An Evaluation of the California Community Crime Resistance ...
83
Golden Gate University School of Law GGU Law Digital Commons California Assembly California Documents 5-1985 An Evaluation of the California Community Crime Resistance Programs Assembly Office of Research Follow this and additional works at: hp://digitalcommons.law.ggu.edu/caldocs_assembly Part of the Legislation Commons is Cal State Document is brought to you for free and open access by the California Documents at GGU Law Digital Commons. It has been accepted for inclusion in California Assembly by an authorized administrator of GGU Law Digital Commons. For more information, please contact jfi[email protected]. Recommended Citation Assembly Office of Research, "An Evaluation of the California Community Crime Resistance Programs" (1985). California Assembly. Paper 326. hp://digitalcommons.law.ggu.edu/caldocs_assembly/326
Transcript of An Evaluation of the California Community Crime Resistance ...

Golden Gate University School of LawGGU Law Digital Commons
California Assembly California Documents
5-1985
An Evaluation of the California Community CrimeResistance ProgramsAssembly Office of Research
Follow this and additional works at: http://digitalcommons.law.ggu.edu/caldocs_assembly
Part of the Legislation Commons
This Cal State Document is brought to you for free and open access by the California Documents at GGU Law Digital Commons. It has been acceptedfor inclusion in California Assembly by an authorized administrator of GGU Law Digital Commons. For more information, please [email protected].
Recommended CitationAssembly Office of Research, "An Evaluation of the California Community Crime Resistance Programs" (1985). California Assembly.Paper 326.http://digitalcommons.law.ggu.edu/caldocs_assembly/326

prepared by Assembly Office of Research
070-A

I
Honorable Tom Hayden Member of the Assembly State Capitol, Room 2141
Dear Assemblyman Hayden:
May 20, 1985
The Assembly Office of Research has been studying the appropriateness, costs, and results of punishments available under California law and comparing them to other possible sanctions which could be more effective and/or less costly. A previous report, "The Costs and Benefits of Prison Sentences for Burglars," issued in February 1984, examined the costs and benefits of recent sentencing laws for the crime of burglary.
This report evaluates the California Community Crime Resistance Program and makes recommendations for continuing the program, which is scheduled to terminate in January 1986. The report also suggests possible improvements in the program.
Sincerely,
PETER R. CHACON
PRC:

'
OF
PROGRAMS
• rc
n 1 an Associate Consultant
compiled by: ie Agata ior Consultant
y ce
s
Poli
sea
sembly
i rman , Vice
r the
i Res eo.
i rman

1 1 3
7
7
7 10 12
16

V: RECOMMENDATTONS Intr0duction ..... Lift the Sunset on CCR
Program . . . . . i Ongoi Funding CCR Programs
ise Lim ton Maximum Grants . Streamline Reporting Requirements
and Increase Accountabi 1 i ty . . . Review Targeting of the Elderly ..
iew ram Designs ..... .
APPF~OI A: CHAPT 578, STATUTES OF 1978
IX R:
APPENDIX C:
I ON FOR ING nt'ARTERLY PROGRESS REP0PT
YSIS OF Vf1RI.ANCE PROCEDURE IJSEn TO IN DIFFERENCES H! BURGLARY RATES
49
49
54
61
71

ce nal
ties loca
y
anni (OCJP) began funding the
Program as a pilot program in 1980.
ies and community development
ies.
incidence of crimes and to
in the crime resistance
were awa , community crime
involve members of
reduce the vulnerability of
zations, and home
ex pee community services.
minimum necessi es for
are components of many other
as victim and witness
sis counseling, and juvenile
me prevent future victimization.
i Crime istance Program has been to
commercial burglaries and reduce
se Communi istance ram
term on lyman Tom
Ass CE'
Community me istance
evalua the c resistance
success 1 ' suggest ways
examine the ip
the resulting changes in the r as wel as
relationship between the characteri cs lat on in t commu
served and the success of the programs.
-ii-

I
on
I i sta nee
and
f a 1
u i
ram was
ia
, ( .l \
s f
i ne),
k
(See
s program
to
, each local

ig bil
activi 1evels o
cooperation wi
to con so 1 i
federa 1
crime in
0
vehi e
11
• I
' • • I
commu
commu
1
1
i or
rams
s
0

In
i
s
were
on ary 1.
ni
g local
were
tion, th
rams

1) recruit, train, use u
local me on
inc se ci zen i nv
3) ca l oca 1 resi inesses in res
techniques
4) To train cers ni as
in me prevention
5) To es lish comprehensive
6) To conduct home and sines securi i i
7) To assist in <:level new or i rc
standards and ordinances in a si
8) To -C"ci Q,.,.,»Jl t in el a
tic vi enc
To assi in i a
assault
ch program director ich 4- a e ec d l.
inclu as ls 1 oca 1 c p ram
to achieve those goals. In i
target areas were sel w in i s al res
were to made.
h prov a quarter
quarterly inc uded resi al a commerc al


A
on
inc eval ion
were ly in
r crime
p c
loca
s s i in program
a t b 1 c p
iverse la-
ons had
and
communities
s g n The
s

Bal n Berkel Contra ) Fresno Hawthorne los Angeles 2 Menlo Park Modesto Palmdale Paramount Sacramento San Francisco San Mateo . ) Santa Ana Santa Barbara Santa Monica Sausali Union Visalia
Covina Yuba
7
more r.

and Union 1 lations of
le se
are a
ali
communities a ncisco and
)
5.2

ons in
Nineteen a
55 are
"t . cn,ena ram
was the number citizens
of vi cti zation. e 3 s
juri sdi cti ons rtici +. c-l s
the median the at cen
residents of the communities, i l e column
tvla teo, San ncisco~
City, Baldwin rk, t na a
uctu t on n cr me
proportion
teen a
increase i a
the p f each communi
?0 5
"crime II ri n a t s li
proportion + c i
activities ai p i i
you 1 offe
Over ons
Hawthorne, Paramount nta t ' a t

15 and Sta
15 a
es
• (Co.) 9.1
.l
i is
20.7% .3
17.1 .5 .2 .8 .9 .7
18.4 .3
18.1 .7 .1 .2
.1 9.5
.4
.0
.4
.6
.0
Employment, Income, and Poverty
Table 4 illustrates the economic diversity of the 21
jurisdictions. According to 1980 census data, the
per capita ranges from a high of $20,586 in Sausali
fourth that amount in Baldwin Park and Hawthorne (~4,
annual income
to less than one
5 and .M,
respectively). The proportion of families living on an income below the
federal poverty standard is highest in Paramount (16.0 percent), Bal~1in
Park (13.2 percent), and Los Angeles (13.0 percent). The jurisdictions
with the smallest percentage of families living in poverty are st Covina
(4.2 percent), San Mateo (4.4 percent), Menlo Park (5.1 percent), and
Sausalito (5.6 percent). Statewide, the average income is
8.7 percent of the families below the federal poverty lev
-12-

4
6.6 7o4 8 3~6 4.5
.3 .9
.4 .6 5 9 1
8.5 7. 6.5 4 8 9.4 5.7 6 4 6 7 5.
5 B. 5. 8 8 5 ? 7 3
!) . 7 6 • 9.9 7.8
t communi
' J ' .1
( (1 .1

tistics for the preceding two r·s show t t
recess ior: between 1 and 1983 affected these iurisdictions ly.
Du ng this period the unemployment rate in Modesto and Paramou
3.6 percentage points while Santa Rarbara (1.0 ion Ci
(1.5 percent), and San Mateo (1.6 percent) experienced increases less
than ~. percenta points.
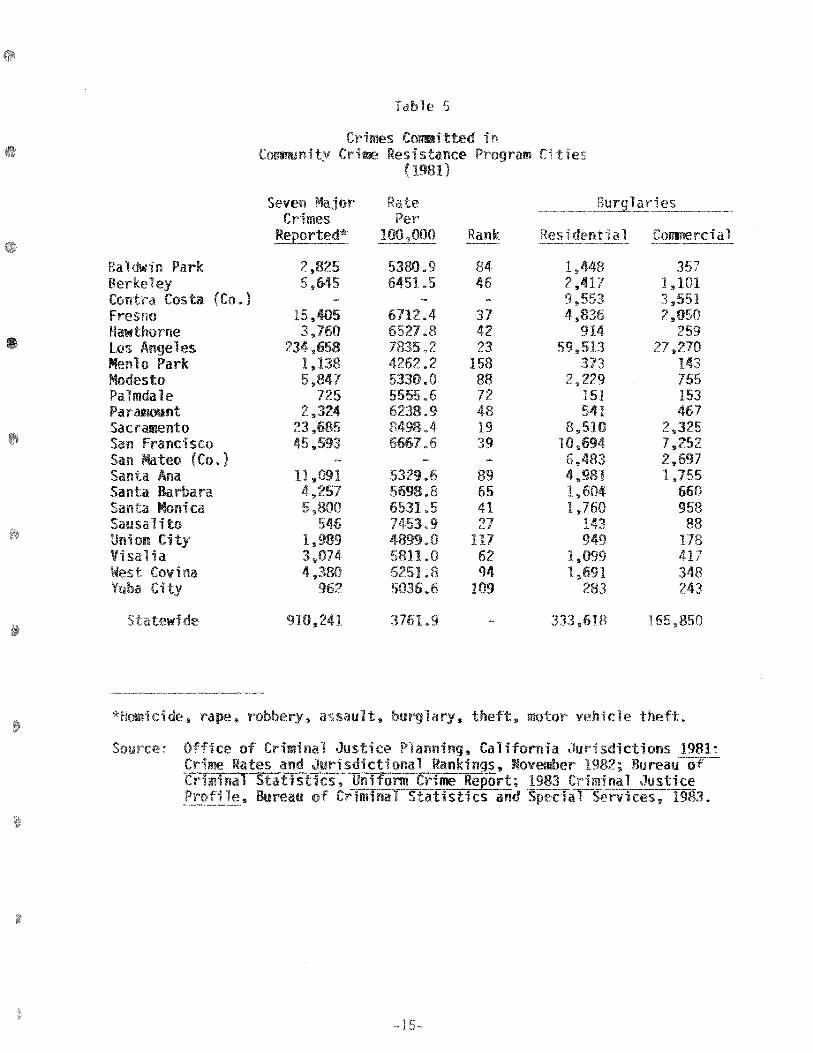
Crime in the Program Jurisdictions
The nffice of Criminal Justice Planning publishes annual reports
comparing the number of major crimes reported in each California
jurisdiction. Table 5 summarizes the numbers and rates of such
reported to the law enforcement offices in each of the pro(lram communitie
in The first column shows the number of major crimes reported, while
the second column shows the rate of the crimes per 1 ,nno pers 1 vi
in
to
communi
ice d
ma.i or pu
fou fi
a commercial
Column 3 shows the ranking of each ju sdic on
iff jurisdictions in the state.
the CCR programs was to reduce burgl
columns of Table 5 show the total number of resi al
rglaries reported during calendar year 19Rl, year j
or to the granting of CCR program funds. This period wil trea
n
rqla tes
assess the effects of the
owing years.
-14-
as
e 5
t, e

ice Services in the Program Jurisdictions
umwa zes a s ice
n
cap E:Y
re ti e e
Baldwin Park Berkeley
c ons
res over the 3-year peri i an i
o each community.
e 6
Police Per Capita Expendi
Per Capita Expenditures
1980-81
s 45 65
1982-83
$ 55 111
1983-84
s 57
Contra Costa (Co.) Fresno Hawthorne los Angeles Menlo Park Modesto Palmdale Paramount Sacramento San Francisco San Mateo (Co.) Santa Ana Santa Barbara Santa Monica Sausalito Un Ci Visalia West na Yuba City
81 73
146 51 61
53 95
152
84 76 71
139 58 54 60 65
81 111 164 91 80 60 68
102 210
96 105 86
188 74 62 81 85
95 130
47
74
99 109 97
71
*Data for San Mateo and Contra Costa counties have been because of the difficulty in determining comparable ~A·~~··u totals between city and countywide jurisdictions.
-16-
the

Per capita police ex itures shovJ significant varia ion
5u s c ons. FY 1 • these 1 . po. 1 ce
to lS2 cap ta. By 1983-84, these ita
ncrea n ranging from to
On an individual basis, however. the changes in per cap t2 i-
tures in ,iuri sdi ons exhibit a wider range. Per ca itures
in 1 o Pa lined .5 percent between 1980 a 1 wh e
its capita expenditures by 78 percent. cos
statewide increased slightly less than 30 percent during this same
Community Crime Resistance Program Funding
Since 79-80, Communi me Resistance p rams have n awa
over $4.5 million in state and federal funds. The original program ra
\'/ere $500,000 of redirected federa 1 Law t sis nee
Administration nts and a matching amount from s 1
;'l.fter enactment Chapter 1 1, which became ive ,Janua 1 ' 1
each participating local a was required to provide 10
ram's total i for the first r and rcen
maximum grant was limited by statute 000.
's ons to local CCR programs come
1 The state ri on v1as 7,
a FY -84. FY s a on was
$
7 s amounts gr,ants awa to t
ocal p over r riod. The a t column c
-17-

s i level of the total -year ea ram.
1 ca amount which could be awa ram
n consi le dispa ty programs in
s r capita. le, the ci of Los es rece a
equivalent to 7 cent person, while San Francisco 1 S grant was cents
smE lest communi es, Seusalito lmdale, rece
gran equivalent .38 and $3.3? person, i y.
Table 7
Amount of Grants Awarded to Each Community Crime Resistance Program
First Second Year Year
Grant Grant Total Capita
Ba 1 dwi n Hi 11 s $ 32~385 $ 26,987 $ 59,372 Berkeley 45,000 32,772 77,772 Contra Costa (Co.) 58,770 52,240 111,010 Fresno 125,000 112,500 237,500 Hawthorne 50~000 45s000 95,000 los Angeles 125,.000 112,500 237 Menlo Park 30,000 27,000 57,000 Modesto 48,207 43~386 91, 0 Palmdale 30,000 279000 57,.000 3. Paramount 26,238 ?3,614 49,852 1 Sacramento 123,249 109,063 232,.312 0. San Francisco 125,000 112,500 237,500 0. San Mateo 111,699 100,528 n2~~221 2 Santa Ana 75,267 67~740 143,007 0.64 Santa Barbara 44,283 39,198 83,481 1.08 Santa Monica 50,000 45,000 95~000 1 Sausalito 30,000 25,977 ,977 7 Union Ci 30,000 ,694 ,694 l. Visalia ?8,270 ,439 :.709 0 West na 50~000 45,000 ,000 1.07 Yuba City "9~982 24~074 54,056 2.63
Sources: Office of Criminal Justice Planning, 11 Cali ia Community Crime Resistance Program; Annual Report, April 1982 to June 1984." November 1~ 1984.
-18-

•
ic
resistance
of resi
on
incl
a
senior citizens
in
recrui
g
in
Community Crime Program Activities
an init al p 1 containi
ted and quarterly reports to
ieve the objectives. Reduci
commercial burglaries was menti as
ing programs. All of the p rams
educate citizens and business owners
proposals contained descriptions of activities
burglary. Curbing domestic violence wa
ec ives
on c
t
i
lp
ls while four programs offe services aimed
1 assault. objectives were r:
u and ock ca ins, initiation
ness watch rams, securi ins i OilS. a
tten in na i s e and
niti ons i
services and activ
X B ins a samp·l ing
' some did not contain in forma ion about
recruited or number of neig h g
ess, we attempted summarize
to provide a profile of t activiti
bles, the fact t data are not s s
mean the program did not provide t serv ce or
vi Only informa on which Itt as reported in a manner
other programs could be included i les.
-1

Use of Volunteers in Crime Resistance
xteen CCR programs proposed to recruit and train volunteers
out various tas Some programs recruited Boy Scouts, while others
concRntrated on involving senior citizens. These volunteers worked with
local police on activities such as administrative duties, riding along with
police patrols, engraving valuables, installing locks, speaking on behalf
of the CCR program, and substituting for sworn peace officers in organizing
neighborhood watch groups.
During the April 1902 to June 1984 grant award period, CCR programs
recruited and trained a total of over 3,080 volunteers. These volunteers
contributed a total of 31,952 hours of community service. Table 8 shows
the number of volunteers and block captains reported by the programs in
each year of the grant period.
-20-

• Baldwin Berkeley
Table 8
Volunteers and Block Captains Recruited by Community Crime Resistance Programs
Volunteers Block Ca~tains
Year 1 Year 2 Year 1 Year 2
157 283 70 58
Contra Costa (Co.) Fresno 43 206 249 Hawthorne 30 13 43 los Angeles 406 302 708 143 435 Menlo Park 22 Modesto 86 20 Palmdale 42 27 69 Paramount 27 Sacramento 161 47 208 San Francisco 27 208 San Mateo (Co.) 35 Santa Ana 47 n/a Santa Barbara 126 Santa Monica 35 93 Sa usa 1 ito
ty
168 134
-21-
Total
70
578
22 79
208
5~0
27
302 27

Resisting Residential Burglary
6, neighborhood watch groups were reported by CCR programs.
groups provide ? way for neighbors to meet and learn to aware of
the normal comings and goings of the persons living in the neighborhood.
Pesi~ents are 1n tructed on procedures for making their homes sa and for
reporting suspic ous activities to the police. Many programs provide crime
resistance pamphlets and other educational materials.
Over h,OOO home security inspections, conducted by reace officers or
trained volunteers, were reported by most programs as another means of
preventing burglaries. These inspections ~ere often conducted in the
presence of a group in one home or apartment in order to show neighbors how
to "nspect their own homes.
Table 9 sumrr:arizes the number of neighborhood watch groups
+he number of
ndinq.
security inspections conducted during the two years
-22-

Table 9
Neighborhood Watch and Home Security Inspections in Community Crime Resistance Programs
Neighborhood Watch Home Security Ins~ection
Year 1 Year 2 Total Year 1 Year 2 Total
Baldwin Park 77 72 149 206 240 446 Berkeley 68 126 194 135 160 295 Contra Costa (Co.) Fresno 807 402 1,209 341 1,311 1,652 Hawthorne 13 13 Los Angeles 331 1,042 19373 61 250 311 Menlo Park 26 14 40 64 24 88 Modesto 160 254 414 120 58 178 Palmdale 22 43 65 52 52 Paramount 42 42 30 30 Sacramento 98 142 240 San Francisco 152 129 281 78 177 255 San Mateo (Co.) 11 14 25 58 126 184 Santa Ana 50 50 Santa Barbara 104 117 221 519 808 1,.327 Santa Monica 29 24 53 81 81 Sausalito 45 27 72 91 50 141 Union City 101 95 196 393 918 Visalia 158 151 309 3 3 West Covina 160 121 281 Yuba City 29 22 15 15
-23-

Reducing the Vulnerability of Individuals and Seniors to Crime
The legislation which established the Community Crime Resi
Program required that each local program emphasize services for
elderly, as defined in the statute. While programs specifically
mentioned services for the elderly in their approved funding proposals, 18
reported data for one or more such activities. These programs conducted
over 300 senior citizen safety awareness seminars dealing with such topics
as personnel safety, home security, and fraud prevention. Some p rams
provided and installed deadbolt locks, while others coordinated services to
the elderly with existing victim and witness assistance services.
Personal safety seminars, many emphasizing rape prevention, were
conducted by many of the programs. Table 10 summarizes the senior and
personal safety seminars and workshops conducted.
-24-

Table 10
Senior Crime Resistance and Personal Safety Seminars Conducted by the
Community Crime Resistance Programs
Programs for Seniors Personal Safety Programs
Year 1 Year 2 Year Year I' Total
Baldwin Park 6 36 n 57 Berkeley 14 65 65 Contra Costa (Co.) Fresno u 9 6 Hawthorne 16 1 17
Angeles Menlo Park 5 5 8 8 Modesto 4 4 8 1 1 Palmdale 0 6 6
1 1 8
San Francisco Mateo (Co.)
Ana 4 Santa Barbara 6 0 6 4 4 Santa Monica 6 40 46 5 5 Sausalito 2 2 1 1 2 Union City 9 9 Visalia 5 2
Covina 20 20 Yuba City 2 7 3 3

Business Workshops and Inspections
The O-Ffice Criminal Justice Planning interpreted the nine statu
program ls into program "components, 11 one of which is 11 to provide
businesses crime prevention services, including education, training and
security inspections. "1 Over 739 workshops vtere reported by 17
jurisdictions, involving more than ?,153 businesses. In addition, over
1,000 business security checks were performed. Table ll shows the reported
activities of the CCR programs to reduce commercial burglaries during the
two-year reporting period.
10ffice of Criminal ,Justice Planning, California Community Crime Resistance Program, Annual Report April 1982 to June 1984, November 1, 1984, Sacramento, p. R.
-26-

e 1
l 1 ---- ---~
1 16
• (Co.) 5 5
Angeles 86 153 o Park 2 11
Modesto 4 4 6 6 e 15
Paramount 2 2 Sacramento 16
Francisco San Mateo (Co.) Santa Ana Santa Barbara Santa Monica Sausalito 9 9 8
on City 6 7 salia 1
Covina 6 6 Yuba City 2 2 93
-2
Other Program Activities
Some the programs offered other services, as traini
programs r cers in crime resistance and communi involvement
presentations for school age children on crime resi se
domestic violence, and vandalism.
Several programs held community rallies to promote crime resi tance a
disseminate information. Other programs used the media (radio,
and newspaper) to promote crime resistance efforts.
Summary
levision
The preceding demographic analysis of the 21 participati communi es
indicates great differences with respect to their size, wealth, and ethnic
and racial composition. The correlation coefficien in le 1
additional analysis of demographic characteristics amonq the ')
communities.' Per capita income is positively and signi
with the percentage of white citizens (.59) and the per
(.71). Conversely, capita income is negatively and signi ca
correlated to the percentage of the population ages 1 {-.
percentage of Hispanics in the community (-.58), and the empl
(-.55). The percenta9e of white residents is strongly
(negatively) with the percentage of Hispanics in community.
:>n ~The correlations coefficient is a statis c which varies
and -1.00 and shows direction and strength of the rel two variables.
-28-
grant
ita
n l. tween

Elderly
Whi
Black
Hispanic
Unemployed
Populat1on change
Capi Police
Per ta
*Bold indi
.,
Table 12
Correlations Between Characteristics of the Connunity Crime Resistance Jurisdictions
i -·-·~- ---~- --- -·-·-
.37
.59 .39
- . 1
-e -.48 47 - .. 84
-. -.3 .41 -.1 -.0?.
-. -.54 . - ' - . . .2 ·- . - .3 -.1
- -. . . . .
.05 or
•
on ce -----
-. . . '

grants were a1 so ignificantly correlated to the percentage of ite
population while at the same time negatively correlated with the percentage
of 15- to ~4-year-olds .
.L\mong the criteria for selection of CCR program funding are number
and percentage of e 1 derly in the community. This criterion was not fully
realized. Although the elderly within a CCR community were v y and
successfully targeted, in the aggregate, CCR communities were uni ly
"elderly." Eleven of the CCR communities had a percentage of elderly less
than the statewide average (19.5 percent). In addition, 12 of CCR
communities show median ages less than the statewide median of 29.9 year.
In characterizing the 21 CCR communities, the following sta
be made:
• The larger the elderly population~ the lower the proportion
1 24 year olds and Hispanics
t The larger the percentage of 15-?4 year olds, the higher
proportion of Hispanics, the lower the percentage of white
population and the per capita CCR grant
t The strongest correlation indicates that the greater whi
ts ca
population, the smaller the Hispanic population, indicating white
and Hispanic isolation from one another in CCR communities (similar
significant correlations are not evident between the black
population and the Hispanic or white populations)
-30-

• Communities with higher per capita income, tend to higher
percentages of whi population and lower o ic
population
capita income, larger percentages of whi
of youth population age 1 24
-31-
, a lower rcenta


III
RESUlTS OF THE COMMUNITY CRIME RESISTANCE PROGRAM
on
the CCR ram is is a cu tc
answer simply. The 1 " the
occurrence of crime, is unmeasura e. How can we count the
mes were never commi
mes actual
Other measures of succes
avail le. For example, we can
resistance program communi es wi
levels citizen rtic tion as ev
the programs. In addition, the
ect a high level isfacti
the CCR program.
This chapter evaluates
d mensions:
3
we are uncerta n of number of
p rams are more rea
ra in cr
peop e s s isfaction with
of law enforcement personne wil
and nee
veness p ram on

I
rose
6.0
similar
15.8
rate
s
s

•
i a burgla es
.8
1983
, the
laries and 1 .3
1982-83 1981-82 1980-81 1979-80 1978-79 1977~78
Index
i
1

ci i communities. In fact 8 of the 21 communities showed
ce statewide average with 3 of these communities reporting
over 3 times the statewide average -9.6 percent.
Table 14
Percentage Changes in Residential Burglaries in CCR Communities
1981-82 1982-83 1981-83
Baldwin Park -38.5% -13.3% -46.7% Berkeley -23.0 10.5 -14.9 Contra Costa (Co.} - 6.7 -10.0 -16.1 Fresno 3.3 - 8.4 - 5.4 Hawthorne -13.3 -18.6 -29.4 los Angeles - 5.8 - 6.5 -11.9 Menlo Park -16.3 9.0 - 8.8 Modesto -12.6 -24.4 -34.0 Palmdale 28.5 13.4 45.7 Paramount 4.8 3.0 7.9 Sacramento -18.8 3.0 -16.4 San Francisco -26.5 - 9.1 -33.2 San Mateo (Co.) -19.9 -13.8 -31.0 Santa Ana Santa Barbara Santa Monica Sausalito Union ty Vi sa lia West Covina Yuba City
Statewide
(-
-18.6 -14.8 -30.7 -29.2 -32.4 -52.1 -23.3 3.8 -20.4 -50.3 32.4 -34.3 -25.6 4.4 -22.3 -15.6 -14.9 -28.2 -13.4 -16.2 -27.4 -16.6 - 5.1 -20.8
- 9.6 - 7.3 -16.3
t reductions in residential burglaries occurred in Sausalito
nd ldwin Park (-38.5 percent). In contrast, three
communities recorded ncreases in residential burglaries during their first
r.
-36-
I

in reported commercial
1 and 1983. Community
commercial burglaries are more
laries.
e
Reported aries
1982-83 1981-83
49.5% 31.9% 4.9 -23.7
-10.9 - 7.5 -11.2 -19.2 25.1 36.7
- 5 - 0.0 .2 -18.9
-31.4 -42.6 .2 -25.5 .9 -45.0
- ~.2 - 4.2 .0 -26.3 .5 -18.0
-10.1 - 8.3 9.5 -19.7
Santa Monica 7.2 - 0.2 -14.3 -59.0 -4.6 4.4
.4 -25.9 -10 6.6 - 1.6 -49.4
- 8.8 -11.3

.8 percent, two communi es,
t Palmdale
significant increases du is i
communities reported decreases
statewide average.
in Target
Nine CCR program agencies me s cs reas
regions or neighborhoods chosen ia1 programs or ve
efforts. The table below s in
burglaries for these nine ci es.
e
Percentage Change Reported Burgl in Target Areas
Commerci
footnote

determine if
ta areas
commercial
decline in
in areas
explanation
sta stical procedure, we tested the crime rate data to
re was a si ificant difference between results in the
communities as a whole. resi ial
la es, was no di resul The rate of
number reported burglaries was not significantly greater
specia on. Appendix C for a iled
ANOVA anal is.)
There are several possible explanations why the success rate in
targeted areas was not signi cantly higher than in the untargeted areas,
for example:
1 Su cient services may not have been provided in target areas to
stify ir being considered a different program than that
pro vi elsewhere in community
e me lem i target areas may be so more severe than in
the ci ive were , even if
a greate resu t coul rea i
' G r c me resistance awareness in areas may e
produced mm'e
actu
avai 1
s i e
reporting of bu laries, which could mask an
se in c mes committed
are not suffi ci to distinguish the effects of
ion.
-40-

1

sta
universe
resi
1 a
Per Capita Income Elderly Youth (15-24) White Black. Hispanic Unempl
1
Note:
bu
ch rae i
rcenta
c s
is not surprising considering the small
anal is'. Over the two-year
s si ificantly correlated with
lained changes in population between
e17
nn·nJ~'8" Percentage Change in and Characteristics of
Prevention Program Cities
Connercial Burglaries
1981-83
-.43 -.22
.19 -.53
.30
.39
.11 -.04 -.45
cant at the .05 level or better. All The correlations for changes in
per 100,000 population) showed no e above.
y correlated with commercial
ite population (R=.53) and per capita
are small, however, showing that only
commercial rglaries can be explained by
community and only ?.0 percent of the
-42-

i can la
8
n
s i
i
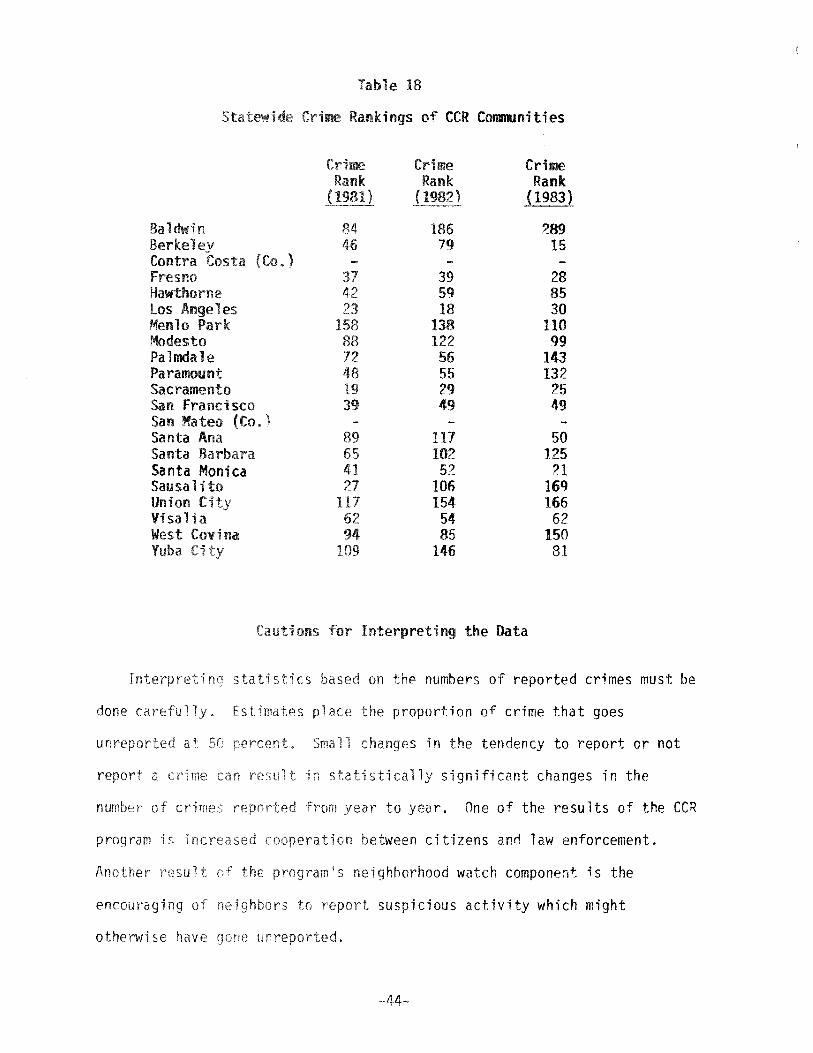
ons Interpreting the Data
done ca s place t proportion of crime that goes
un changes in the tendency to report or not
report s cally significant changes in the
n r f year. One of the results of the CCR
program tion tween citizens and law enforcement.
Another ram's neighborhood watch component is the
encouragi suspicious activity which might
otherwise

•
reason
sma
severa ns
reasons
conclus
In J
nei
ci
a scale of one
g
is
on

vo
c
watch
ipation in crime
t an
tions of ,000
comment on
s i nee 1981. Of
s
frequently

Summary
istance programs are perceived by
effective means of reducing crime.
cit zen and
e data
is accurate. In many cases, burglaries decl in
es at a faster rate than in state as a e.
t efforts to specific areas the
ive programs have produced significant resu ts.
would require information on crime in
ni es.
target areas
istance communities s impressive success in
burglary in the first year. while having a more
second year. Program communities also showed moderate
commercial burglary rates, although first and second
relatively stable. percentage wh tes n a
n population were statistically associ with
es. Per Capita Grants levels were also shown to
to bu aries. Twenty percent of the decrease in
was explained by an increase in per capi CCR
-47-


i
I a
p
i
ncreasi
l securi
ra than
i i a.
t
is a
iti on, the
enormous.
ram be

Genera 1ly,
younger than
predominant
incomes
poverty lev
low-income communi
therefore, most
volunteers.
communities
with relativel
rime resis
a you
n
suggestion
or
in l s.
To i 1E:ment
reli e source
der
law
lower grants.
ci zens are
younger, more
1 ov-1er per capita
ow federa 1
that many
ion and are,
efforts with
to nclude more
dened so that communities
p ram
i in t
The special
ions of teenagers
1 i
orities.
1 materials
as a
diminished
in scope and
broadened,
that funds
Officers'

•
Training Fund or the Drivers Training Penalty Assessment Fund be rerirected
to establish a CCR fund.
A penalty assessment of $4 on every $10, or fraction thereof, assessed
on penal or vehicle code fines or ~orfeitures will yield total revenues of
$130.5 million in FY 1985-86. From these penalty assessment revenues,
appropri ons are made to such programs as the Peace Officers' Training
Fund and the Drivers Training Penalty Assessment Fund. Each fund has had a
budget surplus for the past three fiscal years. Table ?0 summc zes the
amounts of funds in reserve or transferred to the General Fund.
Table 20
End of Year Status of Funds in Thousands of Dollars
Peace Officers• Training fund~ End of year reserves
Drivers Training Penalty Assessment Fund, Transfers
General Fund
1983-84
6,764
25,694
1984-85
6,937
13,764
Source: Governor's Budget: 1985-86, pp. SG-13~ E-31.
1985-86
844
18,561
administered programs providing services crime v c ms at
local level are funded by penalty assessment monies. These monies
c me resis nee programs are continued and that new efforts are
encou
-51-

A tota
rv 1985
Fund.
As an 1
any one program
California, the 1
for large communities.
~!e recommend
~50,000 be based on
on the size
guC!ranteed
Alternati
to community
spec area
vers
ld
in
requested for
Penalty Assessment
imit program grants to
ice all citizens of
resul in severe underfunding
jurisdictions of over
all grants should be based
t large communities must be
e level of service.
in large jurisdictions
ve services to
Streamline Reporting Requirements and Increase Accountability
The narra ve s
provided exi
community. resu t
always provi
programs are ex
rlirector
services, cannot
n
ied by the CCR programs
circumstances of each
program and did not
programs. As the CCR
and standardized. The
providing essential
ng or overly detailed

s
other hand, it is essential to be able to account for the
iture of public funds.
, therefore, that OCJP issue guidelines for a simple
The report should incorporate:
volunteers recruited and/or trained each quarter
volunteer hours of work
neighborhood watch meetings held
home security inspections
programs for senior citizens
programs directed to teenagers and young adults
personal safety programs
siness watch meeting~ held
siness security inspections
rti~i on in each CCR program
complete information on the number of burglaries
(Data should be consistent with the Uniform Crime Report
the Bureau of Criminal Statistics.)
are essential for assessing the effectiveness of the
addition, information on successful crime resistance efforts
on will provide guidance to new programs in communities
lation characteristics.
-53-

elderly,
not have uni
significantly d
measures
Consequently
citizens resi
evidence that e
11 number and o
fall owed.
We recommend
in an effort to i
jurisdictions
Program
in a
i
exceeded ons
In addi on rst
second year
the phasi
services i
first and
emphases An eva
might reveal cu
significant
t
y
is
l
have been targeted to the
communities as a whole did
communities were not
whole with respect to two
on over 55 years of age.
11 number of elderly
lemented. There is also no
funding be based on the
ms ... in that community11 was
ew i funding procedures and criteria
1 islative intent to target
state's elderly.
ons in residential burglaries
1 es in participating communities.
al burglaries also exceeded
suggest that OCJP should review
For ex amp 1 e, a review of
es might indicate that
fferent activities and
ng commercial burglaries
can be improved to have a
me.

•
recommend
is 1 e. i
veness
commercia bu aries .
rev ew program designs and recommend changes
ases d include: the improvement of
the improvement programs directed towards


crimt• resistance.
•
with Sect io11 to community
5. 197/l Filt•d with 1971!
enact as follows
13840) il-
resistanet· to crime and of both community
crime resistance citizen volunteers and
given recognition. In to recognize successful disseminate successful
local agencies to crime and related
or combinations thereof. 55 years of age
purposes. executive director on
funding will on Criminal Justict• in
to consist not more than 16 officials. two elected sh: law enforef'ment
successful of crime
of

undt•r (:riminal
t•valuated bv t-stablishe~l
appropriate appropriatl· for
comments to the Planning.
Criminal Justice to communities
programs in the California
13844 and 13845. be selected
the crime for
exceed a ($125,000) eight local
available under
chapter and Force, the
program and thf' California
chapter to the
and final the
Criminal Committe<> of

Novem~r l, the executive to Legislahue describing in d<·tail
and results from Resistance Program
supported undt·r California shall include a! lt•asl thn·1·
crime prt>vention programs eldt•rly. to training and victim and wilnes~
wwighborhood involve-mf'nt. such a.~. hul not clubs and other community bas('()
community orientation and
continue citizt'n been
of subdivi'iion (a) Section
by type, not limited in the community making the
citizens in community ratio elderly crime victims compared to
in that community of cooperation betwet'n the community
t"""""'m agency in with tlw crimf'
on part of the applicant to show how under this program l:w t~rdinated local, state or federal available for
in Section 13844 monitoring of all grants made
"'"''"<•h• y of the Office of Criminal JustiC('
programs shall madt· available communities through the California
Foret> technical assistanct> procedures

SEC 2. The California Council on Criminal Justice is encouraged to make funds available from the local share of federal money under its control to carry out this act
SEC 3. Section 1 of this act shall remain operative only until January 1. 1983. and on such date is repealed.
SEC 4 The crime rate in California has substantially increased over a 10-year period. The rate of increase over the last five years has been 20 percent (20%); and over the last 10 years has been at a rate of 93 percent (93%). This represents an average increase of almost 10 percent (10%) per year. The types of crime resistance activities to be supported under this act have generally been demom.trated to have a substantial and rapid effect in reducing local crime incidence.
-60-

rmTE:
L
A. B.
IL CR
A.
B.
I I L
A.
B.
c.
L
completing all section of the I
Subnit at 9719
.::::..._;~~
TO\'IARDS ACHIEVI
APPENDIX B
For this section If you do not have a p
1. 2. 3.
L
ective draw a slash
REPORTHJG FOR~1
res i a 1 d a the jurisdiction as a le
same quarter last year and the
de other s me you have
VITI & REPORT!
vi es scuss
\'I ere not
on
ca i
encountered? in i ne
ems
i re
v es u ion I.
your p
, fi 11 out the front bf the
the OCJP Control c Jl. ~..;;...;.....
ich re provided. P Program
cs for your target area. in quarter, as well as for prior to the start·of your
du
or to a pecific
the qua r which
explain.
Section I. example and the
? " p 1 el'ls were not specifically mentioned
is ions ProgramMatic: for it.
uested revi ion and justi cation
2.

QUARTERLY PROGRESS REPORT
PART I: OBJECTIVES
Quarter Ending:
Project Sponsor: .---r----( City or County
PROGRAM OBJECTIVE To recruit, train and use volunteers to carry out local crime prevention efforts.
Project Objectives:
Levels of Performance
Modification to Planned Strategies:
Unanticipated Resources/Difficulties:
-62-

p
citizen involvement in local crime measures includi e development
neighborhood watch groups; in and ing home sec ty inspec-
ining/educ ng community groups in crime resistance measures.
s:
6

PROGRAM OBJECTIVE #3: To train peace officers in crime prevention procedures.
Project Objectives:
Levels of Performance:
f•1odification to Planned Strategies:
Unanticipated Resources/Difficulties:
-64-

crime prevention
I

PROGRAM OBJECTIV To orovide commercial crime prevention services including education, training and security inspections.
Project Objectives:
Level of Performance:
Modification to Planned Strategies:
Unanticipated Resources/Difficulties:
-66-

To assist in the development of new or modification of existing architectural standards and ordinances in o r assi in crime prevention.
67-

PROGRAM OBJECTIVE #7: · To assist in the development and implementation of programs designed to reduce domestic violence.
Project Objectives:
Levels of Performance:
Modification to Planned Strategies:
Unanticipated Resources/Difficulties:
-68-

as ist in development and implementation rams designed to prevent sexual assaults .
•

I -.....! 0 I
PART I I: CRH~E REPORTING FORt1
]~_§_ El_I\_8I~.m _Q_A_T_~ fl_T_~L C_ O_[Jt !!J'.:_ W ID_!:_QA T ~
( Narne or II )
Stats for this Stats for Stats for Sarne Stats for Stats for Same ReiJort Feriotl Same Qtr. Qtr. of Year Stats for this Silllle Qtr. . of Year
CR!ME NONTHS ( quarter ) Last Year Prior to Project CRIME MONTHS Report Period L"st Year Prior to Proiect
, __ ---·--Res1dential Residential --· -Burglaries .Burglaries
1---
Total: Total: ----------- ----
!
-----Conune rc i a l
Commercial Burglaries ----- ---Burglaries
-----Total: Total: ------
FOR THOSE PROJECTS THJH ARE ALSO TARGETING OTHER CRIMES, SUCH AS RAPE, ARMED ROBBERY, ASSAULT, THEFT OVER $200, etc., PLEASE SPECIFY BELOW:
--------·--·- - - - ------
--------- ·- ·---.. ---
--Total: ---- Tot a 1: ------ ------
------- ------- --------------
-··----- - - ··~-···-- ··---1-
---
---- ·---Tot a 1: Total: ----- ----
--'- ---- -

APPENDIX C
ANALYSIS OF VARIANCE PROCEDURE USEO T() EXPLAIN DIFFERENCES BURGlARY RATES
ance ( l is a s istical technique used to
of independent, c1assification variables on a
variable. The variation in the dependent variable is
sa ained" to do the effects of the classification variables.
on, we examined the effects of targeting designated areas ~or
s nee p rams t programs, and different
lain" di ring rates of change in the number of
commercial burglaries.
ri zes ANOVA procedure used to explain changing rates
F statistic is a measure o+ the ratio of the
the to that attributed to random error. The
s t stic, the more vari ion in the dependent variable is
t The column PR is a measure o-f the
F s ti ic is stat i s t i ca 11 y significant. The smaller
more l i magnitu of the F is not the result
s a measure of the variation in the dependent variable
model. The independent variable Program*Year means the
classi cation effects.
-7

di
Model
1 2 3 4
5
6
7
8
Table lC
ANOVA Explaining Differences in Changing Residential Burglary Rates
Independent Effects F PR
Targeting .06 .812 Program 1.56 .182 Year 9.15 .005 Targeting, 1.35 .260 Program Program, 3.24 .009 Year Targeting, 2.82 .017 Program, Year Prograa, 3.30 .008 Year, Program*Year Program, 2.97 .014 Year, Targeting, Program*Year
R2
.00
.32
.21
.32
.53
.53
.76
.76
Targeting special areas within the CCR program cities did not explQin
between residential burglaries in target areas and the city as
1 e. Di rences between the years of the program were significant,
t explain only 32 percent of the variation in burglary rates. Models
ve and six explain 53 percent o~ the variation in residential burglary
Models seven and eight. which contain the interactive effects
v iable, explain 7~ percent of the variation.
-72-

7