An Evaluation of Safety Seminars...DOT/FAAlAM-97/16 Office of Aviation Medicine Washington, D.C....
41
DOT/FAAlAM-97/16 Office of Aviation Medicine Washington, D.C. 20591 19970912 028 An Evaluation of Safety Seminars David R. Hunter Office of Aviation Medicine Federal Aviation Administration Washington, DC 20591 July 1997 Final Report This document is available to the pubHc througt. the National Technical Information Service, Springfield, Virginia 22161. U.S. Department of Transportation Federal Aviation Administration
Transcript of An Evaluation of Safety Seminars...DOT/FAAlAM-97/16 Office of Aviation Medicine Washington, D.C....
DOT/FAAlAM-97/16
Office of Aviation Medicine Washington, D.C. 20591
19970912 028
An Evaluation of Safety Seminars
David R. Hunter
Office of Aviation Medicine Federal Aviation Administration Washington, DC 20591
July 1997
Final Report
This document is available to the pubHc througt. the National Technical Information Service, Springfield, Virginia 22161.
U.S. Department of Transportation Federal Aviation Administration
NOTICE
This document is disseminated under the sponsorship of the U.S. Department of Transportation in the interest of
information exchange. The United States Government assumes no liability for the contents or use thereo£

Technical Report Documentation Page
1. Report No. 12. Government Accession No. 3. Recipient's Catalog No.
DOT/FAA/AM-97116 4. Trt\e and Sub1ii\e 5. Report Date
An Evaluation of Safety Seminars Julv 1997 6. Performing Organization Code
7. Aulhor(s) B. Performing Organization Report No.
Hunter, D.R.
'l. Performing Orgon~alion Name and Acl:1ress ro. Wor1< Unff No. (IRAISJ
Office of Aviation Medicine Federal Aviation Administration 11. COn1ract or Grant No.
Washington, DC 20591
12. Sponsoring Agency nome and Address 13. Type of Report and Pertod Covered
Office of Aviation Medicine Federal Aviation Administration 800 Independence Ave., S.W. Washington, DC 20591 14. Sponsoring Agency Code
15. Supplemental Notes
16. Abstract Fo!ll' versions of an ewluarion form, each of which had a set of common items, were distributed at safety seminars conducted by the Federal Aviation Administration. These evaluation forms assessed participant satisfaction with seminars, perceptions of the seminar content and the presenter, frequency of attendance at seminars, aviation qualifications and experience, seminar content, format and venue preferences, access to computer and video technology for training delivery, self-perceived knowledge and proficiency, training activities, and maim~nance activities. Seminar evaluation forms were received for 226 seminars, representing approximately 66% of the FM Flight Standards District Offices. A total of 5,615 seminar forms were received, approximately equally divided among the four form versions. This represents approximately 44% of the reported attendance at the 226 safety seminars. Seminar participants consistently rated the seminars favorably. Of the participants, 99% reported that they were satisfied with the seminar, 99o/o would recommend seminars to feUow pilots, and 96% either definitely or probably will attend another safety seminar in the next year. Data on computer and video ownership and use suggest that computer-based training might be a feasible means for disseminating training programs. Over half of the participants reported membership in at least one flying organhation, and almost half reported that they had performed some preventive maintenance on an aircraft during the previous six: months. The data provided by the study may be used to guide the content and format of future seminars, while supporting the development of alternative forms of training delivery.
17. Key WordS 18. Distribution Statement . Aircraft pilots Document is available to the public through the Aviation safety National Technical Information Service Training Springfield, Virginia 22161
19. Securl1y Classif. (of thisrepor1) 20. Securtty ClassW. (of this page) 21. No. of Pages 22. PriCe
Unclassified Unclassified 41 FonnOOTF 1700.7 8-72 ffon of com .'eted p authorized
I

ACKNOWLEDGMENTS
This effort was sponsored by the Flight Standards Service (AFS-810). Mr. Roger M. Baker, Aviation Safety National Program Manager, provided program guidance on behalf of that organization and contributed significandy to the success of this research by his continued interest and support.
iii
The author thanks the Safety Program Managers at the local FAA offices who gave our the evaluation forms at their seminars and then collected them and mailed them back.
Thanks are also due, of course, to the pilots who took the time to fill out the evaluation forms.
TABLE OF CONTENTS
Page
INTRODUCTION .......................................................................................................................................... 1
METHOD ......................................................................................................................................................... 2
Instrument Development ..................................................................................................................... 2
Distribution .......................................................................................................................................... 2
RESULTS .......................................................................................................................................................... 3
Seminar Leaders Form ......................................................................................................................... 3
Seminar Evaluation Form - Common Page ........................................................................................ 7
Seminar Evaluation Form- Version 1 ............................................................................................... 13
Seminar Evaluation Form - Version 2 ............................................................................................... 18
Seminar Evaluation Form - Version 3 ............................................................................................... 20
Seminar Evaluation Form - Version 4 ............................................................................................... 23
DISCUSSION AND CONCLUSIONS ........................................................................................................ 28
REFERENCES ................................................................................................................................................ 29
APPENDICES
Seminar Leader Data Form ............................................................................................................... A1
Seminar Evaluation Form - Common Page ..................................................................................... B 1
Seminar Evaluation Form Version 1.0 ............................................................................................. Cl
Seminar Evaluation Form Version 2.0 ............................................................................................. D1
Seminar Evaluation Form Version 3.0 ............................................................................................. E1
Seminar Evaluation Form Version 4.0 ............................................................................................. F1
LIST OF FIGURES
Figure I. Reported numbers of attendees at safety seminars ....................................................................... 5 LIST OF TABLES
Table 1.
Table 2.
Table3.
Table 4. Table 5. Table 6.
Table 7.
Table 8.
Table 9. Table 10.
Table 11.
Distribution and receipt of forms ................................................................................................. 4
Seminars held in each region ......................................................................................................... 5 Day of week and time of day on which seminars were held ........................................................ 6 Duration of seminars ..................................................................................................................... 6
Location of seminars ..................................................................................................................... 6 Subjects covered during seminars ................................................................................................. 7
Other seminar information ........................................................................................................... 8
Distribution of seminar attendees and pilot population by FAA region ..................................... 8
Attendees descriptions of seminar ................................................................................................. 9 Attendees evaluation of seminar ................................................................................................. 11
Primary reason for attending seminar ......................................................................................... 11
v

p
Table 12.
Table 13.
Table 14.
Table 15.
Table 16.
Table 17.
Table 18.
Table 19.
Table 20.
Table 21.
Table 22.
Table 23.
Table 24.
Table 25.
Table 26.
Table 27.
Table 28.
Table 29.
Table 30.
Table 31.
Table 32.
Table 33.
Table 34.
Table 35.
Table 36.
Table 37.
Table 38.
Table 39.
Table 40. Table 41.
Table 42.
Table 43.
Table 44.
Table 45.
TABLE OF CONTENTS (CONTINUED)
Intent to attend another seminar ................................................................................................ I I
Number of seminars attended in previous 12 months ............................................................... 12
Highest certificate level ............................................................................................................... 12
Other ratings and aircraft ownership .......................................................................................... 12
Total flight hours ......................................................................................................................... 12
Flight hours during previous 90 days ......................................................................................... 13
Most effective method for learning about aviation topics ......................................................... 14
Preferred location for seminars ................................................................................................... 15
Preferred time of day for seminars .............................................................................................. 15
Preferred day of week for seminars ............................................................................................. 15
Preferred duration of seminars .................................................................................................... 16
Preferred seminar format ............................................................................................................. 16
Best way to increase attendance at seminars ............................................................................... 17
Time attendees are willing to travel to get to seminar ............................................................... 1 7
Computer ownership and use ..................................................................................................... 19
Would use FAA computer safety programs ........................................................................ .' ....... J 9
Maximum attendees would pay to purchase FAA computer program ........... : ........................... 19
Best way to distribute FAA computer program .......................................................................... 19
Personal computer equipment features ....................................................................................... 20
Videotape player ownership and usage ....................................................................................... 21
Would view FAA safety videos .................................................................................................... 21
Best way to distribute FAA safety videos .................................................................................... 21
Maximum willing to pay to buy FAA safety video ..................................................................... 21
Maximum willing to pay to rent FAA safety video .................................................................... 22
Self-rating of knowledge and proficiency ................................................................................... 22
Safety-related activities during the previous 12 months ............................................................ 24
Membership in flying organizations ........................................................................................... 25
Flying magazines regularly read .................................................................................................. 25
Category of aircraft normally flown ................................................. , .......................................... 26
M . . 't' d . 26 amtenance act1v1 1es an expenences .................................................................................... ..
Frequency of self-maintenance during previous 6 months ........................................................ 27
Frequency of aircraft tire inflation checks .................................................................................. 27
Frequency of oil and hydraulic fluid checks ............................................................................... 27
Maintenance topic most wanted at safety seminar ..................................................................... 27
vi

AN EVALUATION OF SAFETY SEMINARS
INTRODUCTION
This report Jescribes a: large-scale, nationwide evaluation of aviation safety seminars conducted by the Federal Aviation Administration (FAA). These seminars are the primary means utilized by the FAA to provide continuing education on safety and other aviation issues to the pilot population. They are generally aimeJ at private anJ commercial pilots who do not otherwise receive training from their employer or some other. source. Many of the seminars are conducted by FAA Aviation Safety Program Managers (SPMs) located at each of rhe 78 Flight Standards District Offices (FSDOs). In addition, Aviation Safety Counselors (ASCs), volunteers with expertise in aviation, also conduct many seminars, both with and without direct participation by the local SPM.
Despite the importance of the safety seminars as a means of disseminating safety information, no data beyond the most rudimentary enumeration of total seminars and attendees had previously been collected. Therefore, individual SPMs might have developed a general knowledge of the characteristics of attendees, particularly those who attended often, so as to become acquainted with the SPM; however, SPMs lacked detailed information on the majority of seminar attendees. This is an undesirable position, since to some degree, the attendees can be viewed as customers of the SPMs. In this case, the primary dictum applies, "Know your product, and know your customer." SPMs, because of their extensive aviation experienc.,, know their product very well. Unfortunately, they often do not have the information required to enable them to know their customers as well.
Knowing the customers- who they are, what they are like, what they want, how they want it, when they want it, where they want it, what they need- enables the SPMs to shape their product to meet the customers'
I
demands. In selling their product - aviation safety information - the SPMs are competing with many other alternative uses of the customers' resources -including time and effort. Time and effort devoted to attending safety seminars cannot also be devoted to other activities, such as scout meetings, business functions, and simply being at home with rhe family. The customer, if he or she is to buy the SPM's product by attending a seminar, must perceive that the bi:neflt~of the seminar justifies the cost. (See Kotler & Andreasen, 1991, for a comprehensive overview of marketing in this area.) Besides having a high quality product, we must also tailor the format and delivery of that product so as to maximize its utilization by the target population. This means that we must know rhe characteristics of the seminar attendees so that we may tailor the product to fit their needs and capabilities. An excellent product for high-time instrument-rated pilots may be useless for novice private pilots, and vice versa.
This study was designed to meet the needs of the SPMs for detailed information on the characteristics of seminar attendees. In addition to collecting attendee demographics that could be used to focus training content and delivery, satisfaction measures were also included. These measures provided information on attendees' satisfaction and views of the existing seminars ano provided a baseline against which future modifications could be compared. These data, combined with data from other studies of the pilot population (Hunter, 1995; Rakovan, Wiggins, Jensen, & Hunter, in press) also could be used to shape the development ofboth the content and format of new training products. For example, data on personal computer access could be used to evaluate the feasibility of disseminating new training products through a computer-based training format. Thus, the

p
study would serve both an immediate and long-term need for detailed information on seminar attendee characteristics, perceptions, and attitudes.
METHOD
Instrument Development Through discussions with SPMs, their regional
and national managers, and researchers, several areas of interest were identified that would be addressed in .the evaluation instrument. These interest areas were:
• Satisfaction with seminar • Perceptions of the seminar content and the pre-
senter • Frequency of attendance at seminars • Aviation qualifications and experience • Seminar content, format, and venue preferences • Access to computet and video technology for train-
ing delivery • Self-perceived knowledge and proficiency • Training activities • Maintenance activities
From these interest areas, a preliminary instrument was developed and field-tested at a safety seminar. Attendees were encouraged to comment upon the adequacy of the instructions, the clarity and relevance of the questions, and to suggest other items that should be included. Following this trial, the instrument was circulated among a group of SPMs for comment. The general result from both the pilots at the safety seminar and the SPMs was that the instrument was too long and that participants would be reluctant to complete such a lengthy instrument. In addition, doing so would detract from the time available for the seminar. Based upon these comments, it was d«ided to limit the amount of information that a single participant would be asked to provide to that which could be contained on the front and back of a single sheet of paper. To enable the collection of information on all the areas of interest, multiple versions of the instrument were developed.
2
A mtn1mum set of information on participant satisfaction, perceptions of the seminar, and aviation qualifications and experiences was identified, and questions regarding these areas were placed on the front page of each version. Each of the four versions of the instrument contained a different set of questions on the reverse side of the sheet. This approach allowed us to collect a common data set on certain critical issues for all participants, while at the same cime collecting information on all the other areas of interest without overburdening the participants. Following a final review by regional SPMs and the national manager for safety programs, the four instruments were printed as optically-scannable forms.
In addition to the Seminar Evaluation Forms to be completed by rhe seminar participants, an additional Seminar Leader's Form was prepared. This form was to be completed by the seminar leader to record such information as seminar content and venue and number of attendees.
Distribution Approximately 45 days prior to the distribution of
the forms, a message was sent from the Manager, National Safety Program, to all SPMs advising them of the forthcoming mailing and asking them for their support. This was followed approximately 15 days later by a mailing to all Regional Safety Program Managers in which they were provided a copy of the instruments to be used in the study and were requested to encourage all of the SPMs within their respective regions to participate in the study.
The Seminar Evaluation Forms (SEFs) and Seminar Leader Forms (SLFs) were mailed to safety program managers in 75 of the 78 Flight Standards District Offices during August of 1995. Forms were not mailed to three FSDOs at which there was no SPM.
The package provided to each SPM included a cover letter from the Manager, National Safety Program, briefly explaining the purpose of the study and requesting the SPM' s assistance. Detailed instruc
tions on the completion of the SLF and the SEF were

also provided, along with a package of self-addressed mailing labels that the SPM could use to return the completed forms.
The SPMs were instructed to begin handing out rhe evaluation forms at all seminars conducted on or after September 18, 1995. Evaluation forms were to be distributed at seminars until the supplies of the forms were exhausted. The numbers of evaluation forms provided ro each SPM were determined by stratification based upon regional pilot populations with 50% oversampling for Alaska and New England regions to ensure a sufficient number of completed forms for analysis. Within each region, equal numbers of each version of the form were provided to each FSDO.
Approximately 90 days after the scheduled start date {September 18) a follow-up message was sent to
all SPMs reminding them of the program and asking that they distribute the forms at their seminars.
RESULTS
Of the 24,000 evaluation forms distributed to the FSDOs, 5,615 were returned. Approximately 75% of the returned forms were received during the first three months of the data collection period {October through December 1995), with virtually all the remainder being received during the next three month period (January through March 1996). Seminar Leader Forms were received for 226 seminars.
T oral reported attendance (from the SLF) at the 226 seminars was 12,874;. participation rate among seminar attendees was therefore44% (5,615/12,874).
However, some (25) of the 75 FSDOs did not return any of the forms. It is possible that those offices did not receive their shipment of forms or failed to recognize them and properly route them to the SPM. It is also possible, though rather unlikely, that no safety seminars were conducted by that office. Alternatively, none of the participants in any of the seminars may have elected to complete and return the forms, or the local SPM did not choose to participate in the evaluation. The latter explanation seems most likely, as this was a voluntary program for the SPMs
and some of them may have been unconvinced of its benefit, regardless of the advance notification and reminders from FAA Headquarters.
Thus, while 66% of the SPMs responded by partidraring in the study, 33% did not. Further, there was considerable variation in the participarion rates across the regions, with some regions having 100% participation, while ·in others data were available for only about half of the FSDOs. Table I shows the numbers of forms provided to each FSDO in each region, the numbers of forms received from each region, and the participation rates among regions, defined as the percentage of FSDOs that provided seminar evaluation forms for at least one seminar.
Unfortunately, the limited participation confounds the interpretation of the data and limits generalizability of the results. Parcicularly for those regions with relatively low participation, we cannot know the extent to which their nonparticipation biases the results. One might speculate that SPMs whose safety seminars are not well received by the pilot population might be more likely not to participate, out of a fear of obtaining derogatory information. Since we cannot know the extent or direction of these effects, users of these data must remain aware of these possible effects and exercise due caution in interpreting the results. Generalizations should be limited to those FSDOs for which data are available and users should be aware that overall results reported here may not apply for those regions with low participation rates.
In the sections that follow, we will first present the data from the Seminar Leader's Forms for the 226 seminars, then the combined data from the common front page of all four evaluation forms, and finally, the data from each of the unique back pages of the evaluation forms.
Seminar Leader's Form The Seminar Leader's Form (SLF) provided the
mechanism for collecting information on the content and venue of the safety seminars. By having the FAA Region, FSDO Number, and a unique code number entered both on the SLF and on the Seminar Evaluation Forms (SEF), it was also possible to match

Table 1 Distribution and receipt of forms . Region Number of Forms Number of Forms Number of FSDOs Percent of FSDOs
Provided 1 Received" Participating Participating
Alaska 2400 235 3 100
Central 2400 914 4 80
Eastern 2400 542 5 45
Great Lakes 3200 1014 9 69
New England 2400 430 3 100
Northwest 2400 211 5 71 Mountain
Southern 3200 1096 9 75
Southwest 2400 530 7 78
Western Pacific 3200 443 6 50
Note 1: The total number of forms prov1ded to each reg1on compnsed equal numbers of each of the four form versions. Note 2; This column does not total to 5615 because regional identification was not provided on some forms. Of the total 5615 forms returned, the composition was; Version 1 - 1356; Version 2 - 1438; Version 3 - 1438; Version 4 - 1383.
information from the two sources. Thus, it would be possible to perform analyses that dealt with the impact of day of week, duration of seminar, or other s<Ominar attributes of the s<Ominar att<Ond<Oes' opinions. It also allowed seminar lead<Ors to obtain feedback on participants' evaluations for specific seminars, since each seminar was uniquely identified by the combination of Region, FSDO, and code numbers.
From the SLF we find that the mean reported attendance at the 226 seminars was 57, with a standard deviation of 58 and a range of 3 to 478. The median reported attendanc<O was 36. The histograph in Figure 1 shows the distribution of seminar attendance, excluding two seminars with over 300 attendees.
Table 2 shows the numbers of seminars held in each region. The unit of analysis is therefore, seminars, not attendees. The Southern Region had, by far, the largest number of seminars, accounting for 26% of the 226 seminars in this sample. Although some data are available from the Flight Standards Performance Measuring System on the numbers of seminars held in each region annually, those dar.. are somewhat suspect
due to confounding with oth<Or activities that were not
4
clearly formal safety s<Ominars. Therefore, no analyses were undertaken to compare frequencies of seminars in this sample to the general frequency of seminars in each region. However, this topic will be addressed, in terms of pilot attendees, later in this report.
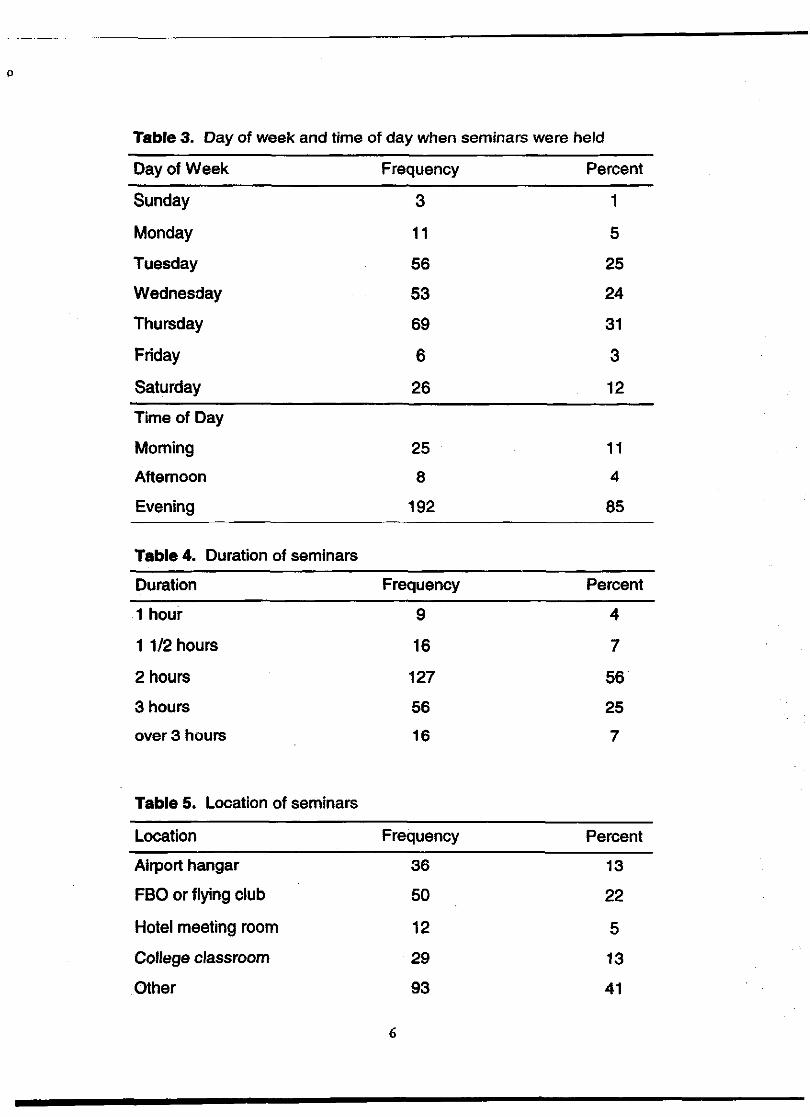
Tables 3 through 5 provide information on when and where the seminars took place. Predominately, the seminars were held in the evenings in the middle of the week, and most lasted about two hours. The SLF failed to adequately capture the location, since "Other" was the modal response (41 %). Meeting rooms at Fixed Base Operators (FBOs) or flying clubs was the second most common response.
Since more than one topic is usually addressed at a safety seminar, the question regarding Subject of the Seminar allowed for multiple responses. From Table 6 we see that Judgment and Decision Making was discussed at almost half of the seminars. Federal Aviation Regulations (FARs) and flight hazards (i.e., weather) were discussion topics at about one-third of the seminars. Least often discussed was the topic of aerial maneuvers, arguably the most difficult to address in a seminar setting. Interestingly, this seems to

20
0
Figure 1
Reported numbers of attendees at safety seminars
Table 2. Seminars held in each region
Region Frequency Percent
Alaska 5 2
Central 18 8 ' --
Eastern 16 7
Great lakes 34 15
New England 15 7
Northwest Mountain 29 13 '
Southern 59 26
Southwest 20 9
Western Pacific 30 13
5
0
Table 3. Day of week and time of day when seminars were held
Day of Week Frequency Percent
Sunday 3 1
Monday 11 5
Tuesday 56 25
Wednesday 53 24
Thursday 69 31
Friday 6 3
Saturday 26 12
Time of Day
Morning 25 11
Afternoon 8 4
Evening 192 85
Table4. Duration of seminars
Duration Frequency Percent
1 hour 9 4
11/2 hours 16 7
2 hours 127 56
3 hours 56 25
over3 hours 16 7
Table 5. Location of seminars
Location Frequency Percent
Airport hangar 36 13
FBO or flying club 50 22
Hotel meeting room 12 5
College classroom 29 13
Other 93 41
6

Table 6. Subjects covered during seminar
Subject
Aerial maneuvers
Airport operating procedures
Air space classification
ATC procedures
Aircraft systems and performance
Emergency procedures
Federal aviation regulations
Flight hazards
IFR procedures and techniques
Judgment/decision making
Navigation aids and procedures
Preflight
Takeoff and landing procedures
Other
correspond well to the attendees' perceptions of the optimal settings for learning about these topics, as we will see later in Tab!.: 18.
To maximize attendance, Safety Program Managers (SPMs) often seek support in staging seminars from other organizations such as flying clubs, pilot organizations or alumni groups. From Table 7, we see that 78% of the 226 seminars in this sample had such a co-sponsor. Another inducement to attendance, the door prize, was offered in almost half of the seminars.
As an induce!:lent to the seminar leader to participate in this evaluation, the instructions to the seminar leader included an offer to provide feedback on the results of the evaluation to any seminar leader who wished to receive it. This feedback was in the form of collared responses to the questions on the evaluation forms from the seminars conducted by that individual
7
Frequency Percent
13 6
46 20
39 17
46 20
45 20
51 23
73 32
71 32
18 8
107 47
28 12
26 12
41 18
97 43
seminar leader. Table 7 shows that almost all rhe seminar leaders indicated they wished to rake advantage of this offer and requested that they be provided with feedback.
Seminar Evaluation Form - Common Page The common first page of each of the four evalua
tion forms contained space to record the FAA region in which the seminar was hdd, along with the identification number of the sponsoring FSDO and the unique code number for that particular seminar. Table 8 presents the numbers of evaluation forms received from each of the nine FAA rfgions and the percentage of the total number of evaluation fonns. For comparison, the percentage of the total pilot population for each region is also given. The numbers of responses range from a low of2ll for the Northwest Mountain

p
TabJe 7, Other seminar information
Frequency- Yes F>ercent- Yes
Co-sponsor 176 78
Oo()r prize 109 48
Want feedback 21~ 94
Table 8. Distribution of seminar attendees and pilot population by FAA region
Region Frequency Attendees Population
NewEngrand 430
Eastern 542
Southern 1096
Great Lakes 1014
Central 914
Southwest 530
Northwest Mountain 211
Western Pacific 443
Alaska 235
region, to a high of 1,096 for the Southern region. In comparing the percentage of attendees to the pilot population in the regions, we see that the Central region is considerably overrepresented in the sample, while the Northwest Mountain, and to a slightly lesser extent, Western. Pacific regions, are underrepresented. Overrepresentation for the New England and Alaska regions is the r,0•ult of deliberate oversampling for those two regions in an attempt to ensure adequate samples.
Tables 9 and 10 show the responses to the adjective checklist items that captured the attendees' views of the seminar they had just attended. For some of the icenzs, t~rei~ noobvioua bcttc1' I:Jireccion of response, at! east no tat this global level of analysis. For example,
8
Percent Percent
8 5
10 13
20 19
19 17
17 5
10 12
4 10
8 17
4 2
the fllst 2 items in Table 9 show that the subjects of the seminar were judged "familiar" by 65% of the attendees, while 35% found that the subjects were "new" (at least to them). Similarly, the level of presentation was thought to be "advanced" to 55% of the attendees,. and "elementary" to 45%. One cannot say, in the absence of any further infOrmation, whether these are satisfactory levels for these attributes or whether some effort is needed to change thern. More detailed analyses, utilizing specific attendee groups (such as student or private pilots) and specific seminar topics (for e:xampleo, decision making or A TC procedures), would provide rnore enlightening results. Such analyses, where Feasible and cequesced by rhe sponsoring organization, may be accomplished in the future.

Table 9. Attendees descriptions of seminar
Frequency Percent
Subjects were:
Familiar. 3430 65
New 1831 35
Level of presentation:
Advanced 2780 55
Elementary 227.1 45
Quality of materials:
High 4862 94
Low 305 6 .•.
·- "'·"
Speaker's knowledge:
High 5202 99
Low 54 1
Speaker's presentation:
Clear 5179 98
Confusing 99 2
Information presented:
Useful 5261 99
Not relevant 64 1
Seminar designed for:
Novices 3177 74
Experts 1122 26
Presentation was:
Interesting 5135 98
Boring 113 2
Overall, I am:
Satisfied 5225 99
Dissatisfied 79 1
9

p
For many of the items, however, the preferred orientation is obvious. Virtually everyone would agree that interesting seminars are better than boring ones and that having speakers with a high level of knowl
edge is preferabie to having speakers who don't know
what they are talking about. On all items of this type, the responses of the attendees were overwhelmingly positive. The last item in Table 9 shows that 99o/o of the attendees were "satisfied" with the seminar. Likewise, from Table 10, 99% of the attendees would
recommend seminars to other pilots. Table 11 gives the primary reason for attending the
safety seminar. The topic to be discussed, and their past experience with seminars together accounted for the majority of the responses to this item. Since seminar topic is a major detcrntinant of attendance, the choice and advertising of topics, within a strategy
of meeting a variety of training needs, becomes very important. Although not addressed in the current study, topics may repel as well as attract attendees, and there may well be a differential effect, which is moderated by demographic, skill, and other experimental variables. Clearly, this would be an interesting and potentially valuable subject for future research.
Another measure of attendees' satisfaction with the
safety seminars, beyond their simple statements of satisfaction, is their intent to attend another seminar. Of the attendees, 96% either "definitely" or "probably" will attend another safety seminar during the next year, as shown in Table 12. This strongly sup~~.!":S the results noted earlier.
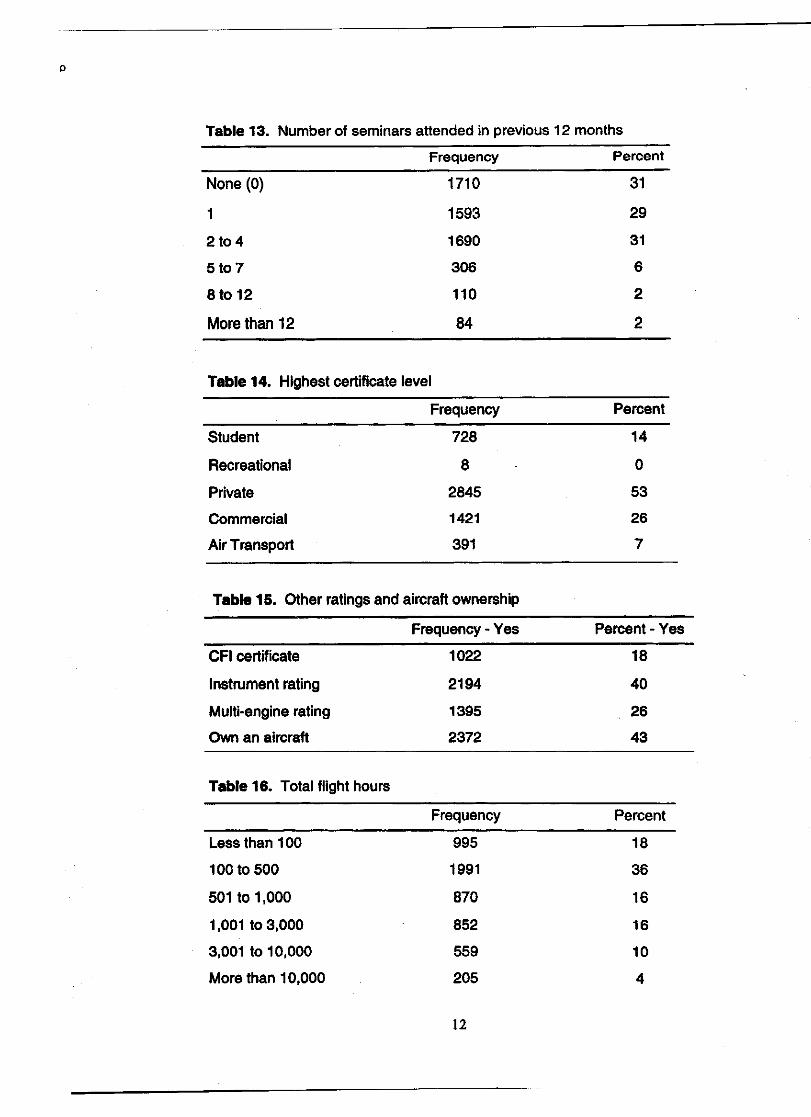
One impression held by those who conduct safety seminars was that they "preached to the choir" and, for the most part, the same people attend.,d safety seminars repeatedly, with little new influx. The data given in Table 13 indicate that such a perception may not be entirely correct. These data show rhat about one- third of seminar attendees have not been to another safety seminar in the last year, and that anorher rhird had only attended one seminar in the
previous year. Only about one-third of the seminar attendees seems t.; constitute rhe "choir" who attend multiple seminars during a single year. It is hard to
10
understand how to interpret these data~ particularly in. light of the data given in Table 12, which showed that almost ail the attendees intend t<> attend another seminar within the next year. Perhaps intentions are fleeting, or the relationships among intentions, topk.s
to be discussed, and opportunities to attend (which are not addressed here) are too complex to be captured by a single question.
The certificate levelst racings, and total and rec.:nt experience of the attendees are reported in T abies 14 throngh 17. The safety seminars attract a higher proportion of private pilots than exist in the overall pilot population (53% compared to 42%). They also draw a correspondingly lower proportion of airline transport pilots than make up the pilot population (7% versus 20%). The proportions of student and commercial pilots in the seminars are approximately
equal to their proportions in rhe pilot population. There were substantially more Certified Flight In
structors among the att"ndees than are found among the pilot population {18% compared to ll %), while the proportion of attendees with instrument ratings (40%) was considerably less than the pilot population (54%}. The latter finding is probably due to the
relatively high proportion of private pilots among attendees.
The reported total and recent flight experience, given in Tables 16 and 17, respectively, approximate the values found in an earlier survey of the total pilot population (Hunter, 1995). Like the general population of private pilots, the majority of attendees had 500 hours or less of total flight experience. The recent experience was also simHar to that of the private pilot population. Hunter (1995) reported that half of the private pilots in his survey had flown 30 or fewer hours in the previous year; or, roughly 2.5 hours per month. Of the seminar attendees, 44% reported having flown 10 hours or less in the previous 90 days; or, roughly 3.3 hours per month.
The evaluation form also asked for the age of the·
participants. The mean age was 46, with a standard deviation of 15.

Table 10. Attendees evaluation of seminar
Leamed something new:
Refreshed old skills and knowledge:
Had my questions answered:
Would recommend seminars:
Yes
No
Yes
No
Yes
No
Yes
No
Table 11. Primary reason for attending seminar
Curiosity
Friend's recommendation
Topic to be discussed
Professional obligation
Reputation of speaker
Good previous seminar
Frequency
396
391
1602
812
344
1454
Table 12. Intent to attend another safety seminar
Definitely will
Probably will
Undecided
Probably will not
Definitely will not
Frequency
3894
1317
148
30
4
11
Frequency
5068
309
4797
403
4927
84
5207
47
Percent
8
8
32
16
7
29
Percent
72
24
3
1
0
Percent
94
6
92
8
98
2
99
1
p
Table 13. Number of seminars attended in previous 12 months
Frequency Percent
None (0) 1710 31
1 1593 29
2 to4 1690 31
5 to7 306 6
8to 12 110 2
More than 12 84 2
Table 14. Highest certificate level
Frequency Percent
Student 728 14
Recreational 8 0
Private 2845 53
Commercial 1421 26
Air Transport 391 7
Table 15. Other ratings and aircraft ownership
Frequency- Yes Percent- Yes
CFI certificate 1022 18
Instrument rating 2194 40
Multi-engine rating 1395 26
OWn an aircraft 2372 43
Table 16. Total flight hours
Frequency Percent
Less than 1 00 995 18
100 to 500 1991 36
501 to 1,000 870 16
1,001 to 3,000 852 16
3,001 to 10,000 559 10
More than 1 0,000 205 4
12

Table17. Flight hours during previous 90 days
None (0)
1 to 10
11 to 20
21 to 50
51 to 100
More than 1 00
SEMINAR EVALUATION FORM -VERSION 1
The unique items contained on the reverse side of Version 1.0 of the SEF primarily addressed the attendees' opinions and preferences regarding seminars in general - not specifically the one they had just attended. The data contained in Tables 18 through 25 are potentially useful for SPMs and others deciding on the best day and time to hold a safety meeting so as to attract the largest participation. Clearly, Mondays and Fridays (Table 21) are poor choices, as are meetings hdd at someone's house (T .. hle 19) or meetings in which only a video is shown without an accompanying speaker (Table 23). Lunchtime seminars also seem unlikely to attract attendees (Table 20}; although, the lunchtime seminars held in New York City are usually filled to capacity (R. Baker, personal communication, July 1996).
These data are also potentially useful in the design and implementation of new training products. The c•.ta in Table 18 show that seminar attendees have some definite expectations about what subjects can and cannot be effectively addressed in a seminar format. Not surprisingly, aerial maneuvers (for example, slow flight or stall recovety procedures) are generally thought best learn~d from a certified flight instructor (CFI). Alternatively, there are some subjects for which seminars are clearly the preferable format. Flight hazards (for example, weather), pilot decision making, human factors, and crew resource management are all topics for which the seminar was considered the most effective method of instruction.
Frequency Percent
13
748 14
1624 30
1423 26
1125 21
327 6
218 4
It is interesting to note that computer-based training was very infrequently chosen as the preferred · training medium, even though some topics, such as navigation aids and procedures, might be very well addressed through such a medium. It seems likely that this reflects a vety limited exposure to computerbased training by the pilots, rather than a bias against that medium based upon personal experiences with unsatisfactory computer-based training, since {from Table 27) the vast majority indicated they would use computer safety programs developed by the FAA.
Although they may be willing to try computerbased training (presumably at home), the preference of attendees for a live speaker in seminars is quite clear from the data shown in Table 23. Of the seminar formats given, the combination of live speaker and video was the preferred format for almost half of the attendees,while a lecture by a safety expert accounted for most of the remainder.
The preference of the attendees for a live speaker who can discuss the aviation safety topic knowledgeably places a significant burden on those arranging safety seminars. As anyone who has attended a safety seminar ( c :any similar lecture by a technical expert) is well aware, some speakers are able to make the most pedestrian of subjects seem fascinating and can hold the audience's attention almost effortlessly, while other speakers can make the most exciting of topics as dull as the shine on a two-dollar pair of shoes and induce profound drowsiness in the most insomniac of listeners. Perhaps these experiences are reflected in the data given in Table 24, which show that the single best way to improve attendance at seminars is to provide more exciting presentations.

p
Table 18. Most effective method for learning about aviation topics (% by row)
Talk to Safety CFI Books or Videotape Computer other seminars manuals based pilots training
Aerial maneuvers 6 10 69 7 6 2
Airport operating 13 31 20 28 7 1 procedures
Airspace 2 36 15 35 11 2 classification & use
Air traffic control 3 37 20 28 10 2 procedures
Aircraft systems & 6 10 19 56 7 2 procedures
Emergency 3 20 44 27 4 2 procedures
Federal aviation 1 32 8 52 5 2 regulations
Right hazards 7 47 13 18 14 1
IFR procedures & 2 15 52 19 10 3 techniques
Navigation aids & 3 18 28 36 13 3 procedures
Preflight 3 8 30 52 5 3
Takeoff & landing 5 11 61 16 5 2 procedures
Pilot decision 10 46 26 10 6 1 making
Human factors 11 52 10 19 6 1
Crew resource 11 45 12 21 10 2 management
!4
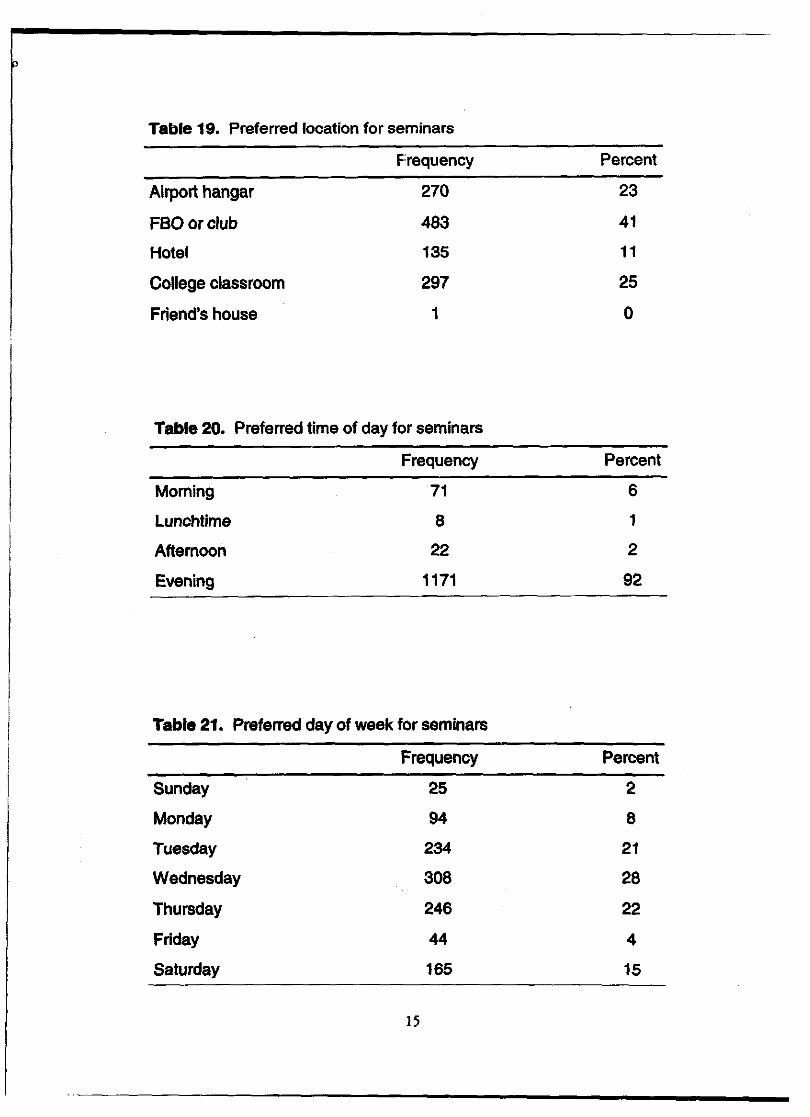
Table 19. Preferred location for seminars
Frequency Percent
Airport hangar 270 23
FBOorclub 483 41
Hotel 135 11
College classroom 297 25
Friend's house 1 0
Table 20. Preferred time of day for seminars
Frequency Percent
Morning 71 6
Lunchtime 8 1
Aftemoon 22 2
Evening 1171 92
Table 21. Preferred day of week for seminars
Frequency Percent
Sunday 25 2
Monday 94 8
Tuesday 234 21
Wednesday 308 28
Thursday 246 22
Friday 44 4
Saturday 165 15
15

Table22. Preferred duration of seminars
Frequency Percent
1/2 hour 1 0
1 hour 58 5
1 1/2 hours 228 18
2 hours 737 58
3 hours 210 17
Over3 hours 32 3
Table 23. Preferred seminar format
Frequency Percent
Lecture by safety expert 265 25
Speech by celebrity 15 1
Panel discussion with 68 6 experts
Open discussion 30 3
Testimonials by fellow 14 1 pilots
Videos with live speaker 471 44
Videos without speaker 9 1
Short presentations with 117 7 open discussion
Panel discussion with 71 7 experts, celebrities & pilots
16
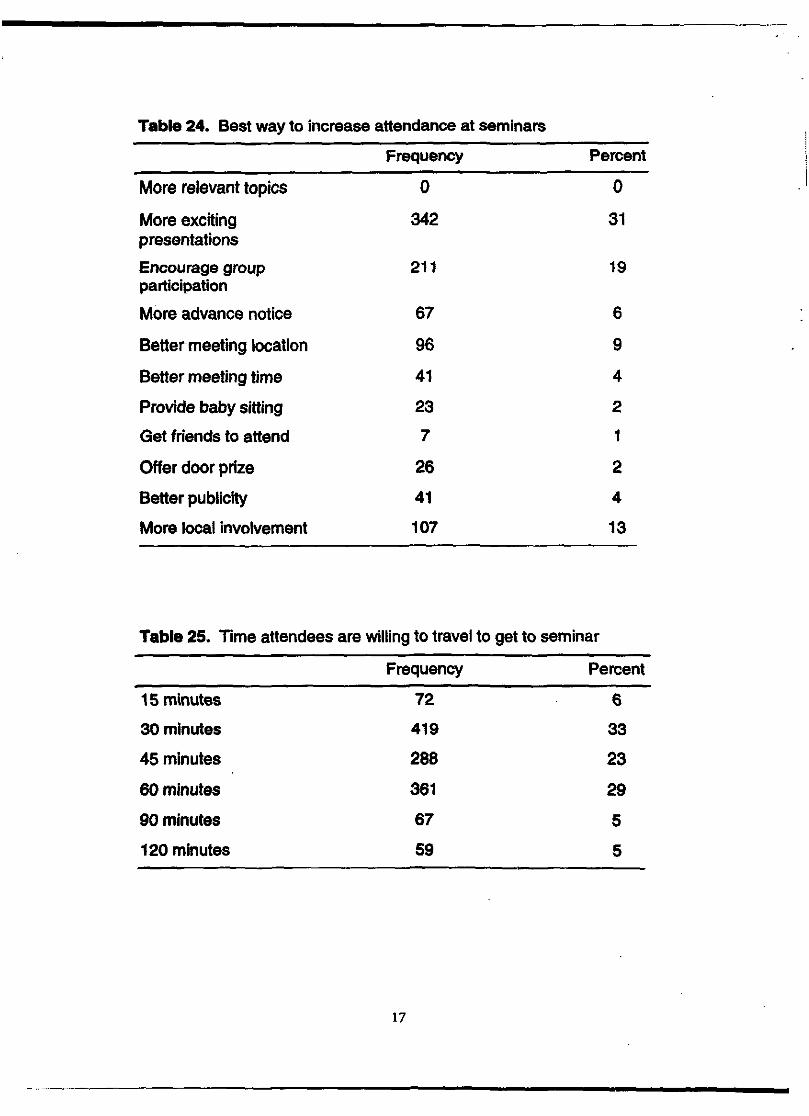
Table 24. Best way to increase attendance at seminars
Frequency Percent
More relevant topics 0 0
More exciting 342 31 presentations
Encourage group 211 19 participation
More advance notice 67 6
Better meeting location 96 9
Better meeting time 41 4
Provide baby sitting 23 2
Get friends to attend 7 1
Offer door prize 26 2
Better publicity 41 4
More local involvement 107 13
Table 25. Time attendees are willing to travel to get to seminar
Frequency Percent
15 minutes 72 6
30 minutes 419 33
45 minutes 288 23
60minutes 361 29
90 minutes 67 5
120 minutes 59 5
17

SEMINAR EVALUATION FORM -VERSION2
The qu~stions on the reverse side ofVersion 2.0 of the SEF were concerned with two possible training product delivery mechanisms- computer-based training and videotapes. It is recognized that pilots do not attend every safety seminar offered in their local area, and that many pilots never attend safety seminars. There is a variety of possible reasons for this, ranging from a simple lack ofinterest in safety issues to lack of opportunity to attend. For the most part, safery seminars are held in the evening, and for many pilots attending an evening function involves some considerable sacrifice. As Kotler and Andreasen ( 1991) indicate, there is always a cost involved for the individual even when partaking of ostensibly free services. That cost includes not only the obvious elements such as transportation expenses, but also other hidden opportunity costs- a pilot attending one of our seminars cannot, at the same time, attend an evening college course. make rounds at the hospital, call upon cusromea, visir wirh his or her family, oc simply relax. 0\:.t \etn~m>.to m-.n"l t.\m\pe"le "ffhh "the.e ahema"lhe activities for the expenditure of the pilot's time and resources. However, ther" will always be some number of pilots who will "lect not to attend. For these pilots, alternative methods of training delivery must be developed in order ta disseminate our training and improve aviation safety.
Computer-based training and videotapes are two mechanisms for providing training to pilots who cannot or will not attend safety seminars. Computerbased training has many advantages that recommend it as a training medium including provisions for interactive learning, adaptive training based upon skill and knowledge assessment, and low duplication and distribution costs. However, as was shown in Table 18, few pilots would consider it the training medium of first choice, possibly because of their unfamiliarity with this medium.
The earlier survey of the general pilot population (Hunter, 1995) indicated that approximately twothirds of pilots own or have access to a personal
18
com purer that could he used for rr;~ining. The current results (shown in Table 26) rer;>licate that findin~&- In addition, a large portion of those who do not currently have a home computer intend to purchase one during the next year. This large proportion of pilots who possess personal computers makes feasible the use of computer-based training as a delivery mechanism. This is supported by the data in Table 27, that indicate that a large number of pilots would use computer-based training program developed by the FAA. It might also be possible, as the data in Table 28 suggest, to recover part of the costs of production and distribution, since pilots were generally willing to pay more thJln $5 to purchase such training programs. That conclusion must be tempered somewhat, however, since the pilots who do not attend safety seminars, although they have access to computers in approximately the same proportion, might not be as willing to use or purchase computer training programs as the seminar attendees sampled in this study.
The data on preferred ways to distribute computerbased training programs {fable 29) present someciting of a dilemma with respect to developing a cost e{fect~-.e del~-.ery m«k11nm. 1he p~'M;' plelttted
delivery method, mail-order, is the one which would present the most organizational difficulty and expense. The FAA is not staffed or organized to function as a mail-order house. Therefore, functions of this sort must be transferred either to another government agency (such as the National Technical Information Service) or to a contractor.
The alternative distribution mechanisms allow the FAA to function more in its traditional role of a technology developer and, in effect, wholesaler of training products. Particularly attractive is the possibility of disseminating new training through computer networks- both commercial networks such as CompuServe and America On Line and the World Wide Web. This prospect virtually removes all distribution costs and allows for a very rapid modification and expansion of the training suite as new products are developed. Based upon the results shown in Table 29, atleast one-fourth of the pilots have access to such a network, and if the geometric growth in utilization

Table 26. Computer ownership and use
Use computer at home
Will buy home computer within next year
Have used computer tllght simulation program
Frequency- Yes
918
397
739
Table 27. Would use FAA computer safety programs
Frequency
Certainly 594
Possibly 554
Uncertain 126
Not likely 84
·Never 6
Percent- Yes
67
32
54
Percent
44
41
9
6
0
Table 28. Maximum attendees would pay to purchase FAA computer program
Frequency Percent
Will not use 125 9
Nothing ($0) 130 10
\.&s.S \han $5 '\SS 14
$5to $15 646 49
More than $15 126 18
TabJe 29. Best way to distribute FAA computer program
Frequency Percent
Will not use 136 11
Download from network 285 23
Buy at computer store 74 6
Order through mail 468 37
BuyatFBO 301 24
19

p
of the World Wide Web is any indicator, that proportion should increase rapidly, making chis a viable means of training delivery to a large segment of the pilot population. In addition, as shown in Table 30, substantial numbers of pilots now have the newer generation computer systems with faster processors and CD-ROM drives. These more powerful systems allow program developers to utilize multimedia presentation techniques that capitalize upon the capabilities of these systems. Thus, it might be feasible to develop and distribute simulation-based training and other complex instructional packages that could not be used with the older, more limited personal computers.
Virtually all the seminar attendees reported that they had a videotape player in their home, and over two-thirds reported that they had viewed safety videos in the past (Table 31). Likewise, almost all the attendees indicated they would view safety videos produced by the FAA (Table32). The order of preference for the best way to distribute videos was reversed from that given for the computer-based training programs. For videos, the first choice was to obtain them from the local Fixed Base Operator (FBO), while mail-order was the second choice (Table 33).
As with the computer programs, attendees expressed a willingness to invest reasonable amounts either to buy (Table 34) or to rent (Table 35) FAA safety videos. This is a particularly important issue, since the
cost of duplication and distribution (for example, packaging and mailing) of videorapes is far greater than the corresponding costs for computer-based training programs. These costs would generally preclude a mass-mailing of videos to pilots, except where relatively small groups of pilots who were particularly at risk for accident involvement could be identified.
SEMINAR EVALUATION FORM -VERSION 3
Table 36 contains the attendees' self-ratings of knowledge and proficiency in a number of aviation areas. Since pilots generally rate themselves as above
average on flying and related activities, it is not too surprising that the ratings were heavily skewed toward the competent side of the scale. The notable exception to that trend was the self-ratings ofinstrument flying, in which 40% of the attendees rated themselves as somewhat or very rusry. Conversely, 60% of the attendees rated their instrument flying knowledge and proficiency as adequate or better; however, only 40% of the attendees indicated they had an instrument rating. This suggests chat about 20% of the attendees think they can adequately fly on instruments, even though they do not have an instrument rating. Whether that assessment is valid is, of course,
Table 30. Personal computer equipment features
Frequency- Yes Percent -Yes
Macintosh 161 11
IBM compatible 809 56
3.5" disk 666 46
CD-ROM 430 30
Color monitor 689 48
386CPU 157 11
486CPU 403 28
Pentium CPU 196 14
20

Table 31. Videotape player ownership and usage
Frequency- Yes Percent- Yes
Videotape player at 1347 98 home
Have viewed safety 931 68 videotapes at home
Table 32. Would view FAA safety videos
Frequency Percent
Certainly 928 67
Possibly 396 29
Uncertain 39 3
Not likely 16 1
Never 2 0
Table 33. Best way to distribute FAA safety videos
Frequency Percent
Local FSDO 117 10
Local FBO 457 38
Public library 210 17
Video rental outlet 120 10
Order through mail 306 25
Table 34. Maximum willing to pay to buy FAA safety video
Frequency Percent
Will not use 30 2
Nothing ($0) 126 9
Less than $5 249 19
$5to$10 707 53
More than $10 227 17
21

----· --------
p
Table 35. Maximum willing to pay to rent FAA safety video
Frequency Percent
Willi not use 29 2
Nothing ($0) 122 9
Less than $3 659 49
$3to$5 476 35
More than $5 65 5
Table 36. Self-rating of knowledge and proficiency (% by row)
Very Good Adequate Somewhat Very Good Rusty Rusty
Weather 20 40 27 11 3
ATC procedures 18 35 28 13 6
Air space regulations 16 35 30 16 4
Basic VFR flying 33 43 19 4 2 techniques
Takeoff and landing 31 46 17 4 2 procedures
Emergency procedures 18 36 31 13 3
Instrument flying 12 23 24 20 20
Preflight planning 29 42 21 6 2
Ground handling 31 44 20 3 2
Radio navigation 27 37 23 9 4
Navigation by pilotage 26 40 23 7 3
Aviator decision making 24 43 24 6 3
Cross-wind landing 22 34 29 10 5
22

not testable from the data in this study. One might specuJate, ho~ever, that overestimation of skill in dtis area, so often associated with fatal accidents, might explain in part why some pilots are willing to continue VFR flight inro deteriorating weather conditions, believing that they have the skills necessary to fly under instrument conditions should that be the last resort.
One might suppose that pilots who attend safery semjn.ars have an jnreresr in safety jssues, and that
·interest might also be reflected in other safery-related activities. Table 37 presents the data on self-reported safery activities for the seminar attendees. Although the data cannot address the depth of understanding achieved or the degree of involvement in the safery activities, they do suggest a substantial degree of participation across all the various activities. Some activities, such as reading a magazine article on safety, obviously do not reflect the same degree of participation as hiring a certified flight instructor (CFI) for training; nevertheless, overall it would seem that this is a group of pilots who are actively concerned with safety.
The last two items in Table 37 provide a rough index of the level of application of the safety lessons learned from some of the training activities. Although there are undoubtedly regional variations in the need to compute density altitude and similar variation in the need to compute aircraft weight and balance, more of these activities is clearly better rhan less. For pilots in a region that is characterized by high-altitude runways and high ambient temperatures, the propensity to make densiry altitude computations might well be an interesting index of their commitment to safery - a notion rhat will be explored in larer research.
Tables 38 and 39 provide additional information on the level of aviation-related activities by the seminar attendees. These data ·also provide information that may be pertinent to the marketing of new aviation safery products, both through cooperative agr~ements with flying associations and clubs and through the choice of print media ro maximize the exposure of a new produce. Although the FAA may well wish to publicize its new products initially through its internal
23
publication, the FAA Aviation News, the dissemination of new product information through articles in magazines such as rhe AOPA Pilot and Flying will reach a far larg~r audience.
SEMINAR EVALUATION FORM -VERSION 4
Earlier, in Table 15, we saw rhar 43% of rhe seminar attendees own their own aircraft, either by themselves or as parr of a partnership. The questions on the reverse side of Version 4.0 of rhe SEF were designed to assess the level, and in some cases the frequency, of the self-performed aircraft maintenance being conducted by pilots, in particular aircraft owners. Tables 40 through 44 show that seminar attendees predominately fly aircraft in the normal and utility categories, and that almost half of them have performed some sort of maintenance activity on their aircraft- most frequently, changing the oil in the aircraft. Almost a fourth of rhe attendees reported having performed some self-maintenance on their aircraft rhree or more times during the previous six months.
Although one might think rhar maintenance is solely within the province of the aircraft owner, in a sense every pilot performs a preventive maintenance function with every preflight inspection. Simply verifying the condition of rhe aircraft structures and fluid levels serves a vital safery function whose importance cannot be overestimated.
The data provided in Table 45 show that, in the area of maintenance, pilots would most like to see seminar_s dealing with preflight inspections and with the maintenance activities that they mighr perform that are sanctioned by the FAA. Although the two topics were approximately equally chosen, the former would probably be more widely received, since the preflight inspection must be performed by all pilots, while self-maintenance activities are generally limited to aircraft owners.


Table 38. Membership in flying organizations
Frequency- Yes Percent- Yes
.Aircraft Owners & Pilots 846 59 Association
Experimental Aircraft 313 22 Association
Ninety-Nines 36 3
National Business Aircraft 22 2 Association
National Air Transportation 14 1 Association
Helicopter Association 8 1 International
Local flying club 407 28
Vocation-related organization 37 3
Aircraft owner's club 177 12
Table 39. Flying magazines regularly read
Frequency- Yes Percent - Yes
FAA Aviation News 387 27
Aviation Safety 342 24
Plane & Pilot 472 33
AOPA Pilot 909 63
Aviation Consumer 113 8
Professional Pilot 140 10
Flying 588 41
EAA Sport Aviation 309 22
Air Progress 88 6
Business & Commercial 141 10 Aviation
25

p
Table 40. Category of aircraft nonnally flown
Frequency Percent
Nonnal 921 82
Utility 149 13
Acrobatic 6 1
Transport 10 1
Glider 6 1
Experimental 19 2
Restricted 11 1
Table 41. Maintenance activities and experiences
Frequency- Yes Percent- Yes
Perform preventive 518 45 maintenance on aircraft
Have an A&P certificate 108 9
Have military experience in 176 14 aircraft maintenance
Have signed off on ADs for 91 8 aircraft
Have a copy of the 500 44 Manufacturers Maintenance Manual for aircraft
Routinely record all 481 45 preventive maintenance you perfonn in logbook
Aircraft is hangared 591 55
Have had a mechanical or 617 49 · electrical failure in flight
Have replaced damaged or 434 35 womtire
Personally observe refueling 850 68 of aircraft
Have serviced aircraft oleo 372 30 strut
Have replaced or serviced 428 35 aircraft sparkplugs
Have changed oil in aircraft 580 47
26

I
r Table 42. Frequency of self-maintenance during previous 6 months
Frequency Percent
None 664
1 to 2 times 210
3to4times 144
5to6times 45
7 or more times 80
Table 43. Frequency of aircraft tire inflation checks
Frequency
Before every flight 688
Once a week 34
Once a month 145
VVhentheylooklow 309
Never 61
Table 44. Frequency of oil and hydraulic fluid checks
Frequency
Before every flight 1136
Once a week
Once a month
Only during scheduled maintenance checks
8
21
51
Table 45. Maintenance topic most wanted at safety seminar
Frequency
FARs dealing with 109 maintenance
Acceptable maintenance 228 practices
Preventive maintenance 150
Aircraft systems 185
Aircraft hardware 20
Preflight inspections 233
Maintenance publications 17
27
58
18
13
4
7
Percent
56
3
12
25
5
Percent
93
1
2
4
Percent
12
24
16
20
2
25
2

p
DISCUSSION AND CONCLUSIONS
The results of this study provide important information to the managers of the FAA safety seminar program to allow them to target their seminar content, format, and venue toward participants' expressed preferences. The results should also be noted by those managers and others interested in assessing user satisfaction with FAA services. In addition, researchers developing new training programs intended for use in safety seminars may also find these results of value. While these results can only be generalized to the districts from which data were obtained, the levels of satisfaction with seminars and participant preferences and characteristics may be applicable to other districts.
The results of this study indicate that most pilots are satisfied with the current FAA safety seminars. This high level of satisfaction is indicated by near total agreement (99%) with the statement "Overall, I am satisfied, • by participants willing to recommend seminars to other pilots, and by their expressed intent to attend future seminars. This fmding is comparable to that obtained by Manning and Schroeder (1990) in a localized survey of pilot satisfaction with FAA flight service station services. In that survey, 96% of pilots were moderately to greatly satisfied with the services they received.
Contrary to the expectations expressed by seminar leaders, attendance at seminars is relatively fluid, since approximately one-third of the participants had nor attended a seminar during the previous year. Although it is impossible to fully appreciate the significance of this datum without having a great deal more information on the dynamics of pilot participation in seminars and in flying in general, it at least suggests that the FAA safery messages are reaching a large number of previously untouched pilots with each seminar.
The questions dealing with computer and videotape ownership indicated that a majority of the pilots possessed a home computer, while almost all the remainder intended to purchase one in the coming year. Virtually everyone had a videotape player. Participants were generally willing to use safety training computer programs and videotapes developed by the FAA and were often willing to pay for their purchase
28
or rental. Given the turnover in seminar panicipation~ use of these media for follow-on training may prove an effective means of disseminating information to those who are unable to attend seminars regularly. This may prove especially advantageous in those geographically large districts in which seminars are only infrequently offered within a reasonable commuting distance of pilots' homes. Computer-based instruction and videotapes also are better suited for some types of training than the rypicallecture format used in seminars; the finding that these media are widely available among pilots may encourage researchers to develop new training programs utilizing the capabilities of those formats.
The self-ratings ofknowledge and proficiency indicate that pilots have a generally positive self-image of their capabilities. Except in the area of instrument flying, all the items in this area were heavily skewed toward a positive assessment of knowledge or skill. While it is certainly possible that tbese pilots are as skilled as they believe, the fact that half of them have fewer than 500 total hours of experience and almost half of them had flown 10 hours or less in the previous 90 days at least suggests they are being overly optimistic in their self-evaluations. On the other hand, the data on safery-related activities suggest that, as a group, the seminar participants frequently took part in activities that might be expected to enhance their knowledge and proficiency. Ultimately these data cannot be used to definitively assess skills and knowledge in anything more than relative terms, and are better used to identify topics (such as air space regulations) that should be addressed in seminars because a large number of pilots indicate their knowledge in a particular area is less than adequate.
The data provided by this study, in combination with other studies of the pilot population, may provide guidance on the preferred content and format of seminars, while at the same time supporting the develCji:nent of alternative forms of training delivery. The data clearly show, at least for the FAA districts for which data were available, tbat participants in safery seminars overwbelmingly report that they are satisfied with them. While this findin~ is heartening, it must also be remembered that only about half of the active

pilot population regularly attend safety seminars (Hunter, 1995). Thus, a challenge exists to develop new seminar programs to attract a greater share of the potenri:tl market, while maintaining the existing high levels of satisfaction. In a matter as important as the ddivety of safety training, there is no such thing as too
successful.
29
REFERENCES
Hunter, D.R. (1995). Airman research questionnairt: Methodology and ovr:ra/1 results. DOT/FAA/AM-95/27. Washington, DC: Office of Aviation Medicine, Federal Aviation Administration. NTIS # ADA300583.
Koder, P., & Andreasen, A.R. (1991). Strategic marketing for nonprofit organizatiom. Fourth Edition. Englewood Cliffs, NJ: Prentice Hall.
Manning, C.A., & Schroeder, D.J. (1990). Pilot views of Montgomery County, T~X~ZJ autom4tedFSSservias. DOT/FAA/AM-90/6. Washington, DC: Office of Aviation Medicine, Federal Aviation Administration. NTIS # ADA227484.
Ralrovan, L., Wiggins, M.W., Jensen, R.S., & Hunter, D.R (in press). A NUional pilot suTJJey to mhana the development and dismnination ofsaftty information. Washington, DC: Office of Aviation Medicine, Federal Aviation Administration.
..

APPENDIX A
• Safety Seminar Evaluation Seminar Leader's Fonn •
1. Region: 2. FSDO 3. Code Number: number:
ONE 1 00 1 0
oEA 200 2® oso 3 00 30
oGL 4 00 40
oCE 5 Gl@ 5®
oSW 6 0® 6®
oNM 7 00 7®
cWP 8 (i) 0 80
cAL 9 00 9® 0 00 10@
4. on what day was this seminar held?
o Sunday o Thursday
oMonday
oTuesday
oWednesday
5. What time did this seminar begin?
o Morning o Afternoon
o Lunchtime o Evening
6. How long did this seml1111r last?
0 1/2 hOUr 0 2 hourS
o1 hour 03 hoUrs
o 1 112 hours o over 3 hours
7. How many people attended?
I I IJ 8. Date of seminar?
Year Month Day
rnrnrn •
AI
9. INhere did this seminar take place?
o Airport Hangar
o FBO or flying club meeting room o Hotel meeting room o College classroom
o PilOt's houSe o Olher - please specify ____ _
10. What was the subject of this seminar? Mark ALL that apply.
o Aerial maneuvers (e.g., stalls) o Airport operating procedures o Air space claslflcatlon & use o Air tramc control procedures
o Alraaft systems & performance o Emergency procedures o Federal aviation regulations o Flight hazards (e.g., weather)
o IFR procedures & techniques o JUdgement I Decision-making o Navigation aids & procedures o Prellight {e.g., \Y8Igl1t & balance) oTIIkeoff & landing PlocedLnS o Other - please specify--
11. Was there a co-sponsor for this seminar
oYes oNo
12. Was there a door prize at this seminar?
oYes oNo
13. Do you want to receive feedback?
oNo oYes -->~i ,. ·r-=J Enter the first four letters of your last name:

APPENDIX B Seminar Evaluation Form - Common Page
Fede,.l Aviation Administration Safety Seminar Evaluation
SubjeciS diSCussed-········· Level of ....-t.uon wes ...... . Quality of IRI!erlaiS was •...•.... Speekel's knowledge was ...... . Speaker's pruentatiOn was. •••• lnfOI'IIIallon presented was .••••. Seminar was designed for ....•..
Presentation -··············-···· 0\'erell,lem ........................ ..
2. Would you ay that you:
OfamiJier 01dviii1C8CI O!ow Olow Oclear Ousetul OnOVicH Qballng Oslllslled
ooerement8ry 0hlgh OhiQh Oc:onfusing Onot relevant Oexpetts Olnlerestlng Odissllisfied
Leamed something new...................................... Oyes Ono RefresMd aid slcllls or k.-lec!Qe ...... -............... Oyes Ono Had yourq~ons 11nswered setlsfactorily......... Oyas Ono Would reoommencl semlniiS to other pilols......... Oyes Ono
3. Which ONE of1111 following best duc:rlbes why you au.nded 1hls lllfely ..,.lnlll?
OCurlaSJty QFrlendS' NCOmmendllon 0Toplc to be diSCussed OProrallonal obllgalon QRepulltlon of speakel(s) 0 GoOd pn111l0us seminar
4. Which ONE ofthiH ·--bell duc:rlbel your lnlent to -nd MOJW 11rety ..,.Ina,. ctuttng tile nest t21110111111?
0 I Will dellnilely - anothenemlnar. 0 I.WIII probably llltend another semlner. 01 am undecided ·I may or may not attend. 01 probably will not attend another seminar. 01-KIIIy Will not lll!end en-r seminar.
1. How many otller P:M sponsored 11rety Hmlnars have you -nded In the last t2 months?
ONone(O) 01 02·-4 05-7 01·12 0 More than 12
REGION
NE 0 EAO soo GL 0 ceo swo NM 0 WPO AL 0
1'8DONO
<!><!> (D(D (!)(!) @(!) <!><!> <!><!> <!><!> (!)(!) <!><!> <!><!>
CODE (D <!> @ (!) @ <!> <!> (!) <!> ®
7. Do you have 1 CFI cartificlllll?
Oyes Ono
I. Do you -en Instrument filing?
o,.,. 0 110
t. Do you hive a mulli .. nglna riling?
Oyes Ono
11. Do you own your own P'- allher by yourself or u pert of a partnership?
Qyes Ono
11. HowiMJiyTOTAL hours have you flown?
0Lesslhan 100 010010500 050110 1,000 01,001 to 3,000 03,001 to 10,000 OMore than 10,000
12. How_, hours heve you Wown In the rutH DAYS?
oo (Zero) 01-10 011·20 021·50 051-100 0 More than 100
13. How old 111 you?
®<!> (D(D ®(!) ®@ ®® ®® ®® (?.)(!) <!>® ®<!>
1. What Is your highest pilot cetUIIc:ate?
OSiudent
If you are unable to finish 1hls evaluation during the semln•r, plesse complete it Ieier •nd moil it to:
0 Recreational OPrlvllte OCommeroial OAir T111nsport
BI
FediJWI A--Admin~ MM-240 (Dr. Dlvld Hunlel') 100 lndlpt-nce Ave., SW WUhlngton, DC ZOit1
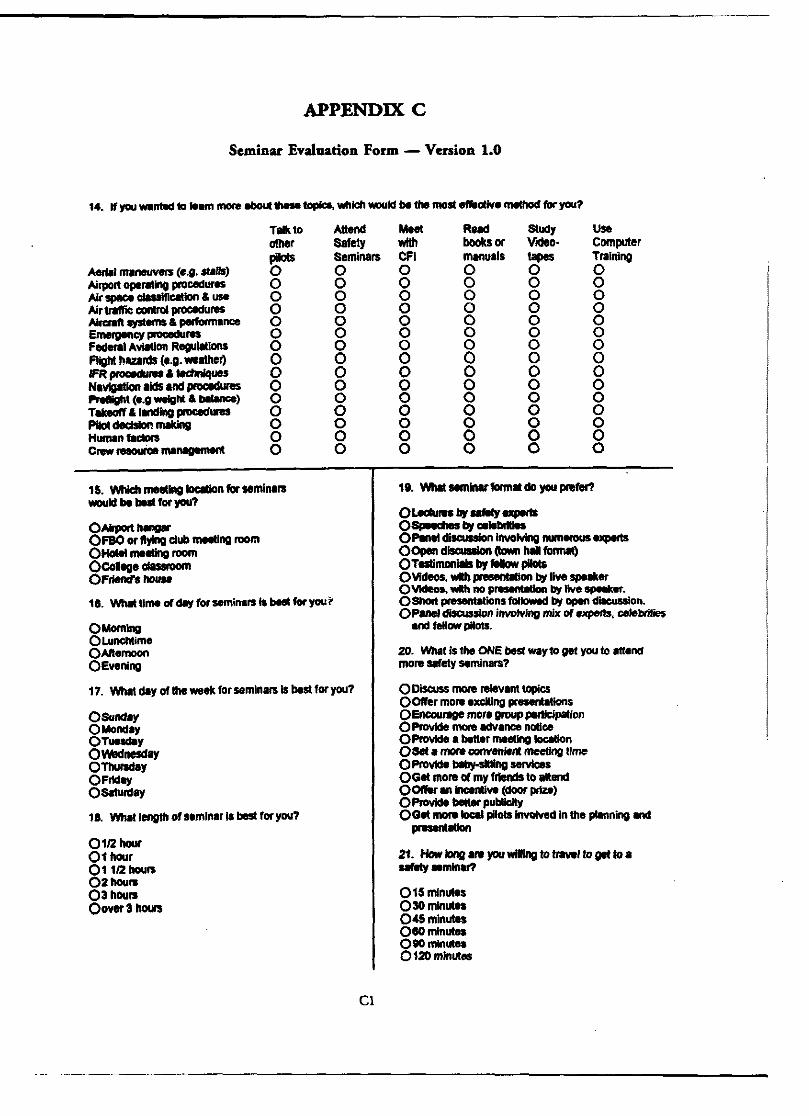
APPENDIX C
Seminar Evaluation Form -Version 1.0
14. If you Wllntedla Jeom more elloUI ..... topk:s. wttlc:h-.ld be the most -cllv•-for you?
Talk to other pilols
-'-' m.,..,.,_(e.g . ..US) 0 Airport operating procedures 0 Air~ claulllcatlon & use 0 Alrtrallic ~ pR)Cidures 0 Alnnft .,stems & pelfolmance 0 EmlllllftCY ~res 0 federal A'lleUOn Regullllons 0 Flight !lards (e.g. wealhel) 0 IFR ~ & tecllnlques 0 Novlgalion aids and ptliCidures 0 l'twllighl (I.Q weight & bll..._) 0 TlkeO« & landing prDCedlftS 0 Pllol decisloll moldng 0 H"""'n- 0 c,_reeauicotmoMQIIMI'll 0
15. Whldl meeting location for seminars -~~~ ....... far you?
0Airporth-0FBO or ftVfnll dub ..-IRQ room CHolet melting room Ocollege daSSIOOI1I 0Frielld's hOuse
11. VI/hill time af daf for seminars Ia bllst for you?
OMomlng 0Lunchlime OAftemoon 0Evening
Attend Safety Seminars 0 0 0 0 0 0 0 0 0 0 0 0 0 0 0
17. Whit day ollheweek far seminars Is blst foryau?
0Sunday 0Manday 0TUIIday 0\'Yadnesday OThursctay 0Frlllay 0Satulllay
111. What length of seminar Is best far you?
0112 hour Othaur 011/2 haul'S 02haurs 03haurs Cover 3 haul'S
Cl
Mlet Rlld study use with boots or VIdeo· Computer CFI manuals tapes Training 0 0 0 0 0 0 0 0 0 0 0 0 0 0 0 0 0 0 0 0 0 0 0 0 0 0 0 0 0 0 0 0 0 0 0 0 0 0 0 0 0 0 0 0 0 0 0 0 0 0 0 0 0 0 0 0 0 0 0 0
18. Whllsemlnarformlt do you ~nfer?
O!Miures r,. saflll)' experts O~brCII-OP.nll diiCUIIion Involving numerous experts OOpen dlscuulan ~ hal fa!INII) OTestimonials r,. flllow pilots OYideos. With .,-an r,. Uve spelker OYicleoa, wlb no p,. .. ,-. by live spelker. OShort p!M811tatlons fol- by open dllcusslon. 0Panel discussion iiiVDiving mix of 1xperts, celelllilies
and fellow pilots.
20. Whatls11oe ONE best woyto get yauto atllnd mare safety S41minars?
ODiscuss more rerevam topics OOifer mo,. 1xcillng presenllllons OEncourage mar• fiiOUP pertlclpltian 0 Pmvlde mcore lidVa- notice 0 Provide a batllr meeting location OSeta IIICft cconv- meeting lime OPravld• bllby-sltllng services OGII mont af my friends to alend OOireran lncenllve (door prize) OPravkle better publicity OGII 1110111local pilots involved In the planning and
,._ntatlon
21. How long.,. you wiling to travel to get to a .-etysemlnar?
015mlnutes 030mlnUiel 04Sminutes oeomlnutea
080 --0 120 mlnllles

APPENDIXD
Seminar Evaluation Form - Version 2.0
14. Do you use a computer at home?
Oyn Ono
15. Is it fikely you will buy a computer fOr your home In the ne>lt year?
Oyes Ono
115. Have you used a computer flight simulation program?
Oyes Ono
17. If the FAA provided interactive computer safety program for pilots, would you use them?
OCertainly OPossibly OUIICertain ONotllktly ONevar
18. If the FAA prep1red computer safety programs fOr sale to PilOts, whit is the most you would be willing to pay fOr one?
OWillnotuse 0Nothing ($0) OLRs than $5 0$5to$1S 0 More than $15
1D. If the FAA prepared computer safely programs for pilot use, what is the best way to make them available to you?
OWill not use 0 Download frOm a network (AOL or compuserve) OBuy at computer store 0 Order through the mall OBuyataFBO
20. Which of the following describes your computer equipment? MARK ALL THAT APPLY.
OUacintosh 0 IBM Compatible 0 3.$" floppy disk OCE:i'ROM OColor monftor 038SCPU Q-4311CPU 0Pantium CPU
Dl
21. Do you have a Videotape player at home?
Oyes Ono
22. Have you ever viewed an aviation safety video lit hclme?
Oyes Ono
23. If the FAA prepared aviation safety videos for pilots, would you view them?
ocartainly OPosslbly OUncertain 0Notlikely ONever
24. lfthe FAA prepared aviation safety videos for pilots, what is the best way to mal<e them available to you?
O~FSCO OL.ac:aiFBO OPubllc library OVICieo rental outlet OOnlerthrough the 1111111
25. If the FAA prepared aviation safety vieclos fOr sale to pilots, what Is the most you would willing to ~to BUY one?
OWIII not use ONothing (SO) OLass than $5 0$5 to 10 0More than $10
211. If the FAA prepared aviation safety videos for pilots, what 1$ the most you would be wiiNng to pay to RENT one?
OWII not use 0 Nothing ($0) OLessthan $3 0$3to$5 0More than $5
., .·
I
j
I .I I .
·J
I

APPENDIX E
Seminar Evaluation Form - Version 3.0
14. Please rate your level of knOWledge or proficiency as a pilot in each of the following arees:
Very good Good Adequate Somewhat Very rusty rusty
Weather end Its impact on flight 0 0 0 0 0 Air traffic control procedures 0 0 0 0 0 Air space regulations 0 0 0 0 0 Basic VFR flying techniques 0 0 0 0 0 Takeoff and landing procedures 0 0 0 0 0 Emergency procedures 0 0 0 0 0 Instrument ftylng 0 0 0 0 0 Preflight planning 0 0 0 0 0 Ground lwldllng 0 0 0 0 0 Radio navigation 0 0 0 0 0 Navigation by pilotage 0 0 0 0 0 AYIItor decision making 0 0 0 0 0 Cross-wind landing 0 0 0 0 0
15. In the last 12 MONTHS, heM' often did you:
0 1-5 6-10 11 + (None) times times times
Use a computer ftlghl simulltion program 0 0 0 0 Read a book on avilltion safety 0 0 0 0 View a vidao on avlalion safety 0 0 0 0 Read • magazine article on ssfety 0 0 0 0 Hire a CFI for training 0 0 0 0 Read an FAA publication 0 0 0 0 Refer to an aircraft operation manual 0 0 0 0 Ask another pilot • safaty question 0 0 0 0 Answer anolher pilot's safety question 0 0 0 0 Use a computer-based leamillg program 0 0 0 0 compute aircraft weight and balance 0 0 0 0 Compute the derslty a1tltude 0 0 0 0
18. To what flying 0/gllnizations do you belong? MARKALL THAT APPLY
17. What llylng magazines do you read regu!arly MARK ALL THAT APPLY
QAircraft owners & Pilots Association QElcperimental Aircraft Association QNinely-Nines ON.Uonal Business Aircraft Associltlon ONational Air Transportation Association QHelicoptar AssociatiOn lntemdonal QA local flying club OVocation relatad organization (e.g. Flying Farmers} QAircraft owner's club (e.g. Cessna Pilot's Association}
El
QFAA Aviation News 0Aviatlon Saf8ty 0Piane &PRot QAOPAPIIot QAvlatlo Consumer
· 0 Professional PRot QFiying QEAA Sport Aviation OAir Progress OBusiness & Commercial Aviation

APPENDIX F
Seminar Eval11ation Form - Version 4.0
14. What category aircraft do you normally fly?
ONormal OUtllity 0Acrobatic OTranspolt 0Giider 0Experimental ORestri;:ted
15. As the owner or operator, do you perform any preventive maintenance on your aircraft?
Oyes Ono
111. How often in the past SIX MONTHS have you performed some type of maintenance on your · aircraft?
OD (None) 01-2times 03-4times 05 -II times 07 or more limes
17. Do you have an A&P certlllcate?
Oyes Ono
18. Do you have miikary experience in aircraft maintenance.?
Oyes Ono
111. Have you, as the owner or operator, ever signed off on any Airworthiness Directives issued for your aircraft?
Cyes Ono
20. Do you have a copy of the Manufacturers Maintenance Manual for your aircraft?
Qyes Ono
21. As the owner or operator, do you rol11nely record all preventive maintenance performed by yourself in the maintenance logbook?
Oyes Ono
22. Is your aircraft hangered?
Oyes Ono
Fl
23. Have you ever had a mechanical or electrical failure in ftlght?
Oyes Ono
24. Have you ever replaced a damaged or worn tire?
Oyes Ono
25. How often do you check for proper inflation of your aircraft tires?
OBetore e"ery flight oa.- .,ek oonce a month OWhen they took low ONever
211. Do you peiSOnaly observe the refueling process every time to insure for proper guel grade?
Oyes Ono
27. How often is your oil and hydraulic fluid level checked?
OBefore every flight OOnceaweek Oonoe a month 0 Only during SCheduled maintenance checks
28. Have you ever serviced an aircraft oleo strut with hydraulic fluid or air?
Oyas Ono
29. Have you ever replaced or serviced your alrcralt sparkplugs?
Oyes Ono
30. Have you ever changed the oil in your aircraft?
Oyes Ono
31. What topic would you MOST like to see discussed by an A&P or an lA at a Safety Seminar?
OFARs dealing with ma!ntenance OAcc:eptable maintenance practices 0Preventi"e maintenance OAircraft systems OAircraft hardware 0 Preflight Inspections - what to look for 0 Maintenance publications
~U.S. GOVERNMENT PRINTING OFFICE: 'ltt1 • 5~/60014