
Alternative Investments 2020 An Introduction to Alternative ...

Journal of Accounting and Economics 35 (2003) 201–226
An evaluation of alternative measures ofcorporate tax rates$
George A. Plesko*
Sloan School of Management, Massachusetts Institute of Technology, Cambridge,
MA 02142, USA
Received 6 August 1999; received in revised form 25 March 2002; accepted 20 January 2003
Abstract
This paper examines the ability of financial statement measures of average and marginal tax
rates (MTR) to capture tax attributes utilizing firm-level tax and financial data. The results
suggest commonly used average tax rate measures provide little insight about statutory tax
burdens, and may introduce substantial bias into analyses of tax incidence. Financial
statement-based proxies for MTR, particularly those based on simulation methods, are found
to perform well in estimating current year tax rates. Both current year and present value MTR
$This research was performed while I was on temporary assignment with the Internal Revenue
Service. I am grateful for the cooperation and assistance of the Statistics of Income Division, particu-
larly Karen Cys, Terry Danby, Nick Greenia, Mike Leszcz, Ken Szeflinski, and to the Boston
Taxpayer Services Division. I am especially indebted to Allison Clark for her help in setting up
the database used in this paper and the research assistance of Joanne Tao (without whom the tax
calculator may never have been completed) and Ying Li. Sharad Asthana generously provided some of the
firm identification data used to supplement Compustat. I have benefited from discussions with or
comments from Rosanne Altshuler, Joshua Angrist, Jennifer Babcock, Mary Barth, Sudipta Basu,
Phil Berger, Charles Boynton, Robert Chirinko, Karen Cys, Lowell Dworin, Dan Feenberg, Pete
Frishmann, John Graham, S.P. Kothari, Andrew Lyon, Gil Manzon, Michael Mikhail, Lil Mills, Stewart
Myers, Thomas Omer, Jowell Sabino, Richard Sansing, Karl Scholz, Terry Shevlin (who read multiple
drafts), Gerald Silverstein, Joel Slemrod, Ken Szeflinski, Roy Welsch, Peter Wilson, seminar participants
at CUNY–Baruch, Columbia University, the Georgetown University Law Center, Universit!e Laval,
M.I.T., Stanford University, University of Wisconsin—Madison, the 1999 KPMG—University of North
Carolina Tax Symposium, the 1999 University of Illinois Tax Research Symposium, Ray Ball, Jerry
Zimmerman, and an anonymous referee. The views expressed in this paper are my own, and do not
necessarily represent those of the IRS or the Department of the Treasury. Any errors are my sole
responsibility.
*Tel.: +1-617-253-2668; fax: +1-617-253-0603.
E-mail address: [email protected] (G.A. Plesko).
0165-4101/03/$ - see front matter r 2003 Elsevier Science B.V. All rights reserved.
doi:10.1016/S0165-4101(03)00019-3

are found to be highly correlated with an easily constructed binary proxy of firms’ tax status.
r 2003 Elsevier Science B.V. All rights reserved.
JEL classification: G3; H25; M4; C200
Keywords: Corporate tax rate; Effective tax rate; Marginal tax rate; Tax; Measurement error
1. Introduction
Numerous empirical studies have examined the role taxes have on corporations’decisions, such as organizational choice, investment decisions, financing mix,dividend policy, merger and acquisition activities, accounting choices, compensationdecisions, and responses to political pressures.1 In contrast to studies of individualtaxation, where public-use micro data are available, firm-level tax return data areconfidential. As a result, non-governmental researchers are usually forced toconstruct tax variables from financial statements,2 leading to both a proliferation ofsuggested measures, and concerns about their accuracy. Gramlich (1992), Callihan(1994), Shackelford and Shevlin (2001), and Maydew (2001) identify tax ratemeasure refinement and improvement as important to furthering research.
Absent data on firms’ tax return information, researchers develop measures fromfinancial statements to capture these unobserved characteristics, and have been aidedby a series of accounting standards (APB 11, SFAS 96, SFAS 109) designed toprovide more information about differences between tax and financial incomereporting. This paper evaluates commonly used tax measures by directly comparingfinancial statement to tax return-based tax rate constructs for a matched sample oftax and Compustat data.
The results show that financial statement-based average tax rate (ATR) measures,such as those used by the US Congress, Joint Committee on Taxation (1984),Porcano (1986), Shevlin (1990), Stickney and McGee (1982) and Zimmerman (1983)are not highly correlated with statutory tax burdens, and produce biased estimates offirms’ tax reporting. The extent of the bias is shown to be exacerbated by otherfinancial and demographic variables often used to examine corporate tax burdens.As dependent variables, the mismeasurement in ATR can be sufficient to lead toerroneous conclusions about the magnitude, and direction, of factors influencingstatutory tax burdens.
Although financial statement based measures of taxable income and liability arethe foundation of simulated marginal tax rates (MTR) (Shevlin, 1990; Graham,1996b), these present value proxies perform substantially better in controlling for
1 Overviews of tax research can be found in Slemrod (1990), Scholes and Wolfson (1992), Brealey and
Myers (1996) Auerbach and Slemrod (1997) and Shackelford and Shevlin (2001).2 Exceptions include Altshuler and Auerbach (1990), Boynton et al. (1992), Collins et al. (1995), Collins
and Shackelford (1997), Cordes and Sheffrin (1981, 1983), Lyon (1997), Lyon and Silverstein (1995), Mills
(1998), Mills et al (1998), Omer et al. (2000), and Plesko (1994, 2000a).
G.A. Plesko / Journal of Accounting and Economics 35 (2003) 201–226202
current year MTR than their average tax counterparts, and are less sensitive to theinclusion of other variables in regression models. Both current and present valueMTR are estimated to be highly correlated with each other, and with an easilyconstructed binary variable based on the presence of net operating losses (NOLs)and a firm’s current income.
The next section of this paper provides a brief review of the differences betweentax and GAAP measures of income and outlines some of the difficulties inreconciling the two. Section 3 presents ATR definitions in tax and financial reportingcontexts, and is followed in Section 4 by a review of the econometric implications ofmeasurement error. Section 5 describes the data used in this paper and theconstruction of the sample. Sections 6 and 7 analyze average and MTR measurescommonly used in the literature. The final section summarizes the conclusions.
2. Financial versus tax reporting
Given that financial reporting objectives differ from those of the tax system, itfollows that income calculated under each system will differ. Financial accountingrecognizes that income and tax liability reported to US tax authorities in any givenyear can differ from the amount that would be paid were GAAP income used as thebasis for taxation. GAAP have prescribed various ways to account for thesedifferences. Under SFAS 109, firms report a total tax liability based upon currentyear financial reporting income, and delineate the portions currently owed anddeferred due to differences in income and expense recognition between tax andfinancial accounting methods. There are two reasons why these differences occur.First, timing differences are caused by differences in revenue and expense recognitionbetween the two reporting systems that should at some point reverse. In many cases,timing differences arise from the reporting requirements under each system, but inothers the differences arise because GAAP allow managers discretion in determiningthe appropriate amounts to accrue while the tax system does not. An obviousexample of such a difference is depreciation.
The second source of differences in the income measure arise when a particularincome or expense accrued under one system will never be recognized under theother. Interest on municipal bonds and a portion of dividends received, for example,are generally excluded from taxable income but are considered income under GAAP.Such ‘‘permanent’’ differences never reverse, and are reflected in a firm’sreconciliation of its ‘‘effective’’ tax rate to the statutory rate. While both temporaryand permanent differences may persist over time, a predictable relation betweenfinancial and tax reporting might still exist as the underlying business activities arethe same.
Since each system’s reporting objectives differ there are also reasons to expect aweak relation between financial and tax reporting. First, the two sets of rules maylead to large differences that do not reverse in a predictable pattern, or are expectedto reverse but in fact do not. For example, while earnings in foreign subsidiaries areconsolidated into the parent under GAAP, these earnings are not recognized as
G.A. Plesko / Journal of Accounting and Economics 35 (2003) 201–226 203
taxable income until cash is actually transferred to the domestic parent. Whileconsidered a temporary difference, under the assumption the earnings will eventuallybe repatriated, tax planning would have such transfers deferred for as long aspossible, or forever.
Second, while judgment is considered an important element of financial reporting,the way in which judgement is exercised need not be consistent across firms, evenwithin an industry. Such differences in discretion could confound any analysis thatrelies on detecting cross-sectional relations between tax and financial results.
Three additional factors complicate the relation between the values reported infinancial statements and those reported for tax purposes. First, the consolidatedentities may differ. GAAP requires firms to file consolidated financial statements thatinclude all operations in which the parent has at least a 50% interest. For taxpurposes, consolidation is not permitted unless there is at least 80% ownership, andeven then it is not required. As a result, consolidated financial statements mayinclude any number of separate taxable entities.
The second complicating factor is timing. Financial and tax reporting appear tofollow similar timetables: financial statements are required to be filed within 90 daysof the end of a corporation’s fiscal year (approximately March 30 for a calendaryear corporation) and corporate tax returns are due the 15th day of the thirdmonth after the close of the fiscal year (March 15 for the same corporation).The SEC filing date and the release of information to shareholders is relativelyfixed, however, while firms must have paid all of their expected tax liability by thatdate in order to avoid interest and/or penalties on any underpayment, payment willusually be made in the course of obtaining a 6 month extension to file. The actual taxreturn will be submitted at a much later date, as late as September 15 for a calendaryear corporation. Given financial statements are prepared and released monthsbefore tax returns are filed, many tax-related items reported in the financialstatements (e.g. the current tax expense) are estimates of the tax liability that will bereported later in the year, and subject to change during the months leading up to thetax filing.
Finally, the income amount and tax liability reported on the original tax returnmay not represent the firm’s ultimate tax liability. This is especially true for largerfirms, which are under continuous audit by the IRS. As filed, tax returns may beviewed as a ‘‘first offer’’ to the government, determined with the knowledge thatmany aspects of the return will be thoroughly examined and challenged. Further, thereturn as filed, even if accepted, can be retroactively affected if carrybacks aregenerated in future years.
3. Defining tax rates
‘‘Effective tax rates,’’ as generally defined and constructed, are measures ofaverage, rather than marginal, tax burdens. The general terminology of an ‘‘effectivetax rate’’ does not clearly distinguish ATR, defined as some measure of tax oversome measure of income, from MTR, measured as the change in tax for a given
G.A. Plesko / Journal of Accounting and Economics 35 (2003) 201–226204
change in income. While ATR and MTR measures are intended to capturedifferences in tax burdens across firms, the suggestion that there is, or should be, one‘‘true’’ measure is misleading, as most analyses of tax burden (particularly themarginal tax burden) are specific to the particular set of circumstances beingexamined.
Even with tax return information, defining the ATR is not straightforward as thefinal income measure for a corporation is reached by calculating a number ofintermediate income definitions. Based upon the difference between incomeand deductions, corporations first calculate net income (NI), conceptually equivalentto pretax book income, which may be positive or negative. However, income subjectto tax (IST), the basis of a firm’s tax liability, can differ from NI for two reasons.First, IST cannot be negative; firms with negative NI will have zero IST in thecurrent year. Second, firms with positive NI are allowed two additional deductions:NOLs and special deductions. The NOL deduction allows firms carrying forwardlosses from prior years to deduct them against current year income; specialdeductions are generated by the dividends received deduction. IST will be themaximum of NI after these deductions or zero. Further complicating the tax liabilitydetermination is the Alternative Minimum Tax (AMT), which may produce differenttax levels owed by firms with the same amount of NI or IST as calculated under theregular tax.
Tax return ATRs may differ from the maximum statutory rate applied to IST fortwo reasons. First, corporate tax rates are graduated, and income below a threshold($75,000 for the year examined here) is taxed at a reduced marginal rate. Second,current or past activities of a firm may generate tax credits that reduce the amount oftax the firm pays in a given year.
To better understand which tax concepts are captured by financial statementmeasures, the analyses in this paper use two measures of firms’ statutory ATRs. Thefirst, TACNI, is defined as tax after credits divided by the tax return measure of NI:taxable income before NOL and special deductions. The second measure, TACISTdefined as tax after credits divided by IST.
While the accounting literature has produced a proliferation of ATRmeasures based upon financial information, those most commonly used have beenidentified and tested by Omer et al. (1991), and are presented in Table 1, along with arecent measure used by Gupta and Newberry (1997). All of the measures relyon the current tax expense (either federal or total) as the basis for measuringtax liability. However, as pointed out by Omer et al., the measures of income used inthe denominators can be divided into three categories. The first category of ATRsuse pretax book income or a variant of pretax book income as the measure ofincome. This group consists of the JCT, Porcano, and Gupta and Newberry, with thelatter having the broadest measure of income as it excludes interest payments. Thesecond category consists of Zimmerman and uses operating cash flow. The finalcategory, consisting of Stickney and McGee and Shevlin, attempts to mimic taxableincome.
Omer et al. (1991) have previously documented the sensitivity of ETR estimates tothe measure employed, and that estimates of firms’ ETRs are not robust to the
G.A. Plesko / Journal of Accounting and Economics 35 (2003) 201–226 205

measure chosen. Given the different focus of each category’s definition of income, apriori we should expect the measures in this last category to be the most highlycorrelated with the tax return measures. This is consistent with the implicitassumptions of Shevlin (1987) and Graham (1996b) in that they use Shevlin’s (1990)construct as the basis of simulations used to estimate present value MTRs. Othermeasures of the ATR should be less correlated with the tax return measure of theATR by design, as the measure they use is intended to capture a different concept ofincome.3
Table 1
Definitions and descriptive statistics of average tax rate measures
Variable Definition Mean Std. dev.
TACNI Tax after credits/net income before special deductions 0.178 0.203
TACIST Tax after credits/income subject to tax 0.316 0.313
Study Measure of average tax rate Mean Std.dev.
US Congress,
Joint Committee
on Taxation
(1984)
Current federal and foreign tax expense/pretax book
income minus (equity income (loss) from unconsolidated
subsidiaries and income (loss) from extraordinary and
discontinued operations) plus income (loss) from
minority interests. (63+64)/((18+16+49)�55)
0.413 0.413
Porcano
(1986)
Current Federal tax expense/pretax book income minus equity
income (loss) from unconsolidated subsidiaries plus income (loss)
from minority interests. 63/(18+63+49+((�1.0� 48)�55))
0.386 0.404
Zimmerman
(1983)
Total tax expense minus change in deferred tax liability and
ITC/operating cash flow (16–change in 35)/(12–41)
0.181 0.357
Shevlin
(1987)
Total tax expense minus change in deferred tax liability/pretax
book income minus (change in deferred tax liability/
statutory marginal tax rate) (16�change in 74)/(18+16+49–
(change in 74/0.34))
0.353 0.341
Stickney and
McGee (1982)
Total tax expense minus deferred tax expense/pretax book
income minus (deferred tax expense/statutory marginal
tax rate) (16�50)/(18+16+49�(50/0.34))
0.337 0.345
Gupta and
Newberry
(1997)
Current income tax expense/book income before interest and
taxes (16�50)/(170�55�17+15)
0.359 0.458
Sample size is 1,116.
Sources: Definitions were drawn from Omer et al. (1991, p.60), with the exception of Gupta and Newberry
(1997).
3 Shevlin (1999) describes several research contexts where financial statement-based measures are the
relevant measures of firms’ tax burdens. See also the conclusion to Section 6.
G.A. Plesko / Journal of Accounting and Economics 35 (2003) 201–226206

4. Implications of measurement error
The previous discussion raises concerns about possible measurement error infinancial statement-based measures of statutory tax rates, and it is worth detailingthe econometric implications of such error in empirical research. This topic hasreceived substantial attention in other fields such as labor economics (where there isconcern about the accuracy of survey response data) and environmental economics(where different monitoring systems yield different measures of pollution levels). Thefollowing discussion is based upon a series of papers by Angrist and Krueger (1999),Bound and Kruegar (1991), and Duncan and Hill (1985) which focused on the effectsof measurement error in labor market survey data, and general statistical treatmentsby Fuller (1987), Greene (1998), and Griliches (1986).
Consider the univariate linear regression framework in which one wants toestimate the effect of one continuous variable (x�) on another continuous variable(y�) each measured without error.4 The estimated model is
y�i ¼ b0 þ b1x�
i þ ei; ð1Þ
where ei is assumed to be identically independently distributed, Nð0; s2e Þ with
covðxi; eiÞ ¼ 0: Measurement error in an independent variable implies that ratherthan observing x�
i ; one observes
xi ¼ x�i þ ui; ð2Þ
where ui is assumed to be distributed Nð0; s2uÞ and uncorrelated with y�
i ; x�i ; and ei: In
this case, the error in the measurement of x�i introduces a proportional ‘‘attenuation
bias’’ on b1 of ð1 � lÞ; where
l ¼s2
x�i
s2x�
i
þ s2ui
: ð3Þ
If ui is uncorrelated with y�i ; x�
i ; and ei; l will be less than one and the estimatedcoefficients will be biased toward zero, with the magnitude of the effect being relatedto the variance of the error in measurement, s2
u : l is often referred to as the‘‘reliability ratio’’ with higher values of l associated with less noise in the observeddata. If data on both x�
i and xi are available, l can be estimated directly by regressingxi� on xi: Estimates of l can be used to adjust coefficients obtained from regressionsusing xi rather than x�
i because l represents the proportion of a change in theobserved but mismeasured variable (xi) that represents a change in the unobservedvariable (xi� ).
In the context of this paper, the absolute and relative abilities of various financialstatement estimates (tfinancial ) to control for variations in firms’ tax return-based
4 Aigner (1973) addresses the issue of measurement error in a binary independent variable, the errors of
which are by definition non-normal and correlated with the value of the mismeasured variable.
G.A. Plesko / Journal of Accounting and Economics 35 (2003) 201–226 207

tax rates (ttax) are estimated using the following model:
tfinancial ¼ b0 þ b1ttax þXN
i¼2
biXi; ð4Þ
where #b1 is the estimate of l as defined in Eq. (3). The inclusion of additionalexogenous variables (Xi ) allows an examination of the effect of other includedexplanatory variables on the estimate of #b1:
There are four complications relevant to this setting. First, in multivariateregressions the attenuation bias will affect the coefficients on all of the independentvariables to the extent the explanatory variables are correlated. Second, the resultsdescribed above rely on the assumptions that ui is normally distributed anduncorrelated with y�
i ; x�i ; and ei . If these assumptions are violated, l may take on
values greater than one. Third, panel data models—a frequent setting for theanalysis of corporate behavior - may exacerbate the attenuation bias depending onthe degree of serial correlation in x�
i compared to that in ui:The fourth complication concerns measurement error in a dependent variable. If
there is measurement error (mi ) in the dependent variable, yi; but it is distributedNð0;s2
mÞ; and uncorrelated with the ‘‘true’’ value, (y�), the independent variables (x�i ),
and the error (ei), then the estimated coefficients of the explanatory variables will notbe biased, but will have higher standard errors. If these assumptions are violated,then coefficient estimates will be biased (either upward or downward) and the bias inthe coefficients will equal the coefficients of a regression on the measurement error(mi) of the explanatory variables.
The empirical implications of measurement error can be significant. Topel(1991) concludes that inconsistencies in job tenure responses in the Panel Studyof Income Dynamics (PSID) are so severe that reasonable parameterestimates cannot be obtained. Klepper et al. (1993) show how measurementerror may not only lead to erroneous conclusions of the magnitude and signifi-cance of the mismeasured variable, but also demonstrate the broader effectsmeasurement error in any independent variable can have on the signs andsignificance of other explanatory variables. They conclude that statistical inferenceswill be most severely affected by ‘‘measurement error in regressions that focus onvariables with relatively small explanatory powers and that are correlated with themismeasured variables.’’
5. Data and methodology
I use a matched sample of firms’ financial statement and tax return data for 1992.A cross-section is chosen for three reasons. First, much of the use of tax rates in theliterature is in cross-sectional settings. Second, by using a single year, I avoid thepotentially complicating factors of tax law changes. While 1992 is not the mostrecent year available, it is the most recent year free of significant corporate tax lawchanges and the accompanying transitions of previous changes, as occurred during
G.A. Plesko / Journal of Accounting and Economics 35 (2003) 201–226208
1990, 1991, and 1993.5 Finally, the MTR calculations for Section 7 required a focuson a single year to make the modeling effort tractable.
To construct the sample, I begin with the Internal Revenue Service’s Statistics ofIncome’s (SOI) corporation file, containing tax return information for 84,213 firms.6
Data are recorded as filed, and validated for accuracy, but do not reflect anysubsequent amendments or audit adjustments. Firms filing 1120-A, the corporateshort form, as well as pass-through entities, such as subchapter S corporations,REITs and RICs were dropped, leaving approximately 53,868 tax return records.
To obtain financial statement information, firms with sufficient data to constructall of the ATR measures were drawn from Compustat. While Compustat includes afield for the firms’ employer identification number (EIN), needed to match thefinancial statements to the tax returns, it is not collected for all firms. To expand thepotential sample size, other sources of data containing both CUSIP numbers andEIN information were obtained, primarily from filings of information reportsassociated with employee benefit plans (Form 5500), which are publicly available.Firms with duplicate or contradictory EINs or CUSIPs were individually examinedto correct for inconsistencies and errors. This file was then merged, by CUSIP, to theCompustat records with missing EINs. This resulting file was then merged, by EIN,to the corporate returns file. Non-matched firms were deleted, as were firms withmissing or zero assets, yielding 7,734 observations.
Non-consolidated members of controlled groups were deleted to minimizeconsolidation differences, reducing the sample size to 4,484.7 To reduce other effectsof consolidation, and focus on accounting differences, the values of total assets andshareholder’s equity reported on the tax return’s balance sheet were compared tothose reported in the financial statements. The balance sheet of the tax return(Schedule L) should reflect the assets and liabilities of the tax filing entity, regardlessof GAAP consolidation. If the difference between the two values exceeded 0.005 ofthe smaller value the record was deleted, eliminating 3,271 firms.
The tax return file provides only limited information about firms’ foreignoperations. To address the effects of financially consolidated foreign source incomethat is not repatriated, firms indicating ownership in a controlled foreign corporationwere deleted. The final data set contained 1,116 observations. Additionalobservations are deleted later in the context of specific tests if data are not availablefor all of the measures.
Summary statistics of the ATR sample are reported in Table 1. Following Omeret al. (1991) tax rates are windsorized to fall within the interval (�1, +1).8
5 U.S. Treasury (1999) reports the difference between aggregate pretax book income and taxable income
‘‘has clearly been growing since 1992 (p. 32)’’ suggesting that compared to other years, using 1992 should
increase the correlation between financial and tax measures.6 The SOI sample is stratified by assets and income to represent the universe of corporation returns for
the year. A description of the sampling methodology can be found in U.S. Internal Revenue Service
(1995).7 See Dworin (1985) and Manzon and Plesko (1996, 2002) for discussions of consolidation issues.8 Approximately 2% of the financial statement-based tax rates fell outside this range. Less than 1% of
the tax return measures were outside this range. Neither windsorizing nor exclusion of these firms from the
G.A. Plesko / Journal of Accounting and Economics 35 (2003) 201–226 209
The mean ATR based upon the tax return definition of NI, TACNI, is 0.178 andincreases to 0.316 for TACIST. This increase is not surprising, as the denominator ofTACIST is constrained to be non-negative and firms with positive tax and zeroincome are assigned an ATR of one. The six financial statement-based measuresdisplay a wide range of mean values, from a low of 0.181 for Zimmerman to a highof 0.413 for the measure used by the JCT. Very few firms have negative ATRs underany of the measures, with Zimmerman’s measure showing the highest proportion ofzero or very low ATRs due to his use of operating cash flows in the denominator.9
With the exception of Zimmerman’s measure, the hypothesis that the meandifference between the financial statement measure of the ATR and TACNI is zerocannot be accepted at any reasonable level of significance (probability is zero to fourdecimal points). With respect to TACIST, we reject the hypothesis of a zero meandifference at at least the 10% level with the exception of Stickney and McGee. Basedon Shapiro-Wilk tests, the hypotheses that the differences between either of the taxreturn-based measures and any of the other measures are normally distributed is alsorejected at any measurable level of significance.
6. The effects of measurement error in ATR
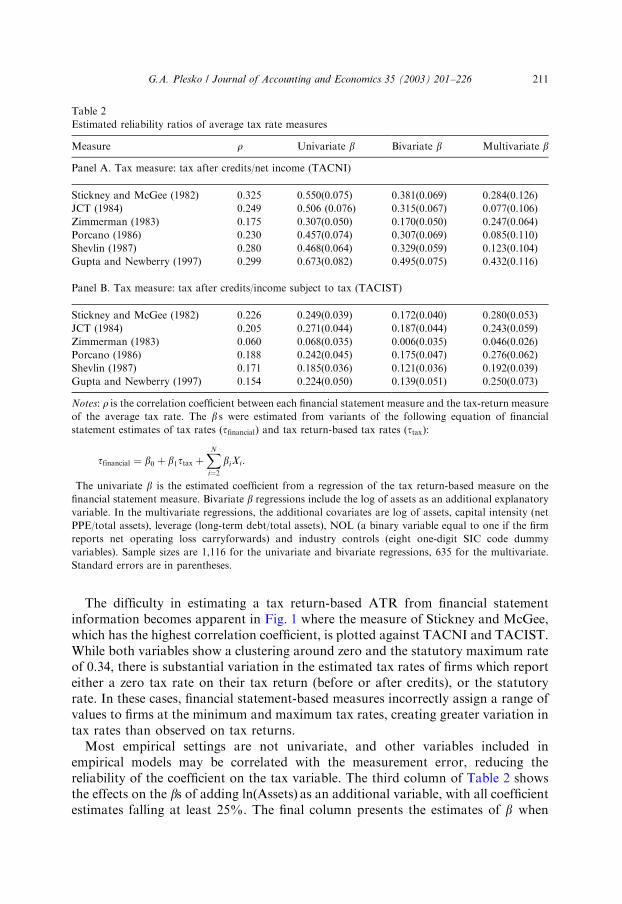
The first two columns in Panel A of Table 2 report the correlation coefficients (r)and the values of #b1; the reliability ratio obtained from a univariate regression ofEq. (4) of TACNI on each of the financial statement-based measures. Consistentwith the expectation that measurement error will bias a coefficient toward zero, theestimated b’s are all less than one and range from a low of 0.307 (Zimmerman) to ahigh of 0.673 (Gupta and Newberry). That Gupta and Newberry’s measure has sucha high estimated coefficient is surprising given their definition of income is thebroadest, and least focused on capturing taxable income. These results imply thatestimated regression coefficients for ATRs are understated by a factor (1=l) of 1.49(Gupta and Newberry) to 3.26 (Zimmerman) when compared to the rate reported ontax returns. To place these values in perspective, all of these estimates show greaterbias than those variables of concern to labor economists. For example, Angrist andKrueger (1999) report cross-sectional ls of wages and hours reported in the CurrentPopulation Survey of 0.77 and 0.87, respectively.
(footnote continued)
sample has a significant effect on any of the results or conclusions presented in this paper. Additional
sensitivity tests, such as deleting firms with NOL carryforwards or restricting the range of values to (0,
0.34) were also carried out with no effect on the results except as noted later.9 Discussions of the sources and extent of differences in income reported on tax returns and financial
statements can be found in U.S. Treasury (1999), Plesko (2000a, b), and Manzon and Plesko (2002).
Sullivan (2000) and Hanlon and Shevlin (2002) focus on the role of non-qualified stock options in
distorting the estimates of both taxes paid, and inferences of taxable income derived from financial
statements. Consistent with the observation that different ATR measures attempt to capture different
concepts of income, the results of Plesko (2000a) suggest measurement problems are more pronounced in
the income numbers of these ratios than in tax liabilities.
G.A. Plesko / Journal of Accounting and Economics 35 (2003) 201–226210
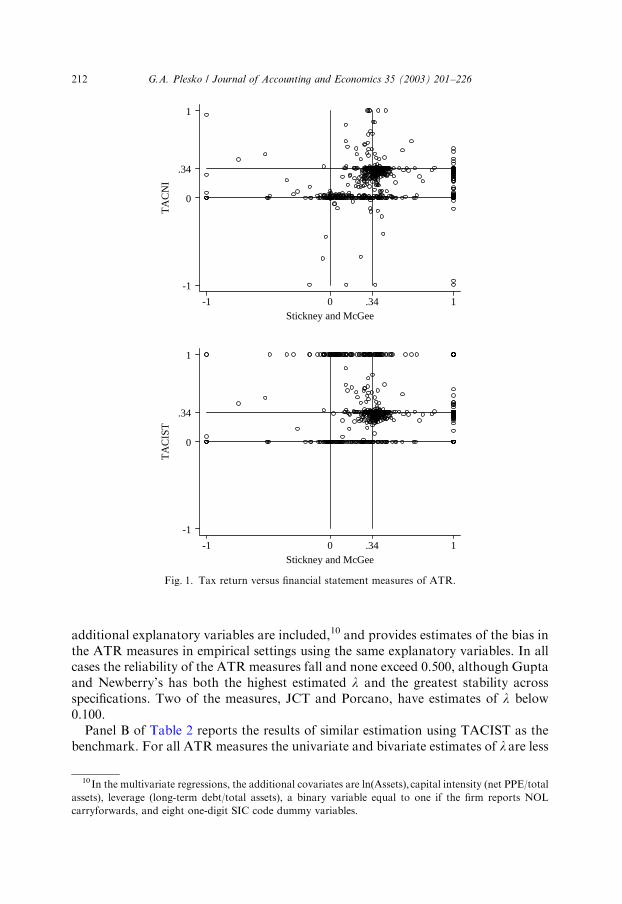
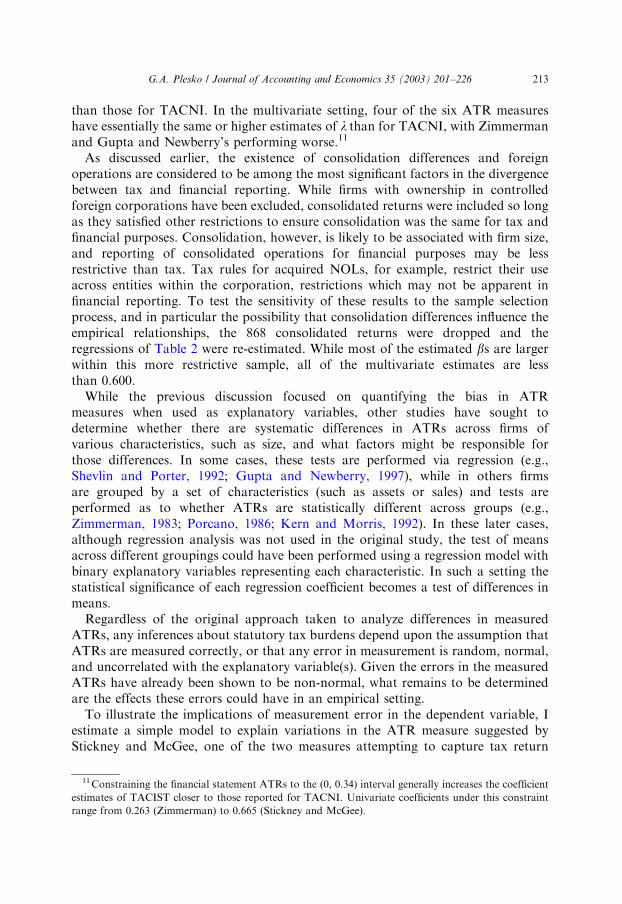
The difficulty in estimating a tax return-based ATR from financial statementinformation becomes apparent in Fig. 1 where the measure of Stickney and McGee,which has the highest correlation coefficient, is plotted against TACNI and TACIST.While both variables show a clustering around zero and the statutory maximum rateof 0.34, there is substantial variation in the estimated tax rates of firms which reporteither a zero tax rate on their tax return (before or after credits), or the statutoryrate. In these cases, financial statement-based measures incorrectly assign a range ofvalues to firms at the minimum and maximum tax rates, creating greater variation intax rates than observed on tax returns.
Most empirical settings are not univariate, and other variables included inempirical models may be correlated with the measurement error, reducing thereliability of the coefficient on the tax variable. The third column of Table 2 showsthe effects on the bs of adding lnðAssetsÞ as an additional variable, with all coefficientestimates falling at least 25%. The final column presents the estimates of b when
Table 2
Estimated reliability ratios of average tax rate measures
Measure r Univariate b Bivariate b Multivariate b
Panel A. Tax measure: tax after credits/net income (TACNI)
Stickney and McGee (1982) 0.325 0.550(0.075) 0.381(0.069) 0.284(0.126)
JCT (1984) 0.249 0.506 (0.076) 0.315(0.067) 0.077(0.106)
Zimmerman (1983) 0.175 0.307(0.050) 0.170(0.050) 0.247(0.064)
Porcano (1986) 0.230 0.457(0.074) 0.307(0.069) 0.085(0.110)
Shevlin (1987) 0.280 0.468(0.064) 0.329(0.059) 0.123(0.104)
Gupta and Newberry (1997) 0.299 0.673(0.082) 0.495(0.075) 0.432(0.116)
Panel B. Tax measure: tax after credits/income subject to tax (TACIST)
Stickney and McGee (1982) 0.226 0.249(0.039) 0.172(0.040) 0.280(0.053)
JCT (1984) 0.205 0.271(0.044) 0.187(0.044) 0.243(0.059)
Zimmerman (1983) 0.060 0.068(0.035) 0.006(0.035) 0.046(0.026)
Porcano (1986) 0.188 0.242(0.045) 0.175(0.047) 0.276(0.062)
Shevlin (1987) 0.171 0.185(0.036) 0.121(0.036) 0.192(0.039)
Gupta and Newberry (1997) 0.154 0.224(0.050) 0.139(0.051) 0.250(0.073)
Notes: r is the correlation coefficient between each financial statement measure and the tax-return measure
of the average tax rate. The b s were estimated from variants of the following equation of financial
statement estimates of tax rates (tfinancial) and tax return-based tax rates (ttax):
tfinancial ¼ b0 þ b1ttax þXN
i¼2
biXi:
The univariate b is the estimated coefficient from a regression of the tax return-based measure on the
financial statement measure. Bivariate b regressions include the log of assets as an additional explanatory
variable. In the multivariate regressions, the additional covariates are log of assets, capital intensity (net
PPE/total assets), leverage (long-term debt/total assets), NOL (a binary variable equal to one if the firm
reports net operating loss carryforwards) and industry controls (eight one-digit SIC code dummy
variables). Sample sizes are 1,116 for the univariate and bivariate regressions, 635 for the multivariate.
Standard errors are in parentheses.
G.A. Plesko / Journal of Accounting and Economics 35 (2003) 201–226 211
additional explanatory variables are included,10 and provides estimates of the bias inthe ATR measures in empirical settings using the same explanatory variables. In allcases the reliability of the ATR measures fall and none exceed 0.500, although Guptaand Newberry’s has both the highest estimated l and the greatest stability acrossspecifications. Two of the measures, JCT and Porcano, have estimates of l below0.100.
Panel B of Table 2 reports the results of similar estimation using TACIST as thebenchmark. For all ATR measures the univariate and bivariate estimates of l are less
TA
CN
I
Stickney and McGee-1 0 .34 1
-1
0
.34
1
TA
CIS
T
Stickney and McGee-1 0 .34 1
-1
0
.34
1
Fig. 1. Tax return versus financial statement measures of ATR.
10 In the multivariate regressions, the additional covariates are lnðAssetsÞ; capital intensity (net PPE/total
assets), leverage (long-term debt/total assets), a binary variable equal to one if the firm reports NOL
carryforwards, and eight one-digit SIC code dummy variables.
G.A. Plesko / Journal of Accounting and Economics 35 (2003) 201–226212
than those for TACNI. In the multivariate setting, four of the six ATR measureshave essentially the same or higher estimates of l than for TACNI, with Zimmermanand Gupta and Newberry’s performing worse.11
As discussed earlier, the existence of consolidation differences and foreignoperations are considered to be among the most significant factors in the divergencebetween tax and financial reporting. While firms with ownership in controlledforeign corporations have been excluded, consolidated returns were included so longas they satisfied other restrictions to ensure consolidation was the same for tax andfinancial purposes. Consolidation, however, is likely to be associated with firm size,and reporting of consolidated operations for financial purposes may be lessrestrictive than tax. Tax rules for acquired NOLs, for example, restrict their useacross entities within the corporation, restrictions which may not be apparent infinancial reporting. To test the sensitivity of these results to the sample selectionprocess, and in particular the possibility that consolidation differences influence theempirical relationships, the 868 consolidated returns were dropped and theregressions of Table 2 were re-estimated. While most of the estimated bs are largerwithin this more restrictive sample, all of the multivariate estimates are lessthan 0.600.
While the previous discussion focused on quantifying the bias in ATRmeasures when used as explanatory variables, other studies have sought todetermine whether there are systematic differences in ATRs across firms ofvarious characteristics, such as size, and what factors might be responsible forthose differences. In some cases, these tests are performed via regression (e.g.,Shevlin and Porter, 1992; Gupta and Newberry, 1997), while in others firmsare grouped by a set of characteristics (such as assets or sales) and tests areperformed as to whether ATRs are statistically different across groups (e.g.,Zimmerman, 1983; Porcano, 1986; Kern and Morris, 1992). In these later cases,although regression analysis was not used in the original study, the test of meansacross different groupings could have been performed using a regression model withbinary explanatory variables representing each characteristic. In such a setting thestatistical significance of each regression coefficient becomes a test of differences inmeans.
Regardless of the original approach taken to analyze differences in measuredATRs, any inferences about statutory tax burdens depend upon the assumption thatATRs are measured correctly, or that any error in measurement is random, normal,and uncorrelated with the explanatory variable(s). Given the errors in the measuredATRs have already been shown to be non-normal, what remains to be determinedare the effects these errors could have in an empirical setting.
To illustrate the implications of measurement error in the dependent variable, Iestimate a simple model to explain variations in the ATR measure suggested byStickney and McGee, one of the two measures attempting to capture tax return
11 Constraining the financial statement ATRs to the (0, 0.34) interval generally increases the coefficient
estimates of TACIST closer to those reported for TACNI. Univariate coefficients under this constraint
range from 0.263 (Zimmerman) to 0.665 (Stickney and McGee).
G.A. Plesko / Journal of Accounting and Economics 35 (2003) 201–226 213
information, and the ATR measure with the highest correlation to TACIST:
ATRSMi ¼ aþ b1lnðAssestsiÞ þ b2ðCapital intensityiÞ þ b3ðLeverageiÞ: ð5Þ
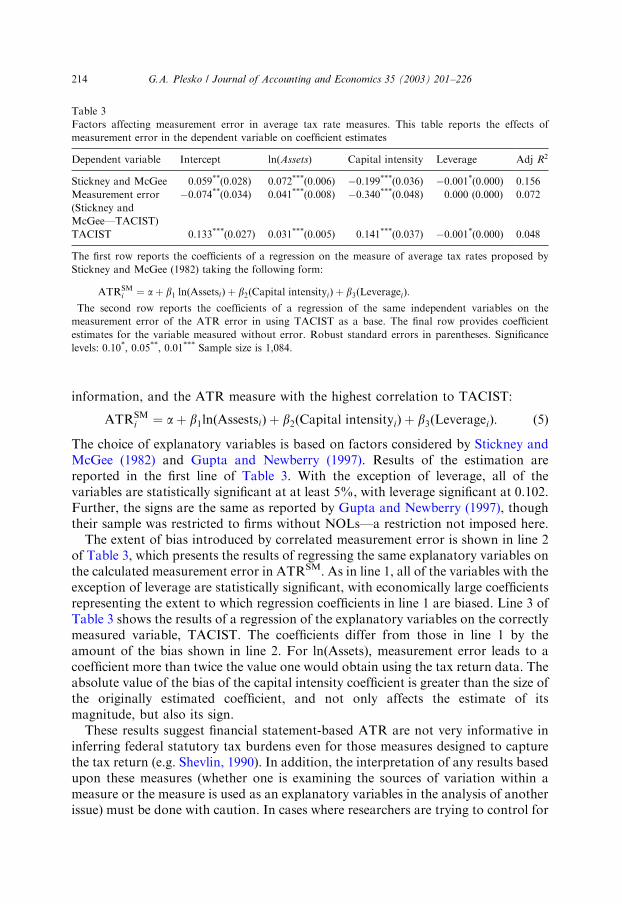
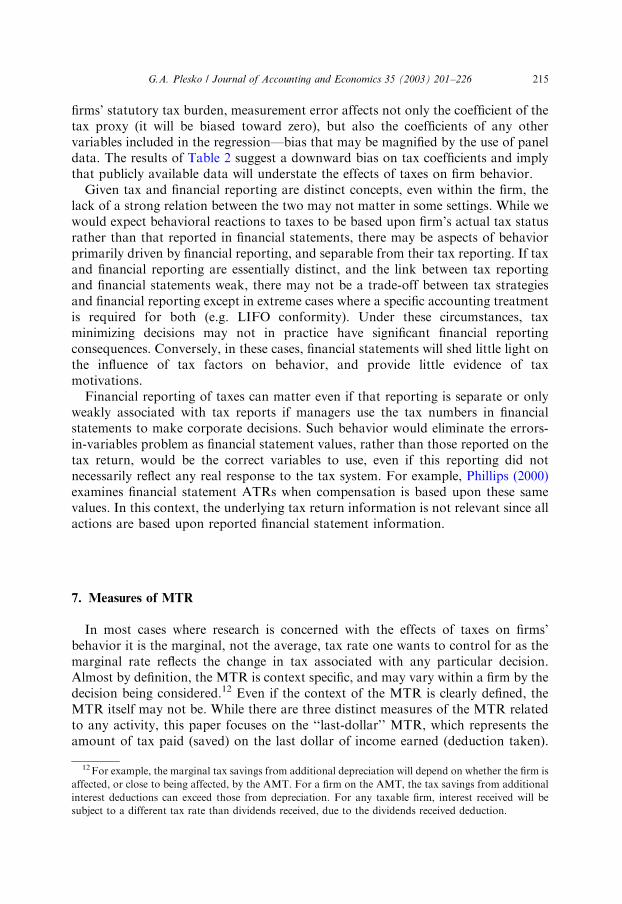
The choice of explanatory variables is based on factors considered by Stickney andMcGee (1982) and Gupta and Newberry (1997). Results of the estimation arereported in the first line of Table 3. With the exception of leverage, all of thevariables are statistically significant at at least 5%, with leverage significant at 0.102.Further, the signs are the same as reported by Gupta and Newberry (1997), thoughtheir sample was restricted to firms without NOLs—a restriction not imposed here.
The extent of bias introduced by correlated measurement error is shown in line 2of Table 3, which presents the results of regressing the same explanatory variables onthe calculated measurement error in ATRSM. As in line 1, all of the variables with theexception of leverage are statistically significant, with economically large coefficientsrepresenting the extent to which regression coefficients in line 1 are biased. Line 3 ofTable 3 shows the results of a regression of the explanatory variables on the correctlymeasured variable, TACIST. The coefficients differ from those in line 1 by theamount of the bias shown in line 2. For lnðAssetsÞ; measurement error leads to acoefficient more than twice the value one would obtain using the tax return data. Theabsolute value of the bias of the capital intensity coefficient is greater than the size ofthe originally estimated coefficient, and not only affects the estimate of itsmagnitude, but also its sign.
These results suggest financial statement-based ATR are not very informative ininferring federal statutory tax burdens even for those measures designed to capturethe tax return (e.g. Shevlin, 1990). In addition, the interpretation of any results basedupon these measures (whether one is examining the sources of variation within ameasure or the measure is used as an explanatory variables in the analysis of anotherissue) must be done with caution. In cases where researchers are trying to control for
Table 3
Factors affecting measurement error in average tax rate measures. This table reports the effects of
measurement error in the dependent variable on coefficient estimates
Dependent variable Intercept ln(Assets) Capital intensity Leverage Adj R2
Stickney and McGee 0.059**(0.028) 0.072***(0.006) �0.199***(0.036) �0.001*(0.000) 0.156
Measurement error
(Stickney and
McGee—TACIST)
�0.074**(0.034) 0.041***(0.008) �0.340***(0.048) 0.000 (0.000) 0.072
TACIST 0.133***(0.027) 0.031***(0.005) 0.141***(0.037) �0.001*(0.000) 0.048
The first row reports the coefficients of a regression on the measure of average tax rates proposed by
Stickney and McGee (1982) taking the following form:
ATRSMi ¼ aþ b1 lnðAssetsiÞ þ b2ðCapital intensityiÞ þ b3ðLeverageiÞ:
The second row reports the coefficients of a regression of the same independent variables on the
measurement error of the ATR error in using TACIST as a base. The final row provides coefficient
estimates for the variable measured without error. Robust standard errors in parentheses. Significance
levels: 0.10*, 0.05**, 0.01*** Sample size is 1,084.
G.A. Plesko / Journal of Accounting and Economics 35 (2003) 201–226214
firms’ statutory tax burden, measurement error affects not only the coefficient of thetax proxy (it will be biased toward zero), but also the coefficients of any othervariables included in the regression—bias that may be magnified by the use of paneldata. The results of Table 2 suggest a downward bias on tax coefficients and implythat publicly available data will understate the effects of taxes on firm behavior.
Given tax and financial reporting are distinct concepts, even within the firm, thelack of a strong relation between the two may not matter in some settings. While wewould expect behavioral reactions to taxes to be based upon firm’s actual tax statusrather than that reported in financial statements, there may be aspects of behaviorprimarily driven by financial reporting, and separable from their tax reporting. If taxand financial reporting are essentially distinct, and the link between tax reportingand financial statements weak, there may not be a trade-off between tax strategiesand financial reporting except in extreme cases where a specific accounting treatmentis required for both (e.g. LIFO conformity). Under these circumstances, taxminimizing decisions may not in practice have significant financial reportingconsequences. Conversely, in these cases, financial statements will shed little light onthe influence of tax factors on behavior, and provide little evidence of taxmotivations.
Financial reporting of taxes can matter even if that reporting is separate or onlyweakly associated with tax reports if managers use the tax numbers in financialstatements to make corporate decisions. Such behavior would eliminate the errors-in-variables problem as financial statement values, rather than those reported on thetax return, would be the correct variables to use, even if this reporting did notnecessarily reflect any real response to the tax system. For example, Phillips (2000)examines financial statement ATRs when compensation is based upon these samevalues. In this context, the underlying tax return information is not relevant since allactions are based upon reported financial statement information.
7. Measures of MTR
In most cases where research is concerned with the effects of taxes on firms’behavior it is the marginal, not the average, tax rate one wants to control for as themarginal rate reflects the change in tax associated with any particular decision.Almost by definition, the MTR is context specific, and may vary within a firm by thedecision being considered.12 Even if the context of the MTR is clearly defined, theMTR itself may not be. While there are three distinct measures of the MTR relatedto any activity, this paper focuses on the ‘‘last-dollar’’ MTR, which represents theamount of tax paid (saved) on the last dollar of income earned (deduction taken).
12 For example, the marginal tax savings from additional depreciation will depend on whether the firm is
affected, or close to being affected, by the AMT. For a firm on the AMT, the tax savings from additional
interest deductions can exceed those from depreciation. For any taxable firm, interest received will be
subject to a different tax rate than dividends received, due to the dividends received deduction.
G.A. Plesko / Journal of Accounting and Economics 35 (2003) 201–226 215
For example, in capital structure decisions the last-dollar MTR measures thedecrease in taxes due to the last dollar of interest payment deducted.13
Although there have been some estimates of MTRs from tax returns, researchershave primarily relied on estimates of firms’ MTR based upon data reported infinancial statements.14 Shevlin (1987, 1990), develops and uses the financialstatement-based measure of taxable income from his ATR measure to estimate thepattern of income and tax liabilities arising from variations in income over time. Thismethodology was extended by Graham (1996a, b) in the context of determining thetax savings from capital structure choices. Manzon (1994) takes a simpler approach,and assumes profitable firms face the statutory maximum rate, but that those withlosses face a reduced tax rate, based upon the time horizon over which the loss isexpected to reverse. Rather than perform extensive simulations, as done by Shevlinand Graham, Manzon estimates the number of years it would take the firm to use upall of its NOL carryforwards, and uses that value to discount the tax rate.15
The tax measures proposed by Shevlin, Manzon, and Graham attempt to measurethe dynamic aspects of the tax code by calculating the effect on taxes over a periodlonger than one year.16 In contrast, this paper uses the current year last dollar MTRas a benchmark. As a result, unless current year and present value tax rates arehighly correlated, the tax return-based current year MTR used in this paper(CYMTR) is not the appropriate benchmark to assess the various present valueproxies. However, given the persistence of firms’ tax status reported by Altshuler andAuerbach (1990) and Graham (1996a, b), such correlation seems to be a reasonableassumption.17
Estimates of firms’ CYMTRs were created by a calculator built for the 1992 SOIcorporate file. For each firm, approximately 60 data items from the tax return wereused in the calculations. These items were taken from Form 1120 (the corporatereturn) and its schedules, Form 3800 (General Business Credit including Foreign TaxCredit information for the purposes of calculating credit limitations), and Form4626, the AMT, including the calculation of the Environmental Tax. The list of taxreturn variables is provided in Table 4.
13 The alternative measures are the ‘‘first-dollar’’ and ‘‘next-dollar’’ MTR. In the case of interest
payments the ‘‘first-dollar’’ MTR estimates the tax savings from the first dollar of interest deducted by the
firm while the ‘‘next-dollar’’ represents the reduction in tax were the firm to deduct an additional dollar of
interest beyond the deductions taken in a given year. Under a progressive tax system, or in the presence of
limited amounts of NOLs or tax credits to offset taxable income and tax liability, the three MTRs need not
be the same.14 Cordes and Sheffrin (1981, 1983) and Dobbins et al. (1988) have provided estimates of corporate
marginal tax rates derived from firm specific tax return data. Plesko (1998) used marginal tax rates at the
industry level to examine leverage decisions surrounding the Tax Reform Act of 1986.15 A hybrid approach is suggested by Manzon and Shevlin (1995) who argue that for NOL carryforward
firms the market value approach of Manzon (1994) provides a less biased and more accurate estimate of
tax rates than the simulation approach.16 Graham (1996b) and Shevlin (1999) both point out the ‘‘true’’ MTR is unobserved.17 At the industry level, Plesko (1998) finds present value marginal tax rates to be highly correlated with
current year tax rates, but that present value rates are better at explaining aggregate leverage changes.
G.A. Plesko / Journal of Accounting and Economics 35 (2003) 201–226216
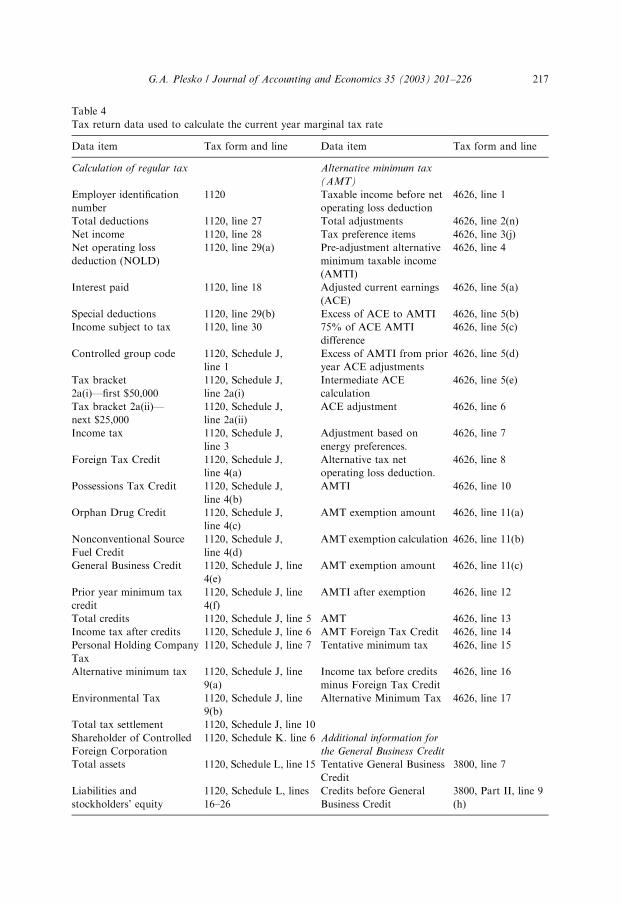
Table 4
Tax return data used to calculate the current year marginal tax rate
Data item Tax form and line Data item Tax form and line
Calculation of regular tax Alternative minimum tax
(AMT)
Employer identification
number
1120 Taxable income before net
operating loss deduction
4626, line 1
Total deductions 1120, line 27 Total adjustments 4626, line 2(n)
Net income 1120, line 28 Tax preference items 4626, line 3(j)
Net operating loss
deduction (NOLD)
1120, line 29(a) Pre-adjustment alternative
minimum taxable income
(AMTI)
4626, line 4
Interest paid 1120, line 18 Adjusted current earnings
(ACE)
4626, line 5(a)
Special deductions 1120, line 29(b) Excess of ACE to AMTI 4626, line 5(b)
Income subject to tax 1120, line 30 75% of ACE AMTI
difference
4626, line 5(c)
Controlled group code 1120, Schedule J,
line 1
Excess of AMTI from prior
year ACE adjustments
4626, line 5(d)
Tax bracket
2a(i)—first $50,000
1120, Schedule J,
line 2a(i)
Intermediate ACE
calculation
4626, line 5(e)
Tax bracket 2a(ii)—
next $25,000
1120, Schedule J,
line 2a(ii)
ACE adjustment 4626, line 6
Income tax 1120, Schedule J,
line 3
Adjustment based on
energy preferences.
4626, line 7
Foreign Tax Credit 1120, Schedule J,
line 4(a)
Alternative tax net
operating loss deduction.
4626, line 8
Possessions Tax Credit 1120, Schedule J,
line 4(b)
AMTI 4626, line 10
Orphan Drug Credit 1120, Schedule J,
line 4(c)
AMT exemption amount 4626, line 11(a)
Nonconventional Source
Fuel Credit
1120, Schedule J,
line 4(d)
AMT exemption calculation 4626, line 11(b)
General Business Credit 1120, Schedule J, line
4(e)
AMT exemption amount 4626, line 11(c)
Prior year minimum tax
credit
1120, Schedule J, line
4(f)
AMTI after exemption 4626, line 12
Total credits 1120, Schedule J, line 5 AMT 4626, line 13
Income tax after credits 1120, Schedule J, line 6 AMT Foreign Tax Credit 4626, line 14
Personal Holding Company
Tax
1120, Schedule J, line 7 Tentative minimum tax 4626, line 15
Alternative minimum tax 1120, Schedule J, line
9(a)
Income tax before credits
minus Foreign Tax Credit
4626, line 16
Environmental Tax 1120, Schedule J, line
9(b)
Alternative Minimum Tax 4626, line 17
Total tax settlement 1120, Schedule J, line 10
Shareholder of Controlled
Foreign Corporation
1120, Schedule K. line 6 Additional information for
the General Business Credit
Total assets 1120, Schedule L, line 15 Tentative General Business
Credit
3800, line 7
Liabilities and
stockholders’ equity
1120, Schedule L, lines
16–26
Credits before General
Business Credit
3800, Part II, line 9
(h)
G.A. Plesko / Journal of Accounting and Economics 35 (2003) 201–226 217
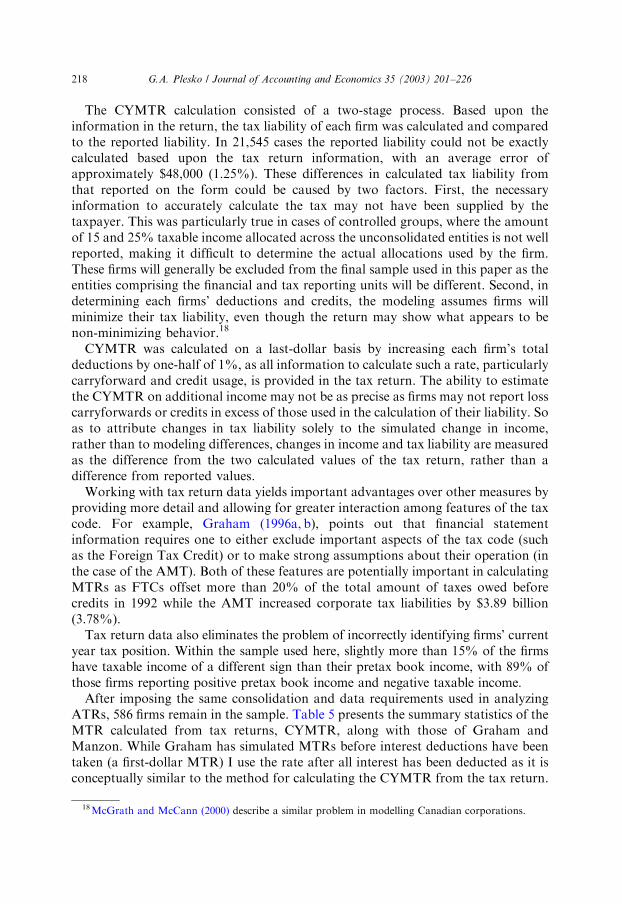
The CYMTR calculation consisted of a two-stage process. Based upon theinformation in the return, the tax liability of each firm was calculated and comparedto the reported liability. In 21,545 cases the reported liability could not be exactlycalculated based upon the tax return information, with an average error ofapproximately $48,000 (1.25%). These differences in calculated tax liability fromthat reported on the form could be caused by two factors. First, the necessaryinformation to accurately calculate the tax may not have been supplied by thetaxpayer. This was particularly true in cases of controlled groups, where the amountof 15 and 25% taxable income allocated across the unconsolidated entities is not wellreported, making it difficult to determine the actual allocations used by the firm.These firms will generally be excluded from the final sample used in this paper as theentities comprising the financial and tax reporting units will be different. Second, indetermining each firms’ deductions and credits, the modeling assumes firms willminimize their tax liability, even though the return may show what appears to benon-minimizing behavior.18
CYMTR was calculated on a last-dollar basis by increasing each firm’s totaldeductions by one-half of 1%, as all information to calculate such a rate, particularlycarryforward and credit usage, is provided in the tax return. The ability to estimatethe CYMTR on additional income may not be as precise as firms may not report losscarryforwards or credits in excess of those used in the calculation of their liability. Soas to attribute changes in tax liability solely to the simulated change in income,rather than to modeling differences, changes in income and tax liability are measuredas the difference from the two calculated values of the tax return, rather than adifference from reported values.
Working with tax return data yields important advantages over other measures byproviding more detail and allowing for greater interaction among features of the taxcode. For example, Graham (1996a, b), points out that financial statementinformation requires one to either exclude important aspects of the tax code (suchas the Foreign Tax Credit) or to make strong assumptions about their operation (inthe case of the AMT). Both of these features are potentially important in calculatingMTRs as FTCs offset more than 20% of the total amount of taxes owed beforecredits in 1992 while the AMT increased corporate tax liabilities by $3.89 billion(3.78%).
Tax return data also eliminates the problem of incorrectly identifying firms’ currentyear tax position. Within the sample used here, slightly more than 15% of the firmshave taxable income of a different sign than their pretax book income, with 89% ofthose firms reporting positive pretax book income and negative taxable income.
After imposing the same consolidation and data requirements used in analyzingATRs, 586 firms remain in the sample. Table 5 presents the summary statistics of theMTR calculated from tax returns, CYMTR, along with those of Graham andManzon. While Graham has simulated MTRs before interest deductions have beentaken (a first-dollar MTR) I use the rate after all interest has been deducted as it isconceptually similar to the method for calculating the CYMTR from the tax return.
18 McGrath and McCann (2000) describe a similar problem in modelling Canadian corporations.
G.A. Plesko / Journal of Accounting and Economics 35 (2003) 201–226218
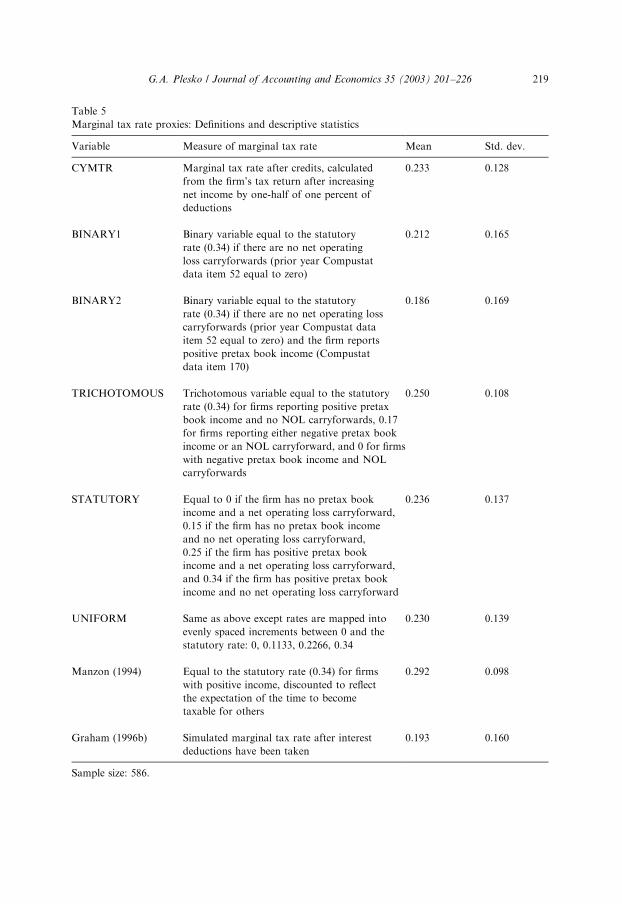
Table 5
Marginal tax rate proxies: Definitions and descriptive statistics
Variable Measure of marginal tax rate Mean Std. dev.
CYMTR Marginal tax rate after credits, calculated
from the firm’s tax return after increasing
net income by one-half of one percent of
deductions
0.233 0.128
BINARY1 Binary variable equal to the statutory
rate (0.34) if there are no net operating
loss carryforwards (prior year Compustat
data item 52 equal to zero)
0.212 0.165
BINARY2 Binary variable equal to the statutory
rate (0.34) if there are no net operating loss
carryforwards (prior year Compustat data
item 52 equal to zero) and the firm reports
positive pretax book income (Compustat
data item 170)
0.186 0.169
TRICHOTOMOUS Trichotomous variable equal to the statutory
rate (0.34) for firms reporting positive pretax
book income and no NOL carryforwards, 0.17
for firms reporting either negative pretax book
income or an NOL carryforward, and 0 for firms
with negative pretax book income and NOL
carryforwards
0.250 0.108
STATUTORY Equal to 0 if the firm has no pretax book
income and a net operating loss carryforward,
0.15 if the firm has no pretax book income
and no net operating loss carryforward,
0.25 if the firm has positive pretax book
income and a net operating loss carryforward,
and 0.34 if the firm has positive pretax book
income and no net operating loss carryforward
0.236 0.137
UNIFORM Same as above except rates are mapped into
evenly spaced increments between 0 and the
statutory rate: 0, 0.1133, 0.2266, 0.34
0.230 0.139
Manzon (1994) Equal to the statutory rate (0.34) for firms
with positive income, discounted to reflect
the expectation of the time to become
taxable for others
0.292 0.098
Graham (1996b) Simulated marginal tax rate after interest
deductions have been taken
0.193 0.160
Sample size: 586.
G.A. Plesko / Journal of Accounting and Economics 35 (2003) 201–226 219
In calculating Manzon’s measure I assume a discount rate of 0.14, with alternaterates yielding similar results.
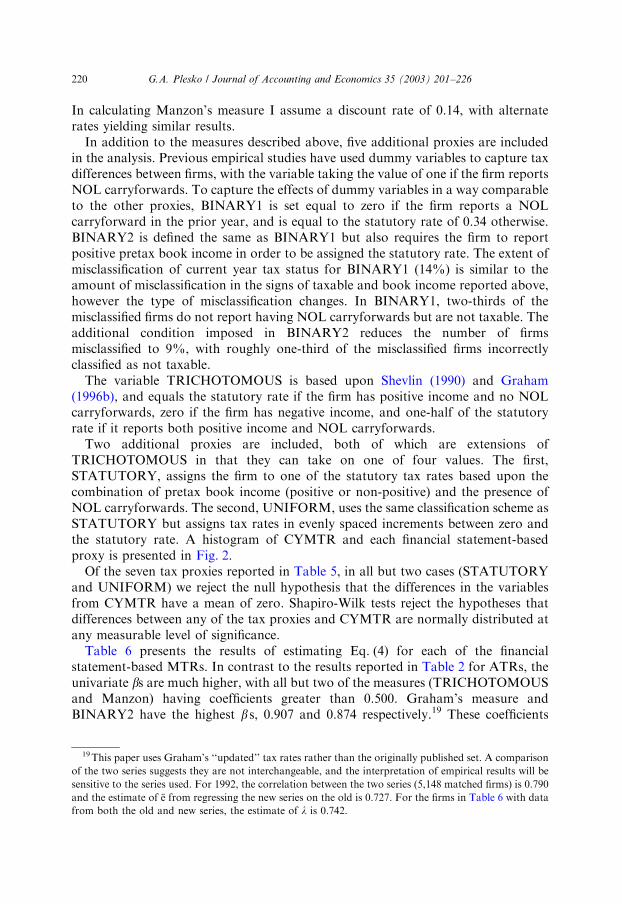
In addition to the measures described above, five additional proxies are includedin the analysis. Previous empirical studies have used dummy variables to capture taxdifferences between firms, with the variable taking the value of one if the firm reportsNOL carryforwards. To capture the effects of dummy variables in a way comparableto the other proxies, BINARY1 is set equal to zero if the firm reports a NOLcarryforward in the prior year, and is equal to the statutory rate of 0.34 otherwise.BINARY2 is defined the same as BINARY1 but also requires the firm to reportpositive pretax book income in order to be assigned the statutory rate. The extent ofmisclassification of current year tax status for BINARY1 (14%) is similar to theamount of misclassification in the signs of taxable and book income reported above,however the type of misclassification changes. In BINARY1, two-thirds of themisclassified firms do not report having NOL carryforwards but are not taxable. Theadditional condition imposed in BINARY2 reduces the number of firmsmisclassified to 9%, with roughly one-third of the misclassified firms incorrectlyclassified as not taxable.
The variable TRICHOTOMOUS is based upon Shevlin (1990) and Graham(1996b), and equals the statutory rate if the firm has positive income and no NOLcarryforwards, zero if the firm has negative income, and one-half of the statutoryrate if it reports both positive income and NOL carryforwards.
Two additional proxies are included, both of which are extensions ofTRICHOTOMOUS in that they can take on one of four values. The first,STATUTORY, assigns the firm to one of the statutory tax rates based upon thecombination of pretax book income (positive or non-positive) and the presence ofNOL carryforwards. The second, UNIFORM, uses the same classification scheme asSTATUTORY but assigns tax rates in evenly spaced increments between zero andthe statutory rate. A histogram of CYMTR and each financial statement-basedproxy is presented in Fig. 2.
Of the seven tax proxies reported in Table 5, in all but two cases (STATUTORYand UNIFORM) we reject the null hypothesis that the differences in the variablesfrom CYMTR have a mean of zero. Shapiro-Wilk tests reject the hypotheses thatdifferences between any of the tax proxies and CYMTR are normally distributed atany measurable level of significance.
Table 6 presents the results of estimating Eq. (4) for each of the financialstatement-based MTRs. In contrast to the results reported in Table 2 for ATRs, theunivariate bs are much higher, with all but two of the measures (TRICHOTOMOUSand Manzon) having coefficients greater than 0.500. Graham’s measure andBINARY2 have the highest bs, 0.907 and 0.874 respectively.19 These coefficients
19 This paper uses Graham’s ‘‘updated’’ tax rates rather than the originally published set. A comparison
of the two series suggests they are not interchangeable, and the interpretation of empirical results will be
sensitive to the series used. For 1992, the correlation between the two series (5,148 matched firms) is 0.790
and the estimate of .e from regressing the new series on the old is 0.727. For the firms in Table 6 with data
from both the old and new series, the estimate of l is 0.742.
G.A. Plesko / Journal of Accounting and Economics 35 (2003) 201–226220

0.000.05
0.100.15
0.200.25
0.300.34
0.000.100.200.300.400.500.600.700.80
GrahamManzon
UNIFORMSTATUTORY
TRICHOTOMOUS
BINARY2
BINARY1
CYMTR
0.000.10
0.200.30
0.400.50
0.600.70
0.80
Shar
e
Marginal T
ax Rate
Fig. 2. Distribution of marginal tax rate estimates.
Table 6
Estimated reliability ratios for marginal tax rate measures
Measure r Univariate b Bivariate b Multivariate b
BINARY1 0.562 0.774(0.037) 0.711(0.043) 0.712(0.047)
BINARY2 0.604 0.874(0.032) 0.834(0.040) 0.819(0.043)
TRICHOTOMOUS 0.519 0.487(0.024) 0.479(0.028) 0.464(0.031)
STATUTORY 0.500 0.760(0.031) 0.731(0.034) 0.718(0.036)
UNIFORM 0.521 0.778(0.030) 0.749(0.034) 0.735(0.035)
Manzon (1994) 0.422 0.295(0.031) 0.255(0.033) 0.256(0.035)
Graham (1996b) 0.646 0.907(0.027) 0.867(0.032) 0.835(0.036)
r is the correlation coefficient between each financial statement measure and the tax return measure of the
marginal tax rate. The bs were estimated from variants of the following equation of financial statement
estimates of tax rates (tfinancial) and tax return-based tax rates (ttax):
tfinancial ¼ b0 þ b1ttax þXN
i¼2
biXi:
The univariate b is the estimated coefficient from a regression of the tax return-based measure on the
financial statement measure. Bivariate b regressions include the log of assets as an additional explanatory
variable. In the multivariate regressions, the additional covariates are log of assets, capital intensity (net
PPE/total assets), Z-score, and industry controls (nine one-digit SIC code dummy variables). Sample sizes
are 586 for the univariate and bivariate regressions, 553 for the multivariate. Standard errors are in
parentheses.
G.A. Plesko / Journal of Accounting and Economics 35 (2003) 201–226 221

remain fairly stable as lnðAssetsÞ and other covariates20 are added, as shown in thenext two columns. In column three both Graham and BINARY2 have estimatedvalues of l in excess of 0.800.
Following the sensitivity tests for the ATR measures, Eq. (4) was reestimated forthe subset of 134 non-consolidated firms (not reported in the tables). With theexception of Manzon’s measure the univariate bs across all specifications increaserelative to those presented in Table 6, with the estimate of l for BINARY2 rising to0.985 and Graham to 0.918. After all the covariates are added, BINARY2 has thehighest coefficient, at 0.859, with the coefficient on Graham’s simulated tax ratefalling to 0.793. For these firms, it appears that controlling for the current yearmarginal effects of corporate taxes can be done as effectively with easily constructedbinary or other categorical variables as with more complicated approaches ofestimating present value MTR.
That a binary variable can be as highly correlated with the current year tax rate asGraham’s continuous variable is appears to be counterintuitive, but a closerexamination of the data, and of Fig. 2, reveals that Graham’s measure has lessvariation than one might expect based upon its methodology. Of the 586observations, Graham places only 11% between 0.03 and 0.31, compared to 34%for CYMTR. The lack of mid-range values is not a result of the sample restrictionsof this paper, as the original sample of 6,156 observations in Graham’s data set hasonly 13% of firms within this range.21
The statistical relation of both Graham’s MTR and BINARY2 to CYMTRsuggests that BINARY2 may also be a better proxy for Graham’s MTR thanTRICHOTOMOUS or the other variables suggested in his paper (Graham, 1996b,p. 209). To test this, Eq. (4) was reestimated using both the consolidated and non-consolidated samples of domestic firms with Graham’s measure substituted forCYMTR as the explanatory variable, paralleling the tests of Table 6. The estimatedcoefficients for BINARY2 across the three specifications averaged 0.87 for theconsolidated sample and 0.93 for the unconsolidated sample, slightly larger than forBINARY1 (0.76 AND 0.83) but substantially greater than the 0.49 and 0.52for TRICHOTOMOUS. Within this sample, BINARY2 serves as a better substitutefor Graham’s (1996b) simulated rates than the alternatives tested in his paper.
This distribution of estimated tax rates suggests MTR proxies, even thoseestimated to have high values of l; should not be viewed as continuous variables.Researchers should be careful in interpreting coefficients on these variables, andrecognize that coefficients on such variables may not represent the effects of infra-marginal changes in the tax rate of a firm, but rather more closely resemble themovement of a firm from a low (or zero) MTR to a high (or statutory maximum)marginal rate.
20 The additional covariates beyond ln(Assets) are capital intensity (net PPE/total assets), Altman’s Z-
score (as implemented by Graham (1996a)), and industry controls for one-digit SIC classifications.21 Graham’s measure will also be affected by the misclassification of firms’ current tax status. Similar to
the errors reported earlier for the binary variables, 15% of the firms in the sample are assigned a zero tax
rate by Graham even though they report a positive tax liability on their tax return.
G.A. Plesko / Journal of Accounting and Economics 35 (2003) 201–226222
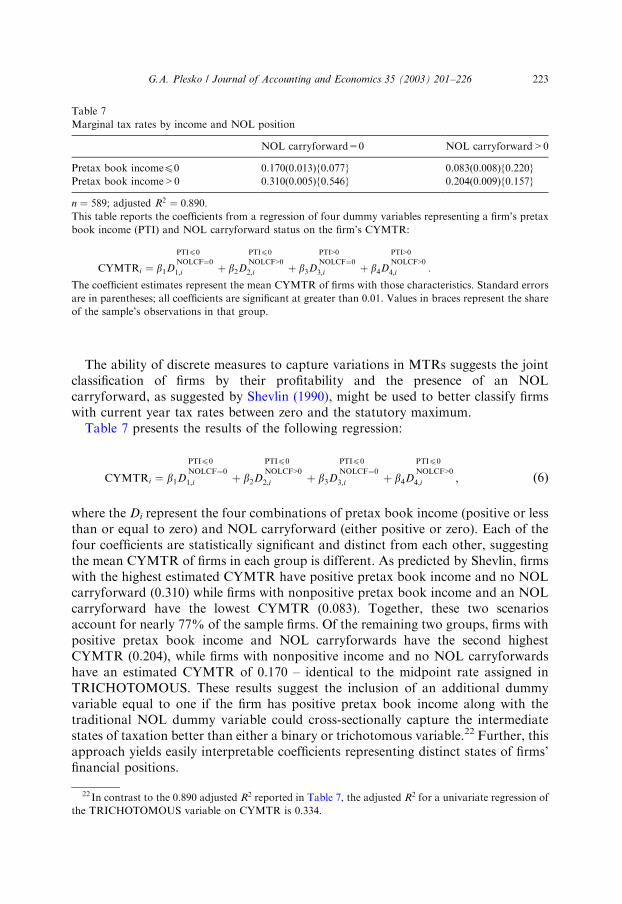
The ability of discrete measures to capture variations in MTRs suggests the jointclassification of firms by their profitability and the presence of an NOLcarryforward, as suggested by Shevlin (1990), might be used to better classify firmswith current year tax rates between zero and the statutory maximum.
Table 7 presents the results of the following regression:
CYMTRi ¼ b1D
PTIp0
NOLCF¼0
1;i þ b2D
PTIp0
NOLCF>0
2;i þ b3D
PTIp0
NOLCF¼0
3;i þ b4D
PTIp0
NOLCF>0
4;i ; ð6Þ
where the Di represent the four combinations of pretax book income (positive or lessthan or equal to zero) and NOL carryforward (either positive or zero). Each of thefour coefficients are statistically significant and distinct from each other, suggestingthe mean CYMTR of firms in each group is different. As predicted by Shevlin, firmswith the highest estimated CYMTR have positive pretax book income and no NOLcarryforward (0.310) while firms with nonpositive pretax book income and an NOLcarryforward have the lowest CYMTR (0.083). Together, these two scenariosaccount for nearly 77% of the sample firms. Of the remaining two groups, firms withpositive pretax book income and NOL carryforwards have the second highestCYMTR (0.204), while firms with nonpositive income and no NOL carryforwardshave an estimated CYMTR of 0.170 – identical to the midpoint rate assigned inTRICHOTOMOUS. These results suggest the inclusion of an additional dummyvariable equal to one if the firm has positive pretax book income along with thetraditional NOL dummy variable could cross-sectionally capture the intermediatestates of taxation better than either a binary or trichotomous variable.22 Further, thisapproach yields easily interpretable coefficients representing distinct states of firms’financial positions.
Table 7
Marginal tax rates by income and NOL position
NOL carryforward=0 NOL carryforward>0
Pretax book incomep0 0.170(0.013){0.077} 0.083(0.008){0.220}
Pretax book income>0 0.310(0.005){0.546} 0.204(0.009){0.157}
n ¼ 589; adjusted R2 ¼ 0:890:This table reports the coefficients from a regression of four dummy variables representing a firm’s pretax
book income (PTI) and NOL carryforward status on the firm’s CYMTR:
CYMTRi ¼ b1D
PTIp0
NOLCF¼0
1;i þ b2D
PTIp0
NOLCF>0
2;i þ b3D
PTI>0
NOLCF¼0
3;i þ b4D
PTI>0
NOLCF>0
4;i :
The coefficient estimates represent the mean CYMTR of firms with those characteristics. Standard errors
are in parentheses; all coefficients are significant at greater than 0.01. Values in braces represent the share
of the sample’s observations in that group.
22 In contrast to the 0.890 adjusted R2 reported in Table 7, the adjusted R2 for a univariate regression of
the TRICHOTOMOUS variable on CYMTR is 0.334.
G.A. Plesko / Journal of Accounting and Economics 35 (2003) 201–226 223

8. Summary and conclusions
While taxes are an important element in corporate decision making, determining afirm’s tax liability is based upon a separate set of rules than income reported toshareholders, and its presentation is filtered through financial accounting standards.The results of this paper suggest that commonly used financial statement-basedmeasures of corporate ATRs measure the statutory corporate tax burden withsignificant error. When used as explanatory variables, the coefficients on thesevariables will understate the effects of the tax system on firm behavior unlessfinancial reporting values influence behavior rather than the tax reporting values.Further, the distribution of financial statement-based ATRs, and the characteristicsused to explain the distribution of these tax rates, do not appear to carry over tounderstanding the distribution of statutory tax burdens.
MTR proxies derived from financial statements appear to provide relativelyreliable estimates of the MTR facing firms in the current year, and the coefficients onthese variables will only slightly understate the effects of taxation. Three measures ofMTR, the current year MTR derived from the tax return, the present value MTRsimulated from financial statements, and a simple binary variable based upon acombination of firms’ income and NOL carryforward position, are found to behighly correlated with each other in the sample.
References
Aigner, D.J., 1973. Regression with a binary independent variable subject to errors of observation. Journal
of Econometrics 1, 49–59.
Altshuler, R., Auerbach, A.J., 1990. The significance of tax law asymmetries: an empirical investigation.
Quarterly Journal of Economics 105, 61–86.
Angrist, J.D., Krueger, A.B., 1999. Empirical strategies in labor economics. In: Ashenfelter, O., Card, D.
(Eds.), Handbook of Labor Economics, Vol. 3A. North Holland, Amsterdam.
Auerbach, A.J., Slemrod, J., 1997. The economic effects of the Tax Reform Act of 1986. Journal of
Economic Literature 35, 589–632.
Bound, J., Kruegar, A.B., 1991. The extent of measurement error in longitudinal earnings data: do two
wrongs make a right? Journal of Labor Economics 9, 1–24.
Boynton, C.E, Dobbins, P., Plesko, G.A., 1992. Earnings management and the corporate Alternative
Minimum Tax. Journal of Accounting Research 30 (Suppl.), 131–153.
Brealey, R., Myers, S., 1996. Principles of Corporate Finance, 5th Edition. McGraw-Hill, New York.
Callihan, D.S., 1994. Corporate effective tax rates: a synthesis of the literature. Journal of Accounting
Literature 13, 1–43.
Collins, J.H., Shackelford, D.A., 1997. Global organizations and taxes: an analysis of the dividend,
interest, royalty, and management fee payments between U.S. multinationals foreign affiliates. Journal
of Accounting and Economics 24, 151–173.
Collins, J.H., Kemsley, D., Shackelford, D.A., 1995. Tax Reform and foreign acquisitions: a
microanalysis. National Tax Journal 48, 1–21.
Cordes, J.J., Sheffrin, S.M., 1981. Taxation and the sectoral allocation of capital. National Tax Journal
34, 419–432.
Cordes, J.J., Sheffrin, S.M., 1983. Estimating the tax advantage of corporate debt. Journal of Finance 38,
95–105.
G.A. Plesko / Journal of Accounting and Economics 35 (2003) 201–226224

Dobbins, P., Dworin, L., Neubig, T., Plesko, G.A., 1988. The Treasury corporate tax model and micro-
simulation applications. Working paper, Office of Tax Analysis, U.S. Department of the Treasury.
Duncan, G.J., Hill, D.H., 1985. An investigation of the extent and consequences of measurement error in
labor-economic survey data. Journal of Labor Economics 3, 508–532.
Dworin, L., 1985, On estimating corporate tax liabilities from financial statements. Tax Notes 29,
965–971.
Fuller, W.A., 1987. Measurement Error Models. Wiley, New York.
Graham, J.R., 1996a. Debt and the marginal tax rate. Journal of Financial Economics 41, 41–73.
Graham, J.R., 1996b. Proxies for the marginal tax rate. Journal of Financial Economics 42, 187–221.
Gramlich, J., 1992. Discussion of earnings management and the corporate Alternative Minimum Tax.
Journal of Accounting Research 30 (Suppl.), 131–160.
Greene, W.H., 1998. Econometric Analysis, 3rd Edition. Prentice-Hall, Englewood Cliffs, NJ.
Griliches, Z., 1986. Economic data issues. In: Griliches, Z., Intriligator, M.D. (Eds.), Handbook of
Econometrics, Vol. III. North-Holland, Amsterdam.
Gupta, S., Newberry, K., 1997. Determinants of the variability in corporate effective tax rates: evidence
from longitudinal data. Journal of Accounting and Public Policy 16, 1–34.
Hanlon, M., Shevlin, T., 2002. Accounting for the tax benefits of employee stock options and implications
for research. Accounting Horizons 16, 1–16.
Kern, B.B., Morris, M.H., 1992. Taxes and firm size: the effect of tax legislation during the 1980s. Journal
of the American Taxation Association 14, 80–96.
Klepper, S., Kamlet, M.S., Frank, R.G., 1993. Regressor diagnostics for the errors-in-variables model—
An application to the health effects of pollution. Journal of Environmental Economics and
Management 24, 190–211.
Lyon, A.B., 1997. Cracking the Code: Making Sense of the Corporate Alternative Minimum Tax.
Brookings Institution, Washington DC.
Lyon, A.B., Silverstein, G., 1995. The Alternative Minimum Tax and the behavior of multinational
corporations. In: Feldstein, M., Hines, J., Glenn Hubbard, R. (Eds.), The Effects of Taxation on
Multinational Corporations. University of Chicago Press, Chicago pp. 153–177.
Manzon, G.B., 1994. The role of taxes in early debt retirement. Journal of the American Taxation
Association 16, 87–100.
Manzon, G.B., Plesko, G.A., 1996. Self-disclosure and selection bias in studies of AMT-motivated
behavior. Paper presented at the Financial Reporting Forum of the Annual Meeting of the American
Accounting Association, Chicago, IL.
Manzon, G.B., Plesko, G.A., 2002. The relation between financial and tax reporting measures of income,
Tax Law Review, forthcoming.
Manzon, G.B., Shevlin, T., 1995. An evaluation of marginal tax rate proxies for firms with NOL
carryforwards. Working paper, Boston College and University of Washington.
Maydew, E.L., 2001. Empirical tax research in accounting: a discussion. Journal of Accounting and
Economics 31, 389–403.
McGrath, A., McCann, C.D., 2000. Canada’s corporation tax model. In: Gupta, A., Kapur, V. (Eds.),
Microsimulation in Government Policy and Forecasting, North-Holland, Amsterdam.
Mills, L.F., 1998. Book-tax differences and Internal Revenue Service adjustments. Journal of Accounting
Research 36, 343–356.
Mills, L., Erickson, M.M., Maydew, E.L., 1998. Investments in tax planning. Journal of the American
Taxation Association 20, 1–20.
Omer, T.C., Molloy, K.H., Ziebart, D.A., 1991. Measurement of effective corporate tax rates using
financial statement information. Journal of the American Taxation Association 13, 57–72.
Omer, T.C., Plesko, G.A., Shelley, M.K., 2000. The influence of tax costs on organizational choice in the
natural resource industry. Journal of the American Taxation Association 22, 38–55.
Phillips, J., 2000. Corporate tax planning effectiveness: the role of incentives. Working paper, University
of Connecticut.
Plesko, G.A., 1994. Corporate taxation and the financial characteristics of firms. Public Finance Quarterly
22, 311.
G.A. Plesko / Journal of Accounting and Economics 35 (2003) 201–226 225
Plesko, G.A., 1998. The tax advantage to corporate debt after Tax Reform. Working paper,
Massachusetts Institute of Technology.
Plesko, G.A., 2000a. Book-tax differences and the measurement of corporate income. In: Proceedings of
the 92nd Annual Conference, National Tax Association—Tax Institute of America, Washington, DC,
pp. 171–176.
Plesko, G.A., 2000b. Evidence and theory on corporate tax shelters. In: Proceedings of the 92nd Annual
Conference, National Tax Association, Tax Institute of America, Washington, DC, pp. 367–371.
Porcano, T.M., 1986. Corporate tax rates: progressive, proportional, or regressive. Journal of the
American Taxation Association 7, 17–31.
Scholes, M.S., Wolfson, M.A., 1992. Taxes and Business Strategy: A Planning Approach. Prentice-Hall,
Englewood Cliffs, NJ.
Shackelford, D.A., Shevlin, T., 2001. Empirical tax research in accounting. Journal of Accounting and
Economics 31, 321–387.
Shevlin, T., 1987. Taxes and of-balance-sheet financing: research and development limited partnerships.
The Accounting Review 62, 480–509.
Shevlin, T., 1990. Estimating corporate marginal tax rates with asymmetric tax treatment of gains and
losses. Journal of the American Taxation Association 1, 51–67.
Shevlin, T., 1999. A critique of Plesko’s An evaluation of alternative measures of corporate tax rates.
Working paper, University of Washington.
Shevlin, T., Porter, S., 1992. The corporate tax comeback in 1987 some further evidence. Journal of the
American Taxation Association 14, 58–79.
Slemrod, J. (Ed.), 1990, Do Taxes Matter? The Impact of the Tax Reform Act of 1986. MIT Press,
Cambridge.
Stickney, C.P., McGee, V.E., 1982. Effective corporate tax rates - the effect of size, capital intensity,
leverage, and other factors. Journal of Accounting and Public Policy 1, 125–152.
Sullivan, M., 2000. Let the Good Times Roll: options and tax-free profits. Tax Notes 87, 1185–1191.
Topel, R.H., 1991. Specific capital, mobility, and wages: wages rise with job seniority. Journal of Political
Economy 99, 145–176.
US Congress, Joint Committee on Taxation, 1984. Study of 1983 effective tax rates of selected large U.S.
corporations (JCS-40-84). U.S. Government Printing Office. Washington, DC.
US Department of the Treasury, 1999. The Problem of corporate tax shelters: discussion, analysis and
legislative proposals. U.S. Government Printing Office. Washington, DC.
US Internal Revenue Service, 1995. Statistics of Income—1992: Corporation Income Tax Returns,
(Publication 16). U.S. Government Printing Office, Washington, DC.
Zimmerman, J.L., 1983. Taxes and firm size. Journal of Accounting and Economics 5, 119–149.
G.A. Plesko / Journal of Accounting and Economics 35 (2003) 201–226226