An Evaluation of a Staff Mentor Program for At-Risk …...With Mentors, At-Risk Without Mentors, and...
257
Portland State University PDXScholar Dissertations and eses Dissertations and eses 1998 An Evaluation of a Staff Mentor Program for At-Risk Students in an Oregon High School: CAKE (Caring About Kids Effectively) Gail Lenore Hayes Portland State University Let us know how access to this document benefits you. Follow this and additional works at: hps://pdxscholar.library.pdx.edu/open_access_etds Part of the Educational Leadership Commons , and the Elementary and Middle and Secondary Education Administration Commons is Dissertation is brought to you for free and open access. It has been accepted for inclusion in Dissertations and eses by an authorized administrator of PDXScholar. For more information, please contact [email protected]. Recommended Citation Hayes, Gail Lenore, "An Evaluation of a Staff Mentor Program for At-Risk Students in an Oregon High School: CAKE (Caring About Kids Effectively)" (1998). Dissertations and eses. Paper 4278. 10.15760/etd.6175
Transcript of An Evaluation of a Staff Mentor Program for At-Risk …...With Mentors, At-Risk Without Mentors, and...
Portland State UniversityPDXScholar
Dissertations and Theses Dissertations and Theses
1998
An Evaluation of a Staff Mentor Program for At-Risk Students in anOregon High School: CAKE (Caring About Kids Effectively)Gail Lenore HayesPortland State University
Let us know how access to this document benefits you.Follow this and additional works at: https://pdxscholar.library.pdx.edu/open_access_etds
Part of the Educational Leadership Commons, and the Elementary and Middle and SecondaryEducation Administration Commons
This Dissertation is brought to you for free and open access. It has been accepted for inclusion in Dissertations and Theses by an authorizedadministrator of PDXScholar. For more information, please contact [email protected].
Recommended CitationHayes, Gail Lenore, "An Evaluation of a Staff Mentor Program for At-Risk Students in an Oregon High School: CAKE (Caring AboutKids Effectively)" (1998). Dissertations and Theses. Paper 4278.
10.15760/etd.6175

AN EVALUATION OF A STAFF MENTOR PROGRAM FOR
AT-RISK STUDENTS IN AN OREGON HIGH SCHOOL:
CA.KE (CARING ABOUT KIDS EFFECTIVELY)
by
GAIL LENORE HAYES
A dissertation submitted in partial fulfillment of the requirements for the degree of
DOCTOR OF EDUCATION in
EDUCATIONAL LEADERSHIP: ADMINISTRATION
Portland State University ©1998

DISSERTATION APPROVAL
The abstract and dissertation of Gail Lenore Hayes for the
Doctor of Education in Educational Leadership:
Administration were presented December 16, 1997, and
accepted by the dissertation committee and the doctoral
program.
COMMITTEE APPROVALS: CfJOY; Hales, Chair
Tom Chenoweth
Ron Petrie
Grant M. Farr Representative of the Off ice of Graduate Studies
DOCTORAL PROGRAM APPROVAL: Robert B. Everhart, Dean School of Education

ABSTRACT
An abstract of the dissertation of Gail Lenore Hayes for
the Doctor of Education in Educational Leadership:
Administration presented December 16, 1997.
Title: An Evaluation of a Staff Mentor Program for At
Risk Students in an Oregon High School: CAKE
{Caring About Kids Effectively)
This study examined the effect of a staff mentoring
program with students identified as at-risk of becoming
early leavers. This mentoring program, Caring About Kids
Effectively {CAKE), was implemented at a suburban
secondary school in Oregon serving grades 9 through 12.
The study of the CAKE program had four research
components: {a) indicators of school success (GPA,
attendance, and attitudes toward school) were compared
between at-risk students and those not at-risk;
(b) indicators of school success were analyzed over the
time at-risk students were mentored to find any
significant change; {c) indicators of school success and
enrollment status at graduation was compared between
students at-risk, with and without mentors; and

(d) participants' perceptions of the mentoring program,
using a researcher-constructed questionnaire given to
mentees and mentors to determine activities that were
successful and those which needed reevaluation.
Using analysis of covariance, the findings showed:
2
(a) a significant difference {E<.05) in attitudes, GPA,
and attendance at the beginning of the study between two
groups of students identified as at-risk and not at-risk;
(b) a significant difference {E<.05) in attitude toward
school at the end of Year 1 between those students at-risk
with mentors scoring higher than at-risk without mentors
and not at-risk students; (c) GPA and attendance declined
for at-risk students, with or without mentors, although
at-risk students with a mentor seemed to lessen the
decline; and (d) no significant differences (E<.05) in GPA
and attendance between at-risk with or without mentors,
although more at-risk students with mentors continued in
school or received GEDs after four years. Finally,
students and staff agreed (75%) that they were "satisfied"
that the mentor program helped at-risk students develop
positive attitudes toward school; however, only half were
satisfied concerning their participation, and felt that
administrative support and time available to meet with
students were crucial to the success of a mentor program.

Based upon these findings, it was concluded that the
CAKE staff mentoring program had a positive influence on
attitude toward school and retention of at-risk students.
3

ACKNOWLEDGMENTS
I am indebted to and wish to acknowledge the many
people who have contributed to the successful completion
of the dissertation. I am especially appreciative of the
time and caring spent by staff mentors who worked with at
risk youth, at Milwaukie High School, and particularly
Larry Wilkins and Sue Johnson, coordinators of the CAKE
mentoring program.
My committee members who have been patient each made
contributions for which I am indebted: Dr. Loyde Hales,
who chaired the committee, provided valuable feedback and
constant support; Dr. Gary Nave, who gave the CAKE
committee great insight into evaluation tools; Dr. Tom
Chenoweth and Dr. Grant Farr who recognized the importance
of such research and gave valuable feedback; and finally,
Dr. Ron Petrie, who helped me visualize my goal and stayed
with my committee, even into his retirement.
Many other people provided support and encouragement
at various stages of my doctoral work and the writing of
this dissertation. A very special thank you to my good
friends Dr. Gaynelle Nolf and Dr. Virginia Anderson, who
have been a constant source of strength and challenged me
to finish this last obstacle; to Joyce Harris, who gave me
iii
the expertise to tackle the statistics portion of the
dissertation, and to Joe Walker, whose editorial and
technical knowledge along with long hours at the keyboard,
enabled a "photo finish" at the defense.
I am especially grateful to my husband, Dr. Mike
Davis, and my three children, Mike, Kelly, and William,
for their understanding of the valuable time away from
family needed to finish this program, and finally, my
parents, Billie and Burke Hayes, for their unwavering
support which ultimately instilled in me the resiliency to
continue when I felt the weakest.
I dedicate this dissertation to my beloved mother,
who passed away before she witnessed my final graduation.
TABLE OF CONTENTS
PAGE
ACKNOWLEDGMENTS . ii
LIST OF TABLES viii
CHAPTER
I INTRODUCTION 1
Statement of the Problem . 1
Background . 4
Rationale 13
Purpose of the Study 18
Definition of Terms 19
Limitations 23
II REVIEW OF THE LITERATURE 27
Educational Reform . 27
Characteristics of At-Risk Students 40
Characteristics of Programs for At-Risk Students . . . . . . . 52
Mentoring
Definition and Historical Background of Mentoring
Roles and Characteristics of Mentor Relationships
Development and Implementation of Successful Mentor Programs
The At-Risk Student and Mentoring Teachers as Mentors for At-Risk
Students
63

III
IV
v
METHODOLOGY • . . 87
General Plan of Study 87
CAKE (Caring About Kids Effectively) . 87
Quantitative Research Components . 89
Independent Variables 90
Characteristics of High School/School District • • . • . . . . . . 91
Subjects • •
Instruments
The Quality of School Life Survey, or QSL
CAKE Survey
Procedures • . . . • •
overview of the Data .
Data Analysis Procedures .
RESULTS .
Pretreatment Analyses
Pretreatment
Question 1.. Comparison of At-Risk and
93
96
1.03
1.08
1.09
122
122
124
Not At-Risk students . . . • 125
The Quality of School Life Scales Attendance Grade Point Average
Question 2. Comparison of At-Risk students with Mentors, At-Risk students without Mentors, and Not At-Risk students . . . . . . 133
The Quality of School Life Scales Attendance GPA
v
REFERENCES
Question 3. Comparison with Mentoring and without Mentoring: School Life Scales
of At-Risk At-Risk Quality of
Question 4. Comparison of At-Risk with Mentoring and At-Risk without Mentoring: Attendance
vi
139
and GPA . . . . . . . . . . . . . 141
Attendance GPA
Question 5. Comparison of Enrollment Status of At-Risk with Mentoring and At-Risk without Mentoring . . 147
Question 6. Perceptions of the Mentor Program: Results of the CAKE Survey . . . . . . . . . 149
Student Comments - QSL
DISCUSSION OF FINDINGS AND RECOMMENDATIONS . . . .
Statistical Findings: Interpretations .
Question 1 Question 2 Question 3 Question 4 Question 5 Question 6
Conclusions
Implications for Practice Recommendations for Practice
Recommendations for Research .
Final Remarks
160
162
164
178
186
187
189

APPENDICES
A QSL ITEM CHARACTERISTICS
B
c
D
E
F
MENTOR (STAFF) CAKE SURVEY
MENTEE (STUDENT) CAKE SURVEY
PRETREATMENT ANALYSES . . . . . . . . . . .
ANALYSES OF QUESTIONS 1 THROUGH 4 . . . . .
HUMAN SUBJECTS CONSENT FORM . . .
vii
204
206
217
228
230
240
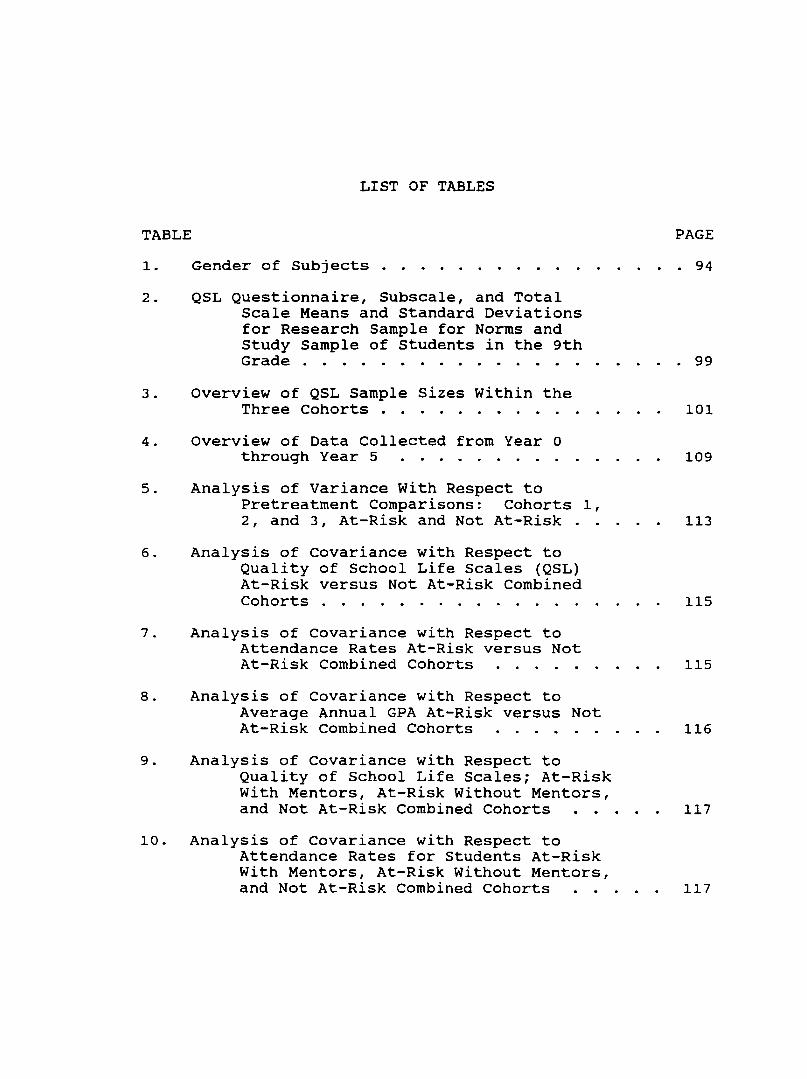
LIST OF TABLES
TABLE
1.
2.
3.
4.
5.
Gender of Subjects . . . . . . .
QSL Questionnaire, Subscale, and Total Scale Means and Standard Deviations for Research Sample for Norms and Study Sample of Students in the 9th Grade . . . . . . . . . . . . . . .
Overview of QSL Sample Sizes Within the Three Cohorts . . . . . . .
Overview of Data Collected from Year o through Year 5 . . . . . . . . .
Analysis of variance With Respect to Pretreatment Comparisons: Cohorts 1, 2, and 3, At-Risk and Not At-Risk .
6. Analysis of Covariance with Respect to Quality of School Life Scales (QSL) At-Risk versus Not At-Risk Combined Cohorts .
7. Analysis of covariance with Respect to Attendance Rates At-Risk versus Not At-Risk Combined Cohorts . . . .
8. Analysis of Covariance with Respect to Average Annual GPA At-Risk versus Not At-Risk combined Cohorts . . . .
9. Analysis of Covariance with Respect to Quality of School Life Scales; At-Risk With Mentors, At-Risk Without Mentors, and Not At-Risk Combined Cohorts
10. Analysis of Covariance with Respect to Attendance Rates for Students At-Risk With Mentors, At-Risk Without Mentors, and Not At-Risk Combined Cohorts
PAGE
. 94
. 99
101
109
113
115
115
116
117
117

11. Analysis of covariance with Respect to the Quality of School Life Questionnaire for At-Risk Students With and Without Mentors -- Year 1 to Year 2, Cohorts 1, 2, 3 •••••.
12. Analysis of Variance for Attendance by AtRisk Students with Mentors versus No Mentors (All Possible Subjects} . . .
13. Analysis of Variance for GPA (Average) by Mentors versus No Mentors Cohorts 1 and 3 . . . . . . . . . . . . . . . .
14. Percentiles and Chi-Square Analysis of Enrollment Status After Year 4 for All At-Risk Students . . . . .
15. Selected Survey Questions: Comparisons Between Mentor and Mentee Responses .
16. Analysis of Variance With Respect to Pretreatment Comparisons by Cohort for At-Risk and Not At-Risk . . . .
17. Analysis of Variance Prior to Treatment, Total Quality of School Life Scale, At-Risk versus Not At-Risk, Combined Cohorts . . . . . . . . . . .
18. T-test Analysis Prior to Treatment on Attendance and GPA, At-Risk versus Not At-Risk, Combined Cohorts . . . . . .
19. Analysis of Covariance with Respect to Quality of School Life Scales (QSL) At-Risk versus Not At-Risk Combined Cohorts
20. Analysis of Covariance with Respect to Attendance Rates At-Risk versus Not At-Risk Combined Cohorts . . . . . .
21. Analysis of Covariance with Respect to Average Annual GPA At-Risk versus Not At-Risk Combined Cohorts . . . .
ix
118
119
119
120
121
123
126
128
129
131
132
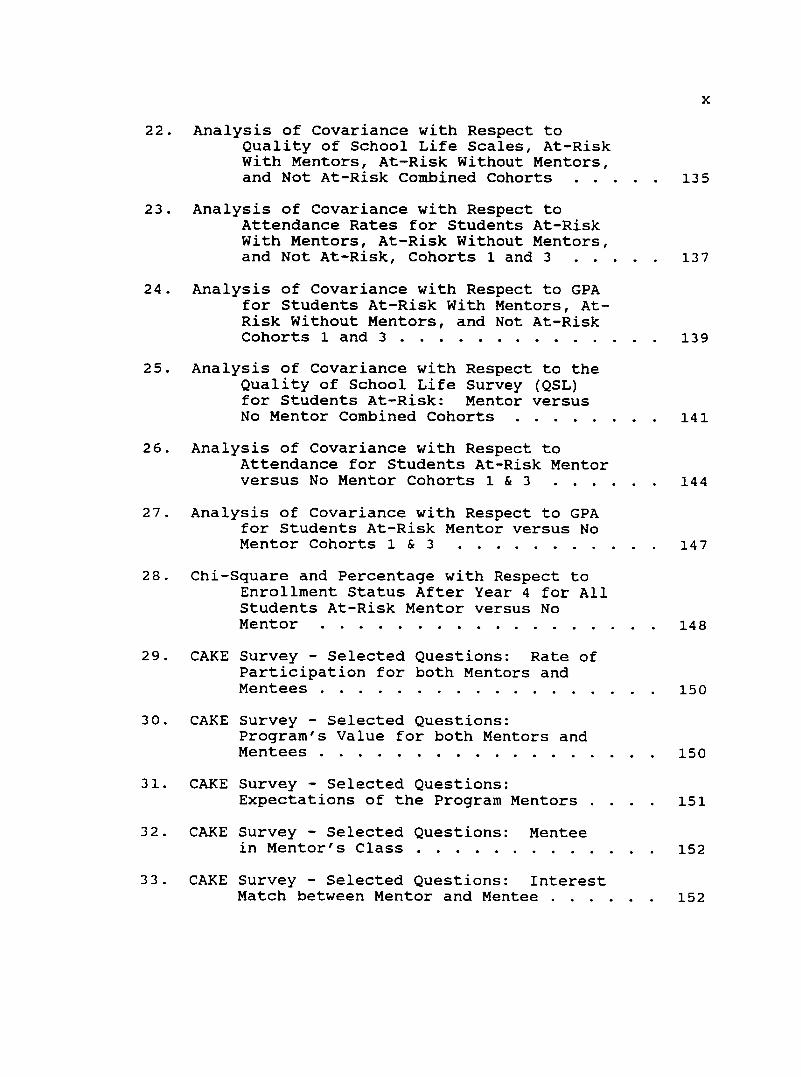
22. Analysis of Covariance with Respect to Quality of School Life Scales, At-Risk With Mentors, At-Risk Without Mentors,
x
and Not At-Risk Combined Cohorts . . . . 135
23. Analysis of Covariance with Respect to Attendance Rates for Students At-Risk With Mentors, At-Risk Without Mentors, and Not At-Risk, Cohorts 1 and 3 . . . . 137
24. Analysis of Covariance with Respect to GPA for Students At-Risk With Mentors, AtRisk Without Mentors, and Not At-Risk Cohorts 1 and 3 . . . . . . . . . 139
25. Analysis of Covariance with Respect to the Quality of School Life Survey (QSL) for Students At-Risk: Mentor versus No Mentor Combined Cohorts . . . 141
26. Analysis of covariance with Respect to Attendance for Students At-Risk Mentor versus No Mentor Cohorts 1 & 3 . . . . 144
27. Analysis of Covariance with Respect to GPA for Students At-Risk Mentor versus No Mentor Cohorts 1 & 3 . . . . 14 7
28. Chi-Square and Percentage with Respect to Enrollment Status After Year 4 for All Students At-Risk Mentor versus No Mentor
29. CAKE Survey - Selected Questions: Rate of Participation for both Mentors and Men tees . . . . . . . . . . . . . . .
30. CAKE Survey - Selected Questions: Program's Value for both Mentors and Men tees . . . . . . . . . . . . . . .
31. CAKE Survey - Selected Questions: Expectations of the Program Mentors .
32. CAKE Survey - Selected Questions: Mentee in Mentor's Class ..... .
33. CAKE Survey - Selected Questions: Interest
148
150
150
151
152
Match between Mentor and Mentee . . . . . 152
xi
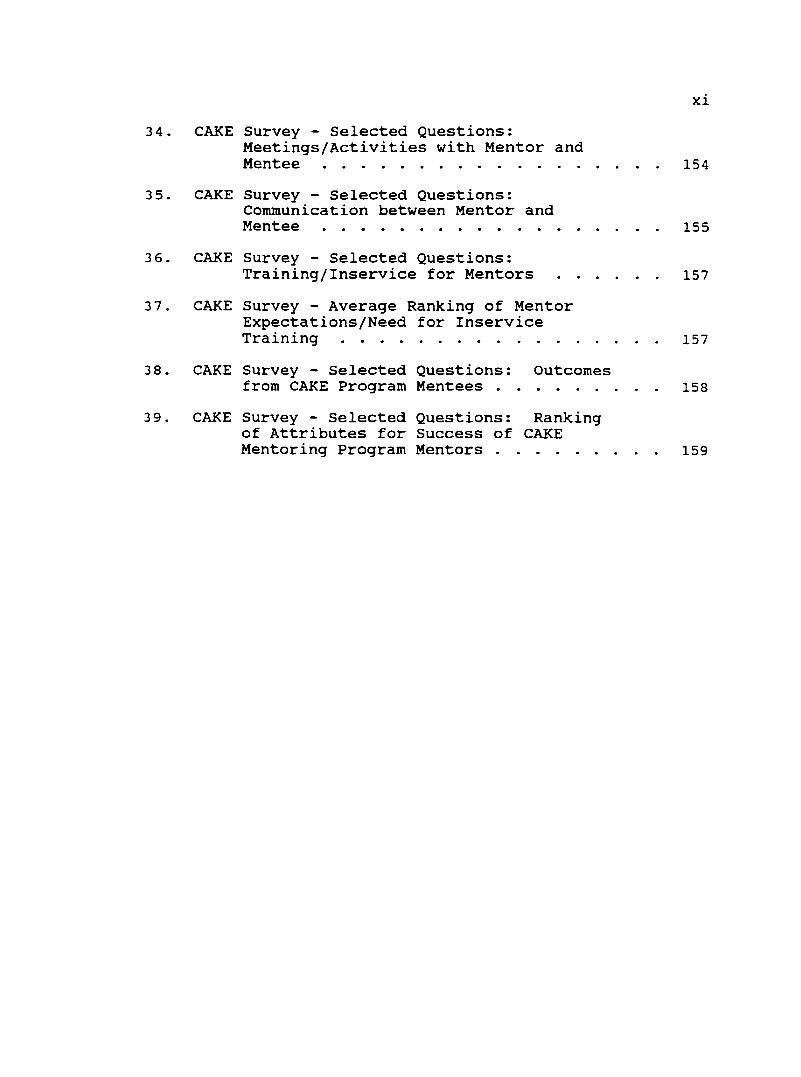
34. CAKE survey - Selected Questions: Meetings/Activities with Mentor and Mentee . . . . . . . . . . 154
35. CAKE survey - Selected Questions: Communication between Mentor and Mentee . . . . . . . . . . . . . . . . 155
36. CAKE Survey - Selected Questions: Training/Inservice for Mentors 157
37. CAKE Survey - Average Ranking of Mentor Expectations/Need for Inservice Training . . . . . . . . . . . . . 157
38. CAKE Survey - Selected Questions: Outcomes from CAKE Program Men tees . . . . . . 158
39. CAKE Survey - Selected Questions: Ranking of Attributes for Success of CAKE Mentoring Program Mentors . . . . . . 159

CHAPTER I
INTRODUCTION
statement of the Problem
Public concern for fiscal responsibility,
accountability, and student achievement has generated
questions regarding the quality of current educational
programs. Are schools educating young people to take
their place as the next generation of workers? As a
nation, approximately one in four of today's teenagers
drop out of high school. In an attempt to curtail the
dropout rate, the business and education sectors are
becoming more involved in attempts to re-engage at-risk
students in schools and in mentoring young people, thereby
bridging the gap between school and the workplace. This
mentoring process has been defined as "the linking of a
person of specific experience in a learning-oriented
relationship with a younger, less experienced person"
(Lambert & Lambert, 1982, p. 12). Around the country,
schools are already using the concept of mentoring in a
variety of forms: some are business or community
oriented, others use peer students as mentors, and a few
use school personnel.
2
The purpose of this study was to evaluate a high
school mentoring program, CAKE (Caring About Kids
Effectively), particularly related to its effects on
students identified as at risk of dropping out of school;
staff, both teachers and support personnel, were used as
mentors. This research examined the literature on student
mentorship programs and reported longitudinal data on such
indicators of school success as student achievement,
attendance, attitudes, and dropout information. In
addition, this study examined participant perceptions on
the usefulness of program activities and characteristics
that appear to be successful.
For a variety of reasons, mentoring has emerged in
schools as an intervention strategy for at-risk students.
It is also popular with the educational sector. According
to Freedman (1991), mentoring appears simple. As One-on-
One materials state, "Maybe you can't change the world,
but you can make a difference in the future of at least
one young person" (U.S. Department of Education, 1992, p.
1). In some cases, mentoring may meet the needs of public
concern for fiscal responsibility; it uses volunteers.
Mentoring is direct, as youth experience personal contact
without layers of bureaucracy. Mentoring is legitimate
and positively perceived:
It is a sanctioned role for unrelated adults to play in the lives of youth, as reflected by the
many stories that help maintain its honored place in our culture. (Freedman, 1991, p. 37)
Lastly, mentoring is flexible. Mentoring has a positive
effect on both the mentor and mentee. As Freedman (1991)
states:
At one level, mentoring speaks to the American traditions of individual achievement, progress, and optimism. It is connected to an improved work force and economic competitiveness ... At the same time, mentoring has another, more subtle allure. This aspect speaks to yearning for community lost, to a time of greater civility and responsibility for strangers. (p. 37)
3
The key question then becomes, what are the outcomes,
if any, of planned mentoring programs involving teachers
linked with at-risk students? Flaxman and Ascher (1992)
noted, "Unfortunately, we know very little about what
mentoring will accomplish, because there is very little
research on its effects" (p. 8).
The study of the CAKE program had five quantitative
research components. Indicators of school success (GPA,
attendance, and attitudes toward school) were compared
between at-risk students and those not at-risk.
Indicators of school success were analyzed over the period
of time at-risk students were mentored to find any
significant changes. Indicators of school success and
enrollment status at graduation were compared between at-
risk students, with and without mentors. And,
participants' perceptions using a researcher-constructed

4
questionnaire were given to both mentees and mentors to
determine those activities that were successful, and those
that needed to be re-evaluated.
This study provided a comprehensive evaluation of
mentoring as an intervention and thereby could provide
guidance to other schools striving to keep students in
school and functioning successfully in the educational
setting.
Background
The American public is concerned with the lack of
preparation of today's youth. According to the report by
the National Commission on Excellence in Education, our
nation is at risk because "the educational foundations of
our society are presently being eroded by a rising tide of
mediocrity that threatens our very future as a nation and
a people" (National Commission on Excellence in Education,
1983, p. 5). In response, most states have enacted
sweeping school reform measures, including school
districts in Oregon. Administrators and teachers are
attending staff development sessions on instructional
strategies and curriculum developed in establishing and
maintaining a climate conducive to academic learning and
achievement. Increases in credit hours mandated for
graduation and state-wide assessment of content areas have
5
been implemented in an effort to assure the public that
high school graduates meet the academic standards required
in a global economy. While all the good news remains in
the forefront of our policy discussions, most educational
reform ignores some of the bad news. That is, students at
risk will suffer.
According to the National Center for Education
Statistics (1996), the national dropout rate (25%) remains
unchanged for the past ten years. When comparing high
school graduates with nongraduates from the class of 1994
with the preceding year, U.S. schools had a graduation
rate of 72% (or 28% early leavers) . The dropout rate in
the urban cities jumps to 35% and in some districts
averages 50% (Schwartz, 1995). In addition, dropout rates
are much higher for Native American, Hispanic, and Black
students, ranging from 35% to 85%. The dropout rate among
Blacks is twice as high as that among Whites, although
four out of five dropouts are White. Urban students drop
out more frequently than suburban students, Hispanics more
frequently than Blacks, and males more frequently than
females (Rhodes & McMillan, 1987, p. 34).
The nation's dropout problem cuts across all ethnic,
social class and geographic lines, with poverty, race, and
the changing family structure compounding the problems
facing today's youth. Over the past decade, the

6
environment in which children grow up has changed
dramatically. According to recent estimates compiled from
the Bush Center in Child Development and Social Policy at
Yale University:
Sixty-five percent of all students now have working mothers, compared with 46% in 1976; 50% of marriages end in divorce; 15.3 million children or 25% of all children live with just one parent compared to 17% of all children in 1976; and one out of five American children lives in poverty. (Mernit, 1990, p. 35)
It would be reasonable to assume that the figures since
1990 have continued to rise as well.
Students from racial or ethnic minorities and recent
immigrants with limited proficiency in English not only
have the risks inherent in poverty, but also prejudice,
bias, and differential access to opportunity structures.
The majority of dropouts throughout the nation fall within
the average IQ range; therefore, they have the ability to
complete a high school education. However, students with
low-average ability face an even tougher challenge. The
most depressing figures are those 25% of the country's
most intelligent students (IQ above 110) who drop out
prior to graduation.
It is estimated that between 18 and 25% of gifted and talented students drop out. This number may appear to be insignificant when one considers that the gifted population probably represents no more than 10% of the entire student body; however in the eyes of many, this group represents a major loss of potential to self and society. (Robertson, 1991, p. 62)
Add to this the problem of dysfunctional families, a
greater influx of non English-speaking refugees, drug
affected and abused children entering the school system,
and increasingly fewer resources for the educational
sector to rely upon in dealing with these pressures.
These factors will ultimately have additional and
potentially catastrophic effects on the nation's dropout
problem.
Although Oregon's dropout rates have traditionally
mirrored the national rate, in recent years this rate has
jumped from 5.7% in 1991-92 to 7.2% in the 1995-96 school
year. As reported in the yearly publication of Oregon's
dropout rates by Oregon's Department of Education (1997),
the four-year dropout rate for the class of 1996 in
Oregon's schools is 26.6%; it was 25% in 1983. Even more
staggering are the reports from the National Center for
Education Statistics (1995) of the large increase in
dropouts at the 8th grade level. In 1990, 7% of the 8th
grade class of 1988 were dropouts; they were not enrolled
in school and had not finished high school. In 1992, 12%
were dropouts. Additional findings in Oregon include a
dropout rate for Hispanic students that is more than
double the overall statewide rate, males had a slightly
higher dropout rate than females, and one-third of
7
8
dropouts were enrolled in the school district one year or
less.
Compounding the problem, taxpayers in Oregon have
passed several property tax-cutting measures that have and
will continue to reduce the amount of money available to
educate students. As stated in an article on educational
funding in the Oregonian,
Since Measure 5 passed in 1990, the money available for public schools in Oregon has declined about 15% per student when adjusted for inflation. (Carter & Herzog, 1997, p. Al)
The average revenue from all sources per student in 1991
was $4,033 versus $3,439 in 1997. There is little dispute
that schools face public pressure to improve the skills
that graduates possess, but at the same time must expand
services to at-risk students that are both cost-effective
and reduce the number of dropouts.
The costs of dropouts are staggering when one
considers that 70% of the nation's prison inmates never
completed high school. A recent survey of Oregon's inmate
population revealed that 71% were high school dropouts
(Jones, 1997). The cost in Oregon to incarcerate an
inmate is $53.73 per day versus $6.00 a day per student to
operate a dropout prevention program in terms of an
alternative school-within-a-school. This figure
approaches $20,000.00 per year per inmate in Oregon's

9
prisons. That figure is very close to the salary of one
beginning school teacher for one year!
This figure is even more staggering, considering the
cost estimates projected by Levin (1972) at $71 billion
lost tax revenue from high school dropouts aged 25 to 34,
welfare and unemployment costs of $3 billion, and crime
and crime prevention costs of $3 billion. These numbers
continue to grow. In 1985-86, more than 600,000 young
people dropped out of school, at a projected cost to
society of $120 billion in lost productivity during their
lifetimes. The U.S. General Accounting Office in 1986
estimated that the disparity between earnings for
graduates and dropouts increases every year. For example,
in 1966 the difference was 12%; in 1978 the difference was
24% (Catterall, 1987). Today, according to Schwartz
(1995), the differences between dropouts and high school
graduates continues to be evident:
• In the last 20 years the earnings level of dropouts doubled, while it nearly tripled for college graduates.
• Recent dropouts will earn $200,000 less than high school graduates, and over $800,000 less than college graduates, in their lives.
• Dropouts make up nearly half the heads of households on welfare.
• Dropouts make up nearly half the prison population. (p. 4)

10
These costs should also be measured in terms of potential
cognitive development and productivity of its citizens,
particularly in our complex and changing technological
society. At a time when declining birthrates might
indicate a smaller pool of potential employees, the
nation's economic growth demands higher numbers of entry-
level employees. Business leaders are increasingly
worried about this ill-prepared pool of workers and will
have to rely on these workers if the current trend
continues (Education Commission of the States Business
Advisory Commission, 1985, p. 17).
The era of school dropouts securing jobs requiring
little or no skill is past.
The gap between dropouts and more educated people is widening as opportunities increase for higher skilled workers and all but disappears for the less skilled. (Schwartz, 1995, p. 4)
It is estimated that, by the year 2010, the growth of the
knowledge economy will reduce the need for low-skilled
jobs in agriculture and industry to only 2% of the
workforce. In addition, "between 1994 and 2005, job
openings will average 1,040,000 annually, while college
graduates joining the labor force are expected to average
1,340,000 each year" (Slater, 1997, p. 7). Assuming this
statistical forecast is correct, it is apparent that an
unskilled worker will have an extremely difficult time
competing for jobs.
11
Since many of these dropouts come from families who
also have had limited educations and higher rates of
unemployment, the failure of schools and society to keep
these students in school contributes to the continuation
of this cycle of poverty. Other social costs related to
unfinished high school educations include the likelihood
of dropouts becoming involved in delinquent and criminal
activities. This then leads to the higher utilization of
services such as welfare, unemployment compensation, and
other social services that have higher costs than most
dropout prevention programs (Green & Baker, 1986, p. 3).
The growing concern over the state of education in
the nation, resulting in the National Commission on
Excellence in Education's 1983 report, A Nation at Risk:
The Imperative for Educational Reform, spawned a
nationwide movement to reform our educational system to
foster excellence. Oregon's answer was the development of
the Certificate of Initial Mastery (CIM) , Certificate of
Advanced Master (CAM) , and additional requirements for
graduates. This will divert funds from alternatives to
supporting these new programs. Not only does the current
excellence movement divert much needed attention from the
dropout problem, it may actually contribute to its
increase. A recent report by the Education Commission of
the States (1985) noted that

As emphasis on higher academic achievement rises, low achievers are likely to throw in the towel ... Unless schools take special measures to keep "on the edge" students from going over the edge we can expect dropout rates to rise. {p. 3}
12
This is not likely to change. An open debate continues as
to the effects of balancing equity and funding. The cost
here is the issue of equity. This excellence movement may
have discriminatory effects on the education of at-risk
children, many of whom are minority children.
There is another economic reason that the rising
dropout rate deserves considerable attention: increased
controversy over the sources of school revenues and
declining school enrollments which in turn causes declines
in school revenues. Most school districts around Oregon
have alternative programs in place to combat the dropout
problem. These programs are now in jeopardy, with the
passing of such tax-limiting measures as Ballot Measure 5
and Ballot Measure 47 from 1990 to 1996 in Oregon.
Millions of dollars are being cut from school districts'
budgets. Programs with low student/teacher ratios are cut
first. These will include alternative programs, electives
with low student numbers, and other elective, creative,
but more costly programs. The students who will suffer
the most are the at-risk students. Now, not only are the
standards for receiving a high school diploma higher and
more difficult to obtain with State testing requirements

13
and the CIM/CAM programs, but the programs that help keep
our at-risk students in school could increasingly
disappear. Not only for the sake of the nation's future,
but for the immediate future of individual schools,
administrators and school boards must meet the demands of
the at-risk population of students (Wehlage, 1983, pp.
16-17).
We no longer can afford the economic drain of disposable people. The youth whom we are casting aside today are part of a small generation who will have to support a large cohort of retired citizens as the twenty-first century unfolds. (Brendtro, Brodcenleg, & Van Bockern, 1990, p. 3)
Rationale
A great deal of literature surrounds the
characteristics of students at risk of dropping out of
school. There exists a multitude of factors outside of
school that put students at risk; add to that the
interaction of those students with certain school
experiences and the results are often discouragement and
withdrawal. Educators can do little to influence or fix
environmental factors placing students at risk, but they
can take active roles in responding to fundamental needs
unmet by contemporary schools. Current research
literature suggests that potential dropouts share common
characteristics. Among these, students perceive school as
14
a hostile place where they continue to experience failure
and frustration (Rhodes & McMillan, 1987). Another is the
inability to develop positive relationships with teachers,
adults, and even peers who are seen as an authority figure
(Pallas, 1986).
One need shared by most students is a sense of school
membership and having adult role models who encourage,
advise, and care. Although teenagers turn to peers for
advice on current styles or trends, when there are
questions of important life crises or future options, they
look to adults for answers (Ianni, 1989). Due to the
changing nature of traditional sources of support in the
family unit for adolescents, it has become increasingly
important for the non-related adult to facilitate the
healthy development of our youth (Schonert-Reichl, 1992).
Positive teacher-student relationships have been widely
documented as having a direct and beneficial influence on
student achievement in school. This could be one area for
solutions to the dropout problem (Cuban, 1989; Rhodes &
McMillan, 1987).
Researchers have found that school dropouts often
cite, as one of the primary reasons for leaving, the
absence of one person who cared about them. The
assumption that all adolescents need support or advice
from adults does not address the fact that the more at-
15
risk adolescent does not know how to ask for help. The
literature suggests that our schools and communities need
to make it easy for adolescents to seek help and even
advertise that adult resources are available (Ianni,
1989). That being the case, help does not always reach
the target groups.
Research, such as Werner and Smith's (1982)
longitudinal research of 700 youth growing up in high risk
environments, found that an adult relationship (i.e.,
mentoring) provided a protective factor for youth in
stressful family conditions. One caring adult can make a
big difference in a young person's life (Smink, 1990).
Augmenting these long-term examinations of the effects of
a mentoring relationship are many biographies and case
studies of successful individuals that affirm the pivotal
role supportive adults played in the success of youths'
lives that they mentored. For example, Bernard
Lefkowitz's (1989) book, Tough Change: Growing Up on Your
Own in America, is based on interviews with 500
disadvantaged youth, a majority of whom credit their
success to the mentoring and support of a caring adult in
their lives. The positive effect on gifted students of a
mentoring relationship has also been well established in
the review of the literature (Kaufman, Harrel, Milam,
Woolverton, & Miller, 1986; Levinson, 1978).

16
The Education Commission of the States (1985) has
listed mentoring as one of the five short-term imperatives
for reversing the high dropout rate among high school
students. Flaxman, Ascher, and Harrington (1988)
concluded, in their study involving disadvantaged youth,
that mentoring is a powerful way to provide adult contacts
for youth who are isolated from adults at home, in
schools, and in their communities.
The self-perceived needs of at-risk students include
having teachers who are supportive and caring, getting
good grades, being a part of the school, and having
positive communication on the options available to them
(Applegate, 1981; Beardon, Spencer, & Moracco, 1989; Mahan
& Johnson, 1983). Many of these perceived needs can be
addressed in a mentor program, especially where teachers
mentor at-risk students. While the literature on
mentoring has grown significantly in the last seven years,
most program evaluation research which links the success
of at-risk youth with having a caring adult relationship
created through a planned mentoring program exists
primarily as descriptive rather than experimental.
Research on mentoring using experimental designs is
scarce. Examples of program research using experimental
designs include Cave and Quint's (1990) evaluation of
"Career Beginnings," McPartland and Nettles' (1991) study

of "Project Raise," Ferguson's (1990) study of programs
for African American males, and Higgins' (1991) study of
the "I Have A Dream" program.
17
There is a lack of clear evidence on the effects of a
teacher mentoring relationship on the low-achieving,
potential high school dropouts. Results of studies have
reported effects of using teachers as mentors. Abcug's
(1991) evaluation of TASK found positive effects on
attendance, achievement, discipline, and attitudes toward
school on at-risk students when using teachers as mentors
over a year's time. Studies and articles on staff
mentoring programs in individual secondary schools
nationwide are also reporting positive effects on the
attendance, achievement, attitudes, and environment of the
school.
For this reason, a mentor program was developed and
implemented to assist in reducing the dropout rate of
students identified as at-risk of dropping out prior to
entering the 9th grade in a selected suburban secondary
school. The program, CAKE (Caring About Kids
Effectively), had as its primary function to establish
relationships between teachers and support staff (as
mentors) and students identified as at-risk. These staff
mentors were to provide support and guidance to at-risk
students by placing a great deal of emphasis on
interpersonal relationships, problem solving techniques,
and communication skills, and by encouraging positive
behavior, study habits, and attendance.
Each one of these at-risk 9th grade students need one staff member, a counselor, or teacher, to guide him through his high school career ... and this person should get to know the student well. (Wiles, 1963, p. 165)
18
An evaluation of this staff mentoring program for at-risk
students will add to the needed longitudinal studies
already in existence.
Purpose of the Study
The purpose of this study was to examine the effects
of a mentoring program, CAKE, matching at-risk students
with staff from a secondary suburban high school. Data
from attendance and GPA records, along with a School Life
Survey which measures attitude towards school and a
program survey, were analyzed in the investigation of the
following questions:
1. Are there significant differences on the
subscales and total scale of the Quality of
School Life Scales (QSL), attendance rates, and
GPA between students identified as at-risk and
students not at risk?
2. Are there significant differences on the
subscales and total scale of the Quality of

19
School Life Scales (QSL), attendance rates, and
GPA between students identified as at risk with
mentors, at-risk without mentors, and not at
risk?
3. Are there significant differences in attitudes
as measured by the QSL between at-risk students
with mentors and at-risk students without
mentors?
4. Are there significant differences regarding
attendance rates and GPA for at-risk students
with mentors and at-risk students without
mentors?
5. Are there significant differences in the
enrollment status for the at-risk students with
mentors and the at-risk students without
mentors?
6. What are the participants' perceptions of the
effectiveness and characteristics concerning the
CAKE program?
Definition of Terms
A number of terms used in this study require
specialized definitions. These appear below:
At-risk. In this study the term is used to denote
students at risk of failure to complete an appropriate

20
academic program. This term became known with the
publication of A Nation At Risk (National Commission on
Excellence in Education, 1983). Students become at-risk
for a variety of reasons: economic, intellectual,
physical, psychological, sociological, and racial biases.
For the purposes of this study, students having three or
more characteristics of the following behavior:
1. Attendance problems
2. Low performance and achievement, subject and
grade failure, many times one or two grades
below level
3. Comes from a lower socioeconomic background
4. Negative attitude about school
5. Low self-esteem
6. Family history of school failure
Attendance. This term refers to the total number of
days a student attended school out of a possible 180 days
offered. Data were gathered through records supplied by
the attendance secretaries at both the middle and high
schools.
CAKE (Caring About Kids Effectively>. This term
refers to a staff mentoring program for students at a
secondary high school in Oregon who were identified as at
risk of dropping school prior to completion.

Cohort. This term describes a single group of
students who began the mentor program during a specific
time period.
Dropout. This term is sometimes used in the
literature and school district policies to describe
students who leave school (early leavers) for any reason
except death before completing an educational program.
21
Enrollment status. This term refers to the student's
status at the end of four years at the high school. For
purposes of this study, enrollment status is identified as
graduated, transferred, GED, dropped out, or returning (to
school for a fifth year) .
GED. This term refers to a General Equivalency Exam,
a test given to students as an alternative way to earn a
high school equivalency degree (General Education
Diploma).
GPA. This term refers to a grade point average,
whereby the letter "A" = 4.0 points, "B" = 3.0 points, "C"
= 2.0 points, "D" = 1.0 points, and "F" = 0.0 points.
Mentee. This term refers to one who feels his or her
personal or professional growth was or is fostered by
another (Krupp, 1985). In this study, a "mentee" or
"protege" was the student at risk of dropping out of
school who had a staff employee of the high school as a
mentor.

Mentor. According to the Thesaurus of ERIC
Descriptors (1990), "mentor" refers to the
trusted and experienced supervisors or advisors who have personal and direct interest in the development and/or education of younger or less experienced individuals, usually in professional education or professional occupations. (p. 161)
In this study, the "mentor" was a certified teacher
or other support staff person currently employed at the
high school who agreed to serve in the role of mentor.
22
Mentoring. This term refers to a process by which a
trusted and experienced supervisor or advisor takes a
personal or direct interest in the development and
education of a younger or less experienced individual
(Thesaurus of ERIC Descriptors, 1990). In this study,
"mentoring" is a highly complex people-related skill,
involving a one-on-one relationship between a caring adult
and a student who needs support to achieve academic,
career, social, or personal goals.
Mentorship. This term refers to a cooperative
arrangement between two people that exists to share the
practical experiences, knowledge, and expertise on the
part of the mentor that are designed to enhance the
professional or personal growth of the protege. In this
study, the "mentorship" was the formal match-up of an at-
risk high school student and a staff member from the same
high school as part of the CAKE mentoring program.

Treatment. This term refers to the assignment of a
staff mentor to a student identified as at risk of
dropping out of school.
Limitations
23
One must be cognizant of limitations inherent in the
design of any study. Therefore, concerns or limitations
as seen by this researcher at the outset of this study are
seen as means to caution readers in advance as to areas
which may be flawed. However, it may be noted that every
avenue or record available to the researcher was
investigated thoroughly for this research. Responsibility
for limitations inherent in any process reliant on
accurate record keeping is non-specific and diffuse.
Threats to internal validity in research involving
at-risk students are evident in this study. The threat to
validity in terms of mortality is evident in the data set.
Missing elements and incomplete data on some students are
due to either subjects leaving the district prior to all
testing being completed, or records nonexistent for GPA
and attendance for some students prior to the 9th grade.
GPA data in this school district were not kept in a print
out form for students prior to 1988 in the 8th grade.
Thus, the Pretreatment data for Cohort 2 was extracted
from 9th grade records for Questions 1 through 4. This

24
researcher was able to extract 8th grade attendance data
for Cohort 2 from individual cumulative files, in order to
compare the cohorts as being equivalent prior to analysis
for Questions 1 through 4. Half of the 130 students
identified for the study in Cohort 1 left school during
the first five months of the first year. Inherent in the
study of at-risk students is the mobility of this group,
particularly those without mentors.
Threats to instrumentation are also apparent in the
study. The researcher had no control over students
actually identified to be mentored. Criteria for
selection of at-risk students were given to 8th grade
counselors, described in Chapter III. These lists were
given to the 9th grade counselors to match with mentors.
Both the number and severity of factors that contributed
to the "at-riskness" of that student makes generalizing
the data difficult.
Due to ethical and practical constraints, the random
selection for experimental and control groups was not
used. Mentees were selected by either the 9th grade
counselor due to severity of at-risk characteristics or at
the request of the staff member due to similar interests.
It was difficult to assure the at-risk students'
composition of the control group, those without mentors,

actually shared the same characteristics as students who
were "chosen" as mentees.
25
The difference in sample size between those students
with mentors and without creates problems for any
explanation of significant differences. The researcher
had no control over the mentors transferring or retiring
during the study. This made sample sizes and
demonstrating causal relations difficult to demonstrate.
The experimental treatment was not tightly
prescribed. The researcher had no control over the level
of participation mentors had with their mentees. Evidence
of the disparity in activities and levels of involvement
are evident in Chapter IV's review of Question 5. The
researcher was dependent on teachers to administer the
attitude survey. Communication was given as to the
importance of this kind of data in evaluating any program,
but as evidenced in the sample sizes, some chose not to
participate.
Maturation could be a minor threat to validity in
this study. The fact that Cohort 2 is comprised of
students one year older than Cohorts 1 and 3 is a factor.
The researcher used pretreatment analysis and analysis of
covariance to lessen the effects of maturity due to this.
The researcher and reader must also be aware that the
Hawthorne effect and regression towards the mean may also

26
threaten any demonstration of causality between those
students with mentors and those without. Student
knowledge that the program existed may have caused the
positive effect on at-risk students with mentors. It is
evident that regression toward the mean is a factor for
the data on at-risk students followed over the four-year
period of time. It is apparent to this researcher that
changes in attitude, grades, attendance, or enrollment
status were not necessarily due to the presence of an
adult mentor. A variety of environmental factors, such as
a change in family conditions, maturity, and environment,
could have also accounted for some of the changes in
behavior.
This researcher was aware of the numerous threats to
validity and limitations inherent in studying at-risk
students. The importance of the subject overshadowed
these difficulties. The plight of at-risk students is
very real. Just because pristine research cannot easily
be conducted with the group does not mean it should not be
done at all. This researcher is left with a strong belief
that the threats to validity illustrate how resistant to
change at-risk students find themselves to be. The
researcher believes that, by continuing to examine
research, results with clear implications for practice
will be found.
CHAPTER II
REVIEW OF THE LITERATURE
The review of the literature is presented in four
sections: (a) a review of educational reform in general
and its relationship to students at risk, (b) the
characteristics of at-risk students, (c} programs for
at-risk students, and (d} mentoring.
Educational Reform
This section of the review of literature will focus
on the national educational reform reports and studies
which have had an impact on state and ultimately district
level decisions regarding at-risk students.
Of all the educational reports calling for reform in
the 1980s, the 1983 report from the National Commission on
Excellence in Education, entitled A Nation at Risk: The
Imperative for Educational Reform, was the first major
report to give impetus to the need for drastic educational
reform. This report offered little to those students
at-risk. Among other things, the report recommended
increasing the number of required academic courses in high
schools, student discipline codes that would make more
efficient use of class time, more rigorous textbooks,

longer school days and years, grouping and promotion of
students according to progress rather than chronological
age, and incentives for teachers.
28
In analyzing the movement for school reform and its
implications for potential dropouts, the recommendations
seem directed largely at the upper third of the student
body, with scant concern for the student at-risk, and fall
in three broad areas: course content, use of time for
instruction and learning, and student achievement.
Recommendations by the National Commission on Excellence
in Education (1983) included more demanding sequences of
basic courses such as science and mathematics and
elimination of the soft, nonessential courses. Better use
of time in class and longer school days were recommended,
along with more time spent on homework, the initiation of
rigorous grade promotion policies by which students will
be promoted only when it is academically justified, and
the use of standardized tests to monitor student
achievement. These recommendations are all based on the
assumption that there will be no negative consequences
associated with more demanding standards. They fail to
consider the student in the most fragile position and in
the greatest need - the potential dropout.
A paper, presented at the National Invitational
Conference on Holding Power and Dropouts by professors of

29
Education at Columbia University, summarized the effect of
raising standards on the potential dropouts' chances of
finishing high school.
The main reasons students dropout of school are poor grades and family and money problems. Raising standards for time spent in school, content of the curriculum, and amount of homework may further compound students' problems and cause even more of them to drop out. (Nafriello, McDill, & Pallas, 1985, p. 11)
When the curriculum is narrowed from a fairly broad
choice of classes to a more academic focus, students with
limited ability (typically displayed by potential
dropouts) have to face repeated failure. A more flexible
curriculum that includes the "not-so-basic" courses allows
those students some sense of success and perhaps a
positive environment, rather than a negative one.
Duke (1985), in his article "What is Excellence and
Should We Try to Measure It?" said:
It could be argued that higher standards for passing courses and meeting graduation requirements provide necessary incentives. But practical experience tells us that this prescription will not work for all students, particularly the reluctant learners. (p. 673)
Analysts have concluded that student attitudes play a
major role in determining performance. Students are found
to perform close to their own estimates of their ability.
If you want to increase achievements in math and science. you should look ... into how you can increase a kid's interest in becoming an engineer, for example. (Duke, 1985, p. 673)

30
Motivation is also the key to encouraging students to
spend additional time on school tasks, namely homework.
Longer school days and years may add little to real
learning time. Such demands, particularly for the
potential dropout, may be problematic; these students are
more likely than other students to have assumed adult
responsibilities related to families and jobs.
Furthermore, increasing time spent on school work may
prevent participation in extracurricular activities, thus
denying those students who need a tie to the school other
than just their classroom work. These extracurricular
activities provide an attachment to school and provide an
avenue of success. Increasing time demands on the
potential dropout is easily resolved by leaving school.
Because of such time constraints placed on the potential
dropout, flexible time options should be provided these
students (McDill et al., 1987, p. 189).
It is clear that, if academic standards are raised
and students are not provided substantial remediation
within the limited time they can devote to classroom work,
socially and academically disadvantaged students will be
more likely to experience frustration and dropout of
school. Duke (1985) forecasted this danger in the
excellence movement (or standards movement) of the 1990s,
as measured by standardized tests, as too much stress
31
being placed on "one best way" and the single "right way"
or "right answer".
We must ask whether an overemphasis on conformity during the formative years exacts too great a price in human development and creativity. (p. 673)
Fortunately, about the same time as the
aforementioned reports came out, more useful suggestions
were offered in studies by Goodlad (1983) and Boyer (1983)
for students at risk of dropping out of school.
Boyer's (1983) book, High School: A Report on
Secondary Education in America, followed the National
Commission on Excellence in Education Report (1983) by
only five months. Moreover, "High School is one of the
longest and probably the most comprehensive of the reform
studies" (Presseisen, 1985, p. 67). Boyer's book was
based on a two-year research project of 15 schools and
funded by the Carnegie Foundation for the Advancement of
Teaching. He recommends strong studies in the arts,
health, technology, and introductory vocational education,
as well as the usual academic areas. Students would take
a core curriculum one-third of the time in school, with
the remaining for electives to meet individual needs and
interests. Pertaining to students at-risk, Boyer advised
close relationships between students and counselors or
teachers who are trusted by students. He suggested also
identifying failure patterns as early as possible and

32
providing alternative programs for those students who need
it. These programs should set reasonably high standards
while passing a feeling of belonging to their students.
A Place Called School: Prospects for the Future by
Goodlad (1983) was the culmination of an eight year
examination of 38 schools, 17,163 students, 1,350
teachers, and 8,624 parents; it sounded the alarm for
at-risk students. He was especially concerned about the
large
group of students who do not grow up in academically oriented households, or who experience cumulative difficulties with school-based learning, or who are not turned on by academics, or simply cannot or do not wish to defer employment. (p. 91)
According to Goodlad,
there is evidence to suggest payoff for these students from intervantion programs that comprehensively include a more careful sequencing of the curriculum, more frequent use of motivational devices and alternative approaches to learning. {p. 91)
He mentioned concern about the passiveness in students and
the rather traditional style of teaching. He recommended
a balanced academic curriculum, and insists that if one
instructional method does not work with a student, others
should be tried. He advised teachers to humanize the
learning and knowledge to make learning less abstract. He
recommended avoiding inflexible schedules and ability
tracking, in favor of non-graded, continuous progress

33
reporting that accepts individual differences and supports
differentiated development. All of these recommendations
are extremely important to the student at-risk.
Sizer (1984), in his book, Horace's Compromise: The
Dilemma of the American High School, observed that:
Far too few modern American adolescents are hungry ... that the American high school student, as student, is all to often docile, compliant, and without initiative. Some who have initiative use it to undertake as little engagement as possible with school. They await their education and take in such of it that interests them. Such students like to be entertained. Their harshest epithet for a teacher is "boring" ... There are too few rewards for the inquisitive; there rarely is extra credit for the ingenious proof. The constructive skeptic can be unsettling to all too many teachers, who may find him cheeky and disruptive. Questing can be costly. (pp. 54-55)
This passage fits the profile of many at-risk
students who do not exhibit an initiative to achieve in
school. He called for the personalization of the
educational process to help promote a student's
self-esteem.
Personalization absolutely implies options for students, different ways and setting for differing individuals. While total personalization is practically impossible, much is clearly attainable within the kinds of constraints usually found in many high schools. The biggest hurdle will be adult attitudes, particularly those that confuse standardization with standards ... Every adult likes to be respected and enjoys being given responsibility ... Adolescents are no different from us in this respect. Therefore, set them a clear goal, give them some sensible

guidance .. and put the burden of learning on them. (p. 67)
34
Following the release of our Nation at Risk (National
commission on Excellence in Education, 1983), several
national reports that addressed the problem of students
at-risk of dropping out of school, and specifically the
issue of excellence and of equity, were published. In
1986, the National Coalition of Advocates for Students
published the results of a year long study, Barriers to
Excellence: Our Children at Risk. The report addressed
specific barriers to educational excellence for all
students, such as inflexible structures, abuses of
tracking, and misuses of testing. During the testimony of
students, dropouts, teachers and others in preparation for
this report, the Board of Inquiry found that education for
students at-risk was lacking and in even greater jeopardy
in light of the reform movements' higher standards (Green
& Baker, 1986; National Coalition of Advocates for
Students, 1986).
Also in 1985, the Charles Stewart Mott Foundation
issued its report, Who's Looking Out for At-Risk Youth
(MDC, 1985). This report was the result of surveys given
to various excellence commissions in 32 states. The
survey found that only 27% of the respondents had even one
recommendation targeted at a group of at-risk youth.

35
Yet another report in 1985, With Consequences for
All. A Report from the ASCD Task Force on Increased High
School Graduation Requirements, issued by the Association
of Supervision and Curriculum Development (ASCD) ,
concluded that many at-risk students may drop out of
school earlier and send the dropout rates even higher
(cited in Green & Baker, 1986, p. 7). The report by the
Education Commission of the States, Business Advisory
Commission (1985), Reconnecting Youth: The Next Stage of
Reform, felt the need to address our alienated youth
at-risk of being lost as productive citizens. Their
report suggested ways in which the business community
could work with the schools to help at-risk students learn
more about the world of work and become responsible
citizens.
In the 1990s, educational reforms focused on the use
of time for instruction in an attempt to help more
students reach the higher standards set forth in the
1980s. Strategies such as longer school days, block
scheduling, more testing and reporting, higher standards,
and better assessment practices tended to ignore the
improvement needed in the teaching and learning process.
The Secretary's Commission on Achieving Necessary
Skills (SCANS) report (U.S. Department of Labor, 1992)
required a range not only of basic skills but also of

36
personal qualities, including working in groups and
thinking skills. According to this report, these skills
are not taught well through conventional instructional
practice with its emphasis on individualized rather than
cooperative learning, abstract principles and
decontextualized context, and fact acquisition rather than
problem-solving. Thus, the SCANS report called for
changing instruction and set the stage for further
research on teaching and learning.
Students who dropped out of high school most
frequently cited irrelevant course work and teaching
techniques that did not match their learning styles, along
with the impersonal educational system, as the major
causes for leaving school.
One of these reform efforts focused on school
programs related to real world experiences, or contextual
teaching. In 1985, Dale Parnell wrote The Neglected
Majority, which incorporated more applied academics into
the classroom and has grown into a comprehensive
nationwide program coupled with the national school-to-
careers movement. Jobs for the Future (1996) has defined
School-to-Careers:
To help young people make more successful transitions from school to careers and further learning, educators and employers have come together in states and communities around the nation to create stronger linkages between their two worlds. (p. 4)

The goals of the school-to-careers movement were to
provide better education, stronger employment prospects,
positive adult role models, and multiple post-secondary
options for all students. School-to-careers experiences
were designed to develop young people's competence,
confidence, and connections that could ensure successful
citizenship (Jobs for the Future, 1996).
An element of brain-based teaching and learning,
espoused by Eric Jensen (1994) in The Learning Brain,
focused on ways to assist students to make learning
connections and to change instruction to match learning
styles. This connections theme was evident in much of
Boyer's (1995) research on teaching and learning. "The
Education Person" described school problems as youth
problems.
Far too many teenagers feel unwanted, unneeded, or unconnected. Without guidance and direction, they soon lose their sense of purpose, even their sense of wanting purpose. Great teachers allow their lives to express their values. They are matchless guides as they give the gift of opening truths about themselves to their students. I often think of three or four teachers out of the many I have worked with who changed my life. What made them truly great? They were well informed. They could relate their knowledge to students. They created an active, not passive climate for learning. More than that, they were creative human beings who taught their subjects and were open enough to teach about themselves. (p. 24)
Contextual teaching, combined with "Integrated Thematic
Instruction" (Kovalik & Olsen, 1994, p. 2), provides
37

38
meaningful content and combines two or more subjects. It
offers content that excites the interest of the students
and the teachers, and is useful to students, thus creating
an emotional bridge between the teachers and the learners.
Interdisciplinary instruction offers students
(particularly at-risk students) learning opportunities at
different developmental levels and varying abilities and
encourages differentiated learning activities and forms of
assessment (Association of Supervision and Curriculum
Development, 1992, p. 1).
Deborah Meier (1995), in The Power of Their Ideas,
described the efficient learning environment as based "on
the fact that we learn best when our natural drive to make
sense of things is allowed to flourish" (p. 152). Meier
said that human bonds or connections developed between
peers and teachers are essential to the learning
environment. "We organize schools as though the ideal was
an institution impervious to human touch" (p. 154).
Herein lies the explanation of students listing
"impersonal schools" or "a lack of someone who cares" as
reasons for dropping out of school. Among other
conditions, Meier believed that Excellent Schools were
small schools that encourage human connections between
students and teachers, and build in "lots of time for

39
building relationships and reflecting on what's happening"
(p. 184).
current research involved in the study of resilient
children stressed the importance of children being
connected to a network of friends, teachers, or other
adults during adolescence. This research demonstrated
that "resilient kids have an uncanny ability to make
school a refuge from society's ills, (and that they need
to be able to) turn to people they have grown to trust"
(Bushweller, 1995, p. 18). Wolin and Wolin (1993) found
that resilient children spent extra time at school, often
to escape trouble at home, and developed more meaningful
relationships with adults at school than they would ever
develop with their parents.
Resiliency studies, some of which have followed
children into adulthood, revealed some of the same
findings. According to Werner and Smith (1992), authors
of an extensive resiliency study conducted over 40 years,
found connections and increased bonding between the
individual and a trusted adult to be the key to building
resiliency.
In fact, it seems almost impossible to successfully overcome adversity without the presence of a trusting relationship, even with a single adult, that says "you matter." (Henderson, 1996, p. 14)

40
This newest body of educational research and
restructuring paradigms incorporated the elements of not
only sustaining the not at-risk student in school, but has
helped to bridge the gap between educational practices and
reasons cited by at-risk students for dropping out of
school prior to graduation.
Characteristics of At-Risk Students
Much has been written about dropout rates and the
characteristics of students who leave school. The general
profile found in the literature describing the student at
risk of dropping out of school contains many, if not most,
of the characteristics listed below:
1. Dislikes school, including the teachers and
the school environment
2. Have few teachers as friends
3. Poor attendance
4. Low performance and achievement, subject
and grade failure, many times one to two
grade below level
5. History of school failure
6. Likelihood that his total family, including
parents, brother(s) and sister(s) are all
dropouts
7. Comes from a lower socioeconomic background

8. Parents apathetic and negative about school
-- does not see any value in education
9. Social contacts are with others like
himself, includes family and friends
10. Feelings of alienation
11. Low self-esteem
12. Customs, values, and attitudes dissimilar
to those of the urban middle class
13. Many come from a large impoverished
household and headed by a female
14. Family background does not provide a positive
self-image
In addition, in the urban areas, the following
characteristics are prevalent:
1. Concentrated in slum areas
2. Many are unemployed and unemployable
3. Role models of success are frequently
ghetto pimps, hustlers, drug pushers, or
those involved in other criminal or illegal
activities
4. Alienation because of deprivation and what
they perceive as social inequities,
injustice and neglect
41

42
(Compiled from the writings of: Beck & Muia, 1980;
Glasser 1969; Hahn, Danzberger, & Lefkowitz, 1987; Martin,
1980; Pallas, 1986; Wehlage & Rutter, 1986)
The Phi Delta Kappa Study of Students at Risk lists
among the characteristics of dropping out of school, the
following ten top indicators:
1. Attempted suicide in the past year
2. Used drugs or engaged in substance abuse
3. Has been a "drug pusher" during the past year
4. Student's sense of self-esteem is negative
5. Was involved in pregnancy in the past year
6. Was expelled from school during the past year
7. Consumes alcohol regularly
8. Was arrested for illegal activity
9. Parents have negative attitude towards education
10. Has several brothers or sisters who dropped out. (Frymier & Gansneder, 1989, p. 142)
The research that centers around the question as to
why students drop out of high school is not only
extensive, but dates back to a National Education
Association meeting in 1872, where a paper was presented
on the causes and remedies of early withdrawal of students

43
(Harris, 1973). Most dropout literature was published in
the 1960s due to extensive grants offered by state and
federal agencies to study the problem. During this time,
one of the most extensive studies was conducted by Elliot
and Voss (1968). These researchers collected data on
2,617 students in California schools between 1963 and
1967. They concluded that the strongest indicators to
dropping out of school are: academic failure, difference
from school norms, social isolation, sibling dropouts, and
commitment to peers. These characteristics are similar to
those listed by later researchers cited in this study.
Hewitt and Johnson (1979) conducted a study that
illustrated how little the indicators for identification
of potential dropouts change from year to year. They
explored the numbers and causes of dropping out at
different points in time: 1924, 1937, 1952, and 1977.
They found that students exhibited similar characteristics
(low achievement, poor attendance, and grade retention) in
all four periods of time.
In the Oregon Department of Education (1980) study of
early leavers, 529 students who left school during the
1979-1980 school year were interviewed. In order of
frequency, reasons given for leaving school were:
1. Teachers
2. Dislike of school in general

44
3. Credits
4. Dislike of specific school
5. Boredom/lack of interest
6. Desire for alternative school
7. Pregnancy
This list is very similar to the recent reasons
students gave for dropping out of school in the 1995-96
school year. Reasons for leaving most often expressed by
these students include irrelevant coursework, falling
behind in credits, peer pressure, teaching techniques did
not match learning styles, lack of personal attention in
class, and lack of support for cultural identity (Oregon
Department of Education, 1997).
Most, if not all, of the research and literature
surrounding the characteristics of at-risk students
includes three indicators: poor attendance, poor academic
performance, and negative attitudes about school. Poor
academic performance is usually evidenced by low grades,
low test scores, and being held back in one or more grades
before high school. A study by Hunt and Holt (1979)
indicated that academic failure is one of the most
important dropout indicators. The researchers found that
failing grades were the most important indicator of the
New York City 9th grade students who dropped out. In
their study, Wehlage and Rutter (1986) also found low
45
achievement and truancy to be primary causes of dropping
out of school. His evidence indicates that students whose
achievement falls into the lowest 25% are the most likely
to drop out. "Dropping out most often results from
truancy and other disciplinary problems, low achievement
and course failure" (Wehlage & Rutter, 1.986, p. 378).
Subject failure and grade retention are the prevalent
complaint of at-risk students. Glasser (1969) made a
strong point against failure and retention.
The major problem of the schools is a problem of failure. Too much of our present educational system emphasizes failure and too many children who attend school are failing. Very few children come to school failures, none come labeled failures; it is our schools and schools alone which pin the label of failure on children. (pp. 7-8)
Indeed, there are many studies that have determined that
grade retention is a main characteristic of dropouts.
Livingston (cited in Voss, Wendling, & Elliott, 1966)
wrote
That of all dropouts who withdrew prior to entering 9th grade, every one was retained at least one grade and 84% were retained two grades. (p. 365)
In the recent report on dropouts in Oregon, a significant
deficiency in credits toward graduation was found in these
students who left school early (Oregon Department of
Education, 1997). Moreover, grade retention is a highly

46
negative experience for the student and reinforces the
student's low self-esteem.
Many researchers feel that family background,
including socioeconomic level, in conjunction with
failure, retention, and student alienation to school (poor
school climate and negative teacher attitudes) influences
the students decision to drop out.
As we descend the socioeconomic ladder, the incidence of dropouts increases sharply. Among youth in the upper class ... only 2% dropout. While the second rung (lower- upper class) the figure rises to 10%. In the upper- middle class, 17% of the youth do not complete school, and the lower-middle class and upper-lower class, the rate of school dropouts rises to an incredible 25%. At the bottom rung(the lower-lower class) a full 50% of the youth quit school. (Beck & Muia, 1980, p. 67)
Blough (1957) also found poverty to be the factor most
frequently associated with dropping out of school.
Many of the at-risk students come from
poverty-stricken single-parent homes. As reported in
Children in Need (Research and Policy Committee of the
Committee for Economic Development, 1987):
In 1985, 66% of black children, over 70% of Hispanic children, and nearly one-half of all white children living in female-headed households lived in poverty ... Children from poor and single-parent households are more likely than others to be children of teenage parents themselves. (p. 9)
As a result of low socioeconomic status, many of the
at-risk students "do not see the value in homework, and

47
all too many come from households where there is little
support for homework or outside academic enrichments"
(Hahn, Danzberger, & Lefkowitz, 1987, p. 18). At-risk
children are handicapped as a result of little or no value
placed on education from parents who have little or no
education themselves.
Recently, researchers such as Wehlage and Rutter
(1986) have gone beyond the traditional characteristics
(low socioeconomic status and poor school performance) and
identified other variables, such as negative attitudes
about school, as important. These variables included
students' perceptions about teacher interest in students,
the effectiveness of discipline, and the fairness of
school discipline. They suggested that a student's
decision to drop out is the culmination of a number of
student and school characteristics.
Research concerning why students drop out of school
has identified the importance of social bonds that connect
the student to the school (Wehlage, 1983; Wehlage, Rutter,
& Turnbaugh, 1987). The term "social bonding" describes
an outcome in which a student is attached, committed,
involved, and has belief in the norms, activities and
people of an institution (Hirschi, 1969). A student is
socially bonded to the extent that he or she is attached
to adults and peers, committed to the norms of the school,

48
involved in activities, and believes in the legitimacy of
that school. It is that part of school membership,
"attachment," that this research will focus its attention.
When students have low attachment to teachers and
administrators, they do not care what these people think
about them, especially as students. Dropouts perceive
that these adults do not care about them. Under these
conditions, it is easy to feel rejected by the school and,
in turn, to justify rejecting the school.
Alienation from teachers and school is a common
characteristic for dropouts. Hershaff (1980) compared the
feelings of alienation and attitude towards school of
dropouts and graduates. He found that dropouts have
greater feelings of meaninglessness, alienation,
powerlessness, and overall negative attitudes. At-risk
students tend to lack problem-solving skills. They often
are not able to see cause and effect relationships between
actions and their consequences. They feel powerless and
removed from any consequences of their actions and thus
blame others.
This feeling of disconnection is also manifested in
student attendance rates and academic performance (Abcug,
1991). The High School and Beyond studies found that
dropouts projected a more external locus of control than
did graduates, and the low level of self-esteem improved

49
once they left school. Leaving a situation that is the
source of negative experiences would then be replaced with
feelings of relief (Wehlage & Rutter, 1986).
Bronfenbrenner (1986) suggested that the forces of the
alienation are growing, and the best way to counteract
them is by creating connections within the schools.
The personal relationships between students and
teachers are distanced in high school. Research shows
that at each progressive level of the education system,
relationships increasingly lack meaning and personal
satisfaction. Many teachers in the comprehensive high
schools believe that it is important to create social
distance between themselves and their students as a means
of maintaining discipline and helping students to become
more independent and responsible.
Students and teachers do not relate to one another as whole persons, but in narrow circumscribed roles. Communication is restricted to what one can and must do in a 50-minute hour where a highly structured setting is a sanction against all but teacher-directed behavior. (Brendtro et al., 1990, p. 10)
This social distancing is a major source of strain for all
students; it is particularly a problem for the at-risk
student, who needs the more supportive environment that
parents may not be able to provide (Benson, Williams, &
Johnson, 1987).

50
Isolation, another impediment to school membership,
refers also to the social bonding that occurs between the
members of the institution and the student. Although
isolation from peers can be troubling to students, equally
serious is the isolation from adults, especially when the
stress of the home environment increases, as is more
likely with an at risk student. This is particularly
important because the social institutions that
traditionally provided adult-adolescent support, such as
church and voluntary organizations, have declined in their
influence. School is often the only place for some
students to find a rewarding adult relationship. Much of
the literature surrounding at-risk student concludes that
schools must be viewed by the students as a caring,
helpful place to be and, most importantly, that the
teachers care about all students.
Negative attitudes towards school prevails in the
research concerning characteristics of those students who
dropout of school. For example, the Coleman Report
(released in 1966) made it explicit that attitudes of
positive self-image are crucial to students' experiences
of success in school. Mayeske's (1973) study concluded
that influences on student achievement tended, when analyzed, to resolve themselves into attitudinal and motivational factors ... and that attitudinal and motivational factors were by far the more important. (p. 3)

51
students' attitudes toward school are influenced by
their teachers, peers, family, and other institutions and
environmental factors. As was mentioned earlier, with the
age-segregated environment of society today, and with more
and more households consisting of a single-parent
configuration or both parents in the workplace, schools
may play an increasingly important role in developing
positive role models and attitudes towards education for
those students at risk for dropping out of school.
Factors contributing to a student dropping out of school
may begin initially as an environmental factor, such as
low socioeconomic status, little or no parental support
for education, and possible learning difficulties. As
these students progress through the school system, many
experience failure and disengagement, which in turn
reinforces low self-esteem and a sense of disempowerment.
Schools push the at-risk student further into dropping out
with their large, impersonal bureaucratic organizations
and overcrowded classrooms, irrelevant curriculum, and
teaching strategies that do not match the student's
learning style. Schools and teachers cannot change the
environmental factors that continue to put students at
risk, but they can develop programs that are more user
friendly and that address the issues students face prior
to dropping out of school.

Characteristics of Programs for At-Risk Students
52
A review of the dropout literature and surveys aimed
at identifying programs around the nation that seem to
keep at-risk students in school revealed a variety of
programs and strategies. Rather than describe these
specific programs from all parts of the country, this
review of the literature will review characteristics found
common among the various dropout intervention strategies
and programs for at-risk students.
Kushman and Kinney (1989), in "Understanding and
Preventing School Dropout," divided dropout prevention
approaches into two categories: the "clinical approach"
and the "systemic approach."
The "clinical approach" deals directly with the
student and the characteristics that make that student
at-risk. It begins by looking at the predictors intrinsic
to the student at-risk in three areas: the home, personal
traits or circumstances, and school behaviors. Most of
these programs utilized guidance and counseling, remedial
education and alternative education programs. This
emphasis was also found in the review of the literature on
dropout prevention prior to the 1980s.
Most prevention programs involved guidance and
counseling as part of their program. As cited in Green

53
(1966), following the enactment of the National Defense
Education Act of 1958, prevention studies, such as the one
by Schrieber (1964), described the importance of such
guidance activities. Green considered guidance to be a
key ingredient to drop out prevention; it is up to the
counselor to make the first move. Not all researchers
agreed that the counseling functions should be carried out
only by certified school guidance counselors. Wrenn
{1967) proposed that this function can be cared out by all
educational workers - teachers, administrators, and
counselors.
Counseling on careers is seen in some studies as an
important factor in dropout prevention. In a program
initiated by the Arkansas State Department of Education
(1980), dropout prone students were given special
counseling sessions with a emphasis on careers. This was
so successful, a second program was added. camp (1980)
agreed; his review of California's statewide prevention
programs indicated that the greatest success with at-risk
students happened when the prevention programs combined
counseling with career awareness.
The astute counselor must zero in on these factors (dropout characteristics) and begin to develop a planned, coordinated response of prevention and treatment. (Kushman & Kinney, 1989, p. 356)

A recent edition of National Association of Secondary
School Principals' (NAASP) (1988) The Practitioner
identified specific counseling activities which include:
establishing a peer counseling program to help high-risk
students develop a sense of belonging; assigning each
student a teacher who advises and counsels him on school
related academics or activities; providing counseling to
parents of high-risk students on how to give support to
their children; and identifying and using dropouts who
have re-entered school as positive role-models for
students at risk.
54
Remediation is another method mentioned in the
literature. As has already been established, many at-risk
students have been retained in at least one grade.
Another remedial approach is ability grouping that places
students with lower abilities in slower classrooms so that
they will catch up. Research has shown that placing
students with academic and behavioral problems in the same
classroom will not improve their situation, and in many
cases lowers self-esteem and increases behavior problems
(Kulik & Kulik, 1982; Rosenbaum, 1980). However, when
slower students are placed with average or above-average
students, they improve. Remedial strategies seem to be
effective only when grouping students part of the day, and
individualized learning within the classroom is practiced.

55
Other forms of remediation that seems to work in drop-out
prevention includes peer-tutoring and cooperative learning
(Kushman & Kinney, 1989).
one of the most documented and successful approaches
for addressing the needs of at-risk children is to place
them in an alternative program. "Alternative program" is
a term used to describe non-traditional elementary and
secondary school programs housed either within the
traditional school or outside, on a separate campus.
Alternative programs are characterized by having caring
teachers, willing and specially suited to work with
at-risk students, a more individualized curriculum,
flexible scheduling to meet the needs of teenage parents
and those who work, and counseling services designed to
better meet the needs of at-risk students (Berkowitz,
1971; Buckner, 1976; Gordon, 1972). Wehlage (1983)
presented some specific guidelines for effective programs
for these at-risk students. These characteristics are
organized in four categories and summarized as follows:
Administration and organization:
1. Small size of classes to provide flexibility and
responsiveness to individual needs
2. Program autonomy which gives teachers ownership
to be more effective

56
Teacher culture:
1. Professional accountability for student success
2. A caring extended role to work with the whole
student
3. Optimistic, but realistic judgements of
individual academic abilities
4. Collegiality
Student Culture:
1. Family atmosphere is created through caring for
each individual
2. Cooperative learning versus competitive learning
3. Supportive peer culture in matters such as rules
and student progress
curriculum and Instruction:
1. Individualized and cooperative
2. Real-life problems used
3. Experiential in terms of career internships,
community involvement, outdoor activities and
community service
Wehlage (1983) summarized his findings on effective
programs by identifying two major areas on which to focus
efforts: (a) social bonding, the positive attachment to
parents and other significant adults which leads to the
commitment to participate in the institutions of society;

and (b) intellectual growth and development of abstract
thinking, beyond the basic skills.
57
Kushman and Kinney (1989) felt that a better approach
to students at-risk of dropping out of school is treating
the "whole" student, rather than just those
characteristics that are difficult to change, such as
poverty, cultural differences, and dysfunctional families.
Limitations to the clinical approach include making
students simply feeling better about themselves will not
necessarily improve their performance in school. Many
clinical interventions carry a negative stigma or further
segregate students from the norm and decrease their
already fragile self-esteem and even become labeled as
"slow" or "dropout."
The school that supports the systemic approach
recognizes the fact that, with the diverse makeup of any
student body, it is necessary to design a school system
that is flexible and meets the needs of all its students.
Schools are student-centered. Kushman and Kinney (1989)
outlined four major factors within a school that need to
be structured for the benefit for all students:
1. Organizational Structure
Students who attend a large school feel overwhelmed
particularly in the transition grades of between middle
school and high school. School hours that are rigid leave

58
little flexibility for working students. The organization
of most traditional schools leaves little or no transfer
of subject matter from one class to another.
2. Procedural Practices
Procedural practices are those rules and regulations
that make a school run smoothly.
It makes little sense to suspend a student who is skipping school, or to give a faiLing grade to a student who, for some understandable reason, is having difficulty with a subject. The disciplinary action does not solve the problem. (Kushman & Kinney, 1989, p. 361)
3. Instructional Strategies
Keeping in mind that students have different learning
styles, teachers must utilize a variety of teaching
methods. In addition, the curriculum must not be
disengaged from the student's out-of-school life and must
be challenging.
4. Educational Inequity
Teacher expectations must be the same for all
students and not lowered because of ethnic or economic
background.
Ironically, these students may not have suffered from low self-esteem until they were put into a situation where little was expected of them. It is only when a student begins to question his or her self-worth that insecurities and low self-esteem are created. (Rushman & Kinney, 1989, p. 362)
In addition to staff attitudes and expectations, the more
obvious type of educational inequity is placing at-risk

59
students in programs that fail to equip them for the
outside world and cheats them of a full education. This
includes "slow classes" and some alternative programs that
provide a caring environment, but do not have a full or
challenging curriculum.
There have been several surveys of dropout prevention
programs in vocational education. Significant among these
studies is a review of 14 programs by Weber and
Silani-Lacey (1983). Their findings are organized into
three categories: content, methodology, and organization.
(a) Content suggestions include having clear goals and
objectives for students, and the criteria for judging
success is directly tied to the content.
(b) Methodological suggestions include: identifying
dropouts early; avoiding "labeling;" having an integrated
program which combines basic skills to
vocational/occupational training; individualized
instruction; using a variety of materials or adapting
materials to meet students needs; including paid work
experience to content of schooling; providing recognition
and rewards to motivate students; using peer-tutoring; and
providing alternative programs. And, (c) Organizational
considerations include: inservicing for teachers to better
equip them to teach at-risk students, linkup with

community agencies, and locating the program within the
school.
Many school districts around the country have
identified the characteristics of effective programs for
dropout prevention. The following is a summary of those
findings:
60
1. Caring, skilled staff that believes all students
can learn
2. Dropout prevention is a priority at all levels
of leadership
3. Instructional program is tied to the individual
learning styles of students
4. Challenging courses that relate to the students'
personal experiences
5. Employment training and career experiences
6. Grading system builds on success by connecting
it to learning tasks set in accordance with
students' achievement levels
7. Involve parents as partners in the student's
education
8. Establish an inviting school climate - mentoring
programs
9. Establish an effective attendance program with
immediate response to parents when students are
not in school
10. Professional counseling supplemented by peer
counseling
11. A fair, consistent discipline system which
establishes a bottom line for unacceptable
behavior
12. Identifying at-risk students early
61
13. Being sensitive to the populations being served
14. Include life-skills training in the curriculum
(See: CETA--Education Linkage Unit, 1981; Gadwa,
Christenson, Bryan, & Boeck, 1983; Green & Baker, 1986;
Hathaway, Sheldon, & McNamara, 1989; NASSP, 1988; New York
Public Schools, 1979; Ohio State Department of Education,
1983; Portland Leaders Roundtable Planning Project, 1986}
Most, if not all, of the research on successful
programs for at-risk students take into consideration the
human connection, or bonding, between teachers and
students. Blueprint for Success listed establishing a
human connection, knowing students as people, developing
positive relationships with another adult, and helping
that student in problem-solving as essential to any at
risk program (National Foundation for the Improvement of
Education, 1986, p. 9).
In summary, all the programs or methodology used to
help prevent students from dropping out of school included
the following characteristics:

62
1. staffing: All the dropout prevention programs
reviewed had a caring, qualified teaching staff. It was
important that teachers and other significant adults
established a positive rapport with individual students
and developed personal relationships to create a sense of
trust and belonging to the school.
2. curriculum: The curriculum should be relevant
and meaningful for at-risk students based on real-life
experiences. Programs emphasized personal development,
preparation for work, or basic skills remediation or other
appropriate academic work.
3. Methodology: Programs were small in
student-teacher ratios. Instruction should be
individualized in terms of pace and ability. Group work
or cooperative learning should also be utilized to foster
social bonding and appropriate group behavior. Clear and
reasonable expectations should be set so that the student
experiences success. Immediate feedback, valid criteria
for evaluating performance, and appropriate rewards and
rules for students are needed.
4. Administrative Support: Preventative programs
and methodology to keep students in school are supported
at all levels of leadership in the school district.

63
Mentoring
Most people are familiar with the term mentoring from
the business world. The idea of mentoring is related to
the early concept of apprenticeship. Levinson (1978)
discusses the importance of mentors for developing a sense
of self in the adult world, particularly as it applies to
careers. A landmark study on adult development, conducted
by Vaillant (1977) on 95 male Harvard University
graduates, found men who were judged to be "best outcomes"
had numerous mentor-like relationships, and often became
mentors themselves. Sheehy's (1976) book, Passages,
looked at female mentors in the workforce. She discovered
that women who gained recognition in their careers were at
some point mentored by another person.
Formal mentoring programs for adults exist in many
fields. Many school districts assign a new teacher to a
more experienced teacher with exemplary teaching ability
to provide encouragement and assistance. Corporate
mentoring programs in place are Federal Express,
Honeywell, Eastman Kodak, AT&T, and BankAmerica, to name a
few. All of these programs have one thing in common: a
nurturing relationship.
This section of the literature review will focus on
mentoring in general. It is divided into the following
subdivisions: definition and historical background of

mentoring, the roles and characteristics of mentor
relationships, components of successful mentoring
programs, and research on mentoring and the at-risk
student, and the teacher as mentor for at-risk students.
Definition and Historical Background of Mentoring
The term mentor can be traced to ancient Greek.
Mentor was the name of a trusted and loyal friend of
64
Odysseus. According to the Greek epic poem, when Odysseus
left his homeland to fight in the Trojan War, he asked his
friend, Mentor, to educate and guide his son, Telemachus.
Other examples from history include Socrates and Plato,
Aristotle and Alexander the Great, Anne Sullivan and Helen
Keller, and Freud and Jung. In each case, the mentor was
a caring person who developed an on-going, one-on-one
-elationship with someone in need.
Today, the word mentor continues to mean any caring
person who encourages, listens, gives advice, is an
advocate, acts as a role model, and shares information and
experience. There are many definitions of a mentor or a
mentoring relationship. Parkay (1988) described mentoring
as:
an intensive, one-to-one form of teaching in which the wise and experienced mentor inducts the aspiring protege into a particular, usually professional way of life. (p. 196)
Blackwell's (1989, p. 8) definition is similar.

Mentoring is the process by which persons of superior rank, special achievement, and prestige instruct, counsel, guide, and facilitate the intellectual and/or career development of persons identified as proteges.
Although there are many different definitions of
mentoring, two characteristics seem to be constant:
a) there is always reference to one individual, one
65
person, interacting in some way with another; and b) there
is some sort of supportive action, such as guidance,
support, and counseling. Mosqueda {1990) contended that
the appeal of mentoring lies in the fact that it brings
individuals together on a one-to-one basis, bypassing
bureaucracy and institutions.
It brings people together essentially because it makes sense to have real people talking to real people. It also makes sense that an older and more experienced person will have skills or knowledge from which a younger person might benefit. {p. 3)
Although some of the characteristics of a mentoring
relationship involve counseling, tutoring and
role-modeling, these alone are not enough to encompass to
term mentoring.
A role-model is defined as one whose life and experiences provide a concrete image of who a younger person can become. By contrast, a mentor is someone who lends guidance and support to enable the young person to become whoever they choose to be. If the role model's message is "Be like me," the mentor's implicit message says: "I will help you be whoever you want to be." {The Forgotten Half, cited in Mosqueda, 1990, p. 169)

66
A review of nearly 800 references by Gray and Gray
(1986) found that there are at least two different types
of mentoring. Each type of mentor fills similar
functions, but for different periods of time and different
outcomes.
1. Informal life mentors. Most people are familiar
with the term mentoring from the business world. The idea
of mentoring is related to the early concept of
apprenticeship. Daniel Levinson's (1978) The Seasons of a
Man's Life discussed the importance of mentors for
developing a sense of self in the adult world,
particularly as it applies to careers. Gail Sheehy's
(1976) book, Passages, looked at female mentors in the
workforce. She discovered that women who gained
recognition in their careers were at some point mentored
by another person.
This type of informal mentoring starts with a more
experienced person who mentors a less experienced person.
According to Gray's (1989) findings, 80-90% of what was
written on mentoring before 1988 describes informal
mentoring or informal career mentoring, and has only
indirect relevance for planned programs for at-risk youth
for a variety of reasons. The mentors in this case
spontaneously begin their mentoring without the proteges

67
knowing. Usually this relationship lasts for 2-15 years,
as in the Annie Sullivan and Helen Keller case.
2. Planned project mentoring or Formal Mentoring.
This type of mentoring is the more focused, usually with a
particular outcome in mind, and lasts a shorter amount of
time (4-18 months). Formal mentoring programs for adults
exist in many fields. In the business world, planned
mentoring programs came as a result of dealing with women
and racial minority groups entering managerial ranks in
increased numbers, as these females and minorities didn't
have natural male mentoring connections. There was a
perceived glass ceiling for women rising in the corporate
hierarchies, and these formal mentoring programs were
established to assist in career advancement (Freedman,
1991). Planned mentoring programs for students originated
in the 1980s, probably as a result of antipoverty efforts
of previous decades, such as Head Start, Title I, and
Chapter I (Flaxman & Ascher, 1992). Many school districts
also assign new teachers to the more experienced teacher
mentors, with exemplary teaching ability to provide
encouragement and assistance. Examples of corporate
mentoring programs in existence for students include
Federal Express, Honeywell, Pepsi-Cola, Eastman Kodak,
AT&T, and BankAmerica, to name a few. All of these

programs have one thing in common: a nurturing
relationship (Gray, 1989; Smink, 1990).
68
According to Gray (1989), project or planned
mentoring is the easiest to arrange and more schools are
beginning to look at this kind of mentoring to help
students. These include the enhancement of career
awareness, the talented and gifted students, and the
at-risk student (Edlind & Haensly, 1985; Outen cited in
Gray, 1989). For years, the gifted student was the only
recipient to benefit from mentorships in public education.
According to Ellingson, Haeger, and Feldhusen (1986)
"gifted children are thought to be particularly good
candidates for mentor experiences" (p. 3). In a study of
604 Presidential Scholars, Kaufman et al. (1986) found
that the majority (66%) reported that their most
significant mentors had been teachers, of which about one
third were in their secondary school experience. In his
22-year longitudinal study, Torrance {1983) found that
students who had mentors completed more years of education
than did non-mentored peers. According to Kaplan (1985),
if the mentoring programs are successful for gifted
students, then they will be beneficial for the mainstream
student, although there is a clear lack of research on the
effects of a mentoring relationship with potential high
school dropouts.
Roles and Characteristics of Mentor Relationships
Many writers have written on the roles and
characteristics in mentor-protege relationships. Schein
(1978, p. 178) listed seven possible roles for mentors:
(a) teacher, coach, or trainer, (b) positive role-model, (c) developer of talent, (d) opener of doors, (e) protector, (f) sponsor, and (g) succes3ful leader.
69
To these, other writers have added others. Gehrke (1988)
added confidant (p. 43). Clawson (1980) added the
concepts of comprehensiveness and mutuality.
comprehensiveness refers to all the aspects of the
protege's life, not just the area to be focused on; the
concept of mutuality recognizes the need for the
relationship to be chosen and valued by both the protege
and the mentor.
The main elements in a mentor relationship in the
public schools are mentor, mentee, and the resulting
relationship of the mentoring process. Lambert and
Lambert (1982) described this process as "the linking of a
person of specific experience in a learning-oriented
relationship'' (p. 12). They said,
The mentoring model utilizes a mature expert who desires to develop an in-depth, sharing relationship with a student. Together the mentor and mentee create a linked series of learning experiences which, as a result of the highly individualized and personal relationship, have implications which impact on other areas of the mentee's existence. The mentor shares not
only expertise, but values problem-solving techniques, and other aspects of his or her life style. It is this mutuality inherent in the relationship which makes mentoring an extremely powerful developmental tool. (p. 12)
Furthermore, mentoring often includes role modeling
70
outside the classroom and can have a strong effect on the
protege on both the educational and personal level (Cox &
Daniel, 1985; Lambert & Lambert, 1982). Gray (1989)
described the major mentor roles in his Mentor-Protege
Relationship Model as:
1) Role Model. Models success in life and work and is someone the protege can identify
2) Leadership. Directs, guides, invites joint decision-making
3) Teacher-Coach. Teaches insights or skills, provides practice of those skills, gives feedback on those skills, and fosters self-evaluation and self-improvement
4) Motivator. Provides positive reinforcement and encourages self-motivation
5) Gate-Keeper. Helps proteges understand realities about the worlds of education and work.
6) Gate-Opener. Helps protege achieve his/her goals and introduces protege to significant others
7) Wise Counsel and Confidant Listens, helps clarify possible solutions and shares wisdom. (p. 19)
71
The content of adult relationships, along with the
outcomes, can vary greatly from program to program, as can
the intensity within programs. According to Flaxman et
al.'s (1988) review of the literature on mentoring
relationships, the goals for that relationship should be
clear and within the mentor's power to achieve, and the
mentor must be empathetic, able to assess the needs of
these students, and be able to apply available resources.
The research surrounding Project RAISE found that,
even though mentors are not usually intended to assume the
supervisory or discipline roles of parents, mentors'
monitoring and pressuring had a significant impact on
attendance (McPartland & Nettles, 1991).
The literature points out that the mentor must be
trained to use interpersonal skills necessary to encourage
students to develop the capacity to change unacceptable
behavior (Gray, 1989). The following strategies can be
used by mentors for effective mentoring:
1) Positive Attitude: Encourage mentee to approach life and goals with enthusiasm and to be accepting of self and others
2) Valuing: Encourage the mentee to examine beliefs and ideals in an effort to establish personal values and goals
3) Open-mindedness: Encourage the mentees to keep an open mind to ideas
4) Interrelations: The interactions between mentor and mentee should be situations of sharing, caring, and empathizing
5) Creative Problem Solving: Encourage the mentee to use a creative problem-solving process
6) Effective Communication: Encourage the mentee to be an attentive listener and an assertive questioner
7) Discovery: Encourage the mentee to be an independent thinker
8) Strengths and Uniqueness: Encourage the mentee to recognize individual strengths and uniqueness and build on them
9) Confidence: Assist the mentee in developing self-confidence
10) Awareness: Stress that the mentee be aware of the environment, be intuitive, be problem-sensitive, and be ready to make the most of opportunities
11) Risk-Taking: Encourage the mentee to be a risk- taker and to be an active participant, not a spectator
12) Flexibility: Share with the mentee the importance of being flexible and adaptable in attitudes and actions, looking for alternatives, and seeing situations/persons from different perspectives. (Borman & Colson, 1984, p. 196)
The key to a successful mentoring is the
mentor-mentee relationship. "Crucial to success of a
mentoring relationship is the appropriate match between
mentor and mentee" (Richardson, 1987, p. 34). This
72
one-on-one relationship can provide support and guidance
for students who are at-risk of dropping out of school.
Development and Implementation of successful Mentor Programs
Development and implementation of mentor programs
that provide assistance to at-risk students must be
carefully planned. "A primary reason mentoring programs
73
fail is that enthusiastic people begin a well-intentioned,
but poorly defined, program without planning exactly what
they want to happen and how it should unfold"
(Haring-Hidore, 1986, p. 240). It is important to
identify factors which can contribute to the limitations
of mentoring. Haring-Hidore identified the following two
factors: a) mentoring requires considerable programmatic
and individual effort which may be difficult to sustain
over time, and b) it is difficult to involve large numbers
of students in a mentoring program because large numbers
of potential mentors seldom are available. Thus it is
important for the mentoring program to be part of a larger
retention program for at-risk students (p. 240).
Gray (1989) pointed out that it is important to have
support from the top, as well as a grass roots based
program, so that voluntary participation occurs.
Imposed programs seldom work as well as those in which people want to 'buy in' as volunteers because they see the benefits for themselves and the organization, and they can meet program
expectations. To attract volunteers, the program's structure, organizational expectations, and anticipated benefits must be communicated to potential participants. Focus groups comprised of prospective participants and needed supporters provide useful input for improving the program's design. Having such input increases support for the program. (p. 20)
The program coordinator is also a key element in a
successful mentor program.
The program coordinator will ... get management's commitment, selectively publicize the effort, decide on goals, recruit volunteers, set up orientation sessions, contact consultants who may be able to help and choose some evaluation strategies. (Phillips-Jones, 1983, p. 40)
Each program should have clear, well-communicated
74
goals. It is deceptively easy to establish ''retention" as
the long-term goal of the mentoring program. Researchers
suggest that short-term goals be established that will
ultimately lead to retention of that student. An example
given is that each student that participates in a mentor
program be engaged in one ongoing school activity at the
end of a certain period of time. such involvement can be
facilitated by the mentor and leads to retention (Austin,
1985). The goals should also relate to the needs of the
participants, determining mentor/protege selection, type
of training to provide, and length of time to which each
is committed (Gray, 1989; Haring-Hidore, 1986).
In the planning phase of the mentoring program, a
monitoring system snould be designed that will enable

75
program staff to obtain feedback from participants
throughout the program. Feedback of various kinds can be
in the form of successes and/or failures of various
activities used with proteges, and suggestions for new
ideas communicated in written form or in a meeting. It is
also important at this stage to decide on an evaluation
tool so that data can be collected proactively.
Evaluation should include whether goals are being met and
the amount of satisfaction experienced by the participants
(Gray, 1989; Haring-Hidore, 1986).
Implementation of the mentor program should begin
with the identification and selection of potential
mentors.
Mentors must be genuinely invested in the principle of mentoring so they can form a close and meaningful tie with an individual or individuals. (Harding-Hidore, 1986, p. 241)
It is equally important for the match to be mutually
agreeable.
One of the most important factors of a successful mentor program is making the right match between mentors and mentees. (Lanier, 1986, p. 42)
Following planning of a mentoring program and
selection of participants, the program is ready for
implementation. Here attention should be given to
orientation and training of participants, and activities
for mentor/mentees outlined.

76
Gray (1989) added that the major cause of failure of
planned mentoring is lack of training.
It cannot be assumed that simply matching mentors with proteges will produce desired results. Before hard-core at-risk students can benefit from what mentors can offer, they need to become receptive to this kind of help. For example, in a Skill Training and Empowerment Program (2-STEP) for at-risk youth, Al Ross (of Vancouver, BC) helps youth break such self-defeating cycles as school failure, delinquency, chemical dependency, welfare dependency, chronic unemployment, and criminality. (p. 19)
While activities can take a variety of forms,
Haring-Hidore (1986) suggested two things: de-emphasize
the hierarchial nature of the mentoring relationship, and
second, activities should be planned so that attention is
not always on the protege. Phillips-Jones (1983) believes
that orientation should be provided for a variety of
reasons, including:
The main purposes of the orientation are to build enthusiasm in the mentors and to help them recognize what they can contribute to their mentees, how mentoring can also benefit mentors, what to expect during a mentor-mentee relationship and how they can enhance their mentoring skills. During the orientation, mentors should receive a manual or other materials to help them with their tasks. Soon after the orientation, they should meet their mentees and begin to initiate action plans. (p. 41)
The At-Risk Student and Mentoring
Researchers have found that school dropouts often
cite as one of the primary reasons for leaving school is
77
the absence of one person who cared about them (Smink,
1990). Their engagement and attachment to school and
teachers was weak. Traditionally, parents and family
members have fulfilled the mentoring role, but the
prevalence of two-earner and single-parent families,
combined with the school's isolation from the larger adult
community, makes it difficult for students to find adult
mentors. Even though ,arental involvement cannot be
stressed enough, mentors outside the family can compliment
parental efforts.
This growing awareness that too many parents are
unable to meet their adolescent children's needs has
generated a host of programs matching at-risk youth with
adults. Examples of large programs implemented across the
country include I Have A Dream Foundation which
encompasses 30 cities in 23 states; One-to-One, which has
the goal of matching a caring mentor with every young
person who would benefit from such a program (U.S.
Department of Education, 1992); and Big Brothers/Big
Sisters of America, which has 500 affiliates throughout
the nation, with children being mentored from primarily
low-income or single-parent families (Smink, 1990) .
At-risk mentor programs seem to attempt to modify the
behaviors and skills of the student, rather than being
seen as supplemental to already existing behaviors as in
78
other programs that mentor gifted students. In addition,
at-risk mentoring programs find some advantages for the
mentor. As Freedman (1991) noted in his literature
review, program leaders feel that a central objective of
their programs is to educate the middle class adult to the
circumstances of poor children and reengage them (both
mentor and child).
Rigorous research in the particular area of mentoring
at-risk youth is scarce. Flaxman and Ascher (1992)
discussed two evaluations that satisfied a rigorous
research model that used pre-test and post-test measures,
with a control group and experimental group. Career
Beginnings was created in the 1980s as a 24-city program
that coordinates college, businesses, and non-teaching
staff to mentor 11th and 12th graders. Evaluation of the
program showed that participants were more likely to
attend college and have higher educational aspirations
than the controls (Flaxman & Ascher, 1992; Hamilton,
1990). According to this program, the key was the amount
of time the mentor invested in the student. The most
successful mentoring were the ones that the responsibility
for sustaining the relationship was actively pursued by
the mentor with a weekly progress report shared with
parents \Fehr, 1993).
79
Another example, Project Raise, a program for at-risk
students in seven middle schools around Baltimore,
Maryland, used adults from the community either as
advocates or mentors. Those students with mentors were
found to be more likely to improve their attendance and
English grades, but not their promotion rates or scores on
standardized tests. Over this two-year period, the
researchers found more positive results with at-risk
students in those schools where the one-on-one mentoring
program had been strongly implemented and supported
(Flaxman & Ascher, 1992; McPartland & Nettles, 1991).
There are also other, less rigorous evaluations that
show positive results of mentoring programs. Linking Up
(Flaxman et al., 1988), a mentoring program developed by
Cornell University, found that students who have a parent
or other adult challenging and supporting them scored
higher on measures of cognitive skills. Laughrey (1990),
in his evaluation of a Florida high school mentoring
program, found that students improved in the areas of
attendance, test results, and postgraduate planning.
A program for at-risk students, involving business
mentors as part of the intervention for 9th and 10th grade
students in a small rural school in South Carolina, found
improvement in attitudes toward school, a reduction in
"D"s and "F"s, and a decrease in the dropout rate from
7.2% in 1990-91 to 1.6% in June 1993 (Stradford, 1993).
Additional, less rigorous research findings reveal both
positive effects of mentoring at-risk youth, and trouble
in proving links on additional benefits.
80
Hamilton (j990) found, in his research on the
Learning Web, that parents were convinced that this mentor
program benefitted their children. The Learning Web was a
program set up to match students with an adult mentor to
teach them a skill. Although there were no clear outcomes
of the program identified, about half of the participants
named their mentor as one of the five most important
adults in their lives.
Davis (1988) analyzed a mentor program to assist in
increasing the academic achievement and attendance of
at-risk 9th grade students in Pittsburgh. This study
found no significant difference between the group who
received mentoring and the group that did not. The study
suggested that the failure of the program to be in place
prior to the opening of school and the lack of effort to
match mentors and at-risk students had a negative impact
on the outcome of the program.
Another mentor program, Atlanta's Adopt-a-student
program, found that participants were more likely than
comparison group members to enroll in post-secondary

81
education, but no more likely to graduate from high school
(Stanwyck & Anson, 1989).
One of the most useful studies of mentoring programs
is a report by Freedman (1988) for Public/Private
Ventures. This study examined the relationships developed
between elder mentors and at-risk youth in five different
programs. In his research, Freedman interviewed 47 pairs
of youth and adults. He concluded that both mentors and
mentees benef itted from the program and suggested further
research into such programs. Of interest in his findings
was the insight he gives to the types of relationships
formed between the mentor and mentees and the effects on
the mentees. He divided the relationships into
"non-significant,'' meaning that the people did not
interact well or regularly, and "significant'' as either
''primary" or "secondary." A "secondary" relationship was
defined as being a "close relationship'' but not bound,
whereas the ''primary" relationship was viewed as central
to the lives of both parties, much like a family
relationship.
Three researchers at Columbia University, Flaxman,
Ascher, and Harrington (1988), in an analysis of the
literature on mentoring, stressed the need for additional
studies, program descriptions and evaluations. They
warned that mentoring is likely to prove a modest

82
intervention, effective only in connection with favorable
influences of family, school, and community. Even with
the tremendous complexity surrounding the effectiveness of
mentoring at-risk students, there is strong observational
evidence to suggest that young people who have an adult
mentor can profit from the relationship.
Jacobi (1991), in a review of literature on mentoring
of university students and academic success, found a lack
of studies linking mentoring directly to academic
outcomes. She found much of the current research failed
to control for outside influences or additional aspects of
a program that could explain the outcomes. While research
is scarce, many educators are convinced of the
effectiveness of mentoring.
The challenges involved in implementing a mentoring
program for at-risk students are evident in the high
failure rate of mentor/mentee matches. Hamilton and
Hamilton (1992) found that, even with a thorough process
of matching, only about half the pairs actually met
regularly. Freedman (1991) concluded that up to two
thirds of mentoring relationships fail.
Cross-gender and cross-ethnic mentoring are also
cause for concern. Program organizers suggest that, when
possible, mentoring should be between people of similar
social origins (Freedman, 1991). When ethnicity is taken
83
into consideration when matching mentors with students,
activists with the African-American and Latino communities
have seen positive results with mentoring efforts. An
example is 100 Black Men of Atlanta, a community service
organization which targeted a high school in Atlanta with
a high dropout rate. It promised students a fully-paid
college tuition for those who graduated from high school
and acted as mentors and tutors for these students (Glass,
1991) .
A mentoring program in the Wake County Public School
system, North Carolina, found that there was improvement
in academic achievement of at-risk black male students in
grades 6 through 8 when they were linked with supportive
black adult males. Campbell-Peralta (1995) also found
positive results in a mentoring program that targeted
primarily minority males. She found that cultural
sensitivity and awareness inservicing of the adult mentors
overshadowed any lack of adult minority mentors available.
Hispanic students from Calexico High School,
California, reported on the importance of having a mentor
who speaks their language and cares about them. Calexico
has gained national attention because 98% of its students
are Hispanic, but only 2% of these drop out every year
(Di Rado, 1997, p. Bl). In reality, most of the potential
mentors are white, middle class; many of the mentees are
84
not. Slicker and Palmer (1993) found that a mis-match or
ineffectively mentored students may produce an actual
decline in academic achievement, probably as the result of
disappointment by that student.
At-risk students often have profound needs or factors
that put them at risk; a mentoring program may seem like
just a drop in the bucket. Factors such as mobility rate,
lower academic achievement, low attendance, negative
attitudes associated with school and stress, affect any
positive results actually recorded as the result of a
mentorship program (Flaxman et al., 1988). For this
reason, some mentoring programs for at-risk youth do not
target the most at-risk students. Project Atlanta targets
students with a "C" average (Glass, 1991). The inner-city
mentoring program evaluated by Fehr (1993) targeted
students that had moderate, rather than more severe,
problems. In contrast to earlier expectations,
researchers have cautioned that mentoring at-risk students
should be thought of as a modest intervention, not a cure
all. Even the ideal of one mentor matched to one mentee
is challenged with Freedman's idea of a mentor-rich
environment in which a student has many mentors to work
with, depending upon the circumstances.

Teachers as Mentors for At-Risk Students
85
The self-perceived needs of at-risk students include:
(a) having teachers who are supportive, caring, and talk
personally with students (Bearden, Spencer, & Moracco,
1989); (b) getting good grades (Applegate, 1981);
(c) feeling connected to the school (Mahan & Johnson,
1983); and (d) getting help in negotiating the school's
bureaucracy and options available in decisions (Mahan &
Johnson, 1983). Many of these perceived needs may be
addressed in a mentor program.
The teacher-student relationship has been widely
documented as having a direct and positive influence on
student achievement in school (Cuban, 1989; Rhodes &
McMillan, 1987; Self, 1985). Self described the teacher-
student relationship as the most important intervention
strategy. When dropouts from New York schools were
interviewed, 61% said that they felt unwanted and defined
good teachers as caring and seeing students as
individuals. A survey of 1,596 students by Poole (1994)
confirms these findings. A significant number wanted more
informal relations with their teachers, and the teacher-
student relationship was found to be a significant factor
in the satisfaction or dissatisfaction of these students.
Examples of programs with positive results involving
teachers as mentors include TASK (Teachers Achieving
86
success with Kids). The purpose of TASK was to promote a
close teacher-student relationship for at-risk students in
an urban middle school. The students met daily with their
mentors and weekly assessments were communicated to
parents. The research on this program found significant
improvement in attendance, discipline, and academic
achievement among the targeted at-risk population, as well
as a positive change in attitudes about school (Abcug,
1991).
Another evaluation of an at-risk mentoring program,
involving the staff in two Texas high schools, found that
adult teacher mentors made a difference in the self
concept of at-risk 10th grade students attending the two
schools. The research also found no difference between
academic achievement or dropping out as a result of these
mentorships (Slicker & Palmer, 1993).
CHAPTER III
METHODOLOGY
General Plan of Study
This study used quasi-experimental research
methodology in examining the effect of a staff mentoring
program with students identified by their counselors as
being at risk of becoming early leavers. This mentoring
program, Caring About Kids Effectively (CAKE), was
designed for and implemented at a suburban secondary
school in Oregon serving grades 9 through 12.
Specifically, such indicators of success in school as
attendance and GPA were examined for the entire four years
of the program's existence, and attitude toward school for
the first two years. The resear~her studied the
enrollment status of these students over the same period
of time.
CAKE (Caring About Kids Effectively)
CAKE, Caring About Kids Effectively, was a mentor
program developed and implemented to assist in reducing
the dropout rate of at-risk students identified prior to
entering the 9th grade in a selected suburban high school.

88
The primary function of this program was to establish
relationships between these at-risk students and staff
members from the high school. These staff mentors,
volunteers from both teachers and support personnel,
provided support and guidance to their student mentees by
placing emphasis on interpersonal relationships, problem
solving techniques, and communication skills, and by
encouraging positive behavior, study skills, and
attendance. Staff mentors were asked for their
preferences concerning student mentees, such as whether
they were in one of their classes, gender, attendance
record, self-esteem, and substance/family abuse issues.
The staff mentors met four times during the first
year of the program to receive training in at-risk student
behavior and provide support for the mentor/mentee
relationship. Over a four-year period of time, additional
mentors were recruited, as staff retired or moved from the
school, and each year incoming at-risk 9th graders were
assigned mentors.
In general, mentorship programs such as this one
presume that the association between the mentor and the
mentee will result in some sort of positive experience for
the mentee. In this program, indicators of success
(attendance, GPA, enrollment status, and attitude towards
school) were examined.
89
Quantitative Research Components
The study of the CAKE mentorship program had four
quantitative research components: The first examined the
difference in school achievement and attitude towards
school by comparing students at risk and those not at
risk; secondly, the at-risk students selected from three
cohorts were compared prior to any treatment to examine
the appropriateness of grouping these students together to
provide for a larger sample; thirdly, indicators of school
success (grades and attendance) and attitude toward school
were analyzed over the period of time students were
mentored to find any significant change; and fourthly, the
researcher felt it was i~pcrtant to report the enrollment
status at graduation for students analyzed in the study.
The analysis of these pre- and post-treatment results
provided information as to the effectiveness of mentoring
on such indicators of school success as attendance and GPA
rates, attitude towards school, and the school's holding
power in terms of the number of dropouts.
The researcher also examined participants'
perceptions of the mentoring program, using data from a
survey given to participants in the program. Both student
proteges and staff mentors were given a survey to
determine those characteristics of the CAKE mentorship
program that were successful and those activities or
90
components of the program that needed to be reevaluated.
The researcher felt that it was important to analyze both
any actual change in students' attitudes and progress in
school over a period of time and examine the perceived
usefulness of the program from both the mentees' and
mentors' viewpoints. This provides a comprehensive
evaluation of the effectiveness of a staff mentoring
program for at-risk students.
Independent Variables
In this study there were two student-related
independent variables: "At-risk status" and "mentoring."
The levels of the at-risk status were: (1) students
classified as being at-risk and (2) all other students.
The levels for the mentoring variable were (1) at-risk
students who received mentoring from staff members
(treatment group) and (2) at-risk students who did not
receive mentoring (control group}. The dependent
variables were: GPA, attendance, enrollment status
(graduated, GED, dropout, and returning 5th-year senior},
attitudes toward school as measured by the Quality of
School Life (QSL) , and perceptions of the mentor program
as measured by the CAKE survey. Attitudes, GPA, and
attendance also served as covariates. Comparisons within
and between groups were made. Because of the method used

in assigning subjects to treatment, described later, a
quasi-experimental design was used.
A third independent variable was staff mentors; the
associated dependent variable was perceptions of the
mentoring program as measured by the CAKE survey. This
part of the study was descriptive.
91
As indicated in the literature review, it should be
noted that mentorship programs are increasing in number in
both the private and public sectors. Therefore it makes
sense that educators would do well to examine how the
mentoring processes and mentorship activities meet the
needs and expectations of the students. Due to the
limitations of such a study, any inferences of causality
cannot be made with any degree of certainty. However,
these results, when matched with similar findings of
student-teacher mentorship programs in other schools, may
make meta-analysis desirable.
Characteristics of High School/School District
The CAKE program was implemented in a suburban high
school, one of four secondary schools located in a school
district of approximately 14,500 students. A total of
1,365 students, grades 9-12, attended this comprehensive
high school. The school district consisted of three
comprehensive high schools and one occupational skills

92
center. The high school faculty consisted of 65 full time
certified teachers, 20 classified staff, four counselors,
and four administrators. The ethnic makeup of this high
school was primarily caucasian (90.5%). Others included
African-American students (1%), Hispanic students (2%),
Asian/Pacific students (4%), and Alaskan/Native American
(2.5%).
The high school used in this research was considered
the "poor sister school" in comparison to the other high
schools located in the district. At the time of the
study, 225 students were on free or reduced lunch, and the
mobility rate was much higher than for the other two
comprehensive high schools, averaging approximately 25%.
Students were absent more often at this high school,
averaging 11% during the years of this research; in
comparison, the absentee rate was 6.5% and 5.5% in the
other two high schools. More students dropped out of this
high school when compared to the other high schools.
Dropout data from the state indicates a 27% dropout rate
for this high school over the four years of this research,
versus 15% and 13% dropout rates for the other two high
schools in the district. The average income for the
parents of this high school was in the low average range,
in contrast to average and above average incomes for
parents of the other two high schools. Approximately 25%

of the high school students analyzed enrolled in college
after graduation, 10% attended a community college, 40%
went directly to the job market, and 25% dropped out or
received a GED.
Subjects
There were two categories of subjects: (a) staff
93
members who agreed to participate in the CAKE program and
serve as mentors (N=83) and (b) at-risk students who were
considered eligible to participate in the CAKE program
(N=ll8). The at-risk students were partitioned into two
groups: (a) students with mentors and who participated in
the CAKE program (N=84) and (b) at-risk students without
mentors (N=44). Both students with mentors (experimental
group) and without mentors (control group) were the
subjects used in this study examining the effects of
mentoring.
Mentors were equally divided as to gender, whereas
there were almost twice as many at-risk male students
assigned mentors as females. This was not the case with
those students without mentors, as they were equally
divided as to their gender. In all three cohorts, there
were more males identified as at-risk than females.
(Refer to Table 1.)

94
Table 1
Gender of Subjects
Year 1 Year!
Subject Gender Cohort 1 Cohort 2 Cohort 3
Menton Male 37 30 Female 46 33 Total 83 63
At-Risk Students
With Mentors Male 33 8 16 Fe ma I.: 15 4 8 Total 48 I! !4
Without Mentors Mal.: 8 6 10 F.:mal.: 8 3 Q
Total 16 i 9 19
Total 64• 21 43••
• 130 ID'd in 1989 - 64 dropped b.:fore January. leaving 64 in Cohort I •• Pick.:d up anoth.:r group. Cohort 3. but had only 52 left by April. and had only 43 actually take QSUattendance/GPA.
The subjects in this study were either at-risk or not
at-risk and divided into three cohorts: Cohort 1,
students identified as at-risk by their 8th grade
counselor, began their freshman year in high school in
Year 1 of the study. Cohort 2 were students identified as
at-risk by their 9th grade counselor and were beginning
their sophomore year in Year 1 of the study. Cohort 3,
students identified by their 8th grade counselor as at-
risk, began their freshman year in Year 2 of the study.
To qualify as a prospective mentee for Cohorts 1 and
3 in the CAKE program, counselors from students in 8th
grade year identified these students as having three or
more characteristics of at-risk behavior listed below:
1. Attendance problems

2. Low performance and achievement, subject and
grade failure, many times one or two grades
below level
3. Comes from a lower socioeconomic background
4. Negative about school
5. Low self-esteem
6. Family history of school failure
95
This was also the criteria 9th grade counselors used for
students in Cohort 2. A counselor from the high school
met with each group of teachers and a counselor at the 8th
grade level and discussed the students recommended as
needing the CAKE program.
Mentors were staff volunteers from the high school.
They were both teachers and support personnel such as
instructional assistants, secretaries, and custodians.
The only criteria to become a mentor was to volunteer to
mentor an at-risk student for the years that student
remained in school. Some staff continued to add mentees
as theirs moved, dropped out, or were demonstrating
success in school; other staff members did not volunteer
to mentor additional students as needed.

96
Instruments
In addition to attendance and GPA records, the
researcher used the following to collect data in order to
evaluate the effectiveness of the mentor program:
The Quality of School Life Survey, or OSL
The Quality of Life Survey, or QSL, by Epstein and
McPartland (1978), was used to determine students'
attitudes and how these attitudes change over time. The
QSL is a multidimensional measure of student reactions to
school in general, to their classwork, and to their
teachers. Three subscales form the 27-item QSL, based on
three dimensions of the concept of the quality of school
life.
The Satisfaction with School subscale (SAT) examines
students' general reactions to school. Epstein and
McPartland (1978) stated:
Because school is a major part of youngsters' lives, students who are positive in their evaluation of life in school may be more likely to experience feelings of general well-being. They also may be more likely to behave in socially acceptable ways and help other students in the school setting. (p. 2)
The Commitment to Classwork subscale (COM) deals with
the level of student interest in classwork. Epstein and
McPartland (1978) explained:

Tasks and assignments are what make school different from non-school settings. In short, "the work" is what makes school school. students who find class assignments and projects interesting and important may learn facts and concepts more completely, and may develop more positive attitudes toward learning. (pp. 2-3)
The final subscale, Reactions to Teachers (TCH),
97
examines student evaluations of instructional and personal
interactions with teachers. Epstein and McPartland (1978)
went on to explain:
Student-teacher relationships may be the key to student acceptance of educational goals, student understanding of school procedures, differences in students' independent or dependent behavior, and attitudes toward authority in and out of school. (p. 3)
The reliability of a test concerns the consistency of
scores derived from the instrument. Reliability studies
on the internal consistency of QSL were conducted for the
4,266 elementary and secondary students in the final
survey. The Administration and Technical Manual by
Epstein and McPartland (1978) provided reliability
coefficients, using KR20 for the subscales and the total
scale of the QSL. Procedures that determined the internal
consistency of tests took into consideration the variation
of student responses to all test items. The reliability
coefficients obtained provided an estimate of test
consistency at a specific time. The overall KR20
reliability for the QSL was .87 for secondary students.
For the subtests, KR-20 reliability coefficients were .79
for the SAT subscale, .72 for the COM subscale, and .64
for the TCH subscale.
98
The standard error of measurement is a measure of the
discrepancies between obtained scores and true scores.
For the QSL, this statistic was computed using the
internal consistency reliability estimates (Stanley &
Hopkins, 1972). The standard error of measurement for the
27-item QSL scale was 2.14 for the secondary samples
(Epstein & McPartland, 1978) .
The research sample has also provided the QSL with
concurrent, discriminative, construct, and predictive
validity. A test is valid if it provides scores that can
be used successfully to define conditions accurately. The
items of each scale of the QSL and selected item
characteristics (item mean, item-subscale correlations,
item-scale correlations) are presented in Appendix A
(Epstein & McPartland, 1978, p. 15). The minimum itern
subscale correlation was .38; only four correlations were
less than .50. The minimum item-scale correlation was
.30; three of the correlations were less than .40. All
item-subscale correlations were greater than their
corresponding item-scale correlations, although in some
cases the differences were negligible.
National norms were not available for the QSL.
Research norms presented were based on the responses of a
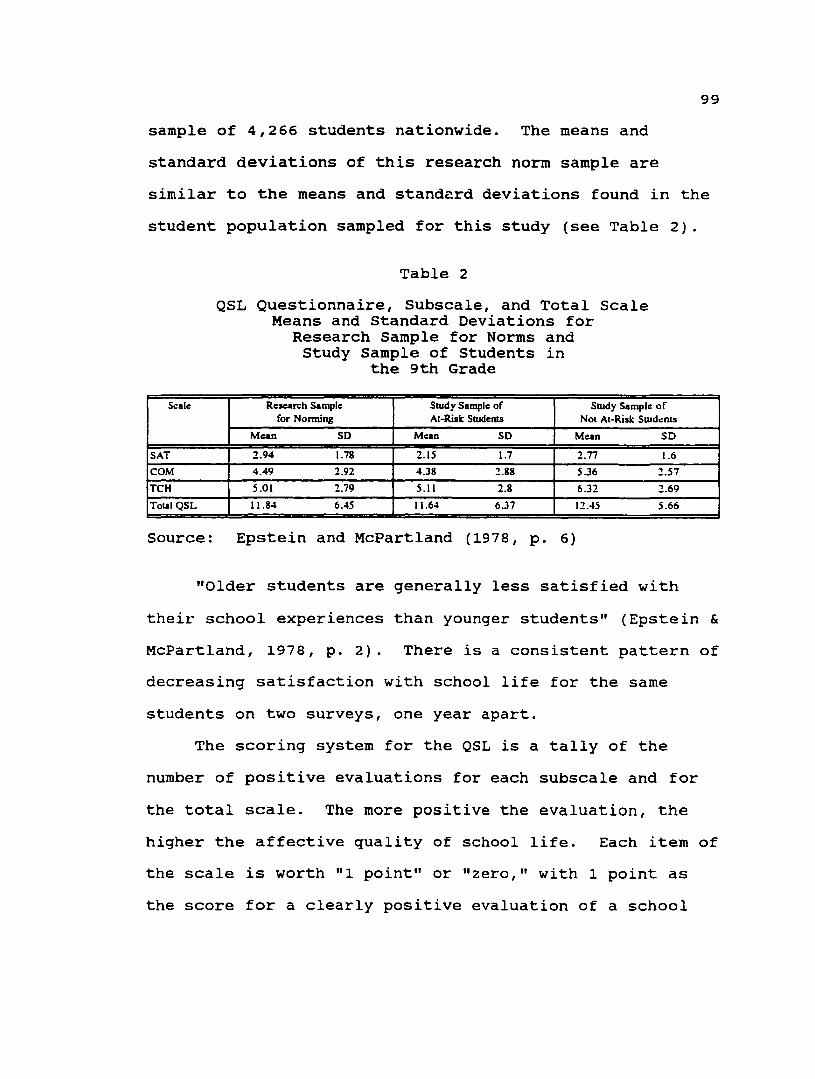
99
sample of 4,266 students nationwide. The means and
standard deviations of this research norm sample are
similar to the means and stand~rd deviations found in the
student population sampled for this study (see Table 2).
Scale
SAT
COM
TCH
TotalQSL
Source:
Table 2
QSL Questionnaire, Subscale, and Total Scale Means and Standard Deviations for
Research Sample for Norms and Study Sample of Students in
the 9th Grade
Research Sample Srudy Sample of Srudy Sample of for Nonning At-Risk SrudclllS Nol At-Risk Students
Mean SD Mean SD Mean SD
2.94 1.78 2.15 1.7 2.77 1.6
4.49 2.92 4.38 2.88 5.36 2.57
5.01 2.79 5.Il 2.8 6.32 2.69
11.84 6.45 11.64 6.37 12.45 5.66
Epstein and McPartland (1978, p. 6)
"Older students are generally less satisfied with
their school experiences than younger students" (Epstein &
McPartland, 1978, p. 2). There is a consistent pattern of
decreasing satisfaction with school life for the same
students on two surveys, one year apart.
The scoring system for the QSL is a tally of the
number of positive evaluations for each subscale and for
the total scale. The more positive the evaluation, the
higher the affective quality of school life. Each item of
the scale is worth "1 point" or "zero," with 1 point as
the score for a clearly positive evaluation of a school
100
experience. A scoring template is provided with the test,
but in this study, all scores were entered into a computer
program and scored using the scoring instructions for the
QSL.
Table 3 illustrates the sample size and year the QSL
was administered to participants in this research. The
size of the groups participating in the sample decreased
each year due to the nature of these students being at-
risk of dropping out of school. For example, in Cohort 1,
46 at-risk students took the QSL in the fall of Year 1 and
Year 2, but only 11 took the QSL in the fall of Year 3 .
CAKE survey
A questionnaire format was selected as the best way
to elicit information from the CAKE participants regarding
their perception of the mentor program. Prior to
constructing the questionnaire, research references were
consulted (Ary, Jacobs, & Razavieh, 1985; Campbell &
Stanley, 1963; Gay, 1987).
Given that this survey is a data collecting
instrument, care was taken in its construction, with
particular attention to its intended use in a concensus
survey. Gay (1987) noted,
In a census survey, an attempt is made to acquire data from each and every member of the population; a census survey is usually conducted when a population is relatively small and readily accessible. (p. 192)

Table 3
Overview of QSL Sample Sizes Within the Three Cohorts
I Year I Ye11r 2 Year 3
COHORTS II of yrs : not : at-risk ' ' at-risk II of yrs 1 at-risk # of yrs : not I I • I
in study ! at-risk ! in study ! at-risk ! m study ! ' ' ' total total total I I 1 mentor nn I I I mentor no I 1 mentor no I I I I I I I I I I mentor : : ! mentor I I mentor I I I I I
Cohort I Grade 9 Grade 10 Grade 11
• I year 125: 7• 3 4 I year 23l 5• 3 2 I year ' I I I -- I -- --I I I I I I
•• 2 years l 11i 46l 34 12 2 years l 71 l 46l 34 12 2 years i -- I -- --I I
••• 3 ycurs ! O! 11! II 0 3 years ! O! II i II 0 3 years i 11! II 0
I, 2, 3 I 196~ 641 48 16 I, 2, 3 I 94! 57! 43 14 I, 2, 3 ! II! 11 0
Cohort 2 Grade 10 Grade 11
I year 1ooi 10: 5 5 I year ' .,o' 1! 0 I ! I ·, I - ! ' 4?' II i 7 ' 4"' 11! 7 2 years ! -! 4 2 years ! -l 4
I, 2 I I
142! 21: 12 9 I, 2 I 62! I 12: 7 s Cohort 3 Grade 9 Grade 10
I year ' 225: .,,j 8 16 I year ' ' : - I l -- l -- --' oi "2' 16 6 2 years : 22i 6 2 years :
I - : I 16
I, 2 I 2251 43! 24 19 I, 2 I ,I
16 6 I I
I 22!
Example: • "I year" Jennies that these students tonk the QSL the first year, in Cohort I. •• "2 years" dc1lllles that these students look the QSL over a two-yl:ar period of lime and were either in the CAKE pro~ram or not assigned 11 menlur.
*** "3 years" denotes that these students were still in the CAKE program for three years.
..... 0 .....
102
This survey was a cross-sectional design as participants
were surveyed just once; the design provided a portrait of
things as they were at a single point on the continuum in
the CAKE program.
Initially, informal interviews were conducted with
the program initiators and the vice-principal of the high
school, to gather initial perceptions of the mentoring
process and the CAKE program. A questionnaire draft was
developed, comprised of questions gleaned from the
informal interviews, research on effective mentoring, and
the program design.
A pilot group consisting of three mentees and three
mentors was formed with the intent of gaining insight on
survey design and content. One survey was found to be
user friendly, and directions were clear for the mentor
group. Since many of the students were unclear as to what
the CAKE program was and what their involvement was
exactly, the mentee group felt that the survey should be
given orally instead of requiring written responses. Many
of the mentees were not told exactly why a staff member
had suddenly taken such an interest in them or were told
that they had a "mentor," but did not explain that it was
specifically called the CAKE program.
The final questionnaire was self-administered to the
mentors and orally given by the researcher to the mentees.

103
In both cases, care was taken to explain the purpose of
the questionnaire, including aims and the participants
involved. Participants were told that feedback would be
given at a staff meeting in an attempt to improve the CAKE
program. A booklet form was chosen for ease of handling
and readability. Page breaks were monitored so that the
respondent did not have to turn the pages to complete any
portions of the questions. The length of time estimated
to complete the questionnaire was 15 minutes. All
questionnaires were given directly back to the researcher
since most of the respondents could be found in the same
building. Those respondents who had moved were given a
self-addressed envelope with which to reply. The CAKE
surveys for mentors are in Appendix B and for mentees in
Appendix c.
Procedures
In the spring of Year o, counselors in three junior
high schools were given criteria by which they were to
identify students from the 8th grade who would be 9th
graders in the fall and were at risk of dropping out of
school within the next four years. These names were given
to the counselors at the high school. Students who were
on an IEP were deleted from this list due to the fact that
they were already receiving services. In the fall, 83

104
staff members volunteered to participate in a mentoring
program {CAKE). Each was given the name of a student at
risk and any known information surrounding the student's
circumstances that led to that student's 8th grade
counselor identifying him or her as at-risk. This group
of 9th graders became Cohort 1.
These volunteer staff mentors were given one-hour
inservice after school on the mentoring process, legal
issues, possibilities for activities, and possible times
to meet together. They were instructed to participate as
much as they felt comfortable. It was felt that, since
these staff members were volunteers, the extent of their
participation in the mentoring program should be up to
them. At the same time, a group of the staff volunteered
to oversee the program. This included one counselor and
three teachers.
In October of the first year of the mentor program, a
survey of student attitudes {QSL) was administered to all
9th and 10th graders in the school. These were to assess
the general climate of the school and were numbered with
the student's identification to be used as data in the
evaluation of the mentoring program. Also in October,
sophomores who were identified as at-risk were also
matched with mentors. These 10th graders then became
Cohort 2. During the year, staff was given a few
105
opportunities to get together and talk about the successes
as well as the frustrations they felt with their mentoring
experience. No additional inservice was given, and any
advice was given by other staff mentors through these
meetings.
The following year, the fall of Year 2, another group
of 9th graders identified as at-risk by their 8th grade
counselors were matched with mentors. These students
became Cohort 3. The staff was given the option of adding
a second mentee or simply staying with the first student
with which they had been matched in Year i. Sixty-three
staff members agreed to mentor another student from this
newest group of 9th graders. The QSL was given again to
all students in the freshman and sophomore classes, and
the students from Cohort 2 now in their junior year.
The students in all three cohorts who were matched
with a staff mentor became the treatment group (at-risk
with mentors) and the students who were identified as at
risk but not matched with mentors became the control group
(at-risk without mentors). This group of at-risk students
without mentors existed because there were more at-risk
students than staff members available to mentor them at
the beginning of Year 1. It is interesting to note that
approximately half of those students identified as at-risk
in Year 1 left school within the first four months,
106
leaving some mentors without mentees. Many waited until
Year 2 to pick up another at-risk student (see Table 1).
No special treatment was given to the group without
mentors except the monitoring of the same data collected
on the students with mentors. The QSL was given to
students remaining in Cohorts 1 and 3 in the fall of Year
3. No additional students were added since most of the
mentors felt they had their hands full with two students.
The number of mentors fell to 63 due to retirements,
teacher transfer, and dropping from the program. In
addition, the teacher primarily responsible for the
program retired in the spring of Year 3. The rest of the
staff had added additional responsibilities to their
teaching which took away from the mentor program.
This researcher systematically collected data on
attendance and GPA information through grade 12 for
Cohorts 1, 2, and 3. The attendance and GPA data was
gathered from records generated in the high school's
counseling office at the end of each semester. Social
studies teachers were given the QSL and asked to
administer the 20 minute surveys on a set date. Each
teacher told students the surveys were confidential and
would be scored to determine students' general
satisfaction in this high school. Students were
instructed to put thei= student number in the upper right
107
hand corner of the surveys in order to distinguish between
groups of students. (In this case, students identified as
at-risk and not at-risk, with mentors and without
mentors.} All surveys were returned to the researcher for
scoring.
The disadvantage to a longitudinal study is that the
samples tend to shrink in size as time goes by (see Table
3}. This was particularly true in this research because
of the nature of the subjects being at-risk. For this
reason, Cohorts 1, 2, and 3 were compared, using data on
attendance and GPA records from their 8th grade year, and
attitudes (as measured by the QSL} from the fall of their
9th grade year prior to any treatment, to determine if it
would be appropriate to merge all three cohorts to
increase the numbers for analysis purposes.
Baseline data were needed to see if the students were
equivalent as far as the types of data to be analyzed,
i.e., attendance, GPA, and attitudes toward school. For
at-risk students, attendance and GPA data from their 8th
grade records for Cohorts 1, 2, and 3 were compared
(Eighth grade GPA for Cohort 2 was unavailable}. For not
at-risk students, attendance and GPA data from the 9th
grade records of Cohorts 1, 2, and 3 were compared, since
district data was available and this group was not
affected by contamination of any treatment. The QSL
108
scores prior to treatment were also compared to see if the
students identified as at-risk were equivalent groups.
Overview of the Data
A summary of the schedule for data collection is
presented in Table 4. It shows the data collected in the
fall and spring of each year of the study, starting with
the baseline data collected in the spring of the year
prior to the beginning of the study.
In the fall of Year 4, a CAKE survey was given to all
83 mentors and a random sampling of mentees to gather
additional qualitative information on the assessment of
participants' opinions on the characteristics of this
mentoring program that were successful or detracted from
its success. This questionnaire was designed to gather
descriptive data. Likert-like scales were used to
describe respondents' perceptions of the CAKE program, its
value in helping at-risk students, factors concerning
placement of the mentee in the mentor's class, and time
available to mentor. Respondents were asked to respond to
questions concerning the match between expectations at the
outset of program participation and at the end of their
program activities. Nominal questions such as frequency
of contacts between the mentor and mentee were included.
Respondents were also asked to rank order program

109
attributes and program activities in terms of personal
value in the mentoring program. The final question was
open-ended to encourage free response.
Table 4
Overview of Data Collected from Year O through Year 5
Year 0 Year I
Cohon Fall Spring Fall Spring
I Grade 8 Grade 8 Grade 9 Grade 9 ~ ~ Group Group I
anendO I attend I GPAI. QSL-1 GPAI. GPA2 GPA2
2 Grade 9 Grade 9 Grade Grade Pre Pre 10 10
allendO Group Group I GPAI. I anendl GPA2 QSL-1 GPAI.
GPA2
J Grade 8 Grade 8 Pre ~
attendO GPAI. GPA2
Pre = Pn:tn:atment data Attend = attendance or days pl'l:scnt GPA = grades average 1st and 2nd semester QSL = Quality of School Life
Year 2
Fall Spring
Grade Grade 10 10 Group Group 2 2 ancnd2 QSL-2 GPAI.
GPA!
Grade Grade 11 II Group Group 2 2 anend2 QSL-2 GPA!.
GPA2
Grade 9 Grade 9 Group Group I I attend I QSL-1 GPA!.
GPA2
Year) Year 4
Fall Spring Fall Spring
Grade Grade Grade Grade 11 II 12 12 Group Group J - attend4 J attendJ GPAI. QSL-3 GPAI. GPA2
GPA2
Grade Grade - -12 12 Group Group J J ancndJ
GPAI. GPA2
Grade Grade Grade Grade 10 10 II II Group Group 2 Group Group J 2 allend2 J attendJ QSL-2 GPAI. GPA!.
GPA! GPA2
Data Analysis Procedures
Year 5
Fall Spring
- -
- -
Grade Grade I! 12 Group Group 4 4 attend4
GPAI. GPA2
Various analyses were planned, using the statistical
treatments most suitable for the data collected.
The questions presented in this chapter were tested
by use of the ~-test, chi-square, analysis of variance,
and analysis of covariance. In addition, frequency tables

110
and other graphic representations were used in reporting
data. These were chosen for the following:
The t-test is used to see if there is a significant
difference between the means of two groups. The chi
square test compares frequencies of occurrences within
groups to see if one condition occurs more often in one
group than in another. Analysis of variance (ANOVA) looks
for variance within and between groups to ascertain if
there is more variance between two or more means at a
selected probability level than is attributable to chance.
For the purpose of this study, the researcher is comparing
the means of two groups of at-risk students with an intent
to examine their similarities or differences. Analysis of
covariance (ANCOVA) is a statistical method for equating
groups on one or more variables and for increasing the
power of a statistical test (Gay, 1987, p. 541). Tukey's
test was used for post hoc mean comparisons when comparing
three groups that were reported as significant. However,
since the sampling distribution with a covariate differs
from the studentized range statistic used for one-way
analysis comparisons, the generalized studentized range
distribution was used and the Bryant-Paulson procedure
followed (see Appendix E).
Concerning the qualitative analysis for the questions
with written responses, the researcher recognizes there

111
are several methods from which to choose. Patton (1990)
suggests that insight, creativity, and experience will
play a major role when choosing a particular methodology
to describe and analyze data, and that applying both
quantitative and qualitative methods to a particular
research question may be appropriate. Qualitative
analysis has emerged as an important and essential means
of research and program evaluation in many fields,
including education.
It is the researcher's belief that all methodologies
have limitations and that in conjunction, appropriate
quantitative and qualitative methodology may be a powerful
approach to research. Both methodologies were used in
this research project to determine the effectiveness of
this mentoring program.
The following questions were formulated to evaluate
the staff mentor program:
1. Are there significant differences on the
subscales and total scale of the Quality of
School Life Scales (QSL), attendance rates, and
GPA between students identified as at-risk and
students not at risk?
2. Are there significant differences on the
subscales and total scale of the Quality of
School Life Scales (QSL), attendance rates, and
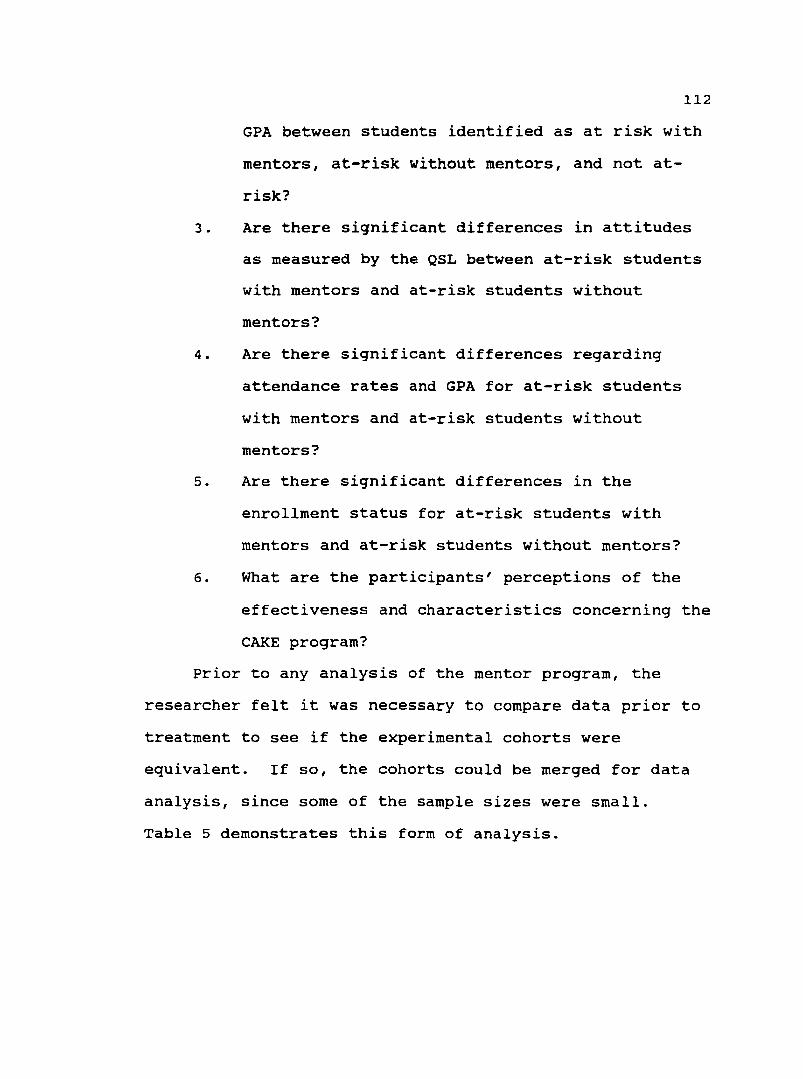
112
GPA between students identified as at risk with
mentors, at-risk without mentors, and not at
risk?
3. Are there significant differences in attitudes
as measured by the QSL between at-risk students
with mentors and at-risk students without
mentors?
4. Are there significant differences regarding
attendance rates and GPA for at-risk students
with mentors and at-risk students without
mentors?
5. Are there significant differences in the
enrollment status for at-risk students with
mentors and at-risk students without mentors?
6. What are the participants' perceptions of the
effectiveness and characteristics concerning the
CAKE program?
Prior to any analysis of the mentor program, the
researcher felt it was necessary to compare data prior to
treatment to see if the experimental cohorts were
equivalent. If so, the cohorts could be merged for data
analysis, since some of the sample sizes were small.
Table 5 demonstrates this form of analysis.
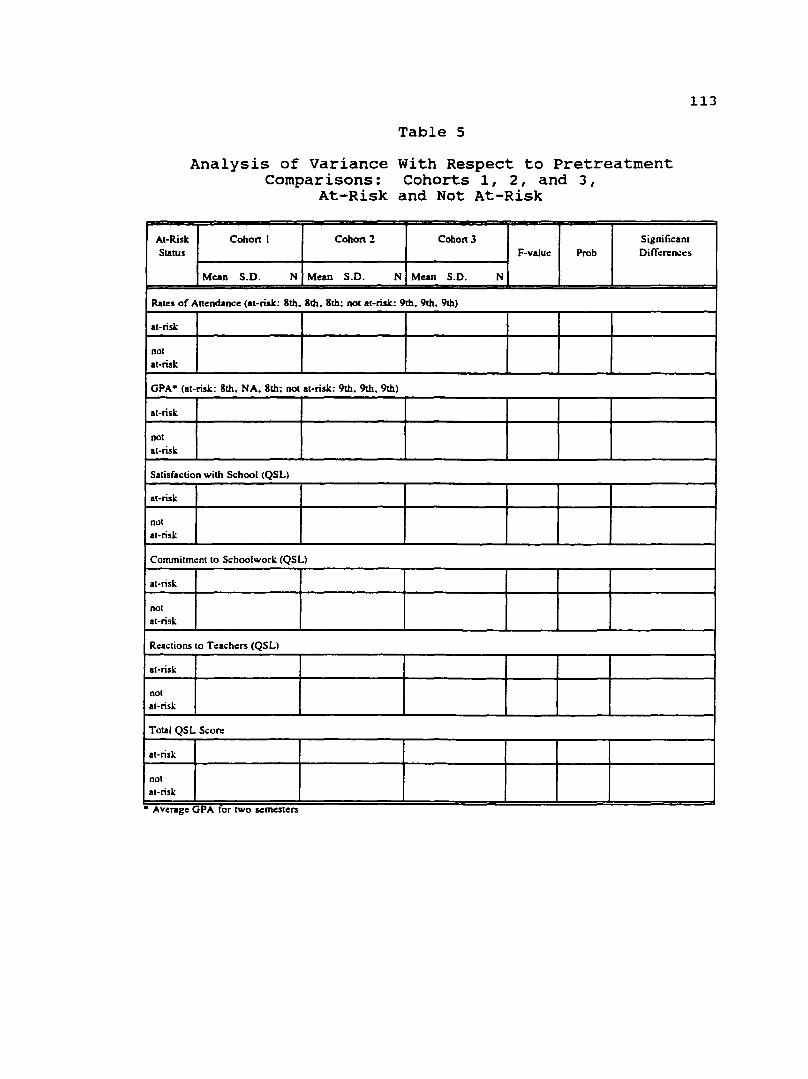
At-Risk
Analysis of Variance Comparisons:
At-Risk
Cohort I Cohort 2
Table 5
With Respect to Pretreatment Cohorts 1, 2, and 3,
and Not At-Risk
Cohort 3 Significant
113
Status F-value Prob Di ffen:n.:es
Mean S.D. N Mean S.D. N Mean S.D. N
Rates of Anendance (at-risk: 8th. 8th, 8th; not at-risk: 9th. 9th. 9th)
at-risk
not at-risk
GPA• (at-risk: 8th. NA. 8th: not at-risk: 9th. 9th, 9th)
at-risk
not at-risk
Satisfaction with School (QSL)
at-risk
not at-risk
Commitment to Schoolwork (QSL)
at-risk
not at-risk
Reactions to Teachers (QSLl
at-risk
not at-risk
Total QSL Scon:
at-risk
not at-risk
• Average GPA tor two scmc:stcrs

114
Question 1. Are there significant differences on the
subscales and total scale of the Quality of School Life
Scales (QSL), attendance rates, and GPA between students
identified as at-risk and not at-risk?
In order to establish a framework from which to have
an understanding of the possible effects of any program on
a student population, it is necessary to identify how the
subgroups differ and are alike. For purposes of this
evaluation, the student population given the QSL is
divided into those identified as at-risk, and those not
at-risk. Students from both groups were given the QSL in
the fall of the 9th grade year in high school, and again
in the fall of their 10th grade year for Cohorts 1 and 3.
For Cohort 2, the QSL was given the fall of their 10th
grade year, and again in the 11th grade. In addition,
attendance and GPA data was compared from Pretreatment to
Year 1 (Pretreatment data for Cohorts 1 and 3 are from 8th
grade records and for Cohort 2, from 9th grade records).
The models for these analyses are shown in Tables 6
through 8.
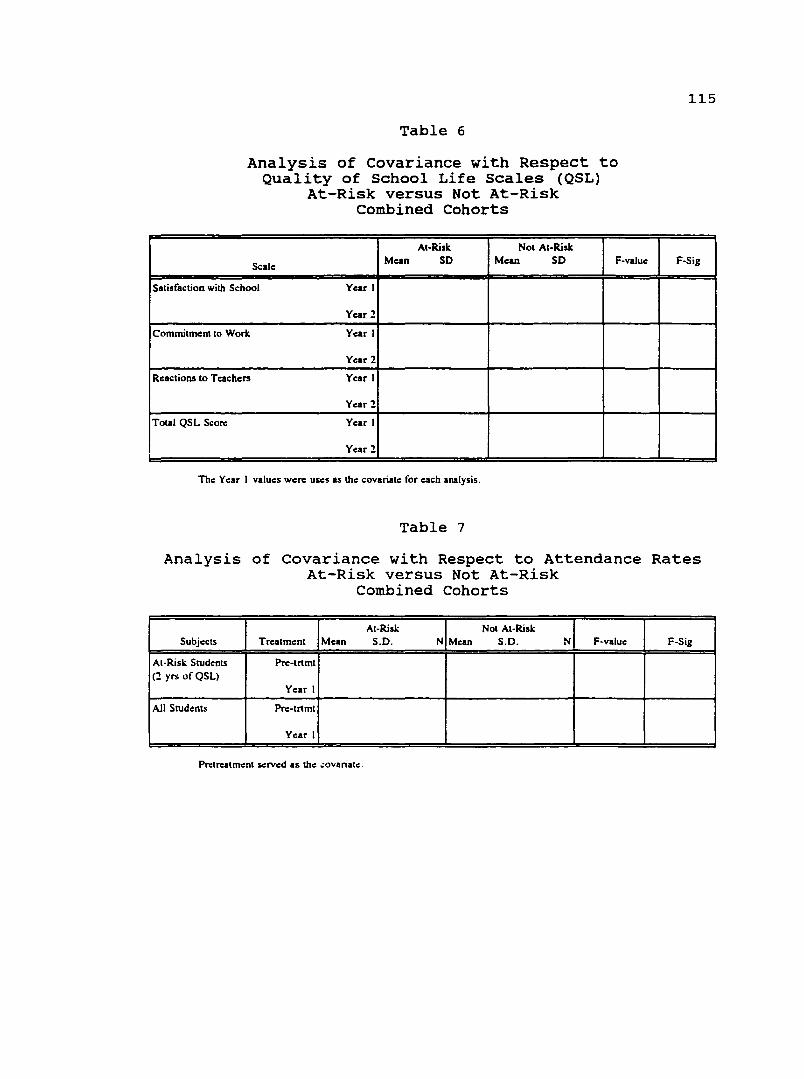
Table 6
Analysis of Covariance with Respect to Quality of School Life Scales (QSL)
At-Risk versus Not At-Risk Combined Cohorts
Al-Risk Not Al-Risk
Scale Mean SD Mean SD F-value
Salisfaclion wilh School Year I
Year 2
Commiunenl 10 Work Year I
Year 2
Reactions to Teachers Year I
Year2
Total QSL Score Year I
Year 2
The Year I values were uses as the covariale for each analysis.
Table 7
115
F-Sig
Analysis of Covariance with Respect to Attendance Rates At-Risk versus Not At-Risk
Combined Cohorts
Al-Risi.: Not At-Risk Subjects Treatment Mean S.D. N Mean S.D. N F-value F-Sig
Al-Risi.: Students Pre-trtml (2 yrs of QSL)
Year I
All Srudcnts Pre-trtml
Year I
Pn:tn::atmcnt served as the .;ovariatc.
116
Table 8
Analysis of Covariance with Respect to Average Annual GPA At-Risk versus Not At-Risk
Combined Cohorts
Al-Risk Not Al-Risk Subjects Tn:a1mcn1 Man S.D. N Mean S.D. N F-value F-Sig
Al-Risk Students Prc-1nm1 (2 yrs of QSL)
Year I
All Students Prc-lr1mt
Year I
Prc1n:a1ment served as lhe covariate.
Question 2. Are there significant differences on the
subscales and total scale of the Quality of School Life
scales (QSL), attendance rates, and GPA between students
identified as at-risk with mentors, at-risk without
mentors and not at-risk?
Table 9 models an analysis of at-risk students with
mentors, at-risk without mentors, and not at-risk in the
QSL, and Table 10 models this same analysis for attendance
and GPA.
Question 3. Are there significant differences in
attitudes as measured by the QSL between at-risk students
with mentors and at-risk students without mentors?
This analysis used an analysis of covariance which
takes into consideration where each student started. The
dependent variable= SAT 2 (Year 2), independent variable
=mentor, covariate= SAT 1 (Year 1). This procedure was

117
followed for the other two scales and the total score on
the QSL. Table 11 models an analysis of covariance with
respect to the QSL for at-risk students with and without
mentors. Table 9
Analysis of Covariance with Respect to Quality of School Life Scales; At-Risk With Mentors, At-Risk
Without Mentors, and Not At-Risk Combined Cohorts
T..,........ Al·Rlsk: ll4cmor Al·Riot: Sex Al·Riak SicJWIQlll
Year No Mcmor Diffcmxiea
Mem S.D. N Man S.D. N Man S.D. N F·vaiu< F.Si,
Satisfl!Ction .... th School
Year I I Year: I I Ccmmiancnt to Scboohoorlt
y.,.,.1
Year:
Rcactiam IO T Cll<hon
Year I
Ycu :
To&aJ OSLSam:
y.,.,.1
Ye.at:
Table 10
Analysis of Covariance with Respect to Attendance Rates for Students At-Risk With Mentors, At-Risk Without
Mentors, and Not At-Risk
Tn:atmmt Year
Prc:-uum
Year I
GPA
PnHnrN
Year I
At·Risk: Mentor
!I.I"" S.D.
Combined Cohorts
At·Risk: Sex At·Risk So Mcnlor
N Mean S.0. N Mean S.0. Sf.,~ F·Si,
Sipufic:anr OiffcrcftCCll

118
Table 11
Analysis of covariance with Respect to the Quality of School Life Questionnaire for At-Risk Students With and Without Mentors -- Year 1 to Year 2,
Cohorts 1, 2, 3
Mentor No Mentor
Scale Year Mean s.o. N Mean S.D. N F-value Prob
SAT Year l
Year2
COM Year 1
Year2
TCH Year I
Year 2
Total Year I QSL
Year 2
Question 4. Are there significant differences
regarding attendance rates and GPAs for at-risk students
with mentors and at-risk students without men~ors? Table
12 models an analysis of at-risk students with mentors
versus at-risk students without mentors regarding
attendance rates for Cohorts 1 and 3. Table 13 models the
same analysis for GPAs. Data from Cohort 2 was excluded
for this analysis due to the maturity factor, and can be
found in the Appendices.
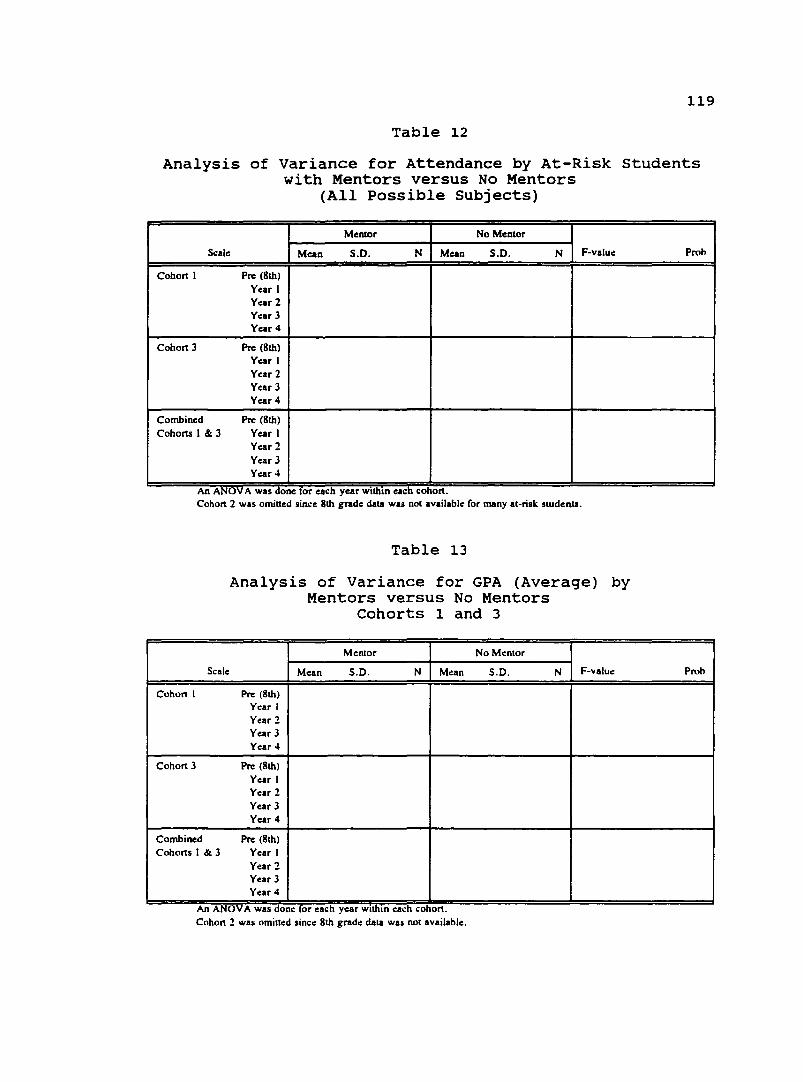
119
Table 12
Analysis of Variance for Attendance by At-Risk Students with Mentors versus No Mentors
(All Possible Subjects)
Mentor No Mentor
S.:ale Mean S.D. N Mean S.D. N F-value
Cohort I Pre (8th) Year I Year 2 Year 3 Year4
Cohort 3 Pre (8th) Year I Year 2 Year 3 Year 4
Combined Pre (8th) Cohorts I & 3 Year I
Year 2 Year 3 Year 4
An ANOV A was done for each year wuhm each cohort. Cohort 2 was omitted since 8th grade dala was nol available for many at-risk students.
Scale
Cohort 1
Cohort 3
Combined Cohorts I & 3
Table 13
Analysis of Variance for GPA (Average) by Mentors versus No Mentors
Cohorts 1 and 3
Mcnior No Menlor
Mean S.D. N Mean S.D. N F-valuc:
Pre (8th) Year 1 Year 2 Year 3 Year 4
Pre (8th) Year 1 Year 2 Year 3 Year4
Pre (8th) Year 1 Year 2 Year 3 Year 4
An ANOv A was done lor each year w1uun each cohort. Cohort 2 was omiued since 8th grade dala was nol available.
Prob
Prob
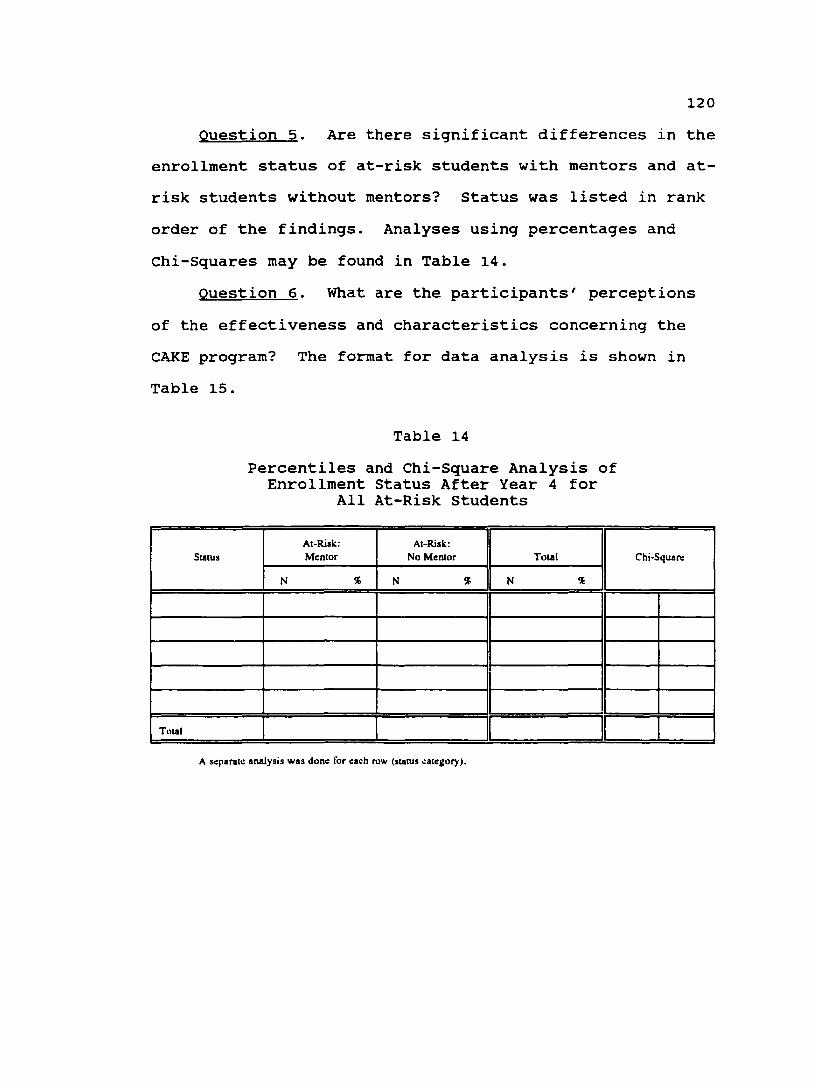
120
Question 5. Are there significant differences in the
enrollment status of at-risk students with mentors and at-
risk students without mentors? Status was listed in rank
order of the findings. Analyses using percentages and
Chi-Squares may be found in Table 14.
Question 6. What are the participants' perceptions
of the effectiveness and characteristics concerning the
CAKE program? The format for data analysis is shown in
Table 15.
Status
Total
Table 14
Percentiles and Chi-Square Analysis of Enrollment Status After Year 4 for
All At-Risk students
At-Risk: At-Risk: Mentor No Mentor Total
N '{, N '{, N '{,
A scpara1.: analysis was dom: for each row (stalus .:a1cgory).
Chi-Square

Table 15
Selected Survey Questions: Comparisons Between Mentor and Mentee Responses
Menton (Staff) Mentees (Siudents)
Question N ~ valid N 'k ~
Questiom 2. J. s. 6. 7
agreclsatisticd (1-2)
neutral (3)
disagn:eldissatisticd (4-S)
missing
Questions 1. 4. 8. 16. 17, 20
yes (1-2)
neutral (3)
no (4-S)
missing
Questioo IO
mentor
mcntce
both
missing
121
valid ~

CHAPTER IV
RESULTS
Chapter IV contains the description of the
investigative results of the six questions outlined in
Chapter III. Pretreatment comparisons were conducted with
analysis of variance. Questions 1 through 4 were
conducted with the use of a t-test, an analysis of
variance, and an analysis of covariance. Question 5 was
conducted with a chi-square analysis and Question 6 used
percentages. The results of these tests may be seen in
Tables 16 through 39.
The pages comprising the remainder of this chapter
present the statistical analyses with respect to Questions
1 through 6. A brief discussion preceeds each table. A
few students chose to write comments on the back of the
QSL. Examples of these comments are included following
Question 6.
Pretreatment Analyses
The lack of significant differences found among
cohorts 1, 2, and 3 strengthened the ability to combine
students from all three cohorts to increase the sample
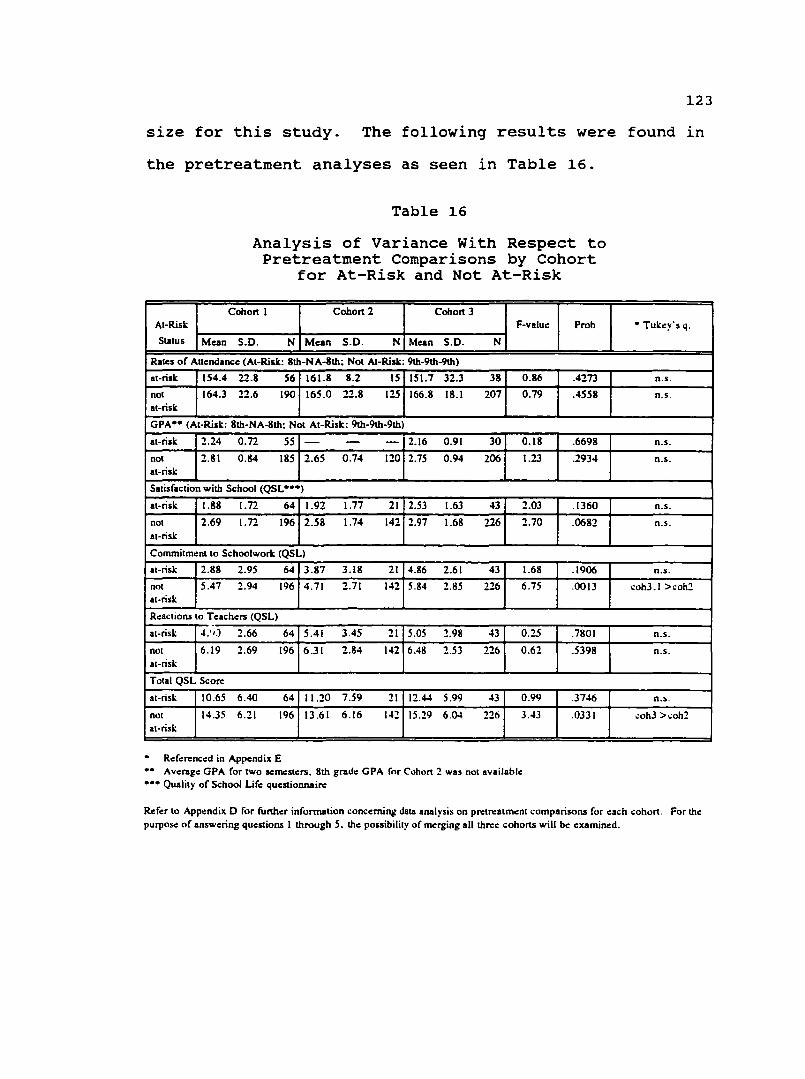
123
size for this study. The following results were found in
the pretreatment analyses as seen in Table 16.
Table 16
Analysis of Variance With Respect to Pretreatment Comparisons by Cohort
for At-Risk and Not At-Risk
Cohort I Cohort 2 Cohort 3 At-Risk F-valui:
Status Mean s.o. N Mean s.o. N Mean s.o. N
Rates of Attendance (At-Ri5k: 8th-NA-8th; Not At-Risk: 9th-9th-9th)
at-risk 154.4 22.8 56 161.8 8.2 15 151.7 32.J 38 0.86
not 164.3 22.6 190 165.0 22.8 125 166.8 18.1 207 0.79 at-risk
GPA .. (At-Risk: 8th-NA-8th; Not At-Risk: 9th-9th-9th)
at-risk 2.24 0.72 55 - - - 2.16 0.91 JO 0.18
not 2.81 0.84 185 2.65 0.74 120 2.75 0.94 206 1.23 at-risk
Satisfaction with School (QSL•••j
at-risk 1.88 1.72 64 1.92 i.n 21 2.53 1.63 43 2.03
not 2.69 1.72 196 2.58 1.74 142 2.97 1.68 226 2.70 at-risk
Commitment to Schoolwork (QSL)
at-risk 2.88 2.95 64 3.87 3.18 21 4.86 2.61 43 1.68
not 5.47 2.94 196 4.71 2.71 142 5.84 2.85 226 6.75 at-risk
Ro:actions to Teacho:rs (QSL)
at-risk 4.'•J 2.66 64 5.41 3.45 11 5.05 2.98 43 0.25
not 6.19 2.69 196 6.31 2.84 142 6.48 2.53 226 0.62 at-risk
Total QSL Score
at-risk 10.65 6.40 64 11.20 7.59 21 12.44 5.99 43 0.99
not 14.35 6.11 196 13.61 6.16 141 15.29 6.04 226 3.43 at-risk
Ro:fo:rcnco:d in Appendix E •• Avo:rage GPA for two semesters. 8th grado: GPA for Cohort 2 was not availablo: ••• Quality of School Life questionnaire
Prob
.4273
.4558
.6698
.2934
.1360
.0682
.1906
.0013
.7801
.5398
.3746
.0331
• Tuki:y"s q.
n.s.
n.s.
n.s.
n.s.
n.s.
n.s.
n.s.
coh3. I >coh1
n.s.
n.s.
n.s.
.:ohJ >.:oh2
Refer to Appo:ndix D for furtho:r infonnation concerning data analysis on pn:tn:atment comparisons for each cohort. For the: purpo~ of answering questions I through 5. the possibility of merging all thn:e cohorts will be examined.
124
Pretreatment
1. Pretreatment comparison of attendance using
analysis of variance revealed no significant difference
between Cohorts 1, 2, and 3 for students identified as at
risk.
2. Pretreatment comparison of attendance using the
analysis of variance revealed no significant difference
between Cohorts 1, 2, and 3 for students identified as not
at-risk.
3. Pretreatment comparison of GPA from 8th grade
data using analyses of variance revealed no significant
difference between Cohorts 1 and 3 for students identified
as at-risk. (GPA data for Cohort 2 were not retained by
the school district as students exited the 8th grade
during the year this information was requested.) When GPA
data from the 9th grade was used in this comparison, there
was no significant difference (see Appendix D).
4. Pretreatment comparison of GPA using analyses of
variance revealed no significant difference between
Cohorts 1, 2, and 3 for students identified as not at-
risk. (The 9th grade year was selected when GPA data were
available for this group since treatment was not an
issue.)
5. Pretreatment comparisons of the Quality of
School Life Questionnaire revealed no significant

125
difference between Cohorts 1, 2, and 3 for at-risk
students, but revealed a difference between Cohorts 1 and
3 when compared to Cohort 2 for not at-risk students. Two
variables could account for these differences. First, the
"Ns" are much larger for not at-risk students, decreasing
the difference needed for tests of significance, and these
students were one year older than those in Cohorts 1 and
3. If the scores are analyzed from a practical point of
view, there is very little difference between the actual
scores of all three cohorts.
The small differences found between the three
cohorts, as well as the use of analysis of covariance,
supported combining cohorts for further data analysis in
this research.
Question 1. Comparison of At-Risk and Not At-Risk Students
The first research question examined differences
between at-risk and not at-risk students on selected
variables. The question was: Are there significant
differences on the subscales and total scale of the
Quality of School Life Scales (QSL), attendance rates, and
GPA between students identified as at-risk and students
not at risk?
In order to determine if there was a difference
initially between students at-risk and students not at-
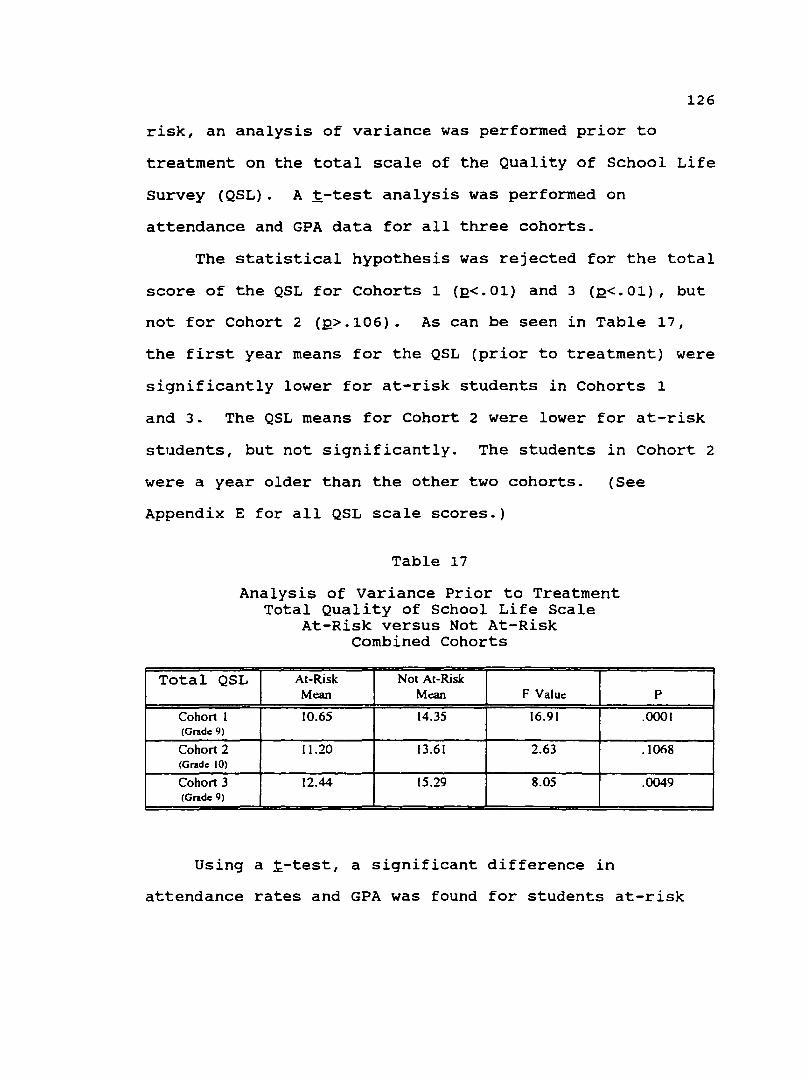
126
risk, an analysis of variance was performed prior to
treatment on the total scale of the Quality of School Life
survey (QSL). At-test analysis was performed on
attendance and GPA data for all three cohorts.
The statistical hypothesis was rejected for the total
score of the QSL for Cohorts 1 (R<.01) and 3 (R<.01), but
not for Cohort 2 (R>.106). As can be seen in Table 17,
the first year means for the QSL (prior to treatment) were
significantly lower for at-risk students in Cohorts 1
and J. The QSL means for Cohort 2 were lower for at-risk
students, but not significantly. The students in Cohort 2
were a year older than the other two cohorts. (See
Appendix E for all QSL scale scores.)
Table 17
Analysis of variance Prior to Treatment Total Quality of School Life Scale
At-Risk versus Not At-Risk combined Cohorts
Total QSL At-Risk Not At-Risk Mean M~ F Valui::
Cohort l 10.65 14.35 16.91 (Grade 9)
Cohort 2 11.20 13.61 2.63 (Grade 10)
Cohort 3 12.44 15.29 8.05 (Grade 9)
Using a t-test, a significant difference in
p
.0001
.1068
.0049
attendance rates and GPA was found for students at-risk

127
and not at-risk. The statistical hypothesis was rejected
for attendance rates in Cohort 1 (R<.01), Cohort 2
{R<.05), and Cohort 3 (R<.01). As can be seen on Table
18, the attendance rates prior to treatment for the
students at-risk was significantly lower than those not
at-risk (in all three cohorts). The statistical
hypothesis was also rejected for GPA in Cohort 1 (R<.01),
cohort 2 (R<.01), and Cohort 3 (R<.01). Prior to
treatment, the GPA means for all three cohorts was
significantly lower for students at-risk when compared to
students not at-risk. These analyses established an
initial difference prior to treatment between the at-risk
and not at-risk groups studied.

128
Table 18
T-test Analysis Prior to Treatment on Attendance and GPA At-Risk versus Not At-Risk
Combined Cohorts
At-Risk Not At-Risk Cohort Mean Mean t-Value p
Attendance
Cohort 1 156.5 170.2 5.22 .001 (Grade 8)
Cohort 2 145.9 165.3 2.56 .018 (Grade 9)
Cohort 3 156.2 173.5 4.92 .001 (Grade 8)
GPA
Cohort 1 2.25 3.05 6.91 .001 (Grade 8)
Cohort 2 1.42 2.68 5.96 .001 (Grade 9)
Cohort 3 2.16 2.97 5.44 .001 (Grade 8)
The Quality of School Life Scales
An analysis of covariance was performed separately on
each of the scales and the total scale of the Quality of
School Life Survey (QSL), using the scale scores of the
first year as the covariate and the corresponding scale
scores of the second year as the dependent variable. The
levels of the independent variable were: (a) the combined
cohorts (1, 2, and 3) of at-risk students and (b) the
combined cohorts (1, 2, and 3) of the not at-risk
students. The statistical hypotheses were rejected for
Commitment to Work (R<.01), Reaction to Teachers (R<.01),

129
and Total QSL (R<.01); it was not rejected for
satisfaction with the School (R>.32).
As can be seen in Table 19, the first year means on
all scales were less for the at-risk students than for the
not at-risk students. However, with the exception of the
satisfaction with School scale, the second year means were
higher for at-risk students than for the not at-risk
students. When the adjusted means are examined, the
differences were even greater: (a) on Commitment to Work,
6.1 for at-risk and 4.6 for not at-risk; (b) on Reaction
to Teachers, 7.2 for at-risk and 6.2 for not at-risk; and
(c) on the Total QSL scale, 16.3 for at-risk and 13.4 for
not at-risk.
QSL Scale
Table 19
Analysis of Covariance with Respect to Quality of School Life Scales (QSL)
At-Risk versus Not At-Risk Combined Cohorts
•At-Risk CN=90) •• Not At-Risk (N=ll3) Treatment
Year Mean (Adj. s.o. Mean !Adj. s.o. F-value Mean)
Satisfa.:tion with School Year I :!.15 1.71 2.77
Year 2 2.76 (2.93) 1.90 2.83
Commitment to Work Year I 4.38 2.88 5.36
Year 2 5.76 (6.05) 3.47 4.86
Reactions to Teachers Year I 5.11 2.80 6.32
Year 2 6.93 (7.19) 3.00 6.41
Toial QSL Score Year I 11.64 6.37 12.45
Year 2 15.45 (16.32) 7.57 14.0Q
• Cohorts I. 2. 3 combined Students in study for at least two years/ Analysis of Variaru:e is in Appendix E
•• Cohorts I & 2 combined (no 2nd year QSL scon:s for Cohort 3 for not at-risk
Mean)
1.66
(2.70) 1.64 0.99
2.57
(4.62) 2.98 12.12
2.69
(6.20) 2.70 6.83
5.66
(13.39) 6.19 11.40
p
.322
.001
.QIO
.001
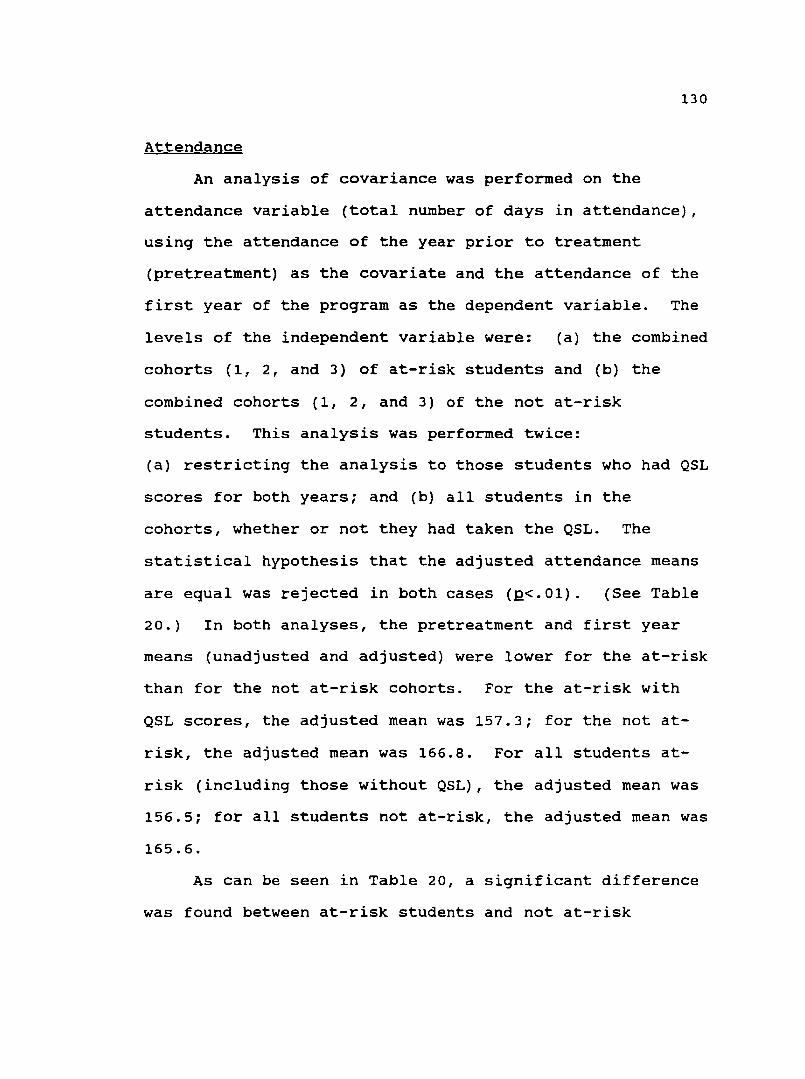
130
Attendance
An analysis of covariance was performed on the
attendance variable (total number of days in attendance),
using the attendance of the year prior to treatment
(pretreatment) as the covariate and the attendance of the
first year of the program as the dependent variable. The
levels of the independent variable were: (a) the combined
cohorts (1! 2, and 3) of at-risk students and (b) the
combined cohorts (1, 2, and 3) of the not at-risk
students. This analysis was performed twice:
(a) restricting the analysis to those students who had QSL
scores for both years; and (b) all students in the
cohorts, whether or not they had taken the QSL. The
statistical hypothesis that the adjusted attendance means
are equal was rejected in both cases (Q<.01). (See Table
20.) In both analyses, the pretreatment and first year
means (unadjusted and adjusted) were lower for the at-risk
than for the not at-risk cohorts. For the at-risk with
QSL scores, the adjusted mean was 157.3; for the not at
risk, the adjusted mean was 166.8. For all students at
risk (including those without QSL), the adjusted mean was
156.5; for all students not at-risk, the adjusted mean was
165.6.
As can be seen in Table 20, a significant difference
was found between at-risk students and not at-risk
131
students on attendance rates (2<.0l) as measured from
pretreatment data to post treatment data or Year 1.
Table 20
Analysis of covariance with Respect to Attendance Rates At-Risk versus Not At-Risk
Combined Cohorts
At-Risk Not Ai-Risk
Subj.:c11 Tn:atmenl Mean (Adj. s.o. N Mean (Adj. S.D. N F-valu.: p
Year Mean) Mean)
wilh QSL Pre-trlmt 154.9 24.1 80 169.7 13.6 90
Yearl 1:4.5 (157.3) 26.3 80 169.3 (166.8) 13.7 90 8.71 .004
all studenll Pre-trlmt 152.8 26.6 113 170.3 13.1 426
Year I 150.8 (156.5) 28.9 113 167.2 (165.6) 17.I 426 17.7 .001
Analysis of Variance is in Appendix E
Grade Point Average
An analysis of covariance was performed on GPA, using
the GPA of the year prior to treatment (pretreatment) as
the covariate and the GPA of the first year of the program
as the dependent variable. The levels of the independent
variable were: (a) the combined cohorts (1, 2, and 3) of
at-~isk students and (b) the combined cohorts (1, 2, and
3) of the not at-risk students. This analysis was
perforned twice: (a) restricting the analysis to those
students who had QSL scores for both years; and (b) all
students in the cohorts, whether or not they had taken the
QSL. The statistical hypothesis that the adjusted GPA
means are equal was rejected in both cases (2<.05 and
p<.01, respectively). In both analyses, the pretreatment

132
and first year means (unadjusted and adjusted) were lower
for the at-risk than for the not at-risk cohorts. For the
at-risk with QSL scores, the adjusted mean was 2.1; for
the not at-risk, the adjusted mean was 2.8. For all
students at-risk (without some QSL scores), the adjusted
mean was 2.4; for all students not at-risk, the adjusted
mean was 2.7.
As can be seen in Table 21, a significant difference
was found between at-risk students and not at-risk
students on their GPA rate (R>.05) as measured from
pretreatment data to post treatment data or Year 1.
Table 21
Analysis of Covariance with Respect to Average Annual GPA At-Risk versus Not At-Risk
Combined Cohorts
At-Risk Not At-Risk
Subjccls Treatment Mean (Adj. S.D. N Mean (Adj. s.o. N F-value p
Year Mean) Mean)
with QSL Prc-tnmt 2.25 0.83 68 2.84 0.65 89 4.46 .036
Year I 1.96 (2.07) 0.91 68 2.68 (2.47) 0.85 89
Prc-tnmt 2.13 0.81 96 2.91 0.73 423 22.1 .001
all students Year l 1.82 {2.35) 0.92 96 2.83 (2.71) 0.87 423
Analysis of Variance is in Appendix E
133
Question 2. Comparison of At-Risk Students with Mentors, At-Risk Students without Mentors,
and Not At-Risk students
The second research question examined differences
between at-risk students with and without mentors, and not
at-risk students on the same selected variables as in
Question 1, to ascertain if having a mentor lessened the
severity of being at-risk when compared to students not
at-risk. The question was: Are there any significant
differences on the subscales and total scale of the
Quality of School Life Scales (QSL), attendance rates, and
GPA between students identified as at-risk with mentors,
at-risk without mentors, and not at-risk?
The Quality of School Life Scales
An analysis of covariance was performed separately on
each of the scales and the total scale of the Quality of
School Life Survey (QSL), using the scale scores of the
first year as the covariate and the corresponding scale
scores of the second year as the dependent variable. The
levels of the independent variable of the combined cohorts
(1, 2, and 3) were: (a) at-risk students with mentors,
(b) at-risk students without mentors, and (c) not at-risk
students. The statistical hypotheses were rejected for
all four covariate analyses (R<.01).

134
As can be seen in Table 22, the first year means on
all scales were less for the at-risk students with and
without mentors than for the not at-risk students.
However, the second year means for all scales were higher
for at-risk students with a mentor, and lower for at-risk
students without a mentor and not at-risk students. When
adjusted means were examined, the differences were even
greater: (a) on Satisfaction with School, 3.2 for at-risk
with a mentor, 2.7 for not at-risk, and 2.1 for at-risk
without a mentor; (b) on Commitment to School Work, 6.6
for at-risk with a mentor, 4.6 for not at-risk, and 4.4
for at-risk without a mentor; (c) on Reactions to
Teachers, 7.7 for at-risk with a mentor, 6.2 for not at
risk, and 5.8 for at-risk without a mentor; and (d) on the
Total QSL scale, 17.7 for at-risk with a mentor, 13.4 for
not at-risk, and 12.3 for at-risk without a mentor.
Tukey's test for post hoc mean comparisons from this
analysis of covariance was performed separately on each of
the scales and the total QSL scale using the mean of Year
1 as the covariate and the corresponding adjusted mean of
Year 2 as the dependent variable. However, since the
sampling distribution with a covariate differs from the
studentized range statistic used for 1-way analysis
comparisons, the generalized range distribution was used
and the Bryant-Paulson procedure followed. (See
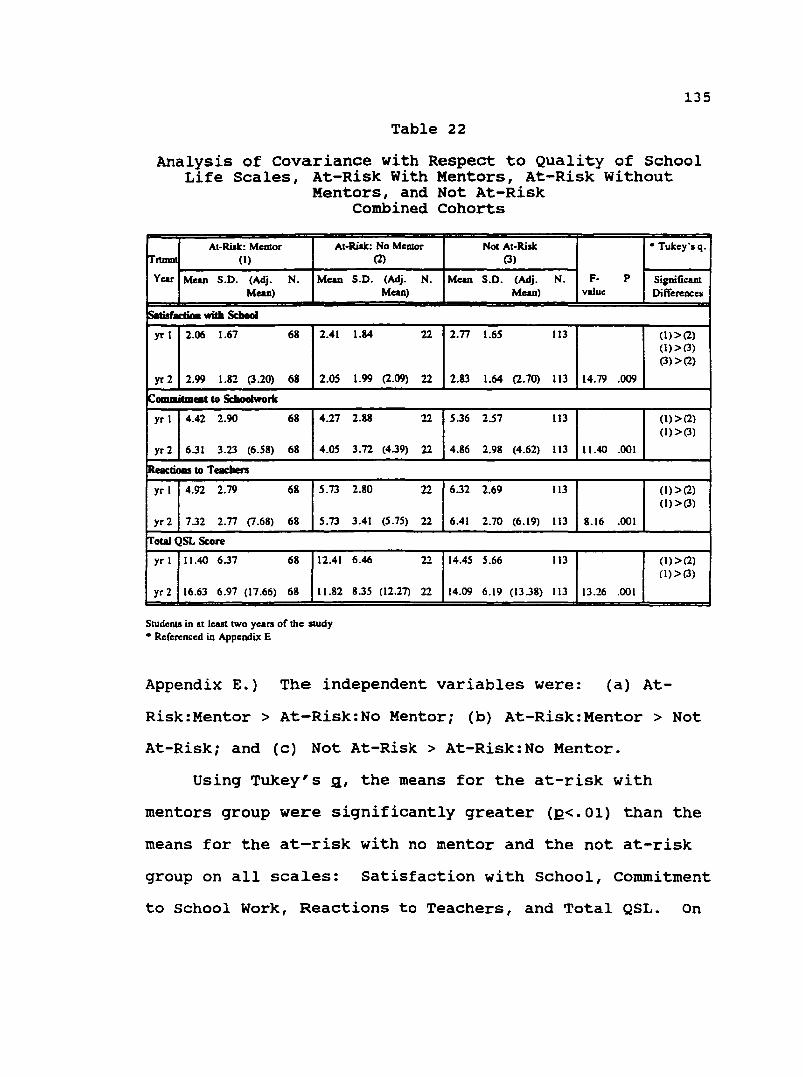
135
Table 22
Analysis of Covariance with Respect to Quality of School Life Scales, At-Risk With Mentors, At-Risk Without
Mentors, and Not At-Risk Combined Cohorts
At·Rislt: Mentor At·Rislt: No Mentor Not At-Risk rrnmn1 (1)
Year Mean S.D. (Adj. N. Mean Mean)
1Satisf8Ctioa witla Scbool
yr 1 2.06 1.67 68 2.41
yr 2 2.99 1.82 (3.20) 68 2.05
tommitmeat lo Sclaoolwork
yr 1 4.42 2.90 68 4.27
yr2 6.31 3.23 (6.58) 68 4.0S
Reactiou lo Teacbers
yr 1 4.92 2.79 68 5.73
yr2 7.32 2.77 (7.68) 68 5.73
Total QSL Score
yr I 11.40 6.37 68 12.41
yr 2 16.63 6.97 (17.66) 68 11.82
Students in at least two years of the study • Referenced in Appendix E
(2) (3)
S.D. (Adj. N. Mean S.D. (Adj. Mean) Mean)
1.84 22 2.77 1.65
1.99 (2.09) 22 2.83 1.64 (2.70)
2.88 22 S.36 2.57
3.72 (4.39) 22 4.86 2.98 (4.62)
2.80 22 6.32 2.69
3.41 (S.7S) 22 6.41 2.70 (6.19)
6.46 22 14.45 S.66
8.35 (12.27) 22 14.09 6.19 (13.38)
N.
113
113
113
113
113
113
113
113
Appendix E.) The independent variables were:
• Tukey'sq.
F- p Significant value Differences
(1)>(2) (l)>C3) (3) >(2)
14.79 .009
(I) >(2) (1)>(3)
11.40 .001
(1)>(2) (1)>(3}
8.16 .001
(1)>(2) (1)>{3)
13.26 .001
(a) At-
Risk:Mentor > At-Risk:No Mentor; (b) At-Risk:Mentor > Not
At-Risk; and (c) Not At-Risk > At-Risk:No Mentor.
Using Tukey's g, the means for the at-risk with
mentors group were significantly greater (R<.01) than the
means for the at-risk with no mentor and the not at-risk
group on all sca1es: Satisfaction with School, Commitment
to School Work, Reactions to Teachers, and Total QSL. On

136
the Satisfaction with School Scales, the mean for the not
at-risk group was significantly greater than the mean for
the at-risk group without a mentor.
As can be seen from the Tukey's g analyses and the
adjusted means, having a mentor lessened the severity of
being at-risk when compared to students not at-risk. For
all QSL scales, at-risk students with mentors scored
significantly higher than at-risk students without mentors
and higher than not at-risk students. With the exception
of Satisfaction with School scale, there was no
significant difference between how students scored who
were not at-risk and those at-risk without mentors.
Attendance
An analysis of covariance was performed on the
attendance variable (total number of days in attendance),
using the attendance of the year prior to treatment
(pretreatment) as the covariate and the attendance of the
first year of the program as the dependent variable. The
levels of the independent variable were: (a) the combined
cohorts (1, 2, and 3) of at-risk students with a mentor;
(b) the combined cohorts (1, 2, and 3) of at-risk students
without a mentor; and (c) the combined cohorts (1, 2, and
3) of not at-risk students. As can be seen in Table 23,
the pretreatment year attendance mean was lowest for at-
r isk students without mentors (146.8), next for at-risk

137
students with mentors (156.1), and highest for the not at-
risk students (170.3). The attendance for Year 1
deteriorated for the students at-risk without mentors
(139.9) and the not at-risk students (167.2), but remained
unchanged for the students at-risk with mentors (156.4).
As can be seen in Table 23, there was no significance
between any of these independent variables for attendance.
The variable of a student at-risk having a mentor did not
significantly increase (R>.09) the attendance rate when
compared to either those students not at-risk, or those
students at-risk without a mentor.
Table 23
Analysis of Covariance with Respect to Attendance Rates for Students At-Risk With Mentors, At-Risk Without
Mentors, and Not At-Risk Cohorts 1 and 3
At-Risk: Mentor At-Risk: No Mentor Not At-Risk Trtmnt {I) (2) (3)
Year Mean S.D. (Adj. N. Mean s.o. (Adj. N. Mean S.D. (Adj. N. F- p
Mean) Mean) Mean) value
pre 156.1 16.9 - 15 146.8 39.2 - 38 170.3 13.I - 426
yr I 156.4 23.6 (160.6) 15 139.9 35.6 (147.8) 38 167.2 17.1 (165.7) 426 4.79 .09
All possible students
An analysis of covariance was performed on GPA, using
the GPA of the year prior to treatment (pretreatment) as
the covariate and the GPA of the first year of the program
as the dependent variable. The levels of the independent
variable were: (a) the combined cohorts (1, 2, and 3) of
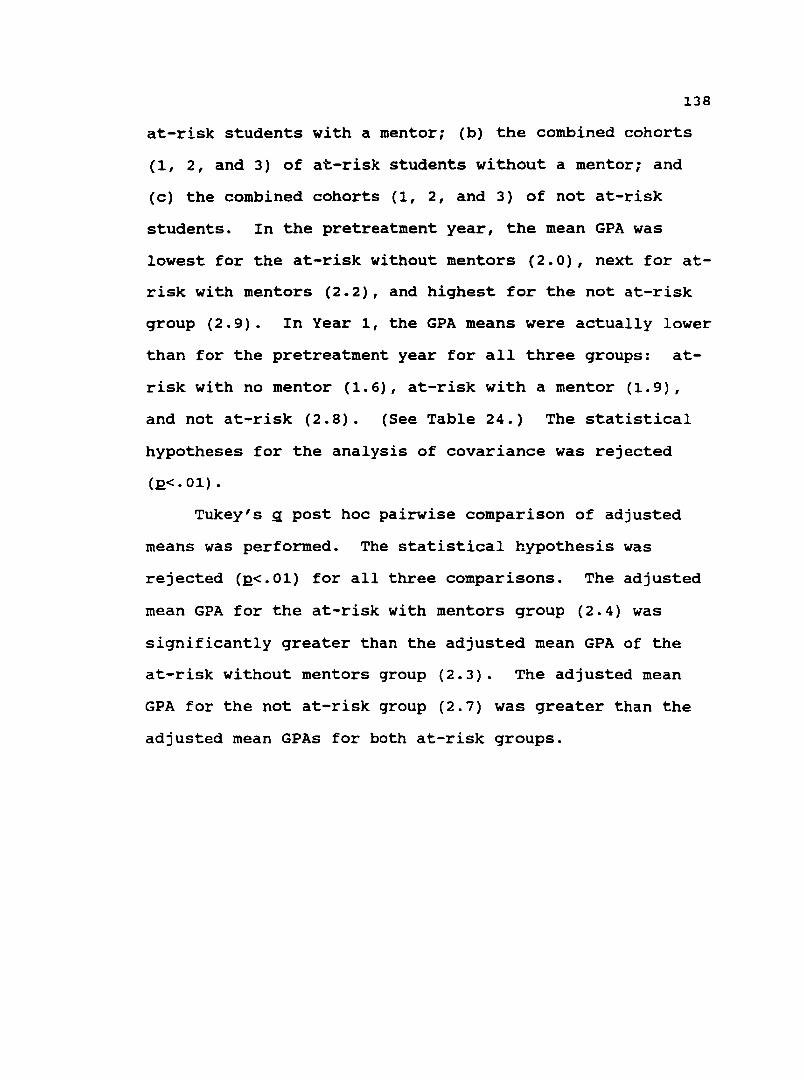
138
at-risk students with a mentor; (b) the combined cohorts
(1, 2, and 3) of at-risk students without a mentor; and
(c) the combined cohorts (1, 2, and 3) of not at-risk
students. In the pretreatment year, the mean GPA was
lowest for the at-risk without mentors (2.0), next for at
risk with mentors (2.2), and highest for the not at-risk
group (2.9). In Year 1, the GPA means were actually lower
than for the pretreatment year for all three groups: at
risk with no mentor (1.6), at-risk with a mentor (1.9),
and not at-risk (2.8). (See Table 24.) The statistical
hypotheses for the analysis of covariance was rejected
(R<. 01) .
Tukey's g post hoc pairwise comparison of adjusted
means was performed. The statistical hypothesis was
rejected (R<.01) for all three comparisons. The adjusted
mean GPA for the at-risk with mentors group (2.4) was
significantly greater than the adjusted mean GPA of the
at-risk without mentors group (2.3). The adjusted mean
GPA for the not at-risk group (2.7) was greater than the
adjusted mean GPAs for both at-risk groups.
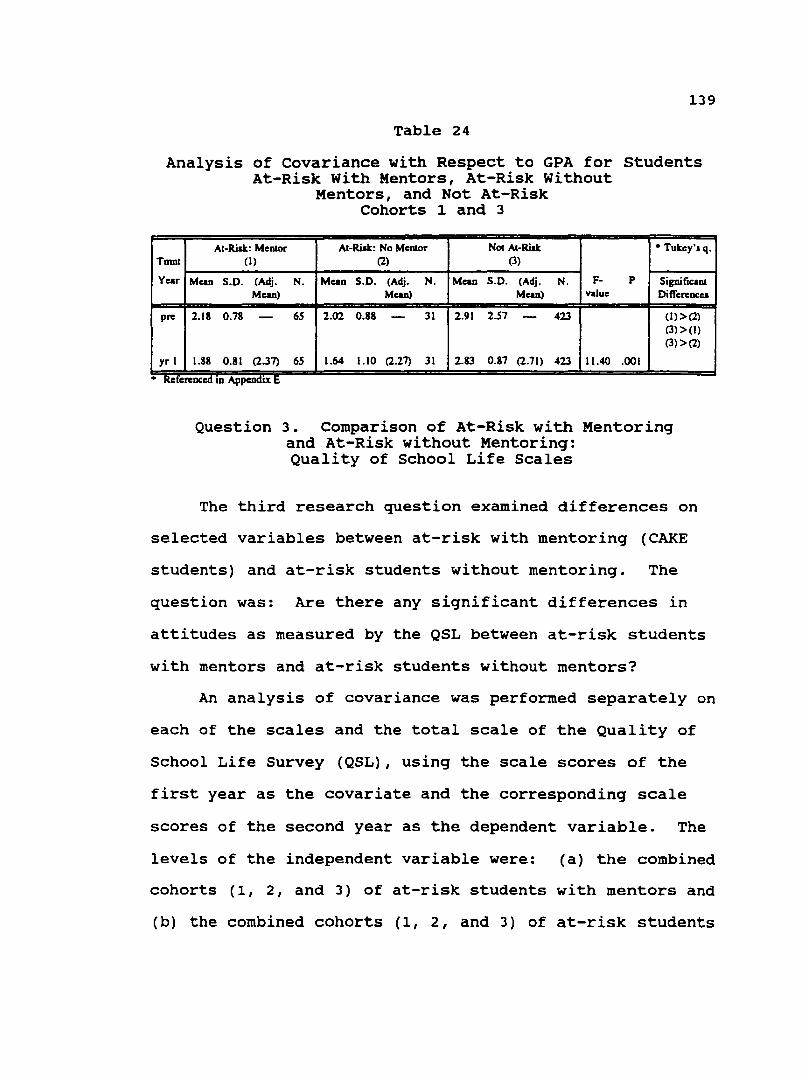
139
Table 24
Analysis of Covariance with Respect to GPA for Students At-Risk With Mentors, At-Risk Without
Mentors, and Not At-Risk Cohorts 1 and 3
At-Risk: Mentor Al-Risk: No Mentor Not At-Risk • Tultey'1 q. Tmnt (I) (2) (3)
Year Mean s.o. (Adj. N. Mean S.D. (Adj. N. Mean S.D. (Adj. N. F- p Significant Mean) Mean) Mean) value Differences
pre 2.18 0.78 - 65 2.02 0.88 - 31 2.91 2.57 - 423 (1)>(2) {3)>(1) {3)>(2)
yr I 1.88 0.81 (2.37) 65 l.64 I.IO (2.27) 31 2.83 0.87 (2.71) 423 11.40 .001
• Referenced 1n Appenaa E
Question 3. Comparison of At-Risk with Mentoring and At-Risk without Mentoring: Quality of School Life Scales
The third research question examined differences on
selected variables between at-risk with mentoring (CAKE
students) and at-risk students without mentoring. The
question was: Are there any significant differences in
attitudes as measured by the QSL between at-risk students
with mentors and at-risk students without mentors?
An analysis of covariance was performed separately on
each of the scales and the total scale of the Quality of
School Life Survey (QSL), using the scale scores of the
first year as the covariate and the corresponding scale
scores of the second year as the dependent variable. The
levels of the independent variable were: (a) the combined
cohorts (1, 2, and 3) of at-risk students with mentors and
(b) the combined cohorts (1, 2, and 3) of at-risk students

140
without mentors. The statistical hypotheses were rejected
for all dependent variables: Satisfaction with the School
(R<.01); commitment to Work (R<.01), Reaction to Teachers
(R<.01), and Total QSL (R<.01).
In contrast with the non-mentored student group, the
first year means of the mentored group of at-risk students
were less on Satisfaction with School, Reaction to
Teachers, and the Total QSL; the mean was greater on the
Commitment to Work scale. However, the second year means
on all scales (both unadjusted and adjusted) were higher
for at-risk with mentors than for the at-risk without
mentors. When the adjusted means were examined, the
differences tended to be greater: (a) on Satisfaction
with School, 3.0 for mentored students and 1.9 for non
mentored; (b) on Commitment to Work, 6.3 for mentored and
4.1 for non-mentored; (c) on Reactions to Teachers, 7.4
for the mentored group and 5.5 for non-mentored group; and
(d) on the Total QSL scale, 16.8 for the mentored group
and 11.5 for the non-mentored group. A significant
difference (R<.01) on the subscales and total scale of the
QSL was found using an analysis of covariance from Year 1
to Year 2 between at-risk students with mentors and at
risk students without mentors (see Table 25).

141
Table 25
Analysis of Covariance with Respect to the Quality of School Life Survey (QSL) for Students At-Risk:
Scale Treatment Mean Year
SAT Year I 2.06
Year 2 2.99
COM Year I 4.42
Year2 6.31
TCH Year I 4.92
Year 2 7.32
QSL Year I 11.40
Year 2 16.63
Mentor versus No Mentor Combined Cohorts
Meuror No Mealor
S.D. (Adj. N. Mean S.D. (Adj. Mean) Mean)
1.67 68 2.41 1.84
1.82 (3.03) 68 2.04 1.99 (1.92)
2.90 68 4.27 2.88
3.23 (6.30) 68 4.05 3.72 (4.10)
2.79 68 5.13 2.80
2.77 (7.39) 68 5.n 3.41 (5.50)
6.37 68 12.41 6.46
6.97 (16.75) 68 11.82 8.35 (11.45)
N. F-valu.: p
22
22 7.07 .009
22
22 8.17 .005
22
22 7.58 .007
22
22 10.45 .002
Question 4. Comparison of At-Risk with Mentoring and At-Risk without Mentoring: Attendance and GPA
The fourth research question examined differences on
selected variables between at-risk students with mentoring
(CAKE students) and at-risk students without mentoring.
The question was: Are there any significant differences
regarding attendance rates and GPA for at-risk students
with mentors and at-risk students without mentors?
Attendance
For each of the four years of the study, an analysis
of covariance for attendance was performed separately for
Cohorts 1, 3, and combined Cohorts 1 and 3, with data for
the 8th grade year or pretreatment as the covariate and

142
attendance data for the following year as the dependent
variable, beginning with Year 1. Thus, twelve separate
analyses were performed. (There was not sufficient
attendance data from 8th grade available for those
students in Cohort 2 to add to this analysis.) For each
analysis, the levels of the independent variable were:
(a) the at-risk students with mentors and (b) at-risk
students without mentors.
For both Cohort 1 and the combined Cohorts 1 and 3,
the statistical hypothesis that the attendance adjusted
means of the at-risk mentored group and the at-risk non
mentored group are equal was rejected for Year l; it was
also rejected for Cohort 1 in Year 2.
The attendance adjusted means for students with
mentors in Cohort 1 were significantly higher (R<.01) for
the first two years in the CAKE program (159 for Year 1
and 149 for Year 2) than the adjusted means for students
without mentors (138 for Year 1 and 103 for Year 2).
There were no significant differences between the adjusted
means for Years 3 and 4, with the adjusted means
continuing to fall for the mentored group (142 for Year 3
and 131 for Year 4), but increasing for the non-mentored
group (110 for Year 3 and 132 for Year 4). However, it
should be noted that the percentage of remaining students

143
was much higher for those students with mentors, 75% (Year
4), than for those without mentors, 25% (Year 4).
The attendance adjusted means for students with and
without mentors in Cohort 3 were not significantly
different (R>.09 and R>.39) for the first two years in the
CAKE program, unlike Cohort 1. At the end of the first
year, the adjusted mean for the mentored group was 158,
and the non-mentored group 146. The adjusted mean in Year
2 for the mentored group was lower (143) than the non
mentored group (157). Similar to Cohort 1, the
differences were also not significant for Years 2
through 4. The adjusted means for the mentored group was
lower (149 for Year 3 and 133 for Year 4) than the non
mentored group (155 for Year 3 and 149 for Year 4).
However, it should be noted that the percentage of
students remaining was much higher for those students with
mentors, 74.2% (Year 4), than those without mentors, 32.1%
(Year 4).
When examining the combined Cohorts 1 and 3, for Year
1, the attendance adjusted mean was significantly greater
(R<.01) for the at-risk students with mentors (159) than
the attendance adjusted means for at-risk students without
mentors (143); no significant difference was found for
Years 2, 3, and 4. Again, the adjusted means were lower
for the mentored group in Year 4 (132) than the non-
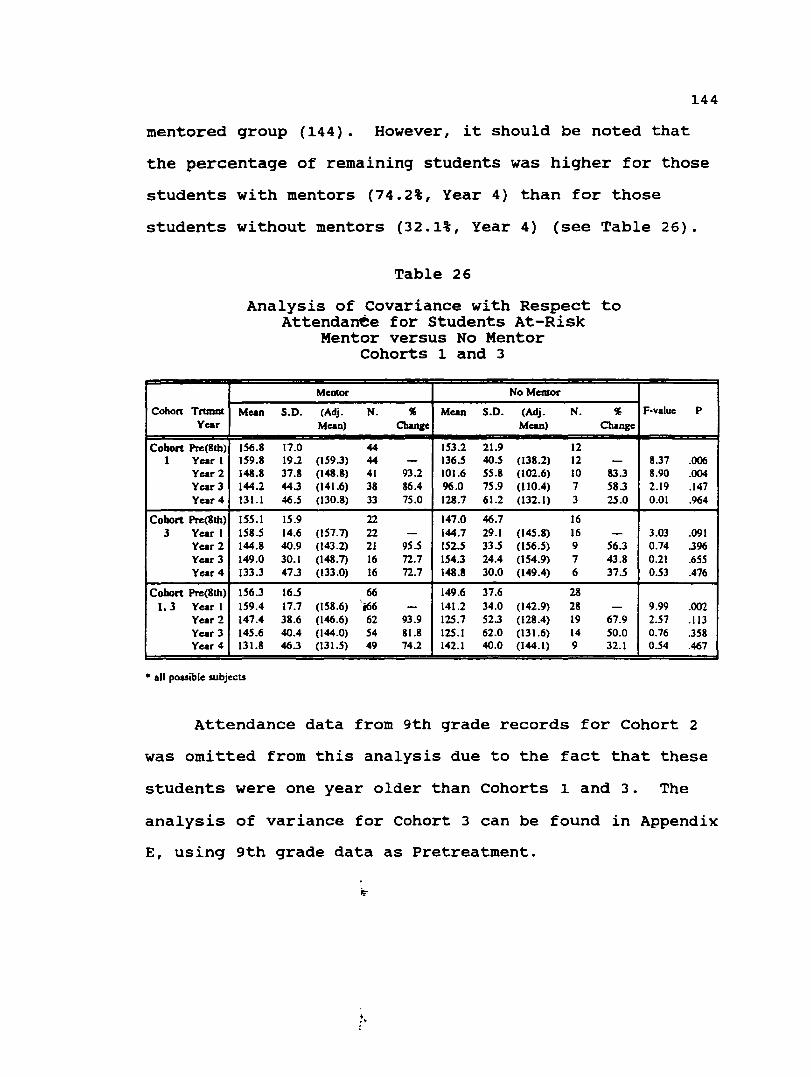
144
mentored group (144). However, it should be noted that
the percentage of remaining students was higher for those
students with mentors (74.2%, Year 4) than for those
students without mentors (32.1%, Year 4) (see Table 26).
Cohon Trtinnl Year
Cobort Pre(81h) 1 Year 1
Year 2 Year 3 Year4
Cobort Pre(81h) 3 Year 1
Year 2 Year 3 Year 4
Cobort Pre(81h) 1, 3 Year 1
Year 2 Year 3 Year 4
Table 26
Analysis of Covariance with Respect to Attendarree for Students At-Risk
Mentor versus No Mentor Cohorts 1 and 3
Mencor NoMemor
Mean S.D. (Adj. N. % Mean S.D. (Adj. N. % Mean) Chanae Mean) Change
156.8 17.0 44 153.2 21.9 12 159.8 19.2 (159.3) 44 - 136.5 40.5 (138.2) 12 -148.8 37.8 (148.8) 41 93.2 101.6 55.8 (102.6) 10 83.3 144.2 44.3 (141.6) 38 86.4 96.0 15.9 (110.4) 7 58.3 131.l 46.5 (130.8) 33 15.0 128.7 61.2 (132.1) 3 25.0
155.l 15.9 22 147.0 46.7 16 158.5 14.6 (157.7) 22 - 144.7 29.1 (145.8) 16 -144.8 40.9 (143.2) 21 95.S 152.S 33.S (156.5) 9 56.3 149.0 30.1 (148.7) 16 72.7 154.3 24.4 (154.9) 7 43.8 133.3 47.3 (133.0) 16 72.7 148.8 30.0 (149.4) 6 31.5
156.3 16.S 66 149.6 37.6 28 159.4 17.7 (158.6) i66 - 141.2 34.0 (142.9) 28 -147.4 38.6 (146.6) 62 93.9 125.7 52.3 (128.4) 19 67.9 145.6 40.4 (144.0) 54 81.8 125.1 62.0 (131.6) 14 50.0 131.8 46.3 (131.S) 49 74.2 142.1 40.0 (144.1) 9 32.1
• all poasible subjects
F-value p
8.37 .006 8.90 .004 2.19 .147 0.01 .964
3.03 .091 0.74 .396 0.21 .655 0.53 .476
9.99 .002 2.57 .113 0.76 .358 0.54 .467
Attendance data from 9th grade records for Cohort 2
was omitted from this analysis due to the fact that these
students were one year older than Cohorts 1 and 3. The
analysis of variance for Cohort 3 can be found in Appendix
E, using 9th grade data as Pretreatment.
145
For each of the four years of the study, an analysis
of covariance for GPA was performed separately for Cohort
1, Cohort 3, and combined Cohorts 1 and 3, using the GPA
from the 8th grade year (pretreatment) as the covariate
and the GPA of subsequent years, beginning with Year 1 as
the dependent variable. Thus, twelve separate analyses
were performed. (There was no GPA data available for
students in the 8th grade year for Cohort 2. Analysis
using 9th grade GPAs can be found in Appendix C.) For
each analysis, the levels of the independent variable
were: (1) at-risk students with mentors and (2) at-risk
students without mentors. With two exceptions, the
statistical hypothesis that the adjusted GPA means of at
risk students with and without mentors was not rejected
for all years and cohorts.
For Cohort 1, the statistical hypothesis for Year 1
was rejected (R<.05), with the adjusted mean for the at
risk group with mentors (1.9) being higher than the at
risk group without mentors (1.5). For Cohort 1, the GPA
means and adjusted means decreased during Year l and 2,
increased during Year 3, and for the mentored group only
increased during Year 4. For Cohort 3, the GPA means
dropped during Year 1, increased during Year 2 and 3, and

stabilized for the mentored group during Year 4, but
dropped for the non-mentored group. (See Table 27.)
146
A partial explanation for the tendency for GPA means
to increase in Years 3 and 4 can be found in the loss of
students in both groups. However, the differences in the
percentages of students who have dropped out, when
comparing mentored groups with unmentored, is noteworthy.
The percentage of at-risk students with mentors in Year 4
is about four times higher in Cohort 1 (65.1%) and 1.5
times as high in Cohort 3 (64.7%) than at-risk students
without mentors in Cohort 1 (16.7%), and Cohort 3 (38.5%).
It should be noted that the percentage of retained
students for Cohorts 1, 2, and combined cohorts in the GPA
analysis was different from the percentage of retained
students in the attendance analysis. This was due to the
fact that GPAs were not available for some students in the
eighth grade, which modified the percentages. However,
the percentage of at-risk students with mentors remaining
in Year 4 in both attendance and GPA analysis was much
greater than those students without mentors.
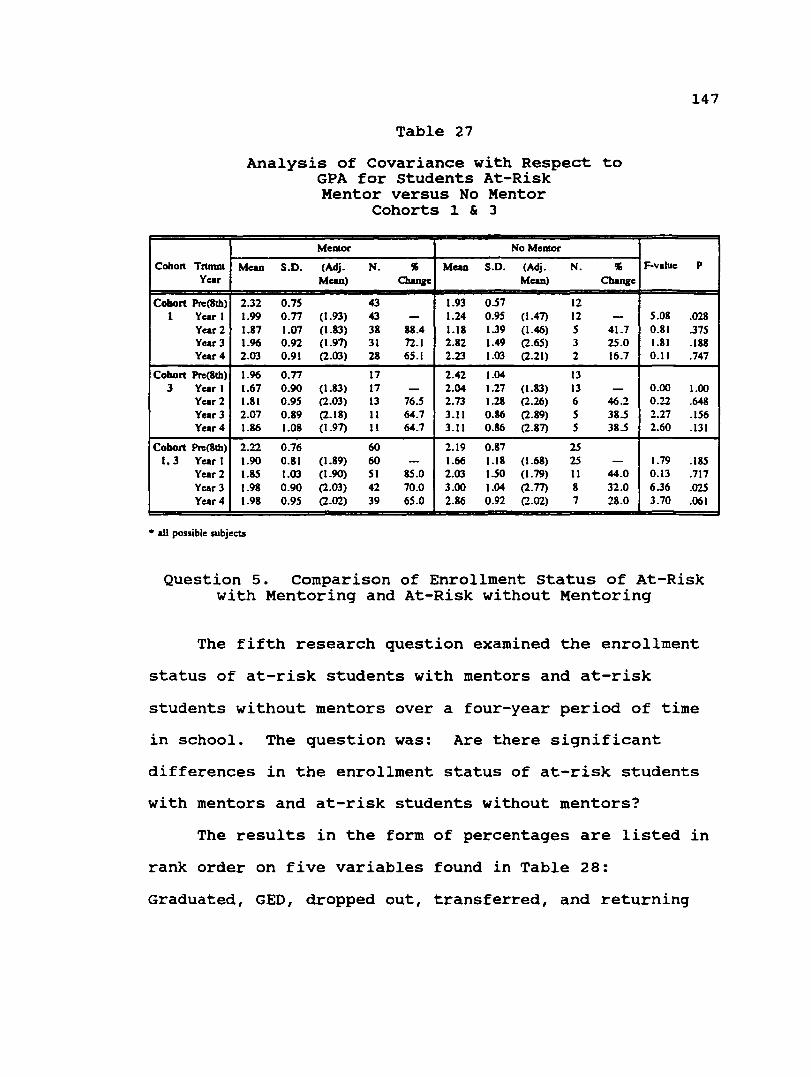
Cohon Trtmnt Year
Cobort Pre(Slh) 1 Year I
Year2 Year3 Year4
Cohort Pre(Slh) 3 Year I
Year2 Year3 Year4
Cobort Pre(81h) 1, 3 Year 1
Year 2 Year3 Year4
Table 27
Analysis of covariance with Respect to GPA for Students At-Risk
Mean s.o.
2.32 0.7S 1.99 0.77 1.87 1.07 1.96 0.92 2.03 0.91
1.96 0.77 1.67 0.90 1.81 0.9S 2.07 0.89 1.86 1.08
2.22 0.76 I.90 0.81 1.85 1.03 I.98 0.90 I.98 0.95
Mentor versus No Mentor Cohorts 1 & 3
Memor NoMemor
(Adj. N. " Mean S.D. (Adj. Mean) Cbanie Mean)
43 1.93 0.51 (1.93) 43 - 1.24 0.9S (1.47) (1.83) 38 88.4 1.18 1.39 (1.46) (l.97) 31 72.1 2.82 1.49 (2.6S) (2.03) 28 6S.I 2.23 1.03 (2.21)
17 2.42 1.04 (l.83) 17 - 2.04 1.27 (1.83) (2.03) 13 76.5 2.73 1.28 (2.26) (2.18) 11 64.7 3.11 0.86 (2.89) (1.97) 11 64.7 3.11 0.86 (2.87)
60 2.19 0.87 (1.89) 60 - 1.66 1.18 (1.68) (1.90) 51 85.0 2.03 1.50 (1.79) (2.03) 42 70.0 3.00 1.04 (2.77) (2.02) 39 65.0 2.86 0.92 (2.02)
N. " Change
12 12 -s 41.7 3 25.0 2 16.7
13 13 -6 46.2 5 38.5 5 38.5
25 25 -II 44.0 8 32.0 7 28.0
• all possible subjects
147
F-value p
S.08 .028 0.81 .37S 1.81 .188 0.11 .747
0.00 1.00 0.22 .648 2.27 .156 2.60 .131
1.79 .185 0.13 .717 6.36 .025 3.70 .061
Question 5. Comparison of Enrollment Status of At-Risk with Mentoring and At-Risk without Mentoring
The fifth research question examined the enrollment
status of at-risk students with mentors and at-risk
students without mentors over a four-year period of time
in school. The question was: Are there significant
differences in the enrollment status of at-risk students
with mentors and at-risk students without mentors?
The results in the form of percentages are listed in
rank order on five variables found in Table 28:
Graduated, GED, dropped out, transferred, and returning

148
for a fifth year. The statistical hypothesis was rejected
(R<.01). The percentage of at-risk students with a mentor
who graduated was twice as high, 43.7%, as those at-risk
without a mentor, 21.3%. Likewise, the percentage of at
risk students with a mentor who received a GED (General
Equivalency Exam) was twice as high, 26.4%, as those at-
risk without a mentor, 10.6%. In comparison, those
students without a mentor dropped out more than twice as
much at 44.7% as those with a mentor at 17.2%. Both
transfering and returning students with and without a
mentor were approximately the same.
Table 28
Chi Square and Percentage with Respect to Enrollment Status After Year 4 for All Students At-Risk
Mentor versus No Mentor
At-Risk: At-Risk: Status Mentor No Mentor Total
N ~ N ~ N ~ Chi-Sq Prob
Graduated 38 43.7 IO 21.3 48 35.8 19.97 .0005
GED 23 26.4 5 10.6 28 20.9
Dropped Out 15 17.2 21 44.7 . 36 26.9
Transferred 8 9.2 10 21.3 18 13.4
Returning 3 3.4 I 2.1 4 3.0
Total 87 (64.1) 47 (35.1) 134 100.0

149
Question 6. Perceptions of the Mentor Program: Results of the CAKE Survey
The sixth research question examined the perceptions
and characteristics of the CAKE program with the staff
mentors and a random sample of the mentees. The question
was: What are the participants' perceptions of the
effectiveness and characteristics concerning the CAKE
program?
The results of the survey can be found in Tables 29
through 39, and are grouped together according to topic.
Results are listed in percentages and include the number
of respondents and valid percentages {taking into account
any missing data). Chapter V contains a discussion of
these findings.
Results indicated both mentors {53%) and mentees
(60%) felt satisfied as to their participation in the CAKE
program. (See Table 29.)
As can be seen in Table 30, both mentors (74%) and
mentees {75%) felt satisfied as to the CAKE program's
value for at-risk students in developing a positive
attitude toward school.
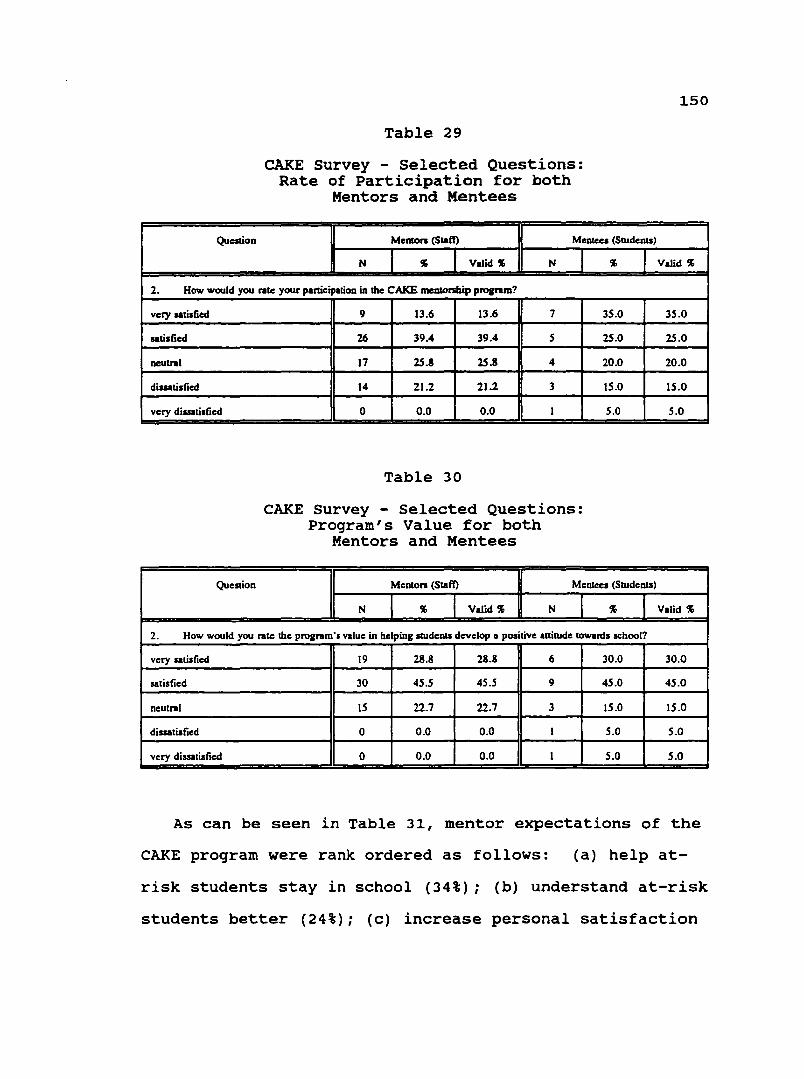
Question
Table 29
CAKE survey - Selected Questions: Rate of Participation for both
Mentors and Mentees
Menron (Slaff)
N "' Valid'-' N
Me111eca (SrudenlS)
$
2. How would you nitc your participation in the CAKE menlDnhip program?
very satisfied
satisfied
ncutnil
dissatisfied
very dissatisfied
Question
9 13.6 13.6 7 35.0
26 39.4 39.4 s 25.0
17 25.8 25.8 4 20.0
14 21.2 21.2 3 JS.O
0 0.0 0.0 I s.o
Table 30
CAKE survey - Selected Questions: Program's Value for both
Mentors and Mentees
Menton (Slaff)
N $ Valid \g
Menlees (Students)
N "' 2. How would you rate the program's value in helping studenlS develop a positive anitude towards school?
very satisfied 19 28.8 28.8 6 30.0
satisfied 30 45.S 45.S 9 45.0
neutnil JS 22.7 22.7 3 IS.O
dissatisfied 0 0.0 0.0 I s.o
very dissatisfied 0 0.0 0.0 I s.o
150
Valid \g
35.0
25.0
20.0
IS.O
s.o
Valid$
30.0
45.0
IS.O
s.o
s.o
As can be seen in Table 31, mentor expectations of the
CAKE program were rank ordered as follows: (a) help at-
risk students stay in school (34%); (b) understand at-risk
students better (24%); (c) increase personal satisfaction

(16%); (d) improve job satisfaction (14%); and
(e) increase professional commitment (12%).
Table 31
CAKE Survey Selected Questions: Expectations of the Program Mentors
Question Menton (Staff)
median %
IS.a. Mentor expectatioaa of CAKE mentorship program:
to help at-risk studenu stay in 1ebool I 34
to have an opportunity to undentand at-risk llUdenll better 2 24
to increase my personal satisfaction by mowing concern for at-rialt 3 16 students
to improve my job satisfaction 4 14
to increase my commitment u a profeuiooal 4 13
151
Results in Table 32 indicated that, of the respondents
who chose to answer these questions, both mentors (85%)
and mentees (67%) agreed that having the mentee in a class
taught by the staff mentor was helful. (Approximately
half of the mentors (45.5%) and mentees (40%) did not
answer question 5.a.) Only half of the mentees were
actually in a class taught by their mentor.
As indicated in Table 33, mentors who replied in this
question were split as to being well matched with their
mentee (agree: 42%; undecided: 39%). Mentees who
responded, however, felt they were well matched (74%) with
mentors.

152
Table 32
CAKE survey - Selected Questions: Mentee in Mentor's Class
Question Meo&on (Slaff) Menlecs (SiudeDlS)
N ~ Valid $ N ~ Valid%
4. Wu meDlee in a clau raught by lbe melllOr?
yea 34 Sl.5 Sl.S 10 so yea & DO 2 3.0 3.0 0 0.0
no 30 45.S 45.S 10 so.o S.a. Wu the fact that the mclll&C wu in one or mon: clauca 1aupt by the menlOr belptw?
strongly aarec 23 34.8 S6.l 3 IS.O
agree 12 18.2 29.3 s 25.0
undecided s 1.6 12.2 2 10.0
disagree 0 o.o 0.0 2 10.0
strongly disagree I 1.5 2.4 0 0.0
missing 30 45.S - 8 40.0
S.b. Was the fact that the mentec wu NOT in a clau raught by the mentor helpful?
strongly agree 2 3.0 1.1 I 5.0
agree I l.S 3.8 I s.o undecided 6 9.1 23.1 4 20.0
disagree 8 12.1 30.8 2 10.0
strongly disagree 9 13.6 34.6 I s.o missing 40 60.6 - 11 ss.o
Table 33
CAKE Survey Selected Questions: Interest Match between Mentor and Mentee
Question Menton (Sraft) Melllces (StudeDlS)
so.o 0.0
50.0
25.0
41.7
16.7
16.7
0.0
-
11.1
11.1
44.4
22.2
I I. I
-
N $ Valid$ N $ Valid $
6. Were the mentor and mentce well-matched with respect to inten:llll?
strongly agree 4 6.1 6.2 6 30.0 31.6
agree 23 34.8 3S.4 8 40.0 42.1
undecided 2S 37.9 38.S 4 20.0 21.1
disagree 9 13.6 13.8 I s.o S.3
strongly disagree 4 6.1 6.2 0 0.0 0.0
missing I l.S - I s.o -
153
As indicated in Table 34, responding mentors reported
that there wasn't enough time available during the day to
meet with mentees (62%); 44% of the mentees were
undecided. Mentors (77%} and mentees (75%} agreed that
they met at least monthly, with 34% and 20%, respectively,
indicating that they met daily. Over half of the mentors
(70%) said that they initiated the meetings; 44% of the
mentees agreed. Mentors indicated that most of the
activities listed in the questionnaire (64%) were not
activities pursued by CAKE participants. (See Table 34
for additional activities.)
As reported in Table 35, results concerning
communication in the CAKE mentoring program indicated the
following. (a) Half of the mentors (56%) explained the
mentor program to his/her mentee; 65% of the mentees
agreed; (b) Two-thirds of the mentors (59%} used written
communication of some kind with the mentee; (c} Most
mentors (69%) indicated that they did not communicate with
the mentee's parents or guardians; mentees (63%} tended to
agree; (d) Mentors reported that progress in classes was
the most frequent topic discussed in meetings with mentees
(71%}; mentees agreed (65%). Most participants agreed
(81% mentors; 75% mentees) that meetings involved feedback
on performance at school.
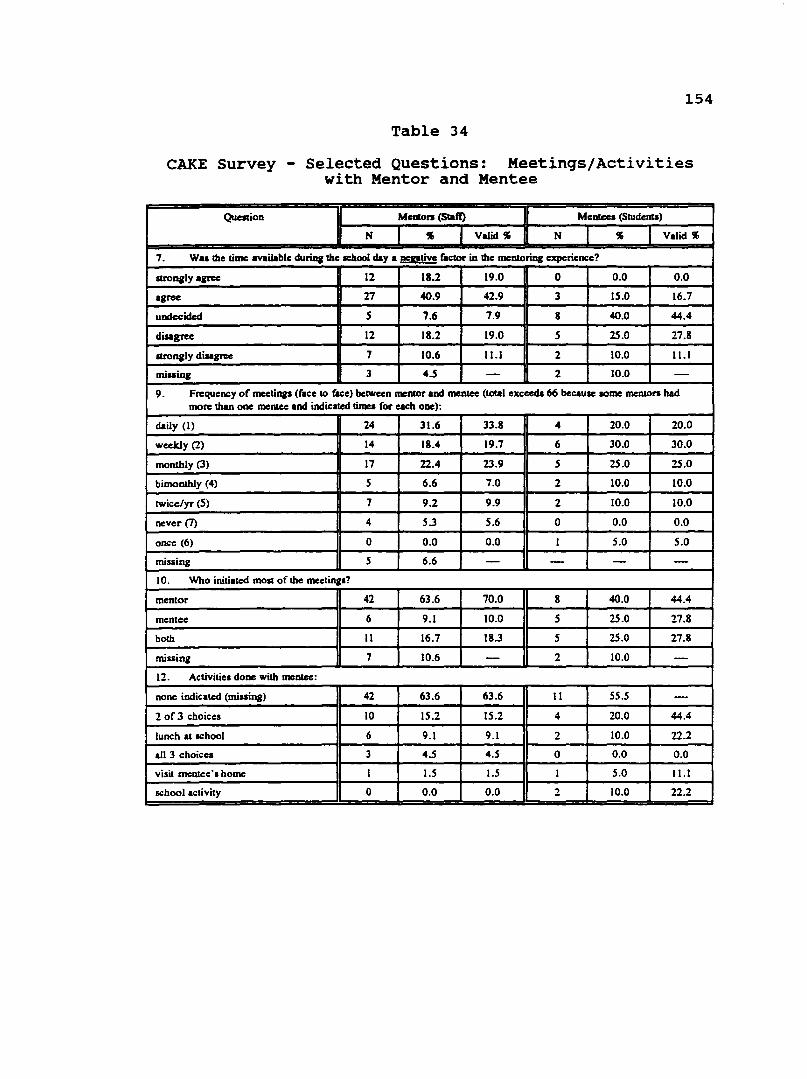
154
Table 34
CAKE Survey - Selected Questions: Meetings/Activities with Mentor and Mentee
Quation Memon {Slaft} MenleCS (Srudenu)
N $ Valid$ N $ Valid$
7. Wa• lhe time available durinJ lhe school day a~ faclOr in lhe menlOring experience?
IUOOBIY a,ree 12 18.2 19.0 0 0.0 0.0
agree 27 40.9 42.9 3 15.0 16.7
undecided 5 7.6 7.9 8 40.0 44.4
disapc 12 18.2 19.0 5 25.0 27.8
suongly disagn:e 7 10.6 11.1 2 10.0 11.1
mining 3 4.S - 2 10.0 -9. Frequency of meetings (face IO face) between men1or and menlee (IOlal exceeda 66 because some men1on had
more lhan one menlee and indicated times for eac:h one):
daily (l) 24 31.6 33.8 4 20.0 20.0
weekly (2) 14 18.4 19.7 6 30.0 30.0
monthly (3) 17 22.4 23.9 5 25.0 25.0
bimoolhly (4) s 6.6 7.0 2 10.0 10.0
twice/yr (5) 7 9.2 9.9 2 10.0 10.0
never (7) 4 S.3 5.6 0 0.0 0.0
onc:e (6) 0 0.0 0.0 I s.o 5.0
missing s 6.6 - - - -10. Who initiated most of lhe meetings?
mentor 42 63.6 70.0 8 40.0 44.4
men tee 6 9.1 10.0 5 25.0 27.8
bolh II 16.7 18.3 5 25.0 27.8
missing 7 10.6 - 2 10.0 -12. Aclivitie• done wilh menlee:
none indicated (mining) 42 63.6 63.6 11 SS.5 -2 of 3 choices 10 15.2 15.2 4 20.0 44.4
lunc:h at school 6 9.1 9.1 2 10.0 22.2
all 3 choice• 3 4.S 4.S 0 0.0 0.0
visit mentee'1 home I 1.5 l.S I s.o I I.I
school activity 0 0.0 0.0 2 10.0 22.2

Table 35
CAKE Survey - Selected Questions: communication between
Mentor and Mentee
Question Meuon (Staft) Meaaeca (Students)
N s Valid 'l\ N 'l\
8. Did the menaor explain lhe CAKE metllOnbip prognm IO lhe mearce?
yes 36 54.5 56.3 13 65.0
yes&. no I 1.5 1.6 0 0.0
QO 27 40.9 42.2 7 35.0
missing 2 3.0 - 0 0.0
11. Type of communication between IDCDIOr and meaaec:
noccs of encouragement 3 4.5 4.5 I s.o congratulatioos:gradea/atteodaoce 3 4.5 4.5 4 20.0
special occuioo card 2 3.0 3.0 I s.o binhday card I 1.5 LS I s.o all 4 choice• (all 4 of lhe above) 6 9.1 9.1 0 0.0
2-3 out of 4 choice1 24 36.4 36.4 0 0.0
none indicated II 16.7 16.7 0 0.0
other communication 16 24.2 24.2 13 65.0
13. Did the memor have communication with the mcntee'• guardian/pare111(1)?
yes 19 28.8 30.6 7 35.0
no 43 65.2 69.4 12 60.0
missing 4 6.1 - I 5.0
14. Topics discuaed in mentor/memce meetings:
progress in class(es) I 47 71.2 I 13
teacher issues 3 17 25.8 s 4
help with homeworlt 4 10 15.2 6 4
family issues 2 20 30.3 4 3
friends 4 10 15.2 4.S 4
other issues outside school - - - 3 s involvemelll in activities 4 7 10.6 3 1
16. Did lllldelll receive feedback from memor about performance in school?
yes 52 78 81.3 IS 15.0
no 12 18.2 18.8 5 25.0
missing 2 3.0 - - -
155
Valid 'l\
65.0
0.0
35.0
-
s.o 20.0
s.o s.o 0.0
0.0
0.0
65.0
38.8
63.2
-
65.0
20.0
20.0
15.0
20.0
25.0
5.0
15.0
25.0
-

156
Results concerning staff development/training for
mentors was mixed, with about half of the mentors (59%)
actually participating in staff development focused on
mentoring students (see Table 36). Of the training
components listed, staff ranked the behavior of at-risk
students, and laws surrounding activities with their
mentees as most important. Substance abuse information,
goal-setting strategies, and other mentorship programs
were ranked as least important as part of inservice
training (see Table 37).
Results from students involved in the CAKE program
indicated the following: (a) Most mentees (60%) did not
feel having a mentor made a positive difference in
performance at school although compared to last year;
these mentees (70%) thought that they were doing better in
school this year and over half (55%) believed school now
had value; (b) most mentees (70%) felt they could talk
with eheir mentors when needed and that the most important
attribute of the program was the fact that they had an
adult to discuss problems with (45%), followed closely
with a better understanding of the school (30%), get
better grades (30%), and discussing issues at home (30%).
Getting help on homework ranked last with 25% (see Table
38) •

157
Table 36
CAKE Survey - Selected Questions: Training/Inservice for Mentors
Question Menton (Staff)
N $ Valid~
17. Did you receive trainiq/imervice on mentoring prior to participation in the prorram?
yes 30 51.6 59.4
QO 26 39.4 40.6
miaaiog 2 3.0 -
Table 37
CAKE Survey - Average Ranking of Mentor Expectations/ Needs for Inservice Training
Question Menton (Staff)
N " 18. Mentor expec:tatiom/needsu part of ioservice uaining:
Ranking
at-risk llUdeDl behavior 2 II
laws surrounding 1111dent/teacber 2 II activities
first meeting tips 3 II
motivation ICCbniques 3 7
coumeliog ICCbniques s 8
community resources available s II
substance abuse infonnation 6 s
goal selling llntegies 6.S 12
ocher mentonbip programs 9 24
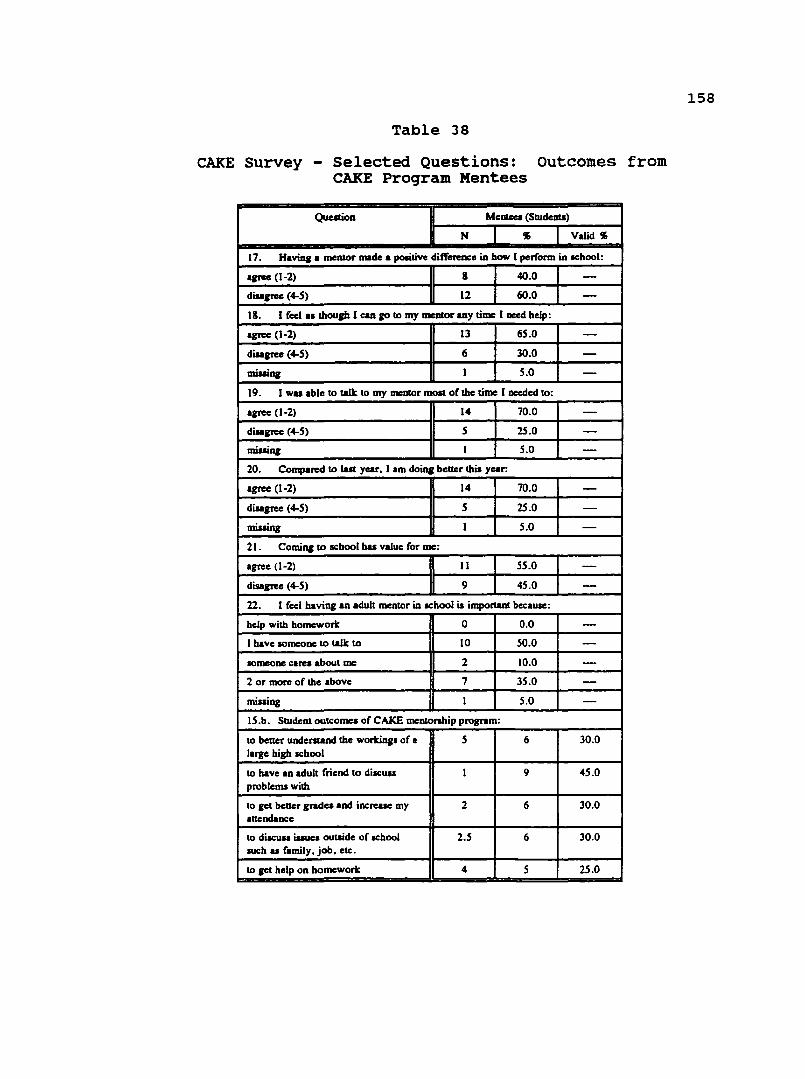
Table 38
CAKE survey - Selected Questions: outcomes from CA.KE Proqram Mentees
Question Memeca (SlUdents)
N $ Valid$
17. HavinJ a menlor made a positive diffen:ac:e in bow [perform in acbool:
agree (1-2) 8 40.0 -disagree (4-S) 12 60.0 -18. l feel aa dloup I can go IO my meDIOr any time I need help:
agree (1-2) 13 65.0 -diulf" {4-S) 6 30.0 -miAiq l s.o -19. I waa able IO talJc to my mclllOr IDOll of Ille time I needed IO:
alf" (1-2) 14 70.0 -diulf" (4-S) s 25.0 -miaaing l s.o -20. Compared IO lut year, I am doing beaer dlia year:
agree (1-2) 14 70.0 -disagree (4-S) s 25.0 -miaaing l s.o -21. Coming to achoo! bu value for me:
agree (1-2) II ss.o -disagree C 4-S) 9 45.0 -22. I feel having an adult mentor in achoo! is impolUDl because:
help wilh homework 0 0.0 -[ have someone to lalk to 10 so.o -someone cares about me 2 10.0 -2 or more of lhe above 7 3S.O -missing l s.o -lS.b. Studenl outcomes of CAKE mentonhip program:
to better understand lhe worlting1 of a s 6 30.0 large high school
to have an adult friend to diacuss l 9 45.0 problems wilh
to get better grades and increase my 2 6 30.0 attendance
to diacuu iuuea outside of achool 2.S 6 30.0 such 11 family, job. etc.
IO get help on homework 4 s 25.0
158

159
The following attributes, as seen by mentors regarding
the success of a mentorship program, were ranked in the
following order: (a) availability of time to meet (52%);
(b) training for mentors (23%); (c) support from
administration (13%). Ranked 4th and 5th were the
assignment of a mentee to his/her mentor's class (11%) and
selection process for mentees (9%) • There seemed to be
little or no need for get-togethers with mentors/mentees
(4%), parents (0%), or support groups (4%) (see Table 39).
Table 39
CAKE survey - Selected Questions: Ranking of Attributes for Success of CAKE
Mentoring Program Mentors
21. Attributes imponant to the success of any mcnlOrship program, ranltcd by mcnton (ranked 1-8 with I =highest and 8=1owell):
R.ankng Value ($ includca only thoac staff mcmben who responded)
Attributes (I) (2) (3) (4) (5) (6) (7) (8) highest lowest
N $ N $ N $ N $ N % N % N % N %
availability of time to meet 30 52 14 24 8 14 3 s 2 3 0 0 0 0 I 2
mcntonhip training for 13 23 3 9 10 18 2 4 s 9 IS 26 7 11 I 2 mentors
support from 7 13 9 16 10 18 7 13 13 23 6 11 I 2 3 s administration
menteea auigned to a 6 II 12 22 7 13 8 15 7 13 7 13 6 11 2 4 mentor's class
selection process for 6 9 s 9 3 6 6 11 s 9 s 9 23 43 2 3 mentccs
fonnal •get-togethen• for 2 4 7 13 9 17 12 22 9 17 6 11 6 11 2 4 mentor/mcntees
existence of an infonnal 2 4 s 9 11 20 13 24 11 20 8 IS 4 7 0 0 suppon group
fonnal meeting with 0 0 0 0 2 4 2 4 I 2 4 6 s 9 40 74 mentce's parents

160
student Comments - QSL
A few students chose to write comments on the back of
the QSL. Examples included the following (reproduced as
written by students):
overall, I don't like school. But I know its nessessary to get any were in life. I think its possible to have a life with out a full education, because my cousin dropped out and he is doing fine. I don't like school.
I hate school because it's to much work I wish I could just take one class at a time (one class for half of a year).
School is okay but sometimes it gets very repetitive and I cant seem to get my mind focused correctly on my daily agenda, therefore, I usually don't apply myself to many of my verious assignments.
I like the game's dance's the day off's this school is OK but if it was my chaise I wouldnt go.
I would say school all right at the first of the year. But teachers start to get more strict towards the end of the year. And you lose privilages. And it starts to get boring so it's not even worth going to school. I wish all the teachers were like Mr. Carle and Mr. Wilkins. The school would be a lot better.
I like school better than most places in the world. There are people and friends here who can really understand the way I feel about certain issues. I mainly solve my problems in school.
I hate school because often times the teachers treat you like dirt. You are always overpowered like, "me teacher, you kid. Kid know nothing."
I like coming to school just to see my friends. Most of my teachers are a real pain especially English, Math.
The reason I hate school is because of: Some of the teachers act like they know everything about the world. Teachers give the students to much home work during weekends. Teachers want us to do projects their way not our way. Some of the kids in this school are stuck up or they need their "ass" kicked badly. I hate going to school five days a week and I think school is a waste of my time. Some teachers are nerds and some act their better than anyone else. THE END!
The comments reinforced the findings of the CAKE
survey and is in agreement with the body of literature
161
surrounding the reasons often cited by students who have
dropped out of school: the lack of relevance between
school and the students' life outside school, irrelevant
course work, teaching techniques that did not match
learning styles, feeling a part of the school that the
electives and activities provide, and the importance of
relationships, primarily with teachers. (Beck & Mui a,
1980; Benson et al., 1987; Boyer, 1995; Hershaff, 1980;
Oregon Department of Education, 1997)

CHAPTER V
DISCUSSION OF FINDINGS AND RECOMMENDATIONS
Anthropologist Loren Eiseley chronicled the
perhaps apocryphal story of how we can each make
a difference in our personal and professional
lives. He relates a time he was walking on the
beach and saw, in the distance, the figure of a
man repeatedly throwing something into the surf,
one at a time. As Eiseley drew closer, he saw a
young man throwing starfish from a large pile
into the ocean. He asked the young man why he
was engaged in this practice, to which the man
cited the probable dismal future of the starfish
due to human incursions on the starfish habitat
and the mollusk as a species. Eiseley replied
that single effort was not likely to alter the
probable outcome for this species. The young
man replied as he threw yet another into the
sea, "Well, it certainly makes a difference to
that one!"
(Paraphrased from Eiseley, 1978)
163
The mentees were this researcher's "starfish."
This study examined the effect of a staff mentoring
program with students at risk of leaving school prior to
graduation. The study consisted of five components: (a) a
comparison of at-risk students and those not at-risk prior
to the start of the program, using indicators of school
achievement (grades and attendance data) and attitudes
toward school; (b) the same indicators were analyzed over
time, comparing not at-risk, at-risk with mentors, and at
risk without mentors; (c) the same indicators were
analyzed over time comparing at-risk students with mentors
and at-risk without mentors; (d) enrollment status after
four years was analyzed for students at-risk with and
without mentors, and (e) results from surveys given to
mentors and mentees were analyzed for activities and
characteristics contributing to the success of a staff
mentoring program.
This final chapter is divided into three sections.
The first section is devoted to the discussion and
interpretations of the statistical results obtained and
reported in Chapter IV. These findings relate to the
ANOVAs, ANCOVAs, chi-square, and percentage analyses
performed. The second section consists of conclusions
drawn from the study with implications and recommendations
for practice. The final section concludes with
recommendations to others who may wish to pursue this
topic in further research.
Statistical Findings: Interpretations
Question 1
164
The purpose of the first research question was to
ascertain if there was a difference between the two groups
of students identified for purposes of this study, at-risk
and not at-risk. Prior to treatment, the students at-risk
were found to have significantly lower means on the total
QSL scores (with the exception of Cohort 2), attendance
rates, and GPA when compared to those students not at
risk. This established an initial difference prior to
treatment between the two groups studied, at-risk and not
at-risk.
Using an analysis of covariance, a difference was
found not only prior to treatment between at-risk students
and students not at-risk, but these two groups of students
continued to respond differently after one year in the
study.
The first year means on all QSL scales were less for
the at-risk students than for the not at-risk. However,
with the exception of the Satisfaction with School scale,
the second year QSL mean scores were reported as higher
for at-risk students than not at-risk. In each case the

165
adjusted mean was also higher for the at-risk student
group. Using an analysis of covariance, significant
differences were found between all groups, except with the
Satisfaction of School scale.
Using analysis of covariance, a significant
difference was also found between students at-risk and
students not at-risk in attendance and GPA. In both
cases, the actual attendance and GPA means for at-risk
groups were lower prior to treatment than for the not at
risk. For each group, the attendance means remained about
the same at the end of Year 1 as they were at the
beginning of the study. When examining the adjusted
attendance means, the attendance rates remained lower for
the at-risk groups when compared with the not at-risk
groups. When examining the adjusted GPA means, the GPA
means of the at-risk groups were significantly lower than
the adjusted means for the not at-risk groups. It is
interesting to note that the GPA for at-risk and not at
risk within their groups dropped from pretreatment to
Year 1; this relationship held true for both the QSL group
and for all students.
Question 2
The second research question examined differences
between at-risk students with mentors, at-risk students
without mentors, and not at-risk students. The purpose of

these comparisons was to determine if having a mentor
lessened the severity of being at-risk when compared to
students not at-risk.
166
The first year means on all scales of the QSL were
less for at-risk students with or without mentors than for
those not at-risk; however, there were differences between
those with mentors and those without mentors. Students
not at-risk reported better attitudes toward school the
first year of the study, and had a slightly lower total
QSL score the following year. This contrasted with at
risk students with or without mentors. The first year of
the study, those with mentors had lower means on all
scales, except the commitment to School Work, than those
without mentors. Using analysis of covariance, in the
fall of the second year of the study the means were
significantly higher for at-risk students with mentors
than without mentors on all scales. It is noteworthy that
the means of the mentored group in Year 2. before any
adjustments were made, were greater on all scales than the
not at-risk students. When adjusted means using the
analysis of covariance were examined. these differences
were even greater when compared to the unmentored group
and not at-risk students.
The attendance means were the lowest for the at-risk
student group without mentors, next for those with
167
mentors, and highest for the not at-risk group. This same
relationship occurred at the end of Year 1. But, it is
interesting to note that the at-risk student group with
mentors had the same attendance rate in Year 1 as it did
in the pretreatment year, whereas the attendance rate
dropped for both the unmentored group and not at-risk
student group. The statistical hypothesis was not
rejected; differences observed between the three groups
were not significant.
The initial GPA means were the lowest for the at-risk
without mentors, next for at-risk with mentors, and the
highest for the not at-risk group. The same patterns
existed at the end of Year 1, with the GPA means actually
being lower for all three groups. Following the rejection
of the statistical hypothesis using an analysis of
covariance, the adjusted means for GPA were examined. As
expected, the adjusted means for the not at-risk was
higher than the other two groups. However, the GPA mean
for the at-risk student group with mentors was also higher
than the unmentored group.
Significant differences in GPA, attendance rates, and
attitudes toward school over a year's period of time were
found between students at-risk and not at-risk. The
addition of a mentor with at-risk students resulted in a
significant improvement in their attitudes toward school

168
as compared with those without mentors and students not
at-risk. The addition of a mentor resulted in improved
GPAs, as compared with those without mentors. Students
not at-risk maintained significantly higher GPAs from Year
1 to Year 2 than either of the at-risk student groups. In
terms of rates of absence, it would appear that the
addition of a mentor did not impact the attendance rate of
at-risk students. This lack of significant difference
could be due to the difference in sample size and the
variances in the variable itself.
The remainder of the study focused on the effects of
staff mentoring on the group of students identified as at
risk since differences between at-risk students and not
at-risk students has been established.
Question 3
The third research question examined differences on
selected variables between at-risk students with mentoring
and at-risk students without mentoring. The analysis of
the Quality of School Life data, using an analysis of
covariance, established significant differences on the
subscales and total score of the QSL between at-risk
students with mentors and at-risk students without
mentors. The mentored at-risk students actually scored
lower prior to treatment on two of the subscales and the
total scale of the QSL than those without mentors. The
169
exception was Commitment to Teachers. One year later,
they actually scored higher on all scales. The
differences were even greater when comparing the adjusted
means, with the mentored students scoring significantly
higher on all scales. Thus, the mentored group
demonstrated an increased positive attitude toward school,
whereas those without mentors were less enthusiastic about
school. This is even more important when, as Epstein and
McPartland (1978) note, students consistently report lower
scores on the QSL as they get older. "There is a
consistent pattern of decreasing satisfaction with school
life for the same students in two surveys, one year apart"
(p. 21).
Question 4
The fourth research question examined differences on
the selected variables (attendance and GPA) between at
risk students with mentors and at-risk students without
mentors. Examining the attendance for the combined
Cohorts 1 and 3, the mentored group began at 156 days and
increased to a mean of 159 days at the end of the first
year. Attendance for the unmentored group began at 150
days; the mean decreased to 141 days. At the end of the
first year, the attendance rate of the mentored group
(combined Cohorts 1 and 3) increased from 156 to 159 days,
with an adjusted mean of 159 days. For the non-mentored

170
group, attendance decreased from 150 to 141 days, with an
adjusted mean of 143. There was a significant difference
between the adjusted means (159 for mentored and 143 for
non-mentored).
The attendance rate for the mentored group continued
to decline during Years 2, 3, and 4. A similar pattern
occurred in the non-mentored group across Year 2 and 3,
but the rate increased in Year 4. In comparing the
attendance rate for Years 2, 3, and 4, in these two groups
there were no significant differences. It is important to
note that the mentored group had 94% of its students left,
and the non-mentored group had 68% left at the end of two
years.
It is also important to note here the dramatic
decline in the group numbers from Year 1 to Year 4 in the
unmentored group. At the end of Year 2, those with
mentors had 93%, without mentors 68%; at the end of Year
3, the difference was much greater with those with mentors
at 82% and without mentors at 50%; and at the end of Year
4, the difference increased again, with those students
with mentors at 74% and without mentors at 32%. This
could explain the lack of significant difference from Year
2 to Year 4 in that the dramatic decline in the non
mentored group left students with the skills to attend
school comparable to those in the mentored group.

171
The analyses of GPAs revealed the same trend for
these students. Grades for mentored at-risk students
actually worsened at the end of the four years, whereas
those students without mentors showed an actual increase.
At the end of the first year, the adjusted mean of the
GPAs of at-risk students with mentors dropped, and those
without mentors was lower still. GPA for the combined
Cohorts 1 and 3 mentored groups began at 2.2 and decreased
to the adjusted mean of 1.9 at the end of the first year.
GPA for the unmentored groups began at 2.2 and decreased
to the adjusted mean of 1.7. This was not a significant
difference. There continued to be no significant
difference in Year 1 to Year 2, with the mentored group's
adjusted GPA mean at 1.9 and the unmentored group at 1.8.
From Year 2 to Year J, there was a significant difference
between the mentored group and the unmentored group; the
adjusted mean for the mentored group rose to 2.0 while the
unmentored group rose to 2.8. Year 3 to Year 4, both
groups had an adjusted mean of 2.0.
As in the attendance data, a partial explanation for
this phenomenon can be found in the actual number of
students left in each year's study. Again, there was a
dramatic decline in the unmentored group over the four
year period. Although their grades fell, greater
percentages of students with mentors continued in school

172
after four years than those without mentors. This
phenomena also supports the results in Questions, i.e.,
mentored students qraduated at a greater rate than non
mentored students.
From the data analysis, it would appear that having a
mentor did not make a difference in such indicators of
school success as rates of attendance and GPA. However,
it is noteworthy that more students left school in those
four years in the group without mentors than those with
mentors, leaving those that maintained their attendance
and GPA over time in the unmentored group. This could
explain the unexpected trend. The influence of mentor
status versus an unmentored status and its relationship to
students' enrollment status in school at graduation is
examined in the following section.
Question 5
The fifth research question examined the enrollment
status of at-risk students with mentors and at-risk
students without mentors over a four year period in
school. An analysis of student enrollment status after
Year 4 of the study found a statistically significant
difference, indicating that having a mentor positively
influenced at-risk students. Approximately twice as many
at-risk students with mentors graduated from high school
(44%) versus those without mentors (21%). Nearly half of

173
those students without mentors dropped out of school (45%)
prior to graduation, versus only a fifth (17%) dropping
out from at-risk students with mentors. Approximately one
quarter of those mentored at-risk students passed their
High School Equivalency exam (GED) (26%) or planned on
returning to high school as "5th year seniors" (3%). This
compares to only one tenth of those at-risk students
without mentors (11%) receiving GEDs or returning for a
"5th year" (2%) • Both groups of at-risk students had
approximately the same transfer rate, which would not
necessarily be influenced by mentor status.
In summary, at-risk students with mentors graduated
or received GEDs at much higher rates and demonstrated
better attitudes toward school than those without mentors.
Question 6
The sixth research question examined the perceptions
and characteristics of the CAKE program with the staff
mentors and a random sample of the mentored students. The
analysis of the survey given to both students and staff
examined the mentor and mentees' perceptions of the
effectiveness and characteristics concerning the
mentorship program and its effect on at-risk students.
The survey was primarily given to mentors because of the
limited sampling of mentees available (see Limitations) .
Therefore, this study is likely to report findings based
on mentor responses in assessing the characteristics
contributing to program effectiveness.
174
Students (75%) and staff (74%) agreed that they were
"satisfied" that the mentor program helped at-risk
students develop positive attitudes toward school, but
about half were satisfied concerning their participation
in the program (60% students; 53% staff) • While 40% of
the mentors were neutral or dissatisfied with their
participation, 70% of the students surveyed felt they were
doing better in school, but 60% did not attribute their
improved performance to having a mentor. Most students
surveyed felt that they could go to their mentor if they
needed help (65%), that their mentor was available when
needed (70%), and that having a mentor provided them with
an adult to talk to (50%).
Mentors were unsure as to whether the mentees and
mentors were well matched with respect to interests (39%
undecided). Approximately half the staff (54%) and
students (50%) agreed they met either daily or weekly.
Staff mentors (70%) felt they were responsible for
organizing meetings with their mentees. Respondents
reported topics most often discussed in meetings included
mentees' progress in classes (mentors, 71%; mentees, 65%)
and, to some extent, family and teacher issues. Help with
homework and involvement with activities was the least
175
likely to be discussed. Mentors (69%) and mentees (63%)
aqreed that mentors did not communicate with the parents
of the students. Slightly over half (59%) of the staff
reported receiving inservice on mentoring prior to
participation in the proqram. The two top needs
identified by those who attended the inservice were
information concerning the behavior of at-risk students
and information regarding legal issues surrounding
student/teacher activities. The least needed topics as
reported in this inservice included substance abuse, goal
setting strategies, and other mentorship programs.
The mentors were divided in their perceptions of the
degree to which mentors explained program facets to
mentees. Many staff members (42%) did not reveal to their
mentees that they were students identified as at-risk and
were assigned a mentor as part of the CAKE program; 65% of
the mentees reported that the program was explained to
them. This reporting coincides with many of the mentees'
surprise upon learning they were part of this program when
asked by the researcher to fill out the CAKE survey.
Consequently, fewer mentees were given the survey. This
researcher believes the mentoring program would have
provided greater assistance to these students had there
been communication concerning the purpose of the mentor.
This is a "planned" mentor program versus a "natural"
176
mentor relationship. To pretend this was anything else
could infuse this mentor relationship with less integrity,
purpose, true communication, and trust than was the case.
Staff ranked their expectations of the CAKE mentoring
program. They rated the opportunity to learn more about
at-risk (24%) students and helping those students stay in
school (34%) as their highest expectation from
participation in the program. An unexpected outcome for
some proponents of mentoring was increased job
satisfaction (14%) and commitment as professionals (12%)
as the two lowest expectations of the program. It is the
researcher's opinion these staff volunteers in the mentor
program were already professionally committed and
satisfied with their jobs as teachers.
Most mentors with mentees in their classes agreed
having the at-risk student assigned to them in class was
beneficial (85%); only 15% of those without their mentees
in their classes percieved this as beneficial. This
statistic coincides with 62% of the mentors reporting they
did not have enough time to meet with their mentees. Most
mentors felt time to meet with their mentee must be
provided regularly in addition to time spent in classroom
intervention with mentees.
Most of the mentors (90%) ranked in the top "3" out
of a possible ranking of "9," availability of time to meet

1.77
as the most important attribute of successful mentorship
programs (52% ranked 11 1, 11 24% ranked 11 2, 11 and 14% ranked
"3"). They ranked a formal meeting with the mentee's
parents as least important (74%). Formal get-togethers or
support groups for mentors, along with the selection
process for mentees, were also listed as less important
attributes to the success of the program. Staff split
evenly on the need for inservice training, probably due to
the 40% of staff who reported earlier that they had not
attended the inservice!
Consistent administrative support is crucial to
program success. This is needed in order to provide
availability of time and organization of planned
activities. In this case, a new principal entered the
high school the second year of the mentor program.
Although this new leadership supported the existing
program, subtle changes and less emphasis during staff
meetings on the mentor program had a dampening effect
overall. The ultimate result became evident in the third
year of the program. New leadership for the high school,
with the retirement of the staff members responsible for
recruiting mentors and organization of the initial
program, led to the eventual decline of the program during
the third year and final dissolution in the fourth year.
Mentors continued to meet with mentees assigned to them
178
during the first two years, but did not add any additional
mentees the third.
This event seemed to coincide with the decline of GPA
and attendance data. There were no significant
differences in achievement data the third and fourth years
between at-risk students with or without mentors. When
the program was at its zenith the first year, a more
significant difference was reported between those with and
without mentors. It is the writer's belief that, if there
had been additional leadership and support for the
program, new mentors could have been recruited,
organizational concerns addressed, and the program
revitalized.
This survey, although limited, gave valuable
additional insight into participants' perceptions of the
program. survey responses added additional weight to the
research data and helped explain some of the phenomena.
Respondents in general were satisfied with mentoring at
risk students as one tool to increase their chances of
successfully completing high school.
Conclusions
The qualitative and quantitative findings of this
study supported the recommendations imbedded in the review
of literature surrounding mentoring at-risk students. As
179
current research literature suggested, educators can do
little to influence the environmental factors placing
students at-risk, but they can take active roles in
responding to fundamental needs unmet by contemporary
schools, i.e., developing positive teacher-student
relationships which in turn affect the students' attitudes
toward school and, ultimately, a student's decision to
stay in school.
The qualitative findings of this study found that
satisfaction in school may be the major intervening factor
concerning the holding power of schools. This perception
from the survey is supported by the quantitative findings
reported in Chapter IV. At-risk students with mentors
demonstrated significant improvement in attitudes toward
school. The at-risk students with mentors scored
significantly higher on all scales of the QSL than both
at-risk students without mentors and students not at-risk.
They did not, however, improve in other measures of school
success, e.g., attendance and grades. However, over the
four years that attendance and GPA were reported, more at
risk students with mentors remained in school than those
without mentors, perhaps explaining the difference. In
fact, approximately twice as many at-risk students in this
study with mentors graduated or made positive choices
toward their education than did those without mentors

180
(i.e., obtaining a GED and returning fifth-year seniors).
The fact that mentored at-risk students displayed no
improvement in attendance and GPA paled in comparison to
their increased ability to stay in school.
Staff mentors reported in the CA.KE survey that their
preparation to be a mentor, along with varied frequency
and quality of contacts with their mentee, had little
effect on the outcome involving the holding power of the
school on at-risk students. on the same survey both
mentors and mentees felt that this mentoring program did
have a positive effect on the mentees' attitudes toward
school. Perhaps the mere presence of an adult who showed
interest in and caring for these at-risk students was the
most important factor in the change in attitude toward
school, independent of any quantitative factors. What was
important was the fact that these at-risk students had an
adult who cared about them during their secondary school
experience.
The CA.KE survey also found that most students felt
that their mentor was available when needed, and that
having a mentor provided them with an adult to talk to.
These findings, along with quotes that students wrote on
the back of the QSL, coincided with studies cited on
reasons students leave school early in the review of the
literature. students who dropped out of high school in

181
previous studies most frequently cited irrelevant
coursework and teaching techniques that did not match
their learning styles, along with the impersonal
educational system, as the major causes for leaving school
(Boyer, 1995; Brendtro et al., 1990; Hershaff, 1980;
Kovalik & Olson, 1994; Meier, 1995). current research
involving the study of resilient children stressed the
importance of children being connected to a teacher or
other adult during adolescence. This research
demonstrated that having an adult that students at-risk
could turn to and trust built resiliency, which in turn
made school for them a refuge from society's ills
(Bushweller, 1995; Wolin & Wolin, 1993).
The findings of this study, along with previous
research, suggest that, even though educators can do
little to influence environmental factors that place
students at-risk, they can respond to one fundamental need
unmet by contemporary schools, i.e., having an adult who
cares! It appears from both qualitative and quantitative
findings in this study, in conjunction with previous
studies, that mentoring programs matching at-risk students
with adult staff members can have a positive effect on
students' attitudes which in turn helps prevent these
students from dropping out of school.

182
Implications for Practice
The issues facing education today are many and
complex. Secondary educators in Oregon are faced with the
reality of the Oregon Education Act for the 21st century,
with its concomitant expectations. For the first time,
the graduating class of 1998 will have to "measure up" to
the standards set by the Oregon Department of Education.
These standards with little fidelity to the reality of
public schools now charged with education for all
students, not just the academically able, those with more
of the world's goods, or those with the personal
resilience to stay the course. Compounding the problem,
the amount of funds available to educate students is
declining.
It is the opinion of this researcher that the move
toward "rigorous" academics and higher standards with less
funding will tend to reinforce the already blessed, and
provide even less help to those with the least ability to
survive and prosper under the present expectations. It
remains to be seen whether mandating certain levels of
proficiency in the absence of systemic change to benefit
all students will result in higher levels of student
achievement. Without systemic change, it may result in
producing even greater numbers of dropouts. Students may
perceive that they have even less chance to graduate. We

183
must address the issue of how the new system will respond
to the concomitantly partitioned students of ethnic and
racial qroups, those "low average" students at the 16th to
40th percentiles of intelligence, the handicapped and
disabled, all of whom have been invited to the banquet we
offer. Unfortunately, it is likely they will find tables
with insufficient room for all invited to take part.
While attempting to fight battles on many grounds,
public schools have to choose how to direct their
available energies. It is probable that the choice will
be to work with the students that we have, and depend on
others to deal with the remainder of the agenda facing us.
That being the case, it is this researcher's belief that
mentoring programs, such as the one described in this
study, may be one way to encourage the discouraged and
help the alienated remain in school
Based on the findings of this study, coupled with the
review of the literature, the following recommendations
are listed concerning staff mentoring programs for
students at risk:
Recommendations for Practice
1. Mentoring programs need to beqin prior to the
transition of the middle school student to the high
school. This study found almost half of the at-risk
students identified in the 8th grade dropped out within
the first few months in high school (see Table 1).
184
2. Planned mentorship programs may be enhanced by a
formal selection process for both mentees and mentors.
Commitment and expectations need to be established and
communicated at the beginning of the program for all
participants. There seemed to be a lack of clarity of
mission. In this case, staff mentors did not have
specific expectations involved with their participation.
3. A mentoring program must establish an organized
system of matching mentors with students. Even in a
"planned" mentorship program, there must be an effort to
minimize the problems between participants. As indicated
in the literature review and student survey, the need to
match/communicate with both mentors and mentees is
necessary for the program's success.
4. A formal communication link should be
consistently established between the mentee's home and the
staff mentor. Information on outside social agencies,
resources available, and modeling positive adult behaviors
which enhance the learning process may assist behaviors in
the mentee's home.
5. Staff mentors should be inserviced, using the
guidelines of mentor programs outlined in the Literature
Review (p. 27) and adjusted for local needs.

6. The progress of the program should be
highlighted with every opportunity, using staff and
district meetings, newsletters, and other forms of
communication.
185
7. A staff mentor program must be supported at the
highest levels. A proqram of this type is doomed if its
continuance is based on the "cult of the personality," or
the leadership of one or two people. The program's
leadership should be part of that staff member's job
description and time made available during the day to
manage the program. It would be reasonable to infer that
the CAKE program deteriorated due to the perception that
it was no longer important to the new principal. Partial
evidence may be found in the deterioration of attendance
and GPA figures from the first year of the program to its
last year (see pp. 141-146).
8. A system should be devised for ongoing
formulative and summative evaluation to drive necessary
changes as the program grows and matures.
9. Staff mentors need to establish short- and long
range goals that can be measured, using both qualitative
and quantitative data. This is crucial feedback as to the
effectiveness of the program.
10. Each mentee should be asked to keep a log to
document his or her activities, concerns, and thoughts;

this would greatly enhance learning and the mentoring
process. Credit for such an activity should also be
considered as motivation to complete such a task. This
provides valuable feedback in any adjustments needed to
make the mentoring program viable.
186
11. Additional documentation/emphasis needs to be
made on those students who actually leave school early.
surveys/interviews should be conducted as to the
circumstances leading to that student dropping out. This
provides valuable information to counselors when advising
students who drop out as to other educational avenues
available to them. This will also add to the assessment
of the mentoring program and provide valuable information
for adjustments.
Recommendations for Research
1. Additional research is needed to clearly
identify current reasons students drop out of school, and
to compare these to earlier findings. This will add more
information available to assist educators in developing
appropriate programs to help students remain in school.
2. Research replicating this study should be
conducted in urban and rural settings and with other mixes
of student populations.

187
3. Longitudinal studies that describe the progress
of at-risk students involved in mentoring programs before
high school graduation and years following are needed.
4. Research studies are needed that describe
mentoring programs that include the middle school years
and their effect on at-risk students' completion of high
school.
5. Research on the level of participation in a
mentoring program of staff participants and the at-risk
students' success in school is needed.
6. Studies are needed comparing the effects of
different types of staff mentoring programs and their
effects on targeted student populations.
7. studies using additional quantitative methods of
research on the effects of staff mentoring of at-risk
students will add to our knowledge base.
Final Remarks
Schools that emphasize keeping students in school,
including the isolated and less capable, while providing
assistance to the disaffected, are demonstrating at worst
enlightened self interest and, at best, fulfilling the
goal of an education appropriate to each student. The
findings of this dissertation, with respect to the mentor
program upon which it is based, may help provide a partial
188
answer of how to provide education to more students. The
ostensible goal of equity spurring tax cuts is spurious.
Genuine equity does not lie in seeing that districts are
funded at the same level. Equity is far more likely to
lie in the quality of our work with students and their
educational outcomes. It is for this reason that we must
continue to replicate best practices when they are seen.
Mentor programs offer a tool that requires little
additional funding but depends on a personal and
professional commitment to do the best we can for all our
students.
REFERENCES
Abcug, L. (1991). Teachers achieving success with kids (TASK), Practicum, Nova University (ERIC Document Reproduction Service No. ED 330 974).
Alleman, E., Cochran, J., Doverspike, J., & Newman, I. (1984, February). Enriching mentoring relationships. The Personnel and Guidance Journal, 62(16), 329-332.
Applegate, J. (1981, September/October). Perceived problems of secondary students. Journal of Educational Research, 75(1), 49-55.
Arkansas State Department of Education. (1980) . career awareness and job placement for early school leavers and adults. Little Rock, AR: Author. (ERIC Document Reproduction Service No. ED 201 755)
Ary, D., Jacobs, L.C., & Razavieh, A. (1985). Introduction to research in education. New York: CBS College Publishing.
Association of Supervision and curriculum Development (1992). curriculum report. Alexandria, VA: Author.
Astin, A.W. (1985, July/August). Involvement: The cornerstone of excellence. Change, 17(4), 24-38.
Beardon, L., Spencer, W., & Moracco, J. (1989). A study of high school dropouts. The School Counselor, 37(2), 113-120.
Beck, L., & Muia, J.A. (1980, November). A portrait of a tragedy: Research findings on the dropout. The High School Journal, 64(2), 65-72.
Benson, P., Williams, D., and Johnson, A. (1987). The quicksilver years: The hopes and fears of earlv adolescence. San Francisco: Harper and Row.
Berkowitz, L. (1971). Staying in school: An evaluation of a program to prevent school dropouts (Final Report). New York: Educational Alliance.
190
Blackwell, J.E. (1989, September/October}. Mentoring: An action strategy for increasing minority faculty. Academe, 75(5), 8.
Blough, T.B. (1956). A critical analysis of selected research literature on the problem of school dropouts. (Doctoral dissertation, University of Pittsburgh}. Dissertation Abstracts International, 17(01), 0058A.
Borman, c., & Colson, s. (1984, March}. Mentoring: An effective career guidance technique. The Vocational Guidance Quarterly, 32(3), 192-197 ••
Boyer, E.L. (1983). High school: A report on secondary education in America. New York: Harper and Row.
Boyer, E.L. (1995). The education person. In J.A. Bean (Ed.), ASCD 1995 yearbook: Toward a coherent curriculum (pp. 16-25). Alexandria, VA: Association for supervision and curriculum Development.
Brendtro, L.K., Brodcenleg, M., & van Bockern, s. (1990). Reclaiming youth at risk: Our hope for the future. Bloomington, IN: National Educational Service.
Bronfenbrenner, U. (1986). Alienation and the four worlds of childhood. Phi Delta Kappan, 67(6), 430-436.
Buckner, M.P. (1976, April 10-13). Effective dropout prevention programs. Paper presented at the Annual Meeting of the National School Boards Association. San Francisco. (ERIC Document Reproduction Service No. ED 123 730)
Bunzel, J.H. (1985). Challenge to American schools: The case for standards and values. New York: Oxford University Press.
Bushweller, K. (1995). The resilient child. American School Board Journal, ~(5), 18-23.
camp, c. (1980). school dropouts: A discussion paper, Sacramento: California state Legislative Assembly Off ice of Research. (ERIC Document Reproduction Service No. ED 191 959)
Campbell, D., & Stanley, J. (1963). Experimental and quasi-experimental designs for research. Boston: Houghton Mifflin.
191
Campbell-Peralta, P.J. (1995, June). Reducing suspensions of minority mates through a group guidance/mentoring interyention program (Master of Science research report). Location: Nova Southeastern University. (ERIC Document Reproduction Service No. ED 394 094)
Carter, s. & Herzog, B. (1997, February 18). Pupils, parents lobby for education money. The Oregonian, pp. Al, AlO.
Catterall, L.S. (1987, October/November). On the social costs of dropping out of school. The High School Journal, 70(1), 19-30.
Cave, G. & Quint, J. (1990) Career beginnings impact evaluation: A program for disadvantaged high school students. New York: Development Research Corporation.
CETA -- Education Linkage Unit. (1981). Secondary school dropouts. St. Paul: Minnesota Department of Education.
Clawson, J.G. (1980). Mentoring in managerial careers. In C.B. Derr (Ed.), Work. family and the career (pp. 144-165). New York: Praeger.
Clawson, J.G. (1985). Is mentoring necessary? Training and Development Journal, 39(4), 36-39.
Coleman, J.S. (1966). Equality of educational opportunity. Washington, DC: U.S. Government Printing Office.
Cooke, D.R. (1965). A guide to educational research. Boston: Allyn and Bacon.
Cooper, c.c. (1985, Spring). Mentors can serve black youth in many ways. The Journal of Negro Education, 54(2), 115-116.
Cox, J., & Daniel, N. (1985, March-April). The role of the mentor. G/C/T/, 37(1), 33-36.
Cuban, L. (1989, February). At-risk students: What teachers and principals can do. Educational Leadership, 46(5), 29-32.
192
Davis, H. (1988). A mentor program to assist in increasing academic achievement and attendance of at-risk ninth-grade students (Doctoral dissertation, University of Pittsburgh). Dissertation Abstracts International, 50(3), 0580A.
Di Rado, A. (1997, February 16). Saving Hispanic students. The Oregonian, pp. Bl-82.
Duke, o. (1985, June). What is excellence and should we try to measure it?, Phi Delta Kappan, 66(10), 673.
Edlind, E.P., & Haensly, P.A. (1985). Gifts of mentorships, Gifted Child Quarterly, 29(2), 55-60.
Education Commission of the states. (1984). Task force on education for economic growth. Journal of Children in Contemporary Society, 16(3-4), 11-47.
Education Commission of the States. (1985). Edu-gram. Salem: Oregon Department of Education.
Education Commission of the States, Business Advisory commission. {1985). Reconnecting youth: The next stage of reform. Denver: ECS Distribution Center.
Eiseley, L.C. (1978). The star thrower. New York: Times Books.
Ellingson, M.K., Haeger, W.W., & Feldhusen, J.F. {1986, March/April). The Purdue mentor program: A university-based mentorship experience for g/c/t children. G/C/T, ~{2), 2-5.
Elliot, D.S., & Voss, H.L. {1968). Delinquency and dropout. Lexington, KY: Lexington Books.
Epstein, L., & McPartland, M. {1978). Administration and technical manual for the OSL. Boston, MA: Houghton Mifflin Co.
Fehr, D.E. {1993, September). When faculty and staff mentor students in inner-city schools. Middle School Journal, ~{l), 65-67.
Ferguson, R. {1990). The case for community-based programs that inform and motivate black male youth. Washington, DC: Urban Institute. {ERIC Document Reproduction Service No. ED 336 458)

193
Flaxman, E., & Ascher, c. (1992). Mentoring in action: The efforts of programs in New York City. New York: Institute for Urban and Minority Education, Teachers College, Columbia University.
Flaxman, E., Ascher, c., & Harrington, c. (1988). Mentoring programs and practices: Analysis of the literature. New York: Institute for Urban and Minority Education, Teachers College, Columbia University.
Fraser, L.A. (1996, Winter). The Atlanta adopt-a-school program: Innovative interactions. Action in Teacher Education, 7(4), 17-22.
Freedman, M. (1988). Partners in growth: Elder mentors and at-risk youth. Philadelphia: Public/Private Ventures.
Freedman, M. (1991). The kindness of strangers: Reflections on the mentoring movement. Philadelphia: Public/Private Ventures.
Frymier, J., & Gansneder, B. (1989, October). The Phi Delta Kappa study of students at-risk. Phi Delta Kappan, 71(2), 142.
Gadwa, K., Christenson, J., Bryan, E., & Boeck, D. (1983, June) . School dropout study: A final report. Lynnwood, WA: Edmonds School District, student Services Department.
Gay, L.R. (1987). Educational research: Competencies for analysis and application. Columbus, OH: Merrill Publishing Company.
Gehrke, N.J. (1988, January/February). On preserving the essence of mentoring as one form of teacher leadership. Journal of Teacher Education, 39(1), 43-45.
Glass, R.S. (1991, Spring). Opening windows for teenagers: How mentors can help. American Educator: The Professional Journal of the American Federation of Teachers, 15(1), 21-26.
Glasser, W. (1969). Schools without failures. New York: Harper and Row.
Goodlad, J.I. (1983). A place called school: Prospects for the future. New York: McGraw-Hill Book co.

Gordon, E.W. (1972). Work-study program: Project Stay. Washington, DC: National center for Educational Communication DHEW/OE.
194
Gray, w. (1989, summer). Advice on planning mentoring programs for at-risk youth. Mentoring International, .J.(3)' 18-21.
Gray, W.A., & Gray M.M. (1986). Mentoring: An annotated bibliography of important references. Vancouver, BC: International Center for Mentoring.
Green, B.I. (1966). Preventing student dropouts. Englewood Cliffs, NJ: Prentice-Hall.
Green, K., & Baker, A. (1986, June). Promising practices for high risk youth education and work program. Portland, OR: Northwest Regional Educational Laboratory.
Guba, E.G. (1978) . Toward a methodology of naturalist inquiry in educational research. CAE Monograph Series in Evaluation, ~(3), 16-21.
Hahn, A., Danzberger, J., & Lefkowitz, B. (1987). Dropouts in America: Enough is known for action. Washington, DC: Institute for Educational Leadership.
Hamilton, S.F. (1990). Linking up: Final report on a mentoring program for youth. Ithaca, NY: Cornell University, Dept. of Human Development and Family Studies. (ERIC Document Reproduction Service No. ED 324 395)
Hamilton, S.F., & Hamilton, M.A. (1992, March). Mentoring programs: Promise and paradox. Phi Delta Kappan, 73(7), 546-550.
Haring-Hidore, M. (1986, Fall). Developing mentoring programs for retention of high-risk students. Reading Improvement, 23(3), 239-244.
Harris, W. (1973). The early withdrawal of pupils from school: Its causes and its remedies. Addresses and journal of proceedings of the national education association (Vol. 3, pp. 260-271). Peoria: The National Education Association, Washington, DC.
195
Harrison, J., & Klopf, G.J. (1986). Dual perspectives of a mentoring relationship. In W.A. Gray & M.M. Gray (Eds.), Mentoring: Aid to excellence in career development. business and the professions. Proceedings of the First International Conference on Mentoring, II, (pp. 60-65). Vancouver, BC: International Centre for Mentoring.
Hathaway, w., Sheldon c., & McNamara, P. (1989). The solution lies in the programs that work. In D. Capuzzi & D.R. Gross (Eds.), Youth at risk: A resource for counselors. teachers and parents (pp. 367-394). Alexandria, VA: American Association for Counseling and Development.
Henderson, N. (1996). Resiliency in schools: Making it happen for students and educators. Resiliency in action. Thousand Oaks, CA: Corwin Press, Inc.
Hershaff, s. (1980, Fall). Dropouts: A comparison of their general feelings of alienation and attitudes toward school with those of persisters. Southern Journal of Educational Research, 24(4), 274-276.
Hewitt, J.D., & Johnson, W. (1979, March). Dropping out of "Middletown." High School Journal, 62(6), 252-256. (ERIC Document Reproduction Service No. ED 215 372)
Higgins, c. (1991, Winter). I have a dream in Washington. DC {Initial Report). Philadelphia: Public/Private Ventures.
Hirschi, T. {1969). causes of delinquency. Berkeley: University of California Press.
Hunt, N., & Holt, B. (1979). The dropout report: Numbers of dropouts, current responses. recommendations. New York: New York City Public Schools.
Ianni, F.A.J. (1989}. Providing a structure for adolescent development. Phi Delta Kappan, 70(9}, 673-682.
Jacobi, M. {1991, Winter). Mentoring and undergraduate academic success: A literature review. Review of Educational Research, 61(4}, 505-532.
Jensen, E. (1994}. The learning brain. San Diego, CA: Turning Point Publishing.
196
Jobs for the Future. (1996). Executive summary: A year of progress in school-to-careers system building. (Brochure). Boston: The Benchmark Communities Initiative, Jobs for the Future.
Jones, R. (1997, August). (Interview with R. Jones, Director of Oregon Department of corrections, Department of Human Relations).
Kaplan, s. (1985, September). From gifted to general education: Exploring the spill-over effect, NASSP Bulletin, 69(482), 79-82.
Kaufman, F., Harrel, G., Milam, c., Woolverton, N., & Miller, J. (1986). The nature, role, and influence of mentors in the lives of gifted adults. Journal of Counseling and Development, 64(9), 576-578.
Kovalik, s., & Olsen, K. (1994). Integrated thematic instruction: The model. Kent, WA: Susan Kovalik & Assoc., Publishers.
Krupp, J.A. (1985, October). Mentoring: A means of sparking school personnel. Journal of Counseling and Development, 64(2), 154-155.
Kulik, c.c., & Kulik, J.A. (1982). Effects of ability grouping on secondary school students: A meta-analysis of evaluation findings, American Educational Research Journal, 19(3), 415-428.
Kushman, J., & Kinney, P. (1989). Understanding and preventing school dropouts. In D. Capuzzi & D.R. Gross (Eds.), Youth at risk: A resource for counselors. teachers and parents (pp. 345-365). Alexandria, VA: American Association for Counseling and Development.
Lambert, S.E., & Lambert, J.W. (1982, November/December). Mentoring: A powerful learning device. G/C/T/, 25(1), 12-13.
Lanier, P.R. (1986). A mentoring experience in the south Bronx: A successful strategy for conducting an innercity mentoring program. Mentoring: Aid to Excellence, 1(2), 40-46.

197
Laughrey, M.C. (1990). The design and implementation of a mentor program to improve the academic achievement of black male high school students (Educational Specialist Practicum Report). Fort Lauderdale, FL: Nova Southeastern University. (ERIC Document Reproduction service No. ED 328 647)
Lefkowitz, B. (1989). Tough change: Growing up on your own in America. New York: Free Press.
Levin, H. (1972). The costs of the nation of inadequate education (Report to the Select Committee on Equal Educational Opportunity, United States Senate). Washington, DC: U.S. Government Printing Office.
Levinson, D.J. (1978). The seasons of a man's life. New York: Alfred A. Knopf.
Lugg, C.A., & Boyd, W.L. (1993). Leadership for collaboration: Reducing risk and fostering resilience. Phi Delta Kappan, 75(3), 253-256.
MDC, Inc. (1985). The state's excellence in education commissions: Who's looking out for at-risk youth?. Prepared for the Charles Stewart Mott Foundation. Chapel Hill, NC: Author.
Mahan, G., & Johnson, c. (1983, April). Portrait of a dropout: Dealing with academic, social, and emotional problems. NASSP Bulletin, 67(462), 80-83.
Martin, D.L. (1980). A study of the family, personal, and subjective characteristics of school dropouts in Kentucky (Doctoral dissertation, University of Kentucky). Dissertation Abstracts International, 41(08), 3357A.
Mayeske, G.W. (1973). A study of the achievement of our nation's students. Washington, DC: U.S. Department of HEW Publication.
McDill, E., Nafriello, G., & Pallas, A. (1987). The high cost of high standards: School reform and dropouts, article in hot topic series Dropouts. Pushouts and Other Casualties. Bloomington, IN: Center on Evaluation, Development, Research of Phi Delta Kappa, pp. 183-209.
198
McPartland, J.M., & Nettles, S.M. (1991, August). Using community adults and advocates for at-risk middle school students: A two-year evaluation of Project RAISE. The American Journal of Education, 99(4), 568-586.
Meier, D. (1995). The power of their ideas. New York: Beacon Press.
Mernit, s. (1990). Kids today. Instructor, 100(2), 35-36, 41-43.
Mosqueda, P.F. (1990). Mentoring young people makes a difference. Denver, co: Education Commission of the States. (ERIC Document Reproduction Service No. ED 317 945)
Nafriello, G., McOill, E.L., & Pallas, A.M. (1985, September). School reform and potential dropouts, Educational Leadership. Journal of the Department of Superyision and curriculum Development, 43(1), 10-14.
National Association of Secondary School Principals. (1988). The practitioner: A newsletter for the on-line administrator, 15(2), 1-4.
National Center for Education Statistics. (1995a). The condition of education. 1994. Washington, DC: U.S. Department of Education, Office of Educatio~~l Research and Improvement. (ERIC Document Reproduction Service No. ED 381 685)
National Center for Education Statistics. (1995b). (Report No: NCES-95-720). Washington, DC. (ERIC Document Reproduction Service No. ED 382 756)
National Center for Education Statistics. (1996). Dropout rates in the United States: 1994. Washington, DC: u.s. Department of Education: Office of Educational Research and Improvement.
National Coalition of Advocates for Students. (1986). Barriers to excellence: Our children at risk. Boston, MA: Author.
National Commission on Excellence in Education. (1983). A nation at risk: The imperative for educational reform. Washington DC: U.S. Government Printing Office.
National Foundation for the Improvement of Education. (1986). A blueprint for success: Operation rescue.
199
Washington, DC: Author. (ERIC Document Reproduction Service No. ED 274 093)
New York Public Schools. (1979). The dropout report. Brooklyn: Board of Education, City of New York.
Nichols, C.E. (1984). The development of a dropout prediction instrument for an urban high school (Doctoral dissertation, University of Pennsylvania) . Dissertation Abstracts International, 44, 3564A.
Ohio State Department of Education. (1983). Reducing dropouts in Ohio schools: Guidelines and promising practices. a guide to drop out prevention. intervention and remediation. Columbus: Ohio State Department of Education. (ERIC Document Reproduction Service No. ED 262 316)
Oregon Department of Education. (1980). Oregon early school leavers study. Salem, OR: Author.
Oregon Department of Education. (1997). Oregon early school leavers study. Salem, OR: Author.
Outen, D. (1989, summer). The mentor project: Aid for teachers and students. Mentoring International, 2(3), 35-42.
Pallas, A. (1986). School dropouts in the United States. In J.D. Stem & M.F. Williams (Eds.), The condition of education {pp. 158-174). Washington, DC: United States Government Printing Off ice.
Parkay, F.W. (1988, Summer). Reflections of a protege, Theory into Practice, 27(3), 196-200.
Parnell, D. (1985). The neglected majority. Washington, DC: The Community College Press.
Patton, M.Q. (1990). Qualitative evaluation and research methods (2nd ed.). Newbury Park, CA: Sage Publications, Inc.
Peng, S.S. & Takai, R.T. (1983, November). High school dropouts: Descriptive information from high school and beyond. National Center for Educational Statistics Bulletin, pp. 1-9. (ERIC Document Reproduction Service No. ED 236 366)
Phillips, L.L. (1977). Mentors and proteges: A study of the career development of women managers and executives in business and industry. Unpublished doctoral dissertation, University of California at Los Angeles.
200
Phillips-Jones, L. (1983). Mentors and proteges. New York: Arbor House.
Poole, M.E. (1994, Summer). The schools adolescents would like. Adolescence, 19(74), 447-458.
Portland Leaders Roundtable Planning Project. {1986). Working papers: Ingredients of a comprehensive system for at-risk youth. Portland, OR: Portland Public Schools.
Presseisen, J.L. (1985). Unlearned lessons: Current and past reforms for school improvement. Philadelphia: The Falmer Press.
Research and Policy Committee of the Committee for Economic Development. (1987). Children in need: Investment strategies for educationally disadvantaged. New York: NYNEX Foundation.
Rhodes, D.C., & McMillan, S.H. (1987). Refocusing schools for dropout prevention: With implications for teacher education. Washington, DC: National Foundation for Improvement of Education. (ERIC Document Reproduction Service No. ED 277 698)
Richardson, H.B. (1987, Fall). Bronx Community College and the student mentor program for at-risk high school students. Community Review, ~(1), 33-37.
Robertson, E. (1991). Neglected dropouts: The gifted and talented. Equity and Excellence, 25(1), 62-74.
Rosenbaum, J.E. (1980). Social implications of educational grouping. Review of Research in Education, ~' 361-401.
Sappington, J.P. (1979). The predictive strength of nine school related indicators for distinquishing potential dropouts (Doctoral dissertation, us International University). Dissertation Abstracts International, 41, 2944A.

Schein, E. (1978). Career dynamics: Matching individual and organizational needs. Reading, MA: Addison-Wesley.
201
Schonert-Reich!, K.A. (1992). Seeking help and social support in adolescence: The role of non-related adults. New York: Columbia University. (ERIC Document Reproduction Service, No. ED 354 295)
Schrieber, D. (1964). Guidance and the school dropout. Washington, DC: American Personnel and Guidance Association.
Schwartz, w. (1995, August). School dropouts: New information about an old problem. (ERIC/CUE Digest, 109). New York: ERIC Clearinghouse on Urban Education. (ERIC Document Reproduction Service No. ED 386 515)
Self, T.C. (1985, April). Dropouts: A review of literature. Monroe: Project Talent Search, Northeast Louisiana University.
Shavelson, R.J. (1996). Statistical reasoning for the behavioral sciences (3rd ed.). Boston: Allyn and Bacon.
Sheehy, G. (1976). Passages: Predictable crises of adult life. New York: Dutton.
Sizer, T.B. (1984). Horace's compromise: The dilemma of the American high school today. Boston: Houghton Mifflin.
Slater, G. (1997). Employment and education. Salem: Oregon State Department of Labor.
Slicker, E.K., & Palmer, D.J. (1993, May). Mentoring atrisk high school students: Evaluation of a schoolbased program. School Counselor, 40(5), 327-334.
Smink, J. (1990). Mentoring programs for at-risk youth: A dropout prevention research report. Clemson, SC: National Dropout Prevention Center. (ERIC Document Reproduction Service No. ED 318 931)
Stanwyck, D.J., & Anson, C.A. (1989). The adopt a student evaluation project final report. Atlanta: Georgia State University, Department of Educational Foundations.
202
Stradford, c.w. (1993, June). Implementation of a rural program to reduce the dropout rate of 9th and 10th grade at-risk students. Practicum. Fort Lauderdale, FL: Nova Southeastern University. (ERIC Document Reproduction Service No. ED 368 527)
Thesaurus of ERIC Desriptors. (1990). Twelfth Edition. Oryx Press, Phoenix, AZ; 161.
Timberlake, C. (1980, June). Why do students dropout of School?: A selected and related literature review. Syracuse: Syracruse University. (ERIC Document Reproduction Service No. ED 189 502)
Torrance, E. (1983). Role of mentors in creative achievement. The Creative Child and Adult Quarterly, !l,(18), 8-15.
U.S. Department of Education. (1992). One-on-one: A guide for establishing mentor programs. Washington, DC: U.S. Department of Education.
U.S. Department of Labor. (1992). Learning a living: A blueprint for high performance. Washington, DC: Secretary's Commission on Achieving Necessary Skills (SCANS).
Vaillant, G.E. (1977). Adaptation to life. Boston: Little Brown.
Voss, H.C., Wendling, A., & Elliot, D.S. (1966, April). Some types of highschool dropouts, The Journal of Educational Research, 59(8), 360-367.
Weber, J.E., & Silani-Lacey, c. (1983). Building basic skills: The dropout (Research and Development Series No. 236). Columbus, OH: National Center for Research in Vocational Education. (ERIC Document Reproduction Service No. CE 036 465)
Wehlage, G. (1983). Effective programs for the marginal high school student. Bloomington, IN: Phi Delta Kappa. (ERIC Document Reproduction Service No. ED 235 132)
Wehlage, G., & Rutter, R.A. (1986, Spring). Dropping out: How much do schools contribute to the problem? Teachers College Record, 87(3), 374-392.

203
Wehlage, G., Rutter R.A., & Turnbaugh, A. (1987, March). A program model for at-risk high shool students, Educational Leadership, 44(6), 70-73.
Werner, E.E., & Smith, R.S. (1982). Vulnerable but not invincible: A longitudinal study of resilient children and youth. New York: McGraw-Hill.
Werner, E.E., & Smith, R.S. (1992). overcoming the odds: High risk children from birth to adulthood. New York: Cornell University Press.
Wiersma, W. (1969). Research methods in education. Philadelphia: J.B. Lippincott Company.
Wiles, K. (1963). The changing curriculum of the American high school. New Jersey: Prentice-Hall, Inc.
Wolin, s., & Wolin, s. (1993). The resilient self: How survivors of troubled families rise above adversity. New York: Random House.
Wrenn, c. (1967). The dropout and the school counselor. In D. Schreiber (Ed.), The school dropout (pp. 192-205). New York: Vantage Books.

APPENDIX A
QSL ITEM CHARACTERISTICS
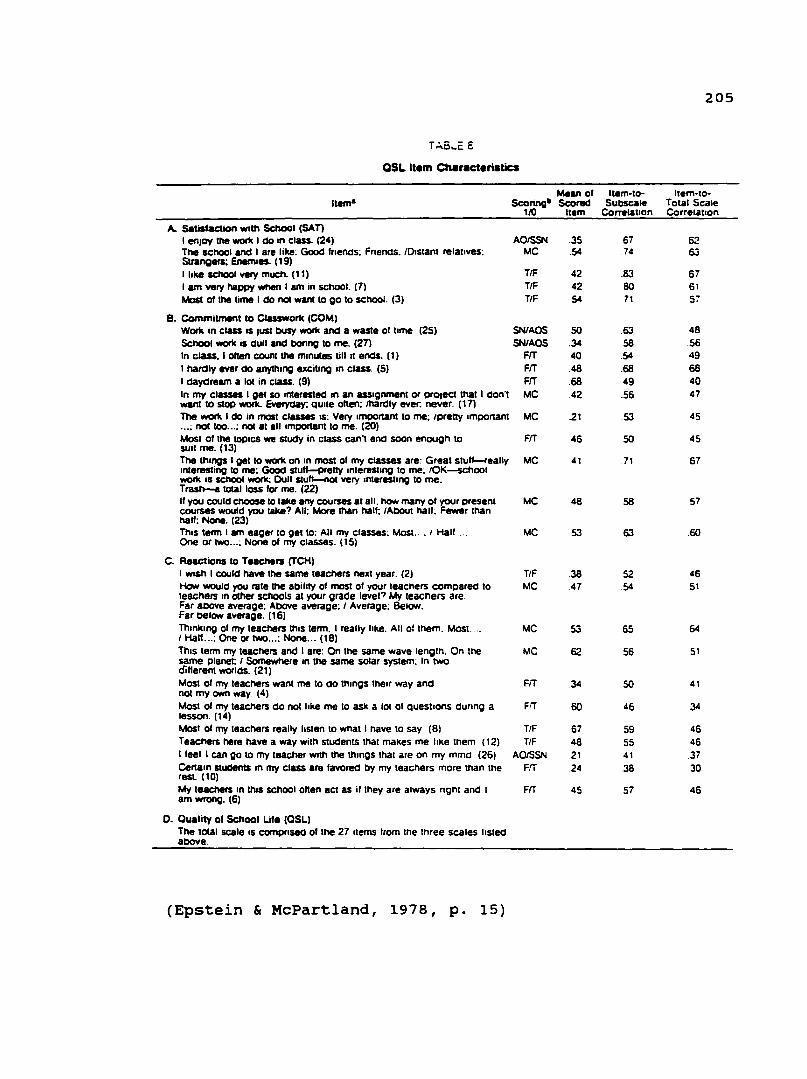
T.:.6 ... E E
QSL Item Characteristics
Item•
A.. Satiafac:tion with School (SAn I en1oy tne work I do 1n class. (24) The school and I are like: Good lnends: Friends. /Distant relatives: Strangers; Enemies. (19) I like school very much. (11) 1 am very happy wnen 1 am in school. (7) Most of lhe time I do not want to go to school. (3)
B. Commitment to Classwork (COM) Work 1n clasS IS Just buSy work and a waste of lime (25) School work is dull and boring to me. (27) In class. I ohen count the minutes till it ends. (1) 1 hardly ever do anything exciting in class. (5) I daydream a lot in class. (9) In my classes I get so interested in an assignment or pro1ec:t that I don't want to stop work. Everyday; quite often; /hardly ever: never. (17) The work I do in moat classes 15: Very important to me; /pretty important ... ; not too ... ; not at all important to me. (20) Most ol the toP1cs we study in class can·t end soon enough to SUit me. (13) The things I get to work on in most ol my classes are: Great stull-feally interesting to me; Good stult-pretty intereshng to me: !OK-school work is sc:nool work: Dull stufl-not very 1nterest1ng to me. Trash-e tolal loss tor me. (22) II you could c:noose to take any courses at all. how many or your present courses would you take? All; More than hall; /About hall: Fewer than hall: None. (23) This term I am eager to get to: All my classes: Most .. • I Hall ... One or two ... ; None ol my classes. ( 15)
C. Reactions to Teachers (TCH) I Wish I could have the same teac:hers next year. (2) How would you rate the ability of most ot your teachers compared to teachers 1n other schools at your grade level? My teacners are Far aoove average; ADove average: I Average: Below. Far bel01¥ average. (16) Thinking ot my teachers this term. I really like. All of them; Most .. 1 Hall ... ; One or two ... ; None ... (18) This 1erm my teachers and I are: On the same wave length. On the same planet: I Somewhere in the same solar system; In two ditterent worlds. (21) Most ol my teachers want me to do things their way and not my 01¥0 way. (4) Mos1 ol my teachers do not like me to ask a lot ot questtons during a lesson. (14) Most ol my teachers really listen to what I nave to say (8) Teachers here have a way with students that makes me like them (12) I feel I can go to my teacher with the things thal are on my mind (26) Certain students 1n my class are favored by my teachers more than the rest (10) My teachers in thlS sc:tlool often ac:1 as ii they are always right and I am wrong. (6)
O. Quality ol School Life (QSL) The total scale 1s c:ompnsed ot the 27 11ems lrom rne three scales listed above.
(Epstein & McPartland, 1978, p. 15)
Mean of Sconng11 Scorad
1/0 Item
ACISSN .35 MC .54
T/F 42 T/F 42 T/F 54
SN/ACS 50 SN/ACS .34
FIT 40 FIT .48 FIT .68 MC 42
MC .21
FIT 46
MC 41
MC 48
MC 53
TIF .38 MC 47
MC .53
MC 62
FIT 34
FIT 60
TIF 67 T/F 48
ACISSN 21 FIT 24
FIT 45
205
Item-to- Item-to-Sutiscale Total Scale
Correlation Correlation
67 62 74 63
.83 67 80 61 7t Si
.63 48
.58 56
.54 49
.68 68 49 40 .56 47
.53 45
50 45
71 67
58 57
63 .60
52 46 54 51
65 64
56 St
50 4t
46 34
59 46 55 46 4t .37 .38 30
57 46

APPENDIX B
MENTOR (STAFF) CAKE SURVEY
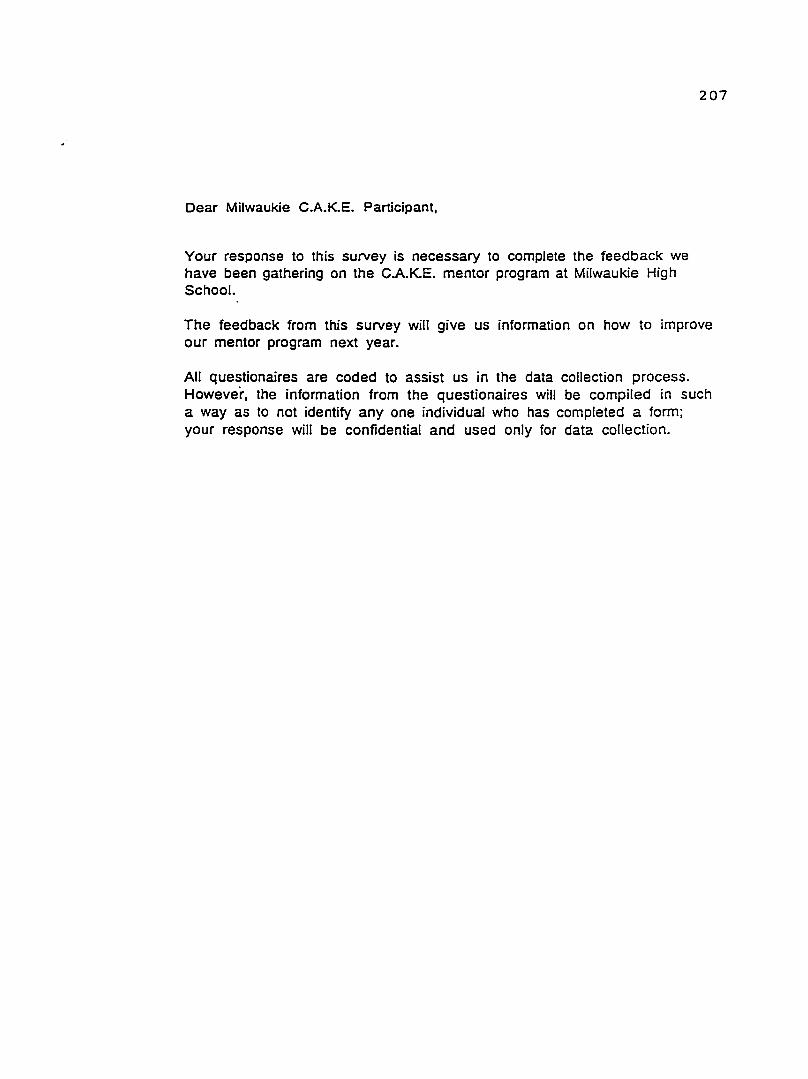
Dear Milwaukie C.A.K.E. Participant,
Your response to this survey is necessary to complete the feedback we have been gathering on the C.A.K.E. mentor program at Milwaukie High School.
207
The feedback from this survey will give us information on how to improve our mentor program next year.
All questionaires are coded to assist us in the data collection process. However, the information from the questionaires will be compiled in such a way as to not identify any one individual who has completed a form; your response will be confidential and used only for data collection.

208
code number
·A QUESTIONAIRE DESIGNED TO GATHER DESCRIPTIVE DATA CONCERNING THE MENTORSHIP PROGRAM AT MILWAUKIE HIGH SCHOOL (CAKE)
DIRECTIONS: PLEASE ANSWER EACH OF THE FOLLOWING QUESTIONS BY MARKING DIRECTLY ONTO THE SURVEY FORM. PLEASE RETURN THIS QUESTIONAIRE TO GAIL HA YES. APPRECIATE YOUR WILLINGNESS TO SHARE YOUR THOUGHTS CONCERNING THIS MENTOR PROGRAM.
SECTION I
1. Were you a mentor in the mentorship program, C.A.K.E.?
__ yes __ no
PLEASE CIRCLE THE NUMBER THAT APPLIES FOR EACH OF THE FOLLOWING QUESTIONS BY USING THIS SCALE:
1 = very satisfied 4 = dissatisfied
2 = satisfied 3 = neutral 5 = very dissatisfied
2. How would you rate your participation in the CAKE mentorship program?
1 2 3 4 5
3. How would you rate the program's value in helping students develop a positive attitude towards school?
1 2 3 4 5
4. Was your mentee in a class taught by you during your participation in CAKE.?
__ yes __ no

.
PLEASE CIRCLE THE NUMBER THAT APPLIES FOR EACH OF THE FOLLOWING QUESTIONS BY USING THIS SCALE:
1 = strongly agree 4 =disagree
2 = agree 3 = undecided 5 = strongly disagree
S. Answer only one: SA or SB
A. Was the fact that the mentee (student) was in one or more classes taught by the mentor helpful?
1 2 3 4 5
B. Was the fact that the mentee (student) was not in class taught by the mentor helpful?
1 2 3 4 5
Please briefly explain why (optional):
6. Were you and your mentee well-matched with respect to interests? Circle the number that applies.
1 2 3 4 5
7. Was time available during the school day a negative factor in your mentoring experience?
1 2 3 4 5
Please explain briefly:
209
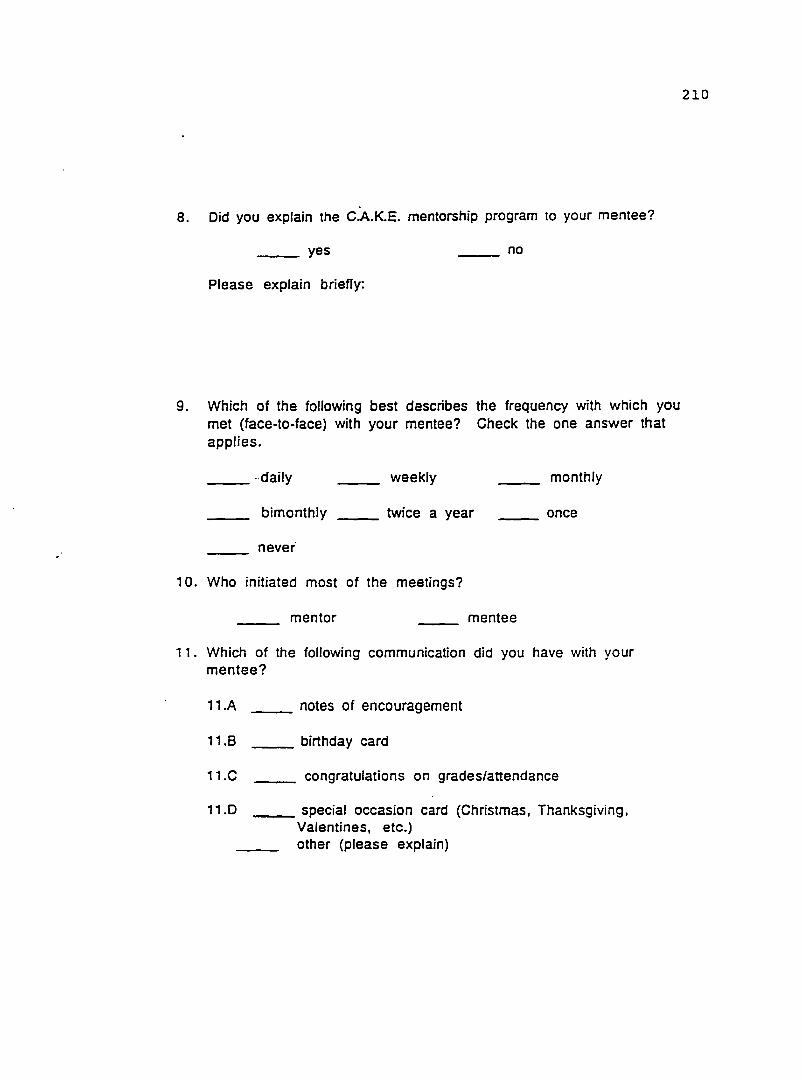
a. Did you explain the c:A.K.E. mentorship program to your mentee?
yes ___ no
Please explain briefly:
9. Which of the following best describes the frequency with which you met (face-to-face) with your mentee? Check the one answer that applies.
___ --daily weekly monthly
bimonthly ___ twice a year ___ once
never
1 O. Who initiated most of the meetings?
mentor mentee
11. Which of the following communication did you have with your mentee?
11.A notes of encouragement
11.B birthday card
11.C congratulations on grades/attendance
11.D special occasion card (Christmas, Thanksgiving, Valentines, etc.) other (please explain)
210

. I
12. Which of the following did you participate in with your mentor?
12.A lunch at school
12.B __ lunch or dinner off campus
12.C attend an after school activity together
12.D visit your mentee's home
Please explain briefly:
13. Did you have communication with the mentee's guardian/parent(s)?
__ yes ___ no
If •yes· what kind of communication did you have with parents? Check one box used most frequently.
13.A letter 13.B phone call 13.C face to face meeting
1 4. Please rate the topics discussed in any meetings you have had with your mentee? Please rate them "1 • thru ·s· with "1 "= most times and ·s·= least times.
progress in class(es)
. ·;, family issues
__ teacher issues
help with homework
friends
involvement in activities
211
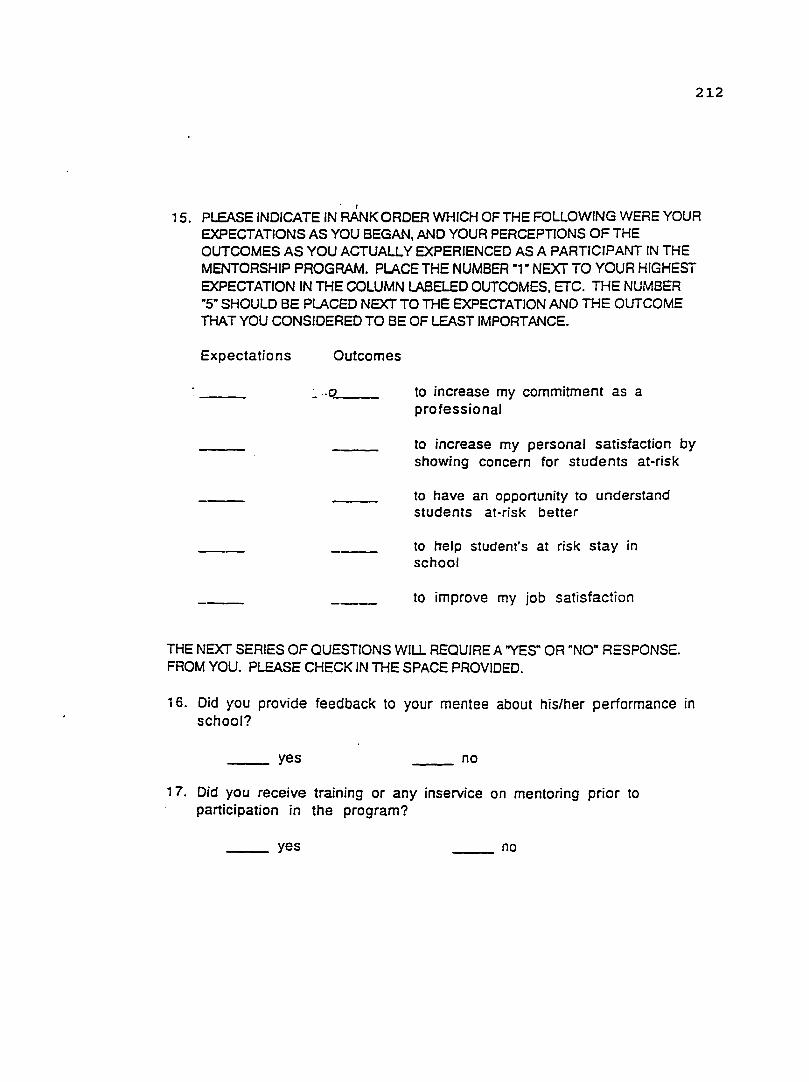
212
• I
15. PLEASE INDICATE IN RANK ORDER WHICH OF THE FOLLOWING WERE YOUR EXPECTATIONS AS YOU BEGAN, AND YOUR PERCEPTIONS OF THE OUTCOMES AS YOU ACTUALLY EXPERIENCED AS A PARTICIPANT IN THE MENTORSHIP PROGRAM. PLACE THE NUMBER ·1 ·NEXT TO YOUR HIGHEST EXPECTATION IN THE COLUMN LABELED OUTCOMES, ETC. THE NUMBER "5" SHOULD BE PLACED NEXT TO THE EXPECTATION AND THE OUTCOME THAT YOU CONSIDERED TO BE OF LEAST IMPORTANCE.
Expectations Outcomes
:_..o.__ __ to increase my commitment as a professional
to increase my personal satisfaction by showing concern for students at-risk
to have an opportunity to understand students at-risk better
to help student's at risk stay in school
to improve my job satisfaction
THE NEXT SERIES OF QUESTIONS WILL REQUIRE A "YES" OR "NO" RESPONSE. FROM YOU. PLEASE CHECK IN THE SPACE PROVIDED.
1 6. Did you provide feedback to your mentee about his/her performance in school?
yes __ no
17. Did you receive training or any inservice on mentoring prior to participation in the program?
__ yes __ no
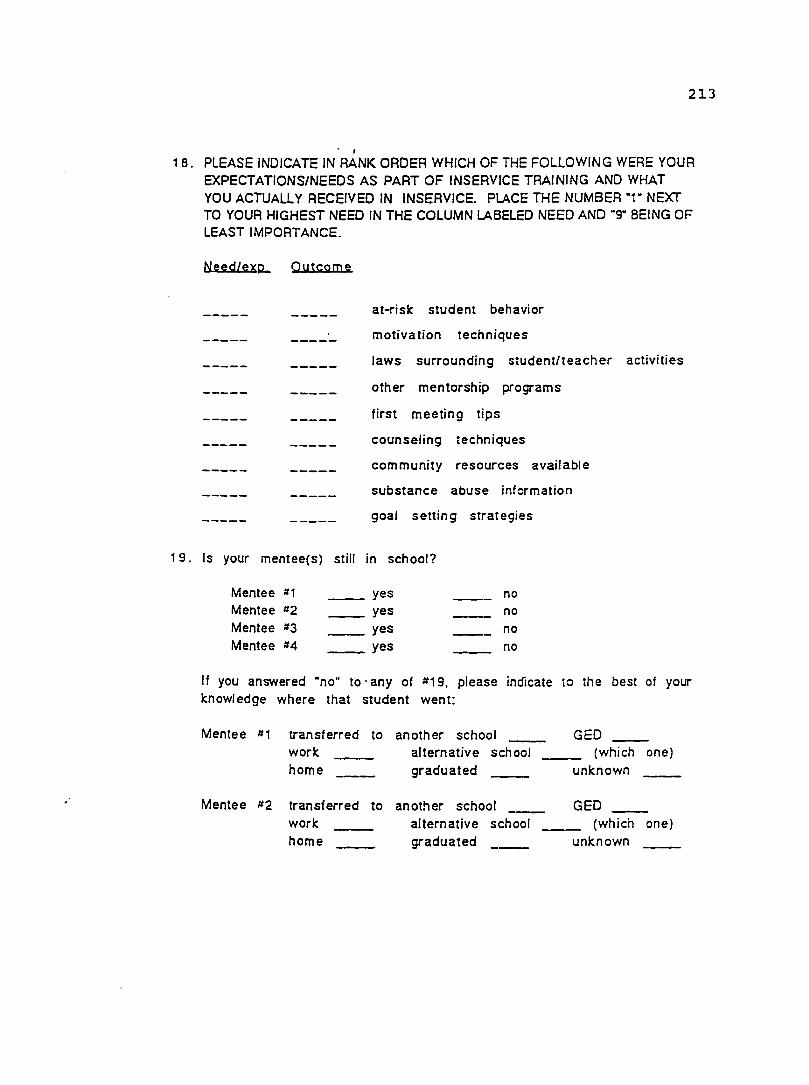
21.3
. I
18. PLEASE INDICATE IN RANK ORDER WHICH OF THE FOLLOWING WERE YOUR EXPECTATIONS/NEEDS AS PART OF INSERVICE TRAINING AND WHAT YOU ACTUALLY RECEIVED IN INSERVICE. PLACE THE NUMBER ·1 • NEXT TO YOUR HIGHEST NEED IN THE COLUMN LABELED NEED AND ·9· BEING OF LEAST IMPORTANCE.
19.
Need/exp Oytcome
----- ----- at-risk student behavior
----- ----- motivation techniques
----- ----- laws surrounding student/teacher activities
----- ----- other mentorship programs
----- ----- first meeting tips
----- ----- counseling techniques
----- ----- community resources available
----- ----- substance abuse information
----- ----- goal setting strategies
Is your mentee(s) still in school?
Mentee 111
Mentee 112
Mentee 113
Mentee lt4
__ yes __ yes __ yes __ yes
no no no no
If you answered "no" to· any of #19, please indicate to the best of your knowledge where that student went:
Mentee It 1 transferred to another school GED work alternative school -- (which one) home graduated -- unknown
Mentee #2 transferred to another school GED __
work alternative school -- (which one) home graduated --- unknown
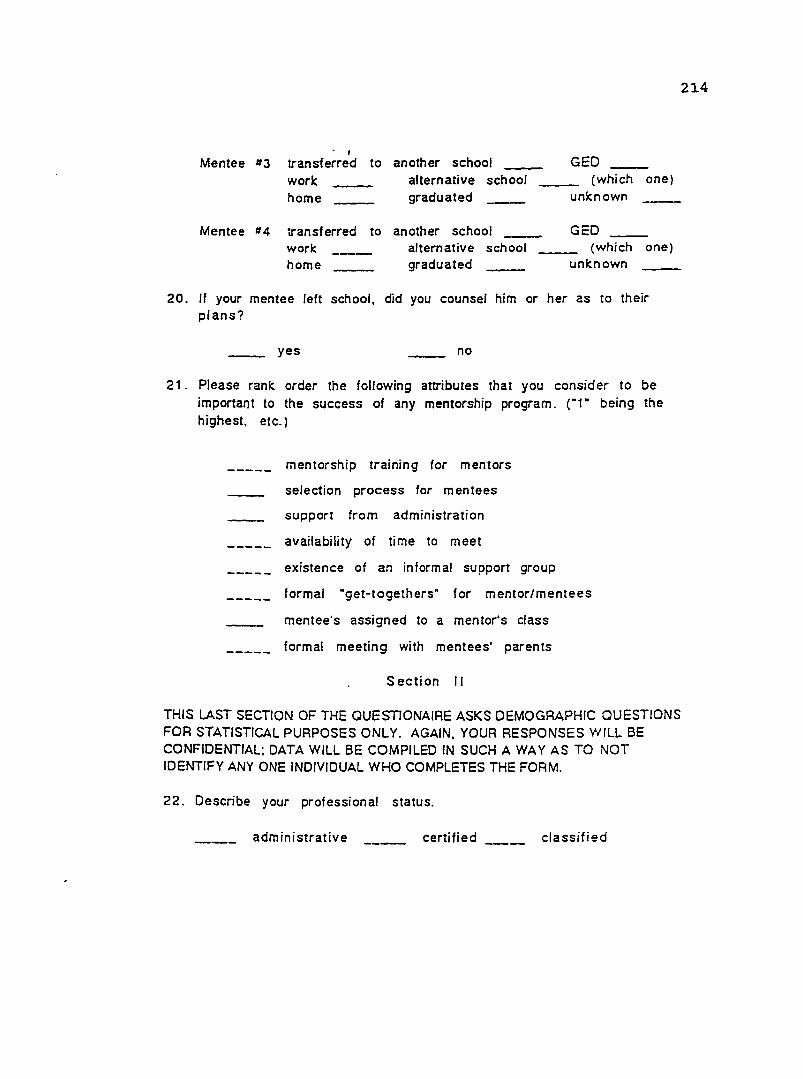
214
. , Mentee #3 transferred to another school _ GED
work alternative school __ (which one) home graduated _ unknown
Mentee 114 transferred to another school _ GED work alternative school __ (which one) home __ graduated ___ unknown _
20. If your mentee left school, did you counsel him or her as to their plans?
yes no
21 . Please rank order the following attributes that you consider to be important to the success of any mentorship program. c-1· being the highest, etc.)
mentorship training for mentors
selection process for mentees
support from administration
availability of time to meet
existence of an informal support group
formal "get-togethers· for mentor/mentees
mentee's assigned to a mentor's class
formal meeting with mentees' parents
Section II
THIS LAST SECTION OF THE OUESTIONAIRE ASKS DEMOGRAPHIC QUESTIONS FOR STATISTICAL PURPOSES ONLY. AGAIN, YOUR RESPONSES WILL BE CONFIDENTIAL; DATA WILL BE COMPILED IN SUCH A WAY AS TO NOT IDENTIFY ANY ONE INDIVIDUAL WHO COMPLETES THE FOAM.
22. Describe your professional status.
administrative certified classified
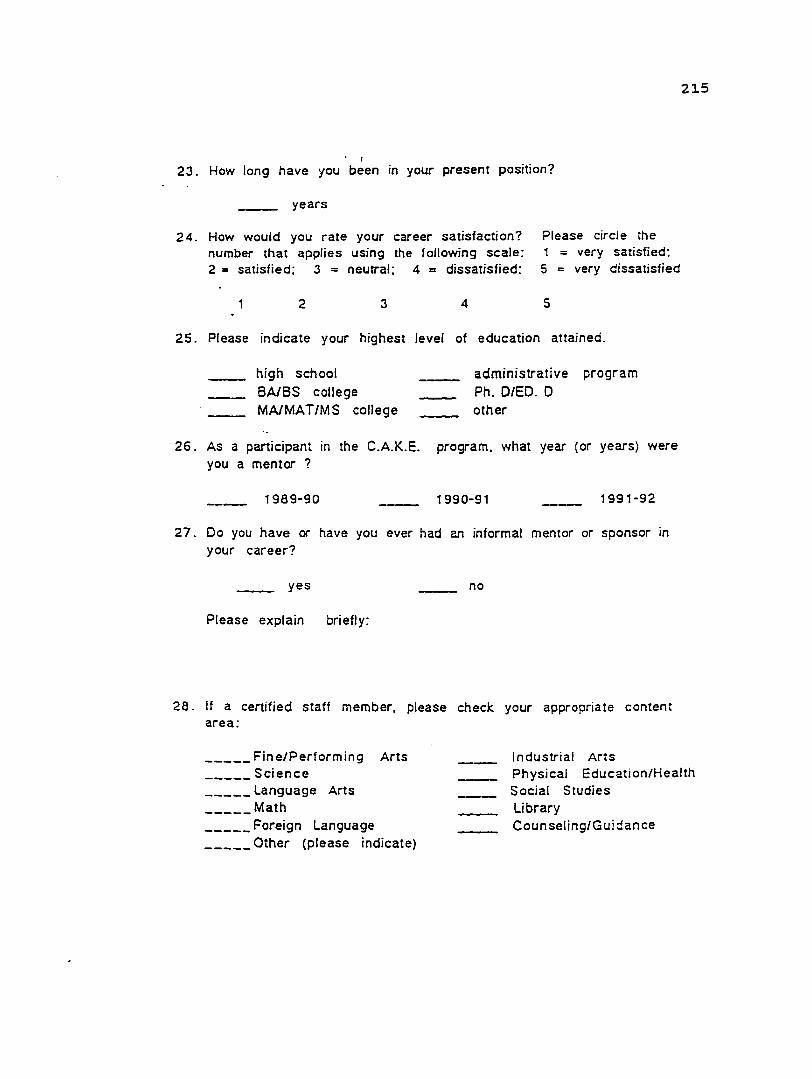
• I
23. How long have you been in your present position?
years
24. How would you rate your career satisfaction? number that applies using the following scale: 2 = satisfied; 3 = neutral; 4 = dissatisfied:
2 3 4
Please circie the 1 = very satisfied: S = very dissatisfied
s
25. Please indicate your highest level of education attained.
high school BA/BS college MA/MAT/MS college
administrative program
Ph. DIED. D other
26. As a participant in the C.A.K.E. program. what year (or years) were you a mentor ?
1989-90 1990-91 1991-92
27. Do you have or have you ever had an informal mentor or sponsor in your career?
__ yes no
Please explain briefly:
28. If a certified staff member. please check your appropriate content area:
-----Fine/Performing Arts Industrial Arts
2:l5
-----Science _____ Language Arts _____ Math
Physical Education/Health Social Studies Library
-----Foreign Language Counseling/Guidance -----Other (please indicate)

216
I
If a classified staff member. please indicate your area:
secretarial media services
kitchen custodial
campus monitor other (please explain)
29. Please check you appropriate age category:
--- 20-24 45-49
--- 25-29 50-54
--- 30-34 55-59
--- 35-39 60 +
40-44 ---30. Please indicate your racial/ ethnic group:
Native American Asian American African American Hispanic Caucasian/White Other
31. Please check the appropriate category:
male female
Any additional comments: (Suggestions to make the CAKE program better. more efective?)

APPENDIX C
MENTEE (STUDENT) CAKE SURVEY

Dear Milwaukie C.A.K.E. Participant,
Your response to this survey is necessary to complete the feedback we have been gathering on the C.A.K.E. mentor progam at Milwaukie High School.
218
The feedback from this survey will give us information on how to improve our mentor program next year.
All questionaires are coded to assist us in the data collection process. However, the information from the questionaires will be compiled in such a. way as to not identify any one individual who has completed a form: your response will be confidential and ·used only for data collection.
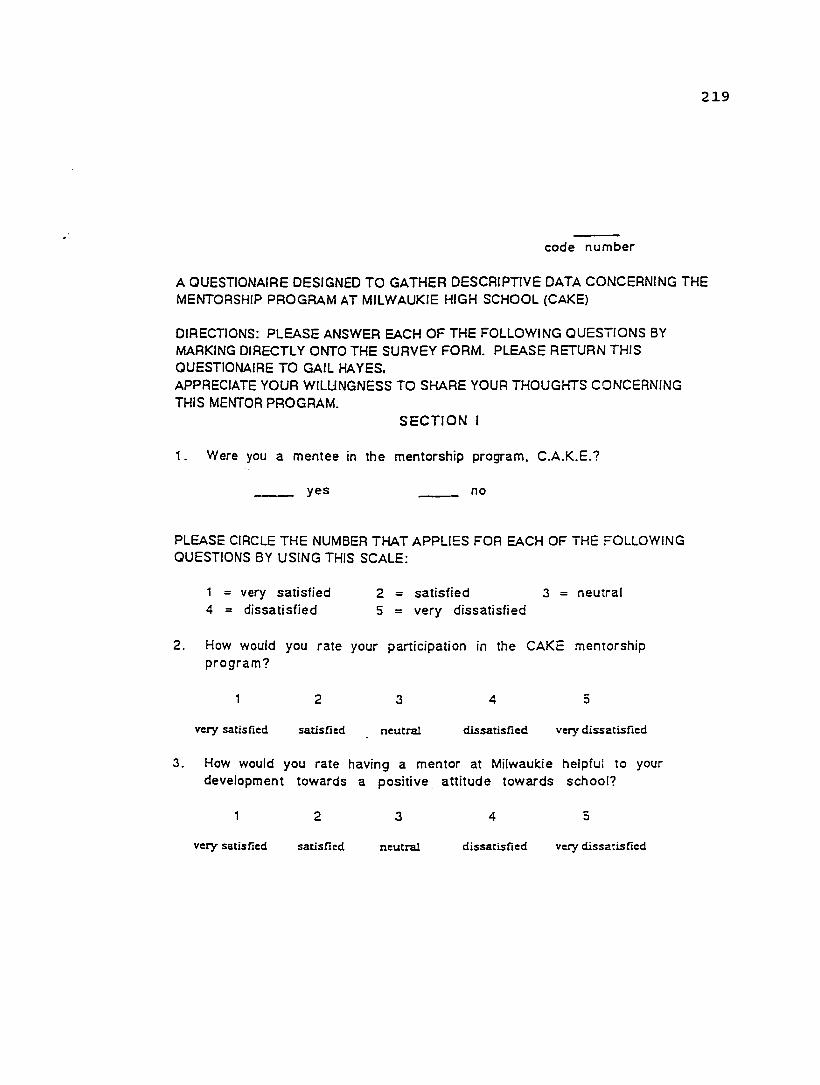
219
code number
A QUESTIONAIRE DESIGNED TO GATHER DESCRIPTIVE DATA CONCERNING THE MENTORSHIP PROGRAM AT MILWAUKIE HIGH SCHOOL (CAKE)
DIRECTIONS: PLEASE ANSWER EACH OF THE FOLLOWING QUESTIONS BY MARKING DIRECTLY ONTO THE SURVEY FORM. PLEASE RETURN THIS QUESTIONAIRE TO GAIL HA YES. APPRECIATE YOUR WILLINGNESS TO SHARE YOUR THOUGHTS CONCERNING THIS MENTOR PROGRAM.
SECTION I
1. Were you a mentee in the mentorship program. C.A.K.E.?
__ yes no
PLEASE CIRCLE THE NUMBER THAT APPLIES FOR EACH OF THE FOLLOWING QUESTIONS BY USING THIS SCALE:
1
4 very satisfied dissatisfied
2 = satisfied 3 neutral 5 = very dissatisfied
2. How would you rate your participation in the CAKE mentorship program?
2 3 4 5
very satisfied satisfied neutral dissatisfied very dissatisfied
3. How would you rate having a mentor at Milwaukie helpful to your development towards a positive. attitude towards school?
2 3 4 5
very satisfied satisfied neutral dissatisfied very dissatisfied
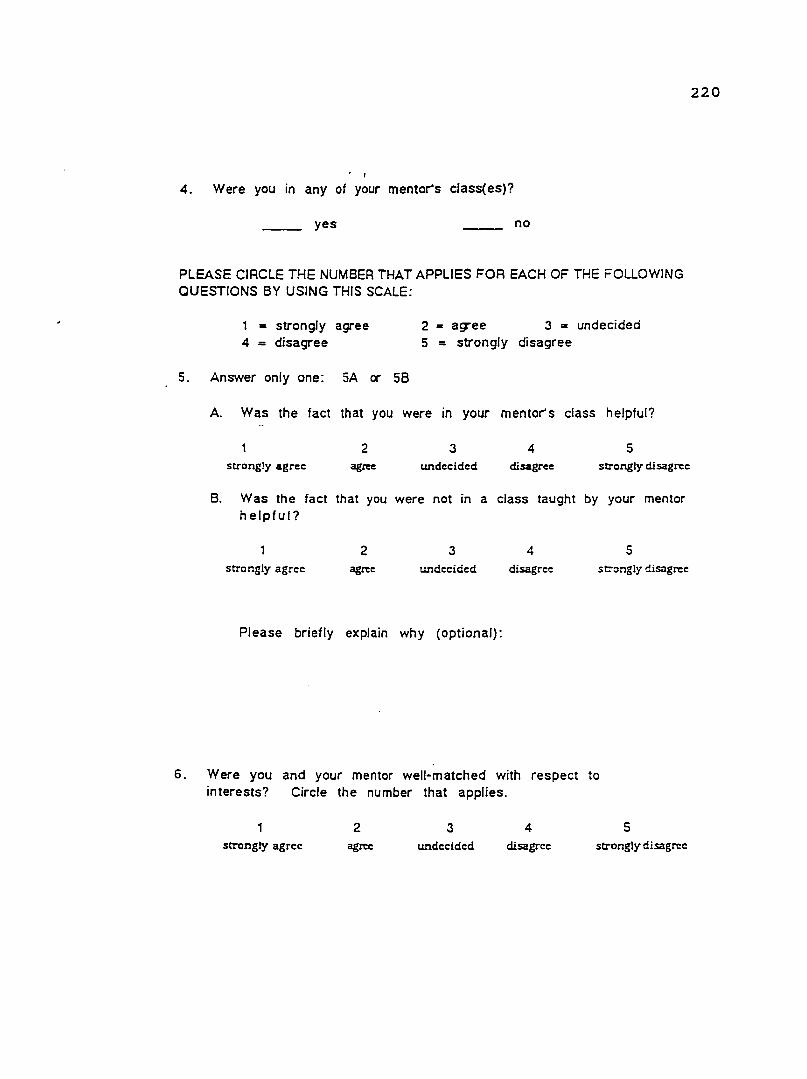
• I
4. Were you in any of your mentor's class(es)?
__ yes no
PLEASE CIRCLE THE NUMBER THAT APPLIES FOR EACH OF THE FOLLOWING QUESTIONS BY USING THIS SCALE:
1 = strongly agree 2 = agree 3 = undecided 4 disagree 5 = strongly disagree
5. Answer only one: SA or 58
A. Was the fact that you were in your mentor's class helpful?
2 3 4 5 strongly agree agree undecided disagree strongly disagree
B. Was the fact that you were not in a class taught by your mentor helpful?
2 3 4 5 strongly agree agree undecided disagree st:"ongly disagree
Please briefly explain why (optional):
6. Were you and your mentor well-matched with respect to interests? Circle the number that applies.
1 strongly agree
2 agree
3 undecided
4 disagree
5 strongly disagree
220

221
. I
7. Was time available during the school day a ~~ factor in your mentee experience?
5
strongly asrcc
2 agr=
3 undecided
4
disagree strongly disagree
Please explain briefly:
8. Were you told that you were a part of the mentor program?
___ yes no
If not, how did the mentor explain their interest in how you were doing in school. Would you want to lcnow if you had a mentor?
9. Which of the following best describes the frequency with which you met (face-to-face) with your mentor? Check the one answer that applies.
daily weekly monthly
bimonthly twice a year once
_ never
1 O. Who initiated most of the meetings?
___ mentor mentee (you)

• I
11 . Which of the following communication did you receive from your mentor?
11 .A notes of encouragement
11.B birthday card
11.C __ congratulations on grades/attendance
11.D __ special occasion card (Christmas, Thanksgiving, Valentines, etc.) other (please explain)
1 2. Which of the following did you participate in with your mentor?
12.A lunch at school
12.B lunch or dinner off campus
12.C __ attend an after school activity together
12.D __ visit your home
Please explain briefly:
222
13. Did your mentor have· communication with your guardian/parent(s)?
__ yes no
If "yes· what kind of communication with parents? box used most frequently.
13.A 13.B 13.C
letter phone call face to face meeting
Check one
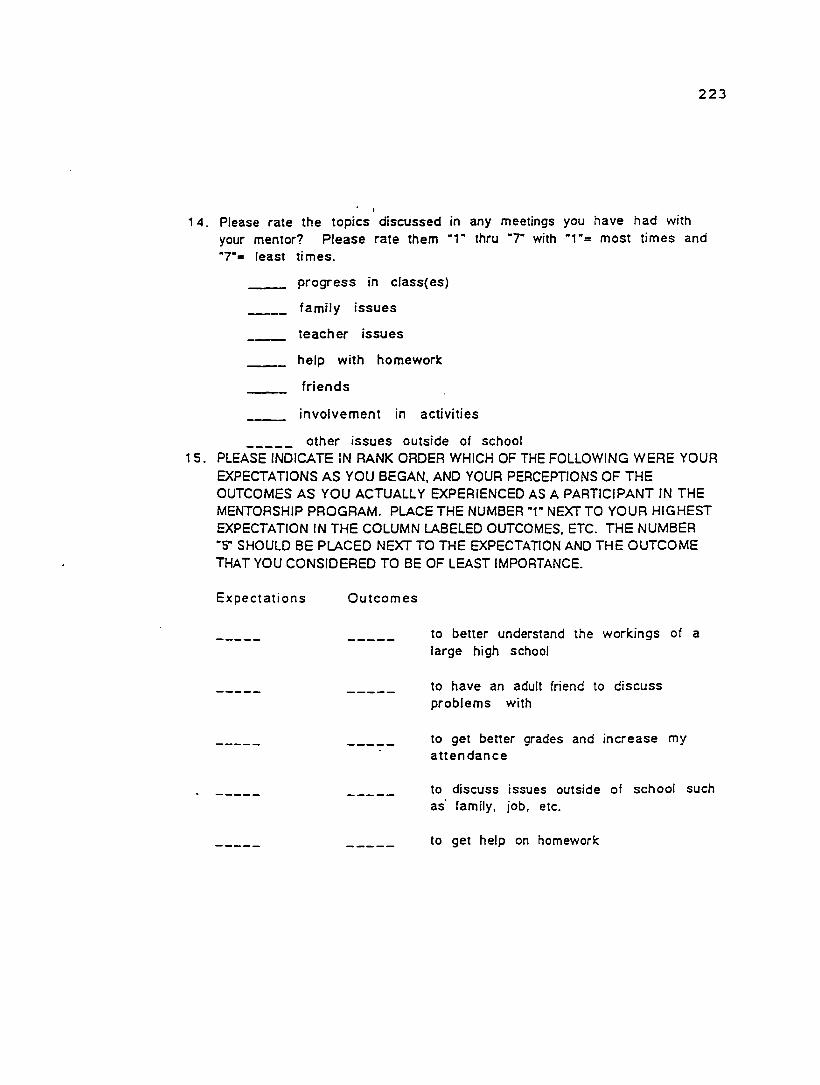
223
• I
1 4. Please rate the topics discussed in any meetings you have had with your mentor? Please rate them ·1· thru ·r with "1"= most times and "7"= least ti mes.
progress in class(es)
family issues
teacher issues
help with homework
friends
involvement in activities
----- other issues outside of school 15. PLEASE INDICATE IN RANK ORDER WHICH OF THE FOLLOWING WERE YOUR
EXPECTATIONS AS YOU BEGAN, AND YOUR PERCEPTIONS OF THE OUTCOMES AS YOU ACTUALLY EXPERIENCED AS A PARTICIPANT IN THE MENTORSHIP PROGRAM. PLACE THE NUMBER "1" NEXT TO YOUR HIGHEST EXPECTATION IN THE COLUMN LABELED OUTCOMES, ETC. THE NUMBER "5• SHOULD BE PLACED NEXT TO THE EXPECTATION AND THE OUTCOME THAT YOU CONSIDERED TO BE OF LEAST IMPORTANCE.
Expectations Outcomes
to better understand the workings of a large high school
to have an adult friend to discuss problems with
to get better grades and increase my attendance
to discuss issues outside of school such as· family, job, etc.
to get help on homework

. I
THE NEXT QUESTION WILL REQUIRE A ·vEs· OR ·No· RESPONSE FROM YOU. PLEASE CHECK IN THE SPACE PROVIDED.
1 6. Did you receive feedback from your mentor about your performance in school?
__ yes no
PLEASE CIRCLE THE NUMBER THAT APPLIES FOR EACH OF THE FOLLOWING QUESTIONS BY USING THIS SCALE:
1 = strongly agree 4 = disagree
2 = ag-ee 3 = undecided 5 = strongly disagree
224
17. Having a mentor in high school has made a positive difference in how I am performing in school.
1 2 3 4 5 strongly agree agree undecided disagree strongly disagree
18. I feel as though I can go to my mentor anytime I need help.
1 2 3 4 5 strongly agree agree u.:1decidcd disagree strongly disagree
19. I was able to talk to my mentor most of the time I needed to.
2. 3 4 strongly agree agn:e undecided disagree
20. Compared to last year. I am doing better this year.
2 strongly agree agree
3 undecided
4 disagree
5 strongly disagree
5 strongly disagree
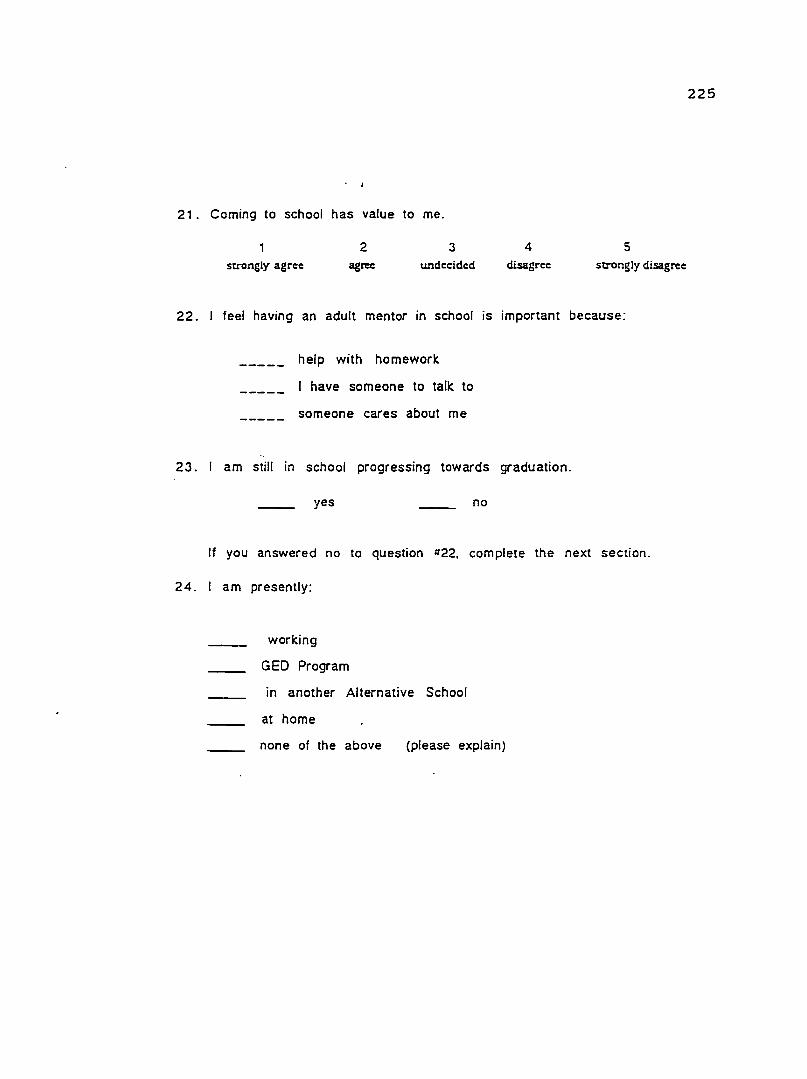
21. Coming to school has value to me.
strongly agree
2 ag~
3 undecided
4 disagree
5 strongly disagree
22. I feel having an adult mentor in school is important because:
help with homework
I have someone to talk to
someone cares about me
23. I am still in school progressing towards graduation.
yes no
If you answered no to question #22, complete the next section.
24. I am presently:
working
GED Program
in another Alternative School
at home
none of the above (please explain)
225

• I
Please rank order any that apply: n·=most important)
25. left school primarily because:
I was failing my classes School was not important Family problems Pregnancy Needed/wanted to get a job Was too far behind in my credits to graduate
26. I told my mentor before leaving where I was going and why.
yes no
If no, please explain further:
Section 11
27. What year in school are you now?
9 10 11
28. How many years have you had a mentor?
2 3
29. I am currently living with:
----- both parents
----- father only
----- mother only
----- a step-parent and a parent
a friend or relative ---------- on my own
226
12

227
I
30. My favorite subject is:
31. My favorite teacher is: Why:
32. My grades are better than in the past.
yes no
33. I come to school more often than I used to:
yes no about the same
34. Please indicate your racial/ethnic group:
Native American Asian American
African American Hispanic
Caucasian/White Other
35. Please check the appropriate category:
male female
36. Additional comments:

APPENDIX D
PRETREATMENT ANALYSES
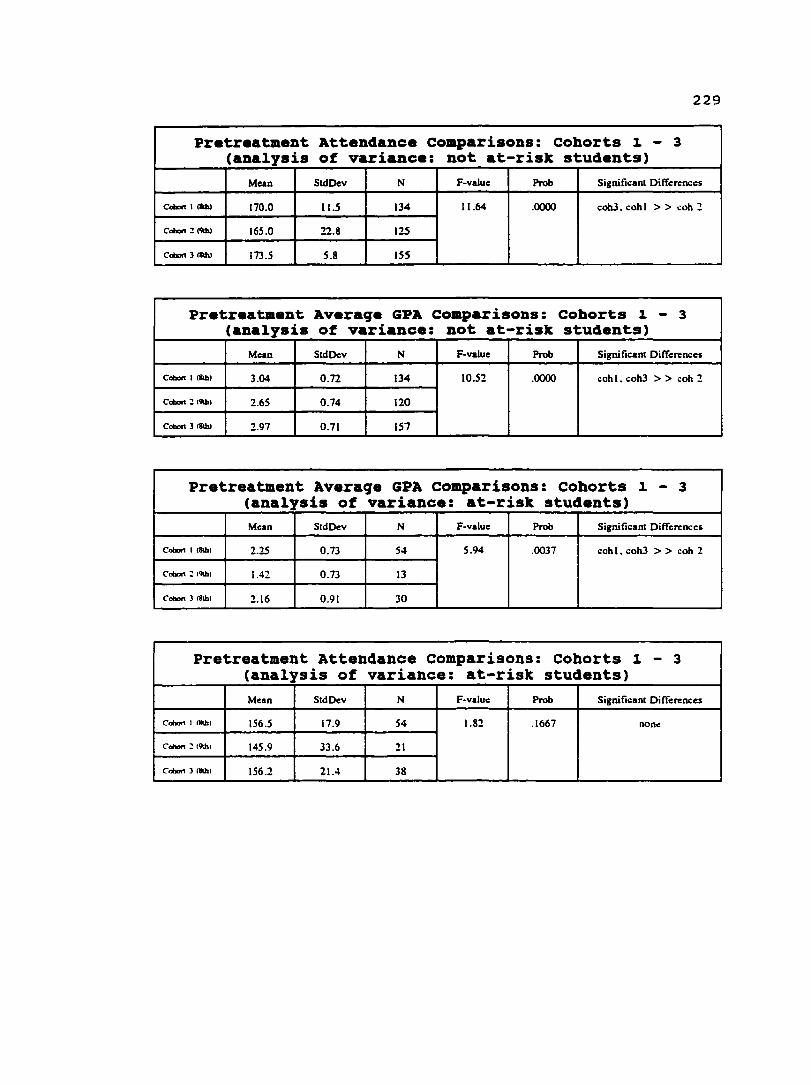
229
Pretreatment Attendance comparisons: Cohorts 1 - 3 (analysis of variance: not at-risk students)
Mean Std Dev N F-value Prob Signific:ant Diffcnmccs
CdlDft I l1llhJ 170.0 11.5 134 11.64 .0000 cohJ. cohl > > coh 2
C-:?~l 165.0 22.8 125
C-l1111hl 173.5 5.8 155
Pretreatment Averaqe GPA Comparisons: Cohorts 1 - 3 (analysis Of variance: not at-risk students)
Mean Std Dev N F-value Prob Significant Differences
C-11111hl 3.04 0.72 134 10.52 .0000 cohl. coh3 > > cob 2
C-:?19tb1 2.65 0.74 120
Cohort l l1llhJ 2.97 0.71 151
Pretreatment Averaqe GPA comparisons: Cohorts 1 - 3 (analysis of variance: at-risk students)
Mean Std Dev N F-value Prob Significant Differences
Ccbott I <Bibi 2.25 0.73 S4 5.94 .0037 cohl. coh3 > > cob 2
Ccbott :? 19tb1 1.42 0.73 13
c cbott 3 111hl 2.16 0.91 30
Pretreatment Attendance Comparisons: Cohorts 1 - 3 (analysis of variance: at-risk students)
Mean Std Dev N F-valuc Prob Significant Diffcnmccs
Ccbott I ll!lhl 156.5 17.9 54 1.82 .1667 none
Cohon:? 1'l!h1 145.9 33.6 21
c cbott ] 111hl 156.2 21.4 38

APPENDIX E
ANALYSES OF QUESTIONS 1 THROUGH 4

231
Pretreatment Comparisons for QSL
Al-Rist Not At-Risk
Mean Std Dev N Mean Std Dev N F Prob
Satisfactioa with Scllool
Cohort 1 1.88 1.72 64 2.69 1.71 196 10.69 .0012
Cohort 2 1.92 1.77 21 2.58 1.74 142 2.59 .1092
Cohort3 2.53 1.63 43 2.97 1.68 226 2.54 .1119
Commitment to Cluswork
Cohort 1 2.87 2.95 64 5.47 2.94 196 14.18 .0002
Cohort 2 3187 3.18 21 4.72 2.71 142 1.72 .1917
Cohort3 4.86 2.61 43 S.84 2.85 226 4.34 .0381
Reactioas to Teacben
Cohort 1 4.90 2.66 64 6.19 2.69 196 11.31 .0009
Cohort 2 S.41 3.45 21 3.31 2.84 142 1.73 .1901
Cohort 3 5.05 2.98 43 6.48 2.53 226 10.8703 .0011
Total QSL Score
Cohort 1 10.65 6.40 64 14.35 6.20 196 16.91 .0001
Cohort 2 11.20 7.59 21 13.61 6.16 142 2.63 .1068
Cohort3 12.44 S.99 43 15.29 6.04 226 8.05 .0049
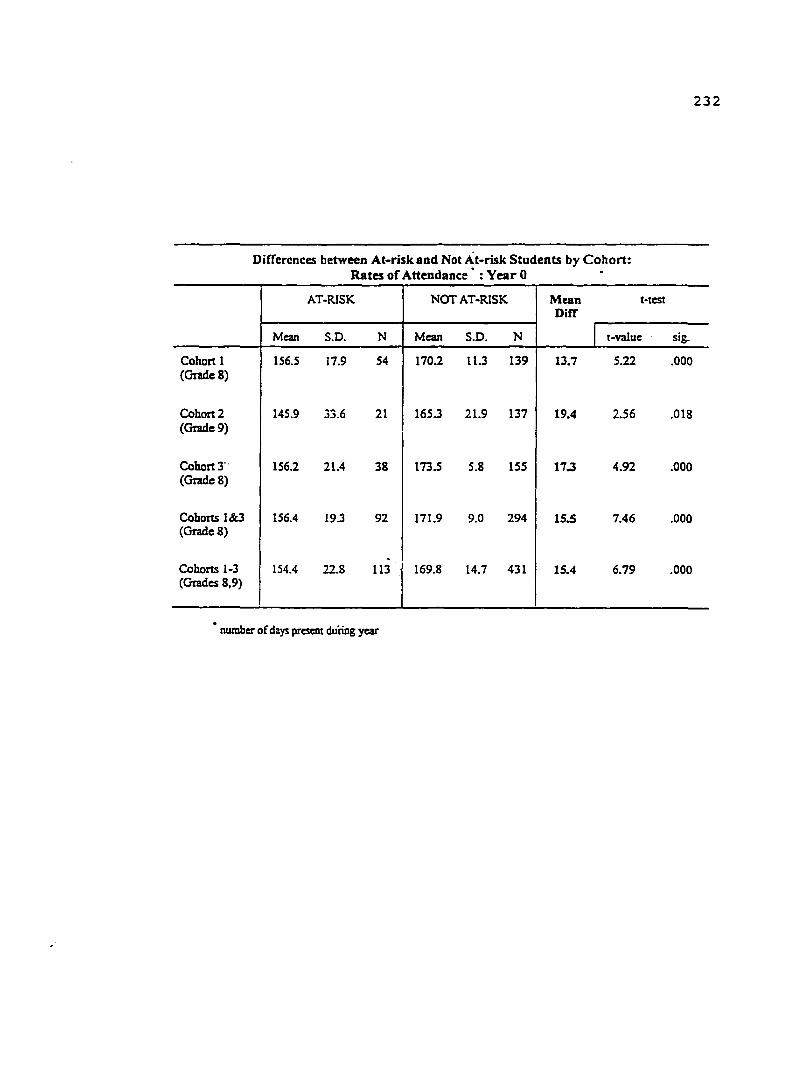
232
Differences between At-risk and Not At-risk Students by Cohort: Rates of Attendance·: Year 0 ·
AT-RISK NOT AT-RISK Mean t-tcst Dirr
Mean S.D. N Mean S.D. N I t-value sig.
Cohort 1 156.5 17.9 54 170.2 11.3 139 13.7 5.22 .000 (Gradc8)
Cohort2 145.9 33.6 21 165.3 21.9 137 19.4 2.56 .oIS (Gradc9)
Cohort3"· 156.2 21.4 38 173.5 5.8 155 17.3 4.92 .000 (Gradc8)
Cohorts 1&3 156.4 19.3 92 171.9 9.0 294 15.S 7.46 .000 (Gradc8)
-Cohorts 1-3 154.4 22.8 113 169.8 14.7 431 15.4 6.79 .000 (Grades 8,9)
number of days present duiing year
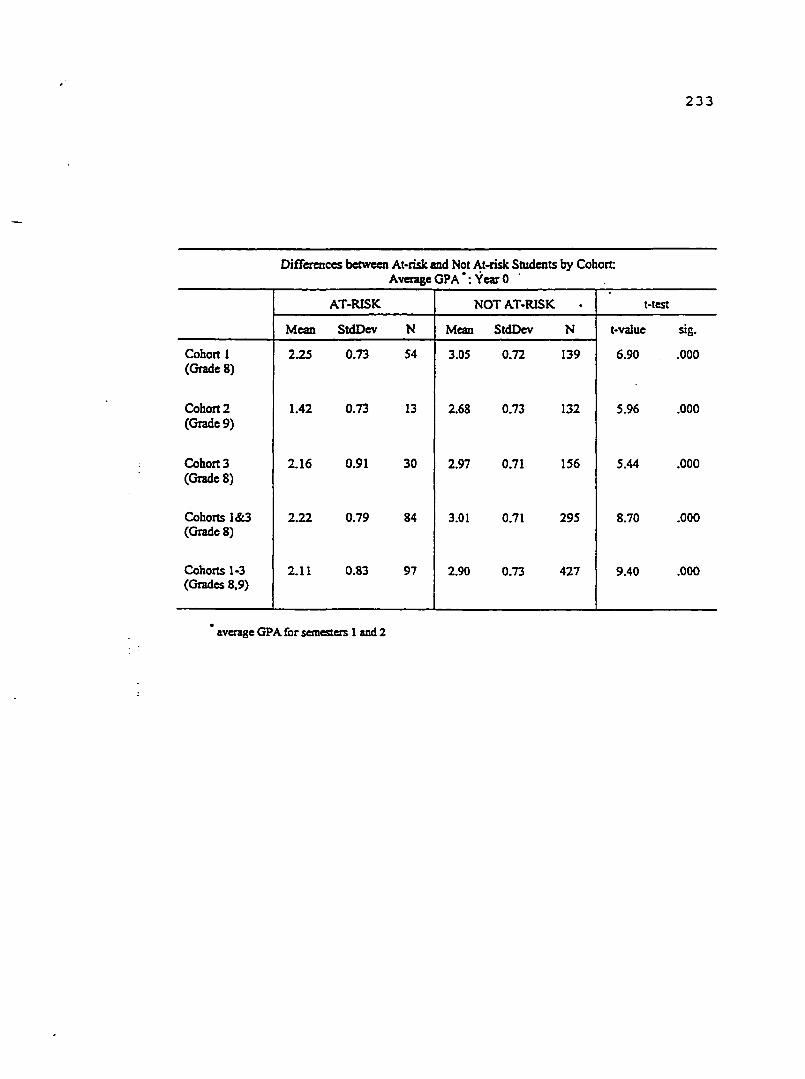
233
Differences between At-risk and Not At-risk Students by Cohort: Average GPA·: Year 0 ·
. AT-RISK NOT AT-RISK . t-test
Mean StdDcv N Mean StdDcv N t-value sig.
Cohort I 2.25 0.73 54 3.05 0.72 139 6.90 .000 (Grade 8)
Cohort2 1.42 0.73 13 2.68 0.73 132 5.96 .000 (Grade9)
Cohort3 2.16 0.91 30 2.97 0.71 156 5.44 .000 (Grade8)
Cohorts 1&3 2.22 0.79 84 3.01 0.71 295 8.70 .000 (Grade 8)
Cohorts 1-3 2.11 0.83 97 2.90 0.73 427 9.40 .000 (Grades 8,9)
average GPA for semesters 1 and 2

234
Question 2: Analysis of Covariance: Quality of School Life Questionnaire
At-Risk: Mentor vs No Mentor (Cohort I)
Mentor NoMcotor . Mean StdDev N Mean StdDev N F-valuc Prob.
SAT Yr.I 1.90 1.73 48 1.81 1.76 16 8.32 .006
Yr.2 2.91 1.87 45 1.33 l.87 12
COM Yr.I 4.06 3.01 48 3.31 2.75 16 10.76 .002
Yr.2 6.27 3.21 45 2.75 3.44 12
TCH Yr.I 4.06 2.76 48 5.00 2.39 16 9.71 .003
Yr.2 7.37 2.57 45 4.83 3.66 12
QSL Yr.l 10.83 6.51 48 10.13 6.21 16 13.75 .000
Yr.2 16.55 6.77 45 8.92 8.34 I2
Question 2: Analysis of Covariance: Quality or School Life Questionnaire
At-Risk: Mentor vs No Mentor (Cohort 2)
Mentor No Mentor
Mean StdDev N Mean StdDev N F-valuc Prob.
SAT Yr.I 1.75 1.91 12 2.15 1.64 9 5.13 .053
Yr.2 3.86 1.68 7 1.40 1.95 7
COM Yr.I 3.52 3.57 I2 4.33 2.69 9 1.41 244
Yr2 7.00 4.00 7 3.60 3.71 5
TCH Yr.I 5.58 3.92 12 5.18 2.92 9 1.09 .380
Yr.2 8.14 3.34 7 5.21 3.42 5
QSL Yr.I 10.85 8.82 12 11.66 6.05 9 2.32 .166
Yr.2 19.00 8.04 7 10.20 8.29 7

235
I
Question 2: Analysis of Covariance: I At-Risk: Mentor vs No Mentor (Cohort 3) I
I I
Mentor No Mentor I
Mean StdDcv N Mean StdDcv N I F-valuc Prob. I SAT Yr.I 2.25 1.57 24 2.88 1.69 19 0.55 .468
:Yr.2 2.84 1.75 I6 3.67 1.37 6 I COM Yr.I 4.58 2.48 24 5.21 2.78 19 0.09 .no
Yr.2 6.13 6.12 16 6.83 2.79 6
TCH Yr.I 4.63 2.58 24 5.59 3.41 19 0.01 .921
Yr.2 6.83 3.14 16 7.33 2.73 6
QSL Yr.I 11.46 5.40 24 13.68 6.59 19 0.07 .790 .. Yr.2 15.80 7.30 16 17.83 5.31 6
: ~ .
Question 2: Analysis of Covariance: At-Risk: Mentor vs No Mentor (Cohorts 1.2)
Mentor No Mentor
Mean StdDcv N Mean StdDcv N F-valuc Prob.
SAT Yr.I 1.87 1.15 60 1.93 1.69 25 12.30 .001
Yr.2 3.04 1.86 52 1.35 1.84 17
COM Yr.I 3.96 3.11 60 3.68 2.72 25 11.89 .001
Yr.2 6.37 3.29 52 3.00 3.43 17
TCH Yr.I 5.01 3.01 60 5.06 2.54 25 10.38 .002
Yr.2 7.48 2.66 52 4.94 3.49 17
QSL Yr.I 10.83 6.95 60 10.68 6.07 25 15.85 .000
Yr.2 16.88 6.92 52 9.29 8.08 17
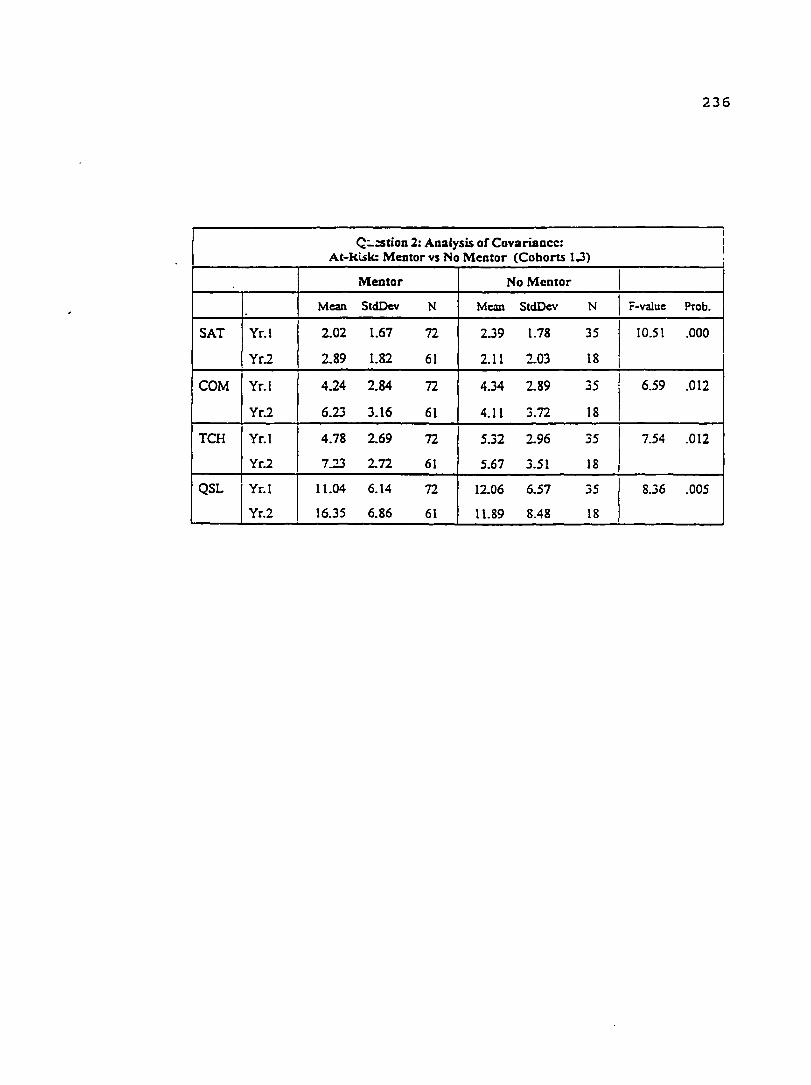
236
I C:..~tion 2: Analysis of Covariance: I At-ktsk: Mentor vs No Mentor (Cohorts 1.3)
Mentor No Mentor I Mean StdDcv N Mean StdDcv N I F-valuc Prob.
SAT Yr.I 2.02 1.67 72 2.39 1.78 35 10.51 .000
Yr.2 2.89 1.82 61 2.11 2.03 18 I COM Yr.I 4.24 2.84 72 4.34 2.89 35 6.59 .012
Yr.2 6.23 3.16 61 4.11 3.72 18
TCH Yr.I 4.78 2.69 72 5.32 2.96 35 7.54 .012
Yr.2 7.23 2.72 61 5.67 3.51 18
QSL Yr.I 11.04 6.14 72 12.06 6.51 35 8.36 .005
Yr.2 16.35 6.86 61 11.89 8.48 18

Cohort Pre (9~
2 Year I
Year2
Year:i
Cohort Pre(9"')
2 Year I
Ycar2
YearJ
152.2
1:?9.8
110.1
130.8
1.68
.56
1.89
2.61
eohort 2
Analysis of Variance for Attendance Mentor versus No Mentor
19.S
45.2
56.6
59.S
II
12
12
7
138.9
136.S
102.9
119.0
44.S
41.7
53.S
74.1
Analysis of Variance for GPA
Mentor versus No Mentor
0.11 6 1.19 0.66
I.OS II 1.57 0.95
1.28 10 1.!I 0.97
0.67 5 2...34 0.65
10
10
8
6
7
9
7
4
13...30
-6.70
7.!0
11.30
OA9
-0.01
0.6S
0.21
237
0.81 .J791
0.1:; .7:?-19
0.08 .7863
0.10 .7562
1.51 .2368
0.00 .9948
1.39 .2510
O.JS .SS86
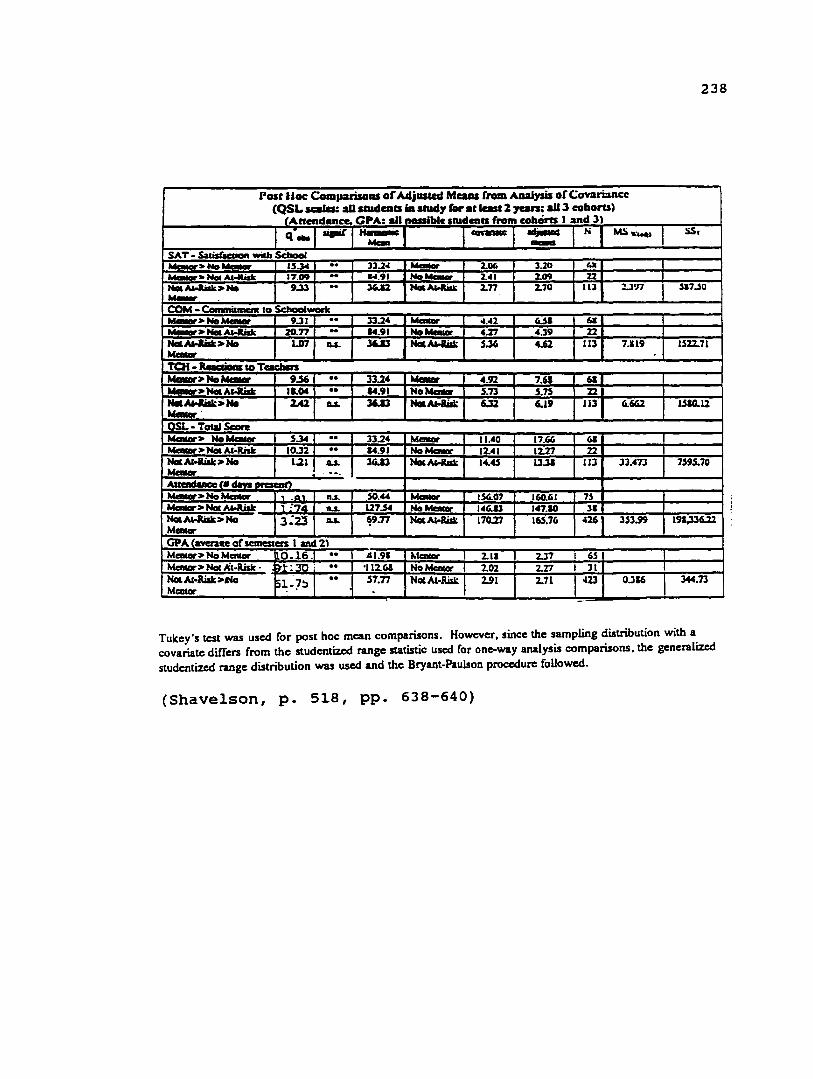
238
Jlost Hoc Comparisoas of Adj1111Cd Mcaas from Amllysis or Cov:ari:&ncc (QSL scaJa: au Sllldmcs ill alud1 for at last 2 :ran; au 3 coboru)
lArrendancc. CPA: all -lblesnadaus from cohorts I and ll q· ... upi( ......... -- ...... N MS..-....,, ss, ...... -SAT· Salis!acaion with School
Mcmor>No""- IS..J.I .. JJ.lol ~ 2.06 l.20 , .. ....... Nol At-Risk 17.09 - IW.91 No.._ 2. .. 1 2.09 22 ,.. Al-Aiak> No 9.ll .. l6.a2 NGlM-Am; 2.77 2.70 Ill U!17 517..SO ...... COM - Commitment 10 Schoolwork ~>NoW- 9.31 .. 33.24 M-. o1 • .a2 UI 61 W..> ... ,..... 20.77 .. 14.91 NoMauor 4.27 4.39 22 Nal.Aloailt> No l.07 D.S. l6.ll NoL~ S.l6 4.62 Ill 7.119 1S22..71 Malar' Tat - Rerriom 10 Tcacbcrs Mallar'> No Naur U6 .. 33.24 Mallar' 4.92 7.61 61 Malar>'No&Al-Rilk 11.04 .. 14.91 NoMalllllr S.73 S.7S 22 Nal.Al-&ilk> No l.42 D.S. l6.l3 Hal Al-lilli: U2 6.19 Ill 6.662 lSIO.ll ....... ""'"' - Total 5coR Mawar> No Mallar- S.34 .. ]].24 Mawar 11.40 17.66 61 Mawar> Nol Al-Risk 10.32 .. 14.91 NoMClllClr 12.41 12.27 22 Hal.Moll.ilk> No 121 D.S. 36.ll Nol Ar.-&aal.; 1"-4S ll.JI Ill ]].473 7S95.70 MClllar . ·-· Allenduml• MClllar>No~ , .... n.s. 50 ..... M- 156.07 160.61 7S Mmlar'> Nol A"°Rist , :., .. n.s. 127.$4 NoMaur 14&.ll 147.IO ll NoLM-Rilk >No 3;23 MClllar
D.S. ~9.77 Not.Al-Rm.; 17Q.l7 16S.76 ol26 "3.99 191,ll6.ll
GPA<averauof'scmesters I and21 Ma1111r>NoMCNar 0-16. .. .11.91 t.tcnrar 2.11 2.]7 6S Mallar> Nol At-Rist . l-1-:~; .. •112.61 No MC111C1r 2.02 2.27 31 Nol.Al·lilk>do Eil: -7:>
.. 57.77 Not Al-Rist 2.91 2.71 -123 0.316 344.73 MCDUlr
-·
Tukey's test was used for post hoc mean comparisons. However, since the ~piing ~istribution with•. covariate differs from the studentizcd range statistic used for one-way analys11 compansons, the generalized studentizcd range distribution was used and the Bryant-Paulson procedure followed.
(Shavelson, p. sis, pp. 638-640)
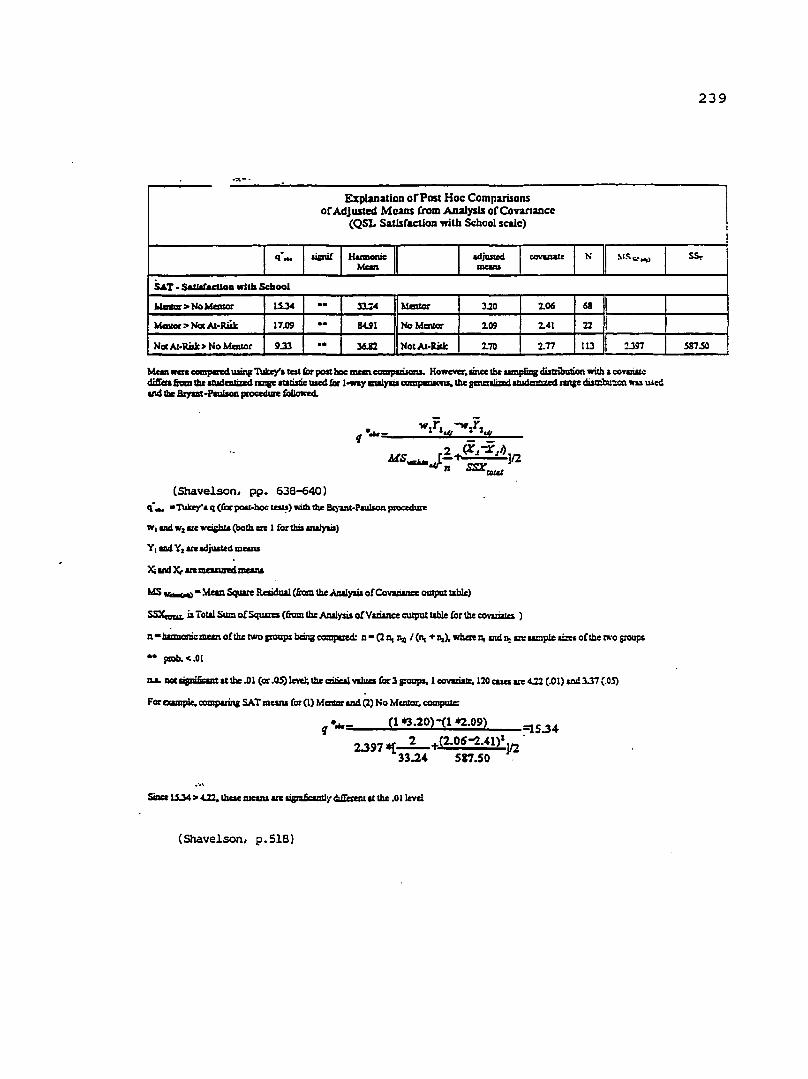
·~-- .
Explanation or Post Hoc: Comparisons or Adjusted Means from Analysis orCovananc:c
(QSL Satisfaction with School scale)
q"- ai;lliC HannolK adjusled CO\"Ul&IC N I ~ll'., • ..,, Man mans
SAT. Sa&llracUoa wlda Sclaool
Mllllat > NoMCIUlr 15-34 .. 33.:4 Mmtor 3.lO 2.06 68
Mcnlor > Not .Al·Riilc 17.119 .. Sc.91 NoMallllr 2.09 2.41 22 I Nee Af•Rilk > No Mauar !il.33 .. 36.12 Not.Al·Rilk 2.70 2.77 113 :?.Jg-7
Man were CCllZlplftd wisltr 'l'ukqa 1a1 for posthoc: lllClllcompcilona. Howcwr • .WC lhc lllDplilla dialribulion with & covaill.: dia"a iiom lhc aftJdanjzrd mip a~ med far 1-way mymis c:ompailml. lbc scnmlizmd 1mdmnzrd migc dislnl:uliell wu wed and ti. Biyut ·Pmllan praccdllre falicntcd.
(Shavelson, pp. 638-640) q",,,. •'I\akey'a q (focpou·hoc ~) Mlb the Br)=t•Paulson p:oadme
w, llld •i arc wcighl& (bolh an 1 !arlhis maiylis)
Y, llld Yi us adju&led mans
X; &l1d X,. m:mcuundman&
MS"~• :'rlcm Square Residual (&m lhc.wlymis of Coni:iln= OUlpUt l&ble)
SSXmw, is TOlal Sumo!Squms (from lhc Anal)'Jis o!Vuiancc cutput t&ble forth: c:ovacialcs )
n•lmmonil:meano!lh: two groups being compmd: n• {lflt Iii! I (n,. +1tz), whae11t lndn: ar:w:ipluma oCthe rr.-o groups
•• plQb. <.01
iu. 11ouipi6'1nt1tlhc .01 (ar .05)1cwlo lhc c::rilal Vlhm foc3sroupa,1~120 cua are 4.22 (.01) wi3.37 (.OS)
F'ar aamp1c. comparina SAT mana far (I) MClllOr and (2} No MCll!Or. c:ompwc
g ··- (1 *3.20)-(1 it2.0!il) =15.34
2.397 *[_1_..,(2.06~.41)1 ]/2. 33.24 511.SO .
Since 15.34 > .ul, lbuc mcam AR ~y cldii:mll II lhe .01 lcvcl
(Shavelson, p.518)
239
I SS,.
587..SO

APPENDIX F
HUMAN SUBJECTS CONSENT FORM

241
omCE OF RE.SEARCH AND SPONSORED PROJECTS
DATE: August 20, 1993
Gail Hayes ~ i .· ~wak.)-~a Balshem, Chair, HSRRC 1993-94
TO:
FROM:
RE: HSRRC Approval of Your Application titled •A Descriptive Study of the Staff Mentor Program C.A.K.E. ..• •
In accordance with your request, the Human Subjects Research Review Committee has reviewed your proposal referenced above for compliance with DHHS policies and regulations covering th"e protection of human subjects. The committee is satisfied that your provisions for protecting the rights and welfare of all subjects participating in the research are adequate, and your project is approved.
Please note to change our address to the Office of Research and Sponsored Projects, (503)725-3417 (instead of the Office of Graduate Studies) on the script of your infonned consent.
Any changes in the proposed study, or any unanticipated problems involving risk to subjects, should be reported to the Human Subjects Research Review Committee. An annual report of the status of the project is required. ·
c. Office of Graduate Studies