AN EVALUATION ARM RADIOSONDE …/67531/metadc710877/m2/1/high...AN EVALUATION OF ARM RADIOSONDE...
8
AN EVALUATION OF ARM RADIOSONDE OPERATIONALPERFORMANCE B. M. Lesht Environmental Research Division Argonne National Laboratory Argonne, Illinois Submitted for publication in Preprint Volume Ninth Symposium on Meteorological Observations and Instrumentation American Meteorological Society Charlotte, North Carolina 27-31 March 1995 by a contractor of the U.S. Government under contract No. W-31-104ENG-38. Aaordingly. the U. S. Government retains a nonexclusive. royalty-free liccnle 10 publish contribution. or allow others to do SO. for DlSTRlBUTIOM OF THIS
Transcript of AN EVALUATION ARM RADIOSONDE …/67531/metadc710877/m2/1/high...AN EVALUATION OF ARM RADIOSONDE...

AN EVALUATION OF ARM RADIOSONDE OPERATIONAL PERFORMANCE
B. M. Lesht Environmental Research Division
Argonne National Laboratory Argonne, Illinois
Submitted for publication in
Preprint Volume Ninth Symposium on Meteorological Observations and Instrumentation
American Meteorological Society Charlotte, North Carolina
27-31 March 1995
by a contractor of the U.S. Government under contract No. W-31-104ENG-38. Aaordingly. the U. S. Government retains a nonexclusive. royalty-free liccnle 10 publish
contribution. or allow others to do SO. for
DlSTRlBUTIOM OF THIS

DISCLAIMER
This report was prepared as an account of work sponsored by an agency of the United States Government. Neither the United States Government nor any agency thereof, nor any of their employees, make any warranty, express or implied, or assumes any legal liability or responsibility for the accuracy, completeness, or usefulness of any information, apparatus, product, or process disclosed, or represents that its use would not infringe privately owned rights. Reference herein to any specific commercial product, process, or service by trade name, trademark, manufacturer, or otherwise does not necessarily constitute or imply its endorsement, recommendation, or favoring by the United States Government or any agency thereof. The views and opinions of authors expressed herein do not necessarily state or reflect those of the United States Government or any agency thereof.

DISCLAIMER
Portions of this document may be illegible in electronic image products. Images are produced from the best available original document.
I

1.2 AN EVALUATION OF ARMRADIOSONDE OPERATIONAL PERFORMANCE
Barry M. Lesht
Argonne National Laboratory Argonne, Illinois
1.0 INTRODUCTION
Despite impressive advances in remote sensing technologies, radiosondes continue to be an important part of most atmospheric research programs. The U. S. Department of Energy Atmospheric Radiation Measurement (ARM) Program uses radiosonde systems to obtain upper-air data at the central facility (CF) and at each of four boundary facilities (BFs) in its southern Great Plains (SGP) Cloud and Fbdiation Testbed (CART) site, an area approximately 350 km by 400 km in north central Oklahoma and south central Kansas. Regular soundings have been made at the CF since July I992 and at the BFs since January 1994, with sounding frequencies mnging h m once daily at each location to eight times daily at each location during intensive operations periods (IOPs). In all, over 4ooo soundings have been made at the SGP site. Radiosonde data are used to check information from CART active and passive remote sensing instruments, to provide boundary conditions for single-column general circulation models, and as input to detailed line-by- line radiation codes used by ARM investigators. In addition, radiosondes are currently the only opedonal i n m e n t system used at the SGP that can measure the detailed vertical distribution of water vapor, a critical need for the ARM Program.
Because the ARM Program uses data from radiosondes for real-time quality control purposes and in sensitive modeling applications, it is important to have a quantitative measure of the quality of the radiosonde data themselves. Finding such a measure is difficult, however, because the basic sensing system (the radiosonde package) is discarded after each use and is not available for repeated calibration checks. Methods of radiosonde data validation that depend on point-by-point comparisons with profiles obtained by ground based remote sensors (e.g., lidar, radio- acoustic sounding system, or wind profilers) lack simultaneity (in space and time) of sampling, especially at higher altitudes. The same problem applies to comparisons of radiosonde data with vertically integrating remote sensing instruments (e.g.,
Corresponding author address: Barry M. Lesht, Environmental Research Division, Argonne National Labontory, Argonne, LL 60439
microwave radiometers), which also sample only the column of air directly above the sensor and may depend on radiosonde data for their own calibrations. Some studies have used pairs of radiosondes mounted on single balloons to assess the accuracy and precision of radiosonde measurements, but this method really measures differences between sensors and is impractical for operational use. We have experimented with two other methods to estimate the quality of the radiosonde data: comparisons with known standards before launch and examination of "replicate" samples made by single sensors aloft. By statistically combining the results from a large number of soundings, we hope to obtain a quantitative measure of ARM radiosonde operational performance.
2.0 RADIOSONDE SYSTEM AND DATA
The ARM Program uses Vaisala RS-80-15 LH radiosondes. Typically, thermodynamic data (pressure. temperature, and humidity) are recorded at 2-s intervals throughout the soundings. Wind velocities, based on Loran-C wind finding, are recorded at 10-s intervals. The ARM radiosondes are equipped with the standard Vaisala Thermocap" and Barocapa temperature and pressure sensors and with the advanced H-Humicapm humidity sensor. Except for the specification for wind velocity accuracy, which depends on the local Loran-C station density, the manufacturer's specifications for these sensors (Table 1) represent the standard deviation of the differences among a series of repeated calibrations. Thus, the sensors would be expected to provide data within the specified limits 68% of the time.
Table 1: Manufacturer's specifications for sensors used in RS-80-15 LH radiosondes. Sensor Resolution Accuracy
~~ ~
0.5 hPa Pressure 0.1 hPa Temperature 0.1"C M.2OC Humidity 1% RH B% R H Velocity 0.1 m/s 0.5 mls
, . _.. - - _ * . . - .-
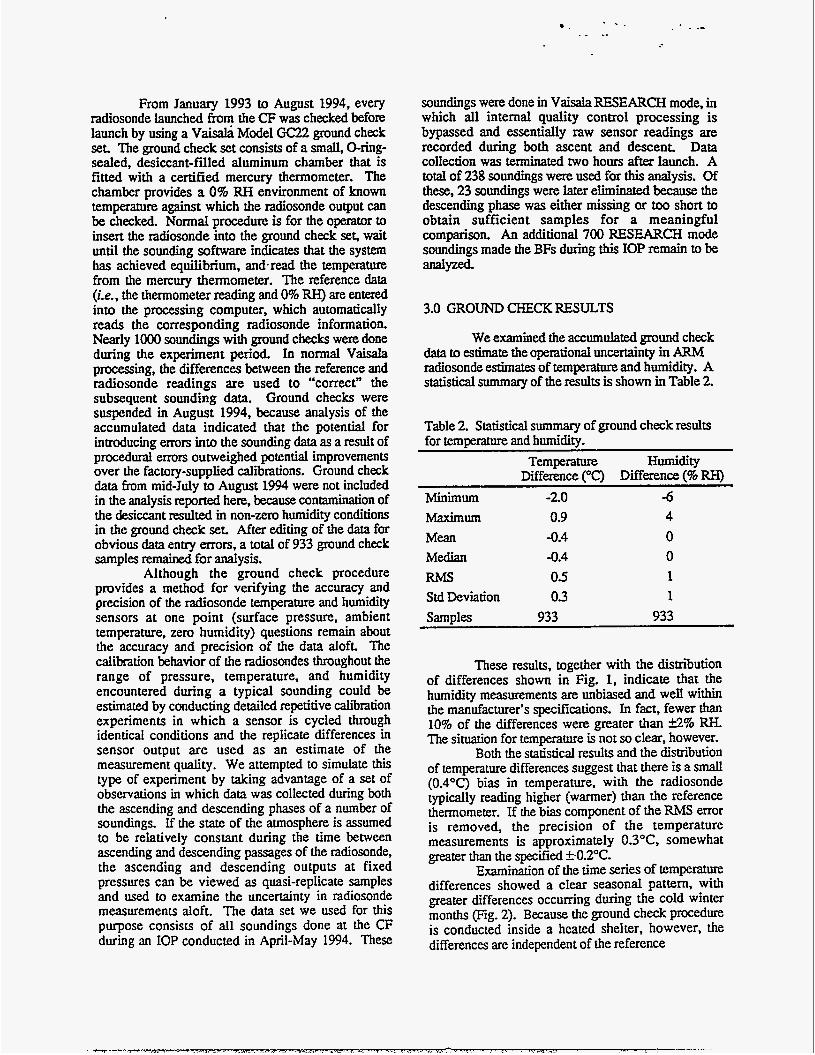
From January 1993 to August 1994, every radiosonde launched from the CF was checked before launch by using a V 6 Model GC22 ground check set The ground check set consists of a small, O-ring- sealed, desiccant-filled aluminum chamber that is fitted with a certified mercury thermometer. The chamber provides a 0% RH environment of known temperature against which the radiosonde output can be checked. Normal procedure is for the operator to insert the radiosonde into the ground check set, wait until the sounding software indicates that the system has achieved equilibrium, andoread the temperature from the mercury thermometer. The reference data (i.e., the thermometer reading and 0% RH) are entered into the processing computer, which automatically reads the corresponding radiosonde information. Nearly IO00 soundings with ground checks were done during the experiment period. In normal Vaisala processing, the differences between the reference and radiosonde readings are used to "correct" the subsequent sounding data. Ground checks were suspended in August 1994, because analysis of the accumulated data indicated that the potential for introducing errors into the sounding data as a result of procedural emrs outweighed potential improvements over the factory-supplied calibrations. Ground check data h m midduly to August 1994 were not included in the analysis r e p o d here, because contamination of the desiccant resulted in non-zero humidity conditions in the ground check set After editing of the data for obvious data entq errors, a total of 933 ground check samples remained for analysis.
Although the ground check procedure provides a method for verifying the accuracy and precision of the radiosonde temperature and humidity sensors at one point (surface pressure, ambient temperature, zero humidity) questions remain about the accuracy and precision of the data aloft. The calibration behavior of the radiosondes throughout the range of pressure, temperature, and humidity encountered during a typical sounding could be estimated by conducting detailed repetitive calibration experiments in which a sensor is cycled through identical conditions and the replicate differences in sensor output are used as an estimate of the measurement quality. We attempted to simulate this type of experiment by taking advantage of a set of observations in which data was collected during both the ascending and descending phases of a number of soundings. If the state of the atmosphere is assumed to be relatively constant during the time between ascending and descending passages of the radiosonde, the ascending and descending outputs at fixed pressures can be viewed as quasi-replicate samples and used to examine the uncertainty in radiosonde measurements aloft. The data set we used for this purpose consists of all soundings done at the CF during an IOP conducted in April-May 1994. These
soundings were done in VaiwlaRESEARCH mode, in which all internal quality control processing is bypassed and essentially raw sensor readings are recorded during both ascent and descent Data collection was terminated two hours after launch. A total of 238 soundings were used for this analysis. Of these, 23 soundings were later eliminated because the descending phase was either missing or too short to obtain sufficient samples for a meaningful comparison. An additional 700 RESEARCH mode soundings made the BFs during this IOP remain to be analyzed-
3.0 GROUND CHECK RESULTS
We examined the accumulated ground check data to estimate the operational uncertainty in ARM radiosonde estimates of temperature and humidity. A statistical summary of the results is shown in Table 2.
Table 2. Statistical summary of ground check results for temperanne and humidity.
Temperature Humidity Difference ("C) Difference (% RH)
Minimum -2.0 -6 Maximum 0.9 4 M a -0.4 0 Median -0.4 0 RMS 05 1 Std Deviation 03 1 Samples 933 933
These results, together with the distribution of differences shown in Fig. 1, indicate that the humidity measurements are unbiased and well within the manufacturer's specifications. In fact, fewer than 10% of the differences were greater than S% RH. The situation for temperature is not so clear, however.
Both the statistical results and the distribution of temperature differences suggest that there is a small (0.4OC) bias in temperature. with the radiosonde typically reading higher (warmer) than the reference thermometer. If the bias component of the RMS error is removed, the precision of the temperature measurements is approximately 0.3"C, somewhat greater than the specified +.0.2OC.
Examination of the time series of tempemure differences showed a clear seasonal pattern. with greater differences occurring during the cold winter months (Fig. 2). Because the ground check procedure is conducted inside a heated shelter, however, the differences are independent of the reference

Figure 1. Distribution of humidity differences (top) and temperature differences obtained during ground C k k S
temperature (typically between 15-20°C). This suggests that the apparent bias in temperature is an artifact of the ground check procedure, most likely resulting €tom a failure of the ground check set to be in thermal equilibrium when the instrument shelter is being heated during the winter. Another evident feature of the time series of temperature differences is the tendency for the scatter to increase dramatically after May 1994 and especially during IOPs (January, April-May, and July of 1994). IOPs involve 24-hr operations that require a number of different personnel to prepare and launch radiosondes. Multiple personnel also have been involved in regular (Le., non-IOP) radiosonde launching since May. The variability in the differences probably reflects the variable experience of the operators and the care they take during the ground check procedure.
in
05
I: 1 Y
-1.0
-25 u16 sni w 1m d ~ d m7
1993-1994
Figure 2. radiosonde and ground check reference temperatures.
Time series of differences between
4.0 ASCENDING AND DESCENDING PHASES
The overall pattern Seen in the ascending and descending phases of the RESEARCH soundings is remarkably similar. A typical sounding is shown in Fig. 3. In qualitative terms, the correlation between ascending and descending temperature measurements is usually excellent, with only small phase lags evident at very high altitudes. Below the tropopause, descending temperature is very nearly identical to ascending temperature. The correlation between ascending and descending humidity differs greatly above and below the tropopause. At highex altitudes and during the initial portions of the descent, it is common for the RH to increase by several percent over the minimum ascending values. These relatively high (for the stratosphere) RH values generally stay constant until the radiosonde has descended through the tropopause, which is often marked by a local humidity maximum. The descending RH then tends to lag the increase in RH until the radiosonde descends well below the tropopause. Below 250 hPa (approximately 10 km), the correlation between descending and ascending RH improves markedly. We suspect that the increase in RH reported by the radiosondes on descent is a result of a change in orientation of the Sensors with respect to the air flow after the balloon breaks. During ascending flight, the radiosonde sensor arm is normally above the bulk of the electronics package in relatively undisturbed air. Because the battery, the heaviest part of the electxonics package, is at the bottom of the radiosonde, it is unlikely that the radiosonde would tip or invert on descent Therefore, during descent, air going past the Sensor arm would have passed around the bulk of the radiosonde package

B
10
1m
IW
Figure 3. Ascending (heavier lines) and descending (lighter lines) phases of sounding done 5/10/94 at 20:3 1 UTC. Top panel shows temperature and relative humidity, bottom panel shows east and north wind components.
fmt. The radiosonde battery is water-activated, and the chemical reaction in the battery is exothermic. At very high altitudes, only a small amount of water shed by the battery pack could account for the increases in RH seen at the beginning of descent. Another factor that may contribute to the apparent lag in RH measured above the tropopause is the rate of descent Although parachutes are attached to the radiosondes, measured descent rates in upper altitudes reach 15- 20 m/s, three to four times faster than the nominal ascent rate and the descent rate below the wpopause. Exactly why the temperature sensor, which has a slightly slower rime constant than the humidity sem, is not similarly affected is not clear, although the general tendency is for the descending phase to measure slightly warmer temperatures than on ascent
Above the tropopause, the descending wind profile resembles a smoothed version of the ascending profile. Major changes in both speed and direction Seem to be accurately tracked, although smaller-scale
fluctuations are not. This loss of detail in the winds at high altitude is to be expected, because much of the coupling between the radiosonde system and the winds depends on the presence of the balloon. At lower altitudes the dosonde and parachute Seem to track the winds quite well. Apparent smoothing also results itom the decreased vertical spatial sampling density associated with the increased descent rate.
To begin to quantify the correlations and differences between the ascending and descending phases, we resampled the soundings to create matching series with an equal number of samples from each phase. We did this by fmding the sample in the ascending phase that most closet matched each descending sample. The matching was based on the reported pressure. When multiple samples with equal pressures were found, we used those samples with the closest calculated altitudes. In the case of temperature and humidity, if a descending sample did not have a matching ascending sample with pressure within C 0.1 Wa the descending sample was discarded. Because of the lower sampling rate, this matching criterion was expanded to fl.4 hPa for the wind data.
After creating the matching series, two simple analyses were conducted. We calculated simple (Pearson) correlation coefficients (r) for each ascendingdescending pair of each variable. We also used the real portion of the complex correlation coefficient for the vector components of the wind velocity as a single metric for these variables. A statistical summary of the results is presented in Table 3. These results confirm the quantitative impressions obtained from visual examination of the sounding data. Temperature and wind correlations are extremely high, humidity correlations somewhat lower. Of course, high correlation coefficients can be obtained without detailed point-to-point agreement in cases where a large, low-frequency signal is present. Without a doubt, the radiosondes are very good at replicating the large low frequency signals in temperature, humidity and wind. A more detailed correlation analysis, based on smaller segments of the matched profiles or on high-pass fitered versions of the profiles remains to be done. It does not appear, however, that the correlation coefficients depend on the number of points used in the comparison as might be expected if the quality of the correlation was unduly influenced by low kquency signal.
Table 3. Statistical summary of correlation analysis of paired ascending and descending sounding phases.
r o r O Minimum -0.685 0.53 1 -0.009 Maximum 0.972 1 0.998 Median 0.734 0.997 0.986 Points 215 215 215
r(Wind)

The second analysis consisted of calculating the differences between ascending and descending phases at each pressure level and binning the accumulated differences by pressure in bins of 1 hPa Size. Discarding bins that had fewer than 50 samples in them, we find that the average difference in temperature through the profile is 0.4"C and the average diffemcc in humidity is -3% RH. Much of the difference in the RH measurements is accounted for by the lag in the descending phase measurement of the increase in humidity found at the tropopause. Average differences between the two phases do not Seem to increase as a function of the average lag betweensamplestakenatthesamepressure.
As may be expected from the nature of the measurement, the average differences between the winds measufed during the ascending and descending phases wete geaerally small. nK distriiution of bin- averaged differences was symmetric with maximum and minimum bin-averaged differences of approximately 5 m/s When integrated, the column average difference in wind speed is was only 0.2 m/s and the median phase angle difference was 0 degrees.
5.0 CONCLUSIONS
Results h m the ground check procedure show that ARM radiosondes are within the manufacturer's specifications for measurement of relative humidity. Bemuse of procedural amfacts, the ground check data could not be used to similarly verify the specification for temperahxe. Analysis of pseudo-qWdatafromascendinganddescending phases of operational soundings suggest that the
temperature measurement is within the H.2"C specified for the system, but more analysis is required to w n f m the accuracy of the temperature sensor alok On average, data collected during the ascending and descending phases of the soundings are quite similar, but the detailed structure may be obscured on descent by loss of sampling density. Uncednty about the physical position response of the radiosonde sensors during descent complicates the situation, but the set of ascending and descending soundings obtained by ARM represent a rich data source for examination of both operational radiosonde sensor response and short time-scaIe changes in the state of the atmosphere.
6.0 ACKNOWLEDGh4ENT
This work was supported by the U. S. Department of Energy, Office of Energy Research, Office of Health and Environmental Research, under contract W-31-109-Eng-38.