Health (Treatment of Sewage and Disposal of Effluent and ...

Louisiana State UniversityLSU Digital Commons
LSU Historical Dissertations and Theses Graduate School
1959
An Engineering Study of the Effluent DisposalProblems of the Louisiana Raw Sugar Industry.Joseph Edward Wheeler JrLouisiana State University and Agricultural & Mechanical College
Follow this and additional works at: https://digitalcommons.lsu.edu/gradschool_disstheses
This Dissertation is brought to you for free and open access by the Graduate School at LSU Digital Commons. It has been accepted for inclusion inLSU Historical Dissertations and Theses by an authorized administrator of LSU Digital Commons. For more information, please [email protected].
Recommended CitationWheeler, Joseph Edward Jr, "An Engineering Study of the Effluent Disposal Problems of the Louisiana Raw Sugar Industry." (1959).LSU Historical Dissertations and Theses. 573.https://digitalcommons.lsu.edu/gradschool_disstheses/573

AN ENGINEERING STUDY OF THE EFFLUENT DISPOSAL
PROBLEMS OF THE LOUISIANA RAW SUGAR INDUSTRY
A Dissertation
Submitted to the Graduate Faculty of the Louisiana State University and
Agricultural and Mechanical College in partial fulfillment of the requirements for the degree of
Doctor of Philosophy
in
The Department of Chemical Engineering
byJoseph Edward Wheeler, Jr.
B.S., Louisiana State University, 1954 M.S., Louisiana State University, 1956
August, 1959

ACKNOWLEDGEMENT
The writer is indebted to Dr. Arthur G. Keller for his/guidance and help in organizing and carrying out this project,
to the Louisiana Sugar Producers Waste Control Council for
support of the project during its first two years and to the
Engineering Experiment Station of Louisiana State University
for the remaining support. Much help and advice was received
from the faculty and staff of the Chemical Engineering Depart
ment at L.S.U.

TABLE OF CONTENTS
Page
ABSTRACT ix
INTRODUCTION 1
CHAPTER
I THE RAW SUGAR INDUSTRY IN LOUISIANA-POLLUTIONPROBLEMS 2
II THE OPERATION OF A RAW CANE SUGAR FACTORY 10
III THE UTILIZATION OF WATER IN RAW CANE SUGARMANUFACTURE 13
IV FIELD STUDIES 20
In-Plant Effluent Studies 23
Raw Sugar Factory Effluents 28
Condenser Cooling Water 31
V THE DISPOSAL OF CANE WASH EFFLUENT 48
VI BIO-STABILIZATION STUDIES 69
The Need for a New Process 69
Functions of Micro-organisms in 69Treatment
Mechanism of Biological Stabilization 71
Stages of Biological Growth 72
Preliminary Treatment Studies 74
Supply of Raw Material 77
Non-flow Reactors 84

CHAPTER PageAerobic vs Anaerobic Treatment 92
Nutrient Addition 92
Quantitative Evaluation of Kinetic Data 104
Effect of Nutrient Addition 104
VII CONCLUSIONS 109
BIBLIOGRAPHY 113
APPENDIX 117
I NOMENCLATURE 118
II EXPLANATION OF TERMS AND ANALYTICAL TESTS 119
III SUITABILITY OF THE O.C. TEST AS A MEASUREOF B.O.D. 123
IV THE a-NAPHTHOL TEST FOR DISSOLVED SUGARS 127
V TABULATED CANE WASH CLARIFICATION TESTRESULTS 129
VITA 138

LIST OF TABLES
TABLE Page
I Effluents Produced at the Audubon SugarFactory— 1944 22
II Physical Characteristics of Cane Wash Water 42
III Summary of Cane Washing Practice inLouisiana 52
IV Cane Wash Water Solids Data, 1955 59
V Effluent Stabilization Study--Effeet of pHon Stabilization Rate 78
VI Effluent Stabilization Pilot Plant 83
VII Early Pilot Plant, Run No. 3 86
VIII O.C. in Reactors Containing Various Amountsof Ammonia, Run No. 1 89
IX O.C. and B.O.D. in Reactors ContainingVarious Amounts of Ammonia and Phos- 94phorous, Run No. 4
X O.C. and B.O.D. in Reactors, Run No. 3 95
XI Summary of Reaction Half-Lives for AerobicReactors Containing Various Concentrations of Added Nutrients, Temperature: 20 °C
XII Summary of Reaction Half-Lives for AerobicReactors Containing Various Concentrations of Added Nutrients, Temperature: 24°C
XIII Summary of Reaction Half-Lives for AerobicReactors Containing Various Concentrations of Added Nutrients, Temperature: 15 °C
v

TABLE
XIV
XV
Summary of Reaction Half-Lives for Aerobic Reactors Containing Various Concentrations of Added Nutrients, Temperature: 20 °C
Comparison of the Effects of Nitrogen Addition and Temperature on Reaction Half- Lives for Aerobic Stabilization of Cane Wash Effluent
Page
101
102
vi

1
2
3
4
5
6
7
8
9
1011
12
13
LIST OF FIGURES
Variation in Water Level of Bayou Teche
Grinding Rate—Louisiana Raw Sugar Factories
Process Flow Diagram of a Cane-Sugar Factory Showing Discharged Effluent
Raw Cane Sugar Factory Water Utilization Flow Diagram
Average Values of B.O.D. in Bayous at Various Sugar Factories
B.O.D. Discharged into Bayous at Various Sugar Factories
Average Values of D.O. in Bayous at Various Sugar Mills
Average Values of Temperatures in Bayous at Various Sugar Mills
Diagram of Multi-Stage Cane Wash Installation at Caldwell Sugar Cooperative
Iberia Impounding Pond— 12/30/57 to 2/3/58
First Stabilization Test— Log^o of Fraction of Original O.C. vs. Time in Hours
Schematic Diagram of Flow Reactors Showing Thermostatic Water Bath, Refrigeration, and Adjustable Rate Feed Pump
Diagram of Constant-Temperature Multiple Reactor Apparatus
Oxygen Consumed Versus Time for Filtered Cane Wash Effluent at 20°C

FIGURE Page
15 Comparison of B.O.D. and O.C. Curves forAerobic and Anaerobic Reactors
16 Effect of Nitrogen on Reaction Half-Livesof Cane Wash Effluent
17 Effect of Temperature on Reaction Half-Lives of Cane Wash Effluent
18 Correlation of O.C. with B.O.D. for LiquidSugar Factory Effluents
96
105\
108
125
viii

ABSTRACT
Cane sugar manufacture is Louisiana's oldest industry,
dating back to 1750. The cane grinding operation is seasonal,
starting in mid-October and lasting about 70 days depending
upon the crop and weather.
Cane juice, molasses, and sugar, because they are readily
utilized by most biological organisms as food, are strong
sources of organic pollution. Sugar and molasses have
Biochemical Oxygen Demands of 1,250,000 and 930,000 ppm,
respectively.
Although the method of processing sugar cane into sugar
is the same as it has been for many years, changes in drain
age patterns and factors have brought pollution problems
created by the sugar industry into focus.
With the influx of other industries in the sugar area
the populace which formerly accepted pollution resulting from
sugar processing as a necessary burden, is now striving to
keep the waters suitable for recreation.
The average throughput of Louisiana raw sugar factories
has increased over the years as a result of low sugar prices
and rising costs. Many factories now handle twice the amount of
cane for which they were originally designed. This overloading

has increased pollution of the streams because of spills
and/or entrainment in evaporators and vacuum pans.
Mechanized methods of cane harvesting have increased
the amount of field mud delivered with the cane so much that
over half of the mills now are obliged to wash it prior to
processing. The effluent from the washing operation is
heavily laden with sugars, soil, and pieces of broken cane.
Plant effluent surveys, made by the author, showed that
the principal effluents not readily controlled by efficient
factory operation are the cooling water from the barometric
condensers and cane wash effluent. Factories were losing
substantial quantities of sugar per day through entrainment.
This problem was remedied by revising the entrainment removal
devices on the evaporators and vacuum pans.
A study was then made of the cane wash effluent problem
in order to effect a reduction in effluent volume while main
taining effective dirt removal from the cane and to develop
an economical treatment.
It was shown that the volume could be reduced to one-
third by multi-stage washing without danger to the factory
from biological growths. Batch reactors were utilized to
evaluate the effects of aeration, temperature, and nutrient
addition on the bio-stabilization of cane wash effluent.
x
Aerobic operation was found to be several fold faster
than anaerobic. The effect of temperature was found to
closely follow the van't Hoff-Arrhenius relation, i.e., the
rate approximately doubled for each 10°C increase in tem
perature. An analysis of variance showed that nitrogen
addition in the ratio of about 1:20 nitrogen to B.O.D. was
optimum for rapid stabilization. Potassium and phosphorous
had no significant effects.

INTRODUCTION
The problems facing the Louisiana sugar industry in
abating and preventing water pollution are as diversified
as the industry itself. However, there is a single funda
mental goal--the control of discharged wastes so that water
quality is suitable for further use by others. This re
quires that adequate pollution control measures be devised
and respected by each link in the chain of users of water
from any given stream.
A sugar factory must have water for cooling, steam
generation and for general utility purposes. It became im
perative to find a way to overcome the pollution problem if
the industry was to survive. In order to carry out this
goal several raw sugar factories in Louisiana formed in 1954
the Louisiana Sugar Producers Waste Control Council. This
organization made arrangements with the Chemical Engineering
Department of Louisiana State University to sponsor the re
search project upon which this dissertation is based.
1

CHAPTER I
THE RAW SUGAR INDUSTRY IN LOUISIANA - POLLUTION PROBLEMS
The raw sugar industry was established in Louisiana37 in
1750. During the formative years of the industry transporta
tion in the state was mainly by water and the industry devel
oped along major waterways. Raw sugar factories are found
along the Mississippi River, Bayou Lafourche, and Bayou Teche.
There is a heavy concentration of mills along Bayou Lafourche
extending from Donaldsonvilie to Lockport and on Bayou Teche
from Breaux Bridge to Franklin. In addition, there are
factories scattered along various small bayous such as Erath
Factory on Bayou Tigre and Meeker on Bayou Boeuf. Altogether
there are about 50 in the state.
Raw cane sugar manufacture, like most agricultural in
dustries, is seasonal. Factory operation extends from late
October through December, a period of 60-70 days. The grind
ing season starts as soon as the sucrose content of the cane
has reached a satisfactory level and ends when the crop is
either completely harvested or is killed by freezing weather.
This situation necessitates that the factories operate at
maximum capacity, 24 hours a day, 7 days a week until the crop
is harvested. While the number of operating factories has
decreased through the years, the cane acreage has remained

3
constant and the production of sugar is at an all time high.
The result is that the remaining factories are accomplishing
higher and higher throughputs each year. The industry has
been a marginal one for many years and is unable to invest
any considerable amount of money in plant improvements or in
facilities for better usage of water.
The problem of water pollution by sugar factories is
not new. References are found in the literature as far back
as the later 19th century4*8>11 *21>32>38. Many of the earlier
investigators were handicapped by a lack of analyses which
would provide them with numerical values rather than arbi
trary comparisons of "good" and "bad" effluents. Most raw
sugar factories today do not differ greatly in their opera
tions from those of a quarter century ago. Although the
mills then discharged large pollutional loadings the pollu
tion problem was not as critical as it is at present.
Three principal factors have been responsible for the
present effluent problem. First, and most important, is the
obstruction to flow in the bayous by flood control structures.
Erected by the U.S. Array Engineers as a result of the 1927
flood disaster, these structures have changed once flowing
streams (particularly the Teche and Lafourche) into compara
tively stagnant drainage outlets with little flow except during
4
periods of heavy rainfall. In the Teche, for example, the
flow is upstream as well as downstream, depending upon the
prevailing wind, rain, and tidal conditions. Thus one often
finds that waste discharged days previously has been carried
back upstream to the door of the very mill that discharged it.
At other times the level of the water may drop until much of
the stream bottom is exposed. Figure 1 shows the level of
Bayou Teche at daily intervals during the 1954 grinding season.
It should be noted that the level during the latter part of
the season, when the waste disposal capacity of the stream was
most needed, was appreciably less than at the beginning.
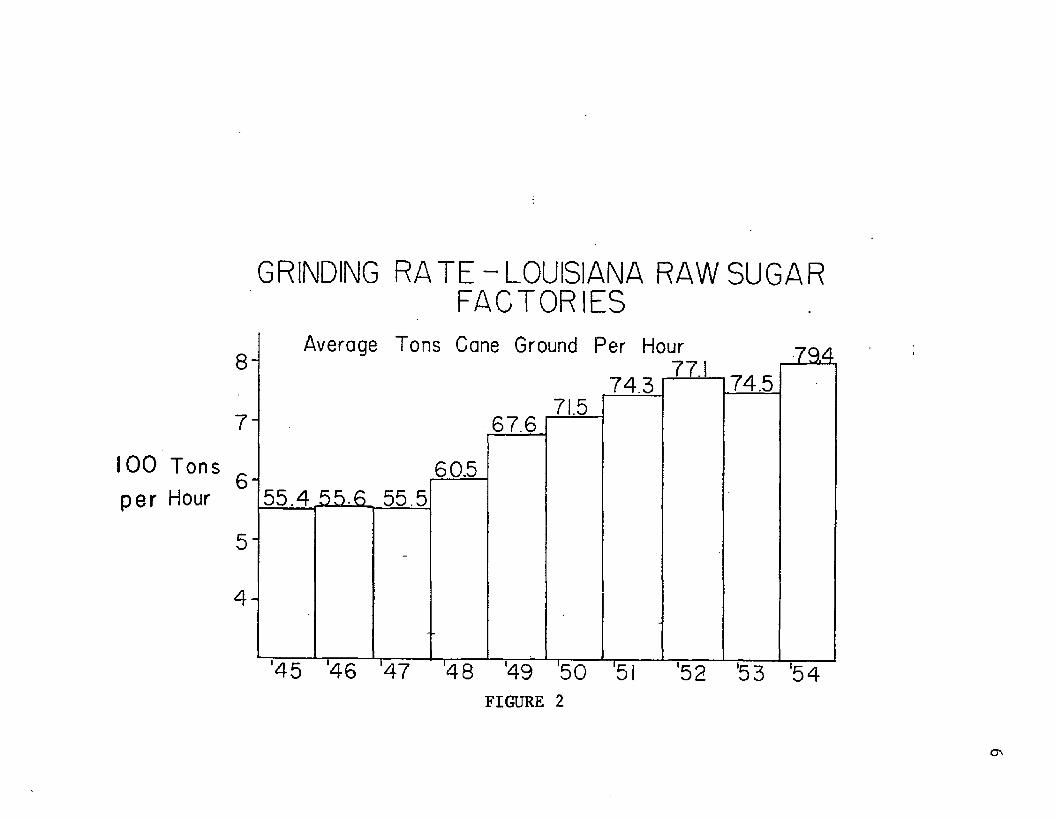
The second factor in this problem is the increased through
put of the average mill. Figure 2 shows the hourly grinding
rate of the average mill in Louisiana over a number of years.
It shows a steady upward trend in grinding rate per factory.
As labor and material costs continue to increase, the factories
find that they must process more cane to stay on a sound eco
nomic footing. Those that cannot expand their operation find
themselves operating at a deficit. The mills that continue
to operate then receive the cane formerly processed in the
extinct ones. Because sufficient profits have not been earned
this steady increase in capacity has not been accompanied by
a corresponding enlargement of plant facilities. Consequently,

VARIATION IN WATER LEVEL OF BAYOU TECHE
(As Read At Gauge Of Iberia Sugar Co-Op., New Iberia)
+GaugeReading(Inches)
Zero Level = 0 c t . 2 4 , 1954 _________1*30 p.m._________
10-
Crop Day
FIGURE 1U l
GRINDING R A T E -LO U IS IA N A RAW SUGAR FA C TO R IE S
8 -
7 -
100 Tons
Average Tons Cane Ground Per Hour77.
67.671.5
b ‘Hour 55 4 55-6 55.5
5 “
4 -
1 y, i A ■i' L
60.5
74.3 74.5IM
'52 '53 '54FIGURE 2

many of the mills are now operating at far greater rates than
they were designed to handle. Overloading of equipment has
caused the problems of spills and entrainment to become pol-
lutionally important.
The third factor causing pollution problems for the sugar
industry is the widespread practice of washing the cane enter
ing the mills. This is done to remove loose dirt and trash
from the cane before it is processed. Rising labor costs have
forced cane growers to adopt mechanized methods for harvesting
cane. This has increased the amount of foreign material con
tained in the cane delivered to the point where more than one-
half of the raw sugar houses in Louisiana find themselves
obliged to wash the cane as it enters the factory. The efflu
ent from the cane washing operation is heavily laden with sugars
and other organic materials which pollute the body of water
that it is allowed to enter.
In past years, soon after the start of each cane grinding
season, the bayous of South Louisiana have become badly pol
luted. Bayou Teche, for example, from New Iberia to Charenton
has become septic and covered with a blanket of dead fish.
At one time the economy of the area was solely dependent upon
the sugar industry and consequently the pollution was accepted
by the majority of the people as a "necessary evil". In
8
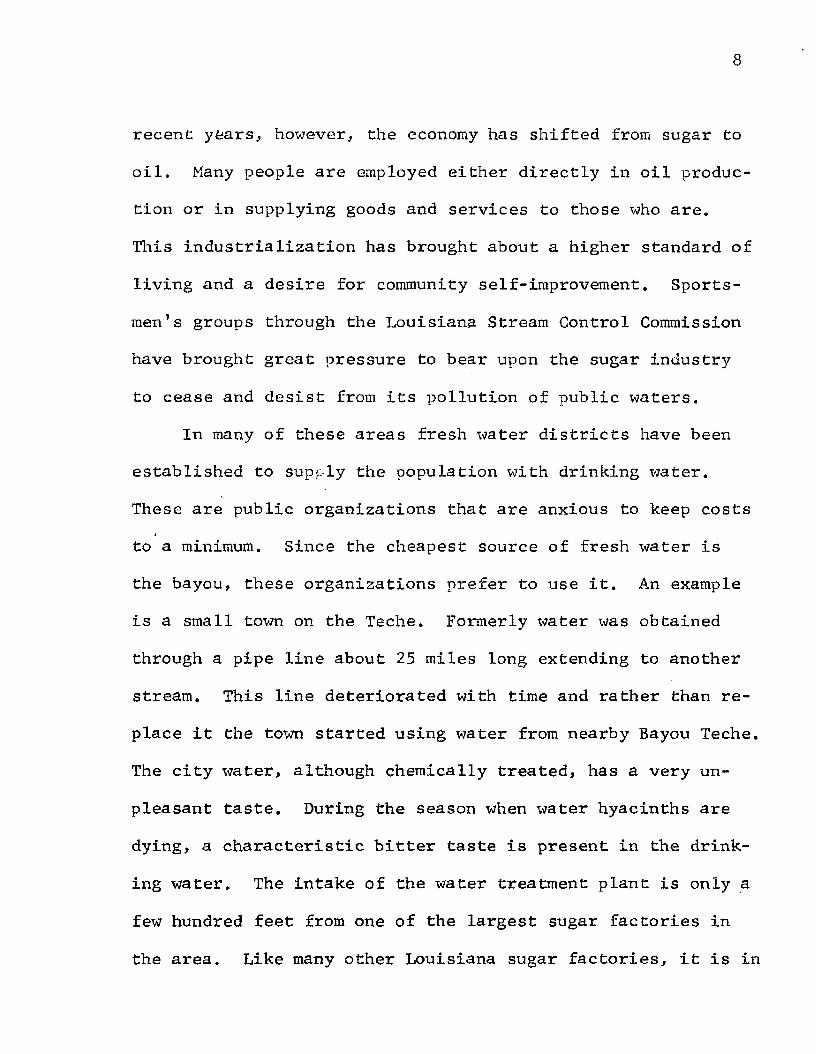
recent yfears, however, the economy has shifted from sugar to
oil. Many people are employed either directly in oil produc
tion or in supplying goods and services to those who are.
This industrialization has brought about a higher standard of
living and a desire for community self-improvement. Sports
m e n ’s groups through the Louisiana Stream Control Commission
have brought great pressure to bear upon the sugar industry
to cease and desist from its pollution of public waters.
In many of these areas fresh water districts have been
established to supply the population with drinking water.
These are public organizations that are anxious to keep costs
to a minimum. Since the cheapest source of fresh water is
the bayou, these organizations prefer to use it. An example
is a small town on the Teche. Formerly water was obtained
through a pipe line about 25 miles long extending to another
stream. This line deteriorated with time and rather than re
place it the town started using water from nearby Bayou Teche.
The city water, although chemically treated, has a very un
pleasant taste. During the season when water hyacinths are
dying, a characteristic bitter taste is present in the drink
ing water. The intake of the water treatment plant is only a
few hundred feet from one of the largest sugar factories in
the area. Like many other Louisiana sugar factories, it is in
9
the unhappy position of being an established plant that suddenly
has no place to dump its effluent.

CHAPTER II
THE OPERATION OF A RAW CANE SUGAR FACTORY
In order to present the full scope of this work it is
advisable to first describe the operation of a sugar factory.
In the field, cane is cut by mechanical harvesters which
sever it at the bottom, trim off the top and pile it in rows.
After burning to remove excess leaves the cane is loaded into
trucks by mechanical grabs. A bundle weighs 2-3 tons. Each
truck carried about 20 tons of cane to the factory where the
bundles are unloaded by crane and placed on a conveyor known
to the industry as a "feeder table". Here the cane is often
washed by water sprays to remove adhering dirt and trash. From
the feeder table the cane drops to a slat conveyor (where it
may be washed also) and is transported through one or more sets
of revolving knives which chop it into small pieces. The
juice is squeezed from the cane by multiple-roller mills. The
woody material remaining (Bagasse) may be burned as fuel, sold
as animal litter, or baled and sold for the manufacture of
wall board (Celotex). Juice from the mills is screened,
weighed, treated with lime to a pH of about 8 and heated by
steam to about 210°F in a shell-and-tube heater. The juice
then passes into insulated clarifiers where the suspended
solids are removed by settling. Underflow (mud) from the

11
clarifier is filtered and the filtrate re-circulated through
the process. The filter cake is either mixed with water and
pumped as a slurry into impounding basins or hauled to nearby
fields to serve as fertilizer. Clarified juice is passed
through multiple-effeet evaporators where water is removed to
concentrate it to about 60% solids (syrup). The syrup is
further concentrated in vacuum pans, where sugar is crystal
lized from the mother liquor. The mixture of liquid and
sugar crystals is dropped into a perforate basket, vertical
centrifugal where the crystals are separated. The liquid
from the centrifugals is re-concentrated and another crop of
crystals is obtained. Generally three "strikes" or batches
of crystals are obtained from a given syrup. The raw sugar
is usually about 97% sucrose and is sold as such to refiners.
Spent liquor or final molasses may be sold for cattle feed,
fermentation into alcohol, or yeast production,
Spencer and Meade37 give a detailed discussion of each
step of sugar manufacture.
The general flows of a raw cane sugar factory are shown
in Figure 3. In this figure the major effluents are shown
as being discharged to the right of the diagram.

12
FIGURE 3
PROCESS FLOW DIAGRAM OF A CANE-SUGAR FACTORY SHOWING DISCHARGED EFFLUENT
, CANE FROM FIELDS
CANE WASHWATER
REVOLVING CANE KNIVES
BEARING COOLING WATERFLOOR WASHINGS
' LIMESLURRY !
ROTARY FILTER
CONDENSER COOLING WATERCLEANING SOLUTIONS
FLOOR WASHINGS
MILLS
SLUDGE
JUICE
BAGASSE
MOLASSESRAW SUGAR
CLEAR JUICE CLARIFIERS
VACUUM PANSEVAPORATORS
CENTRIFUGALS
FEEDER TABLE
LIMING TANKS
CANE CARRIER
JUICE HEATERS
WEIGHING TANKS
FILTER PRESS MUD

CHAPTER III
THE UTILIZATION OF WATER IN RAW CANE SUGAR MANUFACTURE
Water requirements for raw cane sugar manufacture may be
grouped into two general categories:
(a) Water used for cooling purposes(b) Water used in processing
The utilization of this water is best visualized by re
ferring to Figure 4, '’Water Utilization Diagram of a Cane
Sugar Factory". Water for cooling purposes is used in the
barometric condensers of multiple-effeet evaporators and
vacuum pans, and to cool the sugar massecuites in crystal-
lizers. The quantity of cooling water used varies from 3,000
to 12,000 G.P.M., depending upon the size and equipment ofITeach factory. It has been estimated by Keller that the
Louisiana industry as a whole uses about 360 million gallons
of water per day during the grinding season. The water
generally comes from streams or wells near the factories and
is discharged to a stream or adjacent swamp area. Many mills
utilize closed re-circulating systems with spray ponds to
reduce the amount of water needed from outside sources.
Water is actually used in the process for: (1) washing
sugar crystals, (2) boiler feed water, (3) coolant for machinery
bearings, (4) spraying onto the ground cane that has previously
passed through one or more sets of rollers to aid in dissolving
13

FIGURE 4
RAW CANE SUGAR FACTORY WATER UTILIZATION FLOW DIAGRAM
SUPPLY WATERCOOLING WATER
STEAM
COOLING WASHMACERATION
JUICESUGAR
BAGASSE MOLASSES
't FROM CONDENSERS
EXCESS CONDENSATEBLOW-DOWN
FLOOR WASHINGS. CLEAN-OUTS. CANE WASH. MISCELLANEOUS
BOILERS
HEATERS
CANEMILLS
CONDENSERS
ACCUMULATOR
EVAPORATORS
HOUSE SUPPLY
CENTRIFUGALS
SODA AND ASH SOLUTIONS
15
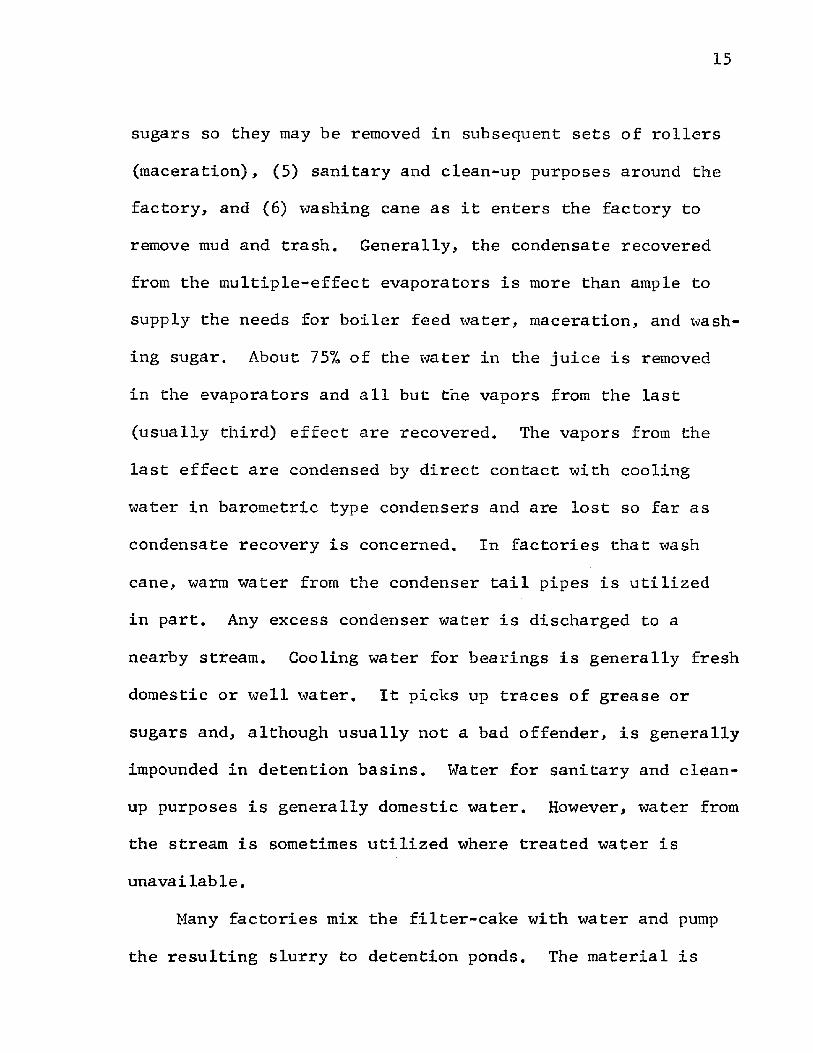
sugars so they may be removed in subsequent sets of rollers
(maceration), (5) sanitary and clean-up purposes around the
factory, and (6) washing cane as it enters the factory to
remove mud and trash. Generally, the condensate recovered
from the multiple-effect evaporators is more than ample to
supply the needs for boiler feed water, maceration, and wash
ing sugar. About 75% of the water in the juice is removed
in the evaporators and all but the vapors from the last
(usually third) effect are recovered. The vapors from the
last effect are condensed by direct contact with cooling
water in barometric type condensers and are lost so far as
condensate recovery is concerned. In factories that wash
cane, warm water from the condenser tail pipes is utilized
in part. Any excess condenser water is discharged to a
nearby stream. Cooling water for bearings is generally fresh
domestic or well water. It picks up traces of grease or
sugars and, although usually not a bad offender, is generally
impounded in detention basins. Water for sanitary and clean
up purposes is generally domestic water. However, water from
the stream is sometimes utilized where treated water is
unavailable.
Many factories mix the filter-cake with water and pump
the resulting slurry to detention ponds. The material is

16
allowed to remain there for several months to decompose and
dry out by evaporation. During the summer months the dried
material is removed and spread on the fields as fertilizer.
Formerly this material was dumped directly into a stream, a
practice which is no longer continued except by some factories
along the Mississippi River where large dilution is available.
As the sugar mill effluent is not toxic, the organic material
therein is readily purified by biological stabilization in
the river.
In order to understand the pollution problems of the
sugar industry a knowledge of the constitution of the waste
discharged and the manner in which it exerts a pollutional
effect upon a body of water is desirable. Sugar factory wastes
are similar to those from other food processing, starch manu
facture, pulp, and paper mills in that they pollute the waters
by exerting an "oxygen demand" by virtue of their utilization
as food for micro-organisms present in the environment. This
is in sharp contrast to the "toxic" pollution exerted by the
wastes from certain industrial plants which exerts itself in
the form of poisonous material in the effluent. Examples of
this toxic type of pollution are cyanide wastes from plating
plants, acids found in coal mine drainage and the waste
"pickling" liquors of the steel industry. A noteworthy

17
example of these are certain phenolic materials which have
been discharged into the Mississippi River in the past as
constituents of oil refinery effluents in the Baton Rouge
area. When chlorinated in domestic water treatment plants
these wastes form chloro-phenols which caused the water in
the city of New Orleans to have a "medicinal” taste in con
centrations as low as 1 part per million. In 1918 serious
complaints of intolerable "medicinal" tastes in the water
were registered in Milwaukee. The source was found to be a
phenol plant on the Indiana side of the lake28.
Thus, the sugar mill pollution problem is one of organic
material entering the body of water where it acts as food
for micro-organisms present there. It is the growth and re
production of these organisms with their accompanying action
upon the surrounding atmosphere, water, plant and animal life
which is the undesirable end pollutional effect. If the
material remained sterile after it entered the water there
would be no pollutional effect. However, it is this same
microbial action which allows the earth to continually purify
itself and replenish life over and over again through the ages.
Without it the world would be a barren refuse heap.
A detailed discussion of the mechanism or biological
decomposition will be found in texts on waste15'26>33>36 treat
ment. Biological activity uses up oxygen from the water. When

18
the surroundings contain ample dissolved oxygen to supply the
needs of stabilization of the effluent the decomposition is
said to be "aerobic". When dissolved oxygen is not present,
the organisms utilize combined forms of oxygen or oxidizing
compounds. This "anaerobic" decomposition produces hydrogen
sulfide, methane, and numerous intermediate products which
are foul to the taste and smell as well as being toxic.
The immediate and most striking result of oxygen deple
tion in a stream is the death of fish. When the dissolved
oxygen concentration begins to drop, fish begin to die. The
game fish are killed first and as the oxygen content of the
water approaches nil the hardy "outlaw" fish such as gar are
overcome.
Fish will try to leave a location where the dissolved
oxygen is depleted, but frequently they are unable to escape.
It was common to see Bayou Teche in the vicinity of Jeanerette,
where there are four sugar factories, covered by fish floating
dead on the water after the mills began operation.
Organic pollution fosters the growth of innumerable types
of plants and organisms which utilize the material for nutri
tion and growth. One might visualize this complex as a
thriving community wherein a source of new money is the organic
pollution which is used many times as it passes from person to

19
person, each obtaining a living and in turn helping to support
others. This interrelationship is excellently discussed by
Phelps28.
The effect of this micro-organism community is diverse.
Often foul odors and tastes result which render the water
unfit for drinking. Unpleasant smells make the neighborhood
undesirable for habitation, a condition which is very unfavor
able to community development. Grossly polluted waters develop
a black color and become opaque due to the micro-organism
life therein.
It is a known fact that polluted waters harbor pathogenic
bacteria. In the past, many epidemics of typhoid fever and
dysentery have been caused by polluted drinking water. Con
ditions which favor the growth of micro-organisms, namely a
source of organic enrichment, will conserve and promote the
life of pathogenic bacteria1*.
A number of tests have been developed to evaluate the
magnitude of water polution. The ones which are of importance
to this study are the D.O., O.C. and B.O.D. tests. A brief
description of these will be found in the appendix.

CHAPTER IV
FIELD STUDIES
A survey of the literature showed that no comprehensive
study had been made of commercially operating raw cane sugar
factories. However the problem was recognized as far back
as 1914 when it was estimated that 3000 pounds of sugar per
million pounds manufactured were lost26. It was observed at
this early date that ’’The most important source of pollution
in Louisiana is that from sugar factories.” The pollutional
effects cited were removal of oxygen from streams, death of
fish, and the production of unpleasant odors.
In 1944 a study was made by the Louisiana Stream Control
Commission on the effluents from the Audubon Sugar Factory,
an experimental sugar mill which is operated by Louisiana
State University19. Although other work prevented a detailed
study, a series of tests and flow measurements was carried
out in order to determine the strengths of typical sugar
factory wastes. The experimental sugar factory ground cane
at the rate of 10 tons per hour for only 11 hours per day,
5 days a week, as compared to a typical commercial operation
of 80 tons per hour, 24 hours a day, 7 days a week. Its
wastes in contrast to a full size plant were very small.
The Audubon factory is an ideal operation which is super
vised by the Department of Chemical Engineering. The survey
20

21
showed this to be true by pointing out that the B.O.D. of
the Audubon condenser water was only 21 compared to 162 for
an unnamed commercial factory grinding 1300 tons of cane per
day and 37 for a second factory grinding 2700 tons. The re
port stated that the equivalent population required to produce
this effect would be 1154 people for Audubon and 48,600 and
30,000 for the two commercial factories respectively.
Another source of pollution pointed out in the Audubon
survey was the wastes resulting during bi-weekly cleanings.
The heat transfer surfaces of evaporators and heat exchangers
are cleaned periodically using caustic soda and muriatic
acid alternately. The small volumes of these wastes made
them much less a problem than the day to day effluents, even
though these wastes are relatively concentrated.
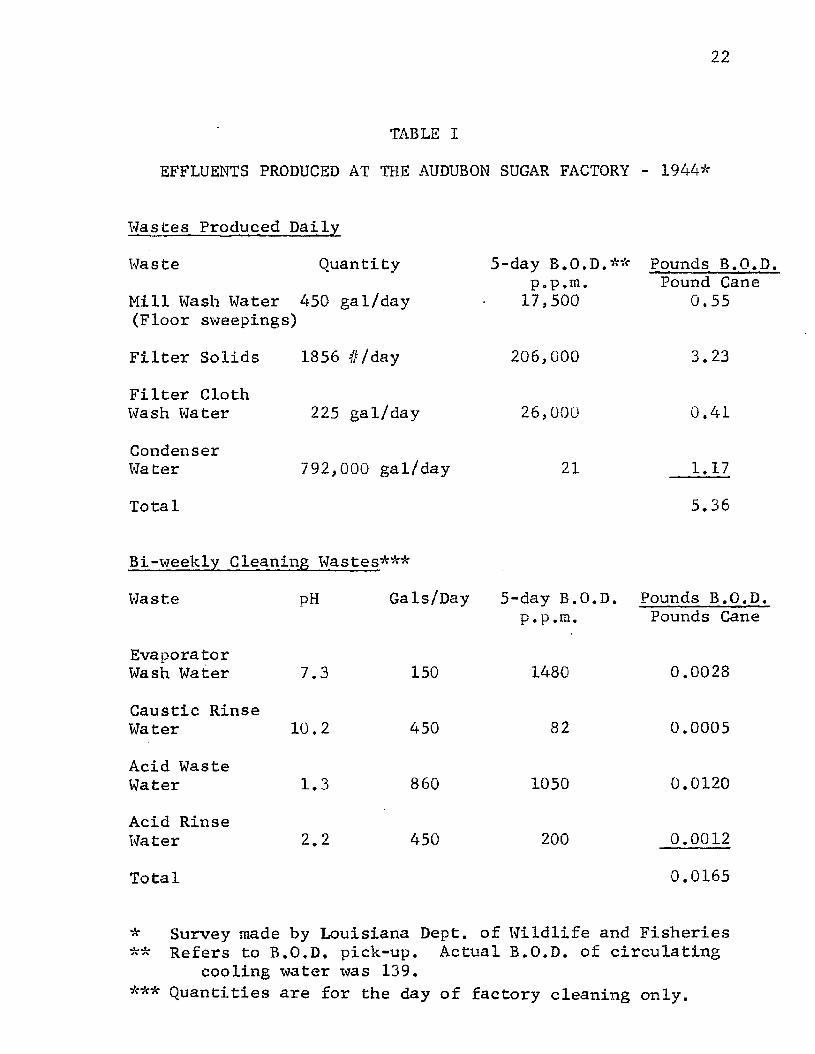
The results of the Audubon tests were cited by Cusachs*
at the 1947 Short Course for Water and Sewage Plant Operators
held at L.S.U. The findings are summarized in Table I.
As a result of this survey it was concluded by the Stream
Control Commission that all sugar mill operators in the state
should discharge only their condenser water into public
streams. It was also stressed that the population equivalent
of the two commercial factory effluents was greater than the
total population of all communities along their receiving
22
TABLE I
EFFLUENTS PRODUCED AT THE AUDUBON SUGAR FACTORY - 1944*
Wastes Produced Daily
Waste Quantity
Mill Wash Water 450 gal/day (Floor sweepings)
Filter Solids
Filter Cloth Wash Water
CondenserWater
Total
1856 #/day
225 gal/day
792,000 gal/day
5-day B.O.D.** Pounds B.O.D. p.p.in. Pound Cane17,500
206,000
26,000
21
0.55
3.23
0.41
1.17
5.36
Bi-weekly Cleaning Wastes***
Waste pH Gals/Day
Evaporator Wash Water
Acid Waste Water
Acid Rinse Water
Total
7.3
Caustic Rinse Water 10,2
1.3
2.2
150
450
860
450
5-day B.O.D. Pounds B.O.D. p.p.m. Pounds Cane
1480
82
1050
200
0.0028
0.0005
0.0120
0.00120.0165
* Survey made by Louisiana Dept, of Wildlife and Fisheries** Refers to B.O.D. pick-up. Actual B.O.D. of circulating
cooling water was 139.*** Quantities are for the day of factory cleaning only.

23
streams,
Very little further attention was given the cane sugar
factory pollution problem until 1954. At that time the
Louisiana Stream Control Commission set a discharge limit of
1-1/2 pounds of B.O.D. per ton of cane ground on those mills
discharging into Bayou Teche. The restrictive orders, issued
with the intent of improving the condition of Bayou Teche,
were unsuccessful. Several factories were served by the
Stream Control Commission with "Cease and Desist" orders.
At this time a group of factories banded together and formed
the Louisiana Sugar Producers Waste Control Council, the
originator and sponsor of this project.
In-Plant Effluent Studies
Prior to each grinding season inspection visits were made
by the author to the factories that were participating in the
project. There were eight factories in the original group.
Sampling and analytical procedures were provided for each
mill and detailed instructions given to their chemists and
other supervisory personnel involved.
The factories purchased and set up the necessary equip
ment to perform O.C. and D.O. analyses. Because a rather
expensive constant-temperature incubator is needed to perform
B.O.D. analyses they were run only at L.S.U. on samples which

24
were delivered there at frequent intervals. Visits were made
to the factories at intervals of one week or less. At the
time of each visit the operation was inspected from a pollu
tion abatement standpoint, the laboratory analyses performed
at the mill were examined, recommendations were made to
operating personnel to alleviate any trouble found arid samples
were collected for immediate transport to Baton Rouge. These
samples were packed in ice and rushed by auto or by private
aircraft to L.S.U. in order to prevent any deterioration
prior to analysis. In addition to B.O.D,, analysis, the O.C.
was determined on most samples to obtain a correlation be
tween the two so that the samples analyzed by the factory
laboratories could be used in estimating B.O.D. pollutional
loadings. This correlation is shown in the appendix.
Weirs were installed at the mills to measure flows.
Readings were obtained from them at regular intervals
throughout the grinding season. In addition a set of three
Parshall flumes having throat widths of 3", 6", and 3' were
constructed and a "Brown" recording and integrating flowmeter
suitable for these units was purchased. This equipment made
it possible to obtain instantaneous flow rates, total flows,
and a profile record of effluent discharge volumes through
out the day from a given source. When no flow measuring

25
device was available, flows were estimated using the charac
teristic curves for the pumps involved.
Analytical reagents required to run the O.C. and D.O.
tests were prepared for the factories in order to insure re
liable results. Nearly 100 gallons of standard solutions
were supplied to the factories each year.
The results obtained from the first survey made it evi
dent that there were certain key sources of pollution common
to most factories. Efforts were then made to have the factories
take the necessary correctional steps. This was not difficult
as it was shown that much of the pollution was being caused
by material that should be leaving as product.
A survey of the factories during the next season showed
rather striking improvements resulting from various steps
taken as a result of the initial survey.
Figure 5 shows the B.O.D. values for six factories before
the 1954 season, during the season, and during the following
season when remedial measures advocated as a result of the
initial survey had been put into effect. In order to protect
the confidential nature of the survey the factories are iden
tified by letter and general location. It is of interest to
note the rather wide variation found from factory to factory.
Figure 6 shows the pounds per day of B.O.D. discharged

26
FIGURE 5AVERAGE VALUES OF B.O.D. IN BAYOUS
AT VARIOUS SUGAR FACTORIES
120
BEFORE SEASON
100
80
PmPh
*OftPQ
60
40
20
DURING SEASON □
inc\r“ t
ino \r*H
A E FDCBFACTORY DESIGNATION
1955

B.O.D.
DISC
HARG
ED,
POUNDS
PER
DAY
FIGURE 6
B.O.D. DISCHARGED INTO BAYOUS AT VARIOUS SUGAR FACTORIES
4000
3200
2400
1600
800
o oo oo oA oi—I i.OI— ( r-i O N
o O o4-1 4-1 4J
m
m \om m inO N O N O Nr H i— i !—(
inO Nr H
inmON
v-OmON
mONmmon
<1- UN <0m UN mON ON ONi— i r—i r~l
mm inON ON i—I r - i
B D E F
FACTORY DESIGNATION
195 4
____
____
____
____
to 27
,600
1955

28
by several factories. It is a key feature of the survey since
the other pollutional effects upon the stream are a result of
the B.O.D. discharged.
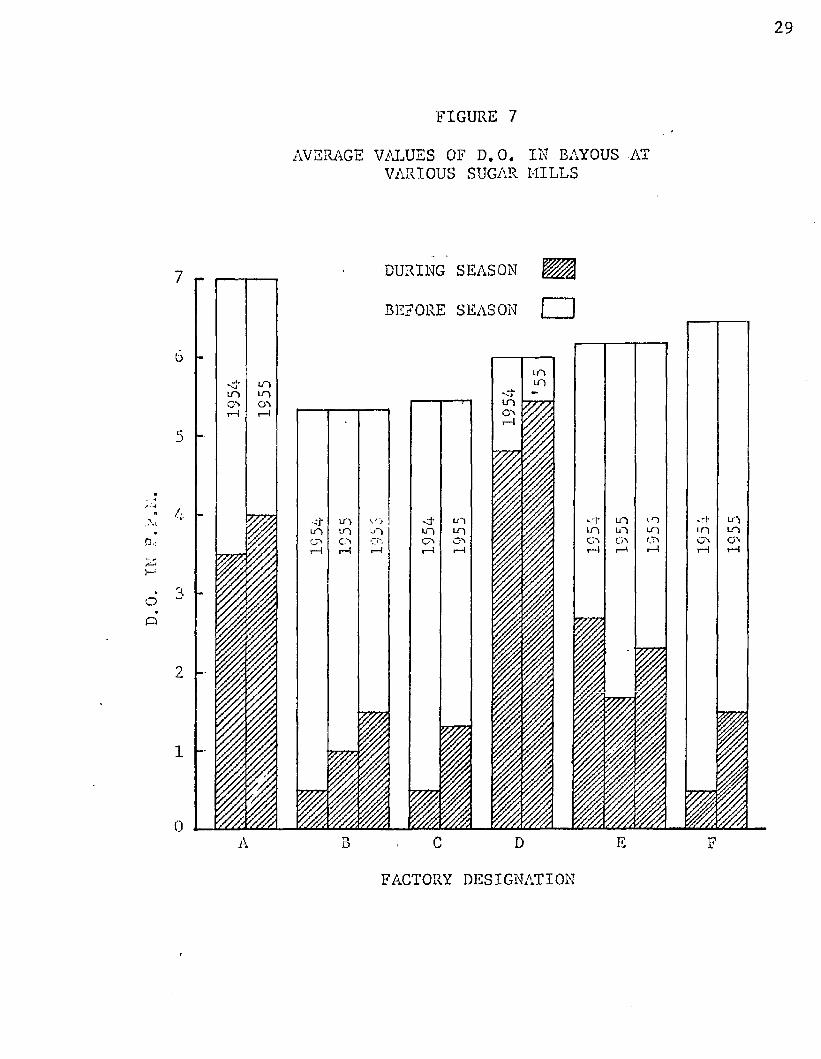
Figure 7 shows the dissolved oxygen in Bayou Teche at
each of the six mills both before and during the grinding
seasons. Note that during the 1954 season four of the six
locations experienced average D.O. concentrations below the
minimum of 2 p.p.m. recommended for aquatic life. There were
fish kills at all four locations.
Figure 8 shows the average temperatures present in the
streams at the locations studied. There was little variation
from factory to factory in the same stream and not much dif
ference between any of the locations. Note that the average
for all factories studied was about 19 degrees Centigrade
which is considered an excellent cooling water temperature by
most industrial plants.
Raw Sugar Factory Effluents
A consideration of the waste disposal problem of a cane
sugar mill quickly brings the realization that there is not
one, but many problems involved. Several distinctly different
types of wastes emanate from each mill and each of these pre
sents a slightly different disposal problem. These wastes
will now be considered separately.
29
FIGURE 7
AVERAGE VALUES OF D.O. IK BAYOUS AT VARIOUS SUGAR MILLS
DURING SEASON7BEFORE SEASON
b
inO-'5
/ '■I-u~ior—|LT>mo>t^\
»•
i
ocB D EA F
FACTORY DESIGNATION
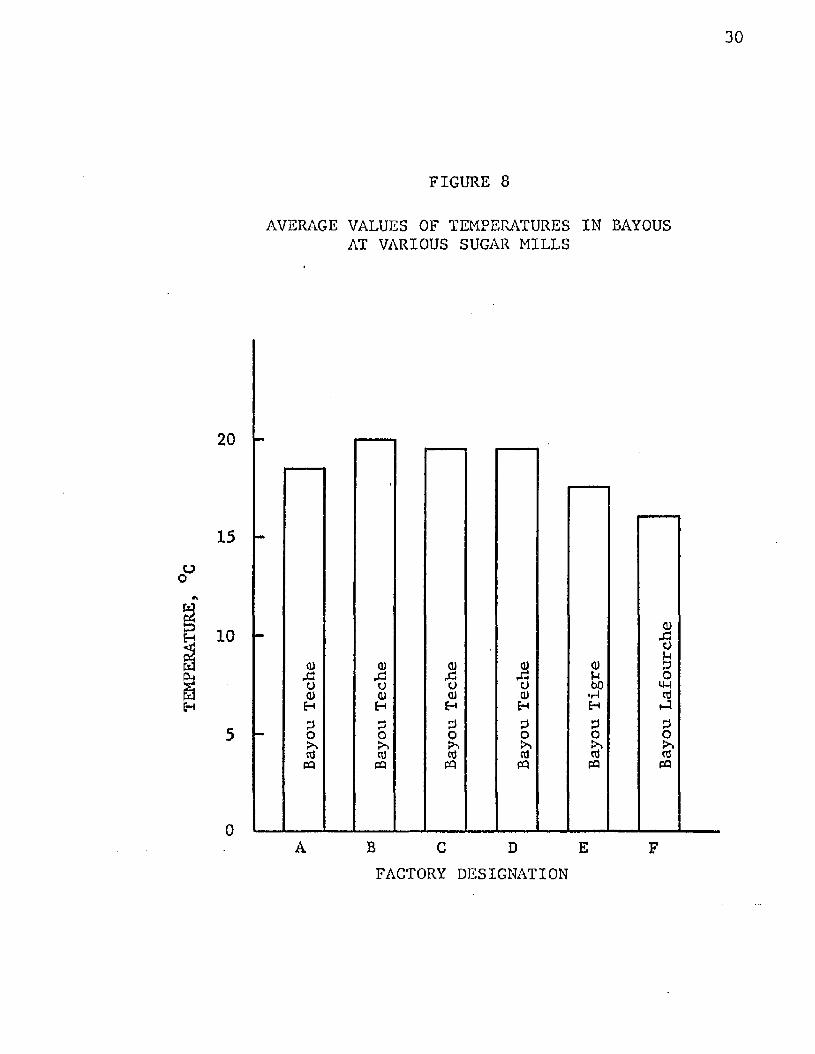
FIGURE 8
AVERAGE VALUES OF TEMPERATURES IN BAYOUS AT VARIOUS SUGAR MILLS
20
15
10 -
PoPHPO!>\P
cl>£ooHPopPQ
P£o<uHPO>,PCQ
opHPOrttPQ
Pb O•r4HPO>•,PM
0B C D EFACTORY DESIGNATION
Bayou
Lafo
urch
e

31
Condenser Cooling Water
By far the major amount of water used in cane sugar manu
facture is that used for cooling the barometric condensers
used in connection with the operation of evaporators and
vacuum pans. Theoretically, there is no reason why we should
not be able to operate vacuum pans and evaporators success
fully without any entrainment of sugar or other contaminating
materials in the condenser discharge. With respect to en
trainment, the main offender is the last effect of the mul-
tiple-effect evaporators employed in every raw cane sugar
factory. Here, because of the low pressure, the vapor
velocities are higher than in the preceding effects and the
entrainment is more critical.
Entrainment is generally due to one of three causes:
(1) working the plant too fast, (2) incorrect operation, and
(3) improperly designed equipment. In Louisiana there has
been a steady increase in grinding rates which has imposed
a heavier loading upon the evaporators and vacuum pans, making
them very susceptible to entrainment. Actually, entrainment
results from the carry-over of small drops of liquid by the
vapors leaving the unit. Vapor bubbles form in the liquor
in the tubes and as they rise they increase in size and
velocity. When the bubbles reach the surface they burst and

32
shoot droplets into the vapor space above at velocities of up
to 25 feet per second in the low-pressure last effect. If
the boiling rate is excessive the mixture of liquid and vapor
will shoot out of the tube bundle with sufficient speed to
carry large droplets directly into the vapor outlet. In
addition, many of these droplets will be atomized and en
trained in the rapidly moving vapors. Many of the droplets
entrained in the vapor by the bursting bubbles will be so
small as to form a mist that is not susceptible to the action
of gravity or centrifugal force to any large degree. This
form of entrainment is not efficiently removed by the usual
baffle-type separators found in most sugar factories. The
tendency toward entrainment increases with a decrease in
pressure from the first to the last effect. In the last
body the resistance to upward movement is less because of
lower vapor density, therefore the small droplets are pro
jected to a greater height.
The most common operational errors are incorrect liquid
level and variations in vacuum within the evaporating unit.
Many operators believe that the tube bundle should be com
pletely covered with liquid to provide maximum contact with
the heat transfer surfaces. However, experience indicates
that the most efficient use is obtained when the liquid
height is about 1/3 of the tube bundle length. Under these
conditions a regular convection flow will exist. If the
level is raised there will be turbulent upheavals resulting
in increased entrainment.
The vacuum in a unit may be subject to variations from
two causes. If several units are connected to a single con
denser changes in one unit will cause the pressure in the
others to vary. Similarly, if a single pump supplies water
to several condensers, variations in flow through one con
denser will affect the others. Since the pressure determines
the boiling point in the vessels, any variations of it will
result in alternate periods of no boiling followed by intense
flashing. During the flashing period the contents of the
unit may froth up into the separators. In such a case the
separators are ineffective.
Improperly designed units generally are of two classes;
those having improper liquid inlet distributors or those
having an irregular heat distribution. A flashing effect
takes place when a liquid flows at its boiling point from
one vessel into another which is at a lower pressure. This
is the result of the lowered boiling point which causes the
excess heat content of the inflowing liquid to be lost by
vaporization. The volume of vapor given off in each effect

34
by flashing increases with the vacuum. In the last effect
the vapor volume is about 700 times as great as that of the
same weight of liquid. This large change in volume explains
the turbulence that the flashing produces. Since the flash
ing occurs as the liquid enters the unit its effect can be
minimized by proper feed distribution. Improper distribution
of heating steam and inadequate venting of non-condensibles
from the steam section of the heating bundles will result in
irregular boiling. This will result In points of high tur
bulence within the evaporator causing considerable splashing
and spray.
Every operator is attempting to get the most from his
equipment. Frequently mills grind twice the amount of cane
for which their equipment was originally designed. For this
reason it is of prime importance to every mill in the state
to have proper entrainment removal devices and to give them
the maintenance they need. The only way in which entrainment
can be eliminated is by the installation in the evaporator or
vacuum pan of adequate, and properly designed, separators or
"catch-alls'1. These are available in numerous designs from
various fabricators who specialize in this type of equipment.
In most factories, in addition to eliminating a large portion
of the pollution problem, the installation of such a separator
35
will normally result in increased yields of sugar sufficient
to pay for its installation cost in one or two grinding
seasons.
At the start of this research program persons having
supervisory responsibility for the participating mills were
interviewed. None of the eight mills in the original spon
soring group would acknowledge having any entrainment diffi
culty at that time. During the first season of the program
it was found that six of the eight mills were having heavy
sugar losses through entrainment. The source of this trouble
was traced in each case to the last effect of the multiple-
effect evaporators. The B.O.D. of the combined condenser
cooling water effluent for evaporators and vacuum pans varied
from 50 to 400 parts per million. Flows were in the order
of from 2,000 to 6,000 gallons per minute.
Based on the market price of sugar at that time and the
fact that sugar has a B.O.D. of 1,250,000 parts per million
it was calculated that the entrainment was costing the mills
anywhere from $100 to $2,500 per day. These estimates, sub
sequently confirmed by low yields on the part of the mills,
resulted in a notable increase in cooperation and interest
from the mill owners. Examination of the entrainment separators
in the factories showed that every mill having trouble was in

36
such a position because of inadequate or mal-functioning en
trainment removal equipment.
There were three principal shortcomings, one or more of
which was found to be the cause of the equipment failure:
1. Separator return lines were too small to prevent caking and clogging by syrup returning to the unit.
2. Short-circuiting of separator due to lower pressure drop through the liquid return lines than through the separator proper.
3. Interior baffles corroded away due to improper maintenance.
Where catchall return lines are too small, syrup grad
ually cakes inside and a slug of sugar combined with bits of
rust eventually seals up the passage. With the drain lines
plugged the level of syrup which is deposited in the catch
all gradually rises until it reaches the barometric condenser.
Once this happens a steady flow of sugar from the unit into
the cooling water outlet results.
Many of the return lines were designed in such a manner
that the pressure drop through them is less than that through
the separator itself. Because of this the vapor flows out
through the return line and prevents separated syrup from re
turning to the body of the evaporator. Having no place to
go, the liquid floods the separator and passes out through
the vapor line into the cooling water and subsequently into

the bayou itself.
Once the faulty separator installations were put in
order, it was found possible to reduce the B.O.D. pick up of
the cooling water from a value which may be as high as 500
parts per million to 5-15 parts per million. About 5 parts
per million of residual B.O.D. pick up is believed due to
non-condensables such as ammonia which come from the cane
juice and are absorbed in the cooling water.
The seriousness of the entrainment problem among the
eight member mills can be pointed up by citing a few of the
figures found during the first (1954) grinding season. These
figures represent the maximum, or worst condition found and
not the average condition. Of the eight mills, three in the
group are of relatively new construction and, in consequence,
their separators are more properly designed possibly than those
in the other five mills. In these three mills the B.O.D. pickup
in the water passing through the condensers was, respectively,
15, 40, and 50 parts per million. On the other hand, among
the five older mills of the group, the B.O.D, pickup of con
denser water varied from 100 to as high as 360 parts per
million with the average being in the order of about 180
parts per million.
Tests were occasionally made of the condenser water by
mill personnel using the Alpha-naphthol test for sugars. It

38
was found in many cases that a sample gave no test and yet
was found to have a B.O.D. of over 100 parts per million.
The Alpha-naphthol test was supposed to indicate concentra
tions of sugar as low as one part per million by weight. It
has been difficult to convince sugar factory personnel that
their time honored test is inadequate. Tests reported by
the Government Sugar Experiment Station, Tainan, Formosa,
indicate that Ammonia, Acetone, Nitrates, Se02 or Ferric
Salts reduce the sensitivity of the Alpha-naphthol test.
A study of the Alpha-naphthol test was made to deter
mine its sensitivity. It was found that fresh, clean
solutions should be used. After a period of about one
month the sensitivity of the reagent was found to diminish.
Various light sources were tried and it was found that a
yellow fluorescent light gave the best conditions for the
test. It took as long as three minutes for the test color
to appear using solutions a month or so old.
Various combinations of sugar solutions, Alpha-naphthol
and acid were used to determine the best ratio for the test.
The amount of acid used was found not to affect the test so
long as an ample amount was present to establish two layers.
With about 15 milliliters of solution being tested 8-12 drops
reagent, and 5-10 milliliters of acid were sufficient to

conduct the test at optimum sensitivity. Generally it was
found that the greatest dependable sensitivity was 10 parts
per million instead of the previously cited value of one part
per million. The procedure for running this test is to be
found in the appendix.
Soda and Acid: Caustic Soda (NaOH) and Hydrochloric Acid
(HCl) are used to keep clean the heat transfer surfaces in
heaters, evaporators and vacuum pans. This is done at inter
vals of 2 to 3 weeks throughout the season. The acid and
soda are generally mixed in an impounding pit where they tend
to neutralize each other. However, there is still a degree
of basic character and therefore they are not released until
the rainy season when there is sufficient dilution to permit
their assimilation into the stream without any ill effects.
In no case was this effluent found to be entering the streams
and so it will not be further considered.
Filter M ud: Filter mud was once pumped into the streams
in the form of a slurry. However, this practice was ruled
out by state authorities when the first sugar factory problem
came under investigation. This material contains 2-4% sugar
which gives it a B.O.D. of at least 2500 parts per million.
In no case was the mud found to be entering a stream. There
were two general methods used for its disposal; pumping it as

40
a slurry into a "mud-pond" where it is allowed to ferment and
dry for several months after the grinding season has ended,
or hauling the moist cake away by truck or cart. In either
case the material ends up being spread over the fields as
fertilizer. Many factories have special tractor carts which
contain a screw conveyor to continuously spread the mud along
the rows as it is driven through a field to be fertilized.
Floor Sweepings: Leakage of juice around the mills,
juice tanks, juice pumps, and similar points can be a serious
source of pollution. Spillage of juice, syrup, molasses,
and sugar on the floors and premises of the factory can also
be a source of pollution when the areas are washed down during
routine cleanup or following rains which dissolve and flush
out this material. Floor sweepings are generally highly
pollutional and their B.O.D. is often in the range of 500-2000
parts per million. Since sugar has a B.O.D. of 1,250,000
parts per million and molasses, 930,000 parts per million,
it takes very little "sweet water" to cause appreciable pol
lution trouble38. A serious problem in most of the older
factories is the lack of definite knowledge as to the loca
tion of floor drains and sewers. There is also the problem
of separation of the contents of some floor drains which
carry contaminated water. All floor sweepings should be, and

41
presently are, impounded in pits prepared for the purpose.
To prevent overloading these facilities, the contaminated
material should be separated from the clean effluent which
may be returned to the bayou.
Cane Wash Water: A pollution difficulty encountered
only by those mills which are troubled by muddy cane is that
of disposing of the effluent resulting from washing cane.
This effluent is fast becoming the number one pollution prob
lem of the Louisiana sugar industry. Roughly half of the
mills in the state now wash their cane, some intermittently,
others, full-time. The effluent from this operation has a
B.O.D. which ranges from about 200 to 800 parts per million
depending upon the relative quantities of cane and water in
volved. Its volume is generally between 800-2000 GPM. Data
obtained during the 1955 season showed that the loading varied
from 1.2 to 5.5 pounds of B.O.D. per ton of cane. The physi
cal characteristics of typical samples of cane wash water are
shown in Table II.
The practice of washing cane evolved in recent years to
combat large amounts of mud which are gathered from the field
along with the cane itself. This is due in part to increased
mechanization in cutting cane and bringing it to the mill.
Much of the mud is received at the mill and weighed with the

42
TABLE II
PHYSICAL CHARACTERISTICS OF CANE WASH WATER
Analysis Iberia St. Marys Sterling
Date 12/10 12/12 12/10 12/12
pH 6.7 7.2 7.3 6.8
Settleable Solids, ml/L 5.0 2.7 10.0 5.0
Total solids, ppm 3,827 2,012 3,138 2,625Volatile, ppm 940 608 740 977Volatile, X 24. 6 30.3 23.6 37.2
Dissolved Solids, ppm 1,013 449 692 1,031Volatile, ppm 712 319 276 726Volatile, °L 70.3 71.1 40.0 70.4
Suspended Solids, ppm (by difference)
2,814 1, 563 2,446 1,594
Volatile, ppm 228 289 464 251Volatile, % 8.12 18.5 19.0 15.7
Non-Settleable, ppm 1,659 773 1,113 1,170Volatile, ppm 740 359 447 725Volatile, % 44.7 46.4 40.1 62.0
Settleable Solids, ppm (by difference)
2,168 1,239 2.025 1,455
% of total 51.7 61.6 64.5 55.7% of suspended 77.2 79.2 82.8 91.4Volatile 200 249 293 252Volatile, X 9.2
CENTRIFUGED CANE WASH WATER
20.1 14.6 15.8
Analysis Iberia, 12/10 St. Marys, 12/10
Total Solids, ppm% of total in effluent X removed
83621.878.2
62820.080.0

TABLE II (Continued)
CANE WASH INFLUENT
Analysis
pH
Total Solids, ppm Volatile, ppm Volatile, %
Dissolved Solids, ppm Volatile, ppm Volatile, %
Suspended Solids, ppm (by difference) Volatile, ppm Volatile, %
Iberia, 12/10
6.5
35117048.5
25717467.8
94
00
Sterling, 12/10
7.1
63036758.3
54933160.4
81
3644.5

44
the cane. Although a sample of each load of cane is taken,
and a deduction in the gross weight made to compensate for
the trash found, the sampling procedure is such that the de
duction is inadequate. For this reason, it is to the farmers'
advantage to haul mud with the cane up to the point of the
mills refusing to accept it. The increasing amounts of mud
being brought in with the cane forces more and more mill
operators to wash in order to stay in business. This ten
dency is shown by Gilmore18 who states that half of the mills
in the state of Louisiana wash cane. Many of those which do
not wash regularly set up temporary washing apparatus such
as a fire hose during times when the cane is muddy.
The savings resulting from cane washing come from in
creased sugar yield and from better operation that results
throughout the plant. The entire chain of benefits is based
on one factor, mud removal. It has been found that washing
cane will reduce the amount of filter press mud as much as
100 pounds per ton of cane ground. The average mill in
Louisiana ground approximately 2000 tons of cane per day in
1958 and the mud from this operation averaged about 47, sugars.
Based on removing the mud before it enters the mill and thereby
removing cane sucrose in the mills which might be lost in mud,
washing saves roughly $480 per day of operation. By washing,

45
the average mill can decrease its loss by about $0.24 per ton
of cane ground.
Decreased sugar loss in filter mud is only one of the
ways in which cane washing benefits. When the cane is muddy,
the mud tends to polish the mill rollers, causing them to
slip excessively. In a short time they become worn smooth
and will not pull the cane through the opening between them.
Instead they tend to slip against the cane, closing the pas
sage for it, and thereby causing a "Choke". When this happens
the mill must be stopped, the pressure on the rollers re
leased, and the "Choke" cleared by hand. The time lost in
removing "Chokes" is a loss to the factory, which is generally
trying to operate at maximum throughput, both to economize on
labor and operating cost and to get the crop in before a
freeze occurs.
In addition, the mud removed by washing is kept out of
the mill, thereby permitting more cane to be ground in its
place. When rainy conditions are prevalent and the fields
are muddy, increases in grinding rate of up to 35% have been
obtained simply by washing the cane. This is attained with
no additional equipment or labor and constitutes roughly an
additional $6000 worth of product per day produced by increas
ing throughput (for the average mill).

46
In addition to a reduction in filter mud, decreased
equipment wear, and increased grinding rate, the absence of
mud in the bagasse produced by a mill is of value. Whether
it results from better operation of furnaces burning bagasse,
higher quality of chicken litter made from it, or better
suitability for its use in making paper or wallboard, the
better quality of bagasse produced from washed cane is a
definite asset.
The average sugar mill surveyed used an average of about
1000 GPM of water for washing cane. The amount absorbed by
the cane is small as compared to the total volume. Hereto
fore, mills other than those located on the Mississippi River
or owning large areas of swamp land which can be used for dis
posal have been faced with the necessity of impounding all
water used, or giving up the idea of washing cane. No
success had been found in treating the effluent or minimizing
its volume by re-cycle. Re-cycle was feared by the mills
because it was thought that organisms would build up in the
circulating water, which, if carried into the mill on the
washed cane, would cause inversion of the sucrose in the raw
juice. The material itself varies from coarse grit to fine
collodial mud.
Thus, the problem was simply to either obtain about 3000

47
acre feet of disposal lagoon or not wash cane. Many factories
were forced to stop operations during rainy periods because
they were unable to dispose of the wash water.
The field survey showed, as its final result, that all
effluents other than cane wash water could be successfully
impounded or eliminated at the source.

CHAPTER V
THE DISPOSAL OF CANE WASH EFFLUENT
The difficulty in obtaining an adequate supply of harvest
labor at a cost which the sugar industry could afford to pay
was the principal factor motivating the development of the
first cane cutting machine. Since no satisfactory method has
been developed to clean cane mechanically as harvested, there
followed the general practice of allowing the cut cane to
remain in the field several days after which time the leaves
and trash could be removed by burning. This procedure is not
effective in rainy weather so that during such periods the
grower must either deliver trashy cane to the mill or cease
delivery until the cane is dry enough to burn. Because of
the limited harvest season and the ever present freeze hazard
deliveries are generally continued, and cane, received by the
mills during wet weather contains anywhere from 10% to 50%
trash. With mechanization there has been an increase in the
quantity of cane trash delivered to the mills and a general
lowering of the quality of all work attendant on the harvest
ing operations16. This has resulted in a higher mud and trash
content on the cane at all times, and particularly when it
rains.
A study of the literature shows no work had been published
48
49
on the disposal of cane wash effluent prior to this project.
There are many works dealing with beet sugar waste treatment.
A good summary of their problem is given by Southgate21 and
covers British, German and American beet factories. Although
the beet process differs greatly from that for making cane
sugar there are certain similar operations. The beets are
washing prior to slicing and the effluent from this step is
somewhat like cane wash water. A survey made in 1933s by the
English pollution control authorities showed this effluent
to be in the range of 3000 gallons per ton of beets, to have
a B.O.D. of about 200 parts per million, and a population
equivalent to about 50. A number of other references to beet
sugar industry pollution are found in the literature. In an
investigation by the Water Pollution Laboratory of England2
it was found that at three factories at which transport water
was being re-used the concentration of suspended solids was
reduced by 92-987. by sedimentation. At other locations the
removal was much less and varied with the location, apparently
depending upon the nature of the soil. After sedimentation
the liquid had an average B.O.D. of 700 to 2000 parts per
million, much higher than for cane wash effluent. The liquid
was far too polluted to be discharged to the British streams.
Biological treatment was not used because it was believed to

50
be too expensive. Generally this material has impounded in
storage lagoons. Note that the water itself is re-cycled
and only the settled sludge remains in the lagoons. No ill
effects upon the sugar recovery are reported.
The general opinion of beet sugar investigators10> 2o,23,29, 3'
is that the wash water should be re-cycled, that chemical
clarification is not economically justified, and that lagoon-
ing is the practical method of disposal. Although bio-treatment
is mentioned as a possibility, the land situation in the beet
sugar areas is not so critical, and it has not been generally
adopted in place of storage lagooning.
In general the work done on beet effluents is not appli
cable to cane sugar effluents because the concentrations in
the beet effluents of B.O.D. are ten fold or more times that
from the cane sugar factories. Also, the effluents from the
process, other than condenser water and wash water, are not
comparable. Although a large number of references concern
ing beet sugar wastes were investigated their usefulness is
not great enough to give them further mention.
Current Practices Survey: It has been mentioned that
the sugar factories of Louisiana were forced to initiate the
practice of washing cane as it enters the mills. Although it
was known that about half of the factories washed cane, no

51
reliable information was available as to the washing instal
lations, periods of operation, quantities of water used, cost
of the operations or benefits the operators felt were being
derived. In order to clarify these points, a questionnaire
was sent out to all mills in Louisiana inquiring what the
various factories were doing.
Thirty-five answers were received to the questionnaire.
Of these mills, 22 washed cane as a routine, 13 did not wash
at all, and 2 of the 13 formerly had washed cane but x^ere
forced to stop because they had no disposal facilities. Other
pertinent facts gleaned from the information received are
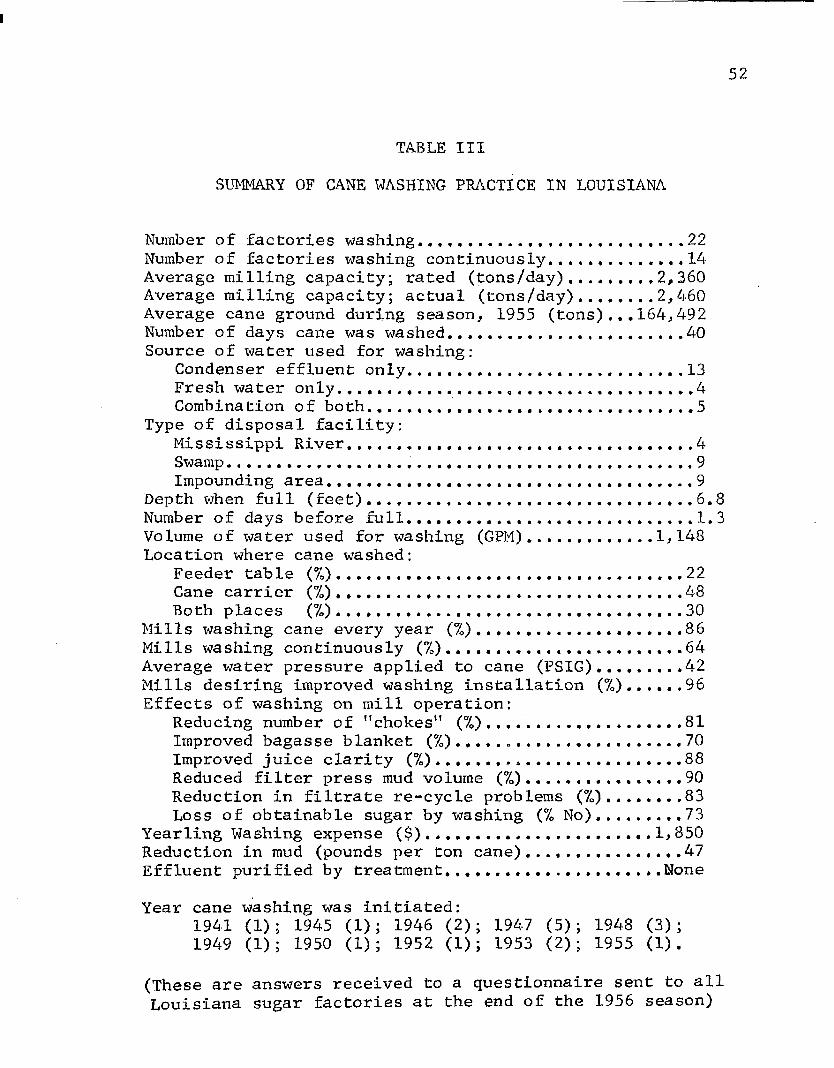
summarized in Table III.
Based on the results shown in Table III, it became evident
that the disposal of cane wash effluent was fast becoming the
primary problem of the sugar industry in Louisiana. As the
other effluents of pollutional nature had been evaluated and
satisfactory ways had been devised to prevent them from being
pollution problems any longer, it was decided to concentrate
on the cane washing operation to make it more efficient to
reduce the volume of effluent to be treated, and to devise
the cheapest workable treatment method.
The chief disadvantage of washing cane for many mills
lies in the difficulty of disposing of the effluent. If the
52
TABLE III
SUMMARY OF CANE WASHING PRACTICE IN LOUISIANA
Number of factories washing........................... ...22Number of factories washing continuously............... 14Average milling capacity; rated (tons/day)..........2,360Average milling capacity; actual (tons/day)........ 2,460Average cane ground during season, 1955 (tons)... 164,492Number of days cane was washed...........................40Source of water used for washing:
Condenser effluent only............................... 13Fresh water only................ .4Combination of both ..........................5
Type of disposal facility:Mississippi River....................................... 4Swamp.................... 9Impounding area........ 9
Depth when full (feet).....................................6.8Number of days before full.............. 1.3Volume of water used for washing (GPM).............. 1,148Location where cane washed:
Feeder table (7.)................................ 22Cane carrier (7)....................................... 48Both places (7°)....................................... 30
Mills washing cane every year (7.)........ 86Mills washing continuously ( % ) ........... 64Average water pressure applied to cane (PSIG)..........42Mills desiring improved washing installation (7>)...... 96Effects of washing on mill operation:
Reducing number of ’'chokes” (7.)...................... 81Improved bagasse blanket (7.)..... 70Improved juice clarity (7o) ..... 88Reduced filter press mud volume (7.)..................90Reduction in filtrate re-cycle problems (%)........83Loss of obtainable sugar by washing (7> No)..........73
Yearling Washing expense ($)..........................1,850Reduction in mud (pounds per ton cane).................47Effluent purified by treatment........ None
Year cane washing was initiated:1941 (1); 1945 (1); 1946 (2); 1947 (5); 1948 (3);1949 (1); 1950 (1); 1952 (1); 1953 (2); 1955 (1).
(These are answers received to a questionnaire sent to all Louisiana sugar factories at the end of the 1956 season)

53
effluent may be economically disposed of without treatment
or impounding costs then washing is a certain profit maker.
If, on the other hand, treatment is necessary the decision
to wash or not to wash rests on an economic balance. Usually,
when not justified by sugar saving alone, washing will be
necessary in order to keep the mill in operation during rainy
seasons.
Cane may be washed in either of two locations: (1) on
the feeder table, or (2) in the cane carrier. Some mills
advocate washing on the table in order to let the maximum
amount of water drain off of the cane before it enters the
knives. Others, as a matter of convenience, wash on the
carrier itself. There is no generally proven best location
for the washing station. Many mills, in fact, wash the cane
twice, once on the apron and again after it falls onto the
carrier. It is felt by many that the bundle is turned*over
and redistributed when falling onto the carrier in such a
manner that a new section of the bundle is exposed to the
sprays.
Cane wash effluent is disposed of in one of three ways:
(1) pumping it into a large river such as the Mississippi,
where it will be quickly diluted; (2) allowing it to flow
onto uninhabited swamp lands where it can decompose without

54
becoming a nuisance or health hazard; or (3) impounding it
in lagoons until biological stabilization has removed all
pollutional material. Once the effluent has purified itself
it may be emptied into a stream.
Unfortunately, only those mills along very large rivers,
such as the Mississippi, can dispose of their effluent by
method (1). In many cases the cost of erecting pumping in
stallations to pump the material over the levee is made
prohibitive because of strict government specifications set
up by the U.S. Corps of Engineers. For this reason many
mills find it more economical to use method (2) even though
they are located next to a river. Method (2) is the cheap
est method of effluent disposal, but the location of some
mills is such that prohibitively long ditches and lines must
be laid to carry away the effluent. Impounding in a lagoon,
(3), is the most expensive method. In addition to piping
and pumps, extensive earth works must be erected. Over a
period of years the pond will fill up with sediment. Heavy
equipment must be employed to remove the silt from the bottom
during the summer time when the pond is not in use. Many
mills are situated in areas where real estate development
in recent years has used up all available land. Several mills
once considered isolated are now in the center of communities.

55
People in these communities frequently are employed in oil
production, supply, or other jobs not related to sugar manu
facture. Consequently, complaints are not suppressed when the
mill causes annoyance to the village from odor, dust or smoke.
In addition to the fact that construction of impounding
lagoons is costly, many mills are unable to buy additional
acreage adjacent to the factory site at any price. Because
of the inability to build new lagoons or enlarge existing
ones it has become necessary to devise ways to reduce effluent
volumes and also to devise ways of utilizing the lagoons in
purifying wastes.
Volume Reduction: Generally, cane washing is carried
out with little concern given to the volume of water used to
wash the cane. Frequently the sprays are operated when no
cane is actually being washed. This causes a needlessly high
volume of effluent.
Most mills have cut down this waste of clean water by
installing quick-closing valves which permit the operator to
stop the flow of spray water when no cane is being washed.
There are three general methods of reducing the volume
of effluent cane wash water. They are (1) continuous re-cycle
of wash water; (2) continuous re-cycle of wash water with
intermediate settling; and (3) multi-stage washing. All of

56
these methods involve some form of re-use of the effluent from
the washing operation.
Total re-cycle involves merely pumping the wash water
back over the cane without any other treatment. It is the
simplest and cheapest procedure, but its short coming is an
excessive build up of solids in the circulating system with
accompanying undue wear on piping and pumps, loss of dirt
removal ability, and possible contamination of the juice
squeezed from the freshly-washed cane. Although the water
could be re-cycled for several hours before bacterial action
became excessive there is a great concern that it might
cause serious trouble within the plant. In the past many
factories not observing strict cleanliness around the mills
have found that growths of certain organisms caused the loss
of sucrose in the raw juice through inversion. Such changes
result in a loss of sugar production. For this reason no
factory was willing to permit experimentation using total re
cycle of their wash water.
Observations made of the once-through washing carried
on by many of the mills indicated that rb-cycle, if accom
panied by primary type treatment, might prove practical
provided the system is purged every few hours to prevent
bacterial development. To try out this idea the loan of a

57
6' x 8' "Graverette" pilot plant clarifier from the Graver
Tank and Manufacturing Company was arranged. The unit was
installed at the Sterling factory located in Franklin,
Louisiana. The unit could not be made to operate on cane
wash effluent because of the heavy mud loading obtained from
the wash water. The sludge draw-off would not accomodate
the mud as fast as it was collected. In order to improve this
condition a grit settling tank was installed ahead of the
clarifier. The factory washed cane only when necessary
and the unit could not be operated continuously.
Lime, Alum, and various settling aids were used in an
effort to clarify the wash water. It was found that a strong
dosage with lime only provided as good a treatment as lime
in combination with other chemicals. The high chemical dosage
required (500 ppm lime) made it un-economical for clarifying
the cane wash effluent.
In conjunction with the pilot plant clarifier operation
a large number of jar settling tests were made using various
settling aids. This was done to determine preliminary dosages
to be added to the pilot plant. Samples of wash water were
taken from other nearby factories for evaluation. The results
of these settling tests, will be found in the appendix.
Solids determinations were run on a number of cane wash
58
effluent samples. Table IV contains the solids analysis of
23 sets of samples. In addition to solids, the sugar content
of each sample was estimated using the alpha-naphthol test
as an indicator. At high concentrations it was possible to
obtain direct sugar content readings by concentrating the
material under vacuum, making a direct polarization on the
concentrated sample Ttfith a saccharimeter. The solids pick-up,
although subject to considerable variation, tends to average
about one-half per cent. The sugar content of the water is
generally in excess of 200 ppm. There seems to be no rela
tion between added solids pick-up and the solids content of
the entering water. This makes re-cycle more attractive
because it shows that dirty water should wash about as well
as fresh water under the conditions existing. Evidently the
material tested had a solids content well below the limiting
value where the water could take up no more.
Cane Wash Water Re-Cycle: Multi-stage washing consists
of spraying fresh water on the cane as it enters the factory.
The effluent from this operation serves as make up water for
a preceding set of sprays which spray the dirty cane at a lo
cation further down the conveyor from the factory. The
effluent from this outer set of sprays is discarded from the
washing system in an amount equal to the influent to the fresh

TABLE IV
CANE WASH WATER SOLIDS DATA, 1955
Date Solids, 7o Centrifugal Sugar .(ppm) _ _ .
Supply, % Wash, 77 Pickup, 70 Solids, °L Supply WashSterling Sugars, Inc.
Nov. 29 0.6238 S 56 183Dec. 2 0.9637 S 220 356
8 0.7036 S 63 17117 0.0351 T 0.7831 T 0.7480 20 AN 200 AN18 0.0182 T 0.4210 T 0.4038 50 AN 200 AN19 0.0388 T 0.5838 T 0.5450 100 AN 200 AN20 0.0291 T 0.7398 T 0.7107 0.5 50 AN 200 AN21 0.0207 T 0.6207 T 0.6000 0.3 15 AN 200 AN22 0.0359 T 0.5846 T 0.5487 1.35 20 AN 200 AN
St. Mary Co-operativeDec. 9 0.7326 S 56 167
12 1.0360 S 78 54813 0.0291 T 0.8437 T 0.8146 46 24817 0.0027 T 0.3273 T 0.3246 none 150 AN18 0.0027 T 0.1253 T 0.1226 20 AN 200 AN19 0.0287 T 0.5329 T 0.5042 20 AN 200 AN20 0.0035 T 0.2581 T 0.2546 0.4 50 AN 200 AN21 0.0113 T 0.5324 T 0.5211 0.4 15 AN 200 AN
(Continued on next page)
LnO

TABLE IV
(Continued)
Date Solids, % Centrifugal Sugar (ppm)Supply, 7Ia Wash, % Pickup, % Solids, %, Supply Wash
Dec. 7Iberia
0.2020 SSugar Co-operative
0.75 set. 76 35613 0.0329 T 0.9370 T 0.9041 193 30617 0.0047 T 0.8317 T 0.8270 20 AN 200 AN18 0.0412 T 0.9342 T 0.8930 50 AN 200 AN19 0.0367 T 2.0797 T 2.0430 200 AN 1.04% DP20 0.0401 T 0.3890 T 0.3489 0.6 100 AN 200 AN
S = Suspended Solids AN = Sugar estimated by Alpha Naphthol
T = Total Solids set. = Solids settled out in 45 minutes
Centrifugal = Solids centrifuged out in 5 seconds at 240 g's
o

61
water sprays. In this manner the cane is washed first by
used water to remove most of the dirt and trash and is then
given a clean rinse before it enters the factory. This repre
sents a stepwise approach to the ideal concept of counter-
current operation.
Prior to the 1957 season, Caldwell Sugars Co-operative,
Inc. installed such a system. About 800 GPM of fresh water
was sprayed over the cane at a location a short distance ahead
of the revolving cane knives. A second set of sprays cir
culated water at a rate of about 2000 GPM over the cane
entering the wash rack. This installation is shown diagram-
matically in Figure 9.
A number of samples were taken from various locations
in the system and analyzed for solids, B.O.D. and O.C. The
average values obtained from these analyses are shown on the
diagram in Figure 9. A total of 2800 GPM of water was applied
to the cane and yet the effluent volume was only 800 GPM.
No ill effects were observed in the operation of the sugar
factory. Another advantage obtained is the more concentrated
effluent. Since the rate of bio-stabilization is a function
of the concentration of putrescible material in solution, the
overall rate of treatment is aided by having a concentrated
feed material, thereby providing more economical treatment of

62
FIGURE 9
DIAGRAM OF MULTI-STAGE CANE WASH INSTALLATIONAT
CALDWELL SUGAR COOPERATIVE
Fresh Water800 GPM
Re-cycle: 1600 GPM
//|\\
CANE CARRIER
jrm rrm,
SUMP
To Disposal 800 GPM

63
the wash effluent.
Physical Treatment: The pre-disposal treatment of cane
wash water is of two types, physical and chemical. By physical
methods, such as screening, settling or filtering, it is pos
sible to remove a high fraction of the total ultimate B.O.D.
This is necessary not only to remove any solids which tend to
fill up later treatment facilities, but because, if not re
moved, the cellulose or woody material in the cane wash water
slowly decomposes with accompanying liquification, thereby
re-polluting the waters. A layer of this material deposited
on the bottom of an impounding lagoon will exert a continual
B.O.D. as it slowly decomposes over a period of many months
and thereby prevent the water from reaching a low enough B.O.D.
concentration to be released to a public stream. It was shown
in Table II that approximately 60% of the total solids content
of cane wash effluent could be removed by settling. Therefore
physical treatment is a necessity for economic and efficient
effluent treatment.
Simple Settling: Settling is necessary as a first step
in any treatment. This operation serves to remove grit and
sand from the water prior to any treatment or re-use. Ex
perience has shown that the material that can be removed from
cane wash effluent by settling will be eliminated quite

64
rapidly. The solid material not removed by settling is
generally of a colloidal nature and requires some form of
chemical treatment to permit its removal. Chemical clarifi
cation does not appear to be economic under present volume-
benefit-cost conditions.
Screening: Another treatment required regardless of
the future use of the wash water is screening. Generally
the effluent is passed through a screen having 1/4 inch
openings to remove the large amounts of woody material which
is washed from the cane. This is done to prevent clogging
of pumps, valves, and pipes. Also, if it is not removed,
the woody material will deposit on the bottom of any treat
ment or storage pond and slowly decompose to exert a continuous
pollutional effect upon any water contained therein.
Treatment, Chemical: Chemical methods of waste treat
ment consist of chemical clarification, chemical oxidation,
and biological oxidation.
Clarification: Clarification is often confused with the
operation of simple settling. The difference lies in the
chemical floe utilized in a clarifier to filter and absorb
material contained in the liquid passing through. Colloidal
materials may be removed by clarification whereas they cannot
be removed by simple settling. From the work done at the

65
Sterling factory, it was discovered that the coarse material
contained in cane wash effluent could be readily settled but
it was exceedingly difficult to effect clarification of the
liquid. It was found that various settling aids gave no
greater benefit than the use of lime alone. The cost of the
amount of lime needed for clarification rendered the opera
tion un-economical.
Chemical Oxidation: Chemical treatment has been reported
involving the use of chlorine and ozone in the treatment of
factory effluent from beet mills. It was found that the cost
of constructing an ozone plant of adequate size to handle the
average cane mill effluent was over $250,000 and that the cost
of producing the amount of ozone needed to treat cane wash
water alone was about $1300 per day. These figures were ob
tained from representatives of a leading ozone concern. It
was rather disappointing to find out that the cost of the
ozone units were as great as the value of some of the sugar
mills.
The use of chlorine was discussed previously. Its use
is un-economical even from the ideal concept of using it to
chemically oxidize the organic material in the effluent.
Experience with chlorinated waters has shown that certain
organic chlorine compounds may be formed which impart a very
66
medicinal taste to the water, rendering it non-potable. The
high chloride concentration resulting could be injurious to
aquatic life in the receiving streams.
Bio-Oxidation: The only method remaining that might have
use in treating the wash effluent is that of bio-stabilization.
This is "nature's own method" for disposing of organic wastes
and basically involves allowing micro-organisms to act upon
the waste before it is discharged and thereby confining the
pollutional effects to a small, controlled area. Cost con
siderations and the slim profit margin found in cane sugar
manufacture dictate that only the minimum treatment is to be
considered. Generally proven processes as activated sludge
and trickling filters are out of reach economically. There
fore, the treatment of these materials must be done using
only earthen pits and ponds, a few pumps and possibly a spray
for aeration.
At the start of the program it was evident that the
existing treatment and/or impounding ponds were woefully
inadequate. The pond depths ranged from six to fifteen feet,
much too great for aerobic decomposition. Solids were not
removed from the wash water before it was impounded. These
solids deposited on the bottom in a thick layer of decom
posing sludge, its solid material slowly dissolving through

67
anaerobic decomposition to replenish the B.O.D. of the water
above. No effort was made to supply aeration nor to provide
the proper nutrients for biological stabilization to occur at
its optimum rate. Since there is a steady replenishment of
the dissolved pollutional material, the effluent will but
slowly reach a quality such that will permit its release to
a receiving body of water without bad effect. Figure 10 il
lustrates this point. It is a plot of B.O.D. against time
as observed in the Iberia impounding lagoon where solids have
been allowed to enter with the cane wash effluent. Ordinarily
a steeper line would result. However, the continued release
of pollutional material from the solids deposited on the
bottom serves to maintain the B.O.D. at a high level. No
fresh effluent was being added during the period covered by
this data. The action in the pond is anaerobic because of
the inability of oxygen to diffuse through the surface rapidly
enough to satisfy the B.O.D.
Because of the previously stated operational and economic
limitations it is believed that the treatment of the sugar
mill effluents must be made in such ponds and at a minimum
outlay for equipment and operation. To do this it is neces
sary to study the factors affecting optimum biological
stabilization to minimize the size of installation needed,
allow rapid disposal, and eliminate odors.

CONC
ENTR
ATIO
N IN
P.P.
M
FIGURE 10
IBERIA IMPOUNDING POND
12/30/57 to 2/3/581,000
600
400
300
‘ 200
100< u, '— O-
■■BT
60
40
20LEGEND:
B.O.D O.C.
10100 20 30 40
TIME IN DAYS
CHAPTER VI
BIO-STABILIZATION STUDIES
The Need for a New Process
The cheapest method of treatment for cane wash effluent
is the use of a properly designed, properly operated oxida
tion pond. A trickling filter or activated sludge treatment
plant has a fixed investment cost of at least $150,000. This
high cost combined with the need for experienced operating
personnel, prices it out of the seasonal, low profit raw cane
sugar industry in Louisiana.
Often mills must wash cane in order to operate. To get
the crop in they must be able to dispose of the effluent in
some type of pond. The available ponding areas are very limited
and by order of the Stream Control Commission a factory must
not discharge more than 1.5 pounds of B.O.D. per ton of cane31ground . - This leads to the conclusion: the mills need to
develop a cheap process for treating their cane wash effluent
by oxidation ponding. Otherwise, they may go out of business
and with them the livelihood of thousands of the inhabitants
of South Louisiana.
Functions of Micro-organisms in Treatment
The key to this waste treatment problem is a study of
the factors affecting the functioning of the organisms which

70
perform the so-called bio-stabilization. There is a wide
range of types of micro-organisms., some having a high rate
of metabolic activity. The common types are: unicellular
yeasts, protozoa, fungi and bacteria. Bacteria have the
highest rates of metabolism among micro-organisms and there
fore are of great importance in waste treatment.
Different bacteria utilize different methods of attack
on the same particle of waste. This gives rise to the varied
products of bacterial activity and to the apparently involved
and complicated metabolism of the order as a whole.
When an organism encounters a material which it can
utilize as food it begins to grow in size until eventually
division takes place with the formation of two cells from
one. The rate at which division takes place depends to a
large extent upon the nature of the medium. An organism
such as the common Escherichia Coli (found in human intestines)
living in a rich medium can divide once every 10 to 15 minutes.
One single organism can give rise to over one million progeny
in five hours. This high rate of synthesis takes place at
the expense of the environment which must supply all of the
raw materials. The material used as food may not always be
present in readily useable form so the organism must break
down the compounds present to forms that may be assimilated.

71
The synthesis of the chemical complex of the bacterial cell
involves the expenditure of energy. This is obtained by the
degradation of energy-rich substances in the environment.
The end products of this degradation are carbon dioxide and
water. If insufficient dissolved oxygen is provided the
reaction is much slower, and fermentation is an intermediate
step. Although the end products will eventually be the same
as for aerobic oxidation, volatile acids, methane, and hydrogen
sulfide will be formed, creating an odor nuisance.
Bacteria have a wide distribution in nature. The only
places free from them are those where a sterilizing influence
is at work. It is not necessary to search for the types
needed to act upon the sugar mill effluents. They are already
present around the factory, in the ponds, and on the cane
shipped to the mills.
Mechanism of Biological Stabilization
There are three types of reactions associated with these
biologically active slimes and sludges. These are oxidation,
cell synthesis, and respiration.
Straight oxidation provides the necessary energy for life
processes. This can be conveniently represented by the equation7 :
CxHyOz + (x + l/4y - l/2z) O 2 -* XCO 2 + l/2y H 2 O + heat

72
Additional cells are synthesized, according to an'
equation of this general form:
n(CxHyOz) + nNH3 + n(x + l/4y - l/2z - 5) 0 a -»
(C5HTN02)n + n(x-5) C02 + l/2n(y-4) H 20 ^ heat
Microbial sludge produced undergoes continuous auto
oxidation (endogenous respiration) like this:
(C5HTNOa)n + 5n02 -* 5nC02 + 2nHa0 + nNH3 + heat
The empirical formula for cellular material (C5H7N02)
is representative of the ratios of the primary constituents
found in biological sludge14.
Biological floe is a collection of micro-organisms, such
as bacteria, yeasts, molds, algae, protozoa, rotifiers, worms
and insect larvae, in a gelatinous matrix.
Stages of Biological Growth
In the presence of oxidizable organic matter, bacterial
growth undergoes several stages. First is a "lag" or induction
period. This phase is omitted where there is a continuous
flow of material into a growth that has been previously formed.
Another early phase is the storage period during which
B.O.D. is removed from solution but not immediately metabo
lized. As time goes on and the soluble B.O.D. in the waste

73
is removed by the bacterial growth the micro-organisms consume
the stored material for metabolism and growth.
The next phase is the "log growth phase" and is the
period during which regular and maximum multiplication of
cells is taking place. Growth occurs by the division of one
cell into two cells. Its rate is limited by the concentra
tion of food present at any particular time. With ample food
the growth is logarithmic, because at any given time the rate
of growth is a function of the number of cells present.
Next is a deceleration phase in which division of cells
occurs at slower intervals. It has been shown9 that the rate
of cell growth below the maximum rate is dependent upon the
B.O.D. concentration and hence the rate of utilization or
stabilization is a function of B.O.D. concentration. There
fore a mean rate constant, representative of the over-all
process during this phase, may be related to the food supply
or B.O.D. This is the basis of the first order reaction
velocity relations common to biological decomposition.
In the final stage there is little B.O.D. removal from
the solution. The biological growth is decomposing at a rate
greater than synthesis. Endogeneous respiration is said to
be taking place.
In most industrial operations the material is kept in a

74
growth phase in order to effect maximum B.O.D. removal. The
excess growth is settled out and discarded and the rest is
used to seed the incoming effluent. This is the basic opera
tion carried out in the so-called activated sludge operation.
For this work it is necessary to effect a similar action with
only the help of earthen settling basins.
Preliminary Treatment Studies
In order to develop a cheap workable process for treat
ing the cane wash effluent it was necessary to study the
bacterial decomposition of this material to find ways to
optimize the action taking place. There are a number of
factors which limit the biological stabilization rate. The
most important of these are aeration, temperature, nutrient
addition, prior solids removal and the B.O.D. concentration
in the feed. Laboratory studies were undertaken in order to
evaluate these effects upon the stabilization of cane wash
effluent.
The first of these studies was made using an open beaker
filled with a mixture of cane juice and cane wash water. The
initial mixture had an O.C. of 410 ppm. There was no tempera
ture control and no aeration other than that received by
surface absorption from the air. The temperature ranged from

75
27° to 32°C. A small amount of "seed” consisting of some old
cane wash water was added to provide the micro-organisms
found around cane sugar factories. The results of the 160
hour run are shown graphically on Figure 11, a chronological
plot of the logarithm of the fraction of O.C. remaining at
the time each analysis was made. When expressed this way
the slope of the first order reaction is proportional to the
reaction rate constant at a given time.
There were three rather distinct steps. The first was
the incubation period lasting about 30 hours. During this
time the bacteria were becoming "acclimated" to the feed
material and those best suited to metabolize it formed their
colonies and superceded others. The second step is that
during which the maximum metabolism took place. During this
time the action was first order and showed a rate constant
of ,46 hours 1. After about 30 hours the O.C. had dropped
to 100 ppm and the rate constant assumed a value of .08. This
remained constant for the rest of the run.
This initial study, although not very precise, showed
that two steps existed, each having its own rate constant.
It was felt that further study was warranted to find ways to
keep the operation at its maximum rate by evaluating those
factors affecting the rate and thereby optimize the treatment

[O.C.
REMA
ININ
G L0
G10
[o.C.
INIT
IALL
Y
FIGURE 11
FIRST STABILIZATION TEST
LOG1q OF FRACTION OF ORIGINAL O.CVS.
1.00 TIME IN HOURS
Period of Endogeneous Respiration ofInductionPeriod Biological Growths
Period of■Maximum Activity
(Biological Grox^th)
600 20 40 80 100 120 140 160TIME IN HOURS
77
process*
A second trial was made using nine reactors. Feed ma
terial was similar to the first. Four of the reactors were
adjusted daily to a pH of 5, 6* 7, or 8, respectively* using
ammonia. Four others were adjusted to corresponding pH's
using lime. The remaining sample received no additives and
served as a blank. All nine were placed in open beakers.
The results of this series are shown in Table V. No
clear-cut conclusions as to the optimum pH of nutrient can
be made from this run because other conditions* mainly tem
perature* were not controlled.
Supply of Raw Material
During the spring of the year when the sugar mills were
closed a series of trials was undertaken to obtain kinetic
data on the stabilization of actual sugar mill effluent. In
order to have a ready supply of raw material arrangements were
made with the Audubon Sugar Factory to place a number of five
gallon cans of effluent in frozen storage. About 125 gallons
of cane wash effluent from the various factories was frozen
and kept at -20°F until needed. Since the studies were aimed
at dissolved B.O.D. removal the effluent was filtered through
coarse filters to remove settleable solids just prior to use.

TABLE V
EFFLUENT STABILIZATION STUDY - EFFECT OF pH ON STABILIZATION RATESYNTHETIC EFFLUENT
Hours o
13.5
36.5
oi—1 •L n
85.5
109.5
142.5
167
186
234.5
258.5
282.51
332 AveragepH
N-8pH 6.6 6.8 4.3 7.1 7.6 7.7 7.7 7.9 7.8 7.7 7.8 8.0 7.25O.C. 410 . 376 345 75 68 64 35 26BOD 369 375N-7PH 6.6 6.5 4.2 6.7 7.3 7.3 7.3 7.5 7.5 7.7 7.7 7.8 7.03O.C. 410 378 313 120 110 33 31 15BOD 369 345N-6pH 6.6 5.7 4.3 5.1 6.6 6.8 6.8 7.1 7.3 7.3 7.4 7.5 6.54O.C. 410 378 400 60 68 42 27 14BOD 369 479N-5pH 6.6 6.0 4.6 4.3 5.8 6.4 6.0 6.1 5.9 7.0 7.1 0.0 5.98O.C. 410 378 405 55 51 42 31 0.0BOD 369 345BlankPH 6.6 0.0 4.5 4.3 4.2 4.4 4.1 4.3 4.3 4.4 4.4 4.6 4.55O.C. 410 378 390 220 81 44 36BOD 369 544
(Continued on next page)

TABLE V (Continued)
t-1 t-1 to to roh-1 W O N C O O ^ ' l—‘ I—1 (jO Ui 00
H o u rs o to c r i i - ‘ U i 0 3 t o ( ^ c o 4 > c x > t o• - o o ^ * » *Un Ul Ui Ln Ui Ln L n L n ( _ n
C>8pH 6.6 6.3 4.9 5.3 6.8 8.6 8.0 7.8 8.0 7.6 7.9 8.2 7.17O.C. 410 371 427 68 56 29 17B O D 369________________________ 547____________________________________________________________C-7pH 6.6 6.1 4.8 5.3 6.4 7.3 7.2 7.2 7.3 7.5 7.5 7.7 6.74O.C. 410 371 405 105 59 37 135 23B O D 369________________________ 564____________________________________________________________C-6pH 6.6 5.8 4.5 4.9 5.5 6.6 6.8 6.9 6.9 7.2 7.4 7.7 6.40O.C. 410 378 393 135 81 69 21 55B O D 369________________________ 544____________________________________________________________C-5pH 6.6 6.1 4.5 4.6 4.6 5.3 5.1 6.7 . 7.0 7.1 7.3 7.7 6.05O.C. 410 373 400 60 81 40 2 126BOD 369 524 _____
N = Samples whose pH was adjusted to ind. pH value with NH40H C = Samples whose pH was adjusted to ind. pH value with Ca(0H)2
Average
•-JMD

80
Seeding: Small amounts of liquid from the previous run
were added to supplement the population of natural micro
organisms by "seeding". Although this was not strictly neces
sary it was a precautionary measure insuring the presence of
the micro-organisms acclimated to this type of material and
thereby shortening the "lag" period during which the necessary
growths form.
Flow Reactors: It was decided, as a result of the two
preliminary trials, that a flow type reactor might be a better
approach to the problem. Once equilibrium was reached only
one set of analyses would be required to evaluate the opera
tion at any given set of operating conditions.
Initially, it was hoped to operate several of the flow
reactors in series and thereby simulate the actual holdups
found at certain plants. In this manner the optimum pond
holdup or "space velocity" would be determined. The first
reactor consisted of three 4000 ml. glass beakers connected
by inverted U-tubes. Feed was supplied from an elevated 5-gallon
glass jar by means of a syphon. This jar was packed in ice
to prevent decomposition of the feed. The rate of feed addi
tion was adjusted by means of a stopcock. The level in each
reactor could be set by adjusting its height relative to the
draw-off and thereby change its holdup volume. The temperature

81
of the reactors was controlled by a thermostat connected to
a room air-conditioner. Several trials were made to "bracket"
the range of flows and B.O.D. involved. Unfortunately it was
not possible to maintain a constant flow because of plugging
of the stopcock by sediment or slimes. This set-up was dis
mantled in favor of an improved type of pilot plant shown in
Figure 12.
In this arrangement an adjustable rate pipetting machine
was used as a low flow rate, precision pump. The reactors
were immersed in a + 0.01°F "Sargent" constant temperature
water bath. The draw-off arrangement was similar to that
used in the first unit. Cooling was supplied to the bath
by water circulating through coils attached to the freezing
compartment of a household refrigerator. Feed was stored in
a glass jug packed in ice contained in a large "picnic cooler".
Several "dry runs" were made using domestic water to
check the temperature and flow regulation. This was satis
factory and so cane wash effluent was charged to the unit.
A total of three sets of runs were made. Table VI shows
data obtained from run #2 of the three. Note that in this
arrangement the effluent from one reactor was fed to the fol
lowing one. This had the advantage of allowing determinations
at three concentrations to be made at one time. Space velocity

FIGURE 12
SCHEMATIC DIAGRAM OF FLOW REACTORS SHOWING THERMOSTATIC WATER BATH, REFRIGERATION,
AND ADJUSTABLE RATE FEED PUMP
FEED
ICE BATH ADJUSTABLE FLOW PUMP (PIPETTING MACHINE)
ADJUSTABLEDRAW-OFF
WATER BATH WITH ±0.01 °C
THERMOSTAT CONTROL AND STIRRER

83
TABLE VI
EFFLUENT STABILIZATION PILOT PLANT
Data: Run No. 2
Reactor Volumes: 1500 cc. each
TotalHours
Temperature°C
Flow Rate gms./min.
O.C. * PPmFeed Reactors
1 •2 3
0 24.0 2.0 70 60 60 60
77 24.0 2.0 66 51 60
120 22.3 1.9 87 75 80
144 22.1 2.1 85 75 69 64
168 26.1 2.1 77 68 59 61
264 23.5 1.9 73 55 48 46
288 24.0 2.1 74 54 51 48
Rate constants based on above data:
Ki 0.35 hr 1
I<2 0.02 hr-1
K3 0.02 hr"1

84
could be adjusted by the depth setting for each reactor.
The arrangement proved to be un-workable for several
reasons: it was difficult to maintain continuous flow due
to plugging of the tubing and the formation of gas bubbles
in the feed line which "vapor locked" the reciprocating
check-valve type pump. The refrigerator proved itself in
capable of maintaining the temperature at the set point as
is evidenced on the data sheet. Finally the refrigerator
burned out and it was therefore decided to abandon this setup
in favor of one more dependable and more easily controlled.
Non-flow Reactors
Because of the difficulties with the constant flow feed
ing arrangement it was decided to give up the flow reactors
and go back to batch studies. This method was admittedly just
as good but required the taking of a great number of samples
to adequately determine the stabilization curve needed to cal
culate a reaction velocity constant.
In order to supply adequate cooling, the apparatus was
relocated to a point next to a 3-ton water cooling unit used
for student laboratory experiments. This unit supplied more
than enough cold water to maintain the desired temperature
in the water bath.
Three batch reactors were immersed in the constant

85
temperature bath. One was sealed, another was open to the
atmosphere, and the third was aerated by compressed air sup
plied below the surface through a porous diffusing stone.
Three sets of runs were made. Two of these were negated
when the coolant valve drifted shut during the night and the
thermostat stuck at the same time, thereby pasteurizing the
bacteria. The data from this run are tabulated in Table VII.
Note that the aerobic reaction showed a much faster action
than either the anaerobic or the open one. Note also that
the B.O.D. of the sealed reactor was only slightly reduced
at the end of the run whereas the other two had B.O.D, values
of about 10% of the original feed. The feed for all of these
runs consisted of filtered cane wash water which was collected
during the grinding season and kept frozen at -30°F until
needed. Although the O.C. of the sealed material dropped
340 ppm, the B.O.D, dropped only 29 ppm. Because of this
it was decided to run both types of analyses (B.O.D. and O.C.)
on the succeeding runs.
The thermostatic bath which had proven un-reliable after
seven attempted runs was discarded. In its place a B.O.D.
incubator having a + 0.1°C thermostatic controller was ob
tained for use as a constant-temperature housing for the
reactors. Filtered compressed air piped into the incubator

TABLE VII
EARLY PILOT PLANT RUN NO. 3
Feed: Frozen Cane Wash Water, Filtered
TotalHours Date Starting I
OpenII
AeratedIII
Sealedi ime B.O.D O.C. B.O.D. O.C. B.O.D O.C.
0 Nov. 22 11 AM 509 470 509 470 509 47028 23 3 PM 542 542 54275 25 2 PM 334 431 38957 24 8 PM 425 525 490
825 25 9:30 PM 332 396 34895 26 10 AM 371 310 334
100 26 3 PM 277 279 320109 26 12 PM 197 191 301178 29 9 PM 231 172 249200 30 7 PM 235 237 256243 Dec. 2 2 PM 176 191 146 168 155 207263 3 10 AM 138 191 168 243 165 220292 4 3 PM 115 142 172311 5 10 AM 122 112 143413 9 4 PM 94 111 164435 10 2 PM 91 69 133469 Jan. 6 2 PM 75 38494 13 3 PM 50 95 55 86 480 130
COO'

87
for aeration purposes was supplied to the reactors through
individual diffuser stones. A diagram of the apparatus is
shown in Figure 13.
Because of the previous difficulties with temperature
control it was decided to conduct a "shake-down" run. In
order to evaluate the temperature control, a "Foxboro" tem
perature recorder of the gas filled bulb type was set up.
The temperature sensing bulb was immersed in one of the re
actors and the recorder proper was placed outside of the
incubator.
Fifteen two-quart Mason jars were utilized as reactors.
Nitrogen was added in the form of ammonia to different re
actors in four concentrations. In addition, samples were
run to which no nitrogen was added. For each nitrogen con
centration one reactor was sealed, one open to the atmosphere,
and one aerated.
The results of the first run are shown in Table VIII.
The temperature recorder drew a smooth concentric circle,
indicating that the controller was performing properly. At
the end of about 150 hours the reaction had progressed ex
tensively. The aerated samples which had been fortified with
various amounts of nitrogen showed the greatest removal of
O.C. The use of reactors that were merely open to the air

88
FIGURE 13
DIAGRAM OF CONSTANT-TEMPERATURE MULTIPLE REACTOR APPARATUS
COMPRESSED AIR SUPPLY
COOLING COILS -7
TEMPERATURE CONTROL
AIRCLEANER
REMOTE \ TEMPERATURE RECORDER--
THERMOMETER
REACTION VESSELS
FLOW TO INDIVIDUAL REACTORS ADJUSTED WITH PINCH CLAMPS

TABLE VIII
O.C. IN REACTORS CONTAINING VARIOUS AMOUNTS OF AMMONIA, RUN NO. 1
Filtered Cane Wash Water
NitrogenAddedPP_m
Typeof
OperationT 0 T A L H O U R S
24 48 77 125 148 172 220 315 340 360 388
None Open 380 275 318 104 79 39 51 46 59 49 92None Aerated 291 352 288 358 110 109 80 84 93 94None Sealed 295 ■ 292 200 99 100 57 61 62 41 62
33 Open 279 207 134 135 85 68 44 68 71 6633 Aerated 245 254 100 73 33 23 14 66 31 7833 Sealed 272 220 212 125 132 78 46 72 71 75
17 Open 228 195 126 129 71 81 38 84 70 6817 Aerated 245 247 76 16 15 78 15 66 60 6717 Sealed 245 208 118 99 105 125 40 80 74 65
12 Open 203 202 144 92 65 45 47 72 78 6912 Aerated 213 248 90 25 17 79 28 82 55 7712 Sealed 194 210 158 109 155 107 29 76 54 64
10 Open 192 210 160 83 77 92 52 85 92 7610 Aerated 229 285 116 58 29 93 14 52 60 6610 Sealed 182 207 171 96 79 99 32 66' 72 72
03M3

90
was discontinued and efforts were concentrated on strict
aerobic and anaerobic operation.
The in-between method of an open beaker was discarded
as being too arbitrary with regard to the type of action
present. Since a beaker only a few inches deep cannot ade
quately simulate the true conditions in a pond several feet
deep, the exposed surface merely introduces another unknown
factor with regard to the D.O. distribution therein.
A second run was made using cane wash water from the
frozen storage supply which, as in run No. 1, was first
passed through a filter to remove the coarse solids which
might tend to decompose during the run and thereby give false
results. This filtering was comparable to the preliminary
screening and settling necessary for plant treatment of cane
wash effluent regardless of the subsequent process. Ten re
actors were used. Five were aerated and the rest were sealed
to insure anaerobic conditions. This was another "shake-down"
run to test the apparatus and no B.O.D. tests were made.
The results of run No, 2 of this series are shown graph
ically in Figure 14 which is a plot of O.C. vs time for each
of the reactors. The initial mixture had an O.C. of 260 ppm
and an ammonia nitrogen content of about 2 ppm as determined
by a "Taylor Comparator". Nitrogen was added in the form of

OXYGEN
CONS
UMED
, P.
P.K
91
FIGURE 14
OXYGEN CONSUMED VERSUS TIME FOR
FILTERED CANE WASH EFFLUENT AT 20 °C
300
250
200
150
100
50
0
AEROBICOXIDATION
ANAEROBICOXIDATION
00:110:130:1
NUMBERS DESIGNATE INITIAL RATIOS OF O.C. TO AMMONIA NITROGEN.
0 50 100 150 200 250 300
TIME IN HOURS

ammonia to give nitrogen to O.C. ratios of 0:1, 1:10, 1:20,
1:30, and 1:40 for corresponding anaerobic and aerobic re
actors. The temperature was held constant at 20°C. Material
from run No. 1 was used as seed.
Aerobic vs Anaerobic Treatment
A look at Figure 14 which shows a family of curves, one
for each reactor, illustrates two points of vital importance
to this study. The first is that the anaerobic curves tend
to be tightly grouped together and are at a higher level than
those for the aerobic reactors. The nutrient addition does
not show any appreciable effect on the rate of anaerobic re
action. The second is that the aerobic curves are widely
spaced, showing a greater amount of stabilization for the re
actors having the greatest nitrogen additions.
Nutrient Addition
This run illustrated the importance of proper nutrient
addition to optimum biological stabilization of cane wash
water. Consequently it was decided to evaluate the effects
of adding the key nutrients, nitrogen and phosphorous on the
rate of treatment.
Run No. 3 of the series used as feed filtered cane wash
water that had been obtained during the previous season. Seed

93
was not added from the previous run, resulting in a rather
long "lag” period. The numerical results are shown in Table
IX. In the anaerobic reactors there was no B.O.D. reduction
for a period of about 200 hours during which the O.C. steadily
dropped. At about the time when the B.O.D. had begun to
stabilize the O.C. ceased to drop and remained level for the
remaining 100 hours in the run. However, in the aerobic re
actors both B.O.D. and O.C. dropped off at about the same
rate throughout the run. The explanation for this behavior
is that under anaerobic conditions the material undergoes
certain molecular rearrangements without any lessening in
the quantity of organic food potential as expressed by the
B.O.D. This is often referred to as the "volatile acids
formation" by sewage technologists. It was only after this
stage that the B.O.D, began to drop.
With the exception of slight differences of nutrient
addition, run No. 4 was similar to run No. 3 and was very
carefully carried out to insure accurate results. For the
anaerobic reactors there was a very slow rate of stabiliza
tion and no similarity between the O.C. and B.O.D. curves.
The results of run No. 4 are shown in Table X. Figure 15
shows O.C. and B.O.D. plots for anaerobic and aerobic re
actors each of which had a B.O.D./Nitrogen ratio of 10:1 in
the initial feed. Although the O.C. curves for both reactors

TABLE IX
O.C. AND B.O.D. IN REACTORS CONTAINING VARIOUS AMOUNTS OF AMMONIA AND PHOSPHOROUS(RUN NO. 3)
Filtered Cane Wash EffluentT = 20 °C
NitrogenAdded T O T A L H O U R S
. J2P_m . . 18 40 47 75 114 139 162 210 259 279 306Anaerobic BOD 269 294 242 208 136 1320 OC 619 515 405 322 355 328 310 330
23 BOD 279 272 252 219 128 107OC 532 502 513 584 473 404 398 324 275 271 291
16 BOD 282 279 264 224 120 121OC 432 426 497 619 530 414 365 332 280 261 295
13 BOD 288 279 244 216 122 159OC 522 472 517 625 556 388 324 341 304 276 294
13*BOD 262 275 244 220 113 126OC 514 408 516 606 550 395 353 342 278 262 297
Aerobic BOD 283 273 180 157 142 620 OC 534 420 528 565 570 499 443 396 368 320 33523 BOD 301 278 187 123 123 116
OC 498 408 514 567 539 470 464 390 340 346 33516 BOD 274 286 180 133 126 118
OC 521 438 519 435 511 488 427 387 351 340 31213 BOD 309 277 165 143 106 100
OC 534 380 530 576 576 418 358 347 319 314 31013*
BOD 303 318 176 131 125 116OC 524 391 520 532 543 454 380 368 327 301 302
* Includes 6 ppm phosphorous.

TABLE X
O.C. AND B.O.D. IN REACTORS CONTAINING VARIOUS AMOUNTS OF AMMONIA AND PHOSPHOROUS(RUN NO. 4)
Filtered Cane Wash EffluentT = 20 °C
Nitrogen Phosphorous Added Added T 0 T A L H 0 U R Sppm PPm 27 70 104 132 156 228 252 298 324 394 418
Anaerobic BOD 372 367— — OC 613 385 318 - 240 - 252 192 323 230 17110 BOD 372 338
OC 584 355 312 - 279 - 243 196 204 - 1985 BODOC
BOD
363609375
375342303291
226 238 173 - 212 230 222 1883 OC
BOD605377
325 327291
203 188 185 236 220 240 194 1786 OC 610 353 278 212 198 185 - 223 - 229 193
Aerobic BOD 366 150 29- - OC 618 525 345 195 173 137 - 139 117 200 142
10 BOD 368 135 34 23— OC 598 500 312 - 200 - 176 115 142 - 144
c BOD 359 95 38 253 OCBOD
620357
468 33294
203 175 105 162 95 12317
12214
OC 605 505 339 142 130 121 - 102 141 131 13210 BOD 365 98 18 36 OC 605 475 253 179 129 132 138 110 140 158 104

000800
600
400
300
200
100
80
60
40
30
20
10
96
FIGURE 15COMPARISON OF B.O.D. AND O.C. CURVES FOR AEROBIC AND ANAEROBIC REACTORS
v \
__ •e ____
V\\\
------- — — B.O.D.
\\\ V
\\\
o
o
,$
n QO
•
o
•O.C.
O.C.
\\\\
o \VA
\\
\o V
Cl"51 C
--
"B .O .
Legenc • Ana o Aer
:erob lcobic
..... J
T - 2C B.O.D.
L . . J
°C/N=10:1
--- -100 200 300 400 500 600 700
TIME IN HOURS

97
were more or less similar there was a striking contrast be
tween the two B.O.D. curves. The plots are semi-logarithmic,
therefore the slopes are proportional to the reaction rate
constants. This rate of reaction is conveniently expressed
by the reaction half lives which are inversely proportional
to the reaction rate constants. The half life for the aerobic
reactor was 57 hours as compared to 630 hours for the anaerobic
one, a ratio of about 12 to 1. This difference agrees with
the literature on the relative rates of the two processes and
their applications25. Generally, the anaerobic process is
used at B.O.D. concentrations of several thousand and is
usually followed up by aerobic treatment once the B.O.D. is
below about 1000 ppm21.
Because two runs had shown that the aerobic operation
was many fold better than anaerobic it was decided to dis
continue further anaerobic te?ts and concentrate on optimizing
the aerobic stabilization of cane wash effluent from the view
point of nutrient addition and temperature.
Four additional sets of runs were made. Two were replicas
at 20°C and the others were made at 15°C and 24°C. The data
from these runs is shown on Tables XI through XV.
Basis for obtaining rate data: The B.O.D.'s from each
reactor were plotted (on semi-logarithmic paper) against time.

98
TABLE XI
SUMMARY OF REACTION HALF-LIVES FOR AEROBIC REACTORSCONTAINING VARIOUS CONCENTRATIONS OF ADDED NUTRIENTS
Temperature: 20°C (Half-Lives in Hours)
Phosphorous Added , ppm
NitrogenAdded,ppm
Note:
0
19
39
0 4.4 8.824 25 2322 22 2116 16 1514 12 1212 15 1514 12 12
Pairs of numbers are results of replicated runs. Feed material was cane wash effluent having a B.O.D. of 350 ppm.
Source of Variation Sum of Squares
Degrees of Freedom
MeanSquare F
UPPER NUMBERS
Between Rows (N) 172.2 2 86.10 59Between Columns (P) 2.9 2 1.45 1Residual 5.8 4 1.45
LOWER NUMBERS (REPLICATE RUN)
Between Rows (N) 162.0 2 81.0 22.0Between Columns (P) 4.7 2 2.35 6.5Residual 1.3 4 0.36
Standard Deviation between replicates = 2.7. For 2 and 4 degrees of freedom an F of 6.94 is significant at the 5Jo level and one of 18.0 at the 1% level.
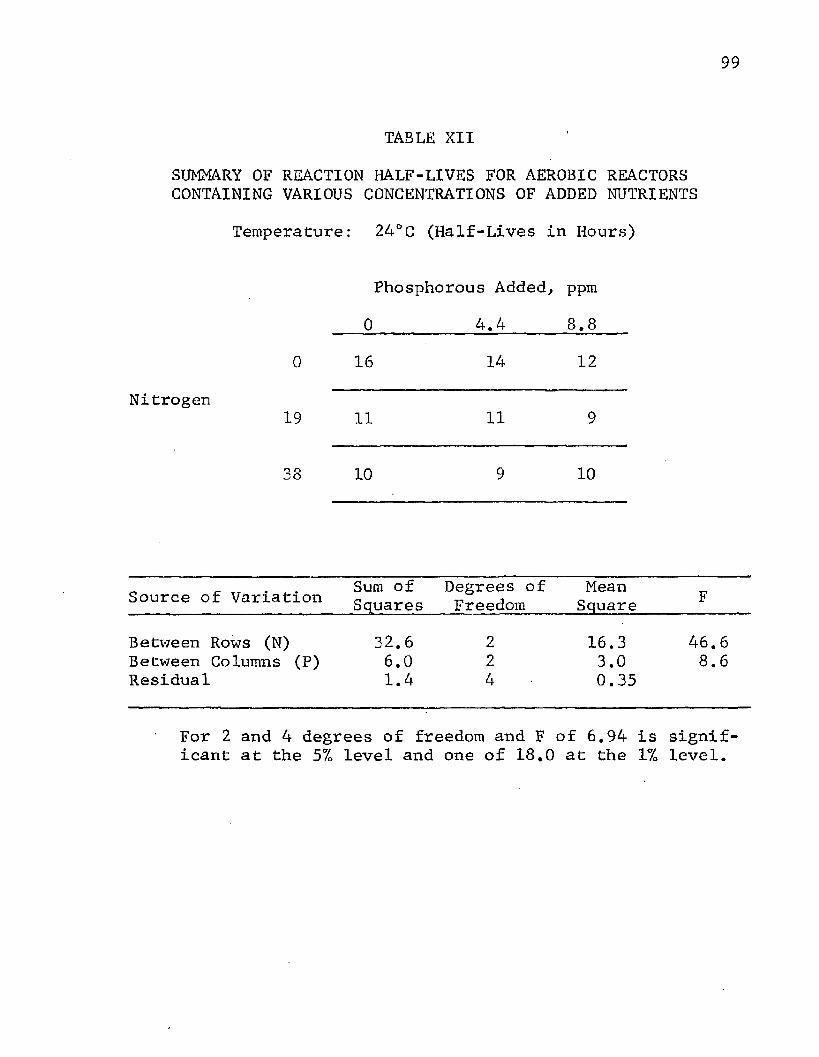
99
TABLE XII
SUMMARY OF REACTION HALF-LIVES FOR AEROBIC REACTORSCONTAINING VARIOUS CONCENTRATIONS OF ADDED NUTRIENTS
Temperature: 24°C (Half-Lives in Hours)
Phosphorous Added, ppm
0 4.4 00•CO
0 16 14 12
Nitrogen19 11 11 9
38 10 9 10
Source of Variation Sum of Squares
Degrees of Freedom
MeanSquare F
Between Rows (N) 32.6 2 16.3 46.6Between Columns (P) 6.0 2 3.0 8.6Residual 1.4 4 0.35
For 2 and 4 degrees of freedom and F of 6.94 is significant at the 57o level and one of 18.0 at the 1% level.

100
TABLE XIII
SUMMARY OF REACTION HALF-LIVES FOR AEROBIC REACTORS CONTAINING VARIOUS CONCENTRATIONS OF ADDED NUTRIENTS
Temperature: 15°C (Half-Lives in Hours)
Phosphorous Added, ppm
0 2.2 4.4
Nitrogen0 34 32 ■
Added,ppm 10 — 26 26
19 21 20

101
TABLE XIV
SUMMARY OF REACTION HALF-LIVES FOR AEROBIC REACTORSCONTAINING VARIOUS CONCENTRATIONS OF ADDED NUTRIENTS
Temperature: 20°C (Half-Lives in Hours)
Using Average Values of 2 Replicated 20°C Runs:
Phosphorous Added, ppm
0 2.2 4.4
0 23 23.5 22
NitrogenAdded, 10 15 14 13.5ppm
19 13 13.5 13.5
Sum of Degrees of Mean Source of Variation Squares Freedom____ Square__________F
Between Rows (N) 166.1 2 83.05 207.6Between Columns (P) 0.9 2 0.45 1.12Residual 1.6 4 0.40

102
TABLE XV
COMPARISON OF THE EFFECTS OF NITROGEN ADDITION AND TEMPERATURE ON REACTION HALF-LIVES FOR AEROBIC
STABILIZATION OF CANE WASH EFFLUENT
Nitrogen Added, ppm*
Temperature°C 0.0 4.4 8.8
15 33.0 27.0 21.0
20 22.8 14.1 13.3
24 14.0 11.0 9.5
Source of Variation Sum of Squares
Degrees of Freedom
MeanSquare F
Between Rows (T) 373.0 2 186.5 36.3Between Columns (N) 117.6 2 58.8 11.5Residual 20.5 4 5.13
For 2 and 4 degrees of freedom an F of 6.94 is signifi- cane at the 5% level and one of 18.0 at the 1 % level.
* Numbers read from smoothed curves shown on graph, therefore are slightly different from those shown on other tables.

103
The best line was drawn through the maximum slope and from
it a half-life for each reactor was obtained.
If c = concentration
t = time
and k = reaction rate constant
then the basis of this method is as follows:
- 4s = kcat
dc ^ (the minus sign indicatesc that the concentration is
decreasing)- In c = kt + c
- [In ca - In cj_] = k (t2 - tx)
k _ In (ci/cg) t2 - tx
Therefore, a semi-log plot of C (B.O.D.) against time will
yeild a straight line having a slope equal to k.
The actual measurements of k from reaction data may be
simplified by using the half-life, i.e., the time required
for the concentration (B.O.D.) to drop in half.
Since In — = +0.693
then k - ±0^93-t-i
This procedure was followed to obtain the half-life values
shown in Tables XI, XII, XIII, XIV, and XV. Note that the
values in Table XI were replicated by making two runs under

104
identical conditions. The feed material for all runs was the
same, consisting of cane wash effluent which had been well
mixed in a large vat, filtered and then frozen at -20°F in
five gallon cans. This procedure assured a uniform feed for
all runs.
Quantitative Evaluation of Kinetic Data
Each run was made using different concentrations of
nitrogen and phosphate nutrients. The nitrogen was supplied
in the form of ammonia and the phosphorous as monobasic
potassium phosphate (KH2P04) .
The statistical data relating to the significance of each
are shown on the tables in which the half-lives are listed.
Effect of Nutrient Addition
An analysis of variance was made on each set of runs to
determine how significant the variables were insofar as their
influence upon the reaction half-lives. It was found that
phosphorous was not significant at the 5 % confidence level.
Nitrogen and temperature were both of significance at better
than the 1% level.
A plot of half-life versus nitrogen addition at the three
temperatures investigated is shown in Figure 16. It can be
seen that the slope of each of the lines drops off rapidly

105
FIGURE 16
EFFECT OF NITROGEN ON REACTION HALF-LIVESOF
CANE WASH EFFLUENT
COPCoo
MhJIEn- JiE3OMHU3PC
35
30
25
20
15
O 2410
5
0 403010
15 °C
20 °C
NITROGEN ADDED'(PPM)
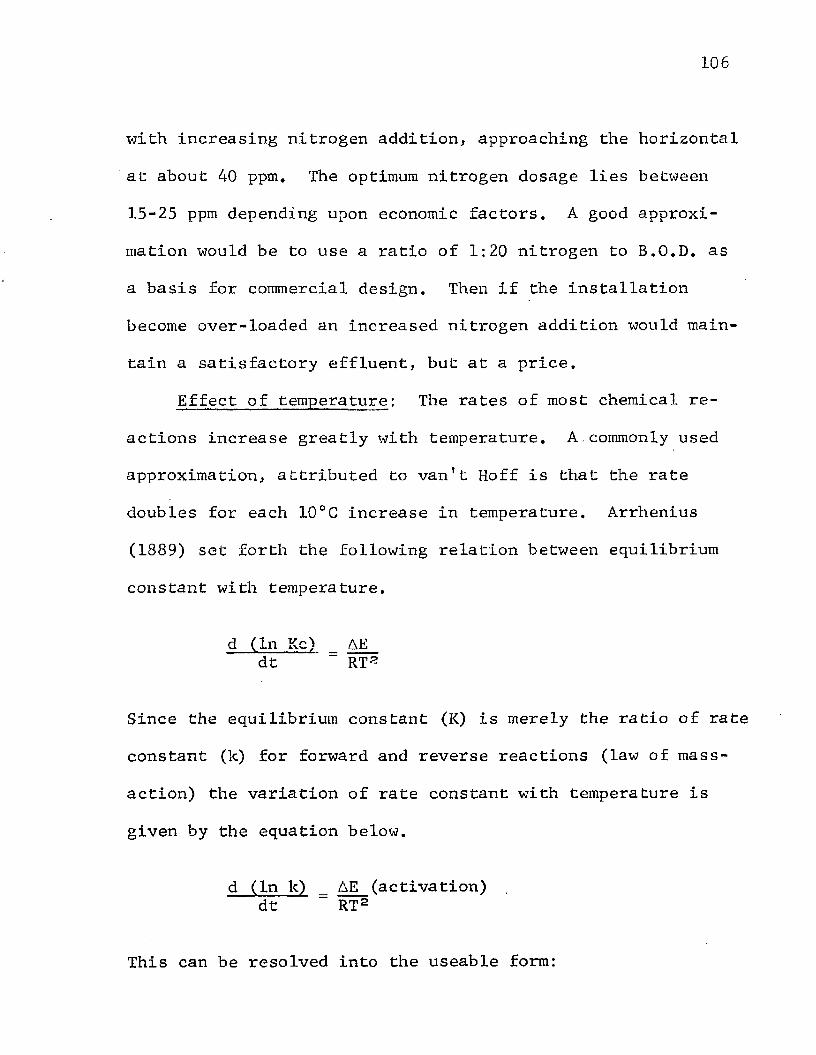
106
with increasing nitrogen addition, approaching the horizontal
at about 40 ppm. The optimum nitrogen dosage lies between
15-25 ppm depending upon economic factors. A good approxi
mation would be to use a ratio of 1:20 nitrogen to B.O.D. as
a basis for commercial design. Then if the installation
become over-loaded an increased nitrogen addition would main
tain a satisfactory effluent, but at a price.
Effect of temperature: The rates of most chemical re
actions increase greatly with temperature. A commonly used
approximation, attributed to van't Hoff is that the rate
doubles for each 10°C increase in temperature. Arrhenius
(1889) set forth the following relation between equilibrium
constant with temperature.
d (In Kc) _ AE dt ~ RT2
Since the equilibrium constant (K) is merely the ratio of rate
constant (k) for forward and reverse reactions (law of mass-
action) the variation of rate constant with temperature is
given by the equation below.
d (In k) _ AE (activation) dt ~ RT2
This can be resolved into the useable form:

107
-L = ec (To“T) = e(To-T) to
t = reaction time
T = temperature
Figure 17 is a semi-logarithmic plot of half-life versus
temperature for the three levels of nitrogen addition. This
plot gives essentially a straight line having a negative
slope. From the slope it is possible to evaluate the term 9 .
For this application it was found that 9 - 1.08, which fit
very nearly to the van't Hoff-Arrhenius rule of thumb that
the rate is halved for each 10°C decrease in temperature13.
For all practical purposes this rule may be applied to the
rate of bio-stabilization of cane wash effluent.

FIGURE 17
EFFECT OF TEMPERATURE ON REACTION HALF-LIVESOF
CANE WASH EFFLUENT
100LEGEND80 0 PPM
19 PPM 38 PPM
60C:,DO
Oh - lH
20
20 2510TEMPERATURE, °C

CHAPTER VII
CONCLUSIONS
From a study of eleven commercial raw sugar factories in
Louisiana it was found that:
1. The water pollution by these factories results from
organic enrichment of the stream.
2. There are six general effluents: (1) condenser cool
ing water, (2) cane wash water, (3) soda and acid, (A) filter
cake, (5) floor sweepings, and (6) bearing cooling water. In
a well operated factory only cane wash water and condenser
cooling water present serious pollution problems.
3. With a properly designed, maintained and operated
factory the condenser cooling water is sufficiently free of
organic pollutional material to enter a public stream. It
should first be passed through a spray pond in order to cool
it and add oxygen so that no damage will be done to the stream
from oxygen depletion by the warm deaerated effluent. This
will aid in self-purification to remove any small amounts of
organic material entrained in the cooling water in the baro
metric condensers.
4. Cane wash water, because of its high B.O.D. and sus
pended solids content, must hot be allowed to enter public
waters. Most of the solids can be removed by simple settling,
109

110
but the dissolved B.O.D. remains high enough to make it in
tolerable to the stream.
5. Most factories do not have, and cannot afford,
facilities to impound all of the cane wash water they need
to use for the period of time required for it to stabilize
naturally. By using two stages of wash water re-cycle during
the cane washing operation it has been found possible to
reduce the volume of effluent to at least one-third of the
original. This reduces the size of treatment facilities
needed and results in a more concentrated effluent which,
for the same total B.O.D., may be treated more rapidly.
6. No ill effects upon factory operation have resulted
because of cane wash water re-cycle. The circulating systems
have remained free of biological groxtfths. If slimes should
build up in the wash water system they could be easily con
trolled by infrequent "shock" chlorination carried out by
dumping chloride of lime (H.T.H.) into the recirculating
water pump.
7. Pilot plant reaction studies have shown that settled
liquid cane wash effluent can be stabilized by aerobic oxida
tion ponds. Anaerobic oxidation requires many times the
aerobic treatment period. At an average water temperature
of 20°C, which is typical of commercial conditions, the

Ill
effluent can be stabilized aerobically at a rate corresponding
to first order reaction half-life of 15 hours when 20 ppm of
nitrogen are added as nutrient,. Greater additions of nitrogen
are not considered economic. Potassium and phosphorous addi
tion did not significantly speed-up the rate of stabilization.
The rate of the stabilization follows the van't Hoff-Arrhenius
relation and consequently is doubled for each 10°C increase
in temperature. The total holdup time for a properly operated
treatment installation should not exceed 70 hours. Based on
the average flow of 1000 GPM of cane wash effluent for all
Louisiana factories surveyed, a pond area of about 4 acres
should be adequate. This amount of land is available to
practically every factory. In addition, the volume of effluent
to be treated can be reduced to one-third by the use of re
cycle washing. This would further reduce the land requirement.
8. The O.C. is not representative of the B.O.D, on an
absolute numerical basis for an isolated single effluent
sample. However, for liquid effluent the difference in B.O.D.
and O.C. of a stream passing through a sugar mill can be re
lated by the equation:
A O.C. = 0.9 A B.O.D.
Where A designates the increase resulting in a given stream
112
passing through the factory.
9. The a-naphthol test for dissolved sugars was found
to have a maximum sensitivity of 10 ppm when fresh solutions
were used laboratory conditions. In several cases factory
a-naphthol tests detected no sugars where there was a B.O.D.
pick-up of as high as 50 ppm. This lack of sensitivity was
traced to the use of old reagent solutions and inadequate
lighting.
10. Based on current conditions the savings resulting
from pollution abatement through increased sugar yields and
better operation permissible in the case of cane washing
will rapidly pay-out the costs incurred for repairs and the
installation of additional equipment. In some of the operat
ing factories studied the savings from less than one week of
improved operation paid these costs.
11. Pollution abatement is a necessity if the Louisiana
Sugar Industry is to continue in our present day society.

BIBLIOGRAPHY
American Public Health Association, Inc., Standard Methods for the Examination of Water, Sewage, and Industrial Wastes, Tenth Edition, New York: 1955.
Brandon, T. W., "Waste Waters From Beet Sugar Factories International Sugar Journal, 49 (1947), Pp. 98.
Coogan, Frank J., and Biglane, K. E., "Program for the Maximum Utilization of Louisiana River Basins for Industrial Development," Second Annua1 Water Symposium on Water Pollution, L.S.U. Engineering Experiment Station, 1953, Pp. 59-77.
Cusachs, Louis, "Industrial Wastes and Their Effect on Sewage-Treatment Plants," Proceedings of the Ninth Annua1 Short Course for Water and Sewage Plant Superintendents and Operators, Baton Rouge: L.S.UEngineering Experiment Station, 1947, Pp. 112-114.
Davies, Owen L., Statistical Methods in Research andProduction, New York: Hafner Publishing Company,1957.
Department of Scientific and Industrial Research, "The Purification of Waste Waters from Beet Sugar Factories," Water Pollution Technical Paper N o . 3 ,
London: H. M. Stationery Office, 1933.
Eckenfelder, W. W. and Moore, T. L., "Oxidation," Chemical Engineering, Sept. 1955.
Ehrmana, L., "Defense of Cane-Sugar Factories in Prosecutions for Water Pollution," Bull. Assoc. Chem. Suer. Indst., 26, Pp. 350-353.
Garrett, T. M. and Sawyer, C. N., Proceedings of the Seventh Industrial Waste Conference, Purdue University: _79, Pp. 51, 1952.

114
10. Gay, Frank E., "Deodorization of Factory Waste Water,1'Report of Hawaiian Sugar Technologists, 8th Annua1 Meeting, 1949, Pp. 79-80.
11. Godchaux, Walter, Jr., "Sugar Refinery Waste Problems,"Proceedings of the Third Annual Symposium on Water Pollution, Baton Rouge: L.S.U. Engineering Experiment Station, Bull. No. 43, Pp. 32-36, 1954.
12. Gutzeit, G., "Characteristics of Beet Sugar FactoryEffluents," Sewage and Industrial Wastes, Vol. 21,
Pp. 91, 1949,
13. Hermann, E. R., "Development of Design Criteria forWaste Stabilization Ponds," U.S. Atomic Energy Commission, 1957,
14. Hoover, S. R., and Porges, N., Sewage and IndustrialWastes, Vol. 24, Pp. 306, Mar. 1952.
15. Imhoff, Karl, and Fair, G. M., Sewage Treatment, JohnWiley and Sons, Inc., New York: 1956.
16. Keller, A. G., and Seip, J. J,, A Study of the Causesof the Declining Sugar Recovery in Louisiana, L.S.U. Engineering Experiment Station, Bull. No. 14,Baton Rouge: 1948,
17. Keller, A. G., "Water Usage and Conservation in theLouisiana Sugar Industry," Proceedings of the Second L.S.U. Engineering Experiment Station, Pp. 54, 1952.
18. Louisiana-Florida Sugar Manual, 1957, Gilmore Pub. Co.,New Orleans: 1958.
19. Louisiana Department of Wild Life and Fisheries,Pollutional Strengths of Cane Sugar Factory Wastes, Baton Rouge: May, 1945.
20. Leclere, E., "Decantation Ponds in Sugar Factories,"Bull. Centre Beige Etude Docum. Eaux, Vol. Ill,Pp. 154-172, 1959.
21. Matschky, J. B., "The Effect of Sugar Factory WasteWaters on Streams," Centr. Zuckerind, Pp. 520-522, 1924.

115
22. Monad, Jaques, Recherches Sur La Crolssance Des CulturesBacteriennes, Hermann and Cie, Paris: 1942.
23. Nolte, E., "Treatment of the Waste Water of a SugarFactory With Chlorine,1' Zeit des Vereins der Deutschen Zucker-Industrie, Vol. 79, Pp. 463-469, July 1929.
24. Oginsky, Evelyn, An Introduction to Bacterial Physiology,W. H. Freeman Co., San Francisco: 1955.
25. Ohio River Valley Sanitation Commission, Planning andMaking Industrial Waste Surveys, Cincinnati 2,Ohio: 1952.
26. O'Neill, J. H., "Stream Pollution in Louisiana,"American Journal of Public Health, Vol. 4,Pp. 343-345, 1914.
27. Pearson, E.A., and Sawyer, C. N., "Beet Sugar ProcessWaters," Chemical Engineering Progress, Vol. 46,Pp. 380-388, 1950.
28. Phelps, Earle B., Stream Sanitation, John Wiley andSons, Inc.ji New York: 1944.
29. Phipps, 0. H.j "Effluent Treatment In the Beet SugarIndustry," Chemistry and Industry, Pp. 1242-1247, 1955.
30. Proceedings of Meeting of Louisiana Stream ControlCommissioh, Baton Rouge: April 30, 1956.
31. Proceedings of Meeting of Louisiana Stream ControlCommission, Baton Rouge: June 6, 1955.
32. Report of the Governor of Puerto Rico, 1916,
33. Rudolfs, William, Editor, Industrial Wastes, ReinholdPublishing Company, New York: 1953.
34. Skalsk, K., "Effectiveness of Biological Purificationof (Beet) Sugar Wastes and the Installation Costs," Gaz. Cukr., Vol. 59, Pp. 181-184, 1957.

116
35. Smith, J. M., Chemical Engineering Kinetics, McGraw-Hill, New York: 1956.
36. Southgate, B. A . , Treatment and Disposal of IndustrialWaste Waters, His Majesty's Stationery Office, London: 1948.
37. Spencer, G. L., and Meade, G. P., Cane Sugar Handbook,Eighth Edition, New York: John Wiley and Sons,Inc., Pp. 7, 1948,
38. Stone, Ralph, "Sugar Cane Process Wastes," Sewage andIndustrial Wastes, Vol. 23, No. 8, Pp. 1025-1028, Aug. 1951.
39. "Sugar Mill Wastes Reclaimed, Rich Soil is By-Product,"Engineering News, Vol. 36, Pp. 146, Mar. 1, 1951.
40. Volk, William, "Industrial Statistics," ChemicalEngineering, Mar. 1956.

A P P E N D I X

APPENDIX I
NOMENCLATURE
B.O.D. — Biochemical Oxygen Demand
c - A constant
D.O. - Dissolved Oxygen
E - Internal energy
GPM - Gallons per minute
K - Equilibrium constant
k - Reaction rate constant
ml - Milliliters
O.C. - Oxygen Consumed from Permanganate
ppm - Parts per million
R - Universal gas constant
T - Temperature
t - Time
9 A constant
118

APPENDIX II
EXPLANATION OF TERMS AND ANALYTICAL TESTS
Dissolved Oxygen (P.O.): Adequate dissolved oxygen is
necessary for the life of fish and other aquatic organisms.
Its concentration also indicates corrosivity of water, photo
synthetic activity, septicity, etc. This test indicates the
condition of the water at the time the sample was obtained.
It is primarily a field method for determining the amount of
oxygen available for the decomposition process if taken above
the point of discharge and the residual oxygen during the
active biological decomposition if taken below the point of
discharge. Since the amount of oxygen that can be dissolved
in water varies with temperature, the temperature of the
sample should be taken.
The dissolved oxygen test is performed by a modification
of the "Winkler" method. From the level of the dissolved
oxygen only it indicates whether the supply of oxygen is
greater than the demand of biological decomposition of the
waste in the stream, and does not measure the total oxygen
demand of the effluent. If the dissolved oxygen content does
not drop below four parts per million by weight there is
little danger to aquatic life, providing the waste contains3*no poisonous material. Coogan and Biglane state that a D.O.

120
of at least 5 parts per million (ppm) should be maintained
in a stream.
The procedures used in performing this and other tests
used in this project are described in detail in "Standard
Methods for the Examination of Water, Sewage, and Industrial
Wastes"1.
Biochemical Oxygen Demand (B.O.D.): In the study of
organic pollution it is important to know how much total
oxygen will be required to completely stabilize the waste.
This information is provided by a determination known as
the Biochemical Oxygen Demand, or, more commonly, B.O.D.
test. The B.O.D. represents the oxygen used by the material
in the course of its complete biochemical stabilization. It
is not always related to the oxygen requirement for complete
chemical combustion, but is a function of the usability of
the material as a bacterial food, and the amount of oxygen
used by the bacteria during the bio-oxidation.
Complete stabilization requires more than 100 days at
20°C used in the test, but such long periods of incubation
are impracticable in most cases. Consequently, a 5 day
period is used. The test consists of determining the dis
solved oxygen of samples of a given effluent before and after
the incubation period. In the case of highly polluted

121
effluents, dilution of the waste is made to prevent complete
removal of the oxygen from the incubated samples. The loss
of oxygen is the biochemical oxygen demand and is expressed
in parts per million by weight. All B.O.D. determinations in
this program are the standard 5 day, 20°C B.O.D.
Oxygen Consumed (O.C.): Oxygen consumed from permanga
nate is that amount of oxygen removed from potassium per
manganate by a water sample when it is digested for 30
minutes in a boiling water bath with a definite strength of
permanganate and dilute sulfuric acid. The carbon, not the
nitrogen, in organic matter is oxidized by potassium per
manganate, Because of this the O.C. is sometimes erroneously
considered as indicating the amount of carbonaceous matter
present. However, the determination indicates only a part
of the carbon. This is because the carbon in nitrogenous
material is not readily oxidized as is carbon in carbonaceous
organic matter. It also does not differentiate directly the. icarbon present in useable form from that in stable organic
compounds.
The usefulness of this test lies in that it can be made
with relatively crude equipment by semi-skilled personnel.
It will be shown later that the O.C. gives a good indication
of the B.O.D. for most sugar factory effluents and is closely
122
related when differences due to added organic material are
being evaluated. For a known type of sugar factory effluent
the O.C. has proven satisfactory to evaluate B.O.D. added
using the correlation developed during the research program.
The O.C. is particularly useful for routine monitoring of
cooling water streams because it can be run by the factory
laboratory on a round-the-clock basis. The pollutional
material that enters the stream is principally a mixture of
sugars, a type of material having a B.O.D. and O.C, which
show a close relationship.
At best, the O.C. is a field approximation of the B.O.D.
for it is the B.O.D. which is the true index of the pollu
tional quality of an organic waste.

APPENDIX III
SUITABILITY OF THE O.C. TEST AS A MEASURE OF B.O.D.
It was briefly mentioned in a previous section that the
Oxygen Consumed From Permanganate and the Biochemical Oxygen\
Demand, although roughly equivalent for readily oxidizable
material, did not have the same numerical values in all cases.
This is because the O.C. does not differentiate between stable
and unstable organic material. The carbon in nitrogen-containing
material is not so readily oxidized as is the carbon in car
bonaceous organic material. The O.C. test suffers from the
disadvantage that it is sensitive to many inorganic compounds
which reduce permanganate but are inert biochemically.
The O.C. test can be run rather quickly in the field by
semi-skilled workers and with a minimum of equipment. The
B.O.D., on the other hand, requires a constant temperature
incubator, numerous specially made bottles, aerated dilution
water fortified with proper nutrients and require 5 days for
completion. It was advantageous to the project to have the
mill personnel run only the O.C. and attempt to correlate
this with the B.O.D. In order to do this a large number of
tests were duplicated. That is, both an O.C. and a B.O.D.
were run on each of numerous effluent samples.
The relationship between B.O.D. and O.C. is shown in
123

124
Figure 18. It was found, as might be expected from the pre
vious discussions of the tests, that there was no absolute
relation between B.O.D. and O.C. on straight effluent samples.
However, due to the fact that the pollutional matter from
sugar mills is of readily oxidizable nature, both chemically
and biologically, a fairly good relation was obtained between
the differences shown by a stream entering and then leaving a
factory. In other words, although the material entering the
factory did not have a B.O.D, and O.C. that were anywhere
similar, the material added to it had values of the two that
were nearly identical. Because of this, the differences
found leaving minus entering were nearly the same.
It must be remembered that the tests are run on diluted
samples and the numerical results are therefore very sensi
tive to errors in the titration step involved in each.
According to "Standard Methods"1, the O.C. has a standard
deviation of 0.08 ml for sugars. Both of these tests were
run on the basis of a maximum of 10 ml requirement for the
undiluted effluent. Therefore, the expected precision should
be about 0.15 multiplied by the ratio of diluted to undiluted
sample in the actual test. Generally, this should be about
jl 3 per cent of the value since dilutions are usually made to
give a mid-range reading on the burette. In addition to
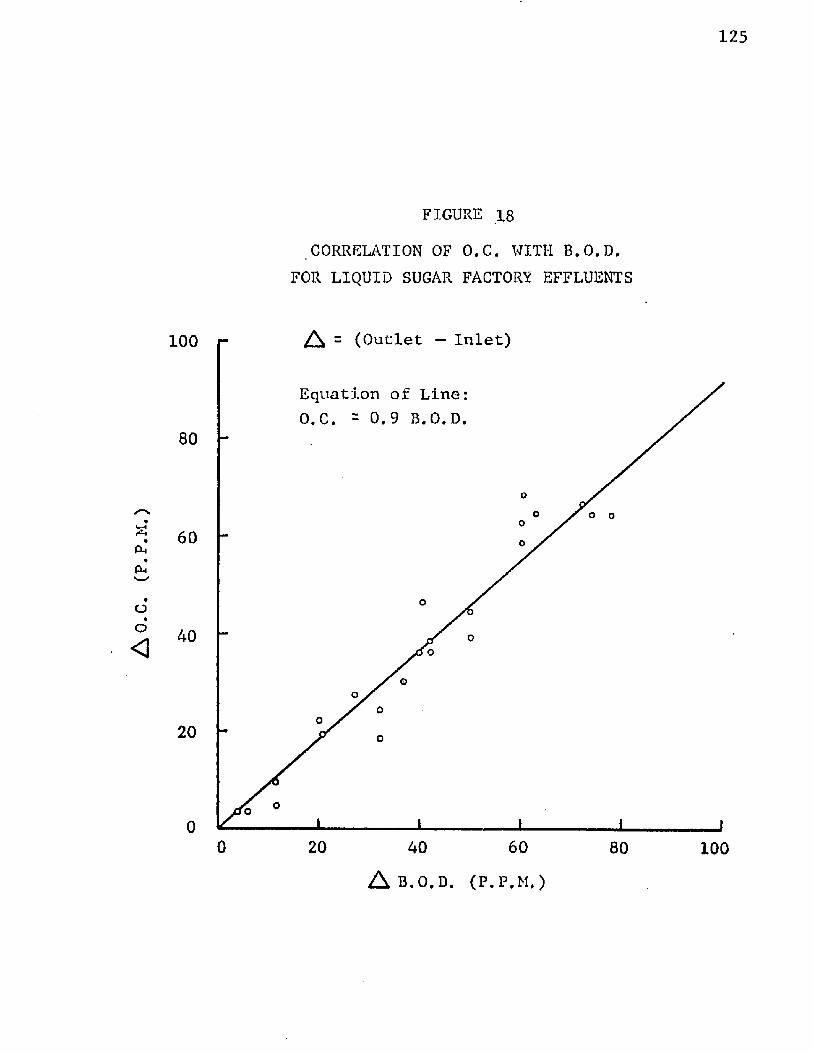
A O.C.
(P. P
.M.)
125
FIGURE 18
CORRELATION OF O.C. WITH B.O.D. FOR LIQUID SUGAR FACTORY EFFLUENTS
A = (Outlet — Inlet)100
Equation of Line:
80
60
40
20
00 20 6040 80 100
A B.O.D. (P.P.M.)

126
errors in titration there are eriors in measurement and in
digestion which cause the a (standard deviation) to vary a
total of about T 13 per cent for the run of the mill sample.
The relation obtained by a "least squares" regression
of the data available indicated that the best relation for
sugar mill effluents is O.C. is equal to 0.9 B.O.D.
Figure 18 shows the mill relation of O.C. to B.O.D. for
general liquid sugar factory effluent.

APPENDIX IV
THE a-NAPHTHOL TEST FOR DISSOLVED SUGARS
From the study made it can be concluded that the sensi
tivity of the a-Naphthol solution of 5% strength is 10 ppm
for.a solution not more than one month old when the follow
ing procedure is used in sample analysis.
1. Rinse the test tube with the solution to be tested.
i
2. Pour in about 1-2 inches of sample.
3. Add enough a-Naphthol, usually about 8-12 drops, to give a faint cloudy solution.If the solution clouds up completely, start over.
4. Add concentrated sulfuric acid by allowing it to run down the side of the test tube until a 1/2-3/4 inch layer is formed.Gently swirl or roll the solution, but do not let the layers mix. Repeat this swirling 2 or 3 times over the interval of 2-3 minutes. If sugar is present a band of color will appear between the layers. This band will be purple to light maroon, depending on the.concentration. The light maroon color is indicative of about 10 ppm sugar.
It may be further concluded for the same concentration
sugar samples that the a-Naphthol solution stored in dark
bottles will give better reproducibility than that stored
in light bottles. This is especially true toward the end
of the month.
Finally, from the results it may be concluded that unless
127

128
the proper light is present, the detectable sensitivity may
drop as much as 3 ppm. The best light found in this study
is the yellow fluorescent lamp.
APPENDIX V
TABULATED CANE WASH
CLARIFICATION TEST RESULTS

130
DATA-CANE WASH WATER— NEW IBERIA CO-OPERATIVE, INC.
Sample No. 1 2 3 4Alum, ppm 100 150 200 250Aid, ppm --- --- --- ---Floe V. Good V. Good V. Good V. GoodSupernatant Clear Clear Clear ClearColor Little Little Little LittleNOTE: Test 1 (1st Sample): This was the first sample of CW
water collected by the Lab, boy supposedly from under the cane table. The water seemed remarkably clean to
________start with._________________________________________________Alum, ppm 100 150 200 250Aid, ppm (Seperan) 1 1 1 1Floe Slightly larger floe than in test 1.Supernatant Much the same as above. Maybe a slight improvement.ColorNOTE: Test 2 (1st Sample): Same water sample as was used in
test 1.
Samples were slow-mixed for 11 minutes and allowed for 20 minutes. Tests were run in 1 liter beakers
to settle•
Sample No. 1 2 3 4 5Lime, ppm 200 Floe None Supernatant Opaque Color ---
300 400 500 None V. Small V. Small Opaque Opaque Opaque
700SmallOpaque
NOTE: Test 3 (a second water sample): Most of the floe particles settled in about 5 min. However, supernatant remained opaque as floe was not complete, indicating too small dosage. The addition of excess lime to the hand-stirred beaker produced a good floe which settled fast leaving a clear supernatant. However, the colorof the supernatant was high.
Sample No. 1 2 3 4Lime 200 300 400 500Aid, Seperan Floe
2610 5 ppmPractically
5 ppm Small
5 ppm Small
5 ppm Floe wore
None Little Little this without aid in test 3
SupernatantColor
Opaque Opaque Opaque Opaque
NOTE: Test 4 (2nd water sample)

131
DATA-CANE WASH WATER-NEW IBERIA CO-OPERATIVE, INC. (Cont.)
Sample No. 1 2 3 4Lime 200 200 400 500Iron 200 200 200 200Floe Poor Medium Good V. GoodSupernatant Opaque Straggle Clear ClearColor --- Red Red RedNOTE: Test 5 (2nd water sample)Lime 200 300 400 500Iron 200 200 200 200Aid (Seperan 2610) 5 5 5 5Floe Medium Med. Good Good V. GoodSupernatant Opaque Straggle Clear ClearColor --- --- Red RedNOTE: Test 6 (2nd water sample): Floe seemed notably larger
with the aid, but did not seem to settle much faster.Most of the floe that formed seemed to settle within5 minutes.
Alum 25 50 75 100Floe None None None NoneColor — --- --- ---Supernatant Opaque Opaque Opaque OpaqueNOTE: Test 7 (3rd water sample): Dose obviously too mild.Alum 125 150 175 200Floe None V . Sma11 Small Sma11-MedColor --- --- --- ---Supernatant ______0ppqpe_ __0qaquq ___ Opaqqe_ _____ OpaquqNOTE: Test 8 (3rd water sample): It appears that 200 ppm is
less than the required idose for good flocculation aswas found with the Sterling CW water
Alum 25 50 75 100Aid (Seperan 2610) 5 5 5 5Floe None None None NoneColor --- --- --- ---Supernatant Opaque Opaque Opaque OpaqueNOTE: Test 9 (3rd water sample): Dose obviously too small.Alum 125 150 175 200Aid (Seperan 2610) 5 5 5 5Floe None V. Small Small MediumColor --- --- --- ---Supernatant_______ . _ Opaque_ ___Opaquq ___ Opaque Many_S_tra{NOTE: Test 10 (3rd water sample): Very little improvement
could be noticed by the addition of the aid «

132
DATA-CANE WASH WATER-NEW IBERIA CO-OPERATIVE, INC. (Cont.)
Sample No, 1 2 3 4 5Seperon Aerofloc Aerofloc
Aid, 1 ppm 2610 548 552 Floxel NoneFloe None None None None NoneSupernatant Color
Opaque Opaque Opaque Opaque Opaque
NOTE: Test 11 (4th water sample)Seperon Aerofloc Aerofloc
Aid, 50 ppm 2610 548 552 Floxel NoneFloe None None None None NoneSupernatantColor
Opaque Opaque Opaque Opa qu e Opaque
NOTE: Test 12 (4th water sample): Both these tests showed________no improvement by the addition .of the aid.______________Aid, 5 ppm S-3000 S-3019 S-3059 NoneFloe None None None NoneSupernata_nt __ ^Ogacjue. Opaqine_ _0^a^uje _ Opa_qu_e ______NOTE: Test 13 (4th water sample): Only the sand, etc. settled
to the bottom-most of which settled within the 1st five________minutes.______________________________________________________Aid, 10 ppm S-3000 S-3019 S-3059 NoneFloe None None None NoneSupernatant _ jOpaque _ Opaque Opaque _ Opaque_______________NOTE: Test 14 (4th water sample)_________________________________Aid, 50 ppm S-3000 S-3019 S-3059 NoneFloe None None None NoneSupernatant _ _Opacju_e _ Opaque_ _0qaque _ Opaque_______________NOTE: Test 15 (4th water sample)_________________________________Alum 100 200 300 400Floe None Medium Good GoodSupernatant Opaque Straggles Clear ClearC o l o r __________ _________Slight Slight _ .Slight________________NOTE: Test 16 (5th water sample)
100 200 300Alum Aid (Seperon
2610) 50 50 50Floe None Good GoodSupernatant Opaque Clear Clear.CoJLor__________ -p- flight SJLight _NOTE: Test 17 (5th water sample): Could
due to the aid. Should have tried 50 ppm is impracticable. However, provement doesn't seem sufficient of aid.
400
50GoodClear.Slight______________be an improvement a.t smaller dose as even at 50 ppm im-
to warrant the use

133
DATA-CANE WASH WATER-NEW IBERIA CO-OPERATIVE, INC. (Cont.)
Sample No. 1 2 3 4 5Lime 200 400 600 800Aid, 5 ppm S-3000 S-3000 S-3000 S-3000Floe V.Small Small Medium Large, but evidently
Little Little Little not enought for compl<clarification
Supernatant Opaque Opaque Opaque OpaqueColor --- reddish reddishNOTE: Test 18 (6th water sample)Lime 200 400 600 800Iron 100 100 100 100Aid, 5 ppm S-3000 S-3000 S-3000 S-3000Floe V.Small Small Fiar V.Good
LittleSupernatant Opaque Opaque Clear ClearColor --- reddish reddish reddishNOTE: Test 19 (6th water sample)Lime 200 200 200 200Aid, 1 ppm Sep-2610 AF-548 ,kF-552 S-3000Floe Little Little Little MediumSupernatant Z Y X BNOTE: Test 20 (6th water sample): • The letters represent the
quality of the supernatantSample No. 5 6 7 8Lime 200 200 200 200Aid, 1 ppm S-3019 S-3059 Floxel NoneFloe Medium Medium Medium V.LittleSupernatant Opaque Opaque Opaque Opaque
C D A ---NOTE: A, B, C and D were very much better than X, Y and Z.

DATA-CANE WASH WATER, STERLING SUGARS11/16/55
Raw Water: pH = 7.2; Temp.: Variable
Sample No. 1 2 3 4 Note
Run No. 1Alum, ppm 20 50 80 110 Turbidity tooLime, ppm __ -- high for visiIron, ppm --- bility ofFloe None None None None floe
Run No. 2Alum, ppm -- Coagulent Aid, Hagen andLime, ppm 240 240 Floxel Added— no improvement—Iron, ppm 90 60 water was: very red on longPH 7.1 7.4 settling.Floe Poor Poor
Run No. 3Alum, ppm -- Floe was veryLime, ppm —* 240 -* 240 -* 300 500 fine on allIron, ppm 120 160 90 90 samples. De-PH -* 9.8 9.7 10.7 11.5 cane water wasFloe Poor Fair Fair Fair very red
Run No. 4Alum, ppm —* 80 100 120 160Lime, ppm —b 250 -* 250 -* 250 -* 250Iron, ppm - - ~ - --pH 9.2 10. 2 10.1 9.8Floe Poor Poor Poor Poor
Run N o . 5Alum, ppm 80 80 80 80Lime, ppm — h 250 — 200 150 — 100Iron, ppm —►pH 10.0 9.7 9.4 9.1.Floe Poor Poor None None

135
DATA-CANE WASH WATER, STERLING SUGARS11/16/55
Hand Stirred Sample: 220 ppm AlumpH = 5.7
Good Floe and Clarification
Sample No • 1 2 3 4 Note
Run No. 1Alum — fe 220 180PH --- ---Floe Fair Poor
Run No, 2Alum 150 200 220 250 11 Min. Stir-pH 6.2 5.8 5.6 5.4 ring at 60 RPIFloe Poor Fair Fair Good
Run No. 3Alum — * 200 150 100Iron — * -- 50 100 200Lime -* — — — --- --- 200pH — * 5.8 --- --- 9.1Floe Fair Poor None Settling with red w
Run No. 4Iron — *> --- 30 --- ---Alum — * 120 60 180 90Lime 250Aid, ppm — •» #7(1.0) Floxel #7(1.0) #7(1.0)pH 6.2 9,8 6.2 6.5Floe Poor Poor Poor PoorSample No • 1 2 3 4 5 6
Run No. 5Lime 200 300 400 500 600 700pH 10.4 10.9 11 .2 11 .4 11.i6 11.8Floe None Tinge Poor Fair Fair FairSupernatant Opaque Tur. Tur SE SE = SEColor High High High High
Run No. 6Same as Above 4- 4 dropsof Floxel/L Results similar to above exceptFlox slightly better.Supernatant NOTE: 600 ppm lime, not as good asColor 220 ppm Alum *

RunNo.
12
3
4
5
67
89
10
RunNo.
123456739
10
136
CANE WASH EFFLUENT (Jar Test Results) Run: Oct. 28, 1955
Mud in 10 Total Min.
Alumppm pH Lime
PPm
.375/7 188 86 8.9
.375/7 222 110 9.1
.375/7 256 120 9.0
.375/7 290 135 9.0
.5/7 325 155 •CO
Alum Lime pH
17 17 8.834 31 9.251 17 8.668 20 8.686 26 8.5
103 38 8.6124 48 8.7142 43 8.7159 46 8.5171 57 8.5
Remarks
Small floc-cloudy supernatant
Size of floe increased with
increase in chem. dosage
Reasonable floc-supernatant clear but many stragglers
Most of floe settled
within 5 minutes
Remarks
No floe No floe No floe No floe No floe No floeSlight floc--Opaque Supernatant Slight floe--Opaque Supernatant Slight floc--Opaque SupernatantMuch better floe but opaque supernatant

137
CANE WASH EFFLUENTS (Jar Test Results) Run: Oct. 28, 1955
Note: These tests were conducted in 7" x 1" test tubes.
RunNo.
Mud in 10 Total min.
Alumppm pH Lime
ppm Remarkslittle floe
1 .375/7 188 6.5 26 little settling-Super- natant Opaque little floe
2 .375/7 188 7.0 34 little settling-Super- natant Opaque little floe
3 .375/7 188 7.5 43 little settling-Super- natant Opaque little floe
4 .375/7 188 8.0 51 little settling-Super- natant Opaque little floe
5 .375/7 188 8.5 77 little settling-Super- natant Opaque little floe
6 .375/7 188 9.0 105 little settling-Super- natant Opaque little floe
7 .375/7 188 9.5 120 little settling-Super- natant Opaque little floe
8 .375/7 188 10.0 150 little settling-Super- natant Opaque reasonable settling and
9 .375/7 188 10.5 170 floc-Supernatant Opaque reasonable settling and
10 .375/7 188 11.0 200 floc-Supernatant Opaque Good settling, clear
11 .5/7 220 10.6 230 brown supernatant, many straggles
Initial pH of water 7.4All samples had much carbon floating on the surfaceThe above run was conducted at varying pH. The pH
being varied by the addition of lime.All sanples were strained free of large bagacillo
particles through a juice strainer.

VITA
Joseph Edward Wheeler, Jr. was born at Saint Louis,
Missouri, on June 10, 1932. He attended schools at
Augusta, Maine; Memphis, Tennessee; and Alexandria, Louisiana,
and was graduated from Menard Memorial High School in May,
1950.
He entered Louisiana State University in September,
1950 receiving a Bachelors Degree in Chemical Engineering
in May, 1954, and a Masters Degree in. Chemical Engineering
in May, 1956.
From 1954 until 1958, he held the position of Research
Fellow in the Department of Chemical Engineering at Louisiana
State University and has also worked in his present posi
tion as a Technologist for Shell Oil Company for slightly
over two years, including summer employment.
He is presently a candidate for the Doctor of Philosophy
Degree in Chemical Engineering.
138

EXAMINATION AND THESIS REPORT
Candidate: Joseph Edward Wheeler, Jr.
Major Field: Chemical Engineering
Title of Thesis: An Engineering Study of the Effluent Disposal Problemsof the Louisiana Raw Sugar Industry
Approved:
jor Professor and Chairman
Deaiy of the Graduate Schoj
EXAMINING COMMITTEE:
■UaLLiWlM -\ 1
Date of Examination:
July 28. 1959