AN EMPIRICAL STUDY OF U.S. CONSUMER PURCHASE …
84
AN EMPIRICAL STUDY OF U.S. CONSUMER PURCHASE INTENTION OF CASUAL ACTIVEWEAR By LAUREN MICHELLE WATTS A thesis submitted in partial fulfillment of the requirements for the degree of MASTER OF ARTS IN APPAREL, MERCHANDISING, AND TEXTILES WASHINGTON STATE UNIVERSITY Department of Apparel, Merchandising, Design and Textiles MAY 2017 © Copyright by LAUREN MICHELLE WATTS, 2017 All Rights Reserved
Transcript of AN EMPIRICAL STUDY OF U.S. CONSUMER PURCHASE …

AN EMPIRICAL STUDY OF U.S. CONSUMER PURCHASE INTENTION OF CASUAL
ACTIVEWEAR
By
LAUREN MICHELLE WATTS
A thesis submitted in partial fulfillment of
the requirements for the degree of
MASTER OF ARTS IN APPAREL, MERCHANDISING, AND TEXTILES
WASHINGTON STATE UNIVERSITY
Department of Apparel, Merchandising, Design and Textiles
MAY 2017
© Copyright by LAUREN MICHELLE WATTS, 2017
All Rights Reserved

ii
To the Faculty of Washington State University:
The members of the Committee appointed to examine the thesis of LAUREN
MICHELLE WATTS find it satisfactory and recommend that it be accepted.
____________________________________
Ting Chi, Ph.D., Chair
____________________________________
Jihyeong Son, Ph.D.
____________________________________
Babu John Mariadoss, Ph.D.
iii
ACKNOWLEDGEMENT
I would like to first express my sincere gratitude to my major advisor Dr. Ting Chi who
has helped me greatly with both my thesis and the entirety of my graduate school career. This
thesis would not have been possible without his guidance and support. His presence during these
past few years has made an immeasurable difference in my education and experience.
I also extend much appreciation to my committee members, Dr. Jihyeong Son and Dr.
Babu John Mariadoss for their willingness to help in the creation of this thesis and their
invaluable insight and support.
Much gratitude is also extended to Dr. Alberta Hill’s generous funding award which
made this research possible. Dr. Alberta Hill’s support helped me greatly by alleviating the stress
of funding this study.
This thesis is more than just an isolated project. It is the culmination of all I have learned
as a student through the education, opportunities, and advice of the faculty and my peers in
AMDT. I have been blessed to have met so many bright, kind, and talented people along the
way.
I would also like to thank my family for supporting me during my graduate studies and
always being just a phone call away.
Finally, I would like to thank Ryan for his patience, encouragement, and coffee-brewing
skills throughout this journey.

iv
AN EMPIRICAL STUDY OF U.S. CONSUMER PURCHASE INTENTION OF CASUAL
ACTIVEWEAR
Abstract
by Lauren Michelle Watts, M.A.
Washington State University
May 2017
Chair: Ting Chi
In recent years, the athletic apparel industry has become a lucrative avenue of business
worldwide. Growing consumer interest in healthy lifestyles has heralded an increased demand
for apparel to meet their needs in style, performance, and functionality. Regardless of one’s
intent to play sports or simply look sporty, activewear has become a staple in consumers’
wardrobes that extends beyond the gym. Aiding in the momentum of the activewear industry’s
growth is the popularity of casual activewear. The casual activewear phenomenon is
characterized by exercise or physical activity facilitating apparel (activewear) being worn for
casual/daily wear. This study determines the key factors influencing U.S. consumers’ intentions
to purchase casual activewear.
First, this study reviewed the existing social psychology theory (i.e., Theory of Planned
Behavior) to propose an enhanced consumer purchase intention model for casual activewear.
Second, an online survey instrument was developed based on existing consumer behavior
scales to gather primary data on both latent constructs and consumers’ demographic variables. A

v
total of 146 eligible responses were collected. The psychometric properties of the proposed
model were examined using survey data. Factor analysis and multiple regression analysis were
utilized for data analysis and hypothesis testing. The significant factors influencing the U.S.
consumers’ intentions to purchase casual activewear were determined. Attitude, perceived behavioral
control, past purchase behavior, and lifestyle orientation had positive effects on intention to purchase
casual activewear. Managerial implications were imparted based on the findings of this study.
In addition, the correlations between demographic variables (including gender, age,
education level, personal annual income level, and ethnicity) and investigated latent constructs
were determined. The effects of the demographic variables on the investigated latent constructs
were insignificant except the positive relationship between age and consumer attitude towards
purchasing casual activewear
Future studies should include the measurement of actual purchase of casual activewear.
Qualitative methods might be used in future studies to provide a comprehensive picture on the
purchase intention of casual activewear.
vi
TABLE OF CONTENTS
Page
ACKNOWLEDGEMENT ............................................................................................................. iii
ABSTRACT ................................................................................................................................... iv
LIST OF TABLES ......................................................................................................................... ix
LIST OF FIGURES ........................................................................................................................ x
CHAPTER
1. INTRODUCTION .......................................................................................................... 1
1.1 Context for Topic .............................................................................................. 1
1.2 Importance of the Topic .................................................................................... 1
1.3 Activewear ........................................................................................................ 3
1.4 Casual Activewear ............................................................................................ 4
1.4.1 Athleisure ........................................................................................... 7
1.5 Activewear Industry .......................................................................................... 8
1.5.1 Leading Companies ........................................................................... 8
1.5.1.1 Nike ..................................................................................... 8
1.5.1.2 Adidas ............................................................................... 10
1.5.1.3 Under Armour ................................................................... 12
1.5.2 Current and Emerging Product Categories ...................................... 13
1.5.2.1 Wearable Technology ....................................................... 14

vii
1.5.2.2 Women’s Activewear ........................................................ 15
1.5.2.3 Textiles .............................................................................. 16
1.5.2.4 Sustainability..................................................................... 17
1.6 Gaps in the Literature and Contributions of this Study .................................. 18
1.7 Purpose of this Study ...................................................................................... 19
1.8 Definition of Terms......................................................................................... 20
2. LITERATURE REVIEW AND MODEL AND HYPOTHESIS DEVELOPMENT ... 21
2.1 Theoretical Foundation ................................................................................... 21
2.1.1 Theory of Planned Behavior ............................................................ 21
2.2 Components of TPB ........................................................................................ 22
2.2.1 Attitude ............................................................................................ 22
2.2.2 Subjective Norm .............................................................................. 24
2.2.3 Perceived Behavioral Control .......................................................... 25
2.3 Expanding the TPB Model.............................................................................. 26
2.3.1 Past Casual Activewear Purchase Behavior .................................... 26
2.3.2 Consumer Lifestyle Orientation ....................................................... 27
2.4 Proposed Research Model............................................................................... 30
3. METHODOLOGY ....................................................................................................... 31
3.1 Sampling Plan and Procedure ......................................................................... 31
3.2 Survey Questionnaire Development ............................................................... 31

viii
3.2.1 Demographics .................................................................................. 32
3.2.2 Scales for Investigated Constructs ................................................... 32
3.2.3 Theory of Planned Behavior ............................................................ 32
3.3 Pilot Test of Survey Instrument ...................................................................... 35
3.4 Statistical Analysis Methods ........................................................................... 35
4. RESULTS AND DISCUSSIONS ................................................................................. 38
4.1 Description of Demographic Information ....................................................... 38
4.2 Assumption Examinations and Factor Analysis ............................................. 39
4.3 Model Adequacy Examinations ...................................................................... 41
4.4 Hypothesis Testing Results and Discussion ................................................. 444
5. CONCLUSIONS AND IMPLICATIONS .................................................................... 48
5.1 Discussion ....................................................................................................... 48
5.2 Conclusions ..................................................................................................... 49
5.3 Implications..................................................................................................... 50
5.4 Limitations and Future Studies ....................................................................... 52
BIBLIOGRAPHY ......................................................................................................................... 53
APPENDIX ................................................................................................................................... 69

ix
LIST OF TABLES
Page
Table 1. Demographic information of the survey respondents ................................................... 39
Table 2. Constructs and corresponding measures and scales ...................................................... 40
Table 3. Correlations and properties of all constructs and demographic variables .................... 43
Table 4. Results of hypothesis testing .......................................................................................... 46

x
LIST OF FIGURES
Page
Figure 1. Consumer purchase intention model for casual activewear ......................................... 22
Figure 2. Research framework ..................................................................................................... 30
Figure 3. Results of hypothesis testing ........................................................................................ 47

1
CHAPTER ONE
INTRODUCTION
1.1 Context for Topic
In recent years, the athletic apparel industry has become a lucrative avenue of business
worldwide (Euromonitor International, 2014). Growing consumer interest in healthy lifestyles
has heralded an increased demand for apparel to meet their needs in style, performance, and
functionality. Regardless of one’s intent to play sports or simply look sporty, activewear has
become a staple in consumers’ wardrobes that extends beyond the gym. From yoga pants in the
supermarket to sneakers in the boardroom, activewear is accepted in many facets of life not
necessarily associated with participation in physical activity (Friedman, 2015).
This merging of the markets comes with increasing consumer demands for a greater array
of products with increased versatility and functionality. More styles and innovations coupled
with increasing consumer demand have generated considerable growth for the activewear
industry. Euromonitor International (2014) reports that in 2013, activewear claimed global worth
of US $255.1 billion, up by 12% since 2008. This includes sales of athletic apparel (US $162.0
billion) and athletic footwear (US $93.1 billion) (Euromonitor International, 2014).
1.2 Importance of the Topic
It is important to understand how and why activewear is consumed and the conscious and
subconscious processes that guide purchase decisions. Despite the seemingly unstoppable growth
of the activewear industry and contrary to imagery of the unstoppable athlete, there remains
limited insight into the forces that guide consumers towards the purchase of clothing endowed

2
with properties intended for participation in physical activity without having the need for, or the
intention to utilize those performance characteristics (Horton, Ferrero-Regis, & Payne, 2016).
Through this study, this necessary insight into the factors influencing consumer purchase intent
that usually leads to purchase behavior will be made more apparent.
Due to changes in consumers’ behavior related to trends in health-conscious behaviors
and wellness and various other factors and conditions, the need for activewear is at an all-time
high. One of the primary drivers in the consumption of activewear is a growing emphasis on a
health-conscious active lifestyle; 49.6% of Americans report exercising for at least 30 minutes a
day 3 or more days a week (Statistic Brain, 2015). Whether watching or participating, athletic
activities are some of the most popular leisure activities in the U.S. Consumers are gaining more
interest in more physically demanding forms of exercise such as high-intensity interval training
and body weight training; meanwhile, Pilates, Zumba, indoor cycling, and balance training have
lost favor (Thompson, 2014). The decline of latter could be due to consumer’s unwillingness to
spend money on expensive equipment and classes. Yoga maintains its popularity in 2015 after
many years of favorability with consumers and currently resides among the top 10 forms of
exercises preferred by Americans (Thompson, 2014). About 9.5% of Americans use yoga as a
form of exercise; this figure is up from 5.1% in 2002 (Clarke, Black, Stussman, Barnes, &
Nahin, 2015).
Running, jogging, and walking have gained popularity for regular exercise. Marathons,
charity walks, and themed running events are experiencing an increase in attendance and
participation. The 2014 Boston Marathon was the second largest in the race’s 118-year history
(Euromonitor International, 2015a). Female participation in the Tough Mudder obstacle race has
grown by 30% since 2010 and participation in the Color Run exploded in size to 1 million

3
runners in its second year in 2013 (Jessop, 2014). Sales for running shoes in the U.S. increased
by 2% in 2013 to $3.09 billion (Jessop, 2014). Women ages 25 to 34 are the largest demographic
of running and jogging participants (Running USA, 2014). Individual sports such as running are
becoming increasingly popular with women under 30 with 62% of women claiming they
participate in individual sports at least once a month (Euromonitor International, 2015b).
Consumers are also making eating healthy a priority as seen in organic and locally
produced food movements. Pollock Communications and Today’s Dietician conducted a survey
to discover trends in consumers’ consumption of healthy food and found an “increased
consumption of nuts/seeds, gluten free food, ancient grains, and a continued focus on low carb
food products as trends for 2015 (as cited in Euromonitor, 2015a).” However, despite an
increased awareness of healthy living, obesity in the U.S. is still on the rise. Almost one-half of
Americans will be obese by 2020.
1.3 Activewear
For the athletic apparel industry, the terms outerwear, sportswear, and activewear are
commonly used and seemingly interchangeable as descriptors for apparel in this market. In their
own ways, they all facilitate participation in physical activity. However, there are distinct
differences between the three terms. Outerwear is a general term to describe jackets, coats, and
capes used as a protective outermost layer (Frings, 2008). These products can be worn while
participating in physical activity, but their purpose is not solely for this use which is not aligned
with the purpose of this study.
The term sportswear is most often used as a substitute for activewear. Sportswear is the
combination of separates including shorts, pants, skirts, shirts, blouses, and jackets, priced and

4
sold separately to be mixed and matched any way the consumer sees fit (Frings, 2008). Similar to
outerwear, sportswear includes products not necessarily intended for exercise.
Despite the growth of the market, activewear remains an ambiguous term with little
consistency in its definition among literature reviewed for this study. Activewear is worn by
Olympic athletes, yet sneakers walk down the runway in couture shows such as Dior and Chanel.
It is important to begin by clarifying activewear for the purpose of this study. Powered by fitness,
activewear is worn by people participating in physical activity or sports (Frings, 2008). Friggs
(2008) further explains that activewear products include leggings, sweat suits, T-shirts, bike
shorts, and unitards. These apparel products are defined as activewear because the garments are,
“specifically engineered to deliver a pre-defined performance or functionality to the user, over
and above its normal functions” (Gupta, 2011). Innovations in textiles and technology give
activewear protective and comfort-focused qualities which facilitate participation in physical
activity. In addition to their high-performance qualities, the use of activewear by a user signifies
intent to exercise. The National Heart, Lung, and Blood Institute (What is Physical, 2015)
describes exercise as a planned and structured activity. In this study, the market for this type of
apparel will only be referred to as activewear.
1.4 Casual Activewear
For the athletic apparel industry, activewear was once an all-encompassing term for
clothing worn with the intent to perform athletic activities. However, as casual, comfort-focused
clothing gains popularity, consumers adopt activewear into their everyday wardrobe (Fowler,
1999; Ko, Taylor, Sung, Lee, Wagner, Navarro, & Wang,, 2012; Wray & Hodges, 2008). As a
result, the line between activewear and casualwear has blurred.

5
To understand why activewear is unusual in a casual setting, casualwear must be defined
and its importance made known. Prior to the 20th
century, clothing susceptible to the public gaze
was not synonymous with comfort and practicality; yet in the past century, casual clothing in the
United States has been almost exclusively driven by those two factors (Clemente, 2014).
Clemente (2014) explains that, “To dress casual is quintessentially to dress as an American and
to live, or to dream of living fast and loose and carefree” (pg. 2). Casualwear is the art of
dressing down while exuding an approachable aura and freeness or spirit and body (Rubinstein,
2001).
As seen in a protest in 1930 by Dartmouth male students who lobbied for the freedom to
wear gym shorts in public, activewear worn outside the gym arguably began on Dartmouth
college campus, a successful endeavor which saw a spike in shorts sales of local merchants
(Clemente, 2014). As clothing intended for participation in physical activity left the gyms, a
marriage between casualwear and activewear emerged. The ideals of casualwear and activewear
meld with each other exceptionally well and create a harmonious relationship as the unrestrained
and carefree foundations of casualwear and the youthful play of activewear are closely related
(Salazar, 2008).
To identify this phenomenon for this study, activewear worn casually in non-athletic
settings will be referred to as casual activewear. Today, casual activewear is evident in apparel
products such as yoga pants, tracksuits, basketball shorts, and sports bras. These items are often
worn for their comfort by non-participants of physical activity. No longer are there clear
distinctions between apparel for work or play (Ko et al., 2012). Casual activewear is activewear
made for the gym, yet it is increasingly observed outside of it due to this fusion of fashion and
fitness (Fromm, 2016; Horton et al., 2016). Moreover, there no way of knowing whether or not

6
wearers of casual activewear on the street have ever worked out at all. Horton et al. (2016) argue
that activewear “is a highly ambiguous form of contemporary fashionable dress that signals a
healthy body and a leisured lifestyle devoted to the improvement of the self.” Activewear worn
casually signifies the casualization of dress and the idolization of a healthy and physically fit
body as a fashion aesthetic (Horton et al., 2016).While some activewear companies, such as
Nike, have previously contested the value of this trend, others embrace it as a reflection of the
changing cultural environment of the world we live in (Friedman, 2015). Designer Derek Lam
supports casual activewear and believes that the use of activewear for casual purposes “has to do
with a modern reflection of urban and suburban activities” (as cited in Friedman, 2015).
Regardless of retailers’ approval of this concept, the increasing momentum of the casual
activewear movement has proven to a lucrative segment. Consumer spending on apparel,
footwear, and accessories rose by 1% from 2013 to 2014 which is largely attributed to a $2
billion increase in sales of activewear (Euromonitor International, 2015a). Much of this is due to
the rise of casual activewear trend. According to the research firm NPD group, the current
estimated market for activewear is $44 billion in the U.S., a 16% increase from 2014 (Banjo,
2016). Overall, total apparel sales in the U.S. grew by a sluggish 2% in 2015. However, without
the activewear category, NPD reports that the U.S. would have experienced a 2% decrease. With
0.2% growth from 2008-2015, the non-athletic apparel category significantly lags behind the
growth of athletic apparel, which is up 4.1% in the same timeframe (Molina, 2016). This gap
between the two categories is predicted to widen in the future.
The casual consumption of activewear is not a new concept to recent times. However, the
growing momentum of this market is undeniable. The casual activewear phenomenon is
characterized by exercise or physical activity facilitating apparel being worn on the streets, to

7
work, restaurants, PTA meetings, or shopping (Kasriel-Alexander, 2015). Consumers want
clothing to be able to transition from activity to activity, without the need to go home and
change. The casual activewear trend is a socially acceptable way to accomplish this. As sports
apparel is accepted into the everyday wardrobe of Americans, consumer demand has led to an
increase in the products, product variety, and retail locations made available for them. Many
retailers have responded to this growing demand including notable brands such as Nike, Under
Armour, Gap, and Lululemon. Athleta, an activewear brand owned by Gap Inc., has opened 100
stores in 2014 alone with an additional 30 planned for 2015 (Euromonitor International, 2015a).
With the expansion of the brand has come a surge in the variety of colors and styles produced.
This growing variety of stylish sports apparel is also evident in the unveiling of Net-a-Sporter in
2014 by parent company online retailer Net-a-Porter which will offer fashion forward garments
with high performance sport characteristics (Lamont-Djite, 2014). Lamont-Djite (2014) reported
that this designer activewear, though capable of assisting and facilitating physical activity, is
equally intended to be worn all day long.
1.4.1 Athleisure
In the world of fashion exists a trending style comprised of combinations of high-
performance athletic apparel and casualwear which embodies a union of leisure, sports, and
lifestyle (Horton, Ferrero-Regis, & Payne, 2016). This style phenomenon has been dubbed
‘athleisure’ by Worth Global Style Network trend forecasting service (WGSN, 2007). Also
recently added to the Merriam-Webster dictionary, ‘athleisure’ is defined as “casual clothing
designed to be worn both for exercising and for general use” (Athleisure, 2015). However,
despite its popularity, it is difficult to discern a consistent definition for this trend. For some

8
retailers and consumers, it encompasses high-performance activewear worn casually (Chen,
2016; Entis, 2016). And for others, clothing which visually imitates activewear (Verry, 2017).
Since perceptions on the meaning of athleisure vary widely, the term athleisure will not be used
in this study. The aforementioned term of casual activewear will be the term used in this study to
be defined as activewear purchased and worn primarily for casual/daily wear.
1.5 Activewear Industry
Aggressive competition drives the activewear industry as numerous competitors desire
market share. These companies within the industry fuel competition with innovative products
and services, advertising campaigns, high-profile endorsements, strategic pricing, and valuable
extrinsic brand image. Current top competitors in the industry identified by Textiles Intelligence
(2013), Nike, Adidas, and Under Armour, all generate competition which shapes the industry.
1.5.1 Leading Companies
1.5.1.1 Nike
Headquartered near Beaverton, Oregon, Nike is the largest seller of activewear in the
world with sales revenue of $27.8 billion in 2014 (Nike, Inc., 2014). The athletic apparel retail
giant’s success can be largely attributed to successful execution of three factors in its business
strategy: innovation, marketing, and endorsements.
Innovation is at the forefront of the company, overtaking the core value that other apparel
retailers hold so closely, fashionability. Nike’s products are a marriage between technology and
art, but without their dedication to being a leader in performance technology, they would lose

9
their competitive edge. In addition to advances in the performance of athletic apparel, Nike
found success in introducing wearable technology like the FuelBand.
Regardless of the growing success of the company, Nike has directed a decreasing
amount of funds towards traditional marketing channels such as television, print, and radio by
40% (Cendrowski, 2012). Instead, focus has been given to untraditional marketing channels like
social media and online communities. Cendrowski (2012) reported that in 2011, Nike spent $113
million in traditional media advertising which pales in comparison to the $771 million spent on
nontraditional media. Closely related to marketing, Nike’s endorsement of individual athletes
and sport teams has proven to be an integral part of their strategy by increasing the visibility of
the brand and enriching the bond with the consumer. Celebrity endorsements target the athletic
consumer and speak to the value of the products, ultimately making the purchase decision less
risky for the consumer (Biswas, Biswas, & Das, 2006).
In a report for Market Realist, Soni (2015) discusses how Nike, with 13% of the
activewear market share in the U.S., is a leader in athletic apparel with Under Armour trailing
behind at 6%. In the footwear market, Nike dominates with 62% of the share (Soni, 2015). In his
article he elaborates that competitors are far from catching up to Nike’s explosive performance;
the closest being Sketchers with 5% of the market share. Nike is able to accomplish such control
of the athletic apparel market because of the brand’s implemented strategies. Internally, Nike
maintains a near flawless inventory management system and is renowned for their ability to
strike remarkable deals with retailers (Soni, 2015). Coupled with their well known, marketing,
sponsorship, and retail presence, Nike has pushed a growing emphasis on technology and
innovative product design. Innovation is an investment in the future of Nike. As Nike moves
forward, technology is increasingly at the forefront of their strategy and it has helped push the
10
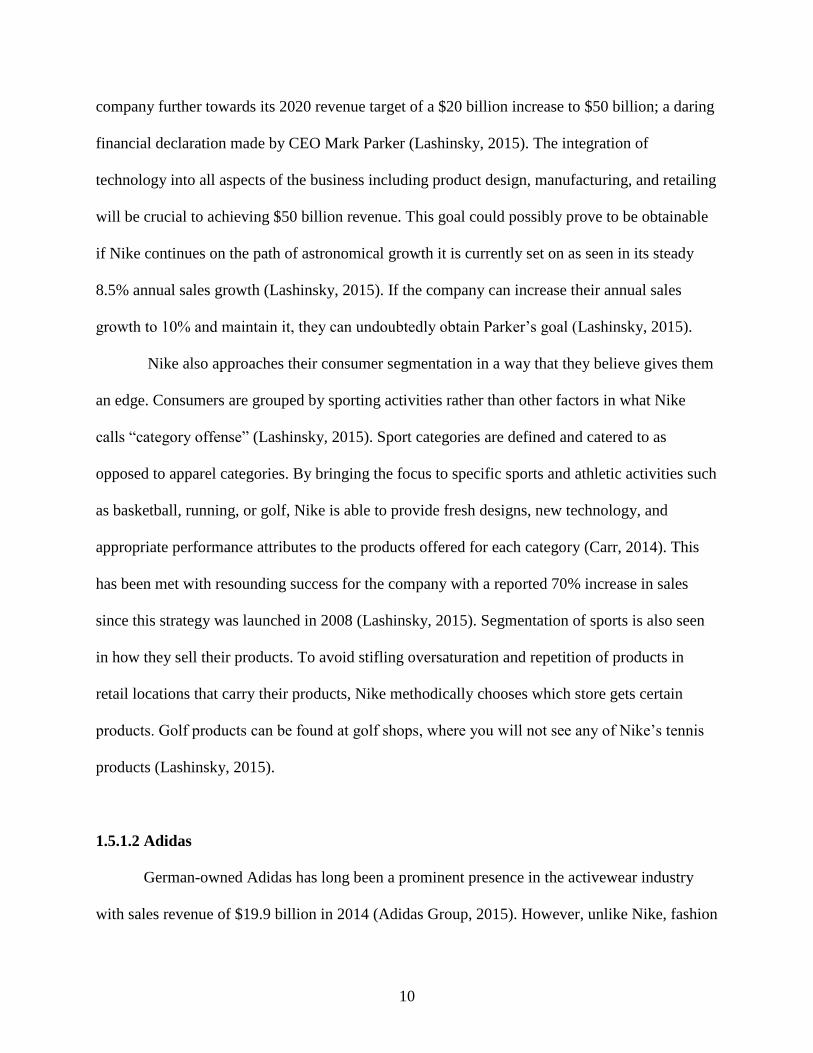
company further towards its 2020 revenue target of a $20 billion increase to $50 billion; a daring
financial declaration made by CEO Mark Parker (Lashinsky, 2015). The integration of
technology into all aspects of the business including product design, manufacturing, and retailing
will be crucial to achieving $50 billion revenue. This goal could possibly prove to be obtainable
if Nike continues on the path of astronomical growth it is currently set on as seen in its steady
8.5% annual sales growth (Lashinsky, 2015). If the company can increase their annual sales
growth to 10% and maintain it, they can undoubtedly obtain Parker’s goal (Lashinsky, 2015).
Nike also approaches their consumer segmentation in a way that they believe gives them
an edge. Consumers are grouped by sporting activities rather than other factors in what Nike
calls “category offense” (Lashinsky, 2015). Sport categories are defined and catered to as
opposed to apparel categories. By bringing the focus to specific sports and athletic activities such
as basketball, running, or golf, Nike is able to provide fresh designs, new technology, and
appropriate performance attributes to the products offered for each category (Carr, 2014). This
has been met with resounding success for the company with a reported 70% increase in sales
since this strategy was launched in 2008 (Lashinsky, 2015). Segmentation of sports is also seen
in how they sell their products. To avoid stifling oversaturation and repetition of products in
retail locations that carry their products, Nike methodically chooses which store gets certain
products. Golf products can be found at golf shops, where you will not see any of Nike’s tennis
products (Lashinsky, 2015).
1.5.1.2 Adidas
German-owned Adidas has long been a prominent presence in the activewear industry
with sales revenue of $19.9 billion in 2014 (Adidas Group, 2015). However, unlike Nike, fashion

11
plays an important role in the business strategy of Adidas. Creating products for the mass market
as well as athletes is vital to their strategy; a strategy with the stressed purpose of obtaining the
most value for their stakeholders as possible (Adidas Group, 2015). Representatives for Adidas
have stated that the company is primarily an athletic apparel brand with deep roots in sports
heritage but it is uniquely fused with fashion and pop culture (Emmerentze Jervell & Germano,
2015). Adidas does not cater solely to the athlete. They also extend their reach to the casual
activewear market as well as high-end fashion-enthusiasts through three distinct product groups:
Adidas Performance for the athletes, Adidas Originals for casual activewear, and Adidas Style
Essentials for the fashion market. Once criticized for being out-of-touch with the American
consumer, Adidas has turned its focus to younger generations to revitalize the company’s image
and so, in addition to pro-athletes, the company collaborates with celebrities and designers such
as Stella McCartney and Kanye West to design and market products (Emmerentze, Jervell &
Germano, 2015).
Adidas has long had limited success in the U.S. in comparison to its business abroad.
Through an increased focus through spending, Adidas hopes to improve their current position in
the U.S. market. 2014 proved to be a difficult year in the U.S. for the German activewear
company as they lost their second place market share position to Under Armour (Cazin, 2015).
To combat this, Adidas moved their U.S. headquarters to Portland, Oregon: Nike’s backyard.
From here, they will focus their marketing strategy on American sports. In an increasing effort to
square-up with Nike, three top designers from Nike were recruited to Adidas’s ranks (Rovell,
2014). Positive but slow initial improvement has been made as seen in a 7% increase in North
American sales for the quarter ending March 31st, 2015 (Cazin, 2015). However, this growth is
not solely contained to Adidas but to the activewear market as a whole (Cazin, 2015).

12
Adidas will also continue to grow its brand portfolio to service a variety of lifestyles and
activity levels and ultimately welcome all consumers from the fitness-lover to the fitness-chic.
Currently existing are designer collaborations and products lines featuring celebrities such as
Kanye West and Stella McCartney.
1.5.1.3 Under Armour
Recently surpassing Adidas as the second most popular activewear brand in the U.S.,
Under Armour is a self-declared underdog brand who is taking Nike’s strategy and executing it
in an anti-Nike way (Schlossberg, 2015a). Schlossberg (2015a) describes Under Armour as a
brand that endorses pro-athletes, similar to Nike, but selects who they consider to be the
overlooked and underappreciated. This includes dancers, boxers, or those who were not first
draft picks for professional teams. Under Armour uses this underdog mentality to push a lifestyle
of athleticism with passion; a “do whatever it takes” mentality encouraging consumers to be
relentless and push themselves to their limits (Schlossberg, 2015a). Still a relatively new
company, Under Armour pursues those who participate in athletic activities more so than the
casual consumer of activewear and offers a range of functional performance activewear. The
company holds a strong advantage over other activewear retailers in terms of its presence in the
app world. The MyFitnessPal, Endomondo, MapMyFitness, and UARecord apps track fitness
progress and help promote a healthy lifestyle and are the most used fitness apps for smart phones
and mobile devices (Schlossberg, 2015a). This accessibility to consumers and authenticity in
marketing has helped in Under Armour’s rapid growth to the top of the activewear market.
Second to Nike, Under Armour accounts for 6% of the U.S. market share of activewear; a
position until recently held by Adidas (Soni, 2015). The company recently achieved $1.20 billion

13
in revenue, up by 28% from recent years which overshot the original target revenue of $1.17
billion (Much, 2015a). Much of the company’s recent success can be attributed to the acquisition
of popular fitness mobile apps, MyFitnessPal and Endomondo (Much, 2015a). Recently, the
brand has begun to expand into new sporting markets such as golf and hunting as well as new
products like bags. Though these are not new or unique areas for activewear, they were
previously untapped by Under Armour who has held on tightly to their basic core apparel that
helped to launch the brand. Now that a strong foothold in the activewear market has been
established, product variability and greater inclusiveness for different athletic activities will
prove to be essential to their growth (Much, 2015a).
Footwear has also become a surging force of profits for Under Armour with a 40%
growth in footwear in 2015 Q3 sales and more recently, sales jumped by 155% for the week
ending November 7th
(Much, 2015b. For comparison, Nike rose 0.2%, Sketchers 17.4%, and
Adidas 10.6% (Much, 2015b). Under Armour’s ability to out-perform Nike makes one of their
goals more apparent: beat Nike. In order to compete with Nike, Under Amour will need sports-
geared footwear, celebrity and athlete endorsements, limited-edition styles, and a wider array of
available designs; a process which is under-way for the brand (Potts, 2015a).
1.5.2 Current and Emerging Product Categories
The activewear industry is a hotspot for technological innovations driven by the need for
increased functionality to achieve greater performance through the use of technical fabrics and
materials (O’Mahoney & Braddock, 2002). Science and engineering bring forth new product
categories and products to elevate the physically active to a higher realm of performance. Some
of these innovations are groundbreaking; the likes of which had been unheard of in the past

14
including wearable technology for physical activity participation or high-tech textiles. Others
innovations are more subtle, filling a demand held by consumers that was unmet.
1.5.2.1 Wearable Technology
Many activewear companies are beginning to offer wearable technology to their
consumers along with traditional apparel. In order to help consumers meet their fitness goals and
maintain active lifestyles, brands are using smartphones, smart watches, mp3 players, and
activity monitoring devices. As of October 2014, 64% of Americans own a smartphone (Smith,
2015). One of the most popular wearable technology innovations is the wrist accessory fitness
tracker which, in most cases, syncs to a smartphone app. Two of the most recognizable fitness
trackers currently on the market are the FitBit and the Nike FuelBand (Yarow, 2013). Yarow
(2013) explains in a review of the products, that these trackers monitor steps taken, calories
burned, sleep patterns, and time. With the ability to sync to a smartphone via Bluetooth, the
experience continues in an app where one can log their food and water intake, connect with other
users, map running our walking routes, and ultimately track and evaluate progress. The
sophistication and capabilities of fitness related technology is only expected to increase.
University of Phoenix executive dean at the college of information systems and technology
Dennis Bonilla detailed his predictions on the role of wearable technology in fitness:
"In the future, your smartwatch will instantly access your medical records, diet and training logs, then sync
them with sensors in the supermarket and mall to provide real-time shopping and health advice. Your smart
shoes and biometric shirts will remind you to straighten your posture, hydrate and run and walk with correct
form to protect your back and knees. A smart bandage will tell diabetics when their blood sugar is running low.
Haptic technology will give you intimacy at a distance; when your wife on the phone 1,000 miles away
squeezes her Fitbit, your Under Armour will tighten up." (as cited in Wallack, 2015)

15
1.5.2.2 Women’s Activewear
In the first quarter of the 2016 fiscal year, Nike saw 14% growth in revenue worldwide
with 9% in the U.S. (Kissane, 2015). A key component attributed to this success is the
company’s growing attention towards their female consumers through trend-conscious apparel; a
component that Nike hopes will be worth $7 billion in 2017, a $2 billion increase from 2014
(Kissane, 2015). The activewear giant has made an increasingly visually attractive assortment of
apparel available to women with a large array of styles and colors aimed towards the woman
athlete. Nike introduced the Metcon 1 training shoe for women in early 2015, preceded by
innovations such as Pro Base Layer apparel and the Air Max. Nike Pro Tights and Dri-fit fabrics
are currently popular with women according to Nike president Trevor Edwards (Wahba, 2015).
Nike is not the only activewear company to realize opportunity in the women’s segment
of the market; brands such as Under Armour and Lululemon have set their sights on the female
customer as well (Townsend, 2013). Previously focusing primarily on men’s apparel, Under
Armour has created a new line of products specially designed for women; an accomplishment
that has eluded them in the past (Townsend, 2013). This line of clothing includes compression
shorts, footwear, training gear, and, most importantly, sports bras. The new Armour Bra
collection is the highlight of their triumphant breakthrough in the women’s activewear market
and is at the forefront of advertisements aimed towards women. The variety of sports bras
offered fall under three categories which cater to women of different activity levels: low-impact
activity, mid-impact activity, and high-impact activity. Women can choose a bra from the
category that fits their physical activity needs from walking to cycling to team sports. The unique
bra features gel straps and gel-encased underwire along with a mesh back, hook and eye closure,

16
molded cups and aesthetically pleasing design. This focus on women’s activewear generated US
$600 million for Under Armour in 2014 and is expected to grow (Fitzpatrick, 2015)
Lululemon, on the other hand, has always made women’s activewear the emphasis and
crux of their company. The yoga-based lifestyle brand generated a craze for stretchy yoga pants
that did the unthinkable, dethrone the denim as women’s preferred pants. Levi Strauss & Co
reported a dip in sales over the past years from $7 billion to $4.8 billion due to their
unwillingness to adapt to the changing desires of consumers (Lutz, 2015). Established in 1998,
Lululemon’s success in such a short amount of time can be attributed to branding rooted in
wellbeing, empowerment, and spiritualism coupled with technical athletic fabrics (Lavrence &
Lozanski, 2014). Many have questioned the technical qualities of the brand arguing that the
products do not differ in from other brands in regards to innovative textiles and design (Peterson,
2014). Their products are more accurately defined as stylish athleisure-wear; and style is where
the brand excels. Products, like their famous yoga pants, claim to make the wearer look more
athletic by sculpting the legs and lifting the posterior. Along with attractive prints and a variety
of cuts, the products encourage women to wear the apparel from the gym to the wherever else
their daily routine may take them. However, the sheer yoga pant recall gaffe in 2013 beckoned
financial hardships for the company allowing Under Armour to overtake their position in the
market (Sullivan, 2014). Under Armour is now worth three times more than Lululemon. Only
three years ago, Lululemon was worth twice more than Under Armour (Schlossberg, 2015b).
1.5.2.3 Textiles
The activewear market has found itself responding quickly to the needs of consumers in
regards to the environment. The polar vortex weather phenomenon of late 2013 to early 2014 and

17
the following year’s harsh winter in the U.S. affected the majority of the country with extreme
low temperatures and unforgiving conditions. Euromonitor International (2015a) explained that
this in turn caused a great consumer need for apparel with high performance aspects in cold
weather from activewear companies; a need that may not have been a priority in previous years
for many Americans. In response, activewear companies have been manufacturing and selling
apparel that can meet this demand through elements such as sealed seams, water resistance,
temperature regulation, and anti-odor properties (Euromonitor International, 2015a). The use of
specialty textiles and strategic designs has allowed the creation of warm garments without added
bulk. (Euromonitor International, 2015a).
1.5.2.4 Sustainability
The activewear industry is prone to high levels of waste and emissions caused by high
consumption rates, short product lifecycles, and mass production. To combat this issue,
activewear companies can adopt sustainable practice business models to keep their
manufacturing process aligned with ethical and business norms. Key concerns still exist in the
manufacturing process when it comes to the process and the materials (Subic A, Shabani B,
Hedayati M, & Crossin E., 2012). Some companies have made great strides by introducing
products that are eco-friendly.
Environmental concern now drives much innovation within the apparel and textile
industry, including the activewear segment (Potts, 2015b). Potts (2015b) reported that legislative
actions in the U.S. and the European Union prevent the usage of certain harmful materials and
processes leading to the need for innovations in environmentally-friendly alternatives. She offers
the example of the elimination of perfluorinated chemicals (PFC); a chemical finishing used on

18
fabrics as a water repellent. After the ban on this chemical in the apparel industry, Potts explains,
Gore released the Gore-Tex C-knit Backer which uses layers comprised of a waterproof
membrane and knitted PFC-free textiles. They have also recently announced their intention to
invest US$15 million alternative materials. Similarly, The Chemours Company released the
PFC-free Teflon EcoElite finish for textiles (Potts, 2015b).
Learning from their previous public mishaps with corporate social responsibility (CSR),
Nike, along with most other activewear companies, publishes yearly reports detailing their CSR
activities. In their 2007-2009 report, Nike (2009) expresses a commitment to creating safe
environments for factory workers in manufacturing locations abroad and a continued exploration
into sustainable manufacturing. This represents a testament to the modern power of the suppliers
within the activewear industry. The manufacturing limitations placed as dictated by CSR and
sustainability practices on Nike, and other brands, commands the products that they can
manufacture and sell. This will dictate price and quality for Nike products.
1.6 Gaps in the Literature and Contributions of this Study
Little research has been conducted concerning the casual consumption of activewear. As
suggested by Chi and Kilduff (2011), future research is needed to explore purchase intentions for
casual activewear. This study could generate depth of knowledge and a greater understanding of
the consumers driving the success of the casual activewear trend. Information from this study
could be used by activewear companies to align marketing strategies to encourage more
purchases of casual activewear and to strengthen relationships with current consumers.

19
1.7 Purpose of this Study
Activewear is a booming apparel market which seeks to provide consumers with clothing
endowed with special characteristics in order to facilitate physical activity. This market is
important in its massive size to the apparel industry as $255.1 billion came from the activewear
sector in 2013 alone (Euromonitor International, 2014). However, despite reoccurring fitness-
inspired fashion trends, little is known about the consumer of casual activewear. The current
fashion craze of athleisure is centered on wearing activewear intended to be worn for physical
activity participation during non-active activities (Horton et al., 2016). This can account for the
recent $2 billion sales increase in the activewear segment from 2013 to 2014 in the U.S.
(Euromonitor International, 2015a). Despite this substantial growth, not much is known about
this influential consumer of casual activewear products and their purchasing intentions. This lack
of consumer identification and understanding within the activewear market is a potential pitfall
for apparel retailers and manufacturers. Failing to determine what influences a casual activewear
consumer’s intent to purchase can only result in a loss of potential profit due to the misguided
targeting and marketing strategies. This study proposes to determine what key factors influence
U.S. consumers’ purchase intensions of casual activewear leading to the behavior of purchase
and use. To investigate this, an empirical study of determinants using an extended TPB model as
the theoretical framework will be conducted. Information from study can be used by retailers and
brands to align marketing strategies to better service the consumer of casual activewear,
reinforce and encourage repeat behaviors, and strengthen the relationship between brands and
their consumers.

20
1.8 Definition of Terms
Activewear: Powered by fitness and worn by people participating in physical activity or sports
(Frings, 2008); Garments that are “specifically engineered to deliver a pre-defined performance
or functionality to the user, over and above its normal functions” (Gupta, 2011).
Attitude: A positive or negative response to an object or behavior which is the result of the
evaluation of outcomes (Ajzen, 1985)
Behavior: “[T]he manifest, observable response in a given situation with respect to a given
target” (Ajzen, 2006).
Casual activewear: Activewear purchased and worn primarily for casual/daily wear. Though
these garments can be worn for physical activity, their main use is casual.
Casualwear: A broad range of apparel at any price point worn for comfort and practicality
(Clemente, 2014); The act of dressing-down (Rubinstein 2001).
Intention: [A]n indication of a person's readiness to perform a given behavior, and it is
considered to be the immediate antecedent of behavior” (Ajzen, 2006).
Perceived behavioral control: The perceived barriers or facilitators to performing the behavior,
whether they are internal or external factors (Ajzen, 1991).
Sportswear: “[A]ny combination of tops and bottoms, such as jackets, skirts, pants, shorts,
blouses, and shirts, that are priced separately so that the customer can combine them as desired”
(Frings, 2008, p. 76).
Subjective norm: An individual’s perception of how other important figures in their lives, such
as family, friends, and peers, would want them to participate in the behavior (Ajzen, 1985).

21
CHAPTER TWO
LITERATURE REVIEW AND MODEL AND HYPOTHESIS DEVELOPMENT
2.1 Theoretical Foundation
2.1.1 Theory of Planned Behavior
As the goal of this study is to determine consumers’ intentions to purchase activewear for
casual use, a theoretical framework is needed to examine what factors govern human intentions.
This study utilizes one of the most well-known and used social psychology theories, the theory
of planned behavior (TPB) (Ajzen, 1985 & 1991), to examine the determinants of consumers’
purchase intentions of activewear for casual purposes which influence their future purchase
behavior. The prediction of behavior will not be examined in this study. This theoretical
framework and its myriad of variations are exceedingly popular amongst researchers in
numerous fields seeking to predict behavior through the identification of motivating factors of a
reasoned process (Knowles, Hyde & White, 2012; Lac, Crano, Berger & Alvaro, 2013; Norman,
2011; Yoon, 2011). Among these research fields, apparel, retailing, and consumer studies find
relevancy in the model to examine purchase intent and motivators (Cowan & Kinley, 2014; Kim
& Karpova, 2010; Kim & Trail, 2010; Norris & Myers, 2013). Related to activewear, physical
activity participation can also be examined through TBP (Bozionelos, & Bennett, 1999;
Chatzisarantis & Hagger, 2009; Rhodes, Courneya, & Hayduk, 2002). Building upon the
previous theory of reasoned action (Ajzen & Fishbein, 1980; Fishbein & Ajzen, 1975), Ajzen
(1991) explores the depth to which intention determines behavior. For without the intention to
perform a certain behavior, there can be no execution of the behavior (Ajzen, 1991). From
22
intention, we learn the degree of motivation one possesses to perform a behavior; their
willingness to attempt resulting in a greater chance to carry out the behavior.
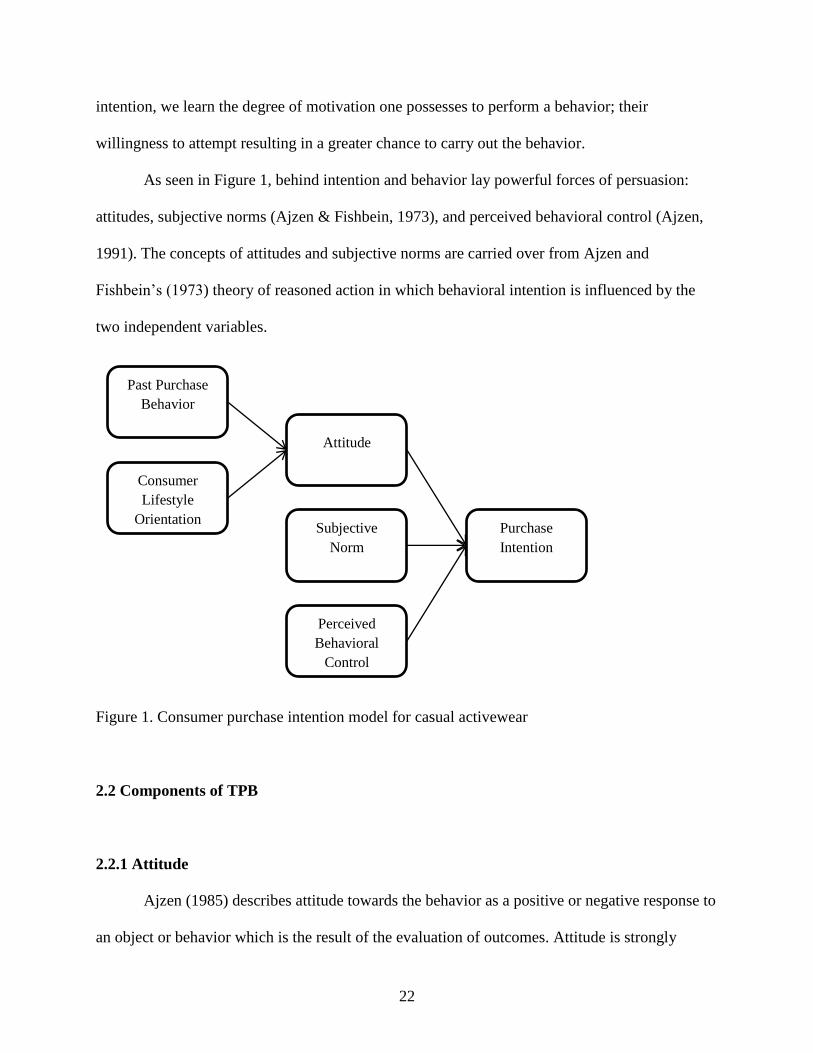
As seen in Figure 1, behind intention and behavior lay powerful forces of persuasion:
attitudes, subjective norms (Ajzen & Fishbein, 1973), and perceived behavioral control (Ajzen,
1991). The concepts of attitudes and subjective norms are carried over from Ajzen and
Fishbein’s (1973) theory of reasoned action in which behavioral intention is influenced by the
two independent variables.
Figure 1. Consumer purchase intention model for casual activewear
2.2 Components of TPB
2.2.1 Attitude
Ajzen (1985) describes attitude towards the behavior as a positive or negative response to
an object or behavior which is the result of the evaluation of outcomes. Attitude is strongly
Past Purchase
Behavior
Perceived
Behavioral
Control
Attitude
Subjective
Norm
Purchase
Intention
Consumer
Lifestyle
Orientation

23
related to behavior as supported by studies that focused on purchase intention of apparel and
footwear through the use of TPB, including attitude (Kim & Karpova, 2010; Wang, 2014; Yan,
Ogle, & Hyllegard, 2010). In a study of the footwear purchase intention of female Taiwanese
consumers, Wang (2014) found that attitude within the TPB framework significantly impacted
purchase intention. The author concluded that the retail atmosphere and environment when
purchasing shoes may affect a consumer’s intent to purchase shoes. The research of Kim and
Karpova (2010) concerning consumers’ purchase intention of counterfeit goods primarily
focused on attitudes as a determinant, which proved to be positively related to purchase intent.
Attitude was significantly influenced by product appearance, value-consciousness, and past
purchase behavior; past purchase behavior will be discussed in the extended model of this study.
Yan, Ogle, and Hyllegard (2010) investigated the purchase intentions and attitudes of Generation
Y consumers toward American Apparel as influenced by message appeal and sources. They
discovered through their study that participants held positive attitudes and an increased intention
to purchase American Apparel products when exposed to messages containing fair labor appeals.
Females in their study described more positive attitudes towards the brand and its advertisements
containing fair labor appeals than male participants. In this study, consumers may hold positive
attitudes towards the consumption of activewear for casual purposes which could increase their
intention to purchase as seen in the following hypothesis:
H1: There is a significantly positive relationship between U.S. consumers’ attitude
toward casual activewear purchase and their intention to purchase casual activewear.

24
2.2.2 Subjective Norm
Subjective norm reflects an individual’s perception of how other important figures in
their lives, such as family, friends, and peers, would want them to participate in the behavior
(Ajzen, 1985). With the growing popularity of the athleisure trend in mainstream fashion, it is
reasonable to assume in this study that consumers will feel the need to conform to the current
fashion trends through the purchase of activewear for casual purposes. Empirical research has
found that purchase intention of apparel can be effectively explained through subjective norm
(Budiman & Wijaya, 2014; Jabari, Othman, & Mat, 2012; Jin & Kang, 2011; Kalafatis, Pollard,
East, & Tsogas, 1999; Yan, Hyllegard, & Blaesi, 2012) In addition to following the rise of the
athleisure trend, consumers may feel pressured by society’s positive perceptions of individuals
who are physically active and subsequently purchase casual activewear to project an athletic
image to others. As found in Martin, Sinden, and Fleming’s (2000) study, people who identify as
regular participators in physical activity are regarded more favorably by others. Their findings
hold relevance to our study as it is probable that consumers seek approval from important people
and groups in their lives through the projection of an athletic image. The consumption of casual
activewear may facilitate the projection of said image. Another study conducted by Jabari et al.
(2012) determined subjective norms significantly impacted Jordanian consumers’ intention to
shop online. Data for this study was collected from the staff of multiple Jordanian universities
and recorded using self-administered questionnaires containing 7-point Likert scales. From the
collection of this data, they concluded that online purchase behavior is more likely to be
influenced by family, friends, and peers rather than positive attitudes. Thus, I propose hypothesis
2 below:

25
H2: There is a significantly positive relationship between U.S. consumers’ subjective
norm and their intention to purchase casual activewear.
2.2.3 Perceived Behavioral Control
Perceived behavioral control (PBC) accounts for the perceived barriers or facilitators to
performing the behavior, whether they are internal or external factors (Ajzen, 1991). PBC can
also have a direct influence of behavior, bypassing intention, as the behavior may not be under
volitional control of the individual (Ajzen, 1991). If one lacks the resources (money, time,
information, etc.) or the self-confidence to perform a behavior, the intent is largely valueless.
However, this study does not seek to observe behavior. In empirical research studies, purchase
intention has been found to positively relate to PBC (Jin & Kang, 2010; Shim, Estlick, Lotz, &
Warrington, 2001). In this study, we may observe consumers who hold a positive attitude
towards casual activewear, but feel that they lack the money to afford such products or they feel
that their lifestyle does not support the use of the products effectively dissuading their intention
to purchase. Additionally, consumers’ lack of self-confidence as a result negative body-image
may inhibit their intention to purchase casual activewear if they are unwilling to wear clothing
that is close-fitting to the body or does not adhere to their self-image. Wasilenko, Kulik, and
Wanic (2007) observed similar avoidance behavior in women with low body-satisfaction who
exercised less often than women with high body-satisfaction. The amount of social distance one
feels between those who dress in athletic styles and themselves may also be a significant
influencer in the observation of PBC (St-James, de Man, & Stout, 2006). St-James et al. (2006)
observed that this can manifest as a desire to not identify with athletes due to perceived negative
characteristics and stereotypes an individual holds against the social group. A consumer’s

26
acceptance of negative stereotypes of athletes may be a barrier to the intention to purchase casual
activewear because of their unwillingness to identify with the athletic social group making
adoption of activewear more difficult. Consequently, I propose hypothesis 3 below:
H3: There is a significantly positive relationship between PBC and U.S. consumers’
intention to purchase casual activewear.
2.3 Expanding the TPB Model
The TPB model is, in some cases, found lacking in its multidimensionality and requires
an expansion to the classic variables when investigating purchase intention of apparel (Cowan &
Kinley, 2014; Kim & Karpova, 2010; Ling, 2009; Muzaffar, 2015). Ajzen (1991) details that the
model is open to elaboration with the presence of important identifiable variables by saying that,
“The theory of planned behavior is, in principle, open to the inclusion of additional predictors if
it can be shown that they capture a significant proportion of the variance in intention or behavior
after the theory’s current variables have been taken into account” (p. 199). To best determine
what influences U.S. consumers’ purchase intention of casual activewear, an expanded model
will be necessary.
2.3.1 Past Casual Activewear Purchase Behavior
Past behavior is arguably a significant determinant in future behaviors (Ajzen, 1991;
Connor & Armitage, 1998). Numerous studies employ the use of past behaviors as an influence
on attitudes and a predictor for behavior intention (d’Astous, Colbert, & Montpetit, 2005; Kim &
Karpova, 2010). To elaborate, past behavior is the execution of a behavior or reaction to overt or
covert stimuli in the past (Sommer, 2011). d’Astous, Colbert, and Montpetit (2005) found that

27
consumers tend to use their previous experiences in performing a behavior to justify their
decision to perform again. They believe that attitudes are defined by the information drawn from
past experiences. A study which examined consumers’ purchase intention of fashion counterfeit
goods, researchers Kim and Karpova (2010) found that those who had previous experience in
purchasing fashion counterfeit goods held more positive attitudes towards the behavior of
purchasing those products. The authors also described the purchases as habitual due to the
reoccurrence of the behavior. Dean, Raats, and Shepherd (2012) found that in a study of 499
participants, past behavior predicted the purchase behavior of organic food. Similarly, a study
conducted by Knowles, Hyde, and White (2012) was able to identify past behavior as a strong
indicator of future donations given to charity by young people. In the realm of fashion, U.S.
college student were found to be more willing to purchase fashion counterfeit products in the
future based off of previous purchases (Lee, 2009). These college students were generally more
fashion-conscious and experienced higher intention to repeat their purchases in the future than
students who had not purchased counterfeit products in the past (Lee, 2009). Hypothesis 4
relating to past purchases is as follows:
H4: There is a significantly positive relationship between past purchase behavior of
casual activewear and U.S. consumers’ attitude towards casual activewear.
2.3.2 Consumer Lifestyle Orientation
Behavior models can be enhanced with the inclusion of the concept of lifestyle with
consideration to personal characteristics, society, habits, and value (Kucukemiroglu, 1999).
Bourdieu (1984) discussed in his book Distinction: A Social Critique of the Judgment of Taste
how lifestyle results from sophisticated actions rather than by random and reckless actions. He

28
believed that the constitution of the individual is greatly related to consuming behaviors, which
forms the lifestyle and tastes of the individual. This lends itself to the formation of consumer
segmentations through the identification of differences relative to others.
Individuals with strong health values place a higher level of importance on exercise and
are more willing to accept exercise behavior (Bephage, 2000). Moreover, individuals who highly
value exercise and wellness behaviors are more likely to adopt visual symbols of dress in order
to project the lifestyle to others (St-James et al., 2006). Those with a higher regard for a
wellness-based lifestyle are more likely to wear activewear in daily life than consumers without
this lifestyle regard. Health consciousness has been found to motivate consumption as seen in
First and Brozina’s (2001) study which examined cultural differences in West European
countries and their impact on organic food consumption. Though cultural elements were found to
vary between participants, they identified health as the most influential factor for consumption.
A study (Honkanen, Verplanken, & Olsen, 2006) conducted on Norwegian consumers observed
environmental consciousness as a powerful influencer in the consumption of organic food.
Positive attitudes towards a behavior are determined in part by concerns over an issue, such as
personal health. The importance that an individual places on the value of participation in
physical activity could hold influence over the consumption of activewear. Unlike health-
consciousness manifested through diet, the effect of health-consciousness expressed through
physical activity has not been well investigated by studies.
In a study aimed to predict consumers’ intentions to shop in sustainable retail
environments, Ogle, Hyllegard, and Dunbar (2004) employed the use of consumer lifestyle
orientation as a variable in an extended model of the Theory of Reasoned Action. Consumer
lifestyle orientation, a variable influencing attitude, measured participation in outdoor activities,

29
degree of involvement in outdoor recreational activities, outdoor organization membership,
membership in a retailer’s consumer cooperative, and past purchase behavior from the retailer
(Ogle et al., 2004). Participants from their study chose activities from a provided list and
completed a self-rating questionnaire which, after analysis, determined that consumer lifestyle
orientation was positively related to intention to shop in sustainable retail stores.
Similar to the study conducted by Ogle et al. (2004), Kraft and Goodell (1993)
determined that consumer lifestyle orientation is an important factor when investigating health
related behaviors. In an effort to provide clarity in health and wellness studies, Kraft and Goodell
(1993) developed a wellness scale to construct psychographic profiles for market segmentation.
They believe that lifestyle has a significant impact on attitude towards health-related behaviors
because those who are currently proactive in their health would have a more positive outlook on
healthy behaviors. The wellness scale measures personal health attitudes and behaviors through
the dimensions of health environment sensitivity, physical fitness, personal health responsibility,
and nutrition and stress management (Kraft & Goodell, 1993). The authors believe that the
orientation towards a health-conscious lifestyle is indicative of consumption preferences and
subsequently recommend that the scale be used for future studies regarding health-related
products. Therefore, the dimensions of this scale will be used explore consumer lifestyle
orientation in this study. Our study will employ this approach to observing the relationship
between lifestyle and attitude towards the purchase of casual activewear as seen in the hypothesis
below:
H5: There is a significantly positive relationship between the consumer lifestyle
orientation and U.S. consumers’ attitude towards casual activewear.

30
2.4 Proposed Research Model
The proposed conceptual model (presented in Figure 2) developed from the literature
review reflects the hypothesized relationships between the variables.
Figure 2. Research framework
Past Purchase
Behavior
Perceived
Behavioral
Control
Attitude
Subjective
Norm
Purchase
Intention
Consumer
Lifestyle
Orientation
H1
H2
H3
H4
H5
31
CHAPTER THREE
METHODOLOGY
This chapter explains the research methodology used in this study. It includes the
research model, the sampling plan and data collection procedure, constructs and scales, and
statistical analysis method.
3.1 Sampling Plan and Procedure
For this research, a quantitative study using a survey was used to distribute an online
questionnaire instrument deployed through Amazon Mechanical Turk. Deploying the
questionnaire in such a manner will allow me to capture consumers who consume activewear for
casualwear purposes with a wide array of demographic variables including age, ethnicity, income
level, education level, and gender.
The questionnaire was pre-tested by 10 U.S. consumers. These consumers were asked to
complete the questionnaire and provide an evaluation and assessment of the contents. Based on
their feedback, minor revisions were made. This preliminary study was used to ensure that the
content and quality of the questionnaire was appropriate for this research study. Based on
preliminary study results, the flow and sequence of questions were evaluated for efficiency.
3.2 Survey Questionnaire Development
The questionnaire was constructed to include both questions to gather demographic
information and information related to the constructs of attitudes, past purchase behavior,

32
consumer lifestyle orientation, subjective norms, perceived behavioral control, and purchase
intention.
3.2.1 Demographics
The demographic variables presented in the questionnaire include gender, ethnicity, age,
education level, annual discretionary income, and annual expenditure on casual activewear.
3.2.2 Scales for Investigated Constructs
For each construct, multiple questions (i.e., measurement items) are adapted from prior
relevant studies (e.g., Ajzen, 2013). Five-point Likert scales ranging from “Strongly disagree=1”
to “Strongly agree=5” are often used for constructs related to TPB (Niaura, 2013; Stanec, 2009).
Five-point Likert scales are also be used for expanded TPB components of past purchase
behavior and consumer lifestyle orientation (Chaudary, Ahmed, Gill, & Rizwan, 2014; Kraft &
Goodell, 1993; Sparks & Shepherd, 1992; Tom, Garibaldi, Zeng, & Pilcher, 1998).Participants
were asked to select the number located on the scale that best represents their opinions, feelings,
and experiences.
3.2.3 Theory of Planned Behavior
With reference to the questionnaire constructed by Ajzen (2013), survey items is stated
thusly as seen in following examples and measured with five-point scales. For the construct of
attitude, five-point scales ranging from 1= “strongly disagree” to 5= “strongly agree” adapted
from previous studies (Khalek & Ismail, 2015; Kim & Karpova, 2010; Zheng, 2013) will record
the following items: 1) Purchasing casual activewear for me would be a good idea; 2) I like the

33
idea of purchasing casual activewear; 3) I have a favorable attitude toward the behavior of
purchasing casual activewear. Reliability will be verified by computing the Cronbach’s alpha.
The Cronbach’s alpha values for attitude items from previous studies all met a minimum apha of
0.7 as suggested by Nunally (1978): 0.883 (Khalek & Ismail, 2015); 0.92 (Kim & Karpova,
2010); 0.882 (Zheng, 2013). From measurement scales adapted from Fitzmaurice (2005) and
Khalifa and Shen (2008), subjective norms will be measured by five-point Likert at 1= “strongly
disagree” to 5= “strongly agree”. Subjective norms items from Khalifa and Shen (2008) met a
Cronbach’s alpha of 0.897. The measurement items include: 1) Most people important to me
think that I should purchase casual activewear; 2) Close friends and family think that it is
acceptable for me to purchase casual activewear; 3) People I listen to could influence me to
purchase casual activewear.
PBC is measured through the following items by five-point Likert scales (1= “strongly
disagree” to 5= “strongly agree”), which are adapted from Kim and Karpova (2010) and Hansen,
Jensen, and Solgaard (2004). In previous studies, construct reliability for this item was found to
meet Cronbach’s alpha values of 0.67 (Kim & Karpova, 2010) and 0.76 and 0.77 for Hansen at
al.’s (2004) study containing two surveys. The measurement items include: 1) In general,
shopping for casual activewear is difficult; 2) It is hard to find the products I want when
shopping for casual activewear; 3) I have the resources to purchase casual activewear; 4) If I
want to, I have complete control of purchasing casual activewear.
To measure purchase intention, statements adapted from Huang, Lee, and Ho (2004) are
presesnted. The measurement items will be captured by five-point scales of “1= strongly
disagree” to “5= strongly agree”. In the 2004 study by Huang et al., the authors measured the
purchase intention towards three different products (beverages, watches, and mobile phones) and

34
determined their Cronbach’a alphas for the items to be 0.92 (beverage), 0.90 (watch), and 0.95
(mobile phone). These items are: 1) I would purchase casual activewear; 2) The probability that I
would consider buying casual activewear is low. 3) I would consider buying casual activewear.
In the extended model of the TPB, the past purchase behavior and consumer lifestyle
orientation variables are also represented in the survey. Five statements adapted from Kraft and
Goodell’s (1993) wellness scale and Sparks and Shepherd’s (1992) organic food consumption
study will be used to operationalize consumer lifestyle orientation and measured with five-point
Likert scales where 1= “strongly disagree” and 5= “strongly agree”. Kraft and Goodell’s (1993)
five-point Likert wellness scale was tested in four separate studies which resulted in Cronbach’s
alpha scores ranging from 0.78-0.86. This proved the scale’s reliability. Sparks and Shepherd’s
consumer lifestyle orientation scale regarding green consumerism met a Cronbach’s alpha of
0.80. From both Kraft and Goodell (1993) and Sparks and Shepherd’s (1992) studies, it was
recommended that the wellness scale meet a minimum Cronbach’s alpha of 0.7. The items for
this scale are as follows: 1) I am concerned about my health all the time; 2) I try to exercise at
least 30 minutes a day, 3 days each week; 3) I believe that the “wellness” idea is a fad; 4) My
daily meals are nutritionally balanced; 5) I think of myself as a health-conscious consumer.
The extent of past casual activewear consumption will be measured and operationalized
with regard to the frequency performance. Using scales adapted from Eastlick and Lotz (1999)
and Sun (2014), five-point Likert scales ranging from “Never =1”, “Once or twice=2”, “Several
times a year=3”, “Several times a month=4”, and “Several times a week=5” will address the
following items: 1) How often do you purchase activewear apparel products with the intention of
wearing them outside of exercise environments (not including footwear)?; 2) How often do you
wear activewear outside of exercise environments? Research by Sun (2014) met a Cronbach’s

35
alpha of 0.758 for the author’s items measuring Chinese consumers’ past shopping experience.
The item of U.S. consumer’s past shopping experience with a low Cronbach’s alpha of 0.51 were
considered a poor value and were dropped.
3.3 Pilot Test of Survey Instrument
The survey instrument was pretested by 10 U.S. consumers. The pretest respondents
were asked to answer the questions and then evaluate the contents individually. The revision
after pretest included layout improvements and specific wording refinement.
3.4 Statistical Analysis Methods
The statistical assumptions tested include multivariate normality, multicollinearity, and
correlation. To meet the assumption of multivariate normality, each variable must have normal
sample distribution which is visible in a bell-shape distribution within a graph. In addition to the
observation of the index values of univariate distributions, skewness and kurtosis are also
calculated for each variable. Results for skewness and kurtosis should fall between -2.0 and +2.0
to verify sufficient normality of the distribution (George & Mallery, 2010). A violation of the
normality assumption occurs when the results exists outside of this aforementioned range.
Multicollinearity occurs in the presence of high inter-correlations among two or more predictor
variables in the multiple regression model. Linear dependency among the independent variables
can occur when these variables measure the same phenomena and subsequently, one variable can
be predicted from the other with little inaccuracy. To test for multicollinearity among the
predictor variables, variance-inflation factor (VIFj) and tolerance were applied. In order to
indicate that no multicollinearity problem occurs, the multicollinearity statistics should

36
demonstrate that the dependent variables’ tolerance indicators should all be greater than 0.1, and
their VIFj values should be less than 5.0 (Marquardt, 1970; Neter, Wasserman, & Kutner, 1989;
O’Brien, 2007).
To examine the relationship between the variables, Pearson correlation analysis was
conducted. To avoid multicollinearity, the correlation coefficient value (r) should not exceed 0.8
(Katz, 2006). The between-variables correlation strength of relationship can be categorized as
low (r = 0.10 to 0.29), moderate r = (0.30 to 0.49), or high (r = 0.50 to 1.0) (Cohen, 1988). The
constructs of the proposed model will be tested in terms of unidimensionality, reliability, and
construct validity (both convergent and discriminate).
Extraction criterion for factor analysis was set at an eigenvalue greater than 1.0. Items
with factor loading values lower than 0.50 were dropped (Hair, Tatham, Anderson, & Black,
1998). Factor loadings, coefficient alpha, item-to-total correlations, and factor structure were
reviewed again upon the removal of selected measurement variables (Chi, Kilduff, & Gargeya,
2009). The aforementioned frequentative procedure is repeated until all necessary requirements
are met.
Model adequacy was proven through the testing of unidimensionality, reliability,
convergent validity, and discriminant validity. First, unidimensionality is defined by the presence
of one underlying measurement construct which accounts for variation in participants’ responses
(Chong, Osborn Popp, DiGangi, & Jannasch-Pennell, 2007). Next, Cronbach’s alpha, a
coefficient of internal consistency, was used to estimate the reliability of the psychometric
instrument for a sample of participants (Tavakol & Dennick, 2011). Third, the parameter of
convergent validity identifies the degree to which the indicators of a construct share a high
proportion of variance (Guo, Aveyard, Fielding, & Sutton, 2008). To ensure convergent validity

37
is valid, the Average Variance Extracted (AVE) scores for all latent constructs should exceed the
threshold of 0.50 (Hair, Black, Babin, Anderson, & Tatham, 2005). Indicator variance can be
more accurately interpreted by latent variables when a larger AVE is present (Hair et al., 2005).
The AVE score will convey the amount of variation that can be accounted for among the items
represented by average percent. Lastly, discriminant validity indicates the uniqueness of a
construct in comparison to other constructs. Constructs should be distinctly different from each
other. The two latent constructs’ squared correlation will be compared to the AVEs. Upon doing
so, it should be apparent that the squared correlation is less than the AVEs which assures
discriminant validity (Alumran, Hou, Sun, Yousef, & Hurst, 2014).
Once the adequacies of all constructs are demonstrated, the average score of the multi-
items for each construct were computed and used in multiple regression analysis (Wang &
Barnes, 2007). To minimize the volume of linear constructs and non-linear construct measures in
a model, the use of single indicants for constructs in the model has been recommended by many
scholars (Cadogan, Cui, Morgan, & Story, 2006; Chi & Sun, 2013; Cohen, Cohen, West, &
Aiken, 2003; Kline, 2011; Wang & Barnes, 2007). Multiple regression analysis was applied to
analyze the relationship (i.e., the proposed hypotheses) between the dependent variable and
investigated independent variables. SPSS software was used for statistical analysis including
assumption tests, model adequacy analysis, and multiple regression analysis.

38
CHAPTER FOUR
RESULTS AND DISCUSSIONS
This section provides the data analysis results and discussions, which includes three parts.
The first part describes the demographic information of the survey respondents. The second part
explains the examination of statistical assumptions and psychometric properties of investigated
latent constructs and variables. Finally, the third part presents and discusses the results of
hypothesis testing.
4.1 Description of Demographic Information
A total of 146 eligible responses were collected by online survey in the U.S.
(www.mturk.com). The profile of survey respondents is presented in Table 1. Among 146
respondents, 41.8% were female and 58.2% were male. The ages of the respondents varied from
20 years old to over 60 years old, with 14.4% ranged from 20 years old to 25 years old, 29.5%
ranged from 26 years old to 30 years old, 22.6% ranged from 31 years old to 35 years old, 10.3%
ranged from 36 years old to 40 years old, 11.0% ranged from 41 years old to 45 years old, 4.1%
ranged from 46 years old to 50 years old, 4.8% ranged from 51 years old to 55 years old, 2.6%
ranged from 56 to 60 years old, and 0.7% were over 61 years old. Most of the respondents had
the education level of some college (42.5%) and bachelor’s degree (48.5%), followed by
master’s degree (6.2%), doctorate degree (1.4%) and others (1.4%). 17.8% of the respondents’
personal pre-tax income ranged from $15,000 to $24,999, followed by $35,000 to $49,999
(17.2%), $25,000 to $34,999 (17.1%), $50,000 to $74,999 (15.8%), $75,000 or higher (13.0%),
$10,000 to $14,999 (6.8%), $5,000 to $9,000 (6.8%), and less than $5,000 (5.5%). Most of the

39
respondents were Caucasian (72.6%), followed by Asian and Pacific islanders (15.6%), African
American (5.5%), Hispanic and Latino (4.8%), and others (1.5%).
Table 1. Demographic information of the survey respondents
Note: total eligible responses are 146.
4.2 Assumption Examinations and Factor Analysis
The normality and multicollinearity of investigated constructs were first examined. First,
skewness and kurtosis were used to examine the normality assumption. Skewness is an indicator
used in distribution analysis as a sign of asymmetry and deviation from a normal distribution.
Kurtosis is an indicator used in distribution analysis as a sign of flattening or peakedness of a
distribution (George & Mallery, 2003). With multivariate statistics, the assumption is that the
combination of variables follows a multivariate normal distribution. Since there is not a direct
test for multivariate normality, we generally test each variable individually and assume that they
Percentage Percentage
Gender Age
Male 58.2% 20-25 14.4%
Female 41.8% 26-30 29.5%
Education Level 31-35 22.6%
Some college 42.5% 36-40 10.3%
Bachelor’s degree 48.5% 41-45 11.0%
Master’s degree 6.2% 46-50 4.1%
Doctorate 1.4% 51-55 4.8%
Others 1.4% 56-60 2.6%
Personal annual income level
(before taxation)
>61 0.7%
<$5,000 5.5% Ethnicity
$5,000-$9,999 6.8% Caucasian 72.6%
$10,000-$14,999 6.8% African American 5.5%
$15,000-$24,999 17.8% Asian, Pacific islanders 15.6%
$25,000 - $34,999 17.1% Hispanic, Latino 4.8%
$35,000 - $49,999 17.2% Others 1.5%
$50,000 - $74,999 15.8%
$75,000 and more 13.0%

40
are multivariate normal if they are individually normal. A variable is considered as normal
distribution if its skewness and kurtosis have values between –2.0 and +2.0 (George & Mallery,
2010). The skewness and kurtosis results met this criterion. Therefore, normality assumption is
not violated.
The variance inflation factor was used to examine multicollinearity that occurs when
two or more independent variables in a regression model are highly correlated to each other. A
commonly used test for multicollinearity is to conduct “artificial” regressions between each
independent variable (as the “dependent” variable) and the remaining independent variables.
Variance Inflation Factors ( ) are calculated as:
value of 5.0 and above indicates a multicollinearity problem (O’brien, 2007). The
of all constructs and variables are below 2.0 in the survey responses collected. Therefore,
there is no multicollinearity problem among constructs and variables.
Factor analysis using varimax rotation method was run. All the factor loadings of the
measurement variables to their respective latent constructs were high (0.500 and higher) and
statistically significant, while their loadings to other constructs were low (0.400 and lower) as
seen in Table 2. This also established the evidences of unidimensionality for the investigated
latent constructs.
Table 2. Constructs and corresponding measures and scales
Construct Measure and Scale [Factor Loading] Source
Attitude (A)
Five-point Likert scale (from “Strongly disagree=1” to
“Strongly agree=5”.)
A1: Purchasing casual activewear for me would be a good
idea. [0.789]
Kim and
Karpova (2010)

41
A2: I like the idea of purchasing casual activewear. [0.787]
A3: I have a favorable attitude toward the behavior of
purchasing casual activewear. [0.773]
& Zheng
(2013)
Subjective
Norm (SN)
SN1: Most people important to me think that I should
purchase casual activewear. [0.652]
SN2: Close friends and family think that it is acceptable for
me to purchase casual activewear. [0.719]
SN3: People I listen to could influence me to purchase
casual activewear. [0.777]
Fitzmaurice
(2005)
Perceived
Behavioral
Control (PBC)
PBC1: In general, shopping for casual activewear is
difficult. R [0.844]
PBC2: It is hard to find the products I want when shopping
for casual activewear. R [0.808]
PBC3: I have the resources to purchase casual activewear.
[0.676]
PBC4: If I want to, I have complete control of purchasing
casual activewear. [0.828]
Kim and
Karpova (2010)
Consumer
Lifestyle
Orientation
(L)
L1: I am concerned about my health all the time. [0.565]
L2: I try to exercise at least 30 minutes a day, 3 days each
week. [0.650]
L3: I believe that the “wellness” idea is a fad. R [0.600]
L4: My daily meals are nutritionally balanced. [0.822 ]
L5: I think of myself as a health-conscious consumer.
[0.861 ]
Kraft and
Goodell (1993)
& Sparks and
Shepherd
(1992)
Purchase
Intention (PI)
PI1: I would purchase casual activewear. [0.739]
PI2: The probability that I would consider buying casual
activewear is low. R [0.671]
PI3: I would consider buying casual activewear. [0.744]
Huang, Lee,
and Ho (2004)
Past Purchase
Behavior (PB)
Five-point Likert scale Never =1, Have once or twice=2,
Several times in the past 6 months=3, Several times a
MONTH=4, Several times a WEEK=5)
PB1: Over the past 6 months, how often have you
purchased casual activewear?
Chaudary et al.
(2014)
Note: (R) - reverse measures. The factor loading of each measure to its latent construct is
provided in parenthesis.
4.3 Model Adequacy Examinations
Unidimensionality, reliability, convergent validity, and discriminant validity were tested
for proving model adequacy. First, unidimensionality refers to the existence of one underlying
measurement construct (dimension) that accounts for variation in examinee responses. Second,
Cronbach's alpha is a coefficient of internal consistency. It is commonly used as an estimate of
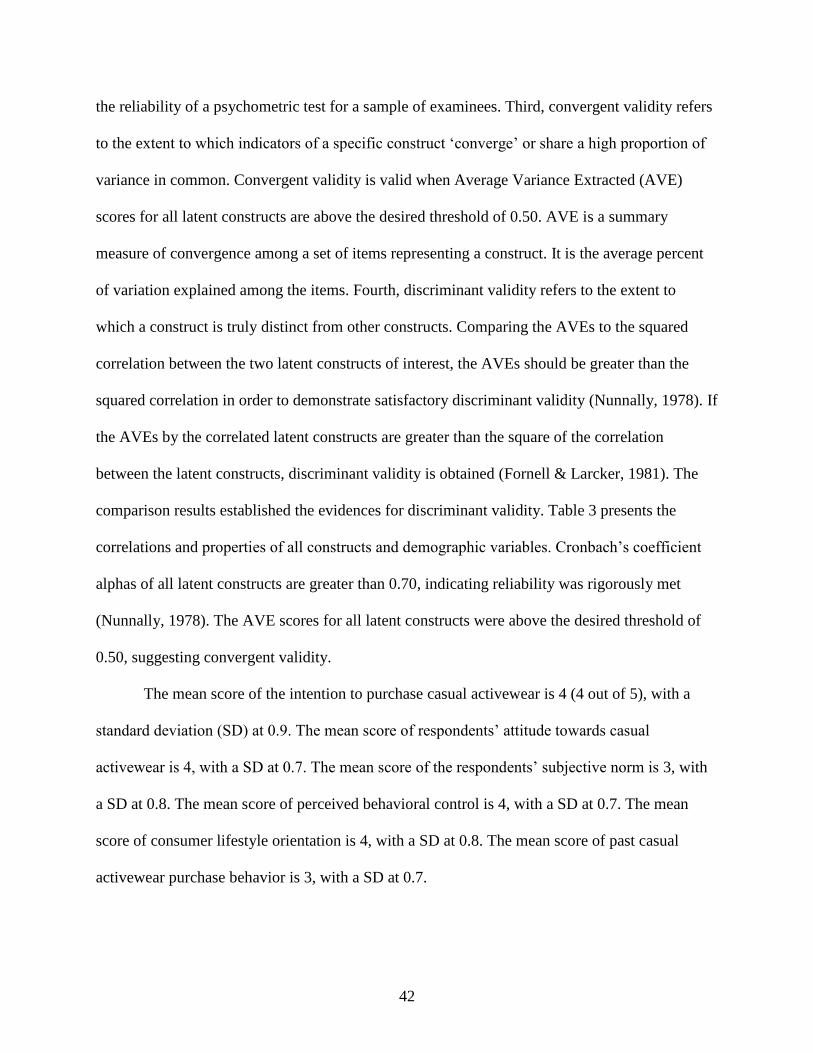
42
the reliability of a psychometric test for a sample of examinees. Third, convergent validity refers
to the extent to which indicators of a specific construct ‘converge’ or share a high proportion of
variance in common. Convergent validity is valid when Average Variance Extracted (AVE)
scores for all latent constructs are above the desired threshold of 0.50. AVE is a summary
measure of convergence among a set of items representing a construct. It is the average percent
of variation explained among the items. Fourth, discriminant validity refers to the extent to
which a construct is truly distinct from other constructs. Comparing the AVEs to the squared
correlation between the two latent constructs of interest, the AVEs should be greater than the
squared correlation in order to demonstrate satisfactory discriminant validity (Nunnally, 1978). If
the AVEs by the correlated latent constructs are greater than the square of the correlation
between the latent constructs, discriminant validity is obtained (Fornell & Larcker, 1981). The
comparison results established the evidences for discriminant validity. Table 3 presents the
correlations and properties of all constructs and demographic variables. Cronbach’s coefficient
alphas of all latent constructs are greater than 0.70, indicating reliability was rigorously met
(Nunnally, 1978). The AVE scores for all latent constructs were above the desired threshold of
0.50, suggesting convergent validity.
The mean score of the intention to purchase casual activewear is 4 (4 out of 5), with a
standard deviation (SD) at 0.9. The mean score of respondents’ attitude towards casual
activewear is 4, with a SD at 0.7. The mean score of the respondents’ subjective norm is 3, with
a SD at 0.8. The mean score of perceived behavioral control is 4, with a SD at 0.7. The mean
score of consumer lifestyle orientation is 4, with a SD at 0.8. The mean score of past casual
activewear purchase behavior is 3, with a SD at 0.7.

43
Table 3. Correlations and properties of all constructs and demographic variables
Attitude SN PBC L PB PI Age Gender Ethnicity Education Income
Attitude 1 .387**
.407**
.443**
.172* .644
** .299
** -.191
* .054 .111 .198
*
SN .150 1 .094 .311**
.108 .267**
-.044 .040 .023 -.107 .136
PBC .166 .012 1 .350**
-.024 .534**
.141 -.049 069 .098 .234*
L .196 .097 .123 1 .119 .454**
.046 -.099 -.035 .181 281**
PB .030 .012 .001 .014 1 -.045 -.083 -.017 .025 .078 .144
PI .415 .071 .285 .206 .002 1 240**
-.136 -.058 .132 .242**
Age - - - - - - 1 -.231**
-.170* .229
** .090
Gender - - - - - - - 1 .122 .019 .111
Ethnicity - - - - - - - - 1 -.046 .097
Education - - - - - - - - - 1 .274**
Income - - - - - - - - - - 1
Mean 4 3 4 4 3 4 - - - - -
S.D. .7 .8 .7 .8 .7 .9 - - - - -
Cronbach's alpha .814 .726 .702 .723 - .771 - - - - -
AVE .613 .520 .630 .504 .531 .517 - - - - -
Skewness -.706 .281 -.298 -.163 .522 -.394 - - - - -
Kurtosis .787 .069 .036 .002 .451 -.509 - - - - -
VIF 1.810 1.325 1.323 1.469 1.092 - 1.313 1.138 1.003 1.202 1.261
Note: **. Correlation is significant at the 0.01 level (2-tailed). *. Correlation is significant at the 0.05 level (2-tailed).
PI- Purchase Intention, SN- Subjective Norm, PBC –Perceived Behavioral Control, L –Consumer Lifestyle Orientation.

44
4.4 Hypothesis Testing Results and Discussion
Once the adequacies of all latent constructs were demonstrated, the proposed hypotheses
were tested using multiple regression technique. A single score was obtained for each latent
construct by averaging across the measurement items. The proposed hypotheses (H1-H5) in the
model were tested.
Table 4 presents the results of hypothesis testing. Four out of five proposed hypotheses
were proven statically significant at p<0.05 level. The results showed that consumer intention to
purchase casual activewear was significantly affected by their attitude (β=0.472, t=6.254),
perceived behavioral control (PBC) (β=0.321, t=4.872), but not by subjective norm (SN)
(β=0.052, t=0.779). The effects of demographic variables on consumer intention to purchase
casual activewear were all insignificant at p<0.05 level. Thus, H1 and H3 were supported while
H2 was rejected. This indicates that US consumers are more likely to purchase activewear for
casual purpose when they show positive attitude towards wearing activewear outside of exercise
environments. Increasingly perceived control of the resources (e.g., money, time, information)
towards casual activewear consumption and the self-confidence to wearing activewear outside of
exercise environments lead to US consumers’ higher willingness to purchasing casual
activewear. In contrast, individual’s perceived opinions of other important figures in their lives
(e.g., family, friends, and peers) towards casual activewear consumption does not significantly
affect their own decision on purchasing casual activewear. The model exhibits a high
explanatory power for US consumer purchase intention towards casual activewear, collectively
accounting for 52.4% variance in the purchase intention (R2=52.4%).
Hypotheses H4 and H5 tested the impacts of consumer past purchase behavior (PB) and
lifestyle orientation (L) on their attitude towards purchasing casual activewear. Both past

45
purchase behavior (PB) and lifestyle orientation (L) significantly affect US consumers’ attitude
towards purchasing casual activewear (β=0.141, t=3.968; β=0.4011, t=5.378 respectively). Thus,
H4 and H5 were supported. The previous experience in purchasing casual activewear positively
affects US consumer attitude towards wearing activewear for casual purpose. Also, individuals
who place a higher level of importance on health value and exercise are more likely to show a
positive attitude towards wearing activewear outside of exercise environments. The effects of
demographic variables on consumer attitude towards wearing casual activewear were all
insignificant at p<0.05 level except age. Age shows a positive effect on consumer attitude
towards wearing casual activewear (β=0.296, t=4.911). The model shows a good explanatory
power for US consumer attitude towards purchasing casual activewear, collectively accounting
for 32.1% variance in US consumer attitude towards purchasing casual activewear (R2=32.1%).
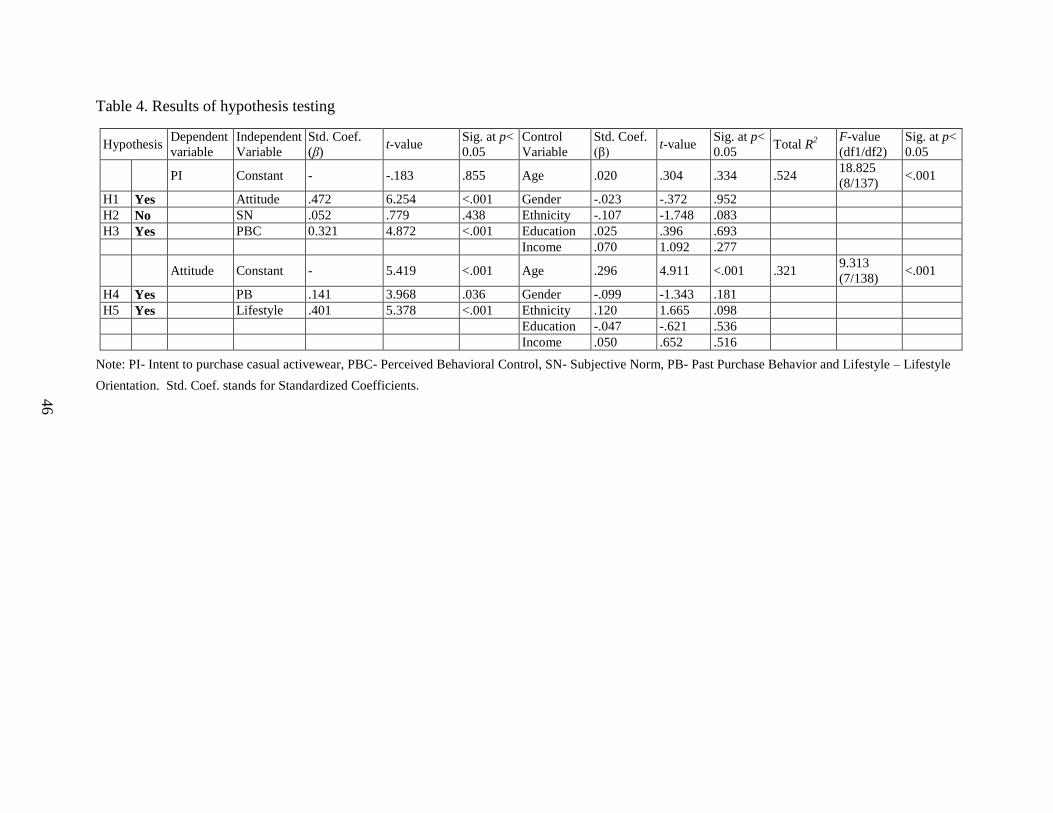
46
Table 4. Results of hypothesis testing
Hypothesis Dependent
variable
Independent
Variable
Std. Coef.
(β) t-value
Sig. at p<
0.05
Control
Variable
Std. Coef.
(β) t-value
Sig. at p<
0.05 Total R
2
F-value
(df1/df2)
Sig. at p<
0.05
PI Constant - -.183 .855 Age .020 .304 .334 .524 18.825
(8/137) <.001
H1 Yes Attitude .472 6.254 <.001 Gender -.023 -.372 .952
H2 No SN .052 .779 .438 Ethnicity -.107 -1.748 .083
H3 Yes PBC 0.321 4.872 <.001 Education .025 .396 .693
Income .070 1.092 .277
Attitude Constant - 5.419 <.001 Age .296 4.911 <.001 .321 9.313
(7/138) <.001
H4 Yes PB .141 3.968 .036 Gender -.099 -1.343 .181
H5 Yes Lifestyle .401 5.378 <.001 Ethnicity .120 1.665 .098
Education -.047 -.621 .536
Income .050 .652 .516
Note: PI- Intent to purchase casual activewear, PBC- Perceived Behavioral Control, SN- Subjective Norm, PB- Past Purchase Behavior and Lifestyle – Lifestyle
Orientation. Std. Coef. stands for Standardized Coefficients.

47
Figure 3. Results of hypothesis testing
Past Purchase
Behavior
Perceived
Behavioral
Control
Attitude
Subjective
Norm
Purchase
Intention
Consumer
Lifestyle
Orientation
.472*
.321*
.052
.141*
.401*

48
CHAPTER FIVE
CONCLUSIONS AND IMPLICATIONS
This research empirically determined the key factors influencing American consumers’
intentions to purchase casual activewear. This chapter provides the conclusions and implications,
which include four parts. The first part compares the finding of this study with previous research
results. The second part draws the conclusions based on the results of rigorous statistical
analysis. The third part imparts several managerial implications that are of interest to industrial
practitioners. Finally, the limitations of this study and possible directions for future research are
stated.
5.1 Discussion
In this study, attitude positively influenced U.S. consumers’ intention to purchase casual
activewear. This positive relationship is congruent with previous apparel purchase intention
studies (Kim & Karpova, 2010; Wang, 2014; Yan et al., 2010). Prior studies indicate that
subjective norm (SN) is an important factor affecting apparel purchase intention (Budiman &
Wijaya, 2014; Jabari et al., 2012; Jin & Kang, 2011; Kalafatis et al., 1999; Yan et al., 2012).
However, in this study, subjective norm (SN) had no influence on intention to purchase casual
activewear for U.S. consumers. The lack of concern over the expectations and opinions of
important others suggest that the purchase of casual activewear is tied to self-interest. Vallerand,
Deshaies, Cuerrier, Pelletier, and Mongeau (1992) suggest that subjective norm is less significant
in the explanation of intention because it is a remote concept. As casual activewear is often worn
for solitary leisure activities, remoteness is relevant in that the influence of significant others is

49
potentially less pervasive. Perceived behavioral control (PBC) positively influenced U.S.
consumers’ intention to purchase casual activewear. This was consistent with previous empirical
studies concerning purchase intention towards apparel (Jin & Kang, 2010; Shim et al., 2001).
U.S. consumers’ past purchase behavior (PB) positively influenced attitude towards
purchasing casual activewear. This finding was congruent with previous studies (Dean et al.,
2012; Kim & Karpova, 2010; Knowles et al., 2012; Lee, 2009). Likewise, lifestyle orientation
positively influenced attitude towards purchasing casual activewear. This result was consistent
with previous studies (First & Brozina, 2001; Honkanen et al., 2006; Ogle et al., 2004).
5.2 Conclusions
In recent years, the athletic apparel industry has grown tremendously. As consumers have
become increasingly interested in healthy lifestyles, the demand for athletic performance apparel
to meet their needs has risen. However, activewear is no longer contained to the gym (Friedman,
2015). It is visible in places such as the grocery store, the boardroom, and the classroom. To
better understand this phenomenon of activewear purchased to be worn as casualwear, this study
determined the key factors influencing U.S. consumers’ intentions to purchase casual
activewear.
First, taking a holistic approach, this study integrated the existing social psychology
theory for examining factors that govern human intentions (i.e., the Theory of Planned Behavior)
and additional important identifiable variables (i.e., past purchase behavior and lifestyle
orientation) to propose an enhanced consumer purchase intention model for casual activewear.
Second, the psychometric properties of the developed model were examined using
gathered primary consumer survey data from the U.S. Factor analysis and multiple regression
50
analysis were utilized for data analysis and hypothesis testing. The significant factors influencing
the U.S. consumers’ intentions to purchase casual activewear were determined. Attitude and
perceived behavioral control (PBC) were found to have positive effects on intent to purchase
casual activewear. The proposed model shows a high explanatory power for US consumer
purchase intention towards casual activewear, accounting for 52.4% variance in the purchase
intention (R2=52.4%).
Third, this study found that the additional variables of past purchase behavior (PB) and
consumer lifestyle orientation (L) within the enhanced Theory of Planned Behavior (TPB)
significantly influenced attitude towards the purchase of casual activewear. Past casual
activewear purchase behavior and lifestyle orientation towards health and wellness help US
consumers gain positive attitude towards shopping activewear for casual purpose.
Finally, demographic variables do not significantly affect consumer intention to purchase
casual activewear, while age affects consumer attitude towards wearing casual activewear. Older
consumers show more positive attitudes toward wearing casual activewear.
5.3 Implications
This study also offers some managerial implications based on the findings. First, attitude
influenced intention to purchase casual activewear. Thus, companies should develop ways to
enhance consumers’ positive attitude towards wearing activewear for casual purpose in
promoting their products. Companies should develop marketing strategies and promotional
campaigns to promote and cultivate favorable attitudes among target consumers toward casual
activewear consumption.

51
Second, perceived behavioral control (PBC) influenced intent to purchase casual
activewear. Therefore, companies should increase the availability of casual activewear products
through different sales channels to ensure products are conveniently accessible to target
consumers. Information concerning product characteristics and properties should be made
readily available to consumers purchasing casual activewear to aid in consumers’ informed
decision-making. Effort should be made to help consumers perceive affordable prices instead of
high prices through the use of marketing strategies such as discounts, advertisements, and new
product development. Consumers’ lack of self-confidence can also inhibit their ability to
purchase casual activewear, so companies should offer products in a variety of styles and fits to
provide consumers with the best product to fit their psychological needs.
Third, past casual activewear purchase behavior (PB) positively influenced attitude
within the expanded TPB model. To encourage repeat purchase behavior, companies should
focus on service quality and consumer satisfaction. That is, if consumers are satisfied with
quality of service provided and the purchased product, they will revisit, repurchase, and
recommend to others. Managers can identify their competitive strengths and weaknesses from
the perspective of the consumer in order to evaluate and improve quality of service and products.
Last, since it has been determined that consumer lifestyle orientation (L) influences
attitude, these details should be more focal for future marketers to develop advertising strategies
in the future. Aspects concerning health, wellbeing, and fitness should be emphasized in
advertising for casual activewear.
52
5.4 Limitations and Future Studies
First, the conclusions and implications drawn from this study are limited to casual
activewear products. The generalization of findings to other apparel products or exercise
products needs further validation.
Second, this study is focused on casual activewear and the proposed research model is a
casual activewear purchase intention model, the survey instrument is product specific. The
application of the survey instrument and research model requires appropriate revisions.
Third, in this study, the intent to purchase is investigated instead of actual purchase of
casual activewear. Future studies should pursue the investigation of the measurement of actual
purchase of casual activewear since the consumption of activewear in the U.S. is rapidly
increasing. Furthermore, the measurement of actual purchase behavior in future studies would
increase the research rigor.
Fourth, this study used a quantitative approach. Although the quantitative approach
allows the examination of the relationships between each of the factors and intention to
purchase casual activewear, it is considered weak when attempting to identify the underlying
reasons to explain the phenomenon. Qualitative methods used in future studies might provide a
more comprehensive picture on intent to purchase casual activewear.

53
BIBLIOGRAPHY
Ajzen, I., & Fishbein, M. (1973). Attitudinal and normative variables as predictors of specific
behaviors. Journal of Personality and Social Psychology, 27(1), 41-48.
Ajzen, I. (1985). From intentions to actions: A theory of planned behavior. In J. Kuhl & J.
Beckmann (Eds.), Action control: From cognition to behavior. (11-39). Heidelberg,
Germany: Springer.
Ajzen, I. (1991). The theory of planned behavior. Organizational Behavior and Human Decision
Processes, 50, 179-211.
Ajzen, I. (2006). Theory of planned behavior diagram. Icek Aizen. Retrieved March 14, 2016,
from http://www.people.umass.edu/aizen/T.P.B.diag.html
Ajzen, I. (2013). Theory of Planned Behaviour Questionnaire . Measurement Instrument
Database for the Social Science. Retrieved from www.midss.ie
Ajzen, I., & Fishbein, M. (1980). Understanding attitudes and predicting social
behavior. Englewood Cliffs, NJ: Prentice Hall.
Alumran, A., Hou, X., Sun, J., Yousef, A. A., & Hurst, C. (2014). Assessing the construct
validity and reliability of the parental perception on antibiotics (PAPA) scales. BMC
Public Health, 14(1), 73. doi:10.1186/1471-2458-14-73
d’Astous, A., Colbert, F., & Montpetit, D. (2005). Music piracy on the web: How effective are
antipiracy arguments? Evidence from the theory of planned behavior. Journal of
Consumer Policy, 28, 289-310.
Athleisure. (2015). In Merriam-Webster.com. Retrieved November 10, 2015, from
http://www.merriam-webster.com/blog/athleisure-words-were-watching.htm.

54
Banjo, S. (2016, April 13). Has the activewear fashion fad run its course? Retrieved August 19,
2016, from https://www.bloomberg.com/gadfly/articles/2016-04-13/lululemon-inspired-
fitness-fashion-trend-cools-down
Bephage, G. (2000). Social and Behavioral Sciences for Nurses, An Integrated Approach, China:
Churchill Livingstone Press, 1-336.
Biswas, D., Biswas, A., & Das, N. (2006). The differential effects of celebrity and expert
endorsements on consumer risk perceptions. The role of consumer knowledge, perceived
congruency, and product technology orientation. Journal of Advertising, 35(2), 17-31.
Bourdieu, P. (1984). Distinction: A social critique of the judgement of taste. London: Routledge
& Kegan Paul.
Bozionelos, G., & Bennett, P. (1999). The theory of planned behaviour as predictor of exercise:
the moderating influence of beliefs and personality variables. Journal of Health
Psychology, 4(4), 517-529.
Budiman, S., & Wijaya, T. (2014). Purchase Intention of Counterfeit Products: The Role of
Subjective Norm. International Journal of Marketing Studies, 6(2), 145-152.
Cadogan, J.W., Cui, C., Morgan, R.E., & Story, V. (2006). Factors facilitating and impeding the
development of export market-oriented behaviour: A study of Hong Kong manufacturing
exporters. Industrial Marketing Management, 35, 634-647.
Carr, A. (2013, February 11). Nike: The No. 1 Most Innovative Company Of 2013. Retrieved
September 30, 2015, from http://www.fastcompany.com/most-innovative-
companies/2013/nike
Cendrowski, S. (2012, February 13). Nike's new marketing mojo. Retrieved September 30, 2015,
from http://fortune.com/2012/02/13/nikes-new-marketing-mojo/
55
Chang, M. K. (1998). Predicting unethical behavior: A comparison of the theory of reasoned
action and the theory of planned behavior. Journal of Business Ethics, 17(16), 1825-
1834.
Chatzisarantis, N. L., & Hagger, M. S. (2009). Effects of an intervention based on self-
determination theory on self-reported leisure-time physical activity participation.
Psychology & Health, 24(1), 29-48.
Chaudary, M. W., Ahmed, F., Gill, M. S., & Rizwan, M. (2014). The determinants of purchase
intention of consumers towards counterfeit shoes in Pakistan. Journal of Public
Administration and Governance, 4(3), 20-38. doi:10.5296/jpag.v4i3.5847
Chen, V. (2016, July 7). Luxury fashion brands are embracing athleisure. Retrieved March 25,
2017, from http://www.scmp.com/magazines/style/fashion-beauty/article/1983046/brand-
new-lifestyle-luxury-fashion-brands-are
Chi, T., & Kilduff, P.P.D. (2011). Understanding consumer perceived value of casual
sportswear: An empirical study. Journal of Retailing and Consumer Services, 18(5), 422-
429.
Chi, T., Kilduff, P.P.D., & Gargeya, V.B. (2009). Alignment between business environment
characteristics, competitive priorities, supply chain structures, and firm business
performance. International Journal of Productivity and Performance Management,
58(7), 645-669.
Chi, T., & Sun, Y. (2013). Development of firm export market oriented behavior: Evidence from
an emerging economy. International Business Review, 22(1), 339–350.

56
Chong, H.Y., Osborn Popp, S., DiGangi, S., & Jannasch-Pennell, A. (2007). Assessing
unidimensionality: A comparison of Rasch Modeling, Parallel Analysis, and TETRAD.
Practical Assessment, Research & Evaluation, 12(14).
Clarke T.C., Black L.I., Stussman B.J., Barnes P.M., & Nahin R.L. (2015) Trends in the use of
complementary health approaches among adults: United States, 2002–2012. (Report
#79). Hyattsville, MD: National Center for Health Statistics.
Clemente, D. (2014). Dress casual: How college students redefined american style. Chapel Hill,
NC: The University of North Carolina Press.
Cohen, J. (1988). Statistical power analysis for the behavioral sciences (2nd ed.). Hillsdale, NJ:
Erlbaum.
Cohen, J., & Cohen, P. (1975). Applied multiple regression/correlation analysis for the
behavioral sciences: Lawrence Erlbaum.
Cohen, J., Cohen, P., West, S., & Aiken, L. (2003). Applied multiple regression/correlation
analysis for the behavioral sciences. Hillsdale, NJ: Lawrence Erlbaum Associates.
Conner, M., & Armitage, C. J. (1998). Extending the Theory of Planned Behavior: A Review
and Avenues for Further Research. Journal of Applied Social Psychology, 28(15), 1429-
1464.
Cowan, K. & Kinley, T. (2014) Green spirit: Consumer empathies for green apparel.
International Journal of Consumer Studies. 38(5), 493-499.
Crano, W. D., & Prislin, R. (2008). Attitudes and attitude change. New York: Psychology Press.
Dean, M., Raats, M. M., & Shepherd, R. (2011). The Role of Self-Identity, Past Behavior, and
Their Interaction in Predicting Intention to Purchase Fresh and Processed Organic Food1.
Journal of Applied Social Psychology, 42(3), 669-688.

57
Eastlick, M. A., & Lotz, S. (1999). Profiling potential adopters and non-adopters of an
interactive electronic shopping medium. International Journal of Retail & Distribution
Management, 27(6), 209-223.
Entis, L. (2016, June 23). Can performance clothing break out of the gym and into the corner
office? Retrieved March 25 2017, from http://fortune.com/2016/06/23/performance-
clothing-for-the-office/
Euromonitor International. (2014, June). Global participative sport as consumption: the new
rules of the game. Retrieved Dec. 2, 2015 from Euromonitor Passport database.
Euromonitor International. (2015a, May 15). Sportswear in the US. Retrieved October 21, 2015,
from Euromonitor Passport database.
Euromonitor International. (2015b, September 1). Young Women’s Health: Global Attitudes
Towards Health, Fitness and Wellbeing Among the Under 30s and Market Impact.
Retrieved October 20, 2015 from Euromonitor Passport database.
First, I and S. Brozina. (2009). Cultural influences on motives for organic food consumption.
EuroMed Journal of Business 4(2):185-199.
Fitzmaurice, J. (2005). Incorporating consumers’ motivations into the theory of reasoned action.
Psychology & Marketing, 22(11), 911-92.
Fitzpatrick, H. (2015, July 15). Under Armour is becoming a huge threat to Lululemon and
Victoria's Secret. Retrieved January 17, 2016, from
http://www.businessinsider.com/under-armours-new-sports-bra-collection-2015-7
Fornell, C., & Larcker, D. F. (1981). Structural equation models with unobservable variables and
measurement error: Algebra and statistics. Journal of marketing research, 382-388.
58
Fowler, D. (1999). The attributes sought in sports apparel: A ranking. Journal of Marketing
Theory and Practice, 7(4), 81-88.
Friedman, V. (2015, November 4). Adventures in Athleisure Clothing. The New York Times.
Retrieved November 10, 2015, from
http://www.nytimes.com/2015/11/05/fashion/adventures-in-athleisure-clothing.html
Frings, G. S. (2008). Fashion: From concept to consumer. Upper Saddle River, NJ: Pearson
Prentice Hall.
Fromm, J. (2016, July 6). The Lululemon lifestyle: Millennials seek more than just comfort from
athleisure wear. Retrieved August 18, 2016, from
http://www.forbes.com/sites/jefffromm/2016/07/06/the-lululemon-lifestyle-millennials-
seek-more-than-just-comfort-from-athleisure-wear/#cfe871a36584
George, D., & Mallery, P. (2003). SPSS for Windows step by step: A simple guide and
reference, 11.0 update (4th
ed.). Boston: Allyn & Bacon.
George, D., & Mallery, M. (2010). SPSS for Windows Step by Step: A Simple Guide and
Reference, 17.0 update (10a ed.) Boston: Pearson.
Guo, B., Aveyard, P., Fielding, A., & Sutton, S. (2008). Testing the convergent and discriminant
validity of the Decisional Balance Scale of the Transtheoretical Model using the Multi-
Trait Multi-Method approach. Psychology of Addictive Behaviors, 22(2), 288-294.
doi:10.1037/0893-164x.22.2.288
Gupta, D. (2011). Functional clothing— Definition and classification. Indian Journal of Fibre &
Textile Research, 36, 321-326.
Hair, J. F., Black, W., Babin, B., Tatham, R. L., & Anderson, R. E. (1998). Multivariate data
analysis (6th ed.). Upper Saddle River, NJ: Prentice Hall.

59
Hair, J. F., Tatham, R. L., Anderson, R. E., & Black, W. (1998). Multivariate data analysis (5th
ed.). Upper Saddle River, NJ: Prentice Hall.
Hansen, T., Jensen, J. M., & Solgaard, H. S. (2004). Predicting online grocery buying intention:
A comparison of the theory of reasoned action and the theory of planned behavior.
International Journal of Information Management, 24(6), 539-550.
doi:10.1016/j.ijinfomgt.2004.08.004
Honkanen, P., Verplanken, B., & Olsen, S.O. (2006). Ethical values and motives driving organic
food choice. Journal of Consumer Behaviour 5(5): 420–430.
Horton, K., Ferrero-Regis, T., & Payne, A. (2016). The hard work of leisure: Healthy life,
activewear and Lorna Jane. Annals of Leisure Research, 19(2), 180-193.
Huang, J., Lee, B. C., & Ho, S. H. (2004). Consumer attitude toward gray market goods.
International Marketing Review, 21(6), 598-614. doi:10.1108/02651330410568033
Jabari, M. A., Othman, S. N., & Mat, N.K. (2012). Actual online shopping behavior among
Jordanian customers. American Journal of Economics, 2(4), 125-129.
Jessop, A. (2014, August 28). Why The Tough Mudder, The Color Run And Spartan Race Will
Continue To Drive Running's Popularity. Retrieved October 20, 2015, from
http://www.forbes.com/sites/aliciajessop/2014/08/28/why-the-tough-mudder-color-run-
and-spartan-race-will-continue-to-drive-runnings-popularity/
Jin, B., & Kang, J. H. (2010). Face or subjective norm? Chinese college students' purchase
behaviors toward foreign brand jeans. Clothing and Textiles Research Journal, 28(3),
218-233.

60
Jin, B., & Kang, J. H. (2011). Purchase intention of Chinese consumers toward a US apparel
brand: A test of a composite behavior intention model. Journal of Consumer Marketing,
28(3), 187-199.
Kalafatis, S. P., Pollard, M., East, R., & Tsogas, M. H. (1999). Green marketing and Ajzen’s
theory of planned behaviour: Aa cross-market examination. Journal of Consumer
Marketing, 16(5), 441–460. http://dx.doi.org/10.1108/07363769910289550
Kasriel-Alexander, D. (2015) Athleisure: Looking workout-ready beyond the gym.
Retrieved Dec. 3, 2015, from Euromonitor Passport database.
Katz, M. H. (2006). Multivariable analysis: A practical guide for clinicians. Cambridge:
Cambridge University Press.
Khalek, A. A., & Ismail, S. H. (2015). Why are we eating halal – Using the theory of planned
behavior in predicting halal food consumption among generation y in Malaysia.
International Journal of Social Science and Humanity IJSSH, 5(7), 608-612.
Khalifa, M., & Shen, K. N. (2008). Explaining the adoption of transactional B2C mobile
commerce. Journal of Enterprise Information Management, 21(2), 110-124.
Kim, H. & Karpova, E. (2010). Consumer attitudes toward fashion counterfeits: Application of
the theory of planned behavior. Clothing and Textiles Research Journal. 28(2), 79-94.
Kim, M., & Trail, G. T. (2010). The effects of service provider employment status and service
quality exchange on perceived organizational image and purchase intention. Sport
Management Review, 13(3), 225-234.
Kissane, B. (2015, September 25). Nike’s Triumphant Q1 2016 Results. Retrieved October 21,
2015, from Euromonitor Passport database.

61
Kline, R. B. (2011). Principles and practice of structural equation modeling. New York, NY:
Guilford.
Knowles, S.R., Hyde, M.K., & White, K.M. (2012). Predictors of young people's charitable
intentions to donate money: An extended theory of planned behavior perspective. Journal
of Applied Social Psychology, 42(9), 2096-2110.
Ko, E., Taylor, C., Sung, H., Lee, J., Wagner, U., Navarro, D., & Wang, F. (2012). Global
marketing segmentation usefulness in the sportswear industry. Journal of Business
Research, 65, 1565-1575.
Kraft, F., & Goodell, P. (1993). Identifying the health conscious consumer. Journal of Health
Care Monitoring, 13(3), 18-25.
Kucukemiroglu, O. (1999). Market segmentation by using consumer lifestyle dimensions and
ethnocentrism. European Journal of Marketing, 33(5/6), 470-487.
Lac, A., Crano, W.D., Berger, D.E., & Alvaro, E.M. (2013). Attachment theory and theory of
planned behavior: An integrative model predicting underage drinking. Developmental
Psychology. 49(8), 1579-1590.
Lamont-Djite, T. (2014, July 09). Net-a-Sporter Is Your New Go-to Sporting Destination.
Retrieved March 11, 2016, from
http://www.harpersbazaar.com/fashion/trends/a2806/net-a-sporter-launches-on-net-a-
porter/
Lashinsky, A. (2015, November 12). Why Nike's CEO is Fortune's Businessperson of the Year.
Retrieved March 01, 2016, from http://fortune.com/2015/11/12/nike-plus-tech/
Lau, M., Chang, M., Moon, K., & Liu, W. (2006). The brand loyalty of sportswear in Hong
Kong. Journal of Textile and Apparel, Technology and Management, 5(1), 1-13.
62
Lee, J. (2009). Understanding college students’ purchase behavior of fashion counterfeits:
Fashion consciousness, public self-consciousness, ethical obligation, ethical judgment,
and the theory of planned behavior (Electronic Thesis or Dissertation). Retrieved from
https://etd.ohiolink.edu/!etd.send_file?accession=ohiou1257894300&disposition=inline
Ling, G. (2009). Understanding consumer purchasing behavior regarding luxury fashion-related
goods (Unpublished doctoral dissertation). The Hong Kong Polytechnic University.
Retrieved from
http://repository.lib.polyu.edu.hk/jspui/bitstream/10397/3954/2/b23216323_ir.pdf
Martin, K.A., Sinden A.R. & Fleming, J.C. (2000). Inactivity may be hazardous to your image:
The effects of exercise participation on impression formation. Journal of Sport &
Exercise Psychology, 22, 283-291.
Marquardt, D. W. (1970). Generalized inverses, ridge regression, biased linear estimation, and
nonlinear estimation. Technometrics, 12, 591–256.
Molina, L. (2016, May 17) Overall Apparel Market Struggles Under Dominance of Athleisure
Trend. APLF. Retrieved September 18, 2016 from http://www.aplf.com/en-US/leather-
fashion-news-and-blog/news/31386/overall-apparel-market-struggles-under-dominance-
of-athleisure-trend
Much, M. (2015a, October 22) Under Armour Earnings Rebound, But Margins Hit Stock.
Investor’s Business Daily. Retrieved November 20, 2015 from
http://news.investors.com/business/102215-776873-under-armour-earnings-top-stock-
falls-on-marginsand-raises-guidance.htm
Much, M. (2015b, November 13) Shoe Sales: Under Armour Outruns Nike by A Mile. Investor’s
Business Daily. Retrieved November 20, 2015 from

63
http://news.investors.com/business/111315-780717-nike-under-armour-skechers-see-
shoe-sales-rise.htm
Muzaffar, N. (2015). Developing an extended model of Theory of Planned behavior to explore
green purchase behavior of Pakistani consumers. American Journal of Business and
Management AJBM, 4(2), 85-101.
Neter, J., Wasserman, W. & Kutner, M. H. (1989). Applied Linear Regression Models.
Homewood, IL: Irwin.
Niaura, A. (2013). Using the Theory of Planned Behavior to Investigate the Determinants of
Environmental Behavior among Youth. Environmental Research, Engineering and
Management, 63(1). doi:10.5755/j01.erem.63.1.2901
Nike, Inc. (2009). Corporate Social Responsibility FY 07 08 09. Retrieved from
http://www.nikebiz.com/crreport/content/pdf/documents/en-US/full-report.pdf
Norman, P. (2011). The theory of planned behavior and binge drinking among undergraduate
students: Assessing the impact of habit strength. Addictive Behaviors. 36(5), 502-507.
Norris, E. & Myers, L. (2013). Determinants of personal protective equipment (PPE) use in UK
motorcyclists: Exploratory research applying an extended theory of planned behavior.
Accident; analysis and prevention.60, 219-230.
Nunnally, J.C. (1978),Psychometric Theory, McGraw-Hill, New York, NY.
O’Brien, R. M. (2007). A caution regarding rules of thumb for variance inflation factors. Quality
& Quantity, 41(5), 673-690. doi:10.1007/s11135-006-9018-6
O’Mahoney, M. & Braddock, S.E. (2002) Sportstech: Revolutionary fabrics, fashion and design.
New York, NY: Thames & Hudson Inc.

64
Ogle, J. P., Hyllegard, K. H., & Dunbar, B. H. (2004). Predicting Patronage Behaviors in a
Sustainable Retail Environment: Adding Retail Characteristics and Consumer Lifestyle
Orientation to the Belief-Attitude-Behavior Intention Model. Environment and Behavior,
36(5), 717-741.
Özdil N. & Anand S. (2014). Recent developments in textile materials and products used for
activewear and sportswear. Electronic Journal of Textile Technologies, 8(3), 68-83.
Potts, E. (2015a, May 5). What’s Next for High-Flying Under Armour? Retrieved Nov 20, 2015,
from Euromonitor Passport database.
Potts, E. (2015b, Sept. 15). Function, Fashion and the Environment Dominate Outdoor
Sportswear Innovation. Retrieved Dec. 14 2015 from Euromonitor Passport database.
Rhodes, R. E., Courneya, K. S., & Hayduk, L. A. (2002). Does personality moderate the theory
of planned behavior in the exercise domain? Journal of Sport & Exercise Psychology, 24,
120-132.
Rovell, D. (2014, December 10). Nike sues former designers. Retrieved February 04, 2016, from
http://espn.go.com/espn/story/_/id/12007269/nike-sues-former-designers-trade-secrets
Rubinstein, R.P. (2001). Dress codes: Meanings and messages in american culture. Boulder,
CO: Westview Press.
Running USA. (2014). 2014 State of the Sport - Part II: Running Industry Report. Santa Barbara,
CA.
Schlossberg, M. (2015a, September 8). Under Armour's underdog strategy to becoming the anti-
Nike. Retrieved September 30, 2015, from http://www.businessinsider.com/under-
armours-underdog-strategy-2015-9
65
Schlossberg, M. (2015b, December 14). Lululemon's founder reveals that he considered buying
Under Armour. Retrieved February 11, 2016, from
http://www.businessinsider.com/lululemon-founder-on-buying-under-armour-2015-12
Shim, S., Estlick, M. A., Lotz, S. L., & Warrington, P. (2001). An online prepurhcase intention
model: the role of intention to search. Journal of Retailing, 77, 397-416.
Smith, A. (2015, April 1). U.S. smartphone use in 2015. Retrieved from Pew Research Center
http://www.pewinternet.org/2015/04/01/us-smartphone-use-in-
2015/?utm_expid=53098246-2.Lly4CFSVQG2lphsg-KopIg.0
Sommer, L. (2011). The theory of planned behaviour and the impact of past behaviour.
International Business & Economics Research Journal, 10(1), 91-110.
Soni, P. (2015, June 8). Nike Market Share Gets the High Score in Activewear. Market Realist.
Retrieved November 20, 2015 from http://marketrealist.com/2015/06/nike-market-share-
gets-high-score-activewear/
Sparks, P., & Shepherd, R. (1992). Self-identity and the theory of planned behavior: Assessing
the role of identification with "green consumerism" Social Psychology Quarterly, 55(4),
388. doi:10.2307/2786955
St-James, M. B., De Man, A. F., & Stout, D. (2006). Athletic style of dress and perceived social
distance. North American Journal of Psychology, 8(3), 541-548.
Stanec, A. D. (2009). The Theory of Planned Behavior: Predicting Teachers’ Intentions and
Behavior during Fitness Testing. Journal of Teaching in Physical Education, 28(3), 255-
271. doi:10.1123/jtpe.28.3.255
Statistic Brain. (2015). Percent of Americans Who Exercise Regularly. Statistic Brain Research
Institute. http://www.statisticbrain.com/percent-of-americans-who-exercise-regularly/
66
Sullivan, G. (2014, June 23). Lululemon still suffering from sheer pants debacle. Founder in
warrior pose. Retrieved January 07, 2016, from
https://www.washingtonpost.com/news/morning-mix/wp/2014/06/23/lululemon-still-
suffering-from-sheer-pants-debacle-founder-in-warrior-pose/
Sun, J. (2014). Key factors influencing the adoption of apparel mobile commerce – an empirical
study of Chinese and U.S. consumers. Unpublished master’s thesis). Washington State
University.
Tavakol, M. & Dennick, R. (2011). Making sense of Cronbach’s alpha. International Journal od
Medical Education, 2, 53-55.
Thompson, W. (2014). Worldwide survey of fitness trends for 2015: What’s driving the market.
American College of Sports Medicine’s Health & Fitness Journal.18(6), 8-17.
Tom, G., Garibaldi, B., Zeng, Y., & Pilcher, J. (1998). Consumer demand for counterfeit goods.
Psychology & Marketing, 15(5), 405-21.
Townsend, M. (2013, February 13). Under Armour finds feminine fide to go beyond $2 billion.
Retrieved February 11, 2016, from http://www.bloomberg.com/news/articles/2013-02-
15/under-armour-finds-feminine-side-to-go-beyond-2-billion
Vallerand, R.J., Deshaies, P., Cuerrier, J.P., Pelletier, L.G., & Mongeau, C. (1992). Ajzen and
Fishbein's theory of reasoned action as applied to moral behavior: A confirmatory
analysis. Journal of Personality and Social Psychology: Personality Processes and
Individual Differences, 62(1), 98-109.
Verry, P. (2017, March 6). Why just about any shoe style is called ‘athleisure’ now. Retrieved
March 25 2017, from http://footwearnews.com/2017/focus/athletic-outdoor/athleisure-

67
trend-changing-athletic-casual-adidas-nmd-nike-flyknit-sportie-la-renarts-west-nyc-
324222/
Wahba, P. (2015, September 25). Women a big factor in Nike's hot streak. Retrieved September
30, 2015, from http://fortune.com/2015/09/25/nike-women/
Wasilenko, K.A., Kulik, J.A., & Wanic, R.A. (2007). Effects of social comparisons with peers on
women’s body satisfaction and exercise behavior. International Journal of Eating
Disorders, 40(8), 740–745.
Wang, S. & Barnes, S. (2007). Exploring the acceptance of mobile auctions in China. Paper
presented at the Management of Mobile Business, 2007. ICMB 2007. International
Conference on Mobile Business.
Wang, Y. (2014). Consumers’ purchase intentions of shoes: Theory of planned behavior and
desired attributes. International Journal of Marketing Studies, 6(4).
What Is Physical Activity? (2015, October 29). Retrieved January 07, 2016, from
https://www.nhlbi.nih.gov/health/health-topics/topics/phys
WGSN. (2007). “Athleisurely Paced” Accessed October 11, 2015.
http://www.wgsn.com.ezp01.library.wsu.edu.au/content/board_viewer/#/501/page/1
Wray, A.Z. & Hodges, N.N. (2008). Response to activewear apparel advertisements by US baby
boomers: An examination of cognitive versus chronological age factors. Journal of
Fashion Marketing and Management, 12(1), 8-23.
Yan, R., Hyllegard, K. H., & Blaesi, L. F. (2012). Marketing eco-fashion: The influence of brand
name and message explicitness. Journal of Marketing Communications, 18(2), 151-168.

68
Yan, R., Ogle, J. P., & Hyllegard, K. H. (2010). The impact of message appeal and message
source on Gen Y consumers' attitudes and purchase intentions toward American Apparel.
Journal of Marketing Communications, 16(4), 203-224.
Yarow, J. (2013, November 18). REVIEW: The Nike FuelBand Versus The Fitbit Force.
Retrieved February 04, 2016, from http://www.businessinsider.com/review-the-nike-
fuelband-versus-the-fitbit-force-2013-11.
Yoo, B. & Lee, S. (2012) Asymmetrical effects of past experiences with genuine fashion luxury
brands and their counterfeits on purchase intention of each. Journal of Business
Research. 65(10), 1507-1515.
Yoon, C. (2011). Theory of planned behavior and ethics theory in digital piracy: An integrated
model. Journal of Business Ethics, 100(3), 405-417.
Zheng, Y. (2013). Antecedents and moderators of purchase intention toward environmentally
friendly apparel: An empirical study of U.S. and Chinese consumers (Unpublished
master’s thesis). Washington State University.

APPENDIX
COVER LETTER AND SURVEY QUESTIONNAIRE

70
An empirical study of U.S. consumer purchase intention of casual activewear
This study is intended to collect commercially non-sensitive information about the factors
influencing activewear purchase intention in the U.S. Understanding the relationships among
these factors can help us determine a better path to develop and promote desired activewear to
the consumers and make contributions to theoretical advancement and empirical validation in the
literature.
This study is being carried out on a strictly confidential basis. You do not have to include your
name or address details unless you wish to do so. Each interview takes approximately 30
minutes to answer the questions in a provided questionnaire and to comment on the clarify of the
questions. If you are not sure of an answer to a question, please provide you best estimate. The
interview questions along with this consent form are sent to you for review and decision on your
participation. The mode of interview will be discussed and determined with you prior to the
interview. We will make notes during the interview for a transcription purpose. All the
information collected from the interviews will be only stored on a WSU server for a minimum
three years. The risk associated with this study is very minimum. Any risks would be related to
data confidentiality, which has been addressed.
By participating in the interview, you agree that you understand the procedures and any risks and
benefits involved in this research. You are free to refuse to participate or to withdraw your
consent to participate in this research at any time without penalty or prejudice; your participation
is entirely voluntary.
If you have questions about this study or the information in this form, please contact the
researcher [Dr. Ting Chi, Associate Professor at the Department of Apparel,
Merchandising, Design & Textiles, Washington State University, [email protected], 509-335-
8536]. If you have questions about your rights as a research participant, or would like to report a
concern or complaint about this study, please contact the Washington State University
Institutional Review Board at (509) 335-3668, or e-mail [email protected], or regular mail at:
Albrook 205, PO Box 643005, Pullman, WA 99164-3005.
Your participation in this important study is greatly appreciated!
THANK YOU!

71
An empirical study of U.S. consumer purchase intention of casual activewear
This study is intended to collect commercially non-sensitive information about the factors
influencing activewear purchase intention in the U.S. Understanding the relationships among
these factors can help us determine a better path to develop and promote desired activewear to
the consumers and make contributions to theoretical advancement and empirical validation in the
literature.
This study is being carried out on a strictly confidential basis. You do not have to include your
name or address details unless you wish to do so. Each interview takes approximately 30
minutes to answer the questions in a provided questionnaire and to comment on the clarify of the
questions. If you are not sure of an answer to a question, please provide you best estimate. The
interview questions along with this consent form are sent to you for review and decision on your
participation. The mode of interview will be discussed and determined with you prior to the
interview. We will make notes during the interview for a transcription purpose. All the
information collected from the interviews will be only stored on a WSU server for a minimum
three years. The risk associated with this study is very minimum. Any risks would be related to
data confidentiality, which has been addressed.
By participating in the interview, you agree that you understand the procedures and any risks and
benefits involved in this research. You are free to refuse to participate or to withdraw your
consent to participate in this research at any time without penalty or prejudice; your participation
is entirely voluntary.
If you have questions about this study or the information in this form, please contact the
researcher [Dr. Ting Chi, Associate Professor at the Department of Apparel,
Merchandising, Design & Textiles, Washington State University, [email protected], 509-335-
8536]. If you have questions about your rights as a research participant, or would like to report a
concern or complaint about this study, please contact the Washington State University
Institutional Review Board at (509) 335-3668, or e-mail [email protected], or regular mail at:
Albrook 205, PO Box 643005, Pullman, WA 99164-3005.
Your participation in this important study is greatly appreciated!
THANK YOU!
If you are not sure of the answer to a question, please provide your best estimate.

72
There are NO right or wrong answers.
Activewear: Apparel that is typically worn for fitness activities and worn by people
participating in physical activity or sports. These garments are specifically engineered to deliver
a pre-defined performance or functionality to the user, over and above its normal functions
Casual Activewear: Activewear that is purchased and worn by consumers primarily in casual or
leisure settings with no particular intention of use in exercise environment.
1. Please respond to the statements by typing a number corresponding to your best estimate. If
you have never made a purchase, please type “0”. If your response to the THIRD question is “0”,
you should not proceed to answer the rest of the questions in the survey.
Past Activewear Consumption
a. How many activewear products have you purchased in the past 6 months for either casual
or leisure purpose or exercise purpose (not including footwear)? ______
b. How many activewear products have you purchased in the past 6 months with the
primary intention of wearing them to exercise in exercise environments (not including
footwear)? ______
c. How many activewear products have you purchased in the past 6 months with the
primary intention of wearing them outside of exercise environments (not including
footwear)? ______
2. Please respond to these statements using the following scale (Circle one number for each
statement). Strongly disagree=1, Disagree=2, Neutral=3, Agree=4, and Strongly agree=5
Purchasing casual activewear for me would be a good idea. 1 2 3 4 5
I like the idea of purchasing casual activewear. 1 2 3 4 5
I have a favorable attitude toward the behavior of purchasing
casual activewear. 1 2 3 4 5
Most people important to me think that I should purchase casual
activewear. 1 2 3 4 5
Close friends and family think that it is acceptable for me to 1 2 3 4 5

73
purchase casual activewear.
People I listen to could influence me to purchase casual
activewear. 1 2 3 4 5
In general, shopping for casual activewear is difficult. 1 2 3 4 5
It is hard to find the products I want when shopping for casual
activewear. 1 2 3 4 5
I have the resources to purchase casual activewear. 1 2 3 4 5
If I want to, I have complete control of purchasing casual
activewear. 1 2 3 4 5
I would purchase casual activewear. 1 2 3 4 5
The probability that I would consider buying casual activewear is
low. 1 2 3 4 5
I would consider buying casual activewear. 1 2 3 4 5
I am concerned about my health all the time. 1 2 3 4 5
I try to exercise at least 30 minutes a day, 3 days each week. 1 2 3 4 5
I believe that the “wellness” idea is a fad. 1 2 3 4 5
My daily meals are nutritionally balanced. 1 2 3 4 5
I think of myself as a health-conscious consumer. 1 2 3 4 5
3. Please circle one number for the following statement. Never =1, Have once or twice=2,
Several times in the past 6 months=3, Several times a MONTH=4, Several times a WEEK=5
Over the past 6 months, how often have you purchased apparel? 1 2 3 4 5
Over the past 6 months, how often have you purchased
activewear? 1 2 3 4 5
Over the past 6 months, how often have you purchased casual
activewear? 1 2 3 4 5
Over the past 6 months, how often have you worn activewear
outside of exercise environments? 1 2 3 4 5
4. The following questions designed to collect some basic demographic information about you.
There is no personal identification information required. Please answer the following questions
with your best estimate if exact data are not available.
a. What is your age? (Please check one of them)
1) 20-25 2) 26-30 3) 31-35 4) 36-40 5) 41-45
6) 46-50 7) 51-55 8) 56-60 9) 61 and older
b. What is your gender? (Please check one of them)
___________Female ___________ Male
c. What’s your ethnicity?

74
1) White/Caucasian 2) Black/African American 3) Asian American/Pacific
Islander
4) Latino/Hispanic 5) Native American 6) Other
d. What is your education level: (Please check one of them)
______ Some college
______Bachelor’s degree
______ Master’s degree
______Doctorate
______ Other
e. What is your annual income level (before taxation)? (Please check one of them)
1) Under $5, 000
4) $15,000 to $24,999
7) $50,000 to $74,999
2) $5,000 to $9, 999
5) $25,000 to $34,999
8) $75,000 and more
3) $10,000 to $14,999
6) $35,000 to $49,999
f. Approximately how much money in total have you spent on casual activewear for
yourself in the past 6 months?
1) $1-$99 2) $100-$499 3) $500-$999 4) $1,000 or more
g. Approximately how much money in total have you spent on activewear (both casual and
workout purposes) for yourself in the past 6 months?
1) $1-$99 2) $100-$499 3) $500-$999 4) $1,000-$1,499
5) $1,500-2,999 6) $3,000-$4,999 7) $5,000 or more
h. Approximately how much money in total have you spent on apparel for yourself in the
past 6 months?
1) $1-$99 2) $100-$499 3) $500-$999 4) $1,000-$1,999
5) $2,000-4,999 6) $5,000-$9,999 7) $10,000 or more