Bridging the Empirical Divide of College Teaching and Student Learning

OPEN ACCESS
EURASIA Journal of Mathematics Science and Technology Education ISSN: 1305-8223 (online) 1305-8215 (print)
2017 13(7):3189-3208 DOI 10.12973/eurasia.2017.00712a
© Authors. Terms and conditions of Creative Commons Attribution 4.0 International (CC BY 4.0) apply.
Correspondence: Ming-Yuan Hsieh, Assistant Professor, Department of International Business, National Taichung
University of Education, Taiwan. Address to No.140, Minsheng Rd., West Dist., Taichung City 40306, Taiwan
(R.O.C.). Tel: +886-4-2218-8731.
An Empirical Study of Education Divide
Diminishment through Online Learning Courses
Ming-Yuan Hsieh National Taichung University of Education, Taiwan (R.O.C.)
Received 30 September 2016 ▪ Revised 31 October 2016 ▪ Accepted 10 November 2016
ABSTRACT
According to the swift development of education system, Taiwanese government is always
devoting diminishing the educational divide between rural and urban regions. This research
focuses on this educational divide by cross-employing the Grey Relational Analysis (GRA)
of quantitative analysis and the Fuzzy Set Qualitative Comparative Analysis (fsQCA) of
qualitative analysis in order to reinforce research reliability, validity and representativeness.
These analysis method are used to assess the results of questionnaires given to professors’,
senior industrialists’ and senior professionals’ experts. Two valuable conclusions are
comprehensively induced from the evaluated results: (1) the autocorrelationships between
the digital characteristics of Online Learning Courses (OLCs) and the level of rural-urban
Education Divide (ED) are completely testified through the correlationships evaluations of
the educational features Mediators that directly and powerfully resupply the educational
research myth and gap and (2) Connectionization of Course Operation (C-CO) of the digital
characteristics of Online Learning Courses (OLCs) is positive to effectively enhance the
educational features of the students’ basic learning abilities (SBLA) and the education-
institution learning capabilities (EILC) that empirically provide the most beneficial niche
strategy to minimize the rural-urban Education Divide (ED).
Keywords: educational divide (ED), online learning course (OLC), grey relational analysis
(GRA), fuzzy set qualitative comparative analysis (fsQCA)
INTRODUCTION
For a long time, the national resources in Taiwan were primarily invested in the most critical-
economic regions and cities in the country such as Taipei (it’s capital city), Taichung and
Kaohsiung in order to pursuit maximum economic development. According to the 2015
educational records of the Taiwanese Education Department of Executive Yuan (see Table 1),
the total number of non-collegiate educational institutions (kindergartens, elementary, junior
high, senior high schools) are up to 5,310 (51.89%) and further, the total number of Higher
Education (“HE”) institutions was up to 89 (61.81%) in the most important economic
development cities in Taiwan (New Taipei, Kaohsiung, Taichung, Taipei and Tainan Cities).

M. Y. Hsieh / Education Divide Diminishment
3190
Table 1. The number of educational institutions in Taiwan in 2015
Kinder-
gartens
Elementary
Schools
Junior
High
Schools
Senior
High
Schools
Total Percentage
HE
Total Percentage College Universities
Total 6,362 2,633 733 506 10,234 100% 19 126 145 100%
Taiwan Island 6,332 2,606 723 503 10,164 99.32% 19 125 144 99.31%
New Taipei City 1,096 213 62 61 1,432 13.99% 6 13 19 13.10%
Kaohsiung City 677 242 79 53 1,051 10.27% 2 14 16 11.03%
Taichung City 659 235 72 48 1,014 9.91% - 17 17 11.72%
Taipei City 687 150 61 69 967 9.45% 1 23 24 16.55%
Tainan City 528 211 60 47 846 8.27% 1 12 13 8.97%
Taoyuan City 528 190 58 33 809 7.91% 1 10 11 7.59%
Changhua County 320 175 36 24 555 5.42% - 5 5 3.45%
Pingtung County 274 167 35 19 495 4.84% - 4 4 2.76%
Nantou County 177 140 32 15 364 3.56% - 2 2 1.38%
Yunlin County 140 155 33 21 349 3.41% - 3 3 2.07%
Miaoli County 174 117 30 19 340 3.32% 1 2 3 2.07%
Hsinchu City 216 85 28 10 339 3.31% - 2 2 1.38%
Chiayi County 142 124 23 10 299 2.92% 1 3 4 2.76%
Hualien County 131 103 23 13 270 2.64% 2 3 5 3.45%
Taitung County 117 88 21 10 236 2.31% - 1 1 0.69%
Yilan County 109 76 24 12 221 2.16% 1 2 3 2.07%
Hsinchu City 161 32 13 12 218 2.13% - 6 6 4.14%
Chiayi City 102 43 11 12 168 1.64% 2 1 3 2.07%
Chiayi County 71 20 8 13 112 1.09% 1 1 2 1.38%
Penghu County 23 40 14 2 79 0.77% - 1 1 0.69%
Kinmen and Matsu Islands 30 27 10 3 70 0.68% - 1 1 0.69%
Kinmen County 24 19 5 2 50 0.49% - 1 1 0.69%
Lianjiang County 6 8 5 1 20 0.20% - - - 0%
State of the literature
• The autocorrelationships between the digital characteristics of online learning courses (OLC)s and the
level of rural-urban Educational Divide (ED) are able to directly be broad-range analyzed as well as
high-profundity proved in order to resupply academic gap in relative Educational Divide (ED)
literatures.
• The Grey Relational Analysis (GRA) of quantitative analysis and the Fuzzy Set Qualitative Comparative
Analysis (fsQCA) of qualitative analysis re cross-utilized in this research in order to reinforce research
reliability, validity and representativeness. These analysis method are used to assess the results of
questionnaires given to professors’, senior industrialists’ and senior professionals’ experts.
Contribution of this paper to the literature
• The autocorrelationships between the digital characteristics of Online Learning Courses (OLCs) and
the level of rural-urban Education Divide (ED) are completely testified through the correlationships
evaluations of the educational features Mediators that directly and powerfully resupply the
educational research myth and gap.
• The Connectionization of Course Operation (C-CO) of the digital characteristics of Online Learning
Courses (OLCs) is positive to effectively enhance the educational features of the students’ basic
learning abilities (SBLA) and the education-institution learning capabilities (EILC) that empirically
provide the most beneficial niche strategy to minimize the rural-urban Education Divide (ED).

EURASIA J Math Sci and Tech Ed
3191
Table 2. The total number of Teachers in Taiwan in 2015
Taiwanese Regions Kindergartens Elementary
Schools
Junior High
Schools
Senior High
Schools Total Percentage
Total 46,169 97,374 50,394 55,340 299,889 100%
Taiwan Island 45,954 96,877 50,137 55,144 298,584 99.56%
New Taipei City 7,514 14,519 6,531 7,440 41,243 13.75%
Taipei City 4,908 9,886 5,345 8,222 39,583 13.20%
Taichung City 6,173 11,795 6,131 6,861 37,556 12.52%
Kaohsiung City 5,044 10,266 5,913 6,198 33,079 11.03%
Taoyuan City 4,332 9,078 5,516 4,310 27,401 9.14%
Tainan City 3,865 7,236 3,742 4,538 24,367 8.13%
Changhua County 2,412 5,386 2,757 2,960 14,993 5.00%
Pingtung County 1,491 3,668 1,720 1,736 10,111 3.37%
Yunlin County 1,172 3,415 1,582 1,691 8,799 2.93%
Hsinchu City 1,217 2,092 1,046 1,466 8,047 2.68%
Miaoli County 1,071 2,762 1,292 1,501 7,377 2.46%
Hsinchu County 1,463 2,831 1,395 938 7,202 2.40%
Nantou County 950 2,705 1,386 1,295 6,828 2.28%
Chiayi County 832 2,476 1,102 754 6,187 2.06%
Yilan County 972 2,142 1,251 1,087 6,126 2.04%
Taitung County 485 1,520 692 592 3,565 1.19%
Hualien County 678 1,886 950 962 5,571 1.86%
Penghu County 160 585 312 218 1,394 0.46%
Keelung City 609 1,469 713 1,122 4,594 1.53%
Chiayi City 606 1,160 761 1,253 4,560 1.52%
Kinmen and Matsu Islands 215 497 257 196 1,305 0.44%
Kinmen County 190 398 200 162 1,090 0.36%
Lianjiang County 25 99 57 34 215 0.07%
The total number of educational teachers in these institutions in the major cities totaled
203,230 or 67.77% of the total number of teachers in Taiwan (as shown in Table 2).
Because the majority of educational institutions and teachers resided in the six largest
cities in Taiwan, the country’s educational resources are significantly also directed to these
cities. Further, students of elite colleges and universities are heavily-represented from these
large cities. In order to effectively minimize the educational disparity of urban-rural and the
unbalance allocation of educational resources in Taiwan, the Taiwanese Education
Department of Executive Yuan has instituted and implemented the Multiple Entrance
Program (“MEP”) of HE’s recruiting examination because the recruiting examination of HE is
the most evaluated factor to be able to realize the level of rural-urban disparity and unbalance
of educational resources. MEP also includes the administration of the Star Plan which is a
system designed to assist students with lower studying abilities and capabilities in Taiwan’s
college admissions process. The overall objective of the Star Plan is to reduce the considerable
disparity and unbalance of educational resources between urban and rural regions in the
country by creating fair entrance opportunity of elite HE institutions. However, Star Plan in
Taiwan’s College Entrance System has carried on over implementing eight years and it has

M. Y. Hsieh / Education Divide Diminishment
3192
never reduced the educational disparity of urban-rural and the unbalance allocation of
educational resources in Taiwan. The most empirical reasons for this disparity are:
(1) HE institution elitism: The Star Plan implemented at these elite HE institutions have still
settled the higher academic-subject score-thresholds for applicants which means that a
majority of student applicants have to be, at least, top 5% of their class in order to enrolled
in a qualified elite HE institutions because each elite HE institution only want to recruit
the top students from rural and urban senior high schools; for example: National Taiwan
University (NTU,), ranking first place in Taiwan, set up the top 1% of entire class to be a
applied academic-subject score-threshold.
(2) Studying abilities and capabilities: some management, administrators, professors of these
elite HE institutions claim that some students recruited from the Star Plan as unable to
keep up with their classmates and it is an official and powerful excuse to support them to
set up more serious academic-subject score-thresholds of applied requirements.
(3) Students’ elitism: a majority of students in these elite HE institutions have resentment
towards students recruited from the Star Plan because these Star Plan students were not
required to pass the difficult entrance exam as the regular students did in order to
demonstrate their learning abilities and capabilities.
For these reason, Star Plan in Taiwan’s College Entrance System has already been
another convenient entrance door for original elite students from rural senior high schools; not
for urban students with lower academic-subject performances. Specifically, the serious urban-
rural disparity and unbalance of educational resources has become an Educational Divide
(“ED”) issue because elite student from senior high schools in city areas has been only one
recruited source of higher elite HE institutions in Taiwan. This Taiwanese education-system
development has resulted in if you want to study in elite senior high school, a prospect student
must be enrolled in an elite junior high school. The process repeats itself all the way through
kindergarten. Consequently, a family’s economic power and residential location have
spontaneously become one of the most critical factors in the students’ basic learning abilities
(“SBLA”) and the education-institution learning capabilities (“EILC”) (Biggs, 1999).
Nevertheless, in view of the swift development and speedy popularization of information and
telecommunication technologies, a majority of Taiwanese students obtain the knowledge and
information through Ho surfing the internet and downloading public up-to-date knowledge
as well as two-way sharing and uploading information from various websites in anytime and
anywhere through (Keskin & Metcalf, 2011) diversified Computer, Communication and
Consumer Electronics (“3C”) devices with online and Wireless Fidelity (“Wi-Fi”) functional
services, such as notebooks, smart phones and etc. This drives the bulk of current students
break through two learning restrictions (Bower & Christensen, 1995), time and space
limitations, of traditional education because current students are able to easily study from each
internet website in anytime and anywhere mode. In this hyper-competitive online technology
epoch, each student can be not only a traditional learner to singly acquire knowledge from
lecturers but also an educator to provide their own personal experience and professional

EURASIA J Math Sci and Tech Ed
3193
comments to each other through two-way learning platform in online learning course (“OLC”)
(Fini, 2009; Hill, 2012) without the geographic and time limitation of traditional face-to-face
educational circumstance (Norris, Sullivan, Poirot, & Soloway, 2003). Subsequently, making a
comprehensive survey on the relative ED researches fields (Damarin, 2000; Dickard &
Schneider, 2002; Saheb, 2005; Çilan, Bolat, & Coşkun, 2008; Singh, 2010), in consideration of
digital characteristics of OLCs, the digital characteristics of OLCs are positive to impact the
popularized level of OLCs (Song, Singleton, Hill, & Koh, 2004) ; the popularized level of OLCs
is able efficiently to enhance SBLA and EILC (Kizilceca, Sanagustínb, & Maldonadob, 2016)
and consequently, the intensification of SBLA and EILC is obviously able to an interfered
impact on the digital characteristics of OLCs and level of rural-urban ED (as referred Figure
1).
Figure 1. Research conceptual induction
However, no research can broad-range analyze as well as high-profundity prove the
autocorrelationships between the digital characteristics of OLCs and the level of rural-urban
ED and hence, this research, in order to re-supply this research gap, not only employs Grey
Relational Analysis (“GRA”) of qualitative analysis to complexly explore the weight-
questionnaires of ED and OLC experts for enhancing research reliability but also applies Fuzzy
Set Qualitative Comparative Analysis (“fsQCA”) method (Ragin, 1987; Huang & Hsieh, 2015)
of qualitative analysis (Basurto, 2013) to evaluate the measured GRA consequences for
strengthening research reliability to corroborate the autocorrelationships between the digital
characteristics of OLCs and the level of rural-urban ED in order to discover the best solution
for research topic.
LITERATURES REVIEWING
In sight of unbalance economically and politically regional developments between
rural cities and urban counties, a majority of national governments have always unfairly and
unequally distributed the educational sources have been into the higher economic
development areas with higher populations in order to not only reinforce the national
economic competitions but also obtain more political supporting from the increased number
of people votes. Eventually, this unbalance-and-unfair-distribution educational development

M. Y. Hsieh / Education Divide Diminishment
3194
in each phase of educational students and institutions has directly resulted in solemn ED that
more rural-city students snatch the bulk of educational opportunities from urban-counties
students (Tiene, 2002); for example: a mass of elite institutions only wants to recruit the elite
students from rural cities; not from urban counties (Fu & Ren, 2010). Especially, in the
diversified recruited application era, the fair recruiting examination system obviously has
been replaced the various student’s applications system which means the multiple subjects’
performances, such as art and music competition awards, and applied prepared documents,
such as recommendation from famous person, have superseded the traditional academic
recruiting examinations. For the reason, slight ED in elementary school phase must lead to
immense ED in higher education phase. Significantly, OLCs has approved to be a direct and
effective manner to conquer various Knowledge Divides (“KDs”) (Selwyn, Gorard, &
Williams, 2001; Hsieh, 2014, Milligan & Littlejohn, 2016) through the swift development in
internet, online and telecommunication technologies (Kerka, 1997). Significantly, this research
explores the exploration of cause-and-effect relations among the digital characteristics of
OLCs, the popularization of OLCs and the level of rural-urban ED through the educational
features of (Hattie, Biggs, & Purdie, 1996; Ravenscroft, 2011) and EILC (Burbules, Nicholas, &
Callister, 2000) to assay the most discussed research mainstream issue – “is OLCs also the best
solution for the rural-urban ED?”. For the reason, taking the educational features of SBLA into
consideration, the critical twelve assessed elements of SBLA have been distinctively integrated
and then defined as Academic Lecturing (“AL”), Question Stimulation (“QS”)( Pool, Koolstra,
& van der Voort, 2003), Concept Mapping (“CM”) (Kop, Fournier, & Mak, 2011), Tutorial
Teaching (“TT”), Excursion Demonstration (“EDN”) (Eklo¨f, 2010), Seminar Exemplify (“SF”),
Learning Elaboration (“LE”) (Hsieh & Chan, 2016), Peer Lecturing (“PL”) (Gamoran, 1987),
Spontaneous Collaboration (“SC”), Generic Study Techniques (“GST”), Content Study
Techniques (“CST”) (Fairlie & London, 2011) and Metacognitive Learning Techniques
(“MLT”) (Grimes & Warschauer, 2008). Moreover, in view of the educational features of EILC,
the most crucial seven assessed factors of EILC have been apparently refined as Flexible
standardization (“FS”) (Gamoran, 1987), Creative literacy and Numeracy (“CLN”) (Rowan,
Brian, & Jr. 1983), Consequential Accountability (“CA”) (Biggs, 1999), Intelligent
Accountability with trust-based professionalism (“IATP”) (Lee, Valerie, & Smith, 1993),
Comprehensive Laboratory (“CL”), Advance Organizer (“AO”) (Simpson 1981) and Various
Learning Groups (“VLG”) (Warschauer, Knobel, & Leeann, 2004). In order to testify the most
discussed research mainstream issue, the critical twelve assessed elements of SBLA and the
most crucial seven assessed factors of EILC have been applied in evaluated statistics in this
research in order to explore the most beneficial determinants of OLCs to overcome the rural-
urban ED. In diminishment with avoidance and diminishment of uncertainty and indecision
in assessed measurements of surveyed questionnaires, Deng (1982) employed the fuzzified
concept of the fuzzy theory in MCDM methodology to induce GRA approach of quantitative
analysis to dwell on the entire dependences and independences among each analytical
variables or assessed criteria in order to identify and conclude the most appropriate solutions
for diversified decision-making issues in social science research fields (Hsieh, Yan, Hung, &

EURASIA J Math Sci and Tech Ed
3195
Jane, 2014; Hsieh, 2016a; Hung et al., 2016); for example: macroeconomic circumstances (Hsieh,
2012), advantage-analyses of regional economy, industrial structure analysis (Hsieh, 2016c),
industrial finance analysis, and etc. In accordance with essential concept and assumption of
GRA, the number of entire interviewee’s choices of weight-questionnaire are greified into the
grey section between the white-color point (best solution) and block-color (worst solution) and
therefore, the appropriate solutions are able to not only identify but also further refine through
a series of complicated greified measurements of Grey Correlation Coefficient (“GCC”, 𝑥𝑖∗)
and Grey Correlation Grade (“GCG”, 𝑟𝑖∗) of each evaluate criterion (Hsieh, Hsu, & Lin, 2016).
Extraordinarily, in accordance with higher research representativeness and reliability, the
Delphi method has always been applied into the statistic assessments of GRA approach
because the interviewed questionnaire of Delphi method is briefly collected from experts,
specialists or professionals. Subsequently, in consideration with a range of greified equations
(Deng, 1989), the five fundamental greified measure-steps are described as:
(1) First greified measure-step: confirming the correspondances among each assessed criteria
in accordance with research topic, the independent variable is defined as 𝑋𝑖 = {𝑋𝑖(𝑘)|𝑘 =
1, 2, … , 𝑛}, 𝑖 = 1, 2, … ,𝑚 and then, dependent variable is further defined as 𝑌 = {𝑌(𝑘)|𝑘 =
1, 2, … , 𝑛}.
(2) Second greified measured step – nondimensionalizing each surveyed data: in order to
identify the influence of each independent variable on each dependent variable, the evaluated
criteria of the number of columns has been nondimensionalized as 𝑋𝑖(𝑘) =𝑋𝑖(𝑘)
𝑋𝑖(𝑇), 𝑘 =
1, 2, … , 𝑛; 𝑖 = 1, 2, … ,𝑚 in order to calculate the analytical comparison measurements.
(3) Third greified measured step – computing Grey Correlation Coefficient (“GCC”, 𝑥𝑖∗) of
GRA approach: GCC of each assessed criterion nondimensionalizing each surveyed data are
further measured in the calculated equations (1), (2) and (3) in accordance with the three kinds
of maximized, minimized and specific characteristics of assessed criteria (considered
elements) as follows:
The nondimensionalizing surveyed data belongs efficient goal (maximum is positive) and
GCC of each assessed criterion are
𝐺𝐶𝐶𝑥𝑖∗ =
𝑥𝑖(0)(𝑘) − min 𝑥𝑖
(0)(𝑘)
max 𝑥𝑖(0)(𝑘) − min𝑥𝑖
(0)(𝑘) (1)
The nondimensionalizing surveyed data belongs inefficient goal (minimum is positive) and
GCC of each assessed criterion are
𝐺𝐶𝐶𝑥𝑖∗ =
min𝑥𝑖(0)(𝑘) − 𝑥𝑖
(0)(𝑘)
max 𝑥𝑖(0)(𝑘) − min𝑥𝑖
(0)(𝑘) (2)
The nondimensionalizing surveyed data belongs specific assessed gold and GCC of each
assessed criterion are

M. Y. Hsieh / Education Divide Diminishment
3196
𝐺𝐶𝐶𝑥𝑖∗ = 1 −
|𝑥𝑖(0)(𝑘) − 𝑂𝐵|
max {max [𝑥𝑖(0)(𝑘)] − 𝑂𝐵,𝑂𝐵 −min[𝑥𝑖
(0)(𝑘)]} (3)
In GCC computing equations, 𝑥𝑖(0)(𝑘) presents original data; 𝑥𝑖
∗ expresses greified date;
min𝑥𝑖(0)(𝑘)describes the minimum of original data and max𝑥𝑖
(0)(𝑘) presents the maximum of
original data.
(4) Fourth greified measured step – measuring Grey Correlation Grade (“GCG”,𝑟𝑖∗) of GRA
approach: after computing GCCs of each assessed criterion, GCGs of each assessed criterion
are further calculated in the measured equations (4) for identifying the influence of each
independent variable on each dependent variable and measured GCG equation are
𝐺𝐶𝐺𝑥𝑖∗ =
|𝑚𝑖𝑛𝑥𝑖(0)(𝑘) + 𝛿∗max𝑥𝑖
(0) (𝑘)|
|1 − 𝑥𝑖(0)(𝑘) + 𝛿∗max𝑥𝑖
(0) (𝑘)| (4)
(5) Fifth greified measured step – calculating Grey Correlation Ranking (“GCK”, 𝑟𝑖∗) of GRA
approach: after measuing GCGs of each assessed criterion, GCK of each assessed criterion is
finally induced for discovering the potential and concrete influences of each independent
variable on each dependent variable and GCK greified equation (5) is
𝐺𝐶𝑅𝑟𝑖∗ =
1
𝑛∑ 휀𝑖(𝑘)
𝑛
𝑘=1
, 𝑘 = 1, 2, … , 𝑛
However, in order to enhance the research reliability, the calculated concept of geometric
mean (√∏ 𝑋𝑖𝑛𝑖=1
𝑛 = √𝑋1𝑋2…𝑋𝑛𝑛 ) was further considered into the original GCK greified
equation as
𝐺𝐶𝑅𝑟𝑖∗ = √∑ 휀(𝑘)
𝑛
𝑘=1
𝑛
, 𝑘 = 1, 2,… , 𝑛 (5)
Exceptionally, fsQCA approach of qualitative analysis is further utilized to testify each
GCG of GRA approach in consideration with the increment of research reliability. fsQCA
approach qualitative analysis (Ragin, 2000) is soured from the initial Qualitative Comparative
Analysis (“QCA”) method of the Boolean Algebra Theory (“BAT”) and QCA method is
directly able to evaluate the linear correspondences between each analytical criterion
(independent variable) and each induced solution (dependent variable). In analytical
measurements of QCA method, the Crisp Set Qualitative Comparative Analysis (“csQCA”)
has firstly been created to explore the dependences (crisp set, “cs”) between two valuable
groups (Ragin, 2008): “in” variables (𝑋1, 𝑋2, … , 𝑋𝑛) and “out” variables (𝑌1, 𝑌2, … , 𝑌𝑛). Basically,
according to the essential concept of QCA method, the two relation-circumstance between “in”
and “out” variables to be in analytical processes: (1) “sufficient analysis”: any “in” variable
can be “possibly” and not be “necessarily” bring about “out” variable and (2) “necessarity

EURASIA J Math Sci and Tech Ed
3197
analysis”: any “in” condition is necessary to affect “out” condition. Subsequently, in these
analytical relation-circumstances, “consistency” is the extent to which a causal combination
generates an outcome and “coverage” is how many surveyed samples with the outcome are
represented by a causal condition (Ragin et al., 2006). Furthermore, if the “in” class (𝑋𝑖) value
is less than or equal to the “out” class (𝑌𝑖) values, the analyses of fsQCA approach belong
“sufficient analysis” and the consistency and coverage are computed as (Schneider &
Grofman, 2006).
consistency(𝑋𝑖 ≤ 𝑌𝑖) =∑min(𝑋𝑖, 𝑌𝑖)
∑(𝑋𝑖) (6)
coverage(𝑋𝑖 ≤ 𝑌𝑖) =∑min(𝑋𝑖 , 𝑌𝑖)
∑𝑌𝑖 (7)
Continuously, if “in” class(𝑋𝑖) value is bigger than the “out” class class(𝑌𝑖) values, the
analyses of fsQCA approach belong “necessity analysis” and the consistency and coverage are
computed as (Mendel & Korjani, 2012).
consistency(𝑋𝑖 ≻ 𝑌𝑖) =∑min(𝑋𝑖 , 𝑌𝑖)
∑(𝑋𝑖) (8)
coverage(𝑋𝑖 ≻ 𝑌𝑖) =∑min(𝑋𝑖, 𝑌𝑖)
∑𝑌𝑖 (9)
RESEARCH DESIGN
Taking interviewed experts into account for going through research analyses and
research evaluation, there are fifteen experts were interviewed in person for collection of
expert’s weight-questionnaires to inductively detect interplays among the digital
characteristics of OLCs (independent variables), SBLA and EILC (evaluated mediators) and
the level of rural-urban ED (Dependent Variables) because the surveyed research of Dalkey
and Helmer (1963) concluded that the collected questionnaires are, at least, over 10
professional interviewees of the total surveyed data in the Delphi method and expertise
brainstorm approach for higher research reliability and representativeness. For the reason, the
interviewees of collected expert’s questionnaire are 15 experts including five professors who
have, a long time, at least over 15 years, in relative ED, SBLA and EILC educational research
fields; five senior industrialists who have over 10-year working experiences in the related OLC
industries and final five senior professionals who have over 10-year analyzing experience in
the interrelated ED, SBLA and EILC of empirical or government research institutions. The
interviewed questionnaire data were surveyed, in person, for the pairwise comparisons at each
level are evaluated with respect to the related interdependence and importance from equal
important (1) to extreme important (5) of Likert’s scales. Contiguously, in connection with
evaluated criteria and in stretch with author’s prior researches in relative OLCs fields, the most
the key-critical determinants of OLCs (Hsieh, 2016) are re-employed to explore the
dependences between digital characteristics of OLCs (independent variables), SBLA and EILC
(evaluated mediators) in order to detect the autocorrelationships between the digital

M. Y. Hsieh / Education Divide Diminishment
3198
characterisitics of OLCs and the level of rural-urban ED. Subsequently, the ten potential
assessed determinants were integrated from the authors’ prior related researches and these
determinants are Aggregation Technology Function of Basic Function (“ATF-BC”) (Fournier,
Kop, & Sitlia, 2011; Lawless & Richardson, 2002), Course Evaluation Technology Function of
Course Function (“CETF-CF”) (Han, Yalvac, Capraro, & Capraro, 2015), Course
Professionalization Technology Function of Course Function (“CPTF-CF”) (Kop & Carroll,
2012), Feedback Technology Function of Basic Function (“FTF-BF”) (Kop & Hill, 2008), Re-
purposing Technology Function of Basic Function (“RTF-BF”) (Kop, Fournier, & Mak, 2011),
Connectionization of Course Operation (“C-CO”) (Hazel, Conrad, & Martin, 1997), Openness
of Course Content (“O-CC”) (Yuan, MacNeill, & Kraan, 2008), Convenience of Course
Operation (“C-CP”) (Hu & Kuh, 2002), Course Complete Rate of Course Assessment (“CCR-
CA”) (Kelland, 2006) and User Completely Unrestricted Operation of Course Operation
(“UCUO-CO”) (Kember, 1995). In succession, making allowance for the essential research
methodology, the evaluated measurements are completely referred as a range of greified (1),
(2), (3), (4) and (5) equations of five fundamental greified measure-steps and (6), (7), (8) and
(9) of one brief fsQCA verify-step in next empirical measurements session.
EVALUATED MEASUREMENTS
Therefore, in order to make probe into the autocorrelationships between the digital
characteristics of OLCs and the level of rural-urban ED in high-technology era, the 15 expert’s
weight-questionnaires has systematically collected by Delphi method and further, GRA and
fsQCA approaches have been employed to comprehensively evaluated these surveyed
experts’ weight-questionnaires. Moreover, there are five main measured-steps to be
implemented and these steps are:
First greified measure-step: confirming the correspondences among each assessed criteria in
accordance with research topic: in consideration with research conceptual induction as Figure
1, the digital characteristics of OLCs were considered as assessed independent variables 𝑋𝑖 =
{𝑋𝑖(𝑘)|𝑘 = 1, 2, … , 𝑛}, 𝑖 = 1, 2, … , 10 and the educational features of SBLA and EILC
(Mediators) were recognized as appraised dependent variables (𝑌 =
{𝑌𝑆𝐵𝐿𝐴(𝑘)|𝑘 = 1, 2, … , 12; 𝑌𝐸𝐼𝐿𝐶(𝐿)|𝐿 = 1, 2, … , 7})to verify the correlationships between the
digital characteristics of OLCs and the educational features of SBLA and EILC (Mediators) in
order to eventually realize the autocorrelationships between the digital characteristics of OLCs
and the level of rural-urban ED.

EURASIA J Math Sci and Tech Ed
3199
Figure 2. Research evaluated route
Second greified measured step – nondimensionalizing each surveyed data: the 15 experts’
weight-questionnaires were gathered in person and specifically, in consideration with the
increment of research reliability and representativeness, these surveyed data has further re-
computed by geometric mean (√∏ 𝑋𝑖𝑛𝑖=1
𝑛 = √𝑋1𝑋2…𝑋𝑛𝑛 ) and computations are demonstrated
in Table 3.
Table 3. The geometric mean of 15 experts’ weigh-questionnaires data
Independent
Variables
Mediators
The educational features of SBLA The educational features of EILC
The digital
characteristics
of OLCs
AL QS CM TT EDN SE LE PL SC GST CST MLT FS CLN CA IATP CL AO VLG
ATF-BC 3.5847 3.7088 3.5566 3.4646 3.5596 3.5166 3.7248 3.0161 3.7807 3.0904 3.507 3.3082 3.9487 3.0292 3.3988 3.3988 3.8737 3.4552 3.4552
CETF-CF 3.5166 3.0292 3.6129 3.4646 3.4498 3.3722 3.6829 3.3722 3.6829 3.3722 3.4042 3.4135 3.8737 3.6571 3.6384 3.294 3.3134 3.1638 3.1037
CPTF-CF 3.5166 3.6929 3.1811 3.7088 3.5166 3.7838 3.4228 3.3988 3.3486 3.0447 3.8105 3.053 3.7704 3.2823 3.4014 3.4135 3.5749 3.4796 3.2112
FTF-BF 3.8105 3.6541 3.5166 3.5166 3.8571 3.3486 3.1588 3.6829 3.5847 3.4375 3.6384 3.3315 3.547 3.901 3.8105 3.9317 3.4135 3.2505 3.4042
RTF-BF 3.5847 3.4891 3.8842 3.3722 3.492 3.9425 3.8539 3.4986 3.4375 3.22 3.6829 3.2992 3.3722 3.7807 3.2734 3.0662 3.0662 3.3486 3.1887
C-CO 3.8842 3.6541 3.7542 3.6129 3.5596 3.8105 3.1588 3.7381 3.2112 3.7381 3.5596 3.7838 3.8842 3.6829 3.4135 3.4404 3.1638 3.3722 3.4646
O-CC 4.0679 3.6541 3.8269 3.2593 3.6384 3.7704 3.0746 3.6384 3.3486 3.4552 3.6541 3.4228 3.3082 3.5596 3.6285 3.396 3.6441 3.0662 3.3631
C-CP 3.8676 3.8842 3.7248 3.5596 3.5166 3.6988 3.3842 3.5596 3.7381 3.7542 3.6285 3.5566 3.6285 3.3224 3.3722 3.0422 3.5317 3.4552 3.2992
CCR-CA 3.3578 3.4498 3.7279 3.7941 3.3988 3.8571 3.3315 3.4404 3.492 3.6829 3.3486 3.2992 3.8737 3.5847 3.4228 3.2112 3.3224 3.6988 3.3395
UCUO-CO 3.8105 3.6988 3.6988 3.5596 3.507 3.7542 3.3343 3.6829 3.1974 3.7279 3.3343 3.2593 3.0878 3.4135 3.8269 3.3486 3.5749 3.2823 3.3459
Third greified measured step – computing 𝐺𝐶𝐶(𝑋𝑖∗) of GRA approach: the geometric
mean of 15 experts’ weight-questionnaires are nondimensionalized by the greified (1) equation
as expressed in Table 4, because of these nondimensionalizing surveyed data belongs efficient
goal (maximum is positive), to concretely testify the correlationships between the digital
characteristics of OLCs and the educational features of SBLA and EILC (Mediators).

M. Y. Hsieh / Education Divide Diminishment
3200
Table 4. GCCs of 15 experts’ weigh-questionnaires
Independent
Variables
Mediators
The educational features of SBLA The educational features of EILC
The digital
characteristics
of OLCs
AL QS CM TT EDN SE LE PL SC GST CST MLT FS CLN CA IATP CL AO VLG
ATF-BC 0.3195 0.7949 0.5341 0.3839 0.3508 0.2828 0.8344 0 1 0.0643 0.3628 0.3492 1 0 0.2266 0.4009 1 0.615 0.9739
CETF-CF 0.2236 0 0.6141 0.3839 0.1112 0.0397 0.7806 0.4933 0.8324 0.4616 0.1469 0.4933 0.9129 0.7203 0.6594 0.283 0.3062 0.1543 0
CPTF-CF 0.2236 0.7762 0 0.8406 0.2569 0.7328 0.4468 0.5301 0.2593 0 1 0 0.7929 0.2904 0.2313 0.4174 0.63 0.6535 0.2979
FTF-BF 0.6374 0.7308 0.4771 0.481 1 0 0.1081 0.9235 0.664 0.5537 0.6387 0.3811 0.5333 1 0.9703 1 0.4301 0.2913 0.8326
RTF-BF 0.3195 0.5378 1 0.2111 0.2032 1 1 0.6682 0.4117 0.247 0.7321 0.3369 0.3304 0.862 0 0.0270 0 0.4465 0.2356
C-CO 0.7413 0.7308 0.8151 0.6612 0.3508 0.7777 0.1081 1 0.0236 0.9773 0.4731 1 0.9251 0.7498 0.2531 0.4476 0.1209 0.4838 1
O-CC 1 0.7308 0.9184 0 0.5228 0.7102 0 0.8619 0.2593 0.5786 0.6716 0.506 0.256 0.6084 0.6416 0.3977 0.7157 0 0.7186
C-CP 0.7178 1 0.7733 0.5614 0.2569 0.5896 0.3974 0.7527 0.927 1 0.6179 0.6891 0.6281 0.3364 0.1786 0 0.5765 0.615 0.5416
CCR-CA 0 0.4919 0.7777 1 0 0.8562 0.3297 0.5877 0.505 0.8995 0.0302 0.3369 0.9129 0.6372 0.2699 0.19 0.3173 1 0.6534
UCUO-CO 0.6374 0.7831 0.7362 0.5614 0.2361 0.683 0.3333 0.9235 0 0.963 0 0.2823 0 0.4408 1 0.3445 0.63 0.3416 0.6709
Fourth greified measured step – measuring 𝐺𝐶𝐶(𝑟𝑖∗) of GRA approach: after measuring
GCCs of 15 experts’ weight-questionnaires, GCGs of these survey data are further measured
by greified (4) equation as presented in Table 5.
Table 5. GCGs of 15 experts’ weigh-questionnaires
Independent
Variables
Mediators
The educational features of SBLA The educational features of EILC
The digital
characteristics
of OLCs
AL QS CM TT EDN SE LE PL SC GST CST MLT FS CLN CA IATP CL AO VLG
ATF-BC 0.4235 0.7091 0.5176 0.448 0.4351 0.4108 0.7512 0.3333 1 0.3483 0.4397 0.4345 1 0.3333 0.3927 0.4549 1 0.565 0.9504
CETF-CF 0.3917 0.3333 0.5644 0.448 0.36 0.3424 0.695 0.4967 0.7489 0.4815 0.3695 0.4967 0.8516 0.6412 0.5948 0.4109 0.4188 0.3715 0.3333
CPTF-CF 0.3917 0.6908 0.3333 0.7582 0.4022 0.6517 0.4748 0.5155 0.403 0.3333 1 0.3333 0.7071 0.4133 0.3941 0.4618 0.5747 0.5907 0.4159
FTF-BF 0.5797 0.65 0.4888 0.4907 1 0.3333 0.3592 0.8674 0.5981 0.5284 0.5805 0.4469 0.5172 1 0.944 1 0.4673 0.4137 0.7491
RTF-BF 0.4235 0.5197 1 0.3879 0.3856 1 1 0.6011 0.4594 0.399 0.6511 0.4299 0.4275 0.7837 0.3333 0.3394 0.3333 0.4746 0.3954
C-CO 0.659 0.65 0.73 0.5961 0.4351 0.6922 0.3592 1 0.3387 0.9565 0.4869 1 0.8698 0.6665 0.401 0.4751 0.3625 0.492 1
O-CC 1 0.65 0.8597 0.3333 0.5117 0.6331 0.3333 0.7836 0.403 0.5427 0.6036 0.503 0.4019 0.5608 0.5825 0.4536 0.6375 0.3333 0.6399
C-CP 0.6393 1 0.688 0.5327 0.4022 0.5492 0.4535 0.6691 0.8726 1 0.5668 0.6166 0.5734 0.4297 0.3784 0.3333 0.5414 0.565 0.5217
CCR-CA 0.3333 0.496 0.6922 1 0.3333 0.7766 0.4272 0.5480 0.5025 0.8326 0.3402 0.4299 0.8516 0.5795 0.4065 0.3817 0.4228 1 0.5906
UCUO-CO 0.5797 0.6974 0.6546 0.5327 0.3956 0.612 0.4285 0.8674 0.3333 0.931 0.3333 0.4106 0.3333 0.4721 1 0.4327 0.5747 0.4316 0.6031
Table 6. GCK of 15 experts’ weigh-questionnaires
Independent Variables Mediators
The educational features of SBLA The educational features of EILC
The digital characteristics of OLCs
ATF-BC 0.4932 0.6115
CETF-CF 0.4614 0.4914
CPTF-CF 0.491 0.4972
FTF-BF 0.5502 0.6849
RTF-BF 0.5631 0.4217
C-CO 0.6193 0.5706
O-CC 0.5645 0.5026
C-CP 0.6408 0.4686
CCR-CA 0.5236 0.5682
UCUO-CO 0.5341 0.5193

EURASIA J Math Sci and Tech Ed
3201
Table 7. The consistency and coverage of the educational features of SBLA
Model: output = f(gcg1, gcg2, gcg3, gcg4, gcg5, gcg6, lpgcc, ptgcc, scgcc, gssgcc, cssgcc, mlsgcc)
Results Raw coverage Unique coverage Consistency
F1 ~gcg1*gcg3*~gcg4*~gcg5*~gcg6*lpgcc*~ptgcc*scgcc*~gssgcc*~cssgcc*~mlsgcc 0.14175 0.097453 1
F2 gcg1*gcg2*gcg3*gcg4*~gcg5*gcg6*~lpgcc*ptgcc*~scgcc*gssgcc*~cssgcc 0.204873 0.078627 1
F3 ~gcg1*gcg2*~gcg3*gcg4*~gcg5*gcg6*~lpgcc*ptgcc*~scgcc*~gssgcc*cssgcc*~mlsgcc 0.09856 0.044297 1
F4 ~gcg1*~gcg2*gcg3*gcg4*~gcg5*gcg6*~lpgcc*ptgcc*scgcc*gssgcc*~cssgcc*~mlsgcc 0.097453 0.028793 1
F5 ~gcg1*gcg2*gcg3*~gcg4*~gcg5*gcg6*lpgcc*ptgcc*~scgcc*~gssgcc*cssgcc*~mlsgcc 0.108527 0.055371 1
F6 gcg1*gcg2*~gcg3*~gcg4*gcg5*~gcg6*~lpgcc*ptgcc*scgcc*gssgcc*cssgcc*~mlsgcc 0.120709 0.0299 1
F7 gcg1*gcg2*gcg3*~gcg4*gcg5*gcg6*~lpgcc*ptgcc*~scgcc*gssgcc*cssgcc*mlsgcc 0.155039 0.0299 1
F8 gcg1*gcg2*gcg3*gcg4*~gcg5*gcg6*~lpgcc*ptgcc*scgcc*gssgcc*cssgcc*mlsgcc 0.115172 0.036545 1
Solution coverage: 0.586932
Solution consistency: 1
Fifth greified measured step – calculating 𝐺𝐶𝐾(𝑟𝑖∗)of GRA approach: after calculating
GCCs of 15 experts’ weight-questionnaires, GCK of these survey data is consequently induced
by the greified (5) equation as illustrated in Table 6 for detecting the correlationships between
the digital characteristics of OLCs and the educational features of SBLA and EILC (Mediators)
in order to eventually realize the autocorrelationships between the digital characterisitics of
OLCs and the level of rural-urban ED.
Sixth fsQCA measured step –gauging consistency and coverage of fsQCA method:
behind a rang of evaluated measurements of GRA approach, the measured consequences of
GRA approach are further re-measured the consistency and coverage between the digital
characteristics of OLCs and the educational features of SBLA and EILC (Mediators) because
the “consistency” is the extent to which a causal combination generates an outcome and
“coverage” is how many surveyed samples with the outcome are represented by a causal
condition. As a result, the consistency and coverage of the educational features of SBLA and
EILC are computed through equations (6), (7), (8) and (9) as described in Table 7 and 8.

M. Y. Hsieh / Education Divide Diminishment
3202
Table 8. The consistency and coverage of the educational features of EILC
Results Raw coverage Unique coverage Consistency
F1 sfgcc*~clgcc*~cagcc*~iatpgcc*lgcc*aogcc 0.286052 0.169031 1
F2 sfgcc*clgcc*~cagcc*~iatpgcc*~lgcc*vggcc 0.257683 0.107565 1
F3 ~sfgcc*cagcc*~iatpgcc*lgcc*~aogcc*vggcc 0.212766 0.134752 1
F4 ~sfgcc*clgcc*~cagcc*~iatpgcc*~lgcc*~aogcc*~vggcc 0.160756 0.052009 1
F5 sfgcc*clgcc*cagcc*~iatpgcc*~lgcc*~aogcc*~vggcc 0.157210 0.076832 1
F6 sfgcc*clgcc*cagcc*iatpgcc*~lgcc*~aogcc*vggcc 0.141844 0.062648 1
Solution coverage: 0.763593
Solution consistency: 1
Extraordinarily, in connection with Table 5 and 6, the coverage of the educational
features of SBLA and EILC are bigger than 0.5, the consistency of the educational features of
SBLA and EILC are both 1 and the number of fsQCA equations of the educational features of
SBLA and EILC are located at the up side of fsQCA standardized linear. This results obviously
indicates evaluated consequences of GCGs and GCR both belong “necessity” circumstance
and consequently, all the digital characteristics of OLCs are positive correlationships between
the digital characteristics of OLCs and the educational features of SBLA and EILC.
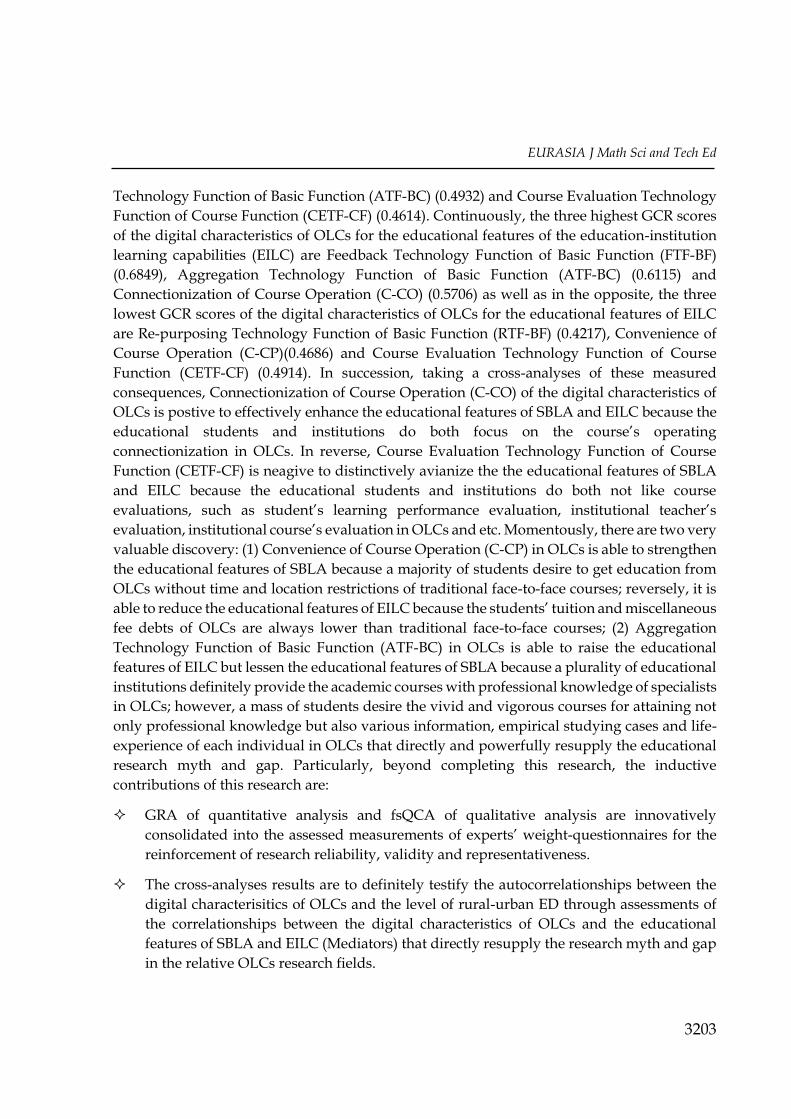
CONCLUSION AND RECOMMENDATION
Taking a series of assessed measurements and consequences of GRA and fsQCA approaches,
the three highest GCR scores of the digital characteristics of Online Learning Courses (OLCs)
for the educational features of the students’ basic learning abilities (SBLA) are Convenience of
Course Operation (C-CP)(0.6408), Connectionization of Course Operation (C-CO) (0.6193) and
Openness of Course Content (O-CC) (0.5645) as well as on the contrary, the three lowest GCR
scores of the digital characteristics of OLCs for the educational features of SBLA are Course
Evaluation Technology Function of Course Function (CETF-CF) (0.4614), Aggregation
EURASIA J Math Sci and Tech Ed
3203
Technology Function of Basic Function (ATF-BC) (0.4932) and Course Evaluation Technology
Function of Course Function (CETF-CF) (0.4614). Continuously, the three highest GCR scores
of the digital characteristics of OLCs for the educational features of the education-institution
learning capabilities (EILC) are Feedback Technology Function of Basic Function (FTF-BF)
(0.6849), Aggregation Technology Function of Basic Function (ATF-BC) (0.6115) and
Connectionization of Course Operation (C-CO) (0.5706) as well as in the opposite, the three
lowest GCR scores of the digital characteristics of OLCs for the educational features of EILC
are Re-purposing Technology Function of Basic Function (RTF-BF) (0.4217), Convenience of
Course Operation (C-CP)(0.4686) and Course Evaluation Technology Function of Course
Function (CETF-CF) (0.4914). In succession, taking a cross-analyses of these measured
consequences, Connectionization of Course Operation (C-CO) of the digital characteristics of
OLCs is postive to effectively enhance the educational features of SBLA and EILC because the
educational students and institutions do both focus on the course’s operating
connectionization in OLCs. In reverse, Course Evaluation Technology Function of Course
Function (CETF-CF) is neagive to distinctively avianize the the educational features of SBLA
and EILC because the educational students and institutions do both not like course
evaluations, such as student’s learning performance evaluation, institutional teacher’s
evaluation, institutional course’s evaluation in OLCs and etc. Momentously, there are two very
valuable discovery: (1) Convenience of Course Operation (C-CP) in OLCs is able to strengthen
the educational features of SBLA because a majority of students desire to get education from
OLCs without time and location restrictions of traditional face-to-face courses; reversely, it is
able to reduce the educational features of EILC because the students’ tuition and miscellaneous
fee debts of OLCs are always lower than traditional face-to-face courses; (2) Aggregation
Technology Function of Basic Function (ATF-BC) in OLCs is able to raise the educational
features of EILC but lessen the educational features of SBLA because a plurality of educational
institutions definitely provide the academic courses with professional knowledge of specialists
in OLCs; however, a mass of students desire the vivid and vigorous courses for attaining not
only professional knowledge but also various information, empirical studying cases and life-
experience of each individual in OLCs that directly and powerfully resupply the educational
research myth and gap. Particularly, beyond completing this research, the inductive
contributions of this research are:
GRA of quantitative analysis and fsQCA of qualitative analysis are innovatively
consolidated into the assessed measurements of experts’ weight-questionnaires for the
reinforcement of research reliability, validity and representativeness.
The cross-analyses results are to definitely testify the autocorrelationships between the
digital characterisitics of OLCs and the level of rural-urban ED through assessments of
the correlationships between the digital characteristics of OLCs and the educational
features of SBLA and EILC (Mediators) that directly resupply the research myth and gap
in the relative OLCs research fields.

M. Y. Hsieh / Education Divide Diminishment
3204
Connectionization of Course Operation (C-CO) of the digital characteristics of OLCs is
most critical determinant to empirically provide the most beneficial niche strategy to the
Taiwanese educational government departments and institutions to establish the most
effective and efficient OLCs in order to overcome the serious rural-urban education
divide.
Eventually, in terms of the swift development of diversified educational technologies,
some digital characteristics of OLCs are still continuously creating and discovering and
therefore, these developing digital characteristics of OLCs may become the research limitation
in this study. However, the evaluated model of this research is able to provide the effective
and efficient methodology for future research direction to identify and assess these innovative
digital characteristics of OLCs in order to find out the most critical solutions for the decrement
of ED in this dynamic education era.
REFERENCES
Angus, L. & Snyder, I. (2003). Families, cultural resources and the digital divide: leTs and educational (dis)advantage, Australian Journal of Education, 47(1), 18–39.
Basurto, X. (2013). Linking multi-level governance to local common-pool resource theory using fuzzy-set qualitative comparative analysis: Insights from twenty years of biodiversity conservation in Costa Rica. Global Environmental Change, 23(3), 573–587. doi: 10.1016/j.gloenvcha.2013.02.011
Biggs, J. (1999). What the Student Does: teaching for enhanced Learning, Higher Education Research & Development, 18(1), 57–75.
Bower, J. & Christensen, C., (1995). Disruptive technologies: Catching the wave. Harvard Business Review, 41–53. Available on-line at https://cbred.uwf.edu/sahls/medicalinformatics/docfiles/Disruptive Technologies.pdf
Burbules, N. C. & Callister, T. A (2000). Universities in Transition: The Promise and the Challenge of New Technologies. Teachers College Record 102, 271–293. Available on-line at http://www.tcrecord.org/Content.asp?ContentlD=10362
Çilan, Ç.A., Bolat, B.A. & Coşkun, E. (2008). Analyzing digital divide within and between member and candidate countries of European Union. In Government Information Quarterly, 28(1), 98–105.
Connollya, T. M., MacArthurb, E., Stansfielda, M. & McLellana, E. (2007). A quasi-experimental study of three online learning courses in computing. Computers & Education, 49(2), 345–359. doi:10.1016/j.compedu.2005.09.001
Dalkey, N. & Helmer, O. (1963). An experimental application of the Delphi method to the use of experts. Management Science, 9: 458–467. doi: 10.1287/mnsc.9.3.458
Damarin, S. (2000). The “digital divide” versus digital differences: Principles for equitable use of technology in education. Educational Technology, 3(11), 14–26.
Deng, J. (1982). The control problems of grey systems. System Control Letter, 5(1), 288–294. doi:10.1016/S0167-6911(82)80025-X
Deng, J. (1989). Introduction to grey system theory. Journal of Grey System, 1(1), 1–24. doi: 10.1007/978-3-642-16158-2_1
Dickard, N. & Schneider, D. (2002). The digital divide: Where we are. Retrieved from http://www.edutopia.org/digital-divide-where-we-aretod

EURASIA J Math Sci and Tech Ed
3205
Eklöf, H. (2010). Skill and will: Test-taking motivation and assessment quality. Assessment in Education, 17(4), 345–356.
Fairlie, R. W. & London, R. A. (2011). The effects of home computers on educational outcomes: Evidence from a field experiment with community college students. The Economic Journal, 122(561), 727–753.
Fini, A. (2009). The technological dimension of a massive open online course: The Case of the CCK08 course tools. The International Review of Research in Open and Distance Learning, 10(5), 1–26. Retrieved from http://www.irrodl.org/index.php/irrodl/article/view/643/1410
Fournier, H., Kop, R. & Sitlia, H. (2011). The value of learning analytics to networked learning on a personal learning environment. Proceedings of the 1st International Conference on Learning Analytics and Knowledge, 104–109. doi: 10.1145/2090116.2090131
Fu, Q., & Ren, Q. (2010). Educational inequality under China’s rural- urban divide: The hukou system and return to education, Environment and Planning A, 42(2010), 59 –610. doi:10.1068/a42101
Gamoran, A. (1987). The Stratification of High School Learning Opportunities. Sociology of Education, 60(1), 135–155.
Grimes, D., & Warschauer, M. (2008). Learning with laptop: A multimethod case study. Journal of Educational Computing Research, 38(3), 305–332.
Han, S., Yalvac, B., Capraro, M. M. & Capraro, R. M. (2015). In-service teachers’ implementation and understanding of STEM project based learning. Eurasia Journal of Mathematics, Science & Technology Education, 11(1), 63–76. doi: 10.12973/eurasia.2015.1306a
Hattie, J., Biggs, J. & Purdie, N. (1996). Effects of Learning Skills Interventions on Student Learning: A Meta-Analysis. Review of Educational Research, 66(2), 99–136.
Hazel, E., Conrad, L. & Martin, E. (1997). Exploring gender and phenomenography. Higher Education Research and Development, 16(2), 213–226.
Herselman, M. & Britton, K. G. (2002). Analyzing the role of ICT in bridging the digital divide amongst learners. South African Journal of Education, 22(4), 270–274.
Hill, P (2012). Online Educational Delivery Models: A Descriptive View, http://www.educause.edu/ero/article/online-educational-delivery-models-descriptive-view
Hsieh, M. Y. & Chan, Y. K. (2016). Is online learning able to effectively decrease tuition and miscellaneous fees debt of higher education in Taiwan. Eurasia Journal of Mathematics, Science & Technology Education, 12(5), 1313–1326. doi: 10.12973/eurasia.2016.1515a
Hsieh, M. Y. (2012). The Innovative Grey-Clustering Macroeconomic Assessment Model To Detect The Fluctuation In The Ten Economies. Journal of Grey System, 24(1), 67–80.
Hsieh, M. Y. (2014). The Application of the SCT and the ANP Model to Refine the Most Critical ICT Determinants in Minimizing the Digital Divide. Mathematical Problem Engineering. doi:10.1155/2014/309675
Hsieh, M. Y. (2016a). The most potential principles of social media. Computers & Electrical Engineering, 51(2016), 376-388. doi:10.1016/j.compeleceng.2015.12.013
Hsieh, M. Y. (2016b). Online learning era: exploring the most decisive determinants of MOOCs in Taiwanese higher education. Eurasia Journal of Mathematics, Science & Technology Education, 12(5), 1163-1188.
Hsieh, M. Y. (2016c). SoLoMo technology: Exploring the most critical determinants of SoLoMo technology in the contemporary mobile communication technology era. Journal of Ambient Intelligence and Humanized Computing, Published online: 30 April, 2016. doi: 10.1007/s12652-016-0375-2

M. Y. Hsieh / Education Divide Diminishment
3206
Hsieh, M. Y., Hsu, Y. C. & Lin, C. T. (2016). Risk assessment in new software development projects at the front end: a fuzzy logic approach. Journal of Ambient Intelligence and Humanized Computing, Published online: 19 April 2016. doi: 0.1007/s12652-016-0372-5
Hsieh, M. Y., Yan, T. M., Hung, C. C. & Jane, C. J. (2014). Explore the most potential supplier’s selection determinants in modern supply chain management. Mathematical Problems in Engineering. doi:10.1155/2014/390878
Hu, S. & Kuh, G. D. (2002). Being (dis)engaged in educationally purposeful activities: the influences of student and institutional characteristics. Research in Higher Education, 43(5), 555–575.
Huang, Y. T. & Hsieh, M. Y. (2015). Exploring the most influenced financial determinants of supply chain management by cross-employing factor analysis approach and fsQCA method. Advances in Mechanical Engineering, 7(11), 1–8.
Hung et al. (2016) The Detections of Retinopathy Symptoms and Tractional Retinal Detachment. Advances in Mechanical Engineering, 8(1), 1–15.
Judge, S., Puckett, K. & Bell, S. M. (2006). Closing the Digital Divide: Update from the Early Childhood Longitudinal Study. The Journal of Educational Research, 100(1), 52–60.
Kelland, J. H. (2006). Constructivist theories and online learning best practices: A discourse analysis. Canadian Association for the Study of Adult Education (CASAE) 2006 National Conference On-Line Proceedings. Toronto, Ontario: York University.
Kember, D. (1995). Open learning courses for adults: a model of student progress. Englewood Cliffs, NJ: Educational Technology.
Kerka, S. (1997). Distance learning, the Internet and the Worldwide Web. (ERIC Document Reproduction Service No. ED 3952141)
Keskin, N. O. & Metcalf, D. (2011). The current perspectives, theories and practices of mobile learning. The Turkish Online Journal of Educational Technology, 10(2), 202–208.
Kizilceca, R. F., Sanagustínb, M. P. & Maldonadob, J. J. (2016). Self-regulated learning strategies predict learner behavior and goal attainment in Massive Open Online Courses. Computers & Education, In Press, Accepted Manuscript (Available online 4 October 2016). Retrieved from http://dx.doi.org/10.1016/j.compedu.2016.10.001
Kop, R. & Carroll, F. (2012). Cloud computing and creativity: Learning on a massive open online course. European Journal of Open, Distance and E-Learning. Retrieved from http://www.eurodl.org/index.php?article=457
Kop, R. & Hill, A. (2008). Connectivism: Learning theory of the future or vestige of the past? International Review of Research in Open and Distance Learning, 9(3), 1–13.
Kop, R., Fournier, H. & Mak, J. S. F. (2011). A pedagogy of abundance or a pedagogy to support human beings? Participant support on massive open online courses. International Review of Research in Open and Distance Learning, Special Issue - Emergent Learning, Connections, Design for Learning, 12(7), 74–93.
Kop, R., Fournier, H. & Mak, J. S. F. (2011). A pedagogy of abundance or a pedagogy to support human beings? Participant support on massive open online courses. International Review of Research in Open and Distance Learning, Special Issue - Emergent Learning, Connections, Design for Learning, 12(7), 74–93.
Lawless, C. J. & Richardson, J. T. E. (2002). Approaches to studying and perceptions of academic quality in distance education. Higher Education, 44(2), 257–282. doi: 10.1023/A:1016315114558
Lee, V. E. & Smith, J. B. (1993). Effects of School Restructuring on the Achievement and Engagement of Middle-grade Students. Sociology of Education, 66, 164–187.

EURASIA J Math Sci and Tech Ed
3207
Mendel, M. J. & Korjani, M. M. (2012), Charles Ragin’s Fuzzy Set Qualitative Comparative Analysis (fsQCA) used for linguistic summarizations, Information Sciences, 202(20), October 2012, 1–23.
Milligan, C. & Littlejohn, A. (2016). How health professionals regulate their learning in massive open online courses. The Internet and Higher Education, 31(2016), 113-121. Retrieved from http://dx.doi.org/10.1016/j.iheduc.2016.07.005
Norris, C., Sullivan, T, Poirot, J. & Soloway, E. (2003). No access, no use, no impact: Snapshot surveys of educational technology in K-12. Journal of Research on Technology in Education, 36(1), 15–27.
Pool, M. M., Koolstra, C. M. T. & van der Voort, H. A. (2003). The impact of background radio and television on high school students’ homework performance. Journal of Communication, 8(7), 705–711.
Ragin et al. (2006). User’s Guide to Fuzzy-Set/Qualitative Comparative Analysis, Department of Sociology, University of Arizona. Available at www.compasss.org/Softwares.htm.
Ragin, C. C. (1987). The Comparative Method. Moving beyond qualitative and quantitative strategies, Berkeley/Los Angeles/London: Univ. of California Press.
Ragin, C. C. (2000). Fuzzy-Set Social Science, Chicago/London: University of Chicago Press.
Ragin, C. C. (2008). Redesigning Social Enquiry: Fuzzy Sets and Beyond, Chicago and London: University of Chicago Press.
Ravenscroft, A. (2011). Dialogue and connectivism: A new approach to understanding and promoting dialogue-rich networked learning. International Review of Research in Open and Distance Learning, 12(3), 140–160.
Rowan, B. & Miracle, Jr. A. W. M. (1983). Systems of Ability Grouping and Stratification of Achievement in Elementary Schools. Sociology of Education, 56 (1), 133–144.
Saheb, T. (2005). ICT, education and digital divide in developing countries. Global Media Journal, 4(7). Retrieved April 17, 2007 from: http://lass.calumet.purdue.edu/cca/gmj/fa05/gmj-fa05-saheb.htm.
Schneider, C. & Grofman, B. (2006). It might look like a regression equation … but it’s not! An intuitive approach to the presentation of QCA and FSQCA results, Paper presented to the conference on ‘Comparative Politics: Empirical Applications of Methodological Innovations’, Sophia University, Tokyo.
Selwyn, N., Gorard, S. & Williams S. (2001). Digital Divide or Digital Opportunity? The Role of Technology in Overcoming Social Exclusion in U.S. Education. Educational Policy, 15(2), 258–277.
Siemens, G. (2005). Connectivism: A learning theory for the digital age. International Journal of Instructional Technology and Distance Learning, 2(1), 3–10.
Simpson, C. (1981). Classroom Structure and the Organization of Ability. Sociology of Education, 54(2), 120–132.
Singh, S. (2010). Digital divide in India: Measurement, determinants and policy for addressing the challenges in bridging the digital divide. International Journal of Innovation in the Digital Economy, 1(2), 1–24.
Song, L., Singleton, E.S., Hill, J.R. & Koh, M.H. (2004). Improving online learning: Student perceptions of useful and challenging characteristics. Internet and Higher Education, 7(2004), 59 -70.
Tiene, D. (2002). Addressing the Global Digital Divide and its Impact on Educational Opportunity. Education Media International, 39(3/4), 211–222. doi: 10.1080/09523980210166440
Vicente, M. R. & Lo´pez, A. J. (2011). Assessing the regional digital divide across the European Union-27. Telecommunications Policy, 35, 220–237.

M. Y. Hsieh / Education Divide Diminishment
3208
Warschauer, M., Knobel, M. & Stone, L. (2004). Technology and Equity in Schooling: Deconstructing the Digital Divide. Educational Policy, 18(4), 562–588.
Yuan, L. MacNeill S. & Kraan W. (2008). Open Educational Resources –Opportunities and challenges for higher education, 1-34. http://wiki.cetis.ac.uk/images/0/0b/OER_Briefing_Paper.pdf
http://iserjournals.com/journals/eurasia