An empirical evaluation of the User Engagement Scale (UES ...
15
An empirical evaluation of the User Engagement Scale (UES) in online news environments Heather O’Brien a,⇑ , Paul Cairns b a School of Library, Archival and Information Studies, University of British Columbia, Canada b Department of Computer Science, University of York, UK article info Article history: Received 3 May 2014 Received in revised form 4 March 2015 Accepted 8 March 2015 Available online 7 April 2015 Keywords: Measurement Experiential scales User engagement Information interaction Online news abstract Questionnaires are commonly used to measure attitudes toward systems and perceptions of search experiences. Whilst the face validity of such measures has been established through repeated use in information retrieval research, their reliability and wider validity are not typically examined; this threatens internal validity. The evaluation of self-report questionnaires is important not only for the internal validity of studies and, by extension, increased confidence in the results, but also for examining constructs of interest over time and across different domains and systems. In this paper, we look at a specific questionnaire, the User Engagement Scale (UES), for its robustness as a measure. We describe three empirical studies conducted in the online news domain and investigate the reliability and validity of the UES. Our results demonstrate good reliability of the UES sub-scales; however, we argue that a four-factor structure may be more appropriate than the original six-factor structure proposed in earlier work. In addition, we found evidence to suggest that the UES can differentiate between systems (in this case, online news sources) and experimental conditions (i.e., the type of media used to present online content). Ó 2015 Elsevier Ltd. All rights reserved. 1. Introduction In information interaction research, there is growing recognition for information systems to satisfy both utilitarian and hedonic needs, particularly in the area of exploratory search where users’ motivations go beyond merely completing an information task (White & Roth, 2009). This has created a call to action for researchers to design systems that are fun and engaging and that foster learning and discovery (White & Roth, 2009), but also to systematically consider the measure- ment of such experiences. Kelly (2009) underscores the need to capture affective responses during ‘‘particular IR [information retrieval] interactions and states’’ (p. 200), while O’Brien and Lebow (2013) advocate developing robust measures of experience. There is an increasing impetus to support searchers to not only retrieve and evaluate information, but to engage with it. Further, we need ‘‘good measures’’ that capture searchers’ affective experiences and allow a degree of standardization to facilitate comparisons between different search systems, user groups, etc. (Käki & Aula, 2008, p. 86). Questionnaires are commonly used to measure attitudes toward systems and perceptions of search experiences. Kelly (2009) notes that such measures have good face validity, but are often developed ‘‘ad hoc’’ and their reliability and wider http://dx.doi.org/10.1016/j.ipm.2015.03.003 0306-4573/Ó 2015 Elsevier Ltd. All rights reserved. ⇑ Corresponding author at: Irving K. Barber Learning Centre, Suite 470, 1961 East Mall, Vancouver, British Columbia V6T 1Z1, Canada. Tel.: +1 604 822 6365; fax: +1 604 822 6006. E-mail addresses: [email protected] (H. O’Brien), [email protected] (P. Cairns). Information Processing and Management 51 (2015) 413–427 Contents lists available at ScienceDirect Information Processing and Management journal homepage: www.elsevier.com/locate/infoproman
Transcript of An empirical evaluation of the User Engagement Scale (UES ...
Information Processing and Management 51 (2015) 413–427
Contents lists available at ScienceDirect
Information Processing and Management
journal homepage: www.elsevier .com/ locate/ infoproman
An empirical evaluation of the User Engagement Scale (UES)in online news environments
http://dx.doi.org/10.1016/j.ipm.2015.03.0030306-4573/� 2015 Elsevier Ltd. All rights reserved.
⇑ Corresponding author at: Irving K. Barber Learning Centre, Suite 470, 1961 East Mall, Vancouver, British Columbia V6T 1Z1, Canada. Tel.: +16365; fax: +1 604 822 6006.
E-mail addresses: [email protected] (H. O’Brien), [email protected] (P. Cairns).
Heather O’Brien a,⇑, Paul Cairns b
a School of Library, Archival and Information Studies, University of British Columbia, Canadab Department of Computer Science, University of York, UK
a r t i c l e i n f o
Article history:Received 3 May 2014Received in revised form 4 March 2015Accepted 8 March 2015Available online 7 April 2015
Keywords:MeasurementExperiential scalesUser engagementInformation interactionOnline news
a b s t r a c t
Questionnaires are commonly used to measure attitudes toward systems and perceptionsof search experiences. Whilst the face validity of such measures has been establishedthrough repeated use in information retrieval research, their reliability and wider validityare not typically examined; this threatens internal validity. The evaluation of self-reportquestionnaires is important not only for the internal validity of studies and, by extension,increased confidence in the results, but also for examining constructs of interest over timeand across different domains and systems.
In this paper, we look at a specific questionnaire, the User Engagement Scale (UES), for itsrobustness as a measure. We describe three empirical studies conducted in the online newsdomain and investigate the reliability and validity of the UES. Our results demonstrategood reliability of the UES sub-scales; however, we argue that a four-factor structuremay be more appropriate than the original six-factor structure proposed in earlier work.In addition, we found evidence to suggest that the UES can differentiate between systems(in this case, online news sources) and experimental conditions (i.e., the type of media usedto present online content).
� 2015 Elsevier Ltd. All rights reserved.
1. Introduction
In information interaction research, there is growing recognition for information systems to satisfy both utilitarian andhedonic needs, particularly in the area of exploratory search where users’ motivations go beyond merely completing aninformation task (White & Roth, 2009). This has created a call to action for researchers to design systems that are funand engaging and that foster learning and discovery (White & Roth, 2009), but also to systematically consider the measure-ment of such experiences. Kelly (2009) underscores the need to capture affective responses during ‘‘particular IR[information retrieval] interactions and states’’ (p. 200), while O’Brien and Lebow (2013) advocate developing robustmeasures of experience. There is an increasing impetus to support searchers to not only retrieve and evaluate information,but to engage with it. Further, we need ‘‘good measures’’ that capture searchers’ affective experiences and allow a degree ofstandardization to facilitate comparisons between different search systems, user groups, etc. (Käki & Aula, 2008, p. 86).
Questionnaires are commonly used to measure attitudes toward systems and perceptions of search experiences. Kelly(2009) notes that such measures have good face validity, but are often developed ‘‘ad hoc’’ and their reliability and wider
604 822

414 H. O’Brien, P. Cairns / Information Processing and Management 51 (2015) 413–427
validity are not well established. This is problematic because, without reliable and valid measures, how can we be confidentof our findings (Cairns, 2013)? Thus it is essential to evaluate the robustness of self-report measures to bolster internalvalidity.
This paper looks to a particular questionnaire, the User Engagement Scale (UES) to evaluate its potential as a ‘‘good mea-sure’’ for adequately assessing human information experiences. The UES is a 31-item self-report questionnaire developed inthe e-shopping domain (O’Brien & Toms, 2010a). It has been subject to some evaluation in search systems (Arguello, Wu,Kelly, & Edwards, 2012; O’Brien & Toms, 2013), multimedia presentation software (O’Brien & Toms, 2010b), social network-ing applications (Banhawi & Mohamed Ali, 2011), and games (Wiebe, Lamb, Hardy, & Sharek, 2014) with mixed resultsregarding its generalizability in experimental settings, and the number of user engagement dimensions (UE) is captures.Given these mixed results, our motivating question was: ‘‘Is the UES a reliable and valid experiential scale to use in informa-tion interaction research, specifically online news browsing?’’ Here, we investigate its viability across three studies.
2. Related literature
2.1. User engagement
User engagement (UE) encompasses users’ initial reactions to technologies (Sutcliffe, 2010), as well as sustained use ofand re-engagement with information systems over time (Jacques, 1996; O’Brien & Toms, 2008). Engaging experiencesinvolve system feedback and challenge, novelty, aesthetic and sensory appeal, interactivity, interest, choice, control, motiva-tion, and positive affect (Jacques, 1996; Jacques, Preece, & Carey, 1995; O’Brien, 2008; O’Brien & Toms, 2008; Webster & Ho,1997). UE has become increasingly important in recent years for evaluating search, social networking, and entertainmentapplications (see for example, Hong & Yang, 2013), though it has been the subject of some research for nearly two decades(Jacques, 1996; Jacques et al., 1995; Webster & Ho, 1997).
Currently, behaviour-based metrics are being proposed as indicators of engagement (Lehmann, Lalmas, Yom-Tov, &Dupret, 2012). For example, search trail length and dwell time may signal continuous use or sustained engagement witha website (Singla & White, 2010). However, objective measures do not capture the subjective experiential aspects ofinformation interaction, such as people’s motivations to use a system, or their emotional response to that usage. Indeed,the relationship between subjective and objective measures is not always clear. While Kelly, Fu, and Shah (2010) found thatthe number of documents retrieved was directly related to how favourable participants rated the IR system in three experi-ments; other studies have found weak or conflicting relationship between user perceptions and performance measures(Al-Maskari & Sanderson, 2011; O’Brien & Lebow, 2013).
Self-report measures, which include interviews, focus groups, think aloud or think after protocols, questionnaires andexperiential scales offer a means to capture the subjective aspects of information experiences, though are also not withouttheir disadvantages. Kelly, Harper, and Landau (2008) provide an excellent summary of these (e.g. demand effects, acquien-sence, etc.) based on their review of relevant psychology literature. In general, however, self-report measures allow people toexpress their knowledge, emotions or attitudes about an experience, are a staple of user-centered research (Kelly, 2009), andan important element of multiple method approaches (O’Brien & Lebow, 2013). Further, well-designed and empirically vali-dated questionnaires and scales allow constructs of interest to be explored, defined and standardized (Fulmer & Frijters,2009).
In the case of a construct such as UE, a robust self-report measure would be useful for researchers, information purveyorsand systems developers. It could be used in prototyping situations to provide designers with quick user feedback about aninterface or search task, or in information retrieval studies to complement and corroborate behavioural or physiologicalmeasures, such as eye tracking. The ability to measure user engagement will provide a more holistic picture of people’sexperiences with information systems. However, the measure must be broad enough to encompass the many dimensionsof UE and capable of functioning in different interactive settings. In other words, it must demonstrate reliability, validityand generalizability.
2.2. The User Engagement Scale (UES)
The User Engagement Scale (UES) is a self-report measure that builds upon earlier work in the area of educationalmultimedia (Jacques, 1996; Webster & Ho, 1997). Jacques’ (1996) questionnaire consisted of 14 items related to achieve-ment, difficulty, attention, control, perceived time, motivation, boredom, patience, curiosity, and the desire to use the soft-ware again. Though rigorously developed, this questionnaire was never published, and as a result, its longitudinal reliabilityand validity were never addressed. Webster and Ho (1997) developed a questionnaire to measure ‘‘influences on engage-ment’’ (challenge, feedback, control, and variety) and ‘‘engagement’’ (attention focus, curiosity, and intrinsic interest) withmultimedia presentations. They compared audience engagement with two types of presentation software and reported highinternal consistency amongst influences on engagement and engagement items, and a unidimensional factor structure.Subsequent work confirmed the internal consistency or reliability of the items with a multimedia training systems(Chapman, Selvarajah, & Webster, 1999), but the make-up of the questionnaire (one or two items per attribute) is problem-atic for reliability (Webster & Ho, 1997).

H. O’Brien, P. Cairns / Information Processing and Management 51 (2015) 413–427 415
The more recent UES was motivated by the conclusion that engagement was a multi-dimensional construct, and thatthere was a need to re-examine its potential attributes and how these related to each other (O’Brien & Toms, 2008,2010a). Through a systematic scale development process, over 400 items were compiled, evaluated, and pre-tested. Anin-depth review process with an independent researcher reduced the number of items to over 100, and these items wereadministered to 440 online shoppers. Six distinct factors emerged through exploratory factor analysis (EFA): aestheticappeal, perceived usability, felt involvement, novelty, focused attention and endurability. Results from this study informedthe second large-scale evaluation of the instrument with 800 shoppers of a specific online retailer. Structural EquationModelling (SEM) was used to confirm the factor structure and examine relationships amongst them (for more informationabout the process of developing and evaluating the UES, see O’Brien & Toms, 2010a). These two studies resulted in a 31-iteminstrument that encompassed system variables (aesthetic appeal, perceived usability), and users’ response to the onlineshopping interaction (felt involvement, focused attention, novelty) and its outcome (endurability).
Since its development, the UES has been administered to users of multimedia presentation software (O’Brien & Toms,2010b), search systems (Arguello et al., 2012; O’Brien & Toms, 2013), social networking applications (Banhawi &Mohamed Ali, 2011), and games (Wiebe et al., 2014). Collectively, these studies offer mixed results regarding the numberof items and factor structure of the UES. The original UES consisted of 31 items and six distinct factors. However, subsequentstudies have eliminated items in their initial analysis because they demonstrated poor contextual or system fit (Arguelloet al., 2012). In addition, some researchers have reported a four- or five-factor structure (Banhawi & Mohamed Ali, 2011;O’Brien & Toms, 2010b, 2013; Wiebe et al., 2014). In the majority of these studies, perceived usability, aesthetics, and focusedattention remain distinct factors, while items from the novelty, felt involvement, and endurability subscales merge to formone factor. Wiebe et al. (2014) labeled this fourth factor Satisfaction, but we do not agree with this terminology because ‘‘usersatisfaction’’ has, as a construct, its own history in the information systems and IR literature. We feel this fourth factor tapsinto the more hedonic and pleasurable aspects of the experience, and could be labeled ‘‘hedonic engagement’’. An exceptionto the four-factor structure was O’Brien and Toms’ (2010b) examination of the UES in an informational webcasts experiment;felt involvement items were eliminated in the preliminary analysis, but the remaining five factors were present and distinct.
Despite issues with the factor structure, all of the studies confirm the multidimensional nature of UE and the internalconsistency of the subscales (pre-factor analysis). Other work supports the concurrent validity of the UES with behaviouralmeasures (Hyder, 2010) and other scales, including the Cognitive Absorption Scale and System Usability Scale (O’Brien &Lebow, 2013), and Flow State Scale (FSS) (Wiebe et al., 2014). Wiebe et al. (2014) found that the UES, in combination withthe FSS, predicted video game performance as measured by the highest level of a game that players attained. However, theamount of predicted variance was low (11%), indicating that other variables (not accounted for by either scale) contributed toperformance. Arguello et al. (2012) did not discern any differences in users’ interface preferences as measured by the UES intheir investigation of aggregated search and task complexity; however, Levesque, Oram, MacLean, et al. (2011) successfullyused items from the UES to compare haptic UE with widgets that provided different degrees of tactile feedback.
In summary, the UES has had positive results regarding its reliability and certain types of validity; some types of validityremain to be explored. Research has cast doubt on the original six-factor structure. Wiebe et al. (2014) advocate using amodified four-factor scale to evaluate engagement with video games, a finding concurrent with O’Brien’s more recent work.We sought to make sense of previous findings by conducting further investigations in the online news domain to examinethe reliability and validity of the UES in this context. Here we ask, ‘‘How generalizable is the UES to online news?’’
3. Current studies
Online news was the domain selected for these studies because it is interactive and multimodal (Chung, 2008), is widelyused by a cross-section of the population for information seeking and browsing (Marshall, 2007), and satisfies both purpose-ful and serendipitous information needs. Online news, with its relevance to everyday life, ubiquity, and the interactive andmultimodal nature of news delivery – is a fitting environment for studying UE and the utilitarian and hedonic aspects ofinformation interaction.
We drew upon North American and United Kingdom news sources in the design of three quasi-experimental studies.Study 1 acted as a pilot to examine the meaningfulness of transferring the UES to the news domain with particular emphasison scale reliability. Study 2 involved browsing online news websites in the context of a socially situated informationscenario. Study 3 manipulated the mode in which participants interacted with news (text, audio, or video). Questionsguiding this research were:
1. To what extent does the UES yield internally consistent subscales and a six-factor structure (all studies)?2. Is the UES sensitive to differences between user engagement with different news websites based on people’s familiarity
with the news sources (Study 2)?3. Does the UES detect differences between experimental conditions, such as the modality for interacting with online news
(i.e., text, audio, video) (Study 3)?
Research question #1 is focused on establishing the reliability of the UES for use in the online news environment. This isimportant, as we need to determine how the UES functions outside of the original e-commerce environment in which it was

416 H. O’Brien, P. Cairns / Information Processing and Management 51 (2015) 413–427
developed. Questions #2 and 3 looked specifically at construct validity. In IIR studies, we need to ascertain that self-reportinstruments can differentiate experiences with different interfaces and experimental conditions, should differences indeedexist.
3.1. Approach to data analysis
To reduce redundancy in other parts of the paper, we present our approach to data analysis used in all studies. First, thewording of the UES items was modified to fit the online news context. This was necessary because the original items weredeveloped and tested in the online shopping domain.
For each data set the following procedures and tests were used to examine the data. Descriptives and missing valueanalysis was first done on each item though, as this produced no concerns, it is not reported in detail here. Cronbach alpha(a) was used to examine the reliability of the subscales of the UES. Values between 0.7 and 0.9 were considered optimal(DeVellis, 2003). Where scales were considered to lack reliability, the Measure of Sampling Adequacy (MSA) of each itemwas used to indicate potentially problematic items. MSA below 0.6 is a commonly used threshold to indicate problematicitems, though this is not wholly dependable for small samples (Tabachnick & Fidell, 2013). Pearson’s correlation coefficientswere used to describe inter-scale correlates and identify possible overlap between the scales; this would suggest a factorstructure requiring fewer than the original six factors.
Where factor structure was considered, the Kaiser–Meyer–Olkin MSA and Bartlett’s test of sphericity were used toindicate that factor analysis would be suitable, though we note the issues of using this with small samples. The componentstructure of the UES was validated through replication of the original six-factor analysis on the new sample (Kline, 2000)using Principal Components Analysis (PCA) with oblique rotation (Direct Oblimin). The structure matrix was used for theanalysis in each case. This decision was based on the significant relationships observed in the inter-item correlation matrix.The structure matrix is more difficult to interpret than the pattern matrix because it does not ‘‘partial out’’ the overlappingvariance among factors but allows items to load significantly on multiple factors (Tabachnick & Fidell, 2013, p. 654). At thesame time it is conceptually clearer as it reveals the correlations seen between the factors. The cut-off value for loadings was0.35 based on our modest sample sizes (Kline, 2000).
4. Study 1: piloting the UES for online news
4.1. Methodology
The purpose of this study was to examine the plausibility and reliability of deploying the UES in the news domain toensure that the UES retains its construct validity in this new domain. The design of this study was distinguished from theoriginal UES work in several important ways. First, it examined the scale in the online news domain, rather than onlineshopping. This required the adaptation of the UES to be more generically suitable for engagement in a variety of domains.Also, it was necessary to devise tasks that would realistically motivate participants in the study to engage with a news read-ing activity. Unlike shopping where the task is to end up with a product, news reading can have a variety of goals from beingmerely to pass time to having in-depth understanding of current issues. Within the context of this study, the intent was toprovide a specific enough task to allow people to know what they needed to do without prescribing exactly what wasrequired in too much detail thus allowing a genuine engagement at an individualized level. We were also interested in amore socially motivated scenario to reflect the different purposes of news consumption over product purchase. Though workon information sharing is not uncommon, all of the studies that have investigated user engagement, with the exception ofBanhawi and Mohamed’s Ali (2011) study of Facebook, have looked at individual information seeking.
Second, this was a quasi-experimental study conducted in a laboratory, rather than a field study. O’Brien and Toms’(2010a) initial studies sampled people who had voluntarily performed online shopping tasks. This is important because sub-sequent work (summarized in O’Brien & Toms, 2013) has questioned the application of some items to experimental researchwhere information tasks are imposed; laboratory-based studies are a mainstay in information interaction.
The study (n = 30) was conducted at a Canadian university using the CBC news website (www.cbc.ca/news). Participants(M = 19, F = 11) browsed the news website and located three stories they were willing to share in a social situation. The studylasted 45–60 min. Approximately two-thirds of participants were between the ages of 21 and 35, and university students(n = 20). No one read print news exclusively: 16 people reported reading online news only and 14 indicated they read bothformats. Most interacted with news daily (n = 18) or several times per week (n = 8).
Each session followed the same procedure. Following informed consent, participants completed a paper-baseddemographic questionnaire. They were then introduced to the simulated task scenario. The scenario asked them to imaginethey would be attending a social gathering later in the evening, and that browsing the online news website would be usefulfor gathering information for conversational purposes. They were given a rough timeline of twenty minutes to locate threenews items. The timeframe was not strictly enforced, but used as a guideline to avoid fatiguing participants. They were askedto avoid non-news content (e.g., weather or classified ads), but otherwise were uninhibited in their browsing and selections.
After their browsing session, participants completed a user perception questionnaire, which included the UES.Respondents completed the questions using a seven-point Likert scale that ranged from ‘‘strongly disagree’’ to ‘‘strongly
H. O’Brien, P. Cairns / Information Processing and Management 51 (2015) 413–427 417
agree.’’ The original UES (O’Brien & Toms, 2010a) used a five-point Likert scale but there was a concern that it would not besufficiently sensitive in this context because of people not wishing to use the extreme ends of the scale (Preston & Colman,2000). The UES was administered on the computer in the form of one of four randomized lists. Lastly, a brief interview wasconducted with participants where they were asked to identify the articles they selected for the task, rate their interest in thearticles, and describe what they found to be least and most engaging about the session. Commercial screen capture softwarerecorded the browsing sessions and facilitated the interviews through playback of the session. At the end, participants werethanked for their time, debriefed, and paid an honorarium for taking part.
4.2. Results
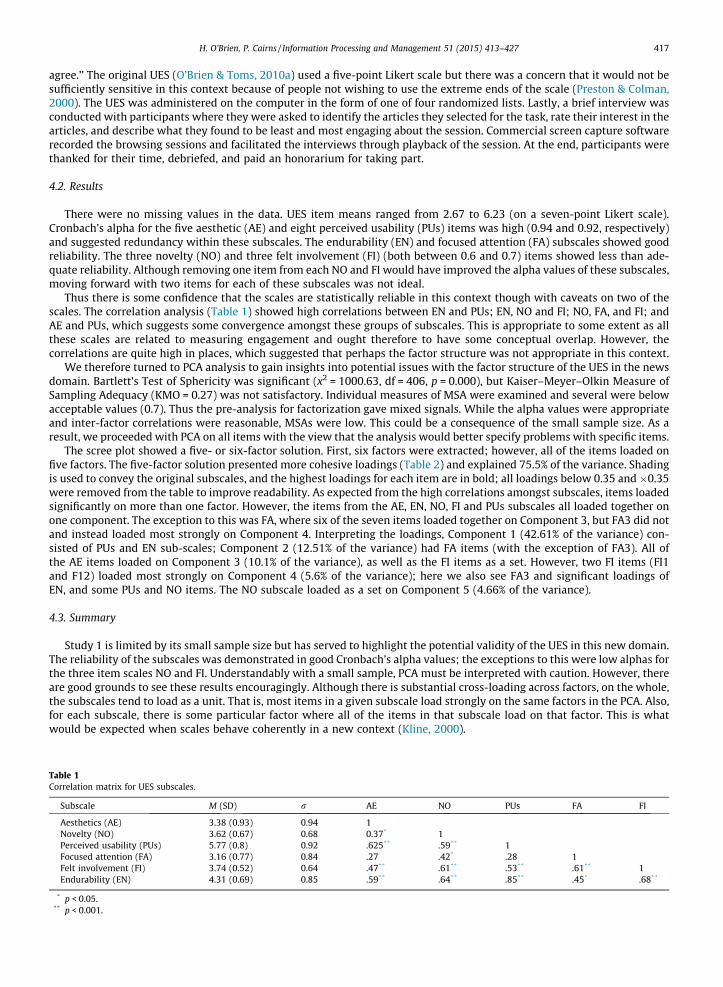
There were no missing values in the data. UES item means ranged from 2.67 to 6.23 (on a seven-point Likert scale).Cronbach’s alpha for the five aesthetic (AE) and eight perceived usability (PUs) items was high (0.94 and 0.92, respectively)and suggested redundancy within these subscales. The endurability (EN) and focused attention (FA) subscales showed goodreliability. The three novelty (NO) and three felt involvement (FI) (both between 0.6 and 0.7) items showed less than ade-quate reliability. Although removing one item from each NO and FI would have improved the alpha values of these subscales,moving forward with two items for each of these subscales was not ideal.
Thus there is some confidence that the scales are statistically reliable in this context though with caveats on two of thescales. The correlation analysis (Table 1) showed high correlations between EN and PUs; EN, NO and FI; NO, FA, and FI; andAE and PUs, which suggests some convergence amongst these groups of subscales. This is appropriate to some extent as allthese scales are related to measuring engagement and ought therefore to have some conceptual overlap. However, thecorrelations are quite high in places, which suggested that perhaps the factor structure was not appropriate in this context.
We therefore turned to PCA analysis to gain insights into potential issues with the factor structure of the UES in the newsdomain. Bartlett’s Test of Sphericity was significant (x2 = 1000.63, df = 406, p = 0.000), but Kaiser–Meyer–Olkin Measure ofSampling Adequacy (KMO = 0.27) was not satisfactory. Individual measures of MSA were examined and several were belowacceptable values (0.7). Thus the pre-analysis for factorization gave mixed signals. While the alpha values were appropriateand inter-factor correlations were reasonable, MSAs were low. This could be a consequence of the small sample size. As aresult, we proceeded with PCA on all items with the view that the analysis would better specify problems with specific items.
The scree plot showed a five- or six-factor solution. First, six factors were extracted; however, all of the items loaded onfive factors. The five-factor solution presented more cohesive loadings (Table 2) and explained 75.5% of the variance. Shadingis used to convey the original subscales, and the highest loadings for each item are in bold; all loadings below 0.35 and �0.35were removed from the table to improve readability. As expected from the high correlations amongst subscales, items loadedsignificantly on more than one factor. However, the items from the AE, EN, NO, FI and PUs subscales all loaded together onone component. The exception to this was FA, where six of the seven items loaded together on Component 3, but FA3 did notand instead loaded most strongly on Component 4. Interpreting the loadings, Component 1 (42.61% of the variance) con-sisted of PUs and EN sub-scales; Component 2 (12.51% of the variance) had FA items (with the exception of FA3). All ofthe AE items loaded on Component 3 (10.1% of the variance), as well as the FI items as a set. However, two FI items (FI1and F12) loaded most strongly on Component 4 (5.6% of the variance); here we also see FA3 and significant loadings ofEN, and some PUs and NO items. The NO subscale loaded as a set on Component 5 (4.66% of the variance).
4.3. Summary
Study 1 is limited by its small sample size but has served to highlight the potential validity of the UES in this new domain.The reliability of the subscales was demonstrated in good Cronbach’s alpha values; the exceptions to this were low alphas forthe three item scales NO and FI. Understandably with a small sample, PCA must be interpreted with caution. However, thereare good grounds to see these results encouragingly. Although there is substantial cross-loading across factors, on the whole,the subscales tend to load as a unit. That is, most items in a given subscale load strongly on the same factors in the PCA. Also,for each subscale, there is some particular factor where all of the items in that subscale load on that factor. This is whatwould be expected when scales behave coherently in a new context (Kline, 2000).
Table 1Correlation matrix for UES subscales.
Subscale M (SD) r AE NO PUs FA FI
Aesthetics (AE) 3.38 (0.93) 0.94 1Novelty (NO) 3.62 (0.67) 0.68 0.37* 1Perceived usability (PUs) 5.77 (0.8) 0.92 .625** .59** 1Focused attention (FA) 3.16 (0.77) 0.84 .27 .42* .28 1Felt involvement (FI) 3.74 (0.52) 0.64 .47** .61** .53** .61** 1Endurability (EN) 4.31 (0.69) 0.85 .59** .64** .85** .45* .68**
* p < 0.05.** p < 0.001.

Table 2PCA with oblique rotation for UES items.
418 H. O’Brien, P. Cairns / Information Processing and Management 51 (2015) 413–427
Of course with the smaller scales, FI and NO, any variation from fully loading on a factor is a substantial deviation from allloading together. Therefore the PCA does not unequivocally support the reliability of these scales. The interviews conductedwith participants after they finished their browsing session confirmed the value of novel experiences, as people expressedthe need for novel content and/or news interface features as part of their engagement with the website (O’Brien, 2011). Thus,it does not seem appropriate to dismiss the NO subscale entirely.
Although we did not find support for the six-factor structure, we did see the items load on five factors. Given the smallsample size, this supports the high inter-scale correlations seen and it may be that with a larger sample the six factorstructure would emerge. Overall though, we found evidence to support the reliability and use of the UES in the online newsdomain and we therefore proceeded to use the UES in a larger study in the same domain that would be more amenable tomore detailed analysis.
5. Study 2: UES and news source familiarity
In study 2, we re-examined the reliability of the UES and investigated its sensitivity by manipulating news source famil-iarity. There are many contextual factors that may influence UE with news, notably trust and credibility. Johnson and Kaye(2009), for example, explored politically oriented Internet users’ evaluations of political candidate websites, issues-orientedwebsites, blogs, email lists/bulletin boards and chat/instant sources. Users’ motivations to rely on blogs for non-mainstreamperspectives predicted their credibility ratings of blogs. Thus with increased voluntary exposure to information sources (i.e.,familiarity), users assessed the attributes of the source more positively.
In this way, familiarity pertains to the nature of the content, and the match between the tone of the content and users’expectations. Novelty and interest has also been explored with respect to online news and the user experience. Studies haveshown that users will engage with content on topics extraneous to their primary interests with positive results (Toms, 2000),and will also be drawn ‘‘off-task’’ when they view salient content (McCay-Peet, Lalmas, & Navalpakkam, 2012). Thus, thefamiliarity of the news provider must be tempered with human tendencies to seek out content that is novel and/or interest-ing. However, the range of topics and stories covered by a news provider on any given day could be quite similar. However,familiarity also applies to the interface/system itself. Familiar systems are those for which users’ have already developed amental model or ‘‘know-how’’. Turner (2013) suggests that familiarity allows us to ‘‘cope’’ with digital technology, reducescognitive load, and thereby frees us to engage more readily in the interaction.
H. O’Brien, P. Cairns / Information Processing and Management 51 (2015) 413–427 419
In study 2, we reasoned that familiarity would influence UE for two reasons. First, users’ would have confidence inthe accuracy of the news provided by the familiar source, trust that source, and understand its potential biases (e.g.,‘‘left-leaning’’); depending on their inclination, readers should be able to find both novel and interesting content on bothfamiliar and unfamiliar news websites. Second, the familiar website would be viewed as more ‘‘usable’’ by participants, freeingthem to become more engaged in the interaction. This study therefore examined how news source familiarity impacted UE,specifically the UES’ ability to discriminate the influence of familiarity on UE in with news sources (i.e., construct validity).
5.1. Methodology
This between-subjects design took place at a British university; participation was part of students’ degree program prac-ticals. The teaching goal of the experiment was to given the students experience of both running and participating in anexperiment. Thus, students were paired with one taking the part of experimenter and one of participant to use one websiteand then swapping roles and using a different website. There is a risk about the person who is experimenter first gettinginsight into the tasks before attempting them for themselves but as this was about individual engagement, there is only asmall risk that knowledge of the tasks could lead to particular engagement with the websites chosen. Also, the study wasa between participants design so that even having seen how to ‘‘achieve’’ the task on one website would be no indicationof how to do the same thing on the other. Counterbalancing the websites used in the first and second portions of the classalso ensured that if there were such an ordering bias, then it would not systematically affect the experimental conditions.
Participants were first-year computer science undergraduates who ranged in age from 18 to 30 (Median = 19). Ninety-eight students took part in the study but due to some not returning their data, the data from only 91 students is includedin the analysis resulting in an uneven split of participants across conditions. Students (M = 77; F = 14) were randomlyassigned to one of two websites: BBC News (BBC) (http://www.bbc.co.uk/news) (n = 50) and International Herald Tribune(IHT) (http://global.nytimes.com/) (n = 41).
Familiarity, the independent variable, could be directly manipulated. We exploited the fact that this study took place in aBritish University and therefore all students would be very familiar with the BBC both as an important national brand and asa politically impartial news provider. For an unfamiliar brand, any non-UK news source was likely to be less familiar, butthere was a risk that other factors (e.g., degree of sensationalism) would influence UE irrespective of familiarity.Therefore the less familiar news source was taken to be the IHT as an internationally relevant, impartial, authoritative,and English news source. This manipulation was successful: 40 people in the BBC condition and 29 in the IHT conditionhad used the BBC television news as a news source. Forty people in the BBC condition and 27 in the IHT condition alsoreported using the BBC Online for news. No one reported using the IHT online as a news source.
Students worked in pairs of participant and experimenter. Following informed consent, participants were given papercopies of the task scenario and questionnaire to complete as they worked through the study. Firstly, they responded todemographic questions. Next, they were given the simulated task scenario used in Study 1 and instructed to interact witheither the BBC or IHT news website. Once 15 min elapsed, participants were prompted by the experimenter to bring the taskto a close within the next five minutes. After 20 min, they were asked to stop. Following their interaction with the newswebsite, they indicated their familiarity with the news source and noted details about the stories they selected as part ofthe task scenario, including their confidence in their knowledge of the news items they selected and their ability to discussthem with others. Lastly, they completed the UES. Only one ordering of the UES items was used for all participants.Familiarity, confidence, and UE were all measured using a five-point Likert scale. Seven-point scales were not used herebecause the experimenter (second author) used the original description of the UES (O’Brien & Toms, 2010a) when preparingthe experiment. The experimenter took other observational measures, but these are not discussed here. Students thenexchanged roles and the new participant used a different news source from the previous one. Students were not privy tothe questionnaire items until they were in the experimenter role, but the procedure introduced some bias as the first experi-menter watched the other student ‘‘researcher’’ interact with the website according to the task scenario. There was noimmediate debriefing as this was kept until the end of the practical class. After both completed the experiment, they wereasked to discuss the value of the UES and to note any issues arising with answering its items.
5.2. Results
All scales had good reliability in the BBC condition and generally good reliability in the IHT condition (Table 3). The excep-tion to this was EN, which had a lower alpha than usually considered acceptable, but only marginally (DeVellis, 2003); thiswas not a cause for concern given the modest sample size. AE showed very high alpha value, which may indicate redundancyin the subscale.
Next, inter-scale correlations were examined (Table 4). Only overall correlations are reported because a broadly similarpicture was seen for IHT and BBC. The AE and PUs scales were only moderately correlated with the other five subscalessuggesting, they should emerge as distinct components. Strong correlations were observed between NO, FI and EN, andFA, NO, and FI, which may indicate overlap amongst these subscales.
The Kaiser–Meyer–Olkin Measure of Sampling Adequacy (KMO = 0.8) and Bartlett’s Test of Sphericity were significant(x2 = 1951.62, df = 465, p = 0.000). The scree plot suggested five or six components. Individual item MSA values were above0.6, and all but three (FA7, EN3 and PUs1) were above 0.7 indicating that each item was suitable for inclusion in the analysis.

Table 3Cronbach’s alpha for UES subscales overall and in each experimental condition.
Subscale Overall BBC (n = 50) IHT (n = 41)
Focused attention (FA) 0.85 0.89 0.81Felt involvement (FI) 0.75 0.73 0.78Novelty (NO) 0.82 0.87 0.76Endurability (EN) 0.73 0.75 0.68Aesthetic appeal (AE) 0.94 0.92 0.94Perceived usability (PUs) 0.88 0.90 0.85
Table 4Correlation matrix for UES subscales.
Subscale FA FI NO EN AE
FA 1FI 0.56** 1NO 0.53** 0.61** 1EN 0.46** 0.57** 0.67** 1AE 0.21* 0.28** 0.41** 0.45** 1PUs �0.03 0.004 0.13 0.21* 0.34**
* p < 0.05.** p < 0.001.
Table 5PCA with oblique rotation for UES items.
420 H. O’Brien, P. Cairns / Information Processing and Management 51 (2015) 413–427
In the initial six-factor solution, all items loaded on only five rotated factors. This may reflect the high degree of correla-tion amongst the subscales observed in Table 4. A five-factor solution was then investigated. Factor loadings for the fivefactors are shown in Table 5 with loadings above 0.35 and below �0.35 highlighted in bold (Kline, 2000). First, it shouldbe noted that all but one subscale had at least one factor where all items strongly loaded on that factor confirming thecoherence of each subscale, similarly to Study 1. The exception was EN, where EN3 loaded on a single factor. This item,‘‘This experience did not work out the way I planned,’’ may not have been meaningful in the context of an undergraduateclass, and it may be argued that participants did not have a particular plan for the session. In addition to the coherence
H. O’Brien, P. Cairns / Information Processing and Management 51 (2015) 413–427 421
of the subscales, three subscales loaded as a whole scale on only one factor: FA, AE and PUs. There were some cross-loadingswith FA and PUs but the strongest loadings were primarily on the factor containing the whole subscale. FI and NO had strongcross-loadings each on three factors but it is encouraging to see that these load only as the whole subscale or not at all. Thissuggests that each scale is functioning as a single unit.
In summary, all subscales (with the exception of one EN item) showed internal coherence both in terms of statisticalreliability and PCA. It seems reasonable to conclude that the subscales may be used as meaningful measures of UE withonline news sources.
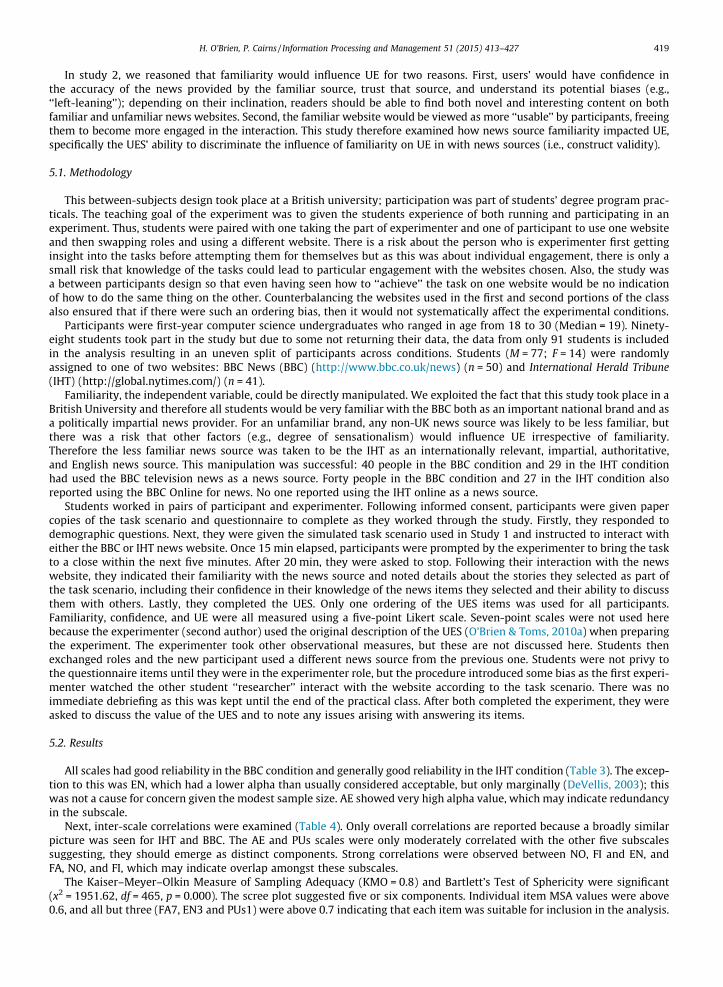
5.2.1. Comparison of UE between conditionsThe primary manipulation was familiarity with the news source. Three questions (coded ordinally on a scale of 1–5) were
used to measure the effectiveness of the familiarity manipulation. BBC was rated as more familiar or more used than the IHT,with the median rating for all three questions about the IHT being the lowest point on the scale. Mann–Whitney testsconfirm these differences (Table 6).
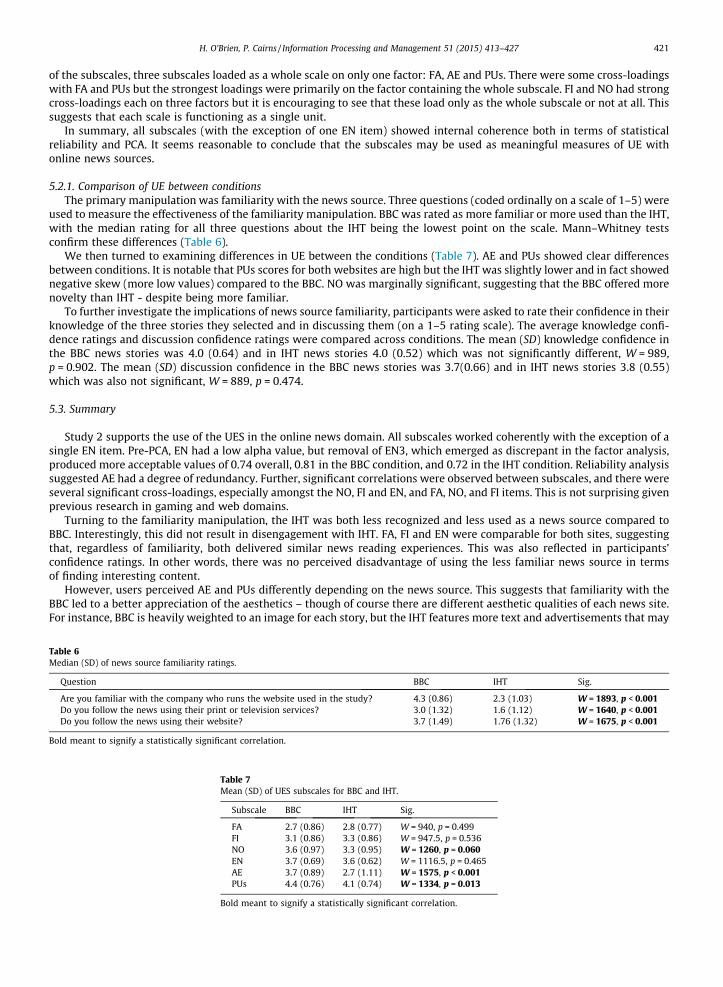
We then turned to examining differences in UE between the conditions (Table 7). AE and PUs showed clear differencesbetween conditions. It is notable that PUs scores for both websites are high but the IHT was slightly lower and in fact showednegative skew (more low values) compared to the BBC. NO was marginally significant, suggesting that the BBC offered morenovelty than IHT - despite being more familiar.
To further investigate the implications of news source familiarity, participants were asked to rate their confidence in theirknowledge of the three stories they selected and in discussing them (on a 1–5 rating scale). The average knowledge confi-dence ratings and discussion confidence ratings were compared across conditions. The mean (SD) knowledge confidence inthe BBC news stories was 4.0 (0.64) and in IHT news stories 4.0 (0.52) which was not significantly different, W = 989,p = 0.902. The mean (SD) discussion confidence in the BBC news stories was 3.7(0.66) and in IHT news stories 3.8 (0.55)which was also not significant, W = 889, p = 0.474.
5.3. Summary
Study 2 supports the use of the UES in the online news domain. All subscales worked coherently with the exception of asingle EN item. Pre-PCA, EN had a low alpha value, but removal of EN3, which emerged as discrepant in the factor analysis,produced more acceptable values of 0.74 overall, 0.81 in the BBC condition, and 0.72 in the IHT condition. Reliability analysissuggested AE had a degree of redundancy. Further, significant correlations were observed between subscales, and there wereseveral significant cross-loadings, especially amongst the NO, FI and EN, and FA, NO, and FI items. This is not surprising givenprevious research in gaming and web domains.
Turning to the familiarity manipulation, the IHT was both less recognized and less used as a news source compared toBBC. Interestingly, this did not result in disengagement with IHT. FA, FI and EN were comparable for both sites, suggestingthat, regardless of familiarity, both delivered similar news reading experiences. This was also reflected in participants’confidence ratings. In other words, there was no perceived disadvantage of using the less familiar news source in termsof finding interesting content.
However, users perceived AE and PUs differently depending on the news source. This suggests that familiarity with theBBC led to a better appreciation of the aesthetics – though of course there are different aesthetic qualities of each news site.For instance, BBC is heavily weighted to an image for each story, but the IHT features more text and advertisements that may
Table 6Median (SD) of news source familiarity ratings.
Question BBC IHT Sig.
Are you familiar with the company who runs the website used in the study? 4.3 (0.86) 2.3 (1.03) W = 1893, p < 0.001Do you follow the news using their print or television services? 3.0 (1.32) 1.6 (1.12) W = 1640, p < 0.001Do you follow the news using their website? 3.7 (1.49) 1.76 (1.32) W = 1675, p < 0.001
Bold meant to signify a statistically significant correlation.
Table 7Mean (SD) of UES subscales for BBC and IHT.
Subscale BBC IHT Sig.
FA 2.7 (0.86) 2.8 (0.77) W = 940, p = 0.499FI 3.1 (0.86) 3.3 (0.86) W = 947.5, p = 0.536NO 3.6 (0.97) 3.3 (0.95) W = 1260, p = 0.060EN 3.7 (0.69) 3.6 (0.62) W = 1116.5, p = 0.465AE 3.7 (0.89) 2.7 (1.11) W = 1575, p < 0.001PUs 4.4 (0.76) 4.1 (0.74) W = 1334, p = 0.013
Bold meant to signify a statistically significant correlation.
422 H. O’Brien, P. Cairns / Information Processing and Management 51 (2015) 413–427
disrupt the reading experience. These differences may reflect the different traditions of television broadcasting versusnewsprint that underpin the two websites. It would be worth investigating differences between these websites on purelyaesthetic grounds, at least for UK-based samples. The difference in perceived usability may be due to substantial differencesin the navigation and organization of the websites. However, in this case, it is likely that familiarity played an important rolewith the more familiar BBC offering an already understood interface where any minor usability issues were alreadyovercome. Perceived novelty was higher for the BBC than IHT website, though only marginally significant. NO items pertainto curiosity and self-motivation to interact with news. This may be due to familiarity with the BBC, or even that the news ismore likely to be relevant to a UK-based student than stories generally found in the IHT. This should be examined further,but does confirm study one’s findings about the importance of novelty in the news domain.
Overall, this study points to interesting differences in engagement between the two websites. Whilst these cannot be con-fidently attributed solely to differences in source familiarity, they are indicative of how familiarity might influence onlinenews interactions. The study offers further support that the UES is able to identify useful differences between online sourcesin terms of how they influence the perceived engagement of people using those sources.
6. Study 3
Building on studies 1 and 2, we investigated the reliability and construct validity of the UES further, specifically its abilityto detect differences between conditions. The overarching question guiding this research was whether the modality of inter-action with news content would influence users’ level of engagement.
Previous research has demonstrated that video is more engaging for people interacting with digital media (Chapmanet al., 1999), and that it may enhance users’ performance (Jacques et al., 1995). However, multimedia may also interfere withengagement if it is considered distracting rather than enhancing (Webster & Ho, 1997). More recently, Sundar, Bellur, Oh, Xu,and Jia (2014), experimented with exploring the impact of interactive features on user engagement. They created conditionsthat enabled users to download, zoom in on, mouse over, or drag content, or use a 3D carousel within an online news maga-zine. In addition to detecting differences in user perceptions according to interaction techniques, they also found that someinteractive modalities led to higher recall/pictorial recognition than others.
We tested four modalities: video, audio, transcript text and narrative text, to see whether the UES would detect differ-ences in UE according to the media condition to which participants were assigned. We hypothesized that video would bemost engaging because it requires multi-sensory involvement; we also reasoned that transcript text would be least engagingbecause it was less ‘‘story-like;’’ in the related area of user experience, narrative is discussed as a powerful tool for incitingengagement (McCarthy & Wright, 2004). We were uncertain as to where audio and narrative text would rank in terms of UE.The narrative text might be favoured for its narrative presentation, since story is a useful tool for making sense of informa-tion. However, the popularity of audio content (e.g., audio books) may be familiar and therefore a more engaging medium forinteracting with online news. Thus, medium of interaction should affect user engagement with online news content andproduce perceptual differences sufficient to examine the construct validity of the UES.
6.1. Methodology
Participants (n = 90) interacted with two news stories (within-subjects) from a North American news source in one of fourformats (between-subjects): audio, video, transcript style text, and narrative style text. Stories were presented in counter-balanced order, and participants were randomly assigned to one of the format conditions. The topic of both stories wastechnology and they varied in length (6 min, 26 s or approximately 2100 words and 9 min, 54 s or approximately 3100words).
Participants were an opportunity sample and were recruited using print and electronic signage posted around a univer-sity campus. We were unable to use data from seven of the participants due to technical issues with the experimentalsystem. For example, the system did not assign two participants to task two in the same mode as task one; this introducedconfounds into the results. There were also instances where the experimenter suspected a participant ‘‘cheated’’ by returningto the stories to answer the comprehension questions. The experimenter noted these cases and we removed the data of theseparticipants before our analysis.’’
Of the 83 valid respondents, the majority were female (61.4%; M = 34.9%) university students (85.5%; non-students = 12%)under the age of 30 (n = 62; 74.7%). Over half of the sample (n = 43; 51.8%) indicated that their highest level of education wasan undergraduate degree and 19 people (22.9%) had/were pursuing a Masters degree. All experimental materials werepresented on a laptop with a 15-inch monitor. After initial briefing, the experimental system guided participants throughthe session. The first screen was the informed consent page, followed by a demographic questionnaire. This was followedby story 1 and story 2 (counterbalanced).
The stories were incorporated into the experimental system via a link to the news website; the set up used a frame tokeep participants from leaving the system. Within the frame, each multimedia condition was presented on a white back-ground and the news provider’s logo was centred at the top of the page; scrolling was permitted for the two text conditionsbut not required for audio or video. The video condition consisted of a 10 � 15 cm (approximately) video window; the audiocondition had a bar that showed the duration of the story, and one’s current location within this total timeframe. The
H. O’Brien, P. Cairns / Information Processing and Management 51 (2015) 413–427 423
transcript text showed was structured as follows: ‘‘person X: quote’’ and each new speaker appeared on a new line. Lastly,the narrative text was derived from the text transcript. It was the same content, but transitions were made more fluidbetween the speakers. One still image from the video was included on the right hand side of the screen for this condition.
After viewing/reading/listening to each story, participants completed a questionnaire, which included the UES with a 7-point Likert rating scale; the UES contained wording appropriate to the mode the participant was assigned to in the experiment.For example, participants in the transcript and narrative text conditions had questions pertaining to the reading task or experi-ence, while those in the audio and video had the terms ‘‘listen’’ and ‘‘view’’ accordingly. They also responded to questions aboutthe story to gauge their interest in the content, and to recall information they had viewed/listened to/read. After interactingwith both stories, participants were led to a post-session questionnaire about their overall experience. A concluding page askedparticipants to inform the experimenter they had finished. Lastly, participants were interviewed about the stories and theiroverall experience. At the conclusion, participants were thanked for their time and paid an honorarium.
6.2. Results
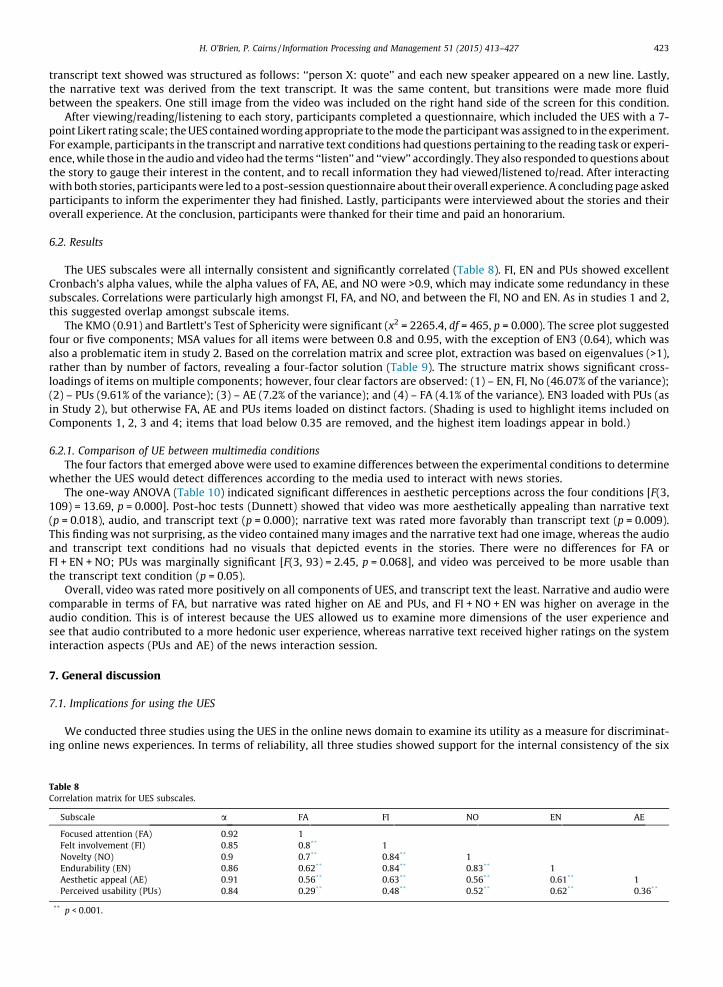
The UES subscales were all internally consistent and significantly correlated (Table 8). FI, EN and PUs showed excellentCronbach’s alpha values, while the alpha values of FA, AE, and NO were >0.9, which may indicate some redundancy in thesesubscales. Correlations were particularly high amongst FI, FA, and NO, and between the FI, NO and EN. As in studies 1 and 2,this suggested overlap amongst subscale items.
The KMO (0.91) and Bartlett’s Test of Sphericity were significant (x2 = 2265.4, df = 465, p = 0.000). The scree plot suggestedfour or five components; MSA values for all items were between 0.8 and 0.95, with the exception of EN3 (0.64), which wasalso a problematic item in study 2. Based on the correlation matrix and scree plot, extraction was based on eigenvalues (>1),rather than by number of factors, revealing a four-factor solution (Table 9). The structure matrix shows significant cross-loadings of items on multiple components; however, four clear factors are observed: (1) – EN, FI, No (46.07% of the variance);(2) – PUs (9.61% of the variance); (3) – AE (7.2% of the variance); and (4) – FA (4.1% of the variance). EN3 loaded with PUs (asin Study 2), but otherwise FA, AE and PUs items loaded on distinct factors. (Shading is used to highlight items included onComponents 1, 2, 3 and 4; items that load below 0.35 are removed, and the highest item loadings appear in bold.)
6.2.1. Comparison of UE between multimedia conditionsThe four factors that emerged above were used to examine differences between the experimental conditions to determine
whether the UES would detect differences according to the media used to interact with news stories.The one-way ANOVA (Table 10) indicated significant differences in aesthetic perceptions across the four conditions [F(3,
109) = 13.69, p = 0.000]. Post-hoc tests (Dunnett) showed that video was more aesthetically appealing than narrative text(p = 0.018), audio, and transcript text (p = 0.000); narrative text was rated more favorably than transcript text (p = 0.009).This finding was not surprising, as the video contained many images and the narrative text had one image, whereas the audioand transcript text conditions had no visuals that depicted events in the stories. There were no differences for FA orFI + EN + NO; PUs was marginally significant [F(3, 93) = 2.45, p = 0.068], and video was perceived to be more usable thanthe transcript text condition (p = 0.05).
Overall, video was rated more positively on all components of UES, and transcript text the least. Narrative and audio werecomparable in terms of FA, but narrative was rated higher on AE and PUs, and FI + NO + EN was higher on average in theaudio condition. This is of interest because the UES allowed us to examine more dimensions of the user experience andsee that audio contributed to a more hedonic user experience, whereas narrative text received higher ratings on the systeminteraction aspects (PUs and AE) of the news interaction session.
7. General discussion
7.1. Implications for using the UES
We conducted three studies using the UES in the online news domain to examine its utility as a measure for discriminat-ing online news experiences. In terms of reliability, all three studies showed support for the internal consistency of the six
Table 8Correlation matrix for UES subscales.
Subscale a FA FI NO EN AE
Focused attention (FA) 0.92 1Felt involvement (FI) 0.85 0.8** 1Novelty (NO) 0.9 0.7** 0.84** 1Endurability (EN) 0.86 0.62** 0.84** 0.83** 1Aesthetic appeal (AE) 0.91 0.56** 0.63** 0.56** 0.61** 1Perceived usability (PUs) 0.84 0.29** 0.48** 0.52** 0.62** 0.36**
** p < 0.001.

Table 9PCA with oblique rotation for UES items.
Table 10Mean (SD) of UES by multimedia condition.
Sub-scale Video Audio Transcript text Narrative text Sig.
FI + EN + NO 4.87 (1.29) 4.83 (1.41) 4.2 (1.62) 4.56 (1.28) p = 0.19PUs 5.55 (0.75) 5 (1.02) 4.74 (1.27) 5.11 (1.08) p = 0.068AE 4.9 (1.03) 3.27 (0.97) 2.8 (1.24) 3.97 (1.55) p < 0.001FA 4.17 (1.5) 3.88 (1.39) 3.67 (1.32) 3.82 (1.48) p = 0.56
Bold meant to signify a statistically significant correlation.
424 H. O’Brien, P. Cairns / Information Processing and Management 51 (2015) 413–427
subscales prior to PCA (with the exception of NO and FI in Study 1, though this may be due to the small sample size).However, a four- (Study 3) or five-factor (Studies 1 and 2) solution emerged during PCA. AE, FA and PUs emerged as distinctfactors in all studies. In study 1, NO emerged as one component, whereas in studies 2 and 3, it merged with FI and EN itemsto form one component. These latter findings support recent work that suggests a four-factor structure for the UES is morefitting (O’Brien & Toms, 2013; Wiebe et al., 2014). We propose labeling these factors as FA, PUs, AE, and hedonic engagementdue to the fact that the items on the fourth factor gauge users’ level of interest, curiosity, and overall impression of theexperience, etc.
Yet, given the fact that NO loaded separately on Component 5 in Study 1, we do not wish to discount it entirely in thecontext of online news experiences. The value of NO in news interactions was supported in the qualitative interview datacollected as part of this study (O’Brien, 2011) and noted in the literature on news browsing behaviours (Toms, 2000). Weneed to be cautious in the interpretation of Study 1 due to sample size. We recommend that researchers with adequate sam-ple sizes perform factor analysis before moving forward to look at the UES in relation to other variables. Researchers withless than adequate sample sizes should still examine the reliability and correlation analyses on all six subscales of theUES. High correlations amongst subscales would suggest utilizing the UES as a four-factor experiential scale: PUs, FA, AEand EN/FI/NO.
Researchers should also consider whether to adopt the items EN3 and PUs8 for inclusion in experimental settings. Theseitems worked well in the original e-commerce context where respondents were asked about a shopping experience that wasvoluntarily carried out. In a laboratory setting, participants are typically engaging in pre-set tasks and may not have any plan,except to complete the experimental session. With these exceptions, the other items worked well in the online news context.
H. O’Brien, P. Cairns / Information Processing and Management 51 (2015) 413–427 425
We adopted the broader term ‘‘experience’’ in our administration of the UES (e.g., ‘‘I felt in control of the experience.’’),and other times refer to the ‘‘task’’ and ‘‘news website.’’ Researchers should give consideration to the wording of the items inIR settings, and elect not to look at experience but the search task and system to get a more nuanced view of the interaction.In studies with multiple search tasks, researchers must decide whether to administer the UES post-task or post-session, andthe implications for these choices. Asking participants to complete a 31-item questionnaire can add ‘‘bulk’’ to the experimen-tal design, but only administering the UES post-session may not accurately reflect the user experience, where some taskswere more challenging, fun, learning intensive, etc. than others.
The accident that led to using two versions of the UES with 5- or 7-point Likert scales has actually shown that both ver-sions give broadly similar results. This suggests that either is equally valid and reliable which is generally consistent withscales with a reasonable number of items (Cox, 1980).
The multidimensional nature of user engagement and the composition of the UES make it a more complex tool to opera-tionalize and score than a unidimensional scale, such as the System Usability Scale (SUS). The endurability, felt involvement,and novelty items pertain to the more pleasurable aspects of system use. As a result, one might ask, ‘‘Why measure usability,aesthetics, or focused attention?’’ Previous work has shown the inter-relationships amongst the factors, as well as theirinvolvement in predicting other outcome variables (O’Brien & Toms, 2010a,b, 2013). We see a great deal of potential in usingthe UES as one of multiple measures in an IIR study, and examining the relationships between UE and other variables ofinterest related to task performance and success, interaction with the IR system, and individual difference variables.
7.2. Evaluation of the UES in online news
The UES showed some potential for discriminant validity in studies 2 and 3. That is, in situations where there wasexpected to be a difference in levels of engagement, the UES did show some differences. This is an important aspect ofexamining the validity of any questionnaire that it should to some extent reflect our expectations of how the concepts beingmeasured behave (Cairns, 2013; Kline, 2000). There is of course a need for caution here. If a questionnaire produces exactlythe results expected then what insights can the questionnaire bring that our intuitions lack? Thus, discriminant validityshould be demonstrated only where there is an expectation of what the differences should be in the hope that where wedo not know what to expect, meaningful differences are revealed.
For the work here, the UES distinguished user experiences with a more (BBC) and less (IHT) familiar news source in study2, and between format conditions in study 3. It is interesting to note that in both studies 2 and 3, AE and PUs were perceiveddifferently depending on the between-subjects condition to which participants were assigned. Both of these subscalespertain to the appearance of the interface and users’ cognitive and affective perceptions of using the news websites.Neither news source (study 2), nor format (study 3) significantly affected FI, EN, or FA. Participants may have had more posi-tive experiences overall with the content encountered, regardless of the site or mode they interacted with. This is supportedby their confidence in their findings in news study 2 where there was no systematic difference between the two sources ofnews for the confidence participants felt in their findings.
The case for discriminant validity is therefore that the source or type of content does not itself influence engagement butrather the aesthetic and perceived usability aspects of engagement. This is consistent with our previous work, (O’Brien, 2011;O’Brien & Lebow, 2013) where we suggested that the role of content should be further explored in the user experience, as UEhas tended to focus on attributes of users and systems (O’Brien & Toms, 2008).
Nonetheless, both studies 2 and 3 show that looking at individual components of the UES, as opposed to calculating anoverall score, is useful. For example, in studies 2 and 3, there were relationships between participants’ perceptions of theusability and aesthetics of the news sources according to their familiarity with the site (Study 2) and the modality throughwhich they interacted with news (Study 3). An exploration of other variables, such as interest in the news content or usercharacteristics, may show differences in perceptions of the more hedonic (FA, NO, FI, and EN) components of the scale.Sundar et al. (2014), for instance, detected differences in the behaviours (one measure of user engagement) and contentevaluations of ‘‘power users’’ (designated as such based on their technology skills). Thus, isolating salient characteristicsof users, content and systems that promote higher and lower levels of engagement may be an effective way of utilizingthe multi-dimensional subscales of the UES.
8. Conclusion
In conclusion, we found evidence to support the reliability and construct validity of the UES across three studiesconducted in the online news domain. While our PCA did not confirm the six-factor structure of O’Brien and Toms’(2010a) original work, we did find support for the internal consistency of items with the subscales, and for PUs, AE andFA being stable factors. Our findings around the NO, FI and EN subscales is more perplexing: in Study 1 novelty emergedas a distinct factor, while in studies 2 and 3 it loaded with EN and FI items. Future work should look more closely at thisparticular finding to determine whether the problem lies in the expression of the item, or is a consequence of how the morehedonic components of experience are perceived (O’Brien & Toms, 2013).
In previous work we have asked, ‘‘Is there a universal measure of user engagement?’’ We believe that the UES reliablycaptures the dimensions of user engagement in a range of contexts. Aesthetics, usability, and focused attention appear to

426 H. O’Brien, P. Cairns / Information Processing and Management 51 (2015) 413–427
be ‘‘stable’’ dimensions of an engaged experience across various types of digital media, whereas felt involvement, novelty,and endurability are more variable in terms of whether they are ‘‘stand alone’’ factors. Nonetheless, with further investmentand continued use and evaluation, the UES is a ‘‘good’’ measure that can assist researchers in capturing the users’ perceptionof information interactions, and be used in mixed methods studies to help make sense of, for example, behavioural data.
Acknowledgments
We wish to thank the people who participated in the research studies. The first author (O’Brien) acknowledges thesupport of the Social Science and Humanities Council of Canada and the Networks of Centres of Excellence Graphics,Animation and New Media Project.
References
Al-Maskari, A., & Sanderson, M. (2011). The effect of user characteristics on search effectiveness in information retrieval. Information Processing andManagement, 47, 719–729.
Arguello, J., Wu, W.-C., Kelly, D., & Edwards, A. (2012). Task complexity, vertical display and user interaction in aggregated search. In Proceedings of the 35thinternational ACM SIGIR conference (pp. 435–444). Portland, Oregon: ACM.
Banhawi, F., & Mohamad Ali, N. (2011). Measuring user engagement attributes in social networking application. In Proceedings of the international conferenceon semantic technology and information retrieval (pp. 297–301). Putrajaya, Malaysia: IEEE.
Cairns, P. (2013). A critique of the UMUX usability questionnaire. Interacting with Computers, 25, 312–316.Chapman, P., Selvarajah, S., & Webster, J. (1999). Engagement in multimedia training systems. In Proceedings of the 32nd Hawaii international conferences on
systems sciences (pp. 1084). Maui, Hawaii: IEEE.Chung, D. S. (2008). Interactive features of online newspapers: Identifying patterns and predicting use of engaged readers. Journal of Computer-Mediated
Communication, 13, 658–679.Cox, E. P. (1980). The optimal number of response alternatives for a scale: A review. Journal of Marketing Research, 18, 407–422.DeVellis, R. F. (2003). Scale development: Theory and applications (2nd ed.). CA, Sage: Thousand Oaks.Fulmer, S., & Frijters, J. (2009). A review of self-report and alternative approaches in the measurement of student motivation. Educational Psychology Review,
21, 219–246.Hong, L., & Yang, S-H. (Eds.), (2013). Proceedings of the 1st workshop on user engagement optimization. 22nd ACM international conference on information
and knowledge management. San Francisco, CA, ACM.Hyder, J. A. (2010). Proposal of a website engagement scale and research model: Analysis of the influence of intra-website comparative behavior. Doctoral
Thesis. University of Valencia.Jacques, R. D. (1996). The nature of engagement and its role in hypermedia evaluation and design. Doctoral Thesis. South Bank University, London.Jacques, R., Preece, J., & Carey, T. (1995). Engagement as a design concept for multimedia. Canadian Journal of Education and Communication, 24(1), 49–59.Johnson, T. J., & Kaye, B. K. (2009). In blog we trust? Deciphering credibility of components of the internet among politically interested internet users.
Computers in Human Behavior, 25, 175–182.Käki, M., & Aula, A. (2008). Controlling the complexity in comparing search user interfaces via user studies. Information Processing and Management, 44,
82–91.Kelly, D. (2009). Methods for evaluating interactive information retrieval systems with users. Foundations and Trends in Information Retrieval, 3, 1–224.Kelly, D., Fu, X., & Shah, C. (2010). Effects of position and number of relevant documents retrieved on users’ evaluations of system performance. ACM
Transactions on Information Systems (TOIS), 28(2), article no. 9.Kelly, D., Harper, D. J., & Landau, B. (2008). Questionnaire mode effects in interactive information retrieval experiments. Information Processing and
Management, 44, 122–141.Kline, P. (2000). A psychometrics primer. Free Assoc. Books. 10.Lehmann, J., Lalmas, M., Yom-Tov, E., & Dupret, G. (2012). Models of user engagement. In Proceedings of the 20th conference on user modeling, adaptation, and
personalization (pp. 164–175). Montreal, QC: Springer.Levesque, V., Oram, L., MacLean, K., et al (2011). Enhancing physicality in touch interaction with programmable friction. In Proceedings of the SIGCHI
conference on human factors in computing systems (pp. 2481–2490). Vancouver, BC: ACM.Marshall, C. C. (2007). The gray lady gets a new dress: A field study of the times news reader. In Proceedings of the 7th ACM/IEEE-CS joint conference on digital
libraries (pp. 259–268). Vancouver, BC: ACM.McCarthy, J., & Wright, P. (2004). Technology as experience. MIT Press.McCay-Peet, L., Lalmas, M., & Navalpakkam, V. (2012). On saliency, affect and focused attention. In Proceedings of the 2012 annual conference extended
abstracts on human factors in computing systems (CHI) (pp. 541–550). New York: ACM.O’Brien, H.L. (2008). Defining and measuring user experiences with technology. Unpublished Doctoral Dissertation, Dalhousie University, Halifax, Nova
Scotia, Canada.O’Brien, H. L. (2011). Exploring engagement in online news interaction. In Proceedings of the Annual Meeting of the American Society of Information Science and
Technology, New Orleans, LA, DOI: 10.1002/meet.2011.14504801088O’Brien, H. L., & Lebow, M. (2013). A mixed methods approach to measuring user experience in online news interactions. Journal of the American Society of
Information Science and Technology, 64(8), 1543–1556.O’Brien, H. L., & Toms, E. G. (2008). What is user engagement? A conceptual framework for defining user engagement with technology. Journal of the
American Society of Information Science and Technology, 59(6), 938–955.O’Brien, H. L., & Toms, E. G. (2010a). The development and evaluation of a survey to measure user engagement. Journal of the American Society of Information
Science and Technology, 61(1), 50–69.O’Brien, H. L., & Toms, E. G. (2010b). Measuring interactive information retrieval: The case of the User Engagement Scale. In Proceedings of Information
Interaction in Context (pp. 335–340). New Brunswick, NJ: ACM.O’Brien, H. L., & Toms, E. G. (2013). Measuring engagement in search systems using the User Engagement Scale (UES). Information Processing and
Management, 49(5), 1092–1107.Preston, C. C., & Colman, A. M. (2000). Optimal number of response categories in rating scales: reliability, validity, discriminating power and respondent
preferences. Acta Psychologica, 104, 1–15.Singla, A., & White, R. W. (2010). Sampling high-quality clicks from noisy click data. In Proceedings of the 19th International Conference on World Wide Web
(pp. 1187–1188). Raleigh, NC: ACM.Sundar, S. S., Bellur, S., Oh, J., Xu, Q., & Jia, H. (2014). User experience of on-screen interaction techniques: An experimental investigation of clicking, sliding,
zooming, hovering, dragging and flipping. Human Computer Interaction, 29(2), 109–152.Sutcliffe, A. (2010). Designing for user engagement: Aesthetic and attractive user interfaces. In Synthesis lectures on human-centered informatics. morgan
Claypool.Tabachnick, B. G., & Fidell, L. S. (2013). Using multivariate statistics (6th ed.). Boston, MA: Pearson.

H. O’Brien, P. Cairns / Information Processing and Management 51 (2015) 413–427 427
Toms, E. G. (2000). Understanding and facilitating the browsing of electronic text. Journal of Human-Computer Studies, 52(3), 423–452.Turner, P. (2013). How we cope with digital technology. In J. M. Carroll (Ed.), Synthesis lectures on human informatics. Morgan and Claypool Publishers.Webster, J., & Ho, H. (1997). Audience engagement in multimedia presentations. SIGMIS Database, 28, 63–77.White, R. W., & Roth, R. A. (2009). Exploratory search: Beyond the query-response paradigm. In Synthesis lectures on information concepts, retrieval and
services. Morgan Claypool.Wiebe, E. N., Lamb, A., Hardy, M., & Sharek, D. (2014). Measuring engagement in video game-based environments: Investigation of the User Engagement
Scale. Computers in Human Behavior, 32, 123–132.