An Empirical Cumulus Parameterization Scheme for a Global ...vmisra/cumulus_jp.pdf · Journal of...
18
Journal of the Meteorological Society of Japan, Vol. 82, No. 4, pp. 989--1006, 2004 989 An Empirical Cumulus Parameterization Scheme for a Global Spectral Model K. RAJENDRAN, T.N. KRISHNAMURTI Department of Meteorology, Florida State University, Tallahassee, Florida, USA V. MISRA Center for Ocean-Land-Atmosphere Studies, Institute of Global Environment and Society, Inc., Calverton, Maryland, USA and W.-K. TAO Laboratory for Atmospheres, NASA Goddard Space Flight Center, Greenbelt, Maryland, USA (Manuscript received 16 December 2002, in final form 19 March 2004) Abstract Realistic vertical heating and drying profiles in a cumulus scheme is important for obtaining accurate weather forecasts. A new empirical cumulus parameterization scheme, based on a procedure to improve the vertical distribution of heating and moistening over the tropics is developed. The empirical cumulus parameterization scheme (ECPS) utilizes observed profiles of Tropical Rainfall Measuring Mission (TRMM) based apparent heat source ðQ 1 Þ and the European Centre for Medium-Range Weather Fore- casts (ECMWF) analysis based apparent moisture sink ðQ 2 Þ. A dimension reduction technique through rotated principal component analysis (RPCA) is performed on the vertical profiles of heating and drying over the convective regions of the tropics, to obtain the dominant modes of variability. Analysis suggests that most of the variance associated with the observed profiles can be explained by retaining the first three modes. The ECPS then applies a statistical approach, in which Q 1 and Q 2 are expressed as a linear combination of the first three dominant principal components which distinctly explain variance in the troposphere as a function of the prevalent large-scale dynamics. The principal component (PC) score, which quantifies the contribution of each PC to the corresponding loading profile, is estimated through a multiple screening regression method which yields the PC score as a function of the large-scale vari- ables. The profiles of Q 1 and Q 2 thus obtained are found to match well with the observed profiles. The im- pact of the ECPS is investigated in a series of short range (1–3 day) prediction experiments, using the Florida State University global spectral model (FSUGSM, T126L14). Comparisons between short range ECPS forecasts and those with the modified Kuo scheme, show a very marked improvement in the skill in ECPS forecasts. This improvement in the forecast skill with ECPS emphasizes the importance of in- Corresponding author and current affiliation: K. Rajendran, Meteorological Research Institute, 1-1 Nagamine, Tsukuba, Ibaraki-305 0052, Japan. E-mail: [email protected] ( 2004, Meteorological Society of Japan
Transcript of An Empirical Cumulus Parameterization Scheme for a Global ...vmisra/cumulus_jp.pdf · Journal of...

Journal of the Meteorological Society of Japan, Vol. 82, No. 4, pp. 989--1006, 2004 989
An Empirical Cumulus Parameterization Scheme for
a Global Spectral Model
K. RAJENDRAN, T.N. KRISHNAMURTI
Department of Meteorology, Florida State University, Tallahassee, Florida, USA
V. MISRA
Center for Ocean-Land-Atmosphere Studies, Institute of Global Environment and Society, Inc., Calverton,Maryland, USA
and
W.-K. TAO
Laboratory for Atmospheres, NASA Goddard Space Flight Center, Greenbelt, Maryland, USA
(Manuscript received 16 December 2002, in final form 19 March 2004)
Abstract
Realistic vertical heating and drying profiles in a cumulus scheme is important for obtaining accurateweather forecasts. A new empirical cumulus parameterization scheme, based on a procedure to improvethe vertical distribution of heating and moistening over the tropics is developed. The empirical cumulusparameterization scheme (ECPS) utilizes observed profiles of Tropical Rainfall Measuring Mission(TRMM) based apparent heat source ðQ1Þ and the European Centre for Medium-Range Weather Fore-casts (ECMWF) analysis based apparent moisture sink ðQ2Þ. A dimension reduction technique throughrotated principal component analysis (RPCA) is performed on the vertical profiles of heating and dryingover the convective regions of the tropics, to obtain the dominant modes of variability. Analysis suggeststhat most of the variance associated with the observed profiles can be explained by retaining the firstthree modes. The ECPS then applies a statistical approach, in which Q1 and Q2 are expressed as a linearcombination of the first three dominant principal components which distinctly explain variance in thetroposphere as a function of the prevalent large-scale dynamics. The principal component (PC) score,which quantifies the contribution of each PC to the corresponding loading profile, is estimated througha multiple screening regression method which yields the PC score as a function of the large-scale vari-ables.
The profiles of Q1 and Q2 thus obtained are found to match well with the observed profiles. The im-pact of the ECPS is investigated in a series of short range (1–3 day) prediction experiments, using theFlorida State University global spectral model (FSUGSM, T126L14). Comparisons between short rangeECPS forecasts and those with the modified Kuo scheme, show a very marked improvement in the skillin ECPS forecasts. This improvement in the forecast skill with ECPS emphasizes the importance of in-
Corresponding author and current affiliation: K.Rajendran, Meteorological Research Institute, 1-1Nagamine, Tsukuba, Ibaraki-305 0052, Japan.E-mail: [email protected]( 2004, Meteorological Society of Japan

corporating realistic vertical distributions of heating and drying in the model cumulus scheme. This alsosuggests that in the absence of explicit models for convection, the proposed statistical scheme improvesthe modeling of the vertical distribution of heating and moistening in areas of deep convection.
1. Introduction
One of the most important physical processesthat play a crucial role in numerical weatherprediction is the cumulus convection. In addi-tion to modifying the heat balance of the tropi-cal atmosphere, the energy release in cumulusconvection is strongly linked to the growth oftropical weather systems such as tropical cy-clones (Charney and Eliassen 1964). The spa-tial and temporal distribution of heating in thetropics has an important impact on the largescale circulation and climate variability. It hasbeen shown that vertical profiles of heating anddrying of tropical cloud clusters affect the waythe large scale circulation responds to deepconvection (e.g., Hartmann et al. 1984; Krish-namurti et al. 1995; Zhang and Krishnamurti1996). The role of diabatic heating on the 30–60day oscillation in the tropical atmosphere, hasalso been extensively studied and found to beimportant (e.g., Lau and Peng 1987; Chang andLim 1988; Sui and Lau 1989). The convectiveheating serves as a forcing for large-scale mo-tions associated with the tropical intraseasonaloscillations and its simulation is found to besensitive to the heating rates produced bydifferent cumulus schemes (Rajendran et al.2002). The impact of vertical heating and mois-tening profiles on the forecast of deep convec-tion is significant, especially during extremeevents. For example, the space time heatingdistribution in individual storms is useful forstorm diagnostics and forecasting applications.These studies suggest the importance of in-corporating realistic vertical heating and dry-ing profiles in the cumulus scheme to obtainaccurate weather forecasts.
Krishnamurti et al. (1983) indicated thatthe modified Kuo scheme implemented in theFSUGSM is limited by the vertical structurefunction of heating and moistening, which isproportional to the difference between cloudand environmental properties. Johnson (1984)has pointed out that cumulus parameterizationschemes that assign vertical distributions tothe convective heating and drying, should con-
sider the different contributions from separatecumulus and mesoscale components as theyhave very different heating and moisteningprofiles. Alexander et al. (1993) analyzed thecombined vector ðQ1;Q2Þ derived from the Aus-tralian Monsoon Experiment (AMEX) by ap-plying rotated principal component analysis(RPCA), and showed that peaks in the profilesvary as a function of the life cycle stage of theconvection. Here Q1 and Q2 are the apparentheat source and apparent moisture sink (Yanaiet al. 1973) respectively. RPCA was also ap-plied to the ECMWF analysis by Misra (1997)to extract the basic modes of cumulus heatingand drying profiles. Lin and Arakawa (2000)identified the basic modes of cumulus heatingand drying profiles through RPCA to be used asa partial closure for the Arakawa-Schubert cu-mulus parameterization scheme. These studiessuggest that in the absence of explicit modelsfor convection, statistical schemes might per-form a reasonable job in producing profiles ofheating and moistening which match closelywith observations.
Explicit models of cumulus convection de-mand very high horizontal and vertical resolu-tion and involve large computational resources.Instead the physical effects of cumulus con-vection are estimated from known large-scalemodel parameters, which affect deep cumulusconvection. In one of the pioneering studiesdemonstrating the strong dependence of deepcumulus convection on large-scale variables,using photographic mapping of clouds over thetropical Pacific, Malkus and Williams (1963)found that the prevalence of deep cumulus con-vection coincided with strong low-level synoptic-scale convergence. The composite analysis of18 tropical disturbances in the equatorial WestPacific by Reed and Recker (1971) illustratedthat the heaviest precipitation occurs in thetrough region where relative humidity and up-ward motion were high. The precipitation esti-mates obtained from large-scale moisture bud-get, which conformed well with the observeddata, suggested that moisture convergence wasthe single largest contributing factor in the
Journal of the Meteorological Society of Japan990 Vol. 82, No. 4

moisture budget. Ogura (1975) found a stronglinear correlation between rainfall rate andlarge-scale vertical velocity in tropical wavesand hurricanes. Studies by Krishnamurti et al.(1980, 1983) have emphasized the importanceof the control of large-scale wave dynamics onthe rainfall associated with tropical mesoscalesystems. At higher latitudes, besides upwardmotion and convergence of water vapor, large-scale thermodynamic structure and verticalwind shear also appear to be important intriggering cumulus convection (Zawadzki andRo 1978; Zawadzki et al. 1981; Weisman andKlemp 1982). The results of these observationalstudies provide the large-scale variables whichare crucial for cumulus heating and drying dis-tribution in areas of deep convection.
The main objective of the present study isto investigate the forecast improvement inFSUGSM by realistic modeling of the verticaldistribution of heating and moistening in areasof deep convection over the global tropics. Astatistically based empirical cumulus parame-terization scheme (ECPS), which makes use ofthe observed profiles of apparent heat sourceðQ1Þ and moisture sink ðQ2Þ, is developed. Thisis achieved by applying RPCA on profiles ofQ1 and Q2 over active convective regions ofthe tropics (40�S to 40�N), to obtain dominantmodes of variability. The ECPS then uses astatistical approach in which Q1 and Q2 areexpressed as a linear combination of the firstthree dominant principal components whichdistinctly explain variance in the lower, middleand upper troposphere, as a function of theprevalent large-scale dynamics. The principalcomponent (PC) score which quantifies thecontribution of each PC to the correspondingloading profile, is estimated through a multiplescreening regression method which yields thePC score as a function of the large-scale vari-ables. To study the impact of modeling realisticvertical distribution of Q1 and Q2 associatedwith deep convection, the ECPS is implementedin the Florida State University global spectralmodel (FSUGSM, T126L14), and a series ofshort range forecast experiments are per-formed. Further, the performance of the ECPSis analyzed by comparing the results of thisensemble of short range forecast experimentsstarted from different initial conditions withthe corresponding integrations of the control
version of the FSUGSM. The improvement inforecast skill with ECPS is further analyzedagainst short range experiments in which bothQ1 and Q2 profiles are based on the ECMWFanalysis.
The datasets used are described in section 2.Section 3 describes the analysis procedurebased on RPCA, the formulation of the ECPSand the analysis results of the statisticalapproach used for the formulation of the ECPS.The results of short range prediction experi-ments using FSUGSM are presented in section4. In section 5, the results are summarized.
2. Datasets: Q1 and Q2 profiles
The ECPS utilizes daily observed verticalprofiles of apparent heating ðQ1Þ and moisten-ing ðQ2Þ over the convective regions of tropicsduring the period 1–28 February 1998. The Q1
profiles are derived using TRMM rainfall prod-ucts (e.g., Tao et al. 2001), and the Q2 profilesare derived from ECMWF analysis followingYanai et al. (1973).
2.1 TRMM based heating profilesIn diagnostic studies (e.g., Yanai et al. 1973),
the apparent heat source Q1 of a large-scalesystem is defined by averaging horizontally thethermodynamic equation as:
Q1 ¼ Cppqy
qtþ V � ‘yþ w
qy
qz
� �þ QR; ð1Þ
where
p ¼ ðp=1000 mbÞR/Cp :
Here y is the potential temperature, V is thehorizontal wind vector, w is the vertical veloc-ity, p is the pressure, R is the dry gas constant,and Cp is the specific heat of air at constantpressure. QR is the radiative cooling/heatingrate per unit mass of air.
The right hand side of Eq. 1 represents thelarge-scale response to heating from the appar-ent heat source, Q1. Q1 can be estimated eitherfrom observations or from grid values in aglobal or regional scale prediction model. Q1
can be directly related to the contributionsof cloud effects which can be explicitly esti-mated by a cloud-resolving or cumulus ensem-ble model (e.g., the Goddard cumulus ensemblemodel, Simpson and Tao 1993):
K. RAJENDRAN, T.N. KRISHNAMURTI, V. MISRA and W.-K. TAO 991August 2004

Q1 ¼ �Cpp1
r
qðrw 0y 0Þqz
þ Lvðc � eÞ
þ Lf ð f � mÞ þ Lsðd � sÞ þ QR; ð2Þ
where r is the air density and Lv;Lf and Ls arethe latent heats of vaporization, fusion and sub-limation respectively. The variables c; e; f ;m;dand s are the rates of condensation, evapora-tion, freezing, melting, deposition and subli-mation per unit mass of air respectively. Theoverbars denote horizontal averages and theprimes indicate deviations from the horizontalaverages.
To summarize,
Q1 ¼ Eddy flux convergence of heat ðTerm 1Þ
þ Latent heating ðTerms 2�4Þ
þ Radiation ðTerm 5Þ:
Among the three contributors, the latent heat-ing is found to dominate the eddy flux conver-gence, and radiation contributions to the totalQ1 (Tao et al. 1993a). Vertically integrated la-tent heating terms of Eq. 2 can be related to thesurface precipitation rate, R, following Yanai etal. (1973) through moisture conservation:ð ztop
zbase
r½Lvðc � eÞ þ Lf ð f � mÞ þ Lsðd � sÞ�dz
ArlLvR; ð3Þ
i:e:;
ð ztop
zbase
rðQ1 � QRÞdzArlLvR; ð4Þ
where rl is the density of liquid water(1 g cm�3). Thus, it follows that passive micro-wave estimates of surface rainfall rate can yieldreasonable estimates of vertically integratedQ1 � QR.
a. Convective-Stratiform Heating (CSH)algorithm
The profiles of Q1 � QR (hereafter will bereferred to as Q1) are then derived usingthe Convective-Stratiform Heating (CSH) algo-rithm of Tao et al. (1993b). The flow chart inFig. 1 shows the detailed procedure for the re-trieval of the profiles of TRMM based appar-ent heat source. The algorithm uses surfaceprecipitation rates, percentage amount of itsstratiform component, the type and location ofobserved cloud systems and a look-up table
containing latent heating profiles associatedwith various types of cloud systems (e.g., squallvs. non squall or monsoon) at different geo-graphic locations, as inputs. The lookup-tablehas many sets of stored convective and strati-form latent heating profiles mostly simulatedby the Goddard cloud ensemble model. Each setof profiles is normalized by the convective andstratiform rainfall amounts assuming a rela-tion such as (4) applied to both convective andstratiform rainfall regimes. The rain rate, R, isused for limiting the total amount of derivedheating (e.g., Eq. 4).
This algorithm takes into account the factthat when cloud latent heating is separatedinto convective and stratiform rainfall regimes,the profiles for each region take on a charac-
CSH Heating ProfileLook-up Table(GCE Modeled
Heating Profiles)
Convective-Stratiform Heating Algorithm
TRMM Microwave Imager (TMI)
Heating Profile
CSH-TMI Heating Profile
GPROF Algorithm
Heating ProfileValidation
?
Z base
Z top Q 1 dzL v
C pR
1
Rain RateStratiform Proportion
Fig. 1. Flowchart showing the procedurefor deriving profiles of apparent heatsource using the CSH heating algo-rithm. The heating profiles in the look-up table are from diagnostic and GCEmodel simulated convective and strati-form heating profiles for various geo-graphic locations. The heating ðQ1Þprofile is normalized by the surfacerain rate ðRÞ. The ‘‘?’’ means to validatethe CSH derived profiles with actualsoundings.
Journal of the Meteorological Society of Japan992 Vol. 82, No. 4

teristic shape even for systems from differentgeographic locations. Thus, the success of themethod depends on the proper discriminationof convective and stratiform rain regimes whichhave characteristic vertical motion and heatingprofile shapes. The strong link between verticalvelocity and diabatic heating rate is discussedby Anthes (1982) and Mapes and Houze (1995).Thus, an appropriate set of heating profileswhich have been normalized with respect tosurface rainfall, R, is selected from this look uptable. Then these profiles are multiplied bysatellite derived rainfall rates. The percentageof that rate which is stratiform is used in orderto properly weigh the convective and stratiformprofiles used in the retrieval.
Daily 0.5�-gridded rainfall and percentageof rainfall classified as stratiform/convective
from TRMM Microwave Imager (TMI) for Feb-ruary 1998 produced using Goddard profiling(GPROF) algorithm (Olson et al. 1999) wereused as inputs to the CSH algorithm while re-trieving the heating profiles used in this study.These CSH derived heating profiles are vali-dated with those estimated at well designedfield campaigns, such as TRMM field programs.The contribution due to latent heating is foundto dominate the eddy flux convergence and ra-diation contributions to the total heating.
The observed TRMM based February 1998mean apparent heat source (Q1, interpolated tomodel s-level) at three vertical levels (s0:3; s0:5
and s0:8) over the global tropics is shown in Fig.2. The horizontal pattern is very similar to thesurface rainfall distribution during this month(not shown) especially at middle and upper
Fig. 2. Monthly mean apparent heat source ðQ1Þ in 0K/day for February 1998 derived using theTMI-CSH algorithm at three different levels, s ¼ 0:3 (top), s ¼ 0:5 (middle), and s ¼ 0:8 (bottom).The boxes denotes the domains used for analysis.
K. RAJENDRAN, T.N. KRISHNAMURTI, V. MISRA and W.-K. TAO 993August 2004

levels. Large heating (l10 K day�1) in themiddle and upper troposphere is associatedwith stronger surface rainfall and resultantlatent heat release. The noticeable featuresare the well defined tropical convergence zone(TCZ) over the East and central Pacific, Atlan-tic Ocean, a broad belt spanning from the SouthIndian Ocean through the Indonesian maritimecontinent, and a distinct south Pacific conver-gence zone (SPCZ). In addition, broad areas ofstrong heating are seen over the continentalregions of the Southern Hemisphere. The heat-ing over the Pacific Ocean is stronger thanthe heating over other convective centers, es-pecially in the upper troposphere. This may bedue to the higher tropopause and warmer seasurface temperatures over the Pacific. Over thePacific and Indian Oceans, strong differentialheating between land and ocean can strengthenthe gradients in thermodynamic fields and af-fect the large-scale circulation. Also, at lowertroposphere, heat sinks (areas of weak cooling)are seen over the Northern Hemispheric con-tinents, and over parts of Indian, Pacific andAtlantic Oceans.
2.2 Moistening ðQ2Þ profiles based onECMWF analysis
Following Yanai et al. (1973), the apparentmoisture sink Q2 of a large-scale system is de-fined by horizontally averaging the water vaporequation as:
Q2 ¼ �Lqq
qtþ V � ‘q þ w
qz
� �; ð5Þ
where L ¼ Lv, is the specific latent heat of va-porization.
The datasets used for computing moisteningðQ2Þ profiles were obtained from ECMWF anal-ysis on a 1� � 1� horizontal grid for one monthperiod extending from 1 February 1998 to 28February 1998. The datasets contained zonaland meridional winds, geopotential height,temperature and relative humidity at standardpressure levels. These fields were linearly in-terpolated to a T126 Gaussian grid in the hori-zontal, and the 14 sigma levels in the verticalcorresponding to the FSUGSM (T126L14) reso-lution. Physical initialization (Krishnamurtiet al. 1991, 1993) of FSUGSM using ECMWFanalysis and observed SSM/I rain rates, yieldsFSU analyzed datasets in which vertical dis-
tributions of drying ðQ2Þ are consistent withobserved rain rates, surface fluxes and clouds.Q2 is thus obtained from the FSU analysisfields following Yanai et al. (1973).
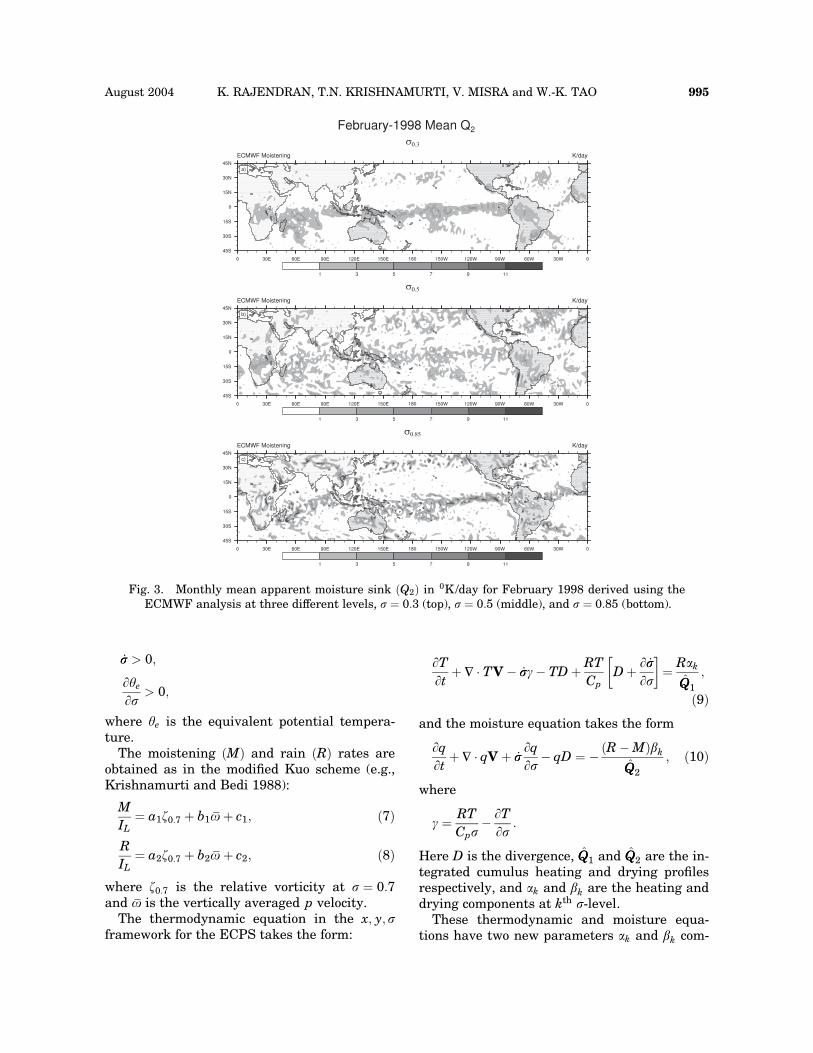
The computed February 1998 mean distribu-tion of Q2 over the global tropics at three verti-cal levels (s0:3; s0:5 and s0:85) is shown in Fig. 3.The horizontal pattern is close to the surfacerainfall distribution, especially at lower tropo-sphere. The heat sources (e.g., Fig. 2) in thetropics are generally accompanied by a mois-ture sink ðQ2Þ indicating that the release oflatent heating of condensation is the majorcomponent of the heat source. The distributionsof large positive Q1 and Q2 in the tropics areconsistent with the distribution of the precipi-tation, indicating that the heating is associatedwith deep cumulus convection.
2.3 Validation datasetsObserved daily precipitation on 1� � 1� grid
based on the Global Precipitation ClimatologyProject (GPCP) combined dataset (Huffman etal. 1997), was used for the validation of precip-itation forecasts from FSUGSM. Daily ECMWFanalysis were used for the validation of circula-tion fields.
3. Empirical cumulus parameterizationscheme (ECPS)
In the ECPS, the initiation and location ofconvective activity is addressed as in the modi-fied Kuo scheme proposed by Krishnamurti etal. (1983). Thus, the ECPS has similar criteriaas that of the modified Kuo scheme, in whichmoisture convergence is considered as the dom-inant term in the moisture budget of a con-vective system. This suggests that the deepconvection is prevalent if the atmosphere isconditionally unstable, and if net moisture con-vergence is positive, i.e., if,
Dc b 0:2; ð6Þ
IL > 0; and rainfall > 5 mm/day;
then the ECPS is invoked in the model. Here,IL is the large-scale moisture convergence andDc refers to cloud depth, which is given by
Dc ¼pLCL � pcloudtop
psurface:
The condition implied by (6) suggests the fol-lowing criteria viz.
Journal of the Meteorological Society of Japan994 Vol. 82, No. 4
_ss > 0;
qye
qs> 0;
where ye is the equivalent potential tempera-ture.
The moistening ðMÞ and rain ðRÞ rates areobtained as in the modified Kuo scheme (e.g.,Krishnamurti and Bedi 1988):
M
IL¼ a1z0:7 þ b1oþ c1; ð7Þ
R
IL¼ a2z0:7 þ b2oþ c2; ð8Þ
where z0:7 is the relative vorticity at s ¼ 0:7and o is the vertically averaged p velocity.
The thermodynamic equation in the x; y; sframework for the ECPS takes the form:
qT
qtþ ‘ � TV � _ssg� TD þ RT
CpD þ q _ss
qs
� �¼ Rak
Q̂Q1
;
ð9Þ
and the moisture equation takes the form
qtþ ‘ � qV þ _ss
qs� qD ¼ �ðR � MÞbk
Q̂Q2
; ð10Þ
where
g ¼ RT
Cps� qT
qs:
Here D is the divergence, Q̂Q1 and Q̂Q2 are the in-tegrated cumulus heating and drying profilesrespectively, and ak and bk are the heating anddrying components at kth s-level.
These thermodynamic and moisture equa-tions have two new parameters ak and bk com-
Fig. 3. Monthly mean apparent moisture sink ðQ2Þ in 0K/day for February 1998 derived using theECMWF analysis at three different levels, s ¼ 0:3 (top), s ¼ 0:5 (middle), and s ¼ 0:85 (bottom).
K. RAJENDRAN, T.N. KRISHNAMURTI, V. MISRA and W.-K. TAO 995August 2004

pared to the corresponding equations in themodified Kuo scheme of Krishnamurti et al.(1983). These parameters are obtained througha statistical analysis procedure, which is de-scribed in the next section.
3.1 Formulation of the statistical approachTo identify the dominant modes of variability
associated with Q1 and Q2 profiles, the dimen-sion reduction technique of rotated principalcomponent analysis (RPCA) is applied to thevertical profiles of Q1 and Q2 over the activeconvective regions of the global tropics (40�S–40�N).
a. Rotated principal component analysis(RPCA)
One of the most common eigenvectorial tech-niques used in analyzing meteorological datais principal component analysis (PCA), which isalso referred to as empirical orthogonal func-tions (EOFs, Preisendorfer 1988). With EOF/PCA, the variance of a dataset can be describedusing a minimal number of extracted factors/components that are spatially and temporallyorthogonal to each other. RPCA is a statisti-cal approach to extract preliminary factorsthrough PCA, and then obtain the final solutionthrough rotation (a non-singular linear trans-formation on the PCs/EOFs) of the preliminaryfactors (Richman 1986). The RPCA solutionsthus obtained agree better with the physicallyrealizable structures of the input datasets thanEOF/PCA (e.g., Richman 1986). In addition,the rotated principal components provide sub-domain stability which is the invariance ofmodes of variability as sub-portions of the do-main are examined. The performance assess-ment of various rotation methods in recoveringthe input structure by Richman (1986) suggeststhat no one specific rotation method will alwaysyield the most accurate results. Our assess-ment of performance of various rotation meth-ods in recovering the input structures of Q1 andQ2 suggested orthogonal varimax rotation asthe most appropriate rotation method. Hence,in this study, we have used the orthogonalnormal varimax rotation method for applyingRPCA.
In PCA, the matrix with EOFs as its columnvectors is referred to as the PC loading matrix,where the elements of the matrix (PC loadings)represent the correlation between the PC and
the variable analyzed. The matrix with PCs asits row vectors is referred to as the PC scorematrix, where the elements of the matrix (thePC scores) represent the contribution of thePC to the corresponding loading profile. Math-ematically RPCA can be written as
ðAÞp�N ¼ ðBÞp�pðTÞp�pðPCCÞp�N ; ð11Þ
where A is the input matrix, B is the unrotatedPC loading matrix, T is the transformationmatrix, PCC is the PC score matrix and N isthe total number of points. In this study, theelements of matrix B are given by the normal-ization,
Ppi¼1 b2
ki ¼ lk, where p is the number ofvertical levels and lk is the kth eigen value.
To obtain the dominant modes of variabilityassociated with Q1 and Q2 profiles, the con-vectively active regions are delineated by se-lecting profiles of Q1 and Q2 only over pointswhere the integrated value of Q1 over the depthof the column was a positive definite quantity.It is seen that performing RPCA on selectedsets of Q1 and Q2 profiles produces EOFs, ofwhich the first three dominant EOFs collec-tively explain more than 99% of the total vari-ance. For example, the PC loading profiles cor-responding to the first three EOFs of Q1 areshown in Fig. 4a. Here, sigma level 0.99 corre-sponds to the lowest level above the surfaceand sigma level 0.05 corresponds to the top ofthe atmosphere. The first three EOFs explain66.1%, 30.7% and 2.9% of total variance re-spectively. The profiles show distinctive peaksin the lower, middle and upper troposphere.These peaks indicate the level of maximumvariation in the vertical column. Comparison ofthe dominant extracted modes with those ob-tained in previous studies reveals some differ-ences among them which may be due to thedifferences in the domain, season and method-ology of the analysis. While the TRMM basedQ1 rotated EOF1 profile resembles the firstmode obtained by the previous studies (e.g.,the Tropical Ocean Global Atmosphere Cou-pled Ocean–Atmosphere Response Experiment(TOGA COARE) intensive observing period(IOP) dataset based modes in Lin and Arakawa2000, and Tung et al. 1999), the EOF2 matchesreasonably well with the second mode obtainedby Alexander et al. (1993) based on AMEXdataset. The EOF3 closely matches the thirdmode obtained by Lin and Arakawa (2000),
Journal of the Meteorological Society of Japan996 Vol. 82, No. 4

based TOGA COARE IOP dataset. However,the significance of the TRMM based Q1 rotatedEOF3 is low, because it contributes only about3% of the total Q1 variation.
Figure 4b shows the PC loading profilescorresponding to the first three EOFs with ex-actly half the number of convectively activedata points used for RPCA. It is apparent thatthe shape of the profiles in the two cases (Figs.4a and b) match exactly with each other exceptfor a slight difference in the variance explainedby individual EOFs. This result shows the sub-domain stability of RPCA based on varimax ro-tation. Similarly, the profiles of the first threeEOFs of Q2, explaining 65.1%, 14.8% and 9.4%
of the total variance respectively, are shown inFig. 4c. Collectively, 89.3% of the total varianceis explained by these EOFs. Thus, RPCA is ableto isolate the dominant and stable modes ofvariability associated with the profiles of largescale heating and drying over the convectivelyactive regions in the tropics.
Thus, applying RPCA on Q1 and Q2 profilesyields the PC loading matrices which can berepresented as E1 and E2 respectively. Thesematrices are products of respective unrotatedPC loading matrix and the transformation ma-trix. Similarly, the PC score matrices for Q1
and Q2 can be represented as PCC1 and PCC2
respectively. Hence,
-0.4 -0.3 -0.2 -0.1 0 0.1 0.2 0.3 0.4 0.5 0.6Q1 (K/day)
1
0.9
0.8
0.7
0.6
0.5
0.4
0.3
0.2
0.1
σ Le
vels
EOF1: 66.1%EOF2: 30.7%EOF3: 2.9%
TRMM Based Q1 Rotated EOF Profile --- February 1998
Fig. 4a. Vertical structure and varianceexplained by 1–3 rotated EOFs of theTRMM based heating field, Q1 (0K /day)for February 1998.
-0.4 -0.3 -0.2 -0.1 0 0.1 0.2 0.3 0.4 0.5 0.6Q1 (K/day)
1
0.9
0.8
0.7
0.6
0.5
0.4
0.3
0.2
0.1
σ Le
vels
EOF1: 68.4%EOF2: 28.2%EOF3: 3.0%
TRMM Based Q1 Rotated EOF Profile --- February 1998(Based on half no of points)
Fig. 4b. Same as Fig. 4a, but with halfnumber of convective points.
-0.4 -0.2 0 0.2 0.4 0.6Q2 (K/day)
1
0.9
0.8
0.7
0.6
0.5
0.4
0.3
0.2
σ Le
vels
EOF1: 65.1%EOF2: 14.8%EOF3: 9.4%
ECMWF Based Q2 Rotated EOF Profile --- February 1998
Fig. 4c. Vertical structure and varianceexplained by 1–3 rotated EOFs ofthe Q2 (0K /day) field estimated usingECMWF analysis for February 1998.
K. RAJENDRAN, T.N. KRISHNAMURTI, V. MISRA and W.-K. TAO 997August 2004

ðAÞp�1 ¼ ðE1Þp�rðPCC1Þr�1 ð12Þ
ðBÞp�1 ¼ ðE2Þp�rðPCC2Þr�1 ð13Þ
Here r represents the number of dominantEOFs retained. The elements of column matrixA are ak and that of column matrix B are bk,the heating and drying components in Eqs. 9and 10 respectively. Each of the elements ofthe column vector PCC1 given by PCrQ1
andthat of PCC2 given by PCrQ2
are determinedthrough a screening regression analysis, whichis described in the next subsection.
b. Multiple screening regression analysisIn the ECPS formulation, the PC scores are
obtained as a function of large-scale variablesby applying a multiple screening regressionanalysis. Three PC scores corresponding to thefirst three retained EOFs for Q1 and Q2 areestimated through the regression analysis. Thevariables such as cloud depth, moisture con-vergence and large-scale vertical motion, whichare known to vary with convective activity, arechosen as the large-scale variables. A screen-ing technique using the best subset of regres-sions was applied to optimize the number ofpredictor variables. Several regressions weretested with a varying number of predictors, andfor each experiment all the subset of regres-sions were screened to obtain the optimumnumber of variables which explain most of thevariance. The resulting six regression equa-tions are
PC1Q1¼ 3:0 � 0:3Dc � 2:1 � 105
� 0:5 _ss5 þ 0:8 _ss6 þ 2 _ss7 þ 1:5 _ss8 þ 0:7 _ss9 þ 0:5 _ss10
6
� �
ð14Þ
PC2Q1¼ 1:9 � 5:0 � 106IL þ 0:15Dc � 1:3
� 105 _ss10 þ _ss11 þ _ss12 þ _ss13 þ _ss14
5
� �ð15Þ
PC3Q1¼ �2:5 þ 9:6 � 105IL � 0:38Dc
� 5:4 � 105 _ss14 ð16Þ
PC1Q2¼ 1:3 � 3:0 � 106IL þ 0:17Dc � 1:8
� 105 _ss10 þ _ss11 þ _ss12 þ _ss13 þ _ss14
5
� �ð17Þ
PC2Q2¼ 0:55 þ 3:8 � 106IL þ 0:28Dc ð18Þ
PC3Q2¼ 0:44 � 1:4 � 106IL ð19Þ
Here, IL is the moisture convergence and _ssk isthe vertical velocity at the kth sigma level.
3.2 Reconstructed Q1 and Q2 profilesTo analyze the reconstructed profiles, we
have chosen five tropical domains (based onthe mean February 1998 heating distributionshown in Fig. 2). The three oceanic domainsare Central Pacific (CPAC, 15�S–5�N; 180�–140�W), Indian Ocean (IO, 30�S–5�N; 40�E–110�E) and Atlantic Ocean (AO, 15�S–15�N;45�W–0�). The two continental areas are Africa(AFR, 35�S–10�N; 0�–40�E) and Australia(AUS, 35�S–15�S; 115�E–155�E). The recon-structed Q1 profiles for these domains areshown in Fig. 5a. The heating rate is plottedalong the x-axis and the model sigma levels areplotted along the y-axis. The retrieved profilesare obtained from a linear combination of thefirst three dominant rotated EOFs. It is seenthat the retrieved profiles match very closelywith the corresponding observed profiles. Thereconstructed Q2 profiles for selected two do-mains (IO and CPAC) are shown in Fig. 5b. Forboth the domains, the retrieved profiles areclose to the observed profile. The results sug-gest that RPCA is an effective tool for dimen-sion reduction in which the observed verticalprofiles of Q1 and Q2 are retrieved with a rea-sonable degree of accuracy by retaining a fewdominant EOFs.
4. Predictive skills of short rangeforecasts
In order to study the impact of the ECPS,a series of short range (3 day) forecast ex-periments are carried out with the FSUGSMhaving in-built physical initialization (Krishna-murti et al. 1991, 1993), using ECMWF analy-sis and observed SSM/I rain rates. The controlversion represents the run with the cumulusparameterization based on the modified Kuoscheme of Krishnamurti et al. (1983). A briefoverview of the FSUGSM control version isgiven in Appendix.
4.1 A representative case studyOut of a series of experiments performed
with the ECPS, the results of a representative
Journal of the Meteorological Society of Japan998 Vol. 82, No. 4

short range forecast started with 5 February1998 initial condition is compared against cor-responding observation and the FSUGSM con-trol forecast. The day-3 precipitation forecastover the tropics for 12Z 8 February 1998 isshown in Fig. 6. It is seen that the precipita-
tion distribution is improved globally along theTCZ, and regionally over all the major con-vective centers except over southern Africa.The high forecast rain in the control versionbecomes comparable with the observed GPCPrain in the ECPS forecast. The longitude-vertical section of day-3 zonal wind averagedover the equatorial belt (5�S–5�N) from thecontrol, and the ECPS forecasts are comparedwith that from the ECMWF analysis in Fig. 7.The circulation though has some delayed re-sponse to the heating profile, shows improve-ment in the ECPS forecast. The major im-provement occurs in the middle and uppertroposphere, consistent with the vertical distri-bution of TRMM based heating (Fig. 2). Thissuggests that the tropical circulation is sensi-tive to vertical distribution of large-scale con-vective heating and drying on this time scale.In addition, this indicates the importance ofincorporating ECPS-like cumulus scheme inmedium and long range forecasts, especially inthe context of tropical variabilities associatedwith Madden-Julian Oscillation (MJO). Figure8 shows the latitude-vertical section of theday-3 forecast of meridional wind averagedover 40�E–100�E from the control, ECPS andECMWF analysis. The structure and the mag-nitude of winds are closer to ECMWF analyzedwinds for the ECPS forecast. The ECPS givesrise to a better forecast of Hadley cell asso-ciated with Australian monsoon, as well as amore realistic Ferrel and Polar cells.
The predictive skill has been evaluated basedon the root mean square error (RMSE) of 850and 200 hPa winds, and geopotential heightat 500 hPa over six selected tropical domains.Figure 9 shows the estimated RMSE of control,and ECPS forecasts for these domains. In gen-eral, the error distribution shows a clear im-provement in forecast skill from the use ofECPS in the FSUGSM. The improvement inforecast skill is quantified by estimating thepercentage improvement in RMSE, which isestimated as the percentage of the differencebetween RMSE of ECPS and control dividedby the RMSE of control. The percentage im-provement in 200 hPa wind and 500 hPa geo-potential height fields over different tropicaldomains (Fig. 10), shows a very marked im-provement in the short range forecasts globallyand regionally, when ECPS is used. The pre-
48 32 16 0 16 32Q1 (K/day)
1
0.9
0.8
0.7
0.6
0.5
0.4
0.3
0.2
0.1
0
σ Le
vels
AFR
5 0 5 10 15 20 25Q1 (K/day)
1
0.9
0.8
0.7
0.6
0.5
0.4
0.3
0.2
0.1
0
Q1 Profiles February 1998IO
5 0 5 10 15 20Q1 (K/day)
1
0.9
0.8
0.7
0.6
0.5
0.4
0.3
0.2
0.1
0AUS
5 0 5 10 15 20 25Q1 (K/day)
1
0.9
0.8
0.7
0.6
0.5
0.4
0.3
0.2
0.1
0
σ Le
vels
CPAC
5 0 5 10 15 20Q1 (K/day)
1
0.9
0.8
0.7
0.6
0.5
0.4
0.3
0.2
0.1
0
σ Le
vels
AO
Obs. (TRMM) Reconstructed
Fig. 5a. Observed and reconstructed ver-tical profiles of Q1 for five domains.
2 1 0 1 2Q2 (K/day)
1
0.9
0.8
0.7
0.6
0.5
0.4
0.3
0.2
σ Le
vels
IO
1 0 1 2 3Q2 (K/day)
1
0.9
0.8
0.7
0.6
0.5
0.4
0.3
0.2
σ Le
vels
CPAC
Obs. (ECMWF Anal.) Reconstructed
Q2 Profiles February 1998
Fig. 5b. Observed and reconstructed ver-tical profiles of Q2 for two selected do-mains.
K. RAJENDRAN, T.N. KRISHNAMURTI, V. MISRA and W.-K. TAO 999August 2004

dictive skill seen in this case study is also con-sistently evident in other short range forecasts.
4.2 Objective verificationTo emphasize the improvement in the fore-
cast skill with ECPS, the results from threeadditional forecast experiments, started withinitial conditions corresponding to 12 January2000, 11 March 2000 and 12 March 2000, areanalyzed. For all the three experiments, theECPS scheme was found to yield improved day-1 to day-3 forecasts over the tropics. For exam-ple, the day-3 precipitation forecast over thetropics for 12Z 15 January 2000 is shown inFig. 11. The strength and distribution of pre-cipitation over the global tropics compare bet-ter with observation in the ECPS forecast. Theprecipitation forecasts around the equatorialoceanic convective centers, especially over the
Indian and western Pacific Oceans, are alsoimproved with the ECPS.
The RMSEs of day-1, day-2 and day-3 fore-casts of winds at 850 and 200 hPa and geo-potential height at 500 hPa from the threeadditional forecast experiments, are comparedwith the corresponding RMSEs from the con-trol forecasts (Fig. 12). The ECPS forecastsverify better than the control forecasts for allthe three variables. In particular, the ECPSprovides large improvements for the 500 hPaheight forecasts. This consistent improvementin the forecast skill for all the case studies fur-ther emphasizes the importance of incorporat-ing realistic vertical distribution of heating anddrying in the model cumulus scheme. The re-sults also suggest that in the absence of explicitmodels for convection, the proposed statisticalscheme improves the modeling of the vertical
Fig. 6. Precipitation for 8 February 1998 from (a) GPCP (observation), (b) the FSUGSM day-3 fore-cast with ECPS, and (c) the FSUGSM control day-3 forecast.
Journal of the Meteorological Society of Japan1000 Vol. 82, No. 4

distribution of heating and moistening in areasof deep convection.
4.3 ECPS with Q1 and Q2 profiles based onECMWF analysis
In order to study the relative forecast im-provement contributed by the utilization ofTRMM based Q1 dataset in ECPS, the skill inshort range forecasts with the present ECPS,is compared against those with ECPS utiliz-ing profiles of both Q1 and Q2 derived fromECMWF analysis. The day-3 precipitation fore-casts from observation, and the two forecastsshow that the present ECPS yields a better
Fig. 7. Longitude-pressure diagram ofzonal wind for 8 February 1998 aver-aged over the equatorial region (5�S–5�N) from (a) ECMWF analysis, (b) theFSUGSM day-3 forecast with ECPS,and (c) the FSUGSM control day-3 fore-cast.
Fig. 8. Latitude-pressure diagram ofmeridional wind for 8 February 1998averaged over 40�E–110�E from (a)ECMWF analysis, (b) the FSUGSMday-3 forecast with ECPS, and (c) theFSUGSM control day-3 forecast.
Forecast Skill Scores - Root Mean Square Error (RMSE)
0
1
2
3
4
RM
SE
(da
y 1)
G.Tr
CPACIO AO
AFRAUS
850 hPa Wind
0
2
4
6
8
RM
SE
(da
y 1)
G.Tr
CPACIO AO
AFRAUS
200 hPa Wind
0
11
22
33
44
RM
SE
(da
y 1)
G.Tr
CPACIO AO
AFRAUS
500 hPa Height
0
1.5
3
4.5
6
RM
SE
(da
y 2)
G.Tr
CPACIO AO
AFRAUS
850 hPa Wind
0
3
6
9
12
RM
SE
(da
y 2)
G.Tr
CPACIO AO
AFRAUS
200 hPa Wind
0
16
32
48
64
RM
SE
(da
y 2)
G.Tr
CPACIO AO
AFRAUS
500 hPa Height
0
1.5
3
4.5
6
RM
SE
(da
y 3)
G.Tr
CPACIO AO
AFRAUS
850 hPa Wind
0
4
8
12
16
RM
SE
(da
y 3)
G.Tr
CPACIO AO
AFRAUS
200 hPa Wind
0
20
40
60
80
RM
SE
(da
y 3)
G.Tr
CPACIO AO
AFRAUS
500 hPa Height
FSUGSM ECPS Forecasts FSUGSM Control Forecasts
Fig. 9. Root mean square error of 1–3day forecasts of winds at 850 hPa and200 hPa, and geopotential height at500 hPa over 6 tropical domains from(i) the FSUGSM with ECPS and (ii) theFSUGSM control version. The domainsare Global Tropics (G.Tr, 40�S–40�N;0�–360�E), Central Pacific (CPAC,15�S–5�N; 180�–140�W), Indian Ocean(IO, 30�S–5�N; 40�E–110�E) and At-lantic Ocean (AO, 15�S–15�N; 45�W–0�), Africa (AFR, 35�S–10�N; 0�–40�E)and Australia (AUS, 35�S–15�S;115�E–155�E).
K. RAJENDRAN, T.N. KRISHNAMURTI, V. MISRA and W.-K. TAO 1001August 2004

forecast over the global tropics (Fig. 6 andFig. 13). Although the distribution of ECMWFbased ECPS forecast resembles the presentECPS forecast over some parts, the spread ofrainfall around the ITCZ region is reducedglobally and compares better with the observa-tion in the present ECPS forecast. The patterncorrelation coefficient for global tropics is 0.3for the present ECPS day-3 forecast, and 0.27for the ECPS forecast based on ECMWF analy-sis. In addition, although large and significantimprovement was not evident, the presentECPS is found to yield improved circulationforecasts over most of the tropics compared toECMWF analysis based ECPS.
5. Summary and discussion
A new empirical cumulus parameterizationscheme, ECPS, which utilizes observed TRMMbased apparent heat source ðQ1Þ and moisturesink ðQ2Þ derived using ECMWF analysis, has
Forecast Skill - Percentage Improvement in Root Mean Square Error with ECPS
-12
0
12
24
36
48P
erce
ntag
e of
Impr
ovem
ent
G.Tr
CPACIO AO
AFRAUS
200 hPa Wind
0
20
40
60
80
100
Per
cent
age
Impr
ovem
ent
G.Tr
CPACIO AO
AFRAUS
500 hPa Height
Day 1 Day 2 Day 3
Fig. 10. Percentage improvement in rootmean square error of 1–3 day forecastsof winds at 200 hPa, and geopotentialheight at 500 hPa over 6 tropical do-mains from the FSUGSM with ECPS.
Fig. 11. Precipitation for 15 January 2000 from (a) GPCP (observation), (b) the FSUGSM day-3forecast with ECPS, and (c) the FSUGSM control day-3 forecast.
Journal of the Meteorological Society of Japan1002 Vol. 82, No. 4

been developed. The profiles of Q1 and Q2 forthe period of 1–28 February 1998 are used asobservations. The dominant modes of variabil-ity associated with the vertical profiles of Q1
and Q2 over active convective regions of thetropics, are obtained through rotated principalcomponent analysis (RPCA) based on normalvarimax rotation. Analysis suggests that mostof the variance associated with the observedprofiles can be explained by retaining the firstthree modes. The ECPS then applies a statisti-cal approach, in which Q1 and Q2 are expressedas a linear combination of the first three dom-inant principal components, which distinctlyexplain variance in the troposphere as a func-tion of the prevalent large-scale dynamics. Theprincipal component (PC) score which quanti-fies the contribution of each PC to the corre-sponding loading profile is estimated throughmultiple screening regression method. Thisyields the PC score as a function of the large-scale variables. Thus, the dependent variablesin the regression equations developed in thescheme modulates the heating about a meanconvective and drying profile as a function oflarge scale variables. The profiles of Q1 and Q2
thus obtained are found to match well with ob-servations.
The impact of the ECPS is investigatedthrough a series of short range (1–3 day)forecast experiments using the Florida StateUniversity global spectral model (FSUGSM,T126L14). This analysis also serves as a sen-sitivity study of the tropical circulation to thevertical distribution of large scale convectiveheating and drying. Forecast comparison withthe FSUGSM with a modified Kuo scheme,shows marked improvement in the short rangeforecasts using the ECPS. It is seen that thelarge-scale distribution, and amount of precipi-tation, is improved globally along the ITCZ andregionally over most of the convective centersover the tropics. The skill is also evident in thestructure and magnitude of winds for the ECPSforecast. The ECPS not only gives rise to a bet-ter forecast of Hadley cell, but leads to a morerealistic Ferrel and Polar cells. This improve-ment in the forecast skill emphasizes the im-portance of incorporating realistic vertical dis-tribution of heating and drying in the modelcumulus scheme. These results also suggestthat in the absence of explicit models for con-
3
3.5
4
4.5
5
Roo
t Mea
n S
quar
e E
rror
DAY 1 DAY 2 DAY 3Forecast Days
850 hPa Wind (m/s)
ECPS-J12ECPS-M11ECPS-M12
CTL-J12CTL-M11CTL-M12
4
5
6
7
8
9
10
Roo
t Mea
n S
quar
e E
rror
DAY 1 DAY 2 DAY 3Forecast Days
200 hPa Wind (m/s)
ECPS-J12ECPS-M11ECPS-M12
CTL-J12CTL-M11CTL-M12
10
20
30
40
50
60
70
Roo
t Mea
n S
quar
e E
rror
DAY 1 DAY 2 DAY 3Forecast Days
500 hPa Geopotential Height (m)
ECPS-J12ECPS-M11ECPS-M12
CTL-J12CTL-M11CTL-M12
Fig. 12. Root mean square error of 1–3day forecasts of winds at 850 hPa,200 hPa, and geopotential height at500 hPa over global tropics (40�S–40�N; 0�–360�E) from (i) the FSUGSMwith ECPS and (ii) the FSUGSM con-trol version started with initial condi-tions corresponding to 12 January 2000(J12), 11 March 2000 (M11) and 12March 2000 (M12).
Fig. 13. Precipitation for 8 February1998 from the FSUGSM day-3 forecastwith ECPS using heating and moisten-ing profiles based on ECMWF analysis.
K. RAJENDRAN, T.N. KRISHNAMURTI, V. MISRA and W.-K. TAO 1003August 2004

vection, the proposed statistical scheme im-proves the modeling of the vertical distributionof heating and drying in areas of deep convec-tion.
Acknowledgments
The authors thank Dr. Steve Lang for aidingretrieval of TRMM heating profile data set. Thevaluable and perceptive comments of the twoanonymous reviewers are also gratefully ac-knowledged. This research effort was supportedby the NOAA Grant Number 1338-745-45. Thecomputations carried out in the study werejointly performed using the computing facilitiesat FSU, CSIT (FSU), and NCAR, Boulder, Col-orado.
Appendix
The Florida State University (FSU) GlobalSpectral Model
The global model used in this study is identi-cal in all respects to that used in Krishnamurtiet al. (1991). The T126 version of the model,however, has been highly vectorized to reducethe model integration time. In addition, mois-ture variable dew point depression (T-Td) hasbeen replaced by specific humidity, and a look-up table is used for moisture calculation to fur-ther reduce the computational time. An outlineof the model is as follows:
1. Variables:a) Independent variables: l; y; s; t.b) Dependent variables: vorticity, diver-
gence, temperature and specific humid-ity.
2. Resolution:a) Horizontal resolution: Triangular spec-
tral truncation; T126 resolution has a384 � 192 Gaussian transform grid witha horizontal separation of about 100 kmat 20 latitude.
b) Vertical resolution: 14 layers in thevertical between 50 mb and 1000 mb.Model variables are staggered in thevertical using Charney-Phillips verti-cal discretization—vorticity, divergence,wind and geopotential are located atlayer interface while temperatures, spe-cific humidity and vertical velocity areassigned at the center of the layer. Thevertical grid has higher resolution in
stratosphere and in planetary boundarylayer.
3. Time integration scheme: The divergenceequation, thermodynamic equation and pres-sure tendency equation are integrated im-plicitly while for vorticity equation and mois-ture continuity equation an explicit timeintegration scheme is used. The tendenciesof the physical processes are integrated us-ing a forward time integration scheme.
4. Space differing scheme: Spectral in the hori-zontal; centered differences in the verticalfor all variables except moisture, which ishandled by an upstream differencing scheme.
5. Surface topography is based on envelope or-ography (Wallace et al. 1983).
6. Parameterization of physical processes:a) Deep convection: based on modified
Kuo cumulus parameterization scheme(Krishnamurti et al. 1983), where themoistening and mesoscale convergenceparameters are obtained from 700 mbvorticity and mean vertical velocity aver-aged over cloud depth through a regres-sion relation.
b) Shallow convection (Tiedke 1984).c) Dry convection.d) Large-scale condensation (Kanamitsu
1975). The scheme accounts for evapora-tion of falling precipitation.
e) Surface fluxes of heat, moisture and mo-mentum are calculated using similaritytheory (Businger et al. 1971).
f ) Vertical distribution of fluxes in the freeatmosphere is based on stability (Ri-chardson number) dependent exchangecoefficient (Louis 1979).
g) 4th order horizontal diffusion (Kana-mitsu et al. 1983).
h) Long and shortwave radiative fluxes arebased on band model and incorporate theradiative effects of water vapor, carbondioxide, ozone and clouds (Harshvardanand Corsetti 1989; Lacis and Hansen1974).
i) Parameterization of low, medium andhigh clouds for radiative transfer calcula-tion is based on threshold relative hu-midity. Fraction area of various clouddistribution configurations in the verti-cal is based on random overlap consider-ation.
Journal of the Meteorological Society of Japan1004 Vol. 82, No. 4

j) Surface temperatures: Prescribed overthe oceans, while over the land a surfaceenergy balance coupled to the similaritytheory determines the surface tempera-ture, including its diurnal cycle (Krish-namurti et al. 1991).
7. Initialization: The initialization of the modelis achieved in two stages:a) Nonlinear normal mode initialization:
(Kitade 1983), wherein the tendencies ofthe first 5 modes with phase speed ex-ceeding about 30 m s�1 are damped dur-ing the initialization. The slow movinghigher modes are allowed to adjust freely.
b) Physical initialization wherein moisturefield, heat sources and sinks, and di-vergence fields are initialized consistentwith observed OLR and rain rates.
References
Alexander, G.D., G.S. Young, and D.V. Ledvina,1993: Principal component analysis of verticalprofiles of Q1 and Q2 in the tropics. Mon. Wea.Rev., 121, 535–548.
Anthes, R.A., 1982: Tropical cyclones—Their evolu-tion, structure and effects. Meteor. Monogr., 41,1–208.
Businger, J.A., J.C. Wyngard, Y. Izumi, and E.F.Bradley, 1971: Flux profile relationship in theatmospheric surface layer. J. Atmos. Sci., 28,181–189.
Chang, C.-P. and H. Lim, 1988: Kelvin wave-CISK: Apossible mechanism for the 30–50 day oscil-lations. J. Atmos. Sci., 45, 1709–1720.
Charney, J.G. and A. Eliassen, 1964: On the growthof the hurricane depression. J. Atmos. Sci., 21,68–75.
Harshvardan and T.G. Corsetti, 1984: Long-wave parameterization for the UCLA/GLASGCM. NASA Tech. Memo. 86072, GoddardSpace Flight Center, Greenbelt, MD 20771, 52pp.
Hartmann, D.L., H.H. Hendon, and R.A. Houze, Jr.,1984: Some implications of the mesoscale cir-culations in tropical cloud clusters for largescale dynamics and climate. J. Atmos. Sci., 41,113–121.
Huffman, G.J., R.F. Adler, P.A. Arkin, A. Chang, R.Ferraro, A. Gruber, J. Janowiak, A. McNab, B.Rudolf, and U. Schneider, 1997: The GlobalPrecipitation Climatology Project (GPCP) com-bined precipitation dataset. Bull. Amer. Me-teor. Soc., 78, 5–20.
Johnson, R.H., 1984: Partitioning tropical heat andmoisture budgets into cumulus and mesoscale
components: Implications for cumulus parame-terization. Mon. Wea. Rev., 112, 1590–1601.
Kanamitsu, M., 1975: On numerical prediction overa global tropical belt. Report No. 75-1, Dept. ofMeteorology, Florida State University, Talla-hassee, Florida 32306, pp. 1–282.
———, K. Tada, K. Kudo, N. Sato, and S. Isa, 1983:Description of the JMA operational spectralmodel. J. Meteor. Soc. Japan, 61, 812–828.
Kitade, T., 1983: Nonlinear normal mode initializa-tion with physics. Mon. Wea. Rev., 111, 2194–2213.
Krishnamurti, T.N., Y. Ramanathan, H.L. Pan, R.J.Pasch, and J. Molinari, 1980: Cumulus param-eterization and rainfall rates I. Mon. Wea.Rev., 108, 465–472.
———, S. Low-Nam, and R. Pasch, 1983: Cumulusparameterization and rainfall rates II. Mon.Wea. Rev., 111, 815–828.
——— and H.S. Bedi, 1988: Cumulus parameter-ization and rainfall rates: Part III. Mon. Wea.Rev., 116, 583–599.
———, J. Xue, H.S. Bedi, K. Ingles, and D. Oos-terhof, 1991: Physical initialization for numer-ical weather prediction over the tropics. Tellus,43, 53–81.
———, H.S. Bedi, and K. Ingles, 1993: Physical ini-tialization using SSM/I rain rates. Tellus, 45A,247–269.
———, S.K.R. Bhowmik, D. Oosterhof, G. Rohaly,and N. Surgi, 1995: Mesoscale signatureswithin the tropics generated by physical initi-alization. Mon. Wea. Rev., 123, 2771–2789.
Lacis, A.A. and J.E. Hansen, 1974: A parameter-ization of the absorption of solar radiationin the earth’s atmosphere. J. Atmos. Sci., 31,118–133.
Lau, K.-M. and L. Peng, 1987: Origin of the low-frequency (intraseasonal) oscillation in thetropical atmosphere. J. Atmos. Sci., 44, 950–972.
Lin, C. and A. Arakawa, 2000: Empirical determina-tion of the basic modes of cumulus heating anddrying profiles. J. Atmos. Sci., 57, 3571–3591.
Louis, J.F., 1979: A parametric model of verticaleddy fluxes in the atmosphere. Boundary LayerMeteorology, 17, 187–202.
Malkus, J.S. and R.T. Williams, 1963: On the inter-action between severe storms and large cumu-lus clouds. Meteor. Monogr., 5, 59–64.
Mapes, B.E. and R.A. Houze, Jr., 1995: Diabaticdivergence profiles in western Pacific warmpool during TOGA COARE. J. Atmos. Sci., 52,1807–1828.
Misra, V., 1997: A statistically based cumulusparameterization scheme that makes use ofheating and moistening rates derived from ob-
K. RAJENDRAN, T.N. KRISHNAMURTI, V. MISRA and W.-K. TAO 1005August 2004

servations. Ph.D. Dissertation, Florida StateUniversity, Tallahassee, 184 pp.
Ogura, Y., 1975: On the interaction between cumulusclouds and the larger scale environment. Pure.Appl. Geophys., 13, 869–889.
Olson, W.S., C.D. Kummerow, Y. Hong, and W.-K.Tao, 1999: Atmospheric latent heating dis-tributions in the Tropics derived from passivemicrowave radiometer measurements. J. Appl.Meteor., 38, 633–644.
Preisendorfer, R.W., 1988: Principal componentanalysis in meteorology and oceanography,Elsevier, New York.
Rajendran, K., Ravi S. Nanjundiah, and J. Sriniva-san, 2002: Comparison of seasonal and intra-seasonal variation of tropical climate in NCARCCM2 GCM with two different cumulusschemes. Meteor. Atmos. Phys., 79, 57–86.
Reed, R.J. and E.E. Recker, 1971: Structure andproperties of synoptic-scale wave disturbancesin the equatorial western Pacific. J. Atmos.Sci., 28, 1117–1133.
Richman, M.B., 1986: Review Article Rotation ofprincipal components. Int’l. J. of Climatology,6, 293–335.
Simpson, J. and W.-K. Tao, 1993: The Goddard Cu-mulus Ensemble Model. Part II: Applicationsfor studying cloud precipitating processes andfor NASA TRMM. Terrestrial, Atmospheric andOceanic Sciences, 4, 55–96.
Sui, C.-H. and K.-M. Lau, 1989: Origin of the low-frequency (intraseasonal) oscillations in thetropical atmosphere. Part II: Structure andpropagation of mobile wave-CISK modes andtheir modification by lower boundary forcings.J. Atmos. Sci., 46, 37–56.
Tao, W.-K., J. Simpson, C.-H. Sui, B. Ferrier, S.Lang, J. Scala, M.-D. Chou, and K. Pickering,1993a: Heating, moisture and water budgets oftropical and midlatitude squall lines: Compar-isons and sensitivity to longwave radiation. J.Atmos. Sci., 50, 673–690.
———, S. Lang, J. Simpson, and R. Adler, 1993b:
Retrieval algorithms for estimating the verti-cal profiles of latent heat release: Their appli-cations for TRMM. J. Meteor. Soc. Japan, 71,685–700.
Tao, W.-K., S. Lang, W.S. Olson, R. Meneghini, S.Yang, J. Simpson, C. Kummerow, E. Smith,and J. Halverson, 2001: Retrieved vertical pro-files of latent heat release using TRMM rain-fall products for February 1998. J. Appl. Me-teor., 40, 957–982.
Tiedke, M., 1984: The sensitivity of the time-meanlarge-scale flow to cumulus convection in theECMWF model. Workshop on Convection inlarge-scale numerical models. ECMWF, 28Nov.–1 Dec. 1983, 297–316.
Tung, W.-W., C. Lin, B. Chen, M. Yanai, and A. Ara-kawa, 1999: Basic modes of cumulus heatingand drying observed during TOGA-COAREIOP. Geophys. Res. Lett., 26, 3117–3120.
Wallace, J.M., S. Tibaldi, and A.J. Simmons, 1983:Reduction of systematic forecast errors in theECMWF model through the introduction ofenvelope orography. Quart. J. Roy. Meteor.Soc., 109, 683–718.
Weisman, M.L. and J.B. Klemp, 1982: The depen-dence of numerically simulated convectivestorms on vertical wind shear and buoyancy.Mon. Wea. Rev., 110, 504–520.
Yanai, M., S. Esbensen, and J.H. Chu, 1973: Deter-mination of bulk properties of tropical cloudclusters from large scale heat and moisturebudgets. J. Atmos. Sci., 30, 611–627.
Zawadzki, I.I. and C.U. Ro, 1978: Correlationsbetween maximum rate of precipitation andmesoscale parameters. J. Appl. Meteor., 17,1327–1334.
———, E. Torlaschi, and R. Sauvageau, 1981: Therelationship between mesoscale thermody-namic variables and convective precipitation.J. Atmos. Sci., 38, 1535–1540.
Zhang, Z. and T.N. Krishnamurti, 1996: A general-ization of Gill’s Heat Induced Tropical Circula-tion. J. Atmos. Sci., 53, 1045–1056.
Journal of the Meteorological Society of Japan1006 Vol. 82, No. 4


![MERCEDES-BENZ PART #'S: A001 989 94 51 & A001 989 94 51 12 … · 2009-06-04 · mercedes-benz part #'s: a001 989 94 51 & a001 989 94 51 12 brake pad paste 'xvwh[sorvlrqkd]dug 1rqh.qrzq](https://static.fdocuments.in/doc/165x107/5f342958813ab3273d362e10/mercedes-benz-part-s-a001-989-94-51-a001-989-94-51-12-2009-06-04-mercedes-benz.jpg)