An Empirical Cumulus Paameterization Scheme · PDF fileAn Empirical Cumulus Paameterization...
25
a An Empirical Cumulus Paameterization Scheme for a Global Spectral Model K. Rajendran *? T. N. Krishnamurti Department of Meteorology Horida State University Tallahassee, Florida v.Misra . Center for Ocean-Land-Atmosphere ,Studies Institute of Global Environment and Society, h c . Calverton, Maryland and W.-I(. Tao Laboratory for Atmospheres NASA Goddard Space Flight Center Greenbelt, Maryland (Journal of the Meteorological Society of Japan, in press) May 1 1,2004 'Current affiliation: Meteorological Research Institute, Tsukuba, Ibaraki, Japan tCorresponding author: K Rajendran, Meteorological Research Instimte, 1-1 Nagaxnine, Tsukuba, Ibaraki- 305 0052, Japan. email: [email protected] https://ntrs.nasa.gov/search.jsp?R=20040171215 2018-05-05T18:01:16+00:00Z
Transcript of An Empirical Cumulus Paameterization Scheme · PDF fileAn Empirical Cumulus Paameterization...

a
An Empirical Cumulus Paameterization Scheme for a Global Spectral Model
K. Rajendran *? T. N. Krishnamurti
Department of Meteorology Horida State University Tallahassee, Florida
v.Misra .
Center for Ocean-Land-Atmosphere ,Studies Institute of Global Environment and Society, h c .
Calverton, Maryland
and
W.-I(. Tao Laboratory for Atmospheres
NASA Goddard Space Flight Center Greenbelt, Maryland
(Journal of the Meteorological Society of Japan, in press)
May 1 1,2004
'Current affiliation: Meteorological Research Institute, Tsukuba, Ibaraki, Japan tCorresponding author: K Rajendran, Meteorological Research Instimte, 1-1 Nagaxnine, Tsukuba, Ibaraki-
305 0052, Japan. email: [email protected]
https://ntrs.nasa.gov/search.jsp?R=20040171215 2018-05-05T18:01:16+00:00Z

T f
Abstract
Realistic vertical heating and drying profiles in a cumulus scheme is important for obtaining accu-
rate weather forecasts. A new empirical cumulus parameterization scheme based on a procedure to
improve the vertical distribution of heating and moistening over the tropics is developed. The em-
pirical cumulus parameterization scheme (ECPS) utilizes profiles of Tropical Rainfall Measuring
Mission 0 based heating and moistening derived from d e European Centre for Medium-
Range Weather Forecasts 0 analysis. A dimension reduction technique through rotated
principal component analysis (RPCA) is performed on the vertical profiles of heating (Q1) and
drying (Q2) over the convective regiods of d e tropics, to obtain the dominant modes of variability.
Analysis suggests that most of the variance associated wid the observed profiles can be explained
by retaining the first three modes. The ECPS then applies a statistical approach in which Ql and
Q2 are expressed as a linear combination of the first three dominant principal components which
distinctly explain variance in the troposphere as a function of d e prevalent large-scale dynamics.
The principal component (F'C) score which quantifies the contribution of each PC to the corre-
sponding loading profile is estimated through a multiple screening regression method which yields
the PC score as a function of the large-scale variables.
The profiles of Q1 and Q 2 thus obtained are found to match well with tlie observed profiles.
The impact of the ECPS is investigated in a series of short range (1-3 day) prediction experiments
using d e Florida State University global spectral model (FSUGSM, T126L14). Comparisons be-
tween short range ECPS forecasts and those with the modified Kuo scheme show a very marked
improvement in the skill in ECPS forecasts. This improvement in the forecast skill with ECPS em-
phasizes the importance of incorporating realistic vertical distributions of heating and drying in the
model cumulus scheme. This also suggests that in the absence of explicit models for convection,
the proposed statistical scheme improves the modeling of the vertical distribution of heating and
moistening in areas of deep convection.
2
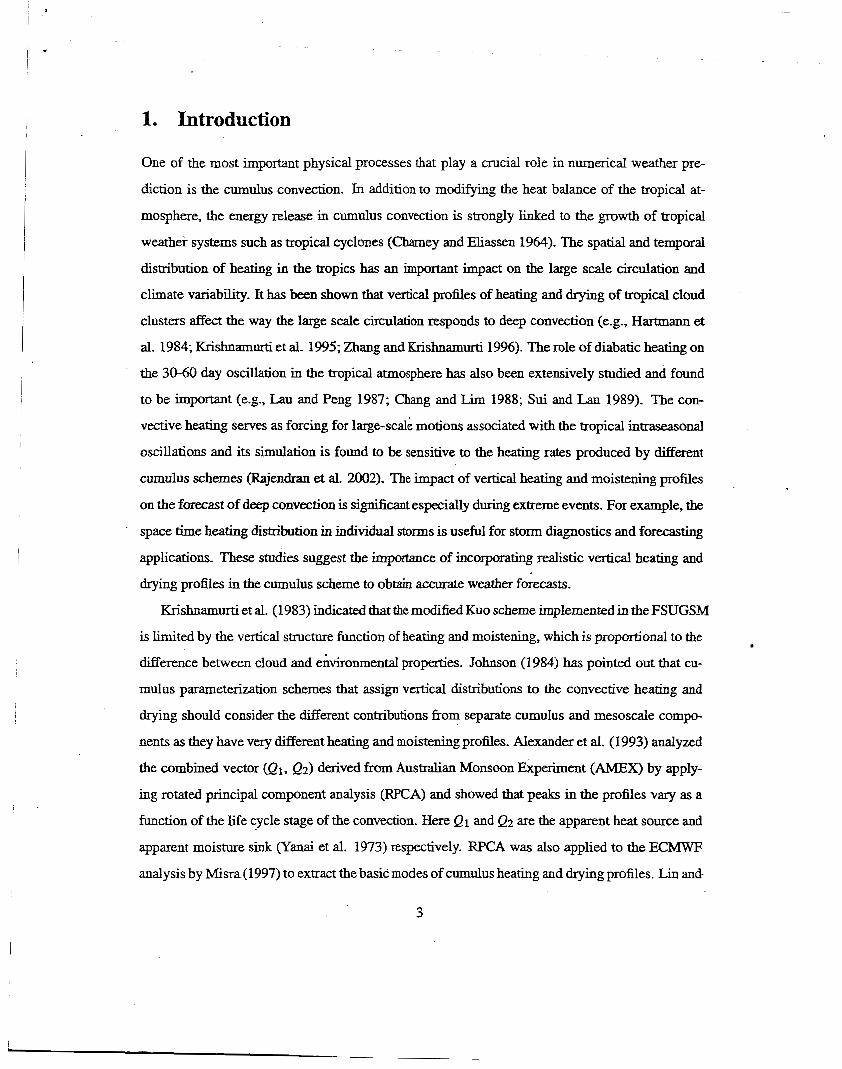
1. Introduction
I
One of the most important physical processes that play a crucial role in numerical weather pre-
diction is the cumulus convection. In addition to modifying the heat balance of the tropical at-
mosphere, the energy release in cumulus convection is strongly linked to the growth of tropical
weather systems such as tropical cyclooes (Charney and Eliassen 1964). The spatial and temporal
distribution of heating in the tropics has an important impact on the large scale circulation and
climate variability- It has been shown that vertical profiles of heating and drying of tropical cloud
clusters affect the way the large scale circulation responds to deep convection (e.g., Hartmann et
al. 1984; Krishnamurti et al. 1995; B a n g and Krishnamurti 1996). The role of diabatic heating on
the 30-60 day oscillation in the tropical atmosphere has also been extensively studied and found
to be important (e.g., Lau and Peng 1987; Chang and Lim 1988; Sui and Lau 1989). The con-
vective heating serves as forcing for large-scale motions associated with the tropical intraseasonal
oscillations and its simulation is found to be sensitive to the heating rates produced by difFerent
cumulus schemes (Rajendran et al. 2002). The impact of vertical heating and moistening profiles
on the forecast of deep convection is si@mt especially during extreme events. For example, the
space time heating distribution in individual storms is useful for storm diagnostics and forecasting
applications. These studies suggest the importance of incorporating realistic vertical heating and
drying profiles in the cumulus scheme to obtain accurate weather forecasts.
Krishnamurti et al. (1983) indicated that the modified Kuo scheme implemented in the FSUGSM
is limited by the vertical structure function of heating and moistening, which is proportional to the
difference between cloud and environmental properties. Johnson (1984) has pointed out that cu-
mulus parameterization schemes that assign vertical distributions to the convective heating and
drying should consider the different contributions fiom separate cumulus and mesoscale compo-
nents as they have very different heating and moistening profiles. Alexander et al. (1993) analyzed
the combined vector (Ql, Q2) derived from Australian Monsoon Experiment (AMEX) by apply-
ing rotated principal component analysis (RF’CA) and showed that peaks in the profiles vary as a
function of the life cycle stage of the convection. Here Ql and Q2 are the apparent heat source and
apparent moisture sink (Yanai et al. 1973) respectively. RPCA was also applied to the ECMWF
analysis by Misra (1997) to extract the basic modes of cumulus heating and drying profiles. Lin and-
3

, Arakawa (2000) identified the basic modes of cumulus heating and drying profiles through RPCA
to be used as a partial closure for Arakawa-Schubert cumulus paraizetmizzthE scheme. These
studies suggest that in the absence of explicit models for convection, statistical schemes might per-
form a reasonable job in producing profiles of heating and moistening which match closely with
observations.
Explicit models of cumulus convection demand very high horizontal and vertical resolution
and involve large computational resources. Instead the physical effects of cumulus conveon are
estimated from known large-scale model parameters which affect deep cumulus convection. In
one of the pioneering studies demonstrating the strong dependence of deep cumulus convection
on large-scale variables, using photographic mapping of clouds over the tropical Pacific, Malkus
and Wfiams (1963) found that the prevalence of deep cumulus conv&tion coincided with strong
low-level synoptic-scale convergence. The composite analysis of 18 tropical disturbances in the
equatorial West Pacific by Reed and Recker (1971) illustrated that the heaviest precipitation occurs
in the trough region where relative humidity and upward motion were bigh. The precipitation es-
timates obtained from large-scale moisture budget, which conformed well with the observed data,
suggested that moisture convergence was the single largest contributing factor in the moisture bud-
get. Ogura (1975) found a strong linear conelation between rainfall rate and large-scale vertical
velocity in tropical waves and hurricanes. Studies by Krishnamurti et al. (1980, 1983) have em-
phasized the importance of the control of large-scale wave dynamics on the rainfall associated with
tropical mesoscale systems. At higher latitudes, besides upward motion and convergence of water
vapor, large-scale thermodynamic structure and vertical wind shear also appear to be important
in triggering cumulus convection (Zawadzki and Ro 1978; Zawadzki et al. 1981; Weisman and
Klernp 1982). The results of these observational studies provide the large-scale variables which
are crucial for cumulus heating and drying distribution in areas of deep convection.
The main objective of the present study is to investigate the forecast improvement in FSUGSM
by realistic modeling of the vertical distribution of heating and moistening in areas of deep con-
vection over the global tropics. A statistically based empirical cumulus parameterization scheme
(ECPS) which makes use of the observed profiles of apparent heat source (Ql) and moisture sink
(Qz), is developed. This is achieved by applying RPCA on proses of Q1 and Q2 over active con-
4

vective regions of the tropics (40"s to 40"N) to obtain dominant modes of variability. The ECPS
then uses a stausticai approach iii which Qi and Q2 zre eqressed as a h e a r combination of the
first three dominant principal components which distinctly explain variance in the lower, middle
and upper troposphere as a function of the prevalent large-scale dynamics. The principal compo-
nent (PC) score which quantifies the contribution of each PC to the corresponding loading profile is
estimated through a multiple screening regression method which yields the PC score as a function
of the large-scale variables. To study the impact of modeling realistic vertical distribution of Ql
and Q2 associated with deep convection, the ECPS is implemented in the Florida State University
global spectral model (FSUGSM, T126L14) and a series of short range forecast experiments are
performed Further, the performance of the ECPS is analyzed by comparing the results of this
ensemble of short range forecast experiments started from different initial conditions with the cor-
responding integrations of the control version of the FSUGSM. The improvement in forecast skill
with ECPS is further analyzed against short range experiments in which both Q1 and Q2 profiles
are based on ECMWF analysis.
The datasets used are described in section 2. Section 3 describes the analysis procedure based
on RPCA, the formulation of the ECPS and the analysis results of the statistical approach used for
the formulation of the ECPS. The results of short range prediction experiments using FSUGSM
are presented in section 4. In section 5, we summarize the results.
2. Datasets: Q1 and Q 2 profiles
The ECPS utilizes daily observed vertical profiles of apparent heating (Ql) and moistening @2)
over the convective regions of tropics during the period 1-28 February 1998. The Q1 p r o a s are
derived using TRMM rainfall products (e.g., Tao et al. 2001) and the Q 2 profiles are derived from
ECMWF analysis following Yan& et al. (1973).
5
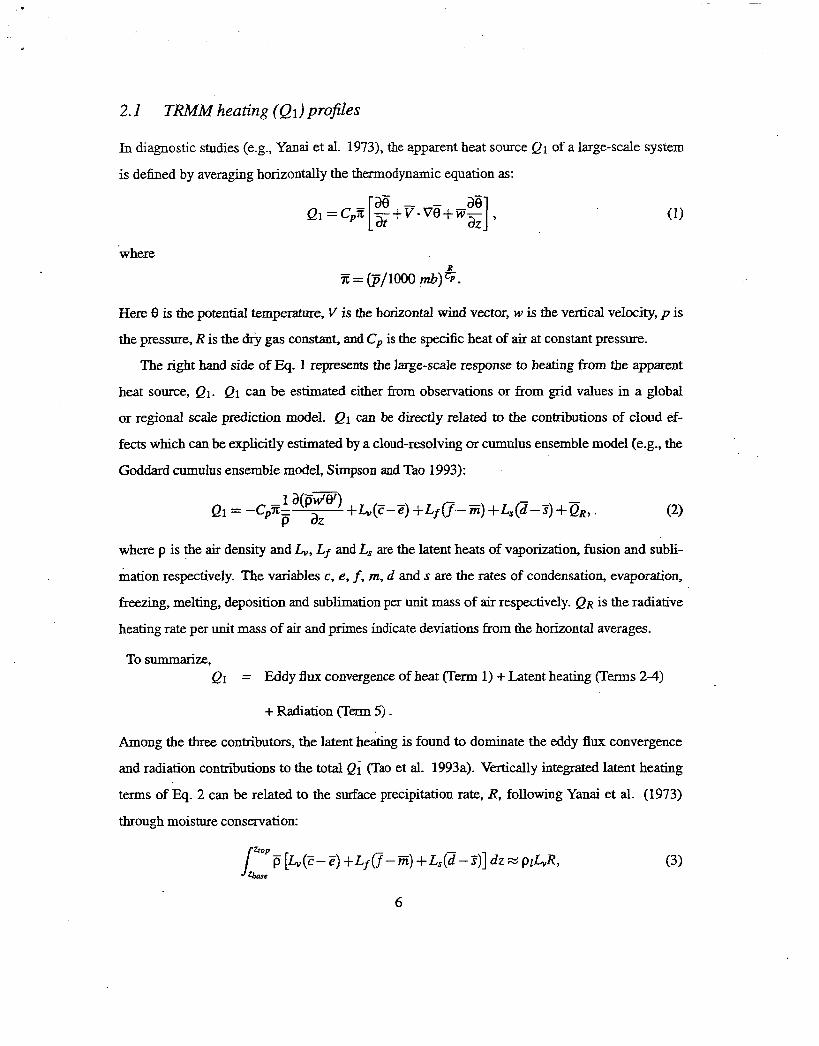
2.1 TRMM heating (Ql) profiles
In diagnostic studies (e-g., Yanai et al. 1973), the apparent heat source Q1 of a large-scale system
is defined by averaging horizontally the thermodynamic equation as:
where
Q~=C,Z -+v-ve+iv-- , E - - "I az
Here 8 is the potential temperature, V is the horizontal wind vector, w is the vertid velocity, p is
the pressure, R is the dry gas constant, and C, is the specific heat of air at constant pressure.
The right hand side of E q 1 represents the large-scale response to heating from the apparent
heat source, Ql. Ql can be estimated either fiom observations or from grid values in a global
or regional scale prediction model. Ql c a ~ ~ be directly related to the contributions of cloud ef-
fects which can be explicitly estimated by a cloud-resolving or cumulus ensemble model (e-g., the
Goddard cumulus ensemble model, Simpson and Tao 1993):
where p is the air density and L,,, Lf and L, are the latent heats of vaporization, fusion and subli-
mation respectively. The variables c, e, f, rn, d and s are the rates of condensation, evaporation,
freezing, melting, deposition and sublimation per unit mass of air respectively. QR is the radiative
heating rate per unit mass of air and primes indicate deviations from the horizontal averages-
To summarize, Q1 = Eddy flux convergence of heat (Term 1) + Latent heating (Terms 2-4)
+ Radiation (Term 5).
Among the three contributors, the latent he&ng is found to dominate the eddy flux convergence
and radiation contributions to the total Q; ("a0 et al. 1993a). Vertically integrated latent heating
terms of Eq 2 can be related to the surface precipitation rate, R, following Yanai et al. (1973)
through moisture conservation:
6

i-e-, /‘OPpQldz M plL,,R, (4) Jzgprc
where pl is the density of liquid water (1 g ~ m - ~ ) . Thus, it follows that passive microwave esti-
mates of surface rainfall rate can yield reasonable estimates of vertically integrated latent heating
and these estimates are close to the vertically integrated Q 1.
a. Convective-Stratiform Heating (CSH) algonrhrn
The latent heating profiles are then derived using the Convective-Stratiform Heating (CSH) algo-
rithm of Tao et al. (1993b). The flow chaa in Fig. 1 shows the detailed procedure for the retrieval
of the latent heating profiles. The algorithm uses surface precipitation rates, percentage amount
of its stratifom component, the type and location of observed cloud systems and a look-up table
containing latent heating profiles associated with various types of cloud systems (e.g., squall vs.
non squall or monsoon) at Merent geographic locations, as inputs. The lookuptable has many
sets of stored convective and stratiform latent heating profiles mostly simulated by the Goddard
cloud ensemble model. Each set of profiles is normalized by the convective and stratiform rainfall
amounts assuming a relation such as (4) applied to both convective and stratifom rainfall regimes.
The rain rate, R, is used for Limiting the total amount of derived heating (e.g., Eq. 4)-
This algorithm takes into account the fact that when cloud latent heating is separated into
convective and stratiform regions, the profiles for each region take on a characteristic shape even
for systems from Herent geographic locations. Thus, the success of the method depends on the
proper discrimination of convective and stratifom rain regimes which have characteristic vertical
motion and heating profile shapes. The strong link between vertical velocity and diabatic heating
rate is discussed by Andes (1982) and Mapes and Houze (1995). Thus, an appropriate set of
heating profiles which have been normalized with respect to surface rainfall, R, is selected from this
look up table. Then these profiles are multiplied by satellite derived rainfall rates. The percentage
of that rate which is stratifom is used in order to properly weigh the convective and stratiform
profiles used in the retrieval.
For the retrieval of latent heating data used in this study, daily OSo-added rainfall and percent-
age of rainfall classified as stratifodconvective from TRMM Microwave Imager (TMI) produced
using Goddard profiling (GPROF) algorithm (Olson et al. 1999) for February 1998 were used as
7
,

, -
I -
inputs for the CSH algorithm. These CSH derived latent heating profiles are validated with those
eshmated at weii designed field c z i i p a i p such as T R ? field programs. The latent heating is
found to dominate the eddy flux convergence and radiation contributions to the total heating.
The observed TRMh4 based February 1998 mean latent heating (Ql, interpolated to model O-
level) at three vertical levels (00.3, 00.5 and 00.8) over the global tropics is shown in Fig. 2. The
horizontal pattern is very similar to the d a c e rainfall distribution during this month (not shown)
especially at middle and upper levels. Stronger latent heating release (2 10 R day-') in the middle
and upper troposphere is associated with heavier surface rainfall. The noticeable features are the
well defined tropical convergence zone (TCZ) over &e East and central Pacific, Atlantic Ocean, a
broad belt spanning from the South Indian Ocean through the Indonesian maritime continent, and a
distinct south Pacific convergence zone (SPCZ). In addition, broad areas of strong heating are seen
over the continental regions of the Southern Hemisphere. The heating over the PacZc Ocean is
stronger than the heating over other centers, especially in the upper troposphere. This may be due
to the higher tropopause and warmer sea surface temperatures over the Pacific. Over the Pacific and
Indian Oceans, strong differential heating between land and ocean can strengthen the gradients in
thermodynamic fields and afXect the large-scale circulation. Also, at lower troposphere, heat sinks
(areas of weak cooling) are seen over the Northern Hemispheric continents and small parts of
Indian, P d c and Atlantic Oceans (mainly at lower troposphere).
2.2 Moistening (Q2) profiles based on E C W F analysis
Following Yanai et al. (1973), the apparent moisture sink Q 2 of a large-scale system is defined by
horizontally averaging the water vapor equation as:
(5)
where L = lj, is the specific latent heat of vapokcation.
. The datasets used for computing moistening ( Q 2 ) profiles were obtained from ECMWF analy-
sis on a 1" x lo horizontal grid for one month period extending from 1 through 28 February 1998.
The datasets contained zonal and meridional winds, geopotential height, temperature and relative
humidity at standard pressure levels. These fields were linearly interpolated to a T126 Gam-
sian grid in the horizontal and the 14 sigma levels in the vertical corresponding to the FSUGSM
-
8
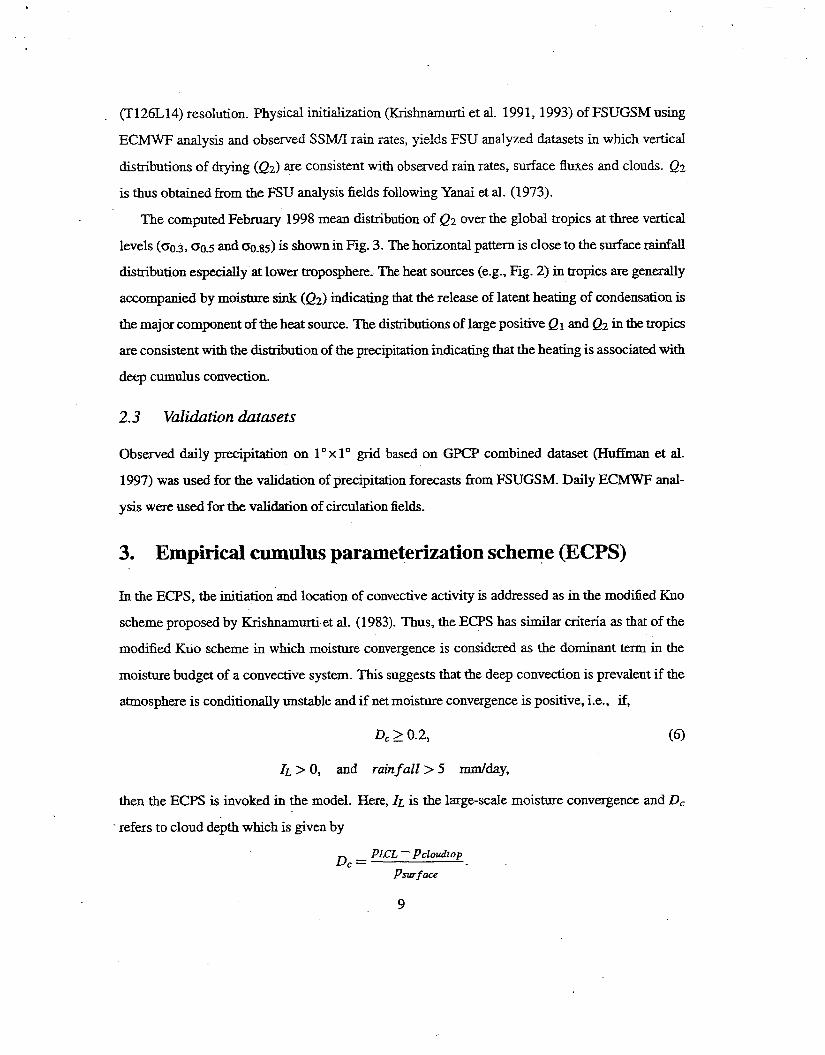
. (T126L14) resolution. Physical initialization (Knshnamurti et al. 1991,1993) of FSUGSM using
ECMWF analysis and observed SSh.I/I rain rates, yields FSU malyzed datasets in which vertical
distributions of drying (Q2) are consistent with observed rain rates, surface fiuxes and clouds. Q2
is thus obtained from the FSU analysis fields following Yanai et al. (1973).
The computed February 1998 mean distribution of Q2 over the global tropics at three vertical
levels ((T0.3,<~0.5 and 00.85) is shown in Fig. 3. The horizontal pattern is close to the surface rainfall
distribution especially at lower troposphere. The heat sources (e.g., Fig. 2) in tropics are generally
accompanied by moisture sink (Q2) indicating that the release of latent heating of condensation is
the major component of the heat source. The distributions of large positive Q 1 and Q2 in the tropics
are consistent with the distribution of the precipitation indicating that the heating is associated with
deep cumulus convection.
2.3 Validation htasets
Observed daily precipitation on l'xl" grid based on G€" combined dataset (HufEnan et al.
1997) was used for the validation of precipitation forecasts from F'SUGSM. Daily ECMWF anal-
ysis were used for the validation of circulation fields.
3. Empirical cumulus parameterization scheme (ECPS)
In the ECP S , the initiation and location of convective activity is addressed as in the modified Kuo
scheme proposed by Krishnamurti et al. (1983). Thus, the ECPS has similar criteria as that of the
modified Kuo scheme in which moisture convergence is considered as the dominant term in the
moisture budget of a convective system. This suggests that the deep convection is prevalent if the
atmosphere is conditionally unstable and if net moisture convergence is positive, i.e., if,
D, 2 0.2, (6)
I L > O , and rainfalZ>5 d d a y ,
then the ECPS is invoked in the model. Here, IL is the large-scale moisture convergence and D,
refers to cloud depth which is given by
PLCL - Pcloudtop
Psurface D, =
9

where 8, is the equivalent potential temperature.
The moistening (M) and rain (R) rates are obtained as in modified Kuo scheme (e.g., Krishna-
murti and Bedi 1988):
R IL _ - - a2b.7 +b2s+c2,
where b.7 is the relative vorticity at B = 0.7 and T3 is the vertically averaged p velocity.
The thermodynamic equation in the x, y , B framework for the ECPS takes the form:
and the moisture equation takes the form
where RT aT
r=c,,-= Here D is the divergence, 01 and Q2 are the integated cumulus heating and drying profiles respec-
tively, and cLI( and f& are the heating and drying components at kfh 0-level.
These thermodynamic and moisture equations have two new parameters ak and p k compared
to the corresponding equations in modified Kuo scheme of Krishnamurti et al. (1983). These
parameters are obtained through a statistical analysis procedure which is described in the next
section.
3.1 Formulation of the statistical approach
To identify the dominant modes of variability associated with Ql and Q2 profiles, the dimension
reduction technique of rotated principal component analysis (RPCA) is applied to the vertical
profiles of Ql and Q2 over the active convective regions of the global tropics (4O0S-4O"N).
10
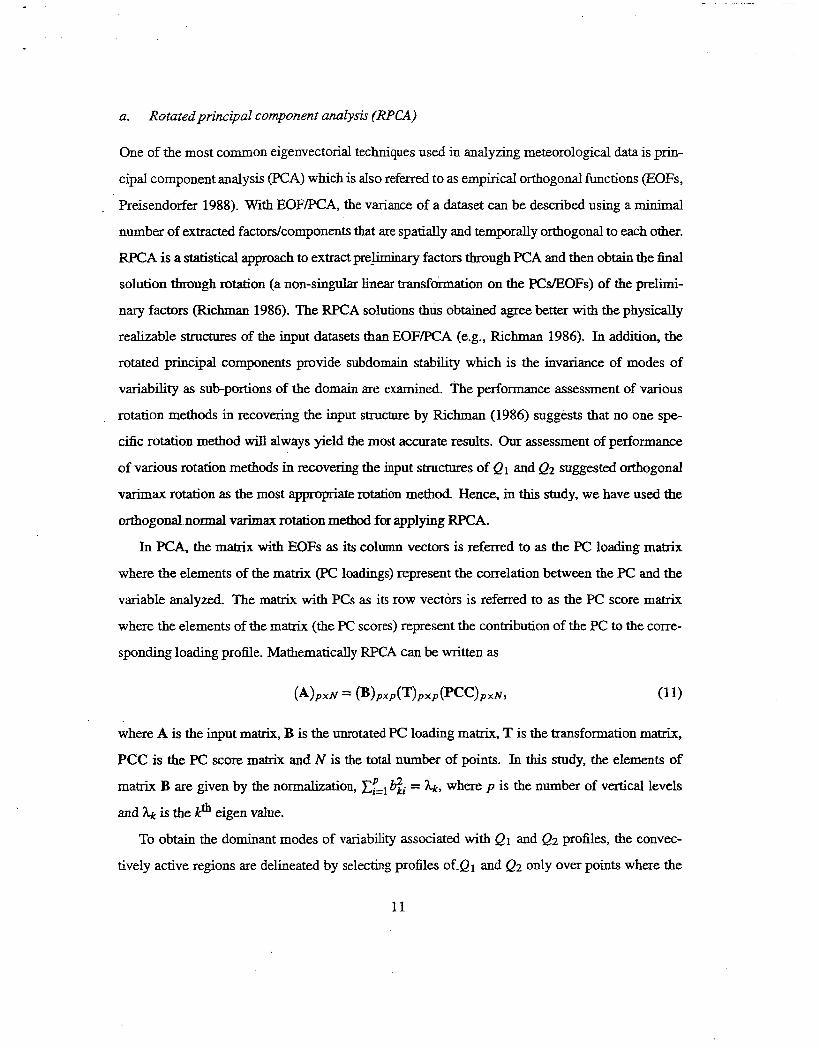
a. Rotated principal component analysis (RPCA)
One of the most common eigenvectorial techniques used in analyzing meteorological data is pM-
cipal component analysis (PCA) which is also referred to as empirical orthogonal functions (EOFs,
Preisendorfer 1988). With EOFPCA, the variance of a dataset can be described using a minimal
number of extracted factors/components that are spatially and temporally orthogonal to each other.
RPCA is a statistical approach to extract p r e - k a r y factors through PCA and then obtain the final
solution through rotation (a non-sin,dar linear transformation on the PCsEOFs) of the prelimi-
nary factors (Richman 1986). The RPCA solutions thus obtained agree better with the physically
realizable structures of the input datasets than EOFKA (e.g., Richman 1986). In addition, the
rotated principal components provide subdomain stability which is the invariance of modes of
variability as sub-portions of the domain are examined. The performance assessment of various
rotation methods in recovering the input structure by Richman (1986) suggests that no one spe-
cific rotation method will always yield the most accurate results. Our assessment of performance
of various rotation methods in recovering the input structures of Ql and Q2 suggested orthogonal
varimax rotation as the most appropriate rotation method. Hence, in this study, we have used the
orthogonal normal varimax rotation metbod for applying RPCA.
In E A , the matrix with EOFs as its column vectors is referred to as the PC loading matrix
where the elements of the matrix (PC loadings) represent the correlation between the PC and the
variable analyzed. The matrix with PCs as its row vectors is referred to as the PC score matrix
where the elements of the matrix (the PC scores) represent the contribution of the PC to the corre-
sponding loading profile. Mathematically RPCA can be written as
where A is the input matrix, B is the unrotated PC loading matrix, T is the transformation matrix,
PCC is the PC score matrix and N is the totaI number of points. In this study, the elements of
matrix B are given by the normalization, G. = hk, where p is the number of vertical levels
and h k is the k* eigen value.
To obtain the dominant modes of variability associated with Q1 and Q2 profiles, the convec-
tively active regions are delineated by selecting profiles of-Ql and Q 2 only over points where the
11
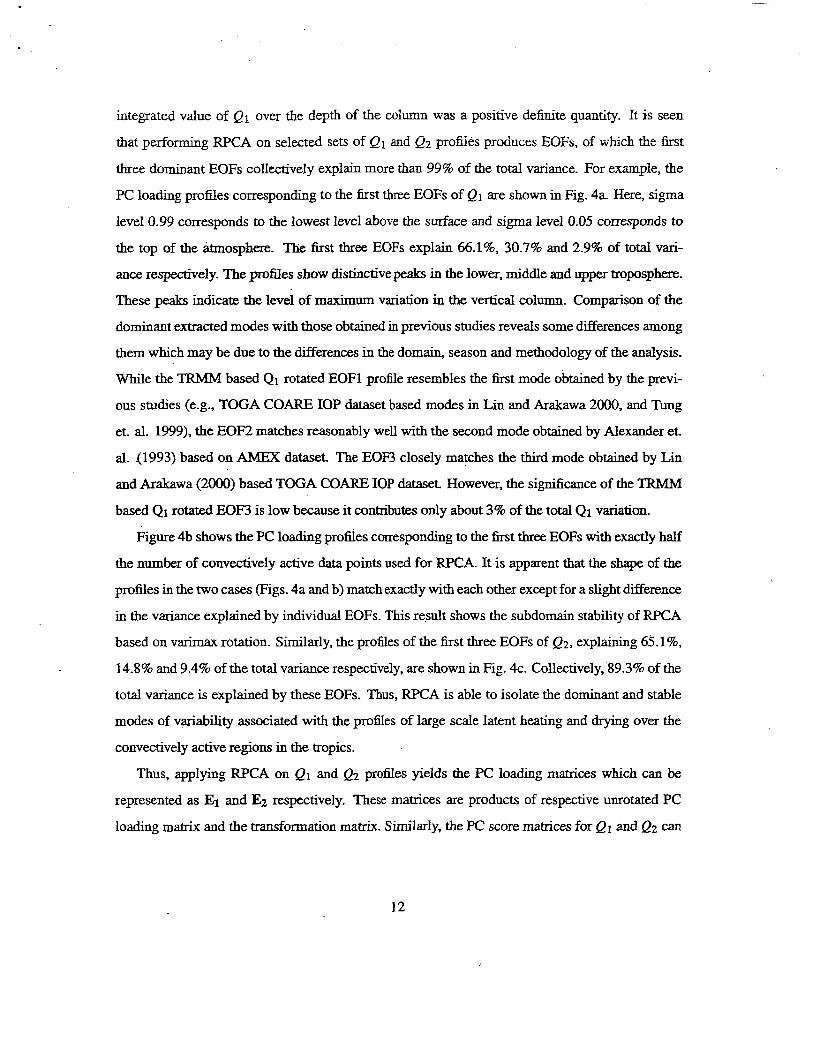
integrated value of Ql over the depth of the column was a positive definite quantity. It is seen
that performing RPCA on selected sets of Ql and Q2 profiles produces EOFs, d Fv'hich the first
three dominant EOFs collectively explain more than 99% of the total variance. For example, the
PC loading profiles corresponding to the first three EOFs of Q1 are shown in Fig. 4a Here, sigma
level 0.99 corresponds to the lowest level above the surface and sigma level 0.05 corresponds to
the top of the atmosphere. The first three EOFs explain 66.1%, 30.7% and 2.9% of total vari-
ance respectively- The profiles show distinctive peaks in the lower, middle and upper troposphere.
These peaks indicate the level of maximum variation in the vertical column. Comparison of the
dominant extracted modes with those obtained in previous studies reveals some differences among
them which may be due to the differences in the domain, season and methodology of the analysis.
While the TRMM based Q1 rotated EOFl profile resembles the h t mode obtained by the previ-
ous studies (e.g., TOGA COARE IOP dataset based modes in Lin and Arakawa 2000, and Tung
et. al. 1999), the EOF2 matches reasonably well with the second mode obtained by Alexander et.
al. (1993) based on AMEX dataset. The EOF3 closely matches the third mode obtained by Lin
and Arakawa (2000) based TOGA C0AR.E IOP dataset. However, the significance of the TRMM
based Q1 rotated EOF3 is low because it contributes only about 3% of the total Q1 variation.
Figure 4b shows the PC loading profiles corresponding to the fist three EOFs with exactly half
the number of convectively active data points used for RPCA. It is apparent that the shape of the
profiles in the two cases (Figs. 4a and b) match exactly with each other except for a slight dBerence
in the variance explained by individual EOFs. This result shows the subdomain stability of RPCA
based on varimax rotation. Similarly, the proiiles of the &st three EOFs of Q2. explaining 65.1 %,
14.8% and 9.4% of the total variance respectively, are shown in Fig. 4c. Collectively,'89.3% of the
total variance is explained by these EOFs. Thus, RPCA is able to isolate the dominant and stable
modes of variability associated with the profiles of large scale latent heating and drying over the
convectively active regions in the tropics.
Thus, applyi~~g RPCA on Ql and Q2 profiles yields the PC loading matrices which can be
represented as E1 and respectively. These matrices are products of respective unrotated PC
loading matrix and the transformation matrix. Similarly, the PC score matrices for Q1 and Q2 can
12
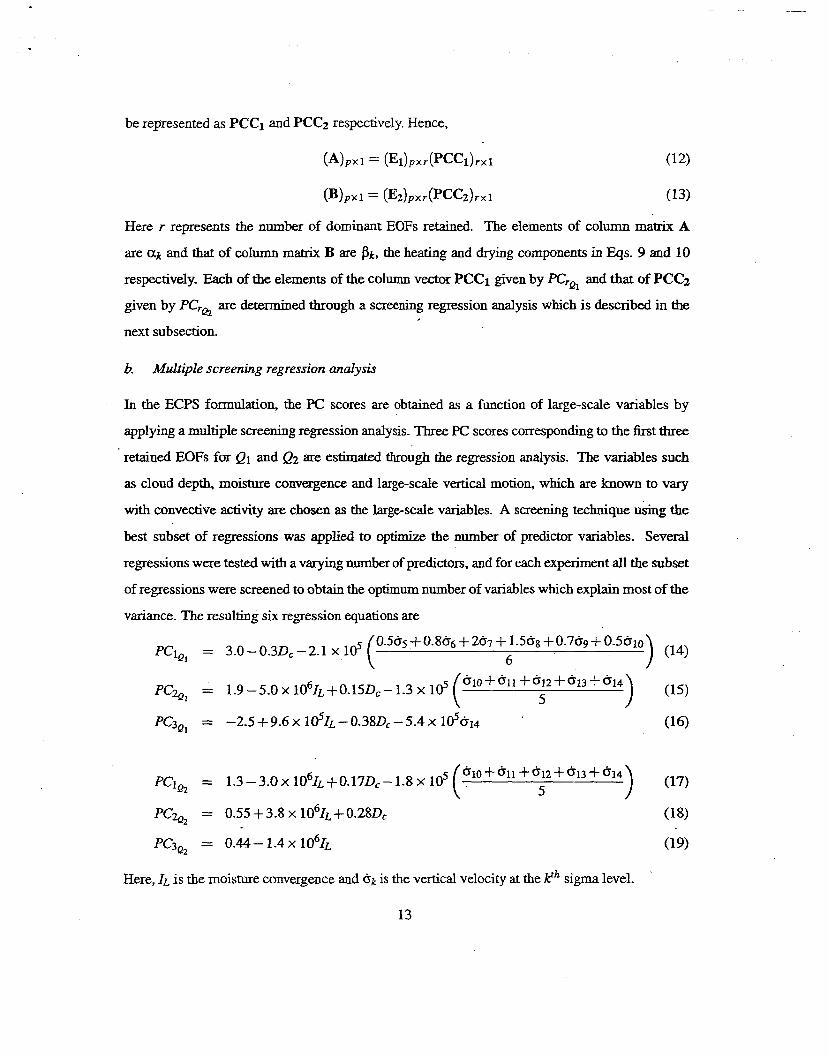
be represented as PCCl and PCCz respectively. Hence,
( A ) p x 1 = ( E 1 ) p x r (PCC1) r x 1
Here r represents the number of dominant EOFs retained. The elements of column matrix A
are ak and that of column matrix B are pk, the heating and drying components in Eqs. 9 and 10
respectively. Each of the elements of the column vector PCCl given by PCra, and that of PCC2
given by PCr& are determined through a screening regression analysis which is described in the
next subsection.
b. Mulhple screening regression analysis
In the ECPS formulation, the PC scores are obtained as a function of large-scale variables by
applying a multiple screening regression analysis. Three PC scores corresponding to the first three
retained EOFs for Ql and Q2 are estimated through the regression analysis. The variables such
as cloud depth, moisture convergence and large-scale vertical motion, which are known to vary
with convective activity are chosen as the large-scale variables. A screening technique using the
best subset of regressions was applied to optimize the number of predictor variables. Several
regressions were tested with a varying number of predictors, and for each experiment all the subset
of regressions were screened to obtain the optimum number of variables which explain most of the
variance. The resulting six regression equations are
) (14) 0.565 + 0.866 + 267 + 1.568 + 0.769 f 0.5610
6 PClq = 3.O-O0.3D,-2.1 x 16
Here, 1~ is the moisture convergence and 6 k is the vertical velocity at the Ph sigma level.
13
3.2 Reconstructed &I and Q2 profiles
To analyze the reconstructed profiles, we have chosen five tropical domains (based on the mean
February 1998 heating distribution shown in Fig. 2). The three oceanic domains are Central Pacific
(CPAC, 15"S-5"N, 180"-140"W), Indim O C ~ (IO, 30°S-5"N, 40"E-ll0"E) and Ath t ic Ocean
(AO, 1SoS-15"N, 45"W-0") and the two continental areas are Africa (AFR, 35"s-10"N; O"40"E)
and Australia (AUS, 35"S-l5"S; 115"E-l55"E). The reconstructed Ql profiles for these domains
are shown in Fig. 5a The heating rate is plotted along the x-axis and the model sigma levels are
plotted along the y-axis. The retrieved profiles are obtained from a linear combination of the first
three dominant rotated EOFs. It is seen that the retrieved profiles match very closely with the
corresponding observed proHes. The reconstructed Qz profiles for selected two domains (IO and
CPAC) are shown in Fig. 5b. For both the domains, the retrieved profiles are close to the observed
profile. The results suggest that RPCA is an effective tool for dimension reduction in which the
observed vertical profiles of Ql and Q2 are retrieved with a reasonable degree of accuracy by
retaining a few dominant EOFs.
4. Predictive skiils of short range forecasts
In order to study the impact of the ECPS, a series of short range (3 day) forecast experiments are
carried out with the FSUGSM having in-built physical initialization (Krishnamurti et al. 1991,
1993) using ECMWF analysis and observed S S M rain rates. The control version represents the
run with the cumulus parameterization based on the modified Kuo scheme of Krishnamurti et al
(1983). A brief overview of the FSUGSM control version is given in Appendix A.
4.1 A representative case study
Out of a series of experiments performed with the ECPS, the results of a representative shea
range forecast started with 5 February 1998 initial condition is compared against corresponding
observation and FSUGSM control forecast. The day-3 precipitation forecast over the tropics for
122 8 February 1998 is shown in Fig. 6. It is seen that the precipitation distribution is improved
globally along the TCZ and regionally over all the major convective centers except over southern
Africa The high forecast rain in the control version becomes comparable with the observed GPCP
14
rain in the ECPS forecast. The longitude-vertical section of day-3 zonal wind averaged over the
equatorial belt (5"S-YN) from the control and the ECPS forecasts are compared with that fiom
the ECMWF analysis in Fig. 7. The circulation, though has some delayed responseto the heating
profile, shows improvement in the ECPS forecast. The major improvement occurs in the middle
and upper troposphere, consistent with the vertical distribution of TRMM based latent heat release
(Fig. 2). This suggests that the tropical circulation is sensitive to vertical distribution of large-
scale convective heating and drying on this time scale. In addition, this indicates the importanCe
of incorporating ECPS-like cumulus scheme in medium and long range forecasts especially in the
context of tropical variabilities associated with Madden-Julian Oscillation (MJO). Fiopre 8 shows
the latitude-vertical section of the day-3 forecast of meridional wind averaged over 40°E-100"E
from the control, ECPS and ECMWF analysis. The structure and the magGtude of winds are
closer to ECMWF analyzed winds for the ECE'S forecast. The ECPS gives rise to a better forecast
of Hadley cell associated with Australian monsoon as well as a more realistic Ferrel and Polar
cells.
The predictive skill has been evaluated based on the root mean square error (RMSE) of 850
and 200 hPa winds and gmpotential height at 500 hPa over six selected tropical domains. Figure 9
shows the estimated RMSE of control and ECPS forecasts for these domains. In general, the error
distribution shows a clear improvement in forecast skill from the use of ECPS in FSUGSM. The
improvement in forecast skill is quantified by estimating the percentage improvement in RMSE
which is estimated as the percentage of the difference between RMSE of ECPS and control divided
by the RMSE of control. The percentage improvement in 200 hPa wind and 500 Wa geopotential
height fields over different tropical domains (Fig. 10) shows a very marked improvement in the
short range forecasts globally and regionally when ECPS is used. The predictive skill seen in this
case study is also consistently evident in other short range forecasts.
4.2 Objective veriiJication
To emphasize the improvement in the forecast skill with ECPS, the results from three additional
forecast experiments started with initial conditions corresponding to 12 January 2000, 11 March
2000 and 12 March 2000 are analyzed. For all the three experiments, the ECPS scheme was found
15

to yield improved day-1 to day-3 forecasts over the tropics. For example, the day-3 precipitation
forecast over the tropics for 122 15 J m w 2000 is shown in Fig. 1 1. The strength and distribution
of precipitation over d e global tropics compare better with observation in the ECPS forecast. The
precipitation forecasts around the equatorial oceanic convective centers especially over d e Indian
and western Pacific Oceans are also improved with the ECPS.
The RMSEs of day-1, day-2 and day-3 forecasts of winds at 850 and 200 hPa and geopo-
tential height at 500 bPa fiom the three additional firecast experiments are compared with the
corresponding RMSEs from the control forecasts (Fig. 12). The ECPS forecasts verifj better than
the control forecasts for all d e three variables. In particular, the ECPS provides large improve-
ments for the 500 hPa height forecasts. This consistent improvement in the forecast skill for all
the case studies M e r emphasizes the importance of incorporating realistic vertical distribution
of heating and drying in the model cumulus scheme. The results also suggest that in the absence
of explicit models for convection, the proposed statistical scheme improves the modeling of the
vertical distribution of heating and moiste~ng in areas of deep convection.
4.3 ECPS with Ql and Q2 profiles based on ECMWF analysis
In order to study the relative forecast improvement contributed by the utilization of TRMM based
Ql dataset in ECPS, the skill in short range forecasts with the present ECPS is compared against
those with ECPS utilizing profiles of bod Ql and Q2 derived from ECMWF analysis. The day-3
precipitation forecasts fkom observation and the two forecasts show that the present ECPS yields a
better forecast over the global tropics (Fig. 6 and Fig. 13). Although the distribution of ECMWF
based ECPS forecast resembles the present ECPS forecast over some parts, d e spread of rainfall
around the ITCZ region is reduced globally and compares better with the observation in the present
ECPS forecast. The pattern correlation coefficient for global tropics is 0.3 for the present ECPS
day-3 forecast and 0.27 for the ECPS forecast based on ECMWF analysis. In addition, although
large and significant improvement was not evident, the present ECPS is found to yield improved
circulation forecasts over most of the tropics compared to ECMWF analysis based ECPS.
16
5. Summary and discussion
A new empirical cumulus parameterization scheme, ECPS, which utilizes observed TRMh4 based
latent heating (el) and moistening (Q2) derived using ECMWF analysis, h,as been developed. The
profiles of Ql and Q2 for the period of 1-28 February 1998 are used as observations. The domi-
nant modes of variability associated with the vertical profiles of Q1 and Q2 over active convective
regions of the tropics are obtained through rotated principal component analysis (RPCA) based on
normal varimax rotation. Analysis suggests that most of the variance associated with the observed
profiles can be explained by retaining the first three modes. The ECPS then applies a statistical
approach in which Ql and Q2 are expressed as a linear combination of the first three dominant
principal components which distinctly explain variance in the troposphere as a function of the
prevalent large-scale dynamics. The principal component (PC) score which quantifies the con&&
bution of each PC to the corresponding loading profile is estimated through multiple screening
regression method. This yields the PC score as a function of the large-scale variables. Thus, the
dependent variables in the regression equations developed in the scheme modulates the heating
about a mean convective and drying profile as a function of large scale variables. The proliles of
Ql and Q2 thus obtained are found to match well with observations.
The impact of the ECPS is investigated through a series of short range (1-3 day) forecast ex-
periments using the Florida State University global spectral model (FSUGSM, T126L14). This
analysis also serves as a sensitivity study of the tropical circulation to the vertical distribution of
large scale convective heating and drying. Forecast comparison with the FSUGSM with modified
Kuo scheme shows marked improvement in the short range forecasts using the ECPS. It is seen
that the large-scale disixibution and amount of precipitation is improved globally along the lTCZ
and regionally over most of the convective centers over the tropics. The skill is also evident in the
structure and magnitude of winds for the ECPS forecast. The ECPS not only gives rise to a better
forecast of Hadley cell but leads to a more realistic Ferrel and Polar cells. This improvement in the
forecast skill emphasizes the importance of incorporating realistic vertical distribution of heating
and drying in the model cumulus scheme. These results also suggest that in the absence of explicit
models for convection, the proposed statistical scheme improves the modeling of the vertical dis-
tribution of heating and drying in areas of deep convection.
17

Acknowledgments
The authors thank Dr. Steve Lang for aiding retrieval of TRMM heating profile data set. The valu-
able and perceptive comments of the two anonymous reviewers are also gratefully acknowledged.
This research effort was supported by the NOAA Grant Number 1338-74545. The computations
carried out in the study were jointly performed using the computing facilities at FSU, CSIT (FSU),
and NCAR, Boulder, Colorado.
18
APPENDIX A
The Florida State University (FSU) Global Spectral Model
The global model used in this study is identical in all respects to that used in Krishnamurti et al.
(1991). The T126 version of the model, however, has been highly vectorized to reduce the model
integration time. In addition, moisture variable dew point depression (T-Td) has been replaced
by specific humidity and a look-up table is used for moisture calculation to further reduce the
computational time. An outline of the model is as follows:
1. Variables:
a) Independent variables: A, 8, a,t.
b) Dependent variables: vorti&y, divergence, temperature and specific humidity.
2. Resolution:
a) Horizontal resolution: Triangular spectral truncation; T126 resolution has a 384 x 192
Gaussian transform grid with a horizontal separation of about 100 km at 20 latitude.
b) Vertical resolution: 14 layers in the vertical between 50 mb and 100 mb. Model vari-
ables are staggered in the vertical using Charney-Phillips vextical discretization - vorticity,
divergence, wind and geopotential are located at layer interface while temperahms, specilic
humidity and vertical velocity are assigned at the center of the layer. The vertical grid has
higher resolution in stratosphere and in planetary boundary layer.
3. Time integration scheme: The divergence equation, thermodynamic equation and pressure
tendency equation are integrated implicitly while for vorticity equation and moisture con-
tinuity equation explicit time integration scheme is used. The tendencies of the physical
processes are integrated using a forward time integration scheme.
4. Space differing scheme: Spectral in the horizontal; centered differences in the vertical for all
variables except moisture which is handled by an upstream differencing scheme.
5. Surface topography is based on envelope orography (Wallace et al. 1983).
6. Parameterization of physical processes:
a) Deep convection: based on modified Kuo cumulus parameterization scheme (Krishna-
19
murti et al. 1983), where the moistening and mesoscale convergence parameters aTe ob-
tained from 700 mb vorticity and mean vertical velocity averaged over cloud depth through
a regression relation.
b) Shallow convection (Tiedke 1984)
c) Dry convection
d) Large-scale condensation (Kanamitsu 1975). The scheme accounts for evaporation of
falling precipitation.
e) Surface fluxes of heat, moisture and momentum are calculated using similarity theory
(Businger et al. 1971).
f) Vertical distribution of fluxes in the free atmosphere is based on stability (Richardson
number) dependent exchange coefficient (Louis, 1979).
g) 4th order horizontal diffusion (Kanamitsu et al. 1983).
h) Long and shortwave radiative fluxes are based on band model and incorporate the radiative
effects of water vapor, carbon dioxide, ozone and clouds (Harshvardm and Corsetti, 1989;
Lacis and Hansen, 1974).
i) Parameterization of low, medium and high clouds for radiative transfer calculation is based
on threshold relative humidity. Fraction area of various cloud distribution configurations in
the vertical is based on random overlap consideration.
j) Surface temperatures: Prescribed over the oceans, while over the land a surface energy
balance coupled to the similarity theory determines the surface temperature including its
diurnal cycle (Krishnamurti et al. 1991).
7, Initialization: The initialization of the model is achieved in two stages:
a) Nonlinear normal mode initialization: (Kitade, 1983), wherein the tendencies of first 5
modes with phase speed exceeding about 30 rn s-l are damped during the initialization. The
slow moving higher modes are allowed to adjust freely.
b) Physical initialization wherein moisture field, heat sources and sinks and divergence fields
are initialized consistent with observed OLR and rain rates.
20
References
Alexander, G. D., G. S. Young, andD. V. Ledvina, 1993: Principal component analysis of vertical
profiles of Ql and Q2 in the tropics. Mon. Weather Rev., 121,535-548.
Anthes, R. A., 1982: Tropical cyclones- Their evolution, structure and effects. Meteol: Monogr.,
41,l-208.
Busingex, J. A., J. C. Wyngard, Y. Izumi, and E. E Bradley, 197 1 : Flux prome relationship in the
atmospheric surface layer- J. Amos. Sci., 28,181-189.
Chang, C.-P., and H. Lim, 1988: Kelvin wave-CISK: A possible mechanism for the 30-50 day ~
oscillations. J. Amus- Sci., 45,1709-1720.
Charney, J- G., and A. Eliassen, 1964: On the growth of the hurricane depression. J. A m s . Sci.,
21,68-75.
Harshvardan, and T.G. Corsetti, 1984: Long-wave parameterkation for the UCLPJGLAS GCM.
NASA Tech. Memo. 86072, Goddard Space Flight Center, Greenbelt, MD 20771,52 pp.
Hartmann, D. L., H. H. Hendon, and R. A. Home, Jr., 1984: Some implications of the mesoscale
circulations in tropical cloud clusters for large scale dynamics and climate. J. Amos. Sci.,
41,113-121.
Huffman, G. J., R. F. Adler, P. A. Arkin, A. Chang, R. Ferraro, A. Gruber, J. Janowiak, A. McNab,
B. Rudolf, and U. Schneider, 1997: The Global Precipitation Climatology Project (GPCP)
combined precipitation dataset. Bull. Amer. Meteoz SOC., 78,5-20.
Johnson, R. H., 1984: Partitioning tropical heat and moisture budgets into cumulus and mesoscale
components: Implications for cumulus parameterization. Mon. Weather Rev., 112, 1590-
1601.
Kanamitsu, M., K. Tada, K. Kudo, N. Sato, and S. Isa, 1983: Description of the JMA operational
spectral model. J. Mereol: SOC. Japan, 61,812-828..
Kanamitsu, M., 1975: On numerical prediction over a global tropical belt. Report No. 75-1, Dept.
of Meteorology, Florida State University, Tallahassee, Florida 32306, pp. 1-282.
21

E a d e , T. !983: Nonlinear normal mode initialization with physics. Mon. Weather Rev., 111,
2 194-2213.
Krishnamurti, T. N., S. K. R. Bhowmik, D. Oosterhof, G. Rohaly, and N. Surgi, 1995: Mesoscale
signatures within the tropics generated by physical initialization. Mon. Weather Rev., 123,
277 1-27 89.
Krishnamurti, T. N., H. S. Bedi, and K. Ingles, 1993: Physical initialization using.SSM.4 rain
rates. Tellus, 45A, 247-269.
IGishnamurti, T. N., J. Xue, H. S . Bedi, K. Ingles, and D. Oosterhof, 1991: Physical initialization
for numerical weather prediction over the tropics. Tellus, 43,53-81.
Krishnamurti, T. N., and H. S. Bedi, 1988: Cumulus parameterization and rainfall rates: Part III.
Mon. Weather Rev., 116,583-599.
Krishnamurti, T. N., S . Low-Nam, and R. Pasch, 1983: Cumulus parameterization and rainfall
rates II.'Mon. Weather Rev., 111,815-828.
Krishnamum, T. N., Y. Ramanathan, H. L. Pan, R J. Pasch, and J. Molinari, 1980: Cumulus
parametahtion and rainfall rates I. MOR Weather Rev., 108,465472.
Lacis, A. A., and J. E. Hansen, 1974: A parameterization of the absorption of solar radiation in
the earth's atmosphere. J. A m s - Sci., 31,118-133.
Lau, K.-M., and L. Peng, 1987: Origin of the low-frequency (intraseasonal) oscillation in the
tropical atmosphere. J. Atmos. Sci., 44,950-972.
Lin, C., and A. Arakawa, 2000: Empirical determination of the basic modes of cumulus heating
and drying profiles. J. A w s . Sci., 57,3571-3591.
Louis, J.F., 1979: A parametric model of vertical eddy fluxes in the atmosphere. Boundary Layer
Meteorology, 17, 187-202.
Malkus, J. S., and R. T. Warns, 1963: On the interaction between severe storms and large
cumulus clouds. Mereal: Monogr., 5 , 5 9 4 .
Mapes, B. E., and R A. Houze, Jr., 1995: Diabatic divergence profiles in western Pacific warm
pool dunhg TOGA COAFE. J. Amos. SC~. ,52,1807-1828.
22
Misra, V., 1997: A statistically based cumulus parameterization scheme that makes use of heating
and moistening rates derived from observations. Ph. D. Dissertation, Florida State Univer-
sity, Tallahassee, 184 pp-
Ogura, Y., 1975: On the interaction between cumulus clouds and the larger scale environment.
Pure. Appl. Geophys., 13,869-889.
Olson, W. S., C. D. Kummerow, Y. Hong, and W.-K Tao, 1999: Atmospheric Iatent heating
distributions in the Tropics derived from passive microwave radiometer measurements. J.
Appl. Meteox, 38,633-644.
Preisendorfer, R. W., 1988: Principal component analysis in meteorology and oceimography,
Elsevier, NewYork
Rajendran, K, Ravi S . Nanjundiah, and J. Srinivasan, 2002: Comparison of seasonal and in-
straseasonal variation of tropical climate in NCAR CCM2 GCM with two different cumulus
schemes. Meteor: Atmos. Phys., 79,57-86..
Reed, R J., and E. E. Recker, 1971: Structure and properties of synoptic-scale wave disturbances
in the equatorial western Pacific. J. Atmos. Sci, 28,1117-1 133.
Richman, M. B., 1986: Review Article Rotation of principal components. Int’Z. J . of Climatology,
6,293-335.
Simpson, J., and W.-K Tao, 1993: The Goddard Cumulus Ensemble Model. Part II: Applications
for studying cloud precipitating processes and for NASA TRMM. Terrestrial, Atmospheric
and Oceanic Sciences, 4, 55-96.
Sui, C.-H., and K.-M. Lau, 1989: Origin of the low-frequency (intraseasonal) oscillations in the
tropical atmosphere. Part II: Structure and propagation of mobile wave-CISK modes and
the^ modification by lower boundary forcings. J. Atmos. ScL, 46,37-56.
Tao, W.-K., S . Lang, W. S . Olson, R Meneghim, S . Yang, J. Simpson, C. Kummerow, E. Smith,
and J. Halverson, 2001 : Retrieved vertical proaes of latent heat release using TRMM rain-
fall products for February 1998. J . Appl. Meteor, 40,957-982.
Tao, W.-K, J. Simpson, C.-H. Sui, B. Fenier, S. Lang, J. Scala, M.-D. Chou, and K. Picker-
23

ing, 1993a: Heating, moisture and water budgets of tropical and midlatitude squall lines:
Comparisons and sensitivity to longwave radiation. J. Amos. Sci., 50,. 673-690.
Tao, W.-K., S. Lang, J. Simpson, and R. Adler, 1993b: Retrieval algorithms for estimating the
vertical profiles of latent heat release: Their applications for TRMM. J. Meteor. Soc. Japan,
71,685-700.
. Tiedke, M., 1984: The sensitivity of the time-mean large-scale flow to cumulus convection in the
ECMWF model. Workshop on Convection in large-scale numerical models. ECMWF, 28
NOV. - 1 D e . 1983,297-316.
Tung, W.-W., C. Lin, B. Chen, M. Yanai, and A. Arakawa, 1999: Basic modes of cumulus heating
and drying observed during TOGA-COARE IOP Geophys. Res. Lett., 26,3 1 17-3 120.
Wallace, J. M., S . Tibaldi, and A. J. Simmons, 1983: Reduction of systematic forecast errors in
the ECMWF model through the introduction of envelope orography. Quart. J. Roy. Meteo-
rol. Soc-, 109,683-718.
Weisman, M. L., and J. B. Klemp, 1982 The dependence of numerically simulated convective
storms on vertical wind shear and buoyancy. Mon. Weather Rex, 110,504-520.
Yanai, M., S . Esbensen, and J. H Chu, 1973: Deteimination of bulk properties of tropical cloud
clusters from large scale heat and moisture budgets. J. Amos. Sci., 30,611-627.
Zawadzki, I., E. Torlaschi, and R. Sauvageau, 1981: The relationship between mesoscale ther-
modynamic variables and convective precipitation. J. A m s . Sci., 38,1535-1540.
Zawadzki, I. I., and C. U. Ro, 1978: Correlations between maximum rate of precipitation and
mesoscale parameters. J. Appl. MeteoroL, 17, 1327-1 334.
Zhang, Z., and T. N. Krishnamurti, 1996: A generalization of Gill’s Heat Induced Tropical Cir-
culation. J. Atmos. Sci, 53,1045-1056.
24

An Empirical Cumulus Parameterization Scheme for a Global Spectral Model
K. Rajendran, T. N. Knshnamurti, V. Misra and -W. -K. Tao
J . Meteor. SOC. Japan L
Popular summary
Realistic vertical heating and d j ing profiles in a cumulus scheme is important for obtaining accurate weather forecasts. A new empirical cumulus parameterization scheme based on a procedure to improve the vertical distribution of heating and moistening over the tropics is developed. The empirical cumulus parameterization scheme (ECPS) utilizes observed profiles of Tropical Rainfall Measuring Mission (TRMM) based apparent heat source (Q,) and the European Centre for Medium- Range Weather Forecasts analysis based apparent moisture sink (a>. A dimension reduction technique through rotated principal component analysis (RPCA) is performed on the vertical profiles of heating and drying over the convective regions of the tropics, to obtain the dominant modes of variability. Analysis suggests that most of the variance associated with the observed profiles can be explained by retaining the first three modes. The ECPS then applies a statistical approach in which Q1 and Q3 are expressed as a linear combination of the first three dominant principal components which distinctly explain variance in the troposphere as a function of the prevalent large-scale dynamics. The principal component (PC) score which quantifies the contribution of each PC to the corresponding loading profile is estimated through a multiple screening regression method which yields the PC score as a function of the large-scale variables.
The profiles of Q1 and 42 thus obtained are found to match well with the observed profiles. The impact of the ECPS is investigated in a series of short range (1-3 day) prediction experiments using the Florida State University global spectral model (FSUGSM, T126L14). Comparisons between short range ECPS forecasts and those with the modified Kuo scheme show a very marked improvement in the skill in ECPS forecasts. This improvement in the forecast skill with ECPS emphasizes the importance of incorporating realistic vertical distributions of heating and drying in the model cumulus scheme. This also suggests that in the absence of explicit models for convection, the proposed statistical scheme improves the modeling of the vertical distribution of heating and moistening in areas of deep convection.