An Empirical Critique of “One Newark” · An Empirical Critique of “One Newark ... In a...
35
2014 Mark Weber (Ph.D. Student) & Bruce D. Baker (Professor) Rutgers Graduate School of Education New Jersey Education Policy Forum 1/24/2014 An Empirical Critique of “One Newark” This report, its production, gathering and organization of data, and data analysis, received no financial support. Data used in this report are all publicly available through cited sources. All analyses are conducted by the authors and all opinions and summaries included herein are those of the authors based on the supporting analyses.
Transcript of An Empirical Critique of “One Newark” · An Empirical Critique of “One Newark ... In a...

2014
Mark Weber (Ph.D. Student) & Bruce D.
Baker (Professor) Rutgers Graduate School
of Education
New Jersey Education Policy Forum
1/24/2014
AnEmpiricalCritiqueof“OneNewark”
This report, its production, gathering and organization of data, and data
analysis, received no financial support. Data used in this report are all
publicly available through cited sources. All analyses are conducted by the
authors and all opinions and summaries included herein are those of the
authors based on the supporting analyses.

1 | P a g e
TableofContentsExecutive Summary ................................................................................................................................... 2
Introduction .................................................................................................................................................. 4
Background ................................................................................................................................................... 5
Analysis and Findings .................................................................................................................................... 8
What are the Differences across Schools by Assigned Category? ............................................................ 9
Do Performance Measures “Predict” One Newark Classification? ......................................................... 12
Do Facilities Constraints and Features Predict Group Assignment? ....................................................... 16
Is the Premise behind Charter Takeover Supported by the Data? ......................................................... 18
Conclusions and Policy Implications ........................................................................................................... 24
Appendix ..................................................................................................................................................... 26
A. Data Sources and Analysis .......................................................................................................... 26
B. One Newark Classifications ......................................................................................................... 26
C. Additional Model Results ............................................................................................................ 32
D. North Star Academy Attrition Rates ........................................................................................... 33
Author Biographies: ................................................................................................................................ 34

2 | P a g e
ExecutiveSummary
On December 18, 2013, State Superintendent Cami Anderson announced a wide‐scale
restructuring of the Newark Public Schools. This brief examines the following questions about
One Newark:
Has NPS identified the schools that are the least effective in the system? Or has the
district instead identified schools that serve more at‐risk students, which would explain
their lower performance on state tests?
Do the interventions planned under One Newark ‐‐ forcing staff to reapply for jobs,
turning over schools to charter operators, closure – make sense, given state
performance data on NPS schools and Newark’s charter schools?
Is underutilization a justification for closing and divesting NPS school properties?
Are the One Newark sanctions, which may abrogate the rights of students, parents, and
staff, applied without racial or socio‐economic status bias?
We find the following:
Measures of academic performance are not significant predictors of the classifications
assigned to NPS schools by the district, when controlling for student population
characteristics.
Schools assigned the consequential classifications have substantively and statistically
significantly greater shares of low income and black students.
Further, facilities utilization is also not a predictor of assigned classifications, though
utilization rates are somewhat lower for those schools slated for charter takeover.
Proposed charter takeovers cannot be justified on the assumption that charters will
yield better outcomes with those same children. This is because the charters in question
do not currently serve similar children. Rather they serve less needy children and when
adjusting school aggregate performance measures for the children they serve, they
achieve no better current outcomes on average than the schools they are slated to take
over.
Schools slated for charter takeover or closure specifically serve higher shares of black
children than do schools facing no consequential classification. Schools classified under
“renew” status serve higher shares of low‐income children.
3 | P a g e
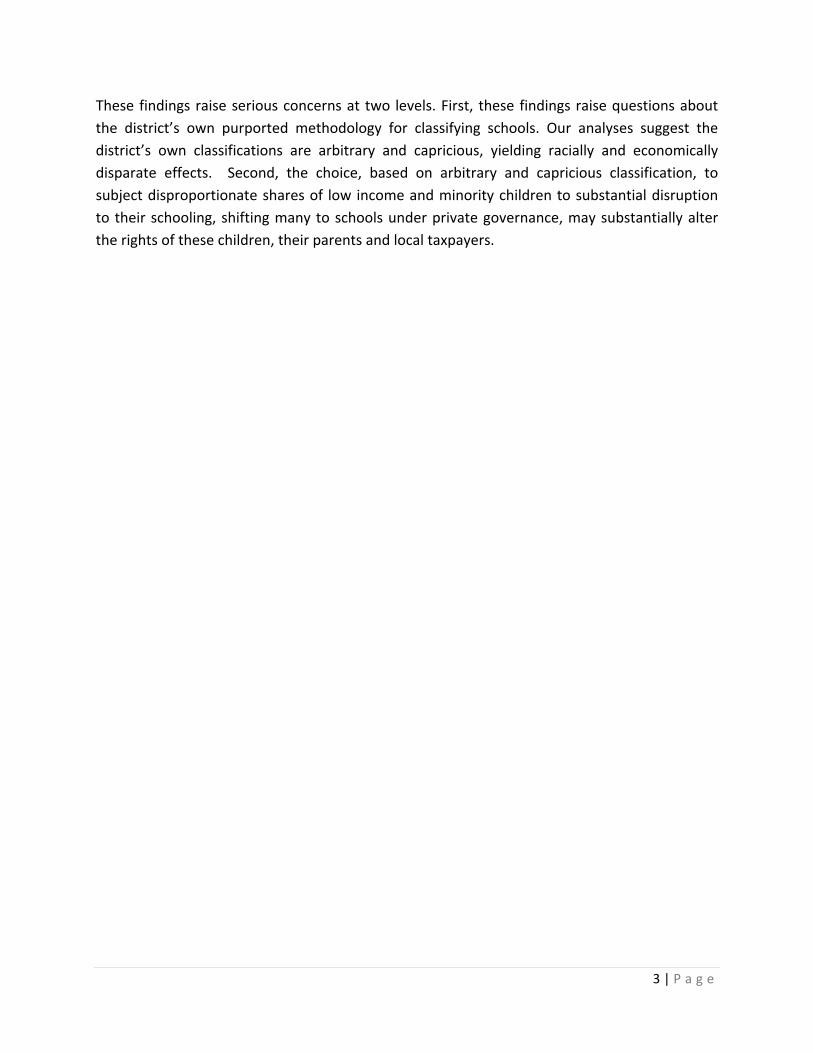
These findings raise serious concerns at two levels. First, these findings raise questions about
the district’s own purported methodology for classifying schools. Our analyses suggest the
district’s own classifications are arbitrary and capricious, yielding racially and economically
disparate effects. Second, the choice, based on arbitrary and capricious classification, to
subject disproportionate shares of low income and minority children to substantial disruption
to their schooling, shifting many to schools under private governance, may substantially alter
the rights of these children, their parents and local taxpayers.

4 | P a g e
Introduction
On December 18, 2013, State Superintendent Cami Anderson announced a major restructuring
of the Newark Public Schools1. While some NPS schools will see little to no substantive change
under the “One Newark” plan, others will be redesigned, taken over by charter management
organizations (CMOs), or closed. Several schools will be “renewed,” requiring all teachers and
school leaders to reapply for their positions and likely leading to substantial turnover in the
schools’ staffs.
While the precise methodology for making One Newark‐based decisions has not been released
by NPS, the state‐run district has published several documents2 that generally explain its
rationale for classifying schools: those that have low proficiency rates on state tests and/or
show low growth (as measured by Student Growth Percentiles) are to be targeted for
intervention.
But is NPS correctly identifying the schools that are poor performers, especially when
considering the populations of students they serve? And are the interventions they plan to
administer warranted, given the data available on Newark’s schools from the New Jersey
Department of Education (NJDOE)?
This brief examines the following questions about One Newark:
Has NPS identified the schools that are the least effective in the system? Or has the
district instead identified schools that serve more at‐risk students, which would explain
their lower performance on state tests?
Do the interventions planned under One Newark ‐‐ forcing staff to reapply for jobs,
turning over schools to charter operators, closure – make sense, given state
performance data on NPS schools and Newark’s charter schools?
Is underutilization a justification for closing and divesting NPS school properties?
Are the One Newark sanctions, which may abrogate the rights of students, parents, and
staff, applied without racial or socio‐economic status bias?
1 “Newark school restructuring includes plans to put charters in district buildings” The Star‐Ledger, 12/18/13.
http://www.nj.com/education/2013/12/newark_school_plan_restructure.html 2 http://onewark.org/supporting‐materials/

5 | P a g e
Background
NPS has been under control of the State of New Jersey since 1995.3 While the district gained
some control over fiscal matters in 20124, “One Newark” was created by a district
administration under state authority, and without the consent of the NPS Advisory Board.5
In its presentation, “Building a System: One Newark,”6 NPS describes its methodology for
classifying schools (p. 4):
Performance Group Definitions based student performance on the NJ ASK:
Low: Average LAL Proficiency is below 200, and median Student Growth Percentile (SGP)
is below 50.
On the Move: Average LAL Proficiency is below 200, but median SGP is above 50 or SGP
has improved by 8 points.
Good: Average LAL Proficiency is above 200.
LAL is “Language Arts Literacy,” as measured by the New Jersey Assessment of Skills and
Knowledge (NJASK).7 It is worth noting that the NPS “One Newark” documents do not cite any
measure of proficiency in mathematics, even though New Jersey administers state exams in
mathematics every year. NPS’s description also makes no mention of student demographics.
In a previous brief, Dr. Bruce Baker shows that SGPs – measures of relative “growth” in test
scores for a school or student ‐ do not account for student characteristics. The brief finds a
modest, negative statistically significant correlation with the percentage of school’s students
who qualify for free lunch, and with the percentage of students who are black or Hispanic.8 This
negative correlation may bias One Newark decisions, and impose more sanctions on those
schools that serve more of these students.
3 “N.J. Moves to Take Over Another District.” Education Week, 5/31/13.
http://www.edweek.org/ew/articles/2013/06/05/33nj.h32.html 4 “For first time in 18 years, Newark school board to regain control of fiscal operations.” The Star‐Ledger, 6/4/13.
http://www.nj.com/essex/index.ssf/2013/06/newark_school_board_to_regain.html 5 “’One Newark’ Reform Plan Proves Divisive Even Before Official Release.” NJ Spotlight, 12/18/13.
http://www.njspotlight.com/stories/13/12/18/one‐newark‐reform‐plan‐proves‐divisive‐even‐before‐official‐release/
6 http://onewark.org/wp‐content/uploads/2013/12/Building‐a‐System‐One‐Newark‐Plan.pdf 7 http://www.state.nj.us/education/assessment/descriptors/ 8 Baker, B. (2013) “Deconstructing Disinformation on Student Growth Percentiles & Teacher Evaluation in New
Jersey.” http://njedpolicy.wordpress.com/2013/05/02/deconstructing‐disinformation‐on‐student‐growth‐percentiles‐teacher‐evaluation‐in‐new‐jersey/
6 | P a g e
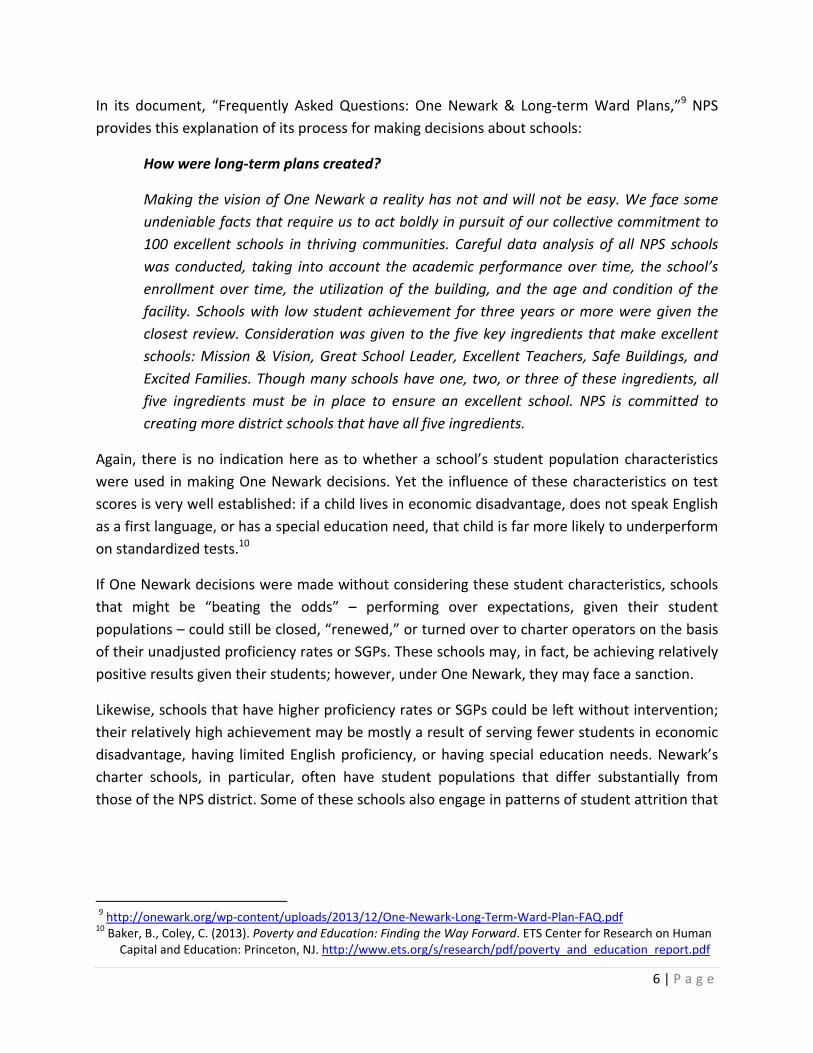
In its document, “Frequently Asked Questions: One Newark & Long‐term Ward Plans,”9 NPS
provides this explanation of its process for making decisions about schools:
How were long‐term plans created?
Making the vision of One Newark a reality has not and will not be easy. We face some
undeniable facts that require us to act boldly in pursuit of our collective commitment to
100 excellent schools in thriving communities. Careful data analysis of all NPS schools
was conducted, taking into account the academic performance over time, the school’s
enrollment over time, the utilization of the building, and the age and condition of the
facility. Schools with low student achievement for three years or more were given the
closest review. Consideration was given to the five key ingredients that make excellent
schools: Mission & Vision, Great School Leader, Excellent Teachers, Safe Buildings, and
Excited Families. Though many schools have one, two, or three of these ingredients, all
five ingredients must be in place to ensure an excellent school. NPS is committed to
creating more district schools that have all five ingredients.
Again, there is no indication here as to whether a school’s student population characteristics
were used in making One Newark decisions. Yet the influence of these characteristics on test
scores is very well established: if a child lives in economic disadvantage, does not speak English
as a first language, or has a special education need, that child is far more likely to underperform
on standardized tests.10
If One Newark decisions were made without considering these student characteristics, schools
that might be “beating the odds” – performing over expectations, given their student
populations – could still be closed, “renewed,” or turned over to charter operators on the basis
of their unadjusted proficiency rates or SGPs. These schools may, in fact, be achieving relatively
positive results given their students; however, under One Newark, they may face a sanction.
Likewise, schools that have higher proficiency rates or SGPs could be left without intervention;
their relatively high achievement may be mostly a result of serving fewer students in economic
disadvantage, having limited English proficiency, or having special education needs. Newark’s
charter schools, in particular, often have student populations that differ substantially from
those of the NPS district. Some of these schools also engage in patterns of student attrition that
9 http://onewark.org/wp‐content/uploads/2013/12/One‐Newark‐Long‐Term‐Ward‐Plan‐FAQ.pdf 10 Baker, B., Coley, C. (2013). Poverty and Education: Finding the Way Forward. ETS Center for Research on Human
Capital and Education: Princeton, NJ. http://www.ets.org/s/research/pdf/poverty_and_education_report.pdf
7 | P a g e
may help raise their proficiency rates and their growth percentiles, as slower‐growing, lower‐
performing students are incrementally removed from the population.11
Our analysis of One Newark, therefore, looks at performance measures while controlling for
student population variations. If the goal of One Newark is to identify those schools within NPS
that require more extensive interventions, student characteristics should be a factor in the
analysis and subsequent decisions.
This same concern was raised in evaluating New Jersey’s ESEA Waiver Request,12 which called
for a classification system based on student performance. NJDOE identified many schools
across the state as “Priority,” “Focus,” and “Reward” schools. But these classifications appeared
to be based on student performance, with no attempt to separate the influence of schools on
test scores from student background factors. “Priority” and “Focus” schools, therefore, were far
more likely to have large percentages of students who were black or Hispanic, or qualified for
the federal Free Lunch program.13
Has NPS used similar methodology in developing One Newark? If so, the district is not
measuring school performance; it is measuring student performance, regardless of factors
outside of the control of the schools. Using standard statistical techniques, we run a series of
tests which at least partially account for student differences between schools as a way of
determining if NPS’s One Newark decisions are sound. We also describe the demographic
characteristics of students affected by One Newark to ascertain if the program’s consequences
are distributed equally across student subgroups, or if certain racial or socio‐economic
subgroups will be disproportionately affected.
This past October, the Institute on Education Law and Policy14 released a report, “New Jersey’s
Apartheid and Intensely Segregated Urban Schools,”15 that included NPS student demographic
information. Using 2010‐11 data, the report finds that 84.1% of Newark’s schools, serving
79.6% of the student population, are “intensely segregated”: they have zero to 10% white
students. This is not surprising in a district that reported a student population that was 51.4%
black, 37.9% Hispanic, and 7.8% white; however, if One Newark consequences
11 Baker, B.D. (2013) Newark Charter Update: A Few New Graphs and Musings. School Finance 101.
http://schoolfinance101.wordpress.com/2013/07/14/newark‐charter‐update‐a‐few‐new‐graphs‐musings/ See also graphs in appendix displaying extreme attrition of North Star Academy.
12 http://www2.ed.gov/policy/eseaflex/approved‐requests/nj.pdf 13 Baker, B. (2012). “Ed Waivers, Junk Ratings & Misplaced Blame: Jersey Edition.”
http://schoolfinance101.wordpress.com/2012/09/12/ed‐waivers‐junk‐ratings‐misplaced‐blame‐jersey‐edition/
14 http://ielp.rutgers.edu/ 15 Flaxman, G., Orflied, G.,Tractenberg, P. (2013).
http://ielp.rutgers.edu/docs/IELP%20final%20report%20on%20apartheid%20schools%20101013.pdf

8 | P a g e
disproportionately affect one racial group, they may serve to further the racial isolation of NPS
schools.
In addition, there is a serious concern as to whether the rights of the students who attend the
schools slated for charter takeovers and their families will be abrogated under One Newark.
While charter schools are publicly funded, recent legal rulings have found that they are not
public entities. The shift from traditional public governance of schools to mixed public/private
relationships may substantively alter the rights of students, employees and taxpayers, including
students’ constitutional and statutory protections under school discipline policies.
Taxpayers may find increasingly that documents and meetings previously considered publicly
accessible are not, as organizations shift key roles and responsibilities under private governance
in order to shield them from public disclosure, such as maintaining contracts for school
employees or outsourced services through private entities not directly governed by the school’s
board.16
NPS claims to take into account the conditions and utilization of facilities in making One Newark
decisions. A survey of NPS facilities is beyond the scope of this brief; however, we do consider
utilization rates in our analysis. Building utilization is calculated by dividing the numbers of
students enrolled in a school by its capacity; a number over 100% indicates that building is over
capacity. We examine the average utilization rates by One Newark classification in an attempt
to determine the rationale for closing buildings or turning them over to charter schools.
AnalysisandFindings
In this section we address each of the major questions laid out above using recent data from
Newark Public Schools, most of which is publicly available (as cited) through the New Jersey
Department of Education. We begin with a descriptive summary of differences in measures
across schools by assigned category under One Newark. We then test whether specific
characteristics are predictive of category assignment, where the assumption would be that if
the One Newark categories were at all “rational” or at least consistent with espoused rationale,
that certain factors would strongly predict which schools were assigned to which groups. We
test a combination of student demographic factors, school level outcome measures, and
facilities use measures.
16 Green, P.C., Baker, B.C., Oluwole, J. (in press) Having it Both Ways: How Charter Schools try to Obtain
Funding of Public Schools and the Autonomy of Private Schools. Emory Law Journal

9 | P a g e
WhataretheDifferencesacrossSchoolsbyAssignedCategory?
For our analysis of One Newark, we created a taxonomy of school consequences:
No Major Change
Renew
Charter Takeover
Close
Unknown
Our methodology is explained in the Appendix B, and our classification for each NPS school is
found in Table B1.
In Figure 1, we compare four test‐based measures of student achievement. Proficiency rates
show the percentage of students at a school who scored “proficient” or “advanced proficient”
on NJASK. We use Eighth Grade rates as most NPS elementary schools encompass Pre‐K or
Kindergarten through Eighth Grade, which makes these the final tests students will take at their
school. While NPS documents only refer to “Language Art Literacy” tests, we report proficiency
rates for both language arts and math tests.
MGP, or Median Student Growth Percentile, is a measure of “growth” on student test scores.
SGPs compare a cohort of students across the state who have a similar history of test scores;
gains or losses on the latest test are then ranked by percentiles in a normal distribution.17 An
SGP score is, therefore, comparative: it shows relative, as opposed to absolute, growth. The
MGP for a school is the median SGP for the entire population of test takers at that school.
While and MGP does not fully control for differences in student backgrounds, it is still arguably
a better measure of differences in school performance than are measures of proficiency rates.
Outcome measures in Figure 1 are weighted by student enrollment.
17 For further explanation of SGPs, see: “AchieveNJ for Teachers; Student Growth Percentiles.”
http://www.nj.gov/education/AchieveNJ/teacher/percentile.shtml

10 | P a g e
Figure 1
The proficiency rates for schools classified as “Renew,” “Charter Takeover,” and “Close” appear
lower than those for schools not subject to One Newark sanctions; however, only those schools
slated to be “renewed” have outcomes that are statistically significantly lower. MGP scores for
all three sanctioned groups are not statistically significantly different. Schools slated for closure,
in fact, have higher average (weighted) MGP scores than those that will stay open under One
Newark.
Note that the number of schools in some categories (“closure” specifically at only three) is
small, and as such the likelihood of a statistically significant difference is small. Nonetheless, the
actual average of all schools in this group for Math and Reading growth percentiles exceeds
that of those identified as having no major change.
What is missing from these student outcomes, however, is any attempt to account for
differences in student population characteristics. If a school had, for example, a relatively large

11 | P a g e
population of students who were in economic disadvantage, we would not be surprised to find
that the school had lower proficiency rates, even if it showed substantial gains on test scores.
Figure 2 shows the differences in student characteristics for our One Newark classifications.
Figure 2
“Renew” schools serve a statistically significantly higher proportion of students in economic
disadvantage (as measured by eligibility for free lunch) than schools that do not face sanction
under One Newark. Schools slated for charter takeovers and closure also serve a higher
proportion of free lunch eligible students, although the difference is not statistically significant.
Included in this chart are demographic figures for charter schools that exist within the Newark
city limits (see Table B2 in Appendix B for a list of these charters). Note that these schools have
a statistically significantly lower free lunch eligible student population than any of the NPS
schools slated for sanctions under One Newark. Note also that the charters have a statistically
significantly lower proportion of English Language Learners (ELL) – as do the schools that they

12 | P a g e
are slated to take over, meaning that the charter sector in Newark will likely continue to under‐
serve the ELL student population under One Newark.
Newark’s charter schools, the schools slated for charter takeover, and the schools slated for
closure have statistically higher black student populations than schools not facing sanctions
(“renew” schools also have a higher proportion of black students, but that difference is not
statistically significant.). There are two concerns here: first, while NPS students are not required
to apply to or attend charters, the disproportionate number of black students who will see their
schools closed or taken over by charters may drive more black students toward those charters,
creating a charter sector that becomes even more racially isolated.
Second: as stated above, recent court cases and rulings by government agencies have
determined that charter schools are not under all circumstances public entities, and as such do
not need to afford the same legal protections and rights to their students as would traditional
government operated schools. These distinctions are non‐trivial under a plan that proposes to
disparately reduce student and family access to traditional public schools, according to their
race.
DoPerformanceMeasures“Predict”OneNewarkClassification?
Because of the statistically significant differences in student characteristics between schools
with different One Newark consequences – and because those differences impact test‐based
school outcomes – an analysis of One Newark must take into account both student background
and student test outcomes. In other words: it isn’t enough just to judge differences in NPS
schools’ proficiency rates and SGPs; we must also look at the differences in student
populations.
We run a series of tests, using the measures above, to predict group assignment of the schools.
We begin with the most relevant though less straightforward approach of using what is
referred to as Multinomial Logistic Regression in order to determine which measures predict
group assignment. Multinomial Logit models are used when there are multiple possible
outcomes (in contrast to typical logit models which predict the likelihood of binary, yes/no
outcomes, which we use at the end of this subsection). We run a series of models to predict
the likelihood that a school was assigned to Renew, Charter Takeover, or Closure, relative to
the baseline condition of “no change.” We run these models in steps – adding predictors and
groups of predictors – to illustrate how the introduction of controls for student populations
negates any performance difference among the categories. In effect, these models which

13 | P a g e
appear statistically more complicated than the descriptive graphs above, are merely a flip‐side
analysis of the same question.
Table 1 provides the summary statistics from the Multinomial Logistic Regressions including
math performance factors and group assignment. We start with whether Math Growth
Percentiles alone explain the likelihood that a school is given a consequential assignment. The
answer to that question is a simple no. Math Growth Percentiles do not provide any statistically
significant prediction of the likelihood of group assignment. When we use math proficiency
rates alone, excluding growth percentiles and demographics, we find that math proficiency
rates are a marginally statistically significant (p<.10) predictor of group assignment, with lower
math proficiency associated with increased likelihood of assignment only to the renew category
(relative to “no major change”). Even this factor is not significant at conventionally accepted
thresholds (p<.05). Proficiency rates remain a marginal predictor of renew status when growth
percentiles are included.
But, when demographics are added, proficiency is no‐longer a predictor of group assignment.
Notably, neither are demographics. This likely occurs because proficiency, growth percentiles
and demographics are so strongly linked. This finding does not negate the fact there exist
substantive demographic differences across categories and that these differences raise serious
policy concerns. That is, it remains relevant that demographics as an underlying condition
differs significantly across these schools. But it would not be equally logical to argue that it
remains relevant that performance is different across these groups since it is performance that
is moderated by demographics, not the other way around.
As mentioned previously, the number of schools in some of these groups is relatively small,
leading to low likelihood of identifying statistically significant differences. This concern is one
reason why at the end of this section, we collapse schools into two categories: either facing
significant consequences or not, where each group has sufficient sample size.
14 | P a g e
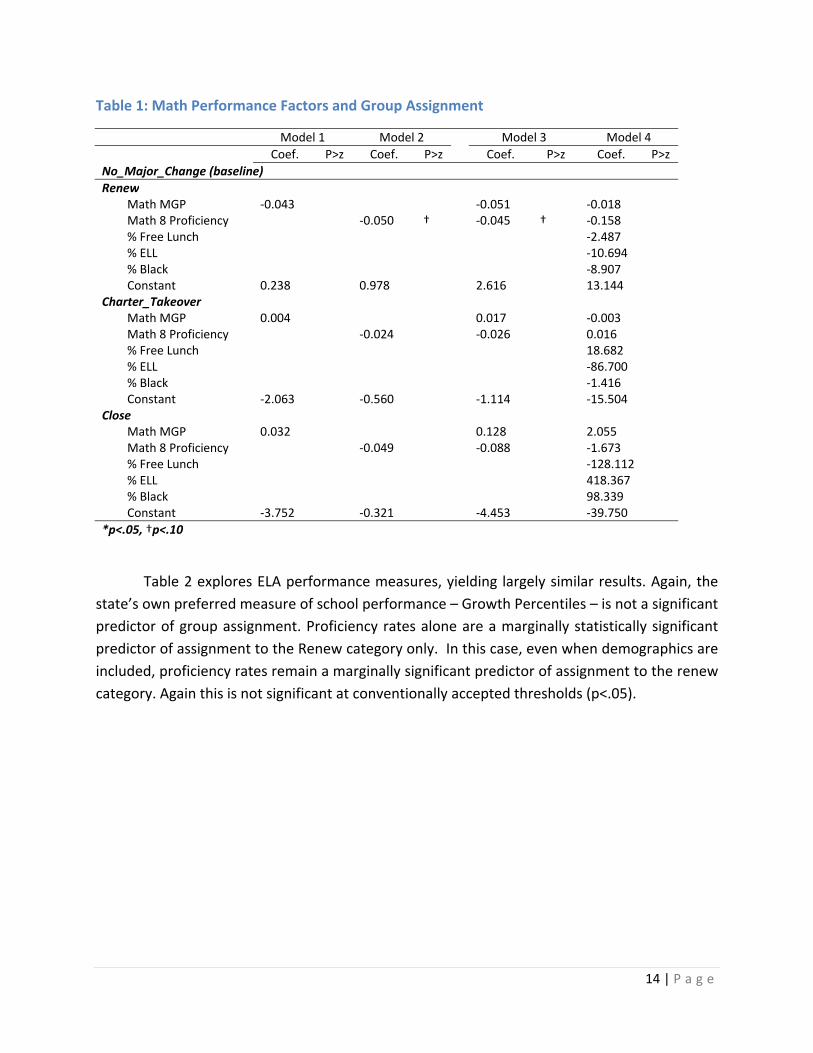
Table 1: Math Performance Factors and Group Assignment
Model 1 Model 2 Model 3 Model 4
Coef. P>z Coef. P>z Coef. P>z Coef. P>z
No_Major_Change (baseline)
Renew Math MGP ‐0.043 ‐0.051 ‐0.018 Math 8 Proficiency ‐0.050 † ‐0.045 † ‐0.158 % Free Lunch ‐2.487 % ELL ‐10.694 % Black ‐8.907 Constant 0.238 0.978 2.616 13.144 Charter_Takeover Math MGP 0.004 0.017 ‐0.003 Math 8 Proficiency ‐0.024 ‐0.026 0.016 % Free Lunch 18.682 % ELL ‐86.700 % Black ‐1.416 Constant ‐2.063 ‐0.560 ‐1.114 ‐15.504 Close Math MGP 0.032 0.128 2.055 Math 8 Proficiency ‐0.049 ‐0.088 ‐1.673 % Free Lunch ‐128.112 % ELL 418.367 % Black 98.339 Constant ‐3.752 ‐0.321 ‐4.453 ‐39.750
*p<.05, †p<.10
Table 2 explores ELA performance measures, yielding largely similar results. Again, the
state’s own preferred measure of school performance – Growth Percentiles – is not a significant
predictor of group assignment. Proficiency rates alone are a marginally statistically significant
predictor of assignment to the Renew category only. In this case, even when demographics are
included, proficiency rates remain a marginally significant predictor of assignment to the renew
category. Again this is not significant at conventionally accepted thresholds (p<.05).

15 | P a g e
Table 2: LAL Performance Factors and Group Assignment
Model 1 Model 2 Model 3 Model 4
Coef. P>z Coef. P>z Coef. P>z Coef. P>z
No_Major_Change (baseline)
Renew LAL MGP ‐0.032 ‐0.086 0.036 LAL 8 Proficiency ‐0.059 † ‐0.056 † ‐0.363 † % Free Lunch ‐18.500 % ELL ‐28.010 % Black ‐19.891 Constant ‐0.079 2.031 5.112 † 44.537 Charter_Takeover LAL MGP ‐0.043 ‐0.110 ‐0.116 LAL 8 Proficiency ‐0.021 ‐0.021 0.063 % Free Lunch 31.851 % ELL ‐76.336 % Black ‐1.586 Constant ‐0.314 ‐0.473 3.607 ‐25.203 Close LAL MGP 0.014 0.116 0.082 LAL 8 Proficiency ‐0.040 ‐0.064 ‐0.013 % Free Lunch 11.492 % ELL 13.499 % Black 6.049 Constant ‐2.942 ‐0.172 ‐3.792 ‐20.133
*p<.05, †p<.10
Table 3 simplifies the above analyses by lumping the outcome measure into two groups –
whether the school faces consequences or not. In this case, we use the same measures to
predict whether a school is effectively “saved” from consequential action. That is, whether the
school was assigned to the “no major change” category, or one of the other categories. The
advantage of this approach is that it places a better balance of schools into our two categories
(avoiding very small sample sizes in any one group). Here, we use odds ratios to express the
relationship, where an odds ratio of 1.0 means “even odds” or that changes in the independent
measure do not affect the odds a school is “saved.” An odds ratio above 1.0 indicates that
increases in the measure are associated with increased odds a school is “saved.” An odds ratio
below 1.0 indicates that increases in the measure are associated with decreased odds a school
is saved.
As in the above models, we find that the state’s new preferred measure of school performance
has no bearing whatsoever on whether a school is spared intervention under One Newark.
Consistent with the previous models, we do find that higher proficiency rates in math or
language arts do increase the odds a school is saved. A 1% increase in proficiency is associated
with a 4% increase in likelihood that the school will not face consequences. Amplified, this does
16 | P a g e
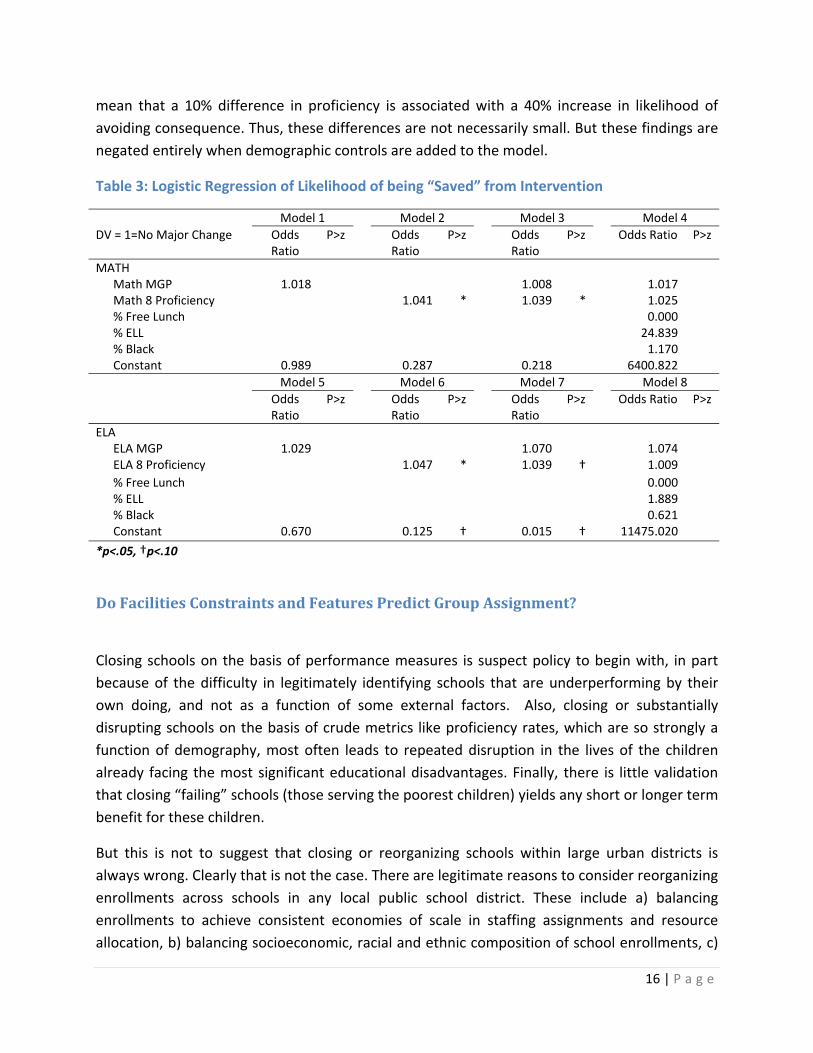
mean that a 10% difference in proficiency is associated with a 40% increase in likelihood of
avoiding consequence. Thus, these differences are not necessarily small. But these findings are
negated entirely when demographic controls are added to the model.
Table 3: Logistic Regression of Likelihood of being “Saved” from Intervention
Model 1 Model 2 Model 3 Model 4
DV = 1=No Major Change Odds Ratio
P>z Odds Ratio
P>z Odds Ratio
P>z Odds Ratio P>z
MATH Math MGP 1.018 1.008 1.017 Math 8 Proficiency 1.041 * 1.039 * 1.025 % Free Lunch 0.000 % ELL 24.839 % Black 1.170 Constant 0.989 0.287 0.218 6400.822
Model 5 Model 6 Model 7 Model 8
Odds Ratio
P>z Odds Ratio
P>z Odds Ratio
P>z Odds Ratio P>z
ELA ELA MGP 1.029 1.070 1.074 ELA 8 Proficiency 1.047 * 1.039 † 1.009
% Free Lunch 0.000 % ELL 1.889 % Black 0.621 Constant 0.670 0.125 † 0.015 † 11475.020
*p<.05, †p<.10
DoFacilitiesConstraintsandFeaturesPredictGroupAssignment?
Closing schools on the basis of performance measures is suspect policy to begin with, in part
because of the difficulty in legitimately identifying schools that are underperforming by their
own doing, and not as a function of some external factors. Also, closing or substantially
disrupting schools on the basis of crude metrics like proficiency rates, which are so strongly a
function of demography, most often leads to repeated disruption in the lives of the children
already facing the most significant educational disadvantages. Finally, there is little validation
that closing “failing” schools (those serving the poorest children) yields any short or longer term
benefit for these children.
But this is not to suggest that closing or reorganizing schools within large urban districts is
always wrong. Clearly that is not the case. There are legitimate reasons to consider reorganizing
enrollments across schools in any local public school district. These include a) balancing
enrollments to achieve consistent economies of scale in staffing assignments and resource
allocation, b) balancing socioeconomic, racial and ethnic composition of school enrollments, c)

17 | P a g e
improving transportation efficiency, d) re‐allocating students to facilities that are more
operationally efficient and safer, healthier environments (utilities, HVAC systems, etc., air
quality, health conditions), and e) balancing building utilization (overcrowding, etc.).
Due to the district’s failure to respond to past open public records requests to turn over state
required Long Range Facilities Plans (LRFP), we have limited measures on which to judge the
facilities logic of school assignments.18 Figure 3 summarizes the percent utilization of buildings
by assignment. Schools slated for no major change are, on average, 17% over capacity. Schools
identified for closure are also over capacity. And schools slated for charter takeover are
somewhat under capacity. But utilization is not a significant predictor of any group assignment.
Figure 3
18 The Education Law Center of New Jersey has made numerous requests in recent years and informed us of the
district’s failure to comply.

18 | P a g e
IsthePremisebehindCharterTakeoverSupportedbytheData?
While the performance of Newark’s charter schools, as judged by state test outcomes, does
vary, there are a few charters schools that have had consistently higher proficiency rates. But
these same schools do not serve the same proportion of students with special education needs,
or who are economically disadvantaged, as the NPS schools.19 The question not addressed by
NPS in its justifications for One Newark, then, is whether there exists any reason to expect that
these same charters can repeat their current successes when educating a population of
students more like those who attend NPS schools; that is, when educating a population that is
substantively different than the children they currently serve.
Figure 4 and Figure 5 display the relationship between proficiency rates on the NJASK Eighth
Grade Math and LAL exams, and the percentage of students in a school who qualify for free
lunch, with schools given different assignments shown as different shapes/colors. Charter
schools are filled diamonds. Schools slated for charter takeover are hollow diamonds. In figure
4 and figure 5, while all of the hollow diamonds do have lower average performance than the
filled diamonds, they also have much higher concentrations of low income children. It would be
a stretch, to say the least, to assert that the filled diamonds could take on the children of the
hollow diamonds and yield their same outcome levels. They’ve never served such a population,
and with respect to the overall distribution of low income students and current outcomes,
charter operators fall largely in line with expectations.
19 Baker, B.D. (2013) Newark Charter Update: A Few New Graphs and Musings. School Finance 101.
http://schoolfinance101.wordpress.com/2013/07/14/newark‐charter‐update‐a‐few‐new‐graphs‐musings/

19 | P a g e
Figure 4: Low Income Concentrations and Math Proficiency

20 | P a g e
Figure 5: Low Income Concentrations and Language Arts Proficiency
Newark’s charter schools do in some cases show comparatively high proficiency rates – but
they also have comparatively low numbers of students who are economically disadvantaged.
The schools that they are slated to be taken over by charter management organizations, in
contrast, have low proficiency rates, but higher proportions of students who qualify for free
lunch. It is worth noting that schools slated for “renewal” and closure also follow this trend.
Figure 4 and 5, however, include only percent free lunch as a factor. As we mentioned earlier in
this brief, Newark charter schools differ substantially from their district counterparts not only
on percent free lunch, but also in terms of concentrations of children with limited English
language proficiency, concentrations of children with disabilities, and concentrations of male
students, all of which seem to affect average performance levels and growth measures.
To assess the ability of NPS schools and Newark charters to educate at‐risk students, we use a
statistical technique ‐‐ linear regression ‐‐ to describe the effects of student backgrounds on
2040
6080
100
NJA
SK 8
LA
L P
rofi
cien
cy
.5 .6 .7 .8 .9 1% Free Lunch
Dist No Change Renew
Charter Takeover CloseCharter
Data Source: NJDOE, 2013 Enrollment file & School Performance Reports

21 | P a g e
school level proficiency rates. We use four variables to describe student population
characteristics: percentage of students who are eligible for free lunch, percentage of students
who have special education needs, percentage of students who are Limited English Proficient
(LEP), and percentage of female students.
Table C1 in the Appendix shows the coefficients of this regression. Nearly 70 percent of the
variation in NJASK proficiency rates on both math and language arts tests can be explained by
free lunch status, special education need, LEP status, and gender.
The remainder of the variation, or “residuals,” describe the differences between what student
characteristics predict and actual test‐based outcomes. That is, the residuals provide a view of
performance, adjusted for differences in demographics, where negative values indicate
performance lower than predicted given students served and positive values indicate
performance higher than expected. Figure 6 shows how NPS and Newark charter schools’
proficiency rates compare to prediction on NJASK‐8 Language Arts tests; One Newark
consequences are color‐coded.
Figure 6

22 | P a g e
Several schools slated for sanction under One Newark do, in fact, perform below prediction;
however, several of these schools perform above prediction, including Miller Street School,
which is slated for closure. Many schools not slated for One Newark consequences perform
below prediction, as do many of the charter schools within the city’s limits.
According to a draft of the One Newark plan published by NJ Spotlight20, NPS has considered
allowing TEAM Academy Charter School (the Newark branch of the national KIPP charter chain)
to take over both Hawthorne and Bragaw schools (the Star‐Ledger reports that Ryan Hill,
Executive Director of TEAM Academy, says the charter operator and NPS remain in
negotiations21). But both of these NPS schools perform above prediction, while TEAM performs
below.
(We also note that North Star Academy, which beats prediction, has engaged in patterns of
student attrition that may advantage its outcomes; see Appendix D: North Star Attrition Rates
for further discussion. According to the draft plan of One Newark published by NJ Spotlight, NPS
at one time did consider allowing North Star to take over Thirteenth Avenue School – MLK.)
Figure 7 shows the same residuals from prediction for NJASK proficiency rates on grade 8 math
tests.
20 http://assets.njspotlight.com/assets/13/1218/0010 21 “Newark school restructuring includes plans to put charters in district buildings.” The Star‐Ledger, 12/18/13.
http://www.nj.com/education/2013/12/newark_school_plan_restructure.html

23 | P a g e
Figure 7
Again, while some schools slated for sanction do perform under prediction, other One Newark
schools do not. And again: both Bragaw and Hawthorne perform above prediction, while TEAM
Academy performs below. By this standard, turning over Hawthorne and Bragaw to TEAM
makes little sense.
In addition, Robert Treat Academy Charter School performs below prediction on both math and
language arts proficiency rates for eighth grade. Yet it is only one of three schools within
Newark’s city limits to win a “Reward” status from the NJDOE (see Appendix, Table B2).
If NJDOE classifications and One Newark consequences are awarded without regard to student
characteristics, why would any Newark school ‐‐ NPS or charter – choose to serve those
students who are economically disadvantaged, have special education needs, or have limited
proficiency in English? For that matter: why would these schools choose to serve as many boys
as girls?

24 | P a g e
ConclusionsandPolicyImplications
One Newark is a program that appears to place sanctions on schools – including closure, charter
takeover, and “renewal” – on the basis of student test outcomes, without regard for student
background. The schools under sanction may have lower proficiency rates, but they also serve
more challenging student populations: students in economic disadvantage, students with
special educational needs, and students who are Limited English Proficient.
There is a statistically significant difference in the student populations of schools that face One
Newark sanctions and those that do not. “Renew” schools serve more free lunch‐eligible
students, which undoubtedly affects their proficiency rates. Schools slated for charter takeover
and closure serve larger proportions of students who are black; those students and their
families may have their rights abrogated if they choose to stay at a school that will now be run
by a private entity.22
There is a clear correlation between student characteristics and proficiency rates on state tests.
When we control for student characteristics, we find that many of the schools slated for
sanction under One Newark actually have higher proficiency rates than we would predict.
Further, the Newark charter schools that may take over those NPS schools perform worse than
prediction.
There is, therefore, no empirical justification for assuming that charter takeovers will work
when, after adjusting for student populations, schools to be taken over actually outperform the
charters assigned to take them over. Further, these charters have no track record of actually
serving populations like those attending the schools identified for takeover.
Our analysis calls into question NPS’s methodology for classifying schools under One Newark.
Without statistical justification that takes into account student characteristics, the school
classifications appear to be arbitrary and capricious.
Further, our analyses herein find that the assumption that charter takeover can solve the ills of
certain district schools is specious at best. The charters in question, including TEAM academy,
have never served populations like those in schools slated for takeover and have not produced
superior current outcome levels relative to the populations they actually serve.
Finally, as with other similar proposals sweeping the nation arguing to shift larger and larger
shares of low income and minority children into schools under private and quasi‐private
22 Green, P.C., Baker, B.C., Oluwole, J. (in press) Having it Both Ways: How Charter Schools try to Obtain Funding of Public Schools and the Autonomy of Private Schools. Emory Law Journal

25 | P a g e
governance, we have significant concerns regarding the protections of the rights of the children
and taxpayers in these communities.

26 | P a g e
Appendix
A. DataSourcesandAnalysis
School enrollment, student characteristics, and student performance data is from the New
Jersey Department of Education.23 We used the following files:
New Jersey School Directory24
2012‐13 Enrollment25
Priority and Focus Schools (pdf, hand coded)26
Reward Schools (pdf, hand coded)27
2011‐12 Performance Report28
Special education rates were taken from the 2012‐13 School Performance Reports.29 These are
pdf files, which required hand coding the data.
NPS building utilization rates were calculated by Danielle Farrie, PhD, Research Director,
Education Law Center30; Dr. Farrie provided us the file on January 6, 2014. We thank Dr. Farrie
her for her assistance with this brief.
Calculations, analysis, and graphics were prepared using Stata statistical software and Microsoft
Excel.
B. OneNewarkClassifications
The NPS “One Newark” plan is explained in several documents published on the onewark.org
website, hosted by the Newark Public Schools. We have used these documents in combination
to determine NPS’s specific plan for each school. The documents are:
Building a System: One Newark31
23 http://www.state.nj.us/education/data/ 24 http://education.state.nj.us/directory/ Downloaded 12/21/13. 25 http://www.state.nj.us/education/data/enr/enr13/stat_doc.htm Downloaded 11/1/13. 26 http://www.state.nj.us/education/reform/PFRschools/PriorityFocusSchools.pdf Downloaded 1/12/14. 27 http://www.state.nj.us/education/reform/PFRschools/RewardSchools.pdf Downloaded 1/12/14. 28 http://education.state.nj.us/pr/database.html Downloaded 11/1/13. 29 http://education.state.nj.us/pr/database.html 30 http://www.edlawcenter.org/ 31 http://onewark.org/wp‐content/uploads/2013/12/Building‐a‐System‐One‐Newark‐Plan.pdf

27 | P a g e
One Newark Long‐Term Ward Plan32
One Newark: School Plans for Families33
All documents were retrieved on December 29, 2013. A draft version of “Building a System:
One Newark – Plan” was published by NJSpotlight34 on December 18, 2013. Largely similar to
the final version published by NPS, the draft specified several charter management
organizations in takeover plans; this was not included in the final publication hosted by NPS.
The documents detail several types of actions for schools under “One Newark”:
“Accelerate progress”: The school remains open without any major restructuring, other
than NPS pledging to “work to continue to improve student outcomes.”
“Renew”: These schools may see a large turnover in staff: “Everyone, both school
leaders and staff, must reapply to the school.” NPS also plans to provide additional
wraparound services, such as meals, adult education classes, and pilots of social services
programs.
“Charter Launch”: A charter operator takes over the school. Students are given
“priority” in their applications if they choose to remain at the school. Staff must,
presumably, reapply to NPS or to the charter operator for their positions.
“Redesign”: “At Redesign Schools, staff will largely remain the same; however, a leader‐
led process will take place to accelerate achievement.”
“Resiting”: A school moves to another facility, but its structure largely stays intact.
“Repurposing”: A facility is used for a different educational purpose.
For this analysis, we created five separate categories of “One Newark” school consequences:
1. No Major Change: Neither the staff nor students will experience a major restructuring.
While some schools may be resited, there will otherwise be little impact on the school.
We have classified many of the schools slated for redesign in this category, as there
appears to be no substantial change in the student body, the staff, or the mission of the
school in NPS documents; however, we recognize that this may change as One Newark
is implemented, and that some of these schools may eventually belong in different
categories.
2. Renew: As staff will have to reapply for their positions, students may see a large change
in personnel. The governance of the school may change in other ways.
32 http://onewark.org/wp‐content/uploads/2013/12/One‐Newark‐Long‐Term‐Ward‐Plan‐FAQ.pdf 33 http://onewark.org/wp‐content/uploads/2013/12/One‐Newark‐School‐Plans‐for‐Families.pdf 34 http://assets.njspotlight.com/assets/13/1218/0010

28 | P a g e
3. Charter Takeover: While students are given “priority” if they choose to apply to the
charter, there appears to be no guarantee they will be accepted.
4. Close: We consider a school “closed” when it ceases to function in its current form, its
building is being divested or repurposed, and it is not being taken over by a charter
operator.
5. Unknown: The “One Newark” documents published by NPS are ambiguous about the
fate of the school.
Table 5 shows our classifications of each NPS school under “One Newark”; footnotes provide
our justifications for several schools. Table 6 lists the charter schools within the Newark city
limits as listed by the New Jersey Department of Education’s School Directory as of the fall of
2013.
TABLE B1
NPS Schools and “One Newark” Consequences (NJDOE EASA Waiver designation in parentheses)
School Name One Newark Consequence
ABINGTON AVENUE SCHOOL No Major Change
ALEXANDER STREET SCHOOL Charter Takeover
ANN STREET SCHOOL No Major Change
ARTS HIGH SCHOOL No Major Change
AVON AVENUE SCHOOL (Priority) No Major Change
American History High School (Reward) No Major Change
BARD EARLY COLLEGE HIGH SCHOOL No Major Change
BARRINGER HIGH SCHOOL (Priority) No Major Change
BELMONT RUNYON ELEMENTARY SCHOOL (Priority) Renew
BENJAMIN FRANKLIN ELEMENTARY SCHOOL No Major Change
BOYLAN EARLY CHILDHOOD CENTER Unknown
BRAGAW AVENUE SCHOOL Charter Takeover
BRANCH BROOK SCHOOL No Major Change
BRUCE STREET SCHOOL FOR THE DEAF No Major Change
CAMDEN STREET ELEMENTARY SCHOOL (Priority) No Major Change
CENTRAL HIGH SCHOOL (Priority) No Major Change
CHANCELLOR AVENUE ANNEX35 Close
CHANCELLOR AVENUE SCHOOL (Focus) No Major Change
CLEVELAND Eighteenth Avenue School36 No Major Change
35 Slated to be repurposed as an early childhood center. Chancellor Avenue Annex and Chancellor Avenue School are listed with separate school codes in NJDOE files; however, both schools are managed by the same principal. 36 The Eighteenth Avenue School building was closed in 2013; Cleveland Avenue School assumed its state school code when the school populations merged.

29 | P a g e
School Name One Newark Consequence
DAYTON STREET SCHOOL at Peshine Avenue37 (Priority) No Major Change
DR WILLIAM H HORTON ELEMENTARY SCHOOL (Focus) Renew
Dr. E. ALMA FLAGG SCHOOL (Focus) Renew
EAGLE ACADEMY No Major Change
EARLY CHILDHOOD ACADEMY OF EXCELLENCE No Major Change
EAST SIDE HIGH SCHOOL (Focus) No Major Change
ELLIOTT STREET ELEMENTARY SCHOOL (Focus) No Major Change
Early Childhood Academy ‐ West No Major Change
FAST TRACK SUCCESS ACADEMY (Focus) Unknown
FIRST AVENUE SCHOOL No Major Change
FOURTEENTH AVENUE SCHOOL No Major Change
G.W. CARVER ELEMENTARY SCHOOL (Priority) Renew
GIRLS ACADEMY OF NEWARK No Major Change
HARRIET TUBMAN ELEMENTARY SCHOOL No Major Change
HAWKINS STREET SCHOOL (Focus) Renew
HAWTHORNE AVENUE SCHOOL (Priority) Charter Takeover
IVY HILL ELEMENTARY SCHOOL (Focus) No Major Change
JOHN F KENNEDY SCHOOL No Major Change
LAFAYETTE STREET SCHOOL No Major Change
LINCOLN No Major Change
LOUISE A SPENCER ELEMENTARY SCHOOL (Priority) Renew
LUIS MUNOZ MARIN ELEMENTARY SCHOOL38 Renew
MADISON AVENUE ELEMENTARY SCHOOL Charter Takeover
MALCOLM X SHABAZZ HIGH SCHOOL (Priority) No Major Change
MAPLE AVENUE SCHOOL Close
MCKINLEY (Focus) No Major Change
MILLER STREET SCHOOL39 (Focus) Close
MT VERNON PLACE SCHOOL (Focus) No Major Change
N J REGIONAL DAY SCHOOL ‐ NEWARK No Major Change
NEWARK BRIDGES HIGH SCHOOL No Major Change
NEWARK EVENING HIGH Close
NEWARK INNOVATION ACADEMY (Focus) Unknown
NEWARK LEADERSHIP ACADEMY No Major Change
NEWARK VOCATIONAL HIGH SCHOOL (Priority) No Major Change
NEWTON STREET SCHOOL Charter Takeover
37 The Dayton Street School building was closed in 2012; Peshine Avenue School assumed its state school code when the school populations merged. 38 Performance data for Marin is incomplete in the NJDOE data files. 39 According to NPS documents: “Redesign Miller and resite to Spencer: School will remain open and staff will move with the school (unless they choose to apply elsewhere). The whole school will be moved to a better facility.” Spencer, however, is scheduled for “renewal,” and it is unclear whether Miller St. will retain its autonomy. Given this, and as the building is scheduled for divestment, we judge Miller St. to be “closed.”

30 | P a g e
School Name One Newark Consequence
Newark Early College High School No Major Change
OLIVER STREET SCHOOL No Major Change
PARK ELEMENTARY SCHOOL No Major Change
QUITMAN COMMUNITY SCHOOL (Priority) No Major Change
RAFAEL HERNANDEZ SCHOOL (Focus) Renew
RIDGE STREET SCHOOL No Major Change
ROBERTO CLEMENTE ELEMENTARY SCHOOL No Major Change
ROSEVILLE AVENUE SCHOOL Close
SCIENCE PARK HIGH SCHOOL (Reward) No Major Change
SOUTH SEVENTEENTH STREET SCHOOL (Focus) No Major Change
SOUTH STREET ELEMENTARY SCHOOL No Major Change
SPEEDWAY AVENUE SCHOOL Renew
SUSSEX AVE SCHOOL Burnet St School (Focus)40 No Major Change
THIRTEENTH AVENUE SCHOOL M L KING41 (Priority) No Major Change
Technology High School No Major Change
UNIVERSITY HIGH SCHOOL No Major Change
WEEQUAHIC HIGH SCHOOL Close
WEST SIDE HIGH SCHOOL (Priority) Close
WILSON AVENUE SCHOOL No Major Change
40 The Burnet Street School was closed in 2013; Sussex Avenue School assumed its state school code when the school populations merged. 41 Dr. Martin Luther King, Jr. School was closed in 2013; Thirteenth Avenue School assumed its state school code when the school populations merged.

31 | P a g e
TABLE B2
Charter Schools within Newark City Limits (NJDOE EASA Waiver designation in parentheses)
DISCOVERY CS
GRAY CS
GREATER NEWARK CS
Great Oaks Charter School
MARIA L. VARISCO‐ROGERS
MARION P. THOMAS CS
Merit Prep CS of Newark
NEW HORIZONS COMM. CS
NEWARK EDUCATORS CHARTER
NEWARK LEGACY CS
NORTH STAR ACAD. CS OF N
Newark Prep
Paulo Freire CS
People's Preparatory Charter
Phillip's Academy CS
ROBERT TREAT ACADEMY CS (Reward)
Roseville Community CS
TEAM ACADEMY CHARTER SCH
UNIVERSITY HEIGHTS CS
VISIONS ACADEMY CS

32 | P a g e
C. AdditionalModelResults
Table C1
Regression Estimates for 8th Grade NJASK Model Outcomes
8th Grade NJASK‐Language Arts 8th Grade NJASK‐Math
Independent
Variables Coef. Std. Err. P>|t| Coef. Std. Err. P>|t|
% Free Lunch ‐108.894 24.979 ** ‐146.642 31.870 **
% LEP 55.681 26.265 * 82.581 32.282 *
% Special Education ‐35.850 40.420 ‐45.268 50.741
% Female 194.695 66.289 ** 181.044 87.379 *
Constant 53.444 45.915 79.795 60.982
R‐squared 0.680 0.680
N 43 41
*p<.05, **p<.01
Table C2
Multinomial Logistic Regression of Facilities Factors on Group Assignment
Coef. Std. Err. P>z
No_Major_Change
Renew % Utilization ‐0.915 Square Ft per Pupil (ln) 0.241 Constant ‐1.913 Charter_Takeover % Utilization ‐7.218 Square Ft per Pupil (ln) ‐2.835 Constant 19.168 Close % Utilization ‐2.166 Square Ft per Pupil (ln) ‐1.453 Constant 7.800
*p<.05, †p<.10

33 | P a g e
D. NorthStarAcademyAttritionRates
Our analysis of whether schools “beat the odds” ranks NPS schools and Newark charter schools
by the amount that eighth grade student proficiency rates are above or below prediction, based
on linear regression. In our analysis, we show North Star Academy Charter School (the Newark
branch of the national Uncommon Schools CMO42) performs substantially over prediction on
both math and language arts tests.
What our analysis does not show, however, is that North Star has consistently engaged in
patterns of significant student attrition. Figure D1 shows student enrollment rates for the last
six cohorts of North Star students for which we have data.
Figure D1
The decrease in student enrollment between fifth and eighth grade may be a significant
contributing factor in North Star’s ability to perform better than prediction on NJASK‐8 tests.
See “Friday Story Time: Deconstructing the Cycle of Reformy Awesomeness”
(http://schoolfinance101.wordpress.com/2013/10/25/friday‐story‐time‐deconstructing‐the‐
cycle‐of‐reformy‐awesomeness/) for a more detailed discussion.
42 http://northstar.uncommonschools.org/
34 | P a g e
AuthorBiographies:
Mark Weber is a current doctoral student in the Department of Educational, Theory, Policy and
Administration at Rutgers, the State University of New Jersey in New Brunswick. He is currently
a public school teacher in New Jersey.
Bruce Baker is a Professor in the Department of Educational, Theory, Policy and Administration
at Rutgers, the State University of New Jersey in New Brunswick where he teaches courses in
quantitative analysis, school finance and education policy, and public school law. He has
authored numerous peer reviewed articles on education policy, the economics of education
and school finance, and has authored numerous law review articles pertaining to school
funding equity, teacher evaluation and most recently the legal relevance of public‐private
governance distinctions in charter schooling.
© 2014. All rights reserved.