RESEARCH ARTICLE Open Access Imputation of missing values ...
An Empirical Comparison of Multiple Imputation
Methods for Categorical Data
Olanrewaju Akande, Fan Li and Jerome Reiter ˚
Abstract
Multiple imputation is a common approach for dealing with missing values in statistical databases.
The imputer fills in missing values with draws from predictive models estimated from the ob-
served data, resulting in multiple, completed versions of the database. Researchers have devel-
oped a variety of default routines to implement multiple imputation; however, there has been
limited research comparing the performance of these methods, particularly for categorical data.
We use simulation studies to compare repeated sampling properties of three default multiple
imputation methods for categorical data, including chained equations using generalized lin-
ear models, chained equations using classification and regression trees, and a fully Bayesian
joint distribution based on Dirichlet Process mixture models. We base the simulations on cat-
egorical data from the American Community Survey. In the circumstances of this study, the
results suggest that default chained equations approaches based on generalized linear models
˚Olanrewaju Akande is PhD student, Department of Statistical Science, Duke University, Durham, NC 27708 (E-mail: [email protected]); Fan Li is Associate Professor, Department of Statistical Science, Duke Univer-sity, NC 27708 (E-mail: [email protected]); and Jerome P. Reiter is Professor of Statistical Science, Duke University,Durham, NC 27708 (E-mail: [email protected]). This research was supported by grants from the National ScienceFoundation (SES-11-31897) and the Alfred P. Sloan Foundation (G-2015-20166003).
1
arX
iv:1
508.
0591
8v2
[st
at.C
O]
23
Dec
201
6

are dominated by the default regression tree and Bayesian mixture model approaches. They
also suggest competing advantages for the regression tree and Bayesian mixture model ap-
proaches, making both reasonable default engines for multiple imputation of categorical data.
A supplementary material for this article is available online.
Key words: latent, missing, mixture, nonresponse, tree
1. INTRODUCTION
Nearly all sample surveys and censuses suffer from item nonresponse, e.g., individuals do not
answer some questions. It is well-known that statistical analyses based on only the complete cases
(with all variables observed) or available cases (with all variables observed for the specific analy-
sis) can be problematic. At best, such analyses are inefficient, as they sacrifice information from
partially observed responses. At worst, they result in biased inferences when there are systematic
differences between the observed data and the missing data (Rubin 1976). See Little and Rubin
(2002) for additional discussion of the drawbacks of complete/available case analysis.
A common approach to handling item nonresponse is multiple imputation (MI) (Rubin 1987).
In MI, the analyst creates multiple, completed datasets by replacing the missing values with draws
from (posterior) predictive distributions estimated with the observed data. The analyst estimates
quantities of interest using each completed data set, and combines the estimates using methods
developed by Rubin (1987). This process incorporates the additional uncertainty from the missing
data in inferences. The completed datasets also can be released as public use files. For reviews of
MI, see Rubin (1996); Schafer (1997); Barnard and Meng (1999); Reiter and Raghunathan (2007);
2

Harel and Zhou (2007).
When implementing MI, most analysts adopt one of two general classes of strategies: joint
modeling (JM) and fully conditional specification (FCS) (van Buuren 2007). In the JM strategy, the
analyst specifies a joint distribution for all variables in the data. Imputations are sampled from the
implied conditional distributions of the variables with missing data, given all other variables. The
JM strategy is appealing, in that it accords with the theory in Rubin (1987). In practice, however,
specifying accurate joint distributions for large numbers of variables can be challenging. Indeed,
most popular JM approaches — such as AMELIA (Honaker et al. 2011), proc MI in SAS (Yang
2011), and the routine “norm” in R (Schafer 1997) — make a simplifying assumption that the
data follow multivariate Gaussian distributions, even for categorical variables. Another option for
categorical data is to use a log-linear model; this is implemented in the R package “cat” (Schafer
1997).
In the FCS strategy, the analyst directly specifies and samples from the univariate distributions
of each variable conditional on all other variables, without first forming a proper joint distribution.
The most popular FCS approach is known as multiple imputation by chained equations (MICE),
which uses generalized linear models for each conditional distribution (Raghunathan et al. 2001;
van Buuren and Groothuis-Oudshoorn 2011; Royston and White 2011; Su et al. 2011). The main
strength of MICE lies in its simplicity and flexibility — one can tailor the predictive model for
individual variables, e.g., use a logistic regression for binary variables and a linear regression for
continuous variables. However, MICE lacks theoretical basis in that the specified univariate condi-
tional distributions may not be compatible (Arnold and Press 1989; Gelman and Speed 1993); that
is, the set of the conditional distributions may not correspond to any joint distribution. Therefore,
3

MICE defines a potentially incompatible Gibbs sampler (Li et al. 2014). Despite this theoretical
drawback, simulation-based research suggests that MICE performs well in practice (Brand 1999;
van Buuren et al. 1999; Raghunathan et al. 2001; Rubin 2003; van Buuren et al. 2006; van Buuren
2007, to name a few). Software packages implementing MICE include “IVEware” in SAS (Raghu-
nathan et al. 2002), “mice” (van Buuren and Groothuis-Oudshoorn 2011; van Buuren 2012) and
“mi” in R (Su et al. 2011), and “mi” and “ice” in STATA (Royston and White 2011).
When the data include a large number of exclusively categorical variables, analysts imple-
menting MI face a challenging task. When using log-linear models for a JM approach, the space of
possible models is enormous due to the large number of potential interaction effects, making it dif-
ficult to select an imputation model. Similar model selection issues plague MICE approaches, e.g.,
when specifying a multinomial logistic regression model for a multi-valued variable with missing
data. Many analysts default to including main effects only; indeed, this is the default option in
most popular MICE packages.
Motivated by these shortcomings, several authors have developed more flexible, default MI en-
gines for both strategies. For JM imputation, Si and Reiter (2013) and Manrique-Vallier and Reiter
(2014a,b) use Dirichlet process mixture of products of multinomial distributions (DPMPM), which
are nonparametric Bayesian versions of the latent class models used by Vermunt et al. (2008).
The DPMPM imputation routines are implemented in the R software package, “NPBayesImpute”
(Manrique-Vallier et al. 2014). For FCS imputation, Burgette and Reiter (2010) and van Buuren
(2012) use classification and regression trees (CART). MI via trees is available as an option in
“mice” in R. Independently, these techniques have shown promise as general-purpose routines
for MI, suggesting that they may be preferable to default applications of MICE. However, to our
4

knowledge, these two techniques have never been compared in simulation contexts with large-
dimensional, genuine categorical data, nor have they been compared to default implementations of
chained equations with generalized linear models. These lack of comparisons make it difficult, if
not impossible, to assess the relative merits of each procedure.
In this article, we compare these three MI methods for categorical data using repeated sam-
pling simulations. Using hypothetical populations comprising data from the American Community
Survey (ACS), we find that the DPMPM and CART imputation engines (which we label with MI-
DPM and MI-CART, respectively) result in better repeated sampling performance than the standard
chained equations via generalized linear models (which we label with MI-GLM). The results sug-
gest competing advantages for the MI-CART and MI-DPM approaches, depending on the sample
size and amount of missing data. Both procedures are sensible default choices for MI of categorical
data.
The remainder of this article is organized as follows. In Section 2, we review the three methods
for MI with categorical data. In Section 3, we describe the simulation design and results with ACS
data. In Section 4, we conclude with general lessons learned and some suggestions for practical
implementation.
2. MULTIPLE IMPUTATION FOR CATEGORICAL DATA
We first introduce notation for describing MI in the context of categorical data. Let Yij P
t1, . . . , Dju be the value of variable j for individual i, where j “ 1, . . . , p and i “ 1, . . . , n. For
each individual i, let Yi “ pYi1, . . . , Yipq. Let Y “ pY1, . . . ,Ynq be the n ˆ p matrix comprising
5

the data for all records included in the sample. We write Y “ pYobs,Ymisq, where Yobs and
Ymis are respectively the observed and missing parts of Y. We write Ymis “ pYmis1, . . . ,Ymispq,
where Ymisj represents all missing values for variable j, where j “ 1, . . . , p. Similarly, we write
Yobs “ pYobs1, . . . ,Yobspq for the corresponding observed data.
In MI, the analyst generates values of Ymis using models estimated with Yobs. This results in
a completed dataset Yplq. The analyst draws L completed datasets, tYplq : l “ 1, . . . , Lu, that are
available for dissemination or analysis.
2.1 Overview of MI-GLM
In MI-GLM, we generate imputations from a sequence of predictive distributions derived
from univariate generalized linear models. The approach proceeds as follows. We first specify
an order for imputing the variables. For example, the “mice” package in R by default imputes
the variables in the order that they appear in the data matrix (although a different order can be
specified by the user), and the “IVEWare” package imputes variables in increasing order of the
number of missing cases. Suppose that r0 ď p variables have missing values, and that r1 “ p´ r0
variables are fully complete. Let the ordered list of variables be defined as pYp1q, . . . , Yppqq, where
any variable with no missing values is put at the end of the list. We next fill in initial imputations
at the missing values. These can be obtained from random draws from the observed marginal
distributions for each variable with missing data (the “mice” package in R does this). Alternatively,
for each variable j with missing values, we can sample from conditional distributions, pYpjq |
Yp1q, . . . , Ypj´1q, Ypr0`1q, . . . , Yppqq, where each model is estimated on the available cases for that
model.
6

With this initial set of completed data, we now use an iterative process akin to a Gibbs sampler
to update the imputations. At each iteration t of the updating, we estimate the predictive model,
pYp1q | Yobsp1q, tYupt´1qpkq : k ą 1uq, where Y
pt´1qpkq includes the set of observed and imputed values
for variable k at iteration t ´ 1. We replace Ypt´1qmisp1q with draws from this conditional distribution,
Yptqmisp1q. We repeat this process for each variable j with missing data, estimating and imputing from
each predictive model, pYpjq | Yobspjq, tYptqpkq : k ă ju, tY
pt´1qpkq : k ą juq. We repeat the cycle t ą 1
times. The values at the final iteration are used to create the completed dataset, Yplq “ pYobs,Yplqmisq.
The entire process is replicated L times to create the full set of multiple imputations.
For categorical data, most implementations of MI-GLM use logistic regressions for binary
variables, multinomial logistic regressions for unordered variables, and cumulative logistic regres-
sions for ordered variables. The default specification of the predictor functions is to include main
effects only for all p ´ 1 variables. It is possible to remove predictors from and add interactions
to certain univariate conditionals using special commands; for “mice” in R, the predictorMatrix
argument can be used to add or remove predictors and the passive imputation option can be used
to add interactions. For Ypjq corresponding to unordered categorical variables with large numbers
of levels, multinomial logistic regressions can have large numbers of parameters, which can result
in unstable coefficient estimates with high standard errors.
2.2 Overview of MI-CART
CART for categorical data (Breiman et al. 1984), originally developed for classification, can
be modified to be an imputation engine. For any outcome Ypjq, CART recursively partitions the
predictor space in a way that can be effectively represented by a tree structure, with leaves corre-
7
Root
A C L5
L1 L2 L3 L4
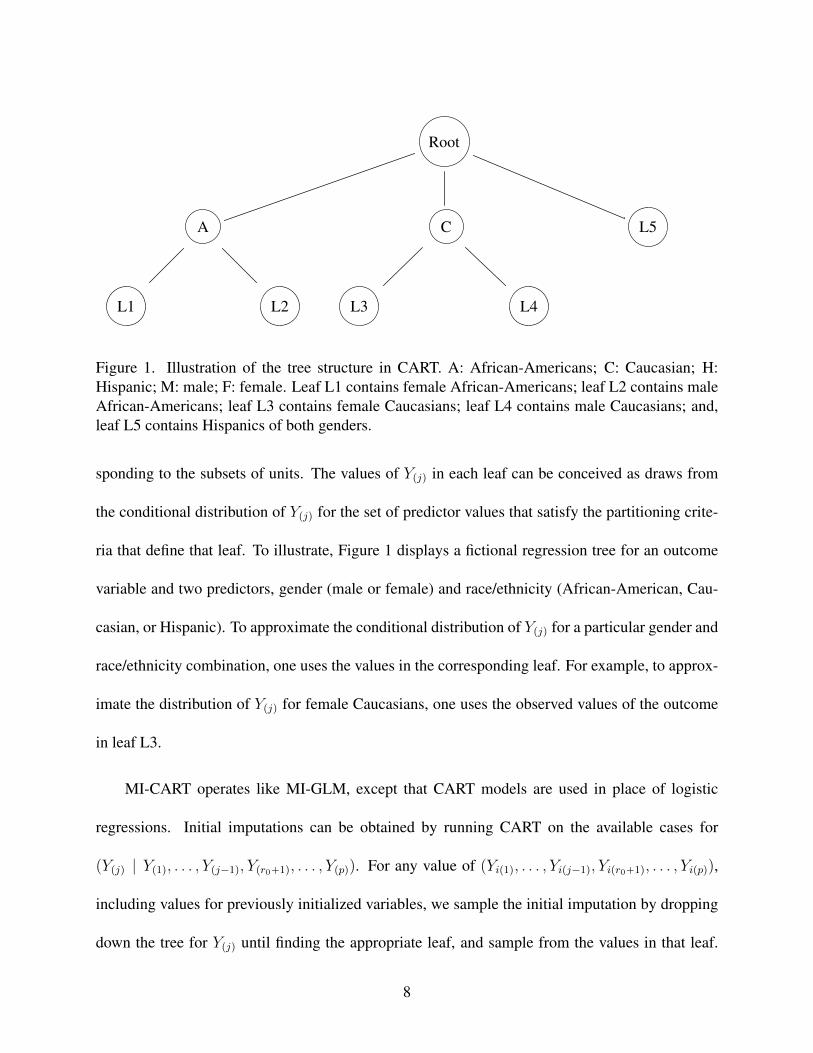
Figure 1. Illustration of the tree structure in CART. A: African-Americans; C: Caucasian; H:Hispanic; M: male; F: female. Leaf L1 contains female African-Americans; leaf L2 contains maleAfrican-Americans; leaf L3 contains female Caucasians; leaf L4 contains male Caucasians; and,leaf L5 contains Hispanics of both genders.
sponding to the subsets of units. The values of Ypjq in each leaf can be conceived as draws from
the conditional distribution of Ypjq for the set of predictor values that satisfy the partitioning crite-
ria that define that leaf. To illustrate, Figure 1 displays a fictional regression tree for an outcome
variable and two predictors, gender (male or female) and race/ethnicity (African-American, Cau-
casian, or Hispanic). To approximate the conditional distribution of Ypjq for a particular gender and
race/ethnicity combination, one uses the values in the corresponding leaf. For example, to approx-
imate the distribution of Ypjq for female Caucasians, one uses the observed values of the outcome
in leaf L3.
MI-CART operates like MI-GLM, except that CART models are used in place of logistic
regressions. Initial imputations can be obtained by running CART on the available cases for
pYpjq | Yp1q, . . . , Ypj´1q, Ypr0`1q, . . . , Yppqq. For any value of pYip1q, . . . , Yipj´1q, Yipr0`1q, . . . , Yippqq,
including values for previously initialized variables, we sample the initial imputation by dropping
down the tree for Ypjq until finding the appropriate leaf, and sample from the values in that leaf.
8

Burgette and Reiter (2010) suggest an additional step before sampling values within the leaves,
namely to use Bayesian bootstraps within each leaf (holding constant the number of observations
in each leaf) to create the pools from which to sample. The Bayesian bootstrap incorporates un-
certainty about the distributions in each leaf. As with MI-GLM, the process is cycled t ą 1 times,
resulting in a completed dataset. We note, however, that this imputation routine does not incorpo-
rate uncertainty about the split points in the trees.
CART algorithms, and hence MI-CART, can struggle with categorical predictors with many
levels. For example, a categorical predictor with 32 levels results in over two billion potential
partitions, making it computationally difficult to run the algorithm in sensible time with standard
computers.
2.3 Overview of MI-DPM
The MI-DPM procedure assumes that the distribution of the categorical data can be char-
acterized using a latent class model. We assume that all combinations of variables are possi-
ble a priori – that is, there are no structural zeros (Si and Reiter 2013). Each individual be-
longs to one of K ă 8 latent classes. Within each class, all variables follow independent
multinomial distributions. To express this as a formal probability model, let zi P p1, . . . , Kq
represent the latent class of individual i; πk “ Prpzi “ kq, for k “ 1, . . . , K, be the prob-
ability of being in latent class k; λkjy “ PrpYij “ y | zi “ kq be the probability that vari-
able Yij takes on the value y for records in latent class k. Also, let π “ pπ1, . . . , πKq, and let
9

λ “ tλkjy : k “ 1, . . . , K; j “ 1, . . . , p; y “ 1, . . . , Dju. We have
Yij | zi,λindep„ Discrete1:Dj
pλzij1, . . . , λzijDjq for all i and j (1)
zi | πiid„ Discrete1:Kpπ1, . . . , πKq for all i. (2)
We can express the marginal probability of any quantity by averaging over the latent classes; for
example,
PrpYi1 “ y1, . . . , Yip “ yp | λ,πq “Kÿ
k“1
πk
pź
j“1
λkjyj . (3)
Although variables are independent within classes, averaging over classes can result in dependence
among the variables. Dunson and Xing (2009) show that, with large enough K, this model is
consistent for any joint probability distribution.
For prior distributions, Si and Reiter (2013) and Manrique-Vallier and Reiter (2014b) use a
truncated version of the stick-breaking representation of the Dirichlet process proposed by Dunson
and Xing (2009),
pλkj1, . . . , λkjDjq
indep„ Dirichletp1Dj
q (4)
πk “ Vkź
hăk
p1´ Vhq (5)
Vkiid„ Betap1, αq for k “ 1, . . . , K ´ 1;VK “ 1 (6)
α „ Gammap0.25, 0.25q. (7)
This prior distribution facilitates efficient computation while allowing the data to dominate the
posterior distribution.
10

To set K, we recommend the approach in Si and Reiter (2013) and Manrique-Vallier and Re-
iter (2014b). The analyst starts with a modest value, say K “ 20. In each iteration of the MCMC,
the analyst can compute the number of classes that have at least one individual. If the number of
occupied classes reaches K across any of the iterations, then the analyst should increase K and
repeat. As long as K is large enough, the estimated posterior distribution is largely insensitive to
the value of K. The iterative method of selecting K primarily serves to improve computational
efficiency, as it avoids estimating parameters for many empty (and essentially irrelevant) classes.
Posterior inferences are obtained via a Gibbs sampler. Missing values are handled within the
sampler. Given a draw of the parameters and observed data, one samples a value of the latent class
indicator for the record using (2). Given a draw of the latent class indicator, one samples values
for the missing items using independent draws from (1). The independence of variables within the
latent classes facilitates computation and imputation in datasets with many categorical variables.
The MI-DPM approach can be adapted for categorical data with structural zeros (Manrique-Vallier
and Reiter 2014a), and it is not limited to a maximum number of levels. Because it relies on a
coherent joint model, the MI-DPM engine can be the building block for handling more complicated
missing data situations, including nonignorable nonresponse (Si et al. 2015) and measurement error
(Manrique-Vallier and Reiter 2015).
3. REPEATED SAMPLING EVALUATIONS
We base the simulation studies on data from the public use microdata files from the 2012 ACS,
available for download from the United States Bureau of the Census (http://www2.census.
gov/acs2012_1yr/pums/). As brief background, the ACS is sent to about 1 in 38 households
11

in the United States, with the goal of enabling estimation of population demographics and housing
characteristics at small geographies, e.g., at census tracts. For each sampled household, the survey
includes questions about the individuals living in the household (e.g., their ages, races, incomes)
and about the characteristics of the housing unit (e.g., number of bedrooms, presence of running
water or not, presence of a telephone line or not). The public use data include about 1.5 million
housing units.
To construct the population data for the simulation, we treat the housing unit as the unit of
analysis. We disregard data on individual people but keep ACS summaries of family compositions
that can be viewed as household-level variables (e.g., presence of children or not, number of work-
ers in household). We remove all identification variables (serial number, region, state, area code
and division), variables corresponding to allocation flags (binary variables indicating if the corre-
sponding variables have been imputed), variables corresponding to replicate survey weights, and
all continuous variables. To simplify comparisons, we eliminate structural zeros — i.e., impossible
combinations of categories like a married 12-year old — by removing variables or levels. We also
delete about 830,000 units corresponding to vacant houses and households with single occupants,
again to avoid structural zeros. The final data comprise 671,153 housing units and 35 categorical
variables. We treat these as a population from which to sample. We treat all variables as unordered
categorical variables to simplify imputation modeling and analysis. The data comprise 11 binary
variables (seven of which have marginal probabilities very close to one or zero), 17 variables with
three to nine levels, and 7 variables with ten or more levels. The variables are described in Table 1
in the supplementary material.
We simulate the processes of random sampling and nonresponse repeatedly, so as to ex-
12

amine frequentist properties of the three imputation procedures. We take samples of size n P
t1000, 10000u and randomly blank either 30% or 45% of the values of each variable independently
across variables. This results in data that are missing completely at random (MCAR), which is the
most favorable scenario for all MI procedures. We also create a missing at random (MAR) sce-
nario with n “ 10000 and a 30% missingness rate. In each sample, we use MI-GLM, MI-CART,
and MI-DPM to create three sets of L “ 10 completed datasets. We repeat the process 200 times,
each time generating new samples and new missingness patterns. We note that the missing data
mechanism tends to result in datasets with 10 or fewer cases with all variables measured, making
complete case analysis untenable.
To implement both MI-GLM and MI-CART, we use the “mice” package in R (van Buuren
and Groothuis-Oudshoorn 2014). For MI-GLM, we use the default choices for binary and nominal
variables with two or more levels: logistic regressions with main effects for all variables. For MI-
CART (the “cart” option in “mice”), we use the default arguments for fitting the trees, e.g., at least
four observations in any terminal node. We run both MI-GLM and MI-CART for t “ 10 cycles as
suggested in van Buuren and Groothuis-Oudshoorn (2011). To implement the DPMPM, we use the
“NPBayesImpute” package in R developed by Manrique-Vallier et al. (2014). We set the number
of latent classes K “ 35, which appears sufficiently large based on tuning with initial runs. We
run each MCMC chain for 10000 iterations using the first 2000 as burn-in.
3.1 Performance Measures
We evaluate the MI methods using sets of marginal probabilities, bivariate probabilities, and
trivariate probabilities. We consider only estimands that satisfy np ą 10 and np1´pq ą 10, where
13

p is the probability in the population, to eliminate estimands where the central limit theorem is
not likely to hold even with no missing data. For each estimand, we use each set of L completed
datasets to compute point and interval estimates via the methods of Rubin (1987). As a brief review,
let q be the completed-data point estimator of some estimand Q, and let u be the estimator of
variance associated with q. For l “ 1, . . . , L, let ql and ul be the values of q and u in completed
dataset Yplq. We use q “řL
l“1 ql{L as the point estimate of Q. We use T “ p1 ` 1{Lqb ` u
as the estimated variance of q, where b “řL
l“1pql ´ qq2{pL ´ 1q and u “řL
l“1 ul{L. We form
95% confidence intervals using pq ´ Qq „ tvp0, T q, where tv is a t-distribution with v “ pL ´
1qp1 ` u{rp1 ` 1{Lqbsq2 degrees of freedom. Multiple imputation inferences require that (i) the
central limit theorem applies for the complete-data estimate, and (ii) the sampling distribution of
the complete-data point estimates is approximately normal. When p is near zero or one, these
conditions may not hold, which can result in unreliable inferences including intervals that include
zero or one.
For each estimand, we compare the three MI procedures by two metrics. We also com-
pute these metrics for estimates based on the sampled data before introduction of missing values.
First, we compute the proportion of the two hundred 95% confidence intervals that contain the
corresponding Q from the full ACS data. Second, we compute the relative mean squared error
(Rel.MSE) for q, defined as
Rel.MSE “ř200
h“1pqphq ´Qq2
ř200h“1pq
phq ´Qq2, (8)
where qphq is the value of q in simulation h, and qphq is the estimate of Q from the sampled data
before introduction of missing values in simulation h.
14

3.2 Summary of results
In our initial experiments, MI-GLM crashed when the data include more than one nominal
variable with more than ten categories. This results from problems estimating the multinomial
logistic regressions with many outcome levels. Therefore, we consider two types of simulations.
In the first type, we remove the seven variables with more than ten categories, leaving 28 variables,
in order to allow comparisons across all three procedures. In the second type, we include the
seven variables and compare only MI-CART and MI-DPM. We summarize results using graphical
displays and tables. In all plots, MI-GLM is abbreviated as GLM, MI-CART as CART, MI-DPM
as DPM, and the pre-missing data results as NO. Median coverage rates across all estimands for
each scenario are available in the supplementary material. In all tables, the entries are summaries
of the Rel.MSEs combined over all relevant probabilities; e.g., the 25th, 50th, and 75th percentiles
of the Rel.MSEs for all marginal probabilities. For all results, Monte Carlo standard errors for
the coverage rates and the reported summaries of the Rel.MSEs are sufficiently small to rule out
chance error as explanation for apparent differences in the results.
3.2.1 Simulations with n “ 10000 and 30% MCAR
We first create scenarios with n “ 10000 using the MCAR mechanism with the 30% miss-
ingness rate. Including all 28 variables, we have 98 marginal probabilities, 3343 bivariate proba-
bilities, and 58778 trivariate probabilities. Typically, to create L “ 10 completed datasets with a
standard desktop computer, MI-GLM runs for about 1 hour and 54 minutes, MI-CART runs for
about 45 minutes, and MI-DPM runs for about 50 minutes.
15

Figure 2. Simulated coverage rates for MI-GLM, MI-CART, MI-DPM, and the pre-missing dataintervals when n “ 10000 with 30% values MCAR. We exclude seven variables with more thanten levels, resulting in p “ 28 variables for imputation and analysis.
Figure 2 displays the simulated coverage rates of the 95% confidence intervals based on the
28 variables. For most estimands, all three MI methods result in reasonable coverage rates. All
three distributions are skewed to the left, particularly for the bivariate and trivariate probabilities.
Overall among the three MI procedures, MI-GLM tends to result in the most coverage rates far
from the nominal 95% level. MI-CART offers the fewest extremely low coverage rates. MI-DPM
tends to result in the highest coverage rates, although it also has many low rates for bivariate and
trivariate probabilities. Across all MI methods, the lowest coverage rates tend to be associated
with seven binary variables with marginal probabilities very close to one in the population. These
variables include questions about the presence of bathtubs, refrigerators, running water, sinks,
stoves, telephones and flush toilets in the households.
Table 1 displays the values of Rel.MSE for all q. The MI-GLM procedure tends to result
in the most inaccurate point estimates, and the MI-CART procedure tends to result in the most
16

Table 1. Distributions of relative mean squared errors when n “ 10000 and 30% values MCAR.We exclude seven variables with more than ten levels, resulting in p “ 28 variables for analysisbetween MI-GLM, MI-CART, and MI-DPM.
Marginal Bivariate TrivariateGLM CART DPM GLM CART DPM GLM CART DPM
Min. 1.0 1.0 1.0 1.0 0.6 0.6 0.6 0.6 0.41st Qu. 1.4 1.2 1.3 1.4 1.2 1.2 1.3 1.1 1.2Median 1.6 1.4 1.5 1.6 1.4 1.4 1.5 1.3 1.43rd Qu. 2.6 1.5 1.9 2.0 1.6 1.7 1.9 1.6 1.6Max. 27670 27550 6.7 39530 38530 188.4 49040 47150 202.6
accurate point estimates. Detailed investigations indicate that the differences in performance reflect
differences in biases more than differences in variances. The largest values in the distributions (e.g.,
the maxima in Table 1) usually involve the seven variables with low probabilities in the population.
As a sensitivity analysis, we also remove the seven variables with probabilities near one, and
perform an independent simulation of 200 runs on the remaining 21 variables. We are left with 83
marginal probabilities, 2590 bivariate probabilities and 37216 trivariate probabilities. The relevant
figure and table are presented in the online supplementary material. In short, the overall patterns
are similar to those in Figure 2 and Table 1. Removing these seven variables also removes most
of the extremely low coverage rates for MI-GLM, making it more competitive with MI-CART
although MI-CART continues to result in slightly better coverage rates overall. MI-DPM yields
median coverage rates around or slightly above 95%; however, it continues to have longer left tails
than the other methods for bivariate and trivariate probabilities. Removing the seven variables also
removes the extremely large Rel.MSE values seen in Table 1. The lowest coverage rates and largest
Rel.MSEs continue to be associated with probabilities closest to zero or one, which is generally
the case in all the simulation scenarios we considered.
As a final sensitivity analysis, we add in the seven variables with more than ten categories,
17

(a) Results with 45% missing data
(b) Results with n “ 1000
Figure 3. Simulated coverage rates for MI-GLM, MI-CART, MI-DPM, and the pre-missing dataintervals for other MCAR scenarios with p “ 21 variables. Top panel is for scenario with n “10000 and a 45% missing data rate, and bottom panel is for scenario with n “ 1000 and a 30%missing data rate.
and perform an independent set of 200 simulations comparing MI-CART and MI-DPM only. We
continue to exclude the variables with probabilities near one. As a result, the comparison focuses
on 28 variables with 177 marginal probabilities, 9049 bivariate probabilities and 180218 trivariate
18

probabilities. To generate L “ 10 completed datasets, typically MI-CART takes about 2 hours
and 45 minutes, and MI-DPM takes about 55 minutes. The relevant figure and table are presented
in the online supplement. In short, including the variables with ten levels does not fundamentally
change the conclusions about MI-CART and MI-DPM.
3.2.2 Simulations with other MCAR scenarios
We next consider two other MCAR scenarios to examine whether or not overall conclusions
change when (i) increasing the rate of missingness and (ii) decreasing the sample size. For both
scenarios, we use only the p “ 21 variables described in the first sensitivity analysis of Section
3.2.1; that is, we discard the variables with more than 10 levels and the variables associated with
marginal probabilities very close to zero or one.
To examine the role of missingness rate, we increase from 30% to 45% of values MCAR
independently for each variable. We continue to use n “ 10000. The results are presented in
the top panels of Figure 3 and Table 2. Compared to results with the 30% missing data rate, we
see increased numbers of low coverage rates for all three MI methods. This results from reduced
numbers of observations on which to estimate the imputation models. MI-DPM offers the highest
coverage rates for marginal probabilities. The distributions of coverage rates for the three methods
are similar for bivariate and trivariate probabilities, with again MI-DPM tending to yield higher
coverate rates. As before, MI-CART tends to offer the smallest values of Rel.MSE, with MI-DPM
a close second. MI-GLM tends to have the largest Rel.MSEs.
We also consider a simulation with 10% of values MCAR independently for each variable.
Not surprisingly, with the low missingness rate, for the most part the Rel.MSEs are similar across
19
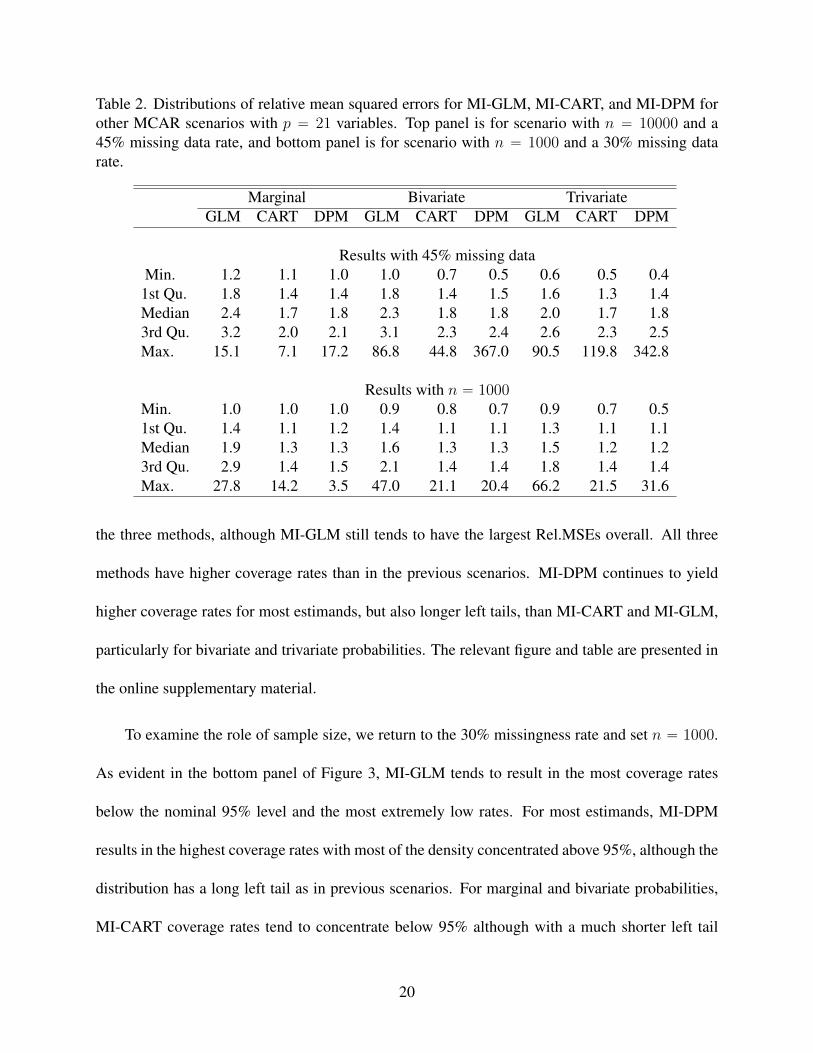
Table 2. Distributions of relative mean squared errors for MI-GLM, MI-CART, and MI-DPM forother MCAR scenarios with p “ 21 variables. Top panel is for scenario with n “ 10000 and a45% missing data rate, and bottom panel is for scenario with n “ 1000 and a 30% missing datarate.
Marginal Bivariate TrivariateGLM CART DPM GLM CART DPM GLM CART DPM
Results with 45% missing dataMin. 1.2 1.1 1.0 1.0 0.7 0.5 0.6 0.5 0.4
1st Qu. 1.8 1.4 1.4 1.8 1.4 1.5 1.6 1.3 1.4Median 2.4 1.7 1.8 2.3 1.8 1.8 2.0 1.7 1.83rd Qu. 3.2 2.0 2.1 3.1 2.3 2.4 2.6 2.3 2.5Max. 15.1 7.1 17.2 86.8 44.8 367.0 90.5 119.8 342.8
Results with n “ 1000Min. 1.0 1.0 1.0 0.9 0.8 0.7 0.9 0.7 0.51st Qu. 1.4 1.1 1.2 1.4 1.1 1.1 1.3 1.1 1.1Median 1.9 1.3 1.3 1.6 1.3 1.3 1.5 1.2 1.23rd Qu. 2.9 1.4 1.5 2.1 1.4 1.4 1.8 1.4 1.4Max. 27.8 14.2 3.5 47.0 21.1 20.4 66.2 21.5 31.6
the three methods, although MI-GLM still tends to have the largest Rel.MSEs overall. All three
methods have higher coverage rates than in the previous scenarios. MI-DPM continues to yield
higher coverage rates for most estimands, but also longer left tails, than MI-CART and MI-GLM,
particularly for bivariate and trivariate probabilities. The relevant figure and table are presented in
the online supplementary material.
To examine the role of sample size, we return to the 30% missingness rate and set n “ 1000.
As evident in the bottom panel of Figure 3, MI-GLM tends to result in the most coverage rates
below the nominal 95% level and the most extremely low rates. For most estimands, MI-DPM
results in the highest coverage rates with most of the density concentrated above 95%, although the
distribution has a long left tail as in previous scenarios. For marginal and bivariate probabilities,
MI-CART coverage rates tend to concentrate below 95% although with a much shorter left tail
20

than the other methods. As evident in Table 2, the MI-GLM procedure still tends to result in the
least accurate point estimates, and the MI-CART and MI-DPM procedures give reasonably similar
performance. The large values of Rel.MSE in Table 2 again correspond to low probability events
in the population.
3.2.3 Simulation with MAR scenario
Often MAR is a more plausible assumption than MCAR in practice. We therefore design a
simulation scenario with MAR, setting n “ 10000 and using the 21 variables described previously.
We set two variables, household type (HHT) which has 5 levels and tenure of property/home (TEN)
which has 4 levels, to be always fully observed. Among households with HHT = 1, in each sample
we randomly and independently blank 15% of values in each of the remaining 19 variables; the
corresponding rates for HHT P p2, 3, 4, 5q are 35%, 50%, 50% and 30%, respectively. Similarly,
for TEN = p1, 2, 3, 4q we use missing item rates of 40%, 15%, 30% and 5%, respectively. This
results in around 40% missing values spread across the 19 variables. We select TEN and HHT as
the fully complete variables because they have statistically significant associations with most of
the other 19 variables.
The results are displayed in Figure 4 and Table 3. The patterns and conclusions from the MAR
scenario are similar to those from the corresponding MCAR scenario. Overall, MI-CART tends
to result in the most coverage rates concentrated around 95% and fewest very low rates, and the
most accurate point estimates. For most bivariate and trivariate estimands, MI-DPM still results in
coverage rates above 95%, but it has the longest lower tail, sometimes reaching very low rates. MI-
GLM results in coverage rates for marginal and bivariate probabilities that are concentrated slightly
21

Figure 4. Simulated coverage rates for MI-GLM, MI-CART, MI-DPM, and the pre-missing dataintervals when n “ 10000 and 30% values MAR. We exclude seven variables with more than tenvariables and seven variables with marginal probabilities near one, resulting in p “ 21 variablesfor imputation and analysis.
below 95%, but its lower tail is comparable to that of MI-CART. The large values of Rel.MSE in
Table 3 correspond to low probability events in the population.
4. CONCLUDING REMARKS
The simulation results suggest several general conclusions about the three MI procedures for
categorical data. First, default applications of MI-GLM with main effects, which are arguably
the most common implementation for multiple imputation, appear to be inferior to MI-CART and
MI-DPM overall. These latter procedures automatically find and model important dependence
structures that are missed with default applications of MI-GLM. Of course, one could use more
complicated predictor functions in the generalized linear models, but with high dimensional vari-
ables selecting appropriate sets of interaction effects to include in the conditional models is daunt-
22

Table 3. Distributions of relative mean squared errors for MI-GLM, MI-CART, MI-DPM, and thepre-missing data intervals when n “ 10000 and 30% values MAR. We exclude seven variableswith more than ten variables and seven variables with marginal probabilities near one, resulting inp “ 21 variables for imputation and analysis.
Marginal Bivariate TrivariateGLM CART DPM GLM CART DPM GLM CART DPM
Min. 1.0 1.0 1.0 0.9 0.8 0.6 0.6 0.6 0.51st Qu. 1.2 1.1 1.1 1.3 1.1 1.1 1.1 1.1 1.1Median 1.5 1.3 1.4 1.5 1.3 1.4 1.4 1.2 1.33rd Qu. 1.8 1.5 2.1 1.8 1.5 1.8 1.6 1.4 1.7Max. 4.5 2.5 9.4 28.2 19.1 144.0 43.6 41.8 195.4
ing. Second, it is difficult to identify a clear winner between MI-CART and MI-DPM. Across the
simulations, the median coverage rates for MI-DPM tend to be larger than the median coverage
rates for MI-CART, although both tend to be close to 95%. On the other hand, MI-CART tends to
result in fewer very low rates than MI-DPM does, and it tends to result in smaller relative mean
squared errors. Therefore, analysts concerned with getting at least nominal coverage rates for most
estimands, but potentially at the expense of some very low rates, may prefer MI-DPM. Analysts
willing to accept slightly lower coverage rates for most estimands with potentially lower risk of
very low rates, in addition to smaller mean squared errors, may prefer MI-CART. Third, the results
suggest that one might favor MI-DPM over MI-CART in situations where one needs to lean on
the model more heavily — the scenarios with smaller sample size and higher missing data rates
in our simulations — and favor MI-CART otherwise. Intuitively, by design the joint model un-
derlying the MI-DPM engine tends to shrink probability estimates from low count cells towards
those for higher count cells. In modest-sized samples or with high rates of missing data, this can
improve accuracy. The effects of this shrinkage generally decrease with sample size. Thus, we
conjecture that MI-DPM and MI-CART would give similar results for much larger n; indeed, we
found this to be the case in a small number of simulation runs with n “ 100, 000. Of course, when
23

the sample size is too small, MI-DPM and MI-CART can lack sufficient data to estimate complex
relationships accurately, highlighting the importance of checking the quality of imputations, e.g.,
with predictive checks as in Burgette and Reiter (2010), for any method.
As with any simulation study, the conclusions suggested by these results may not generalize
to all other settings. The simulations were based on relatively simple missing data mechanisms,
default applications of imputation strategies that were not tuned specifically to the data at hand,
and only a subset of the (huge space of) possible estimands. For example, it may be that MI-
GLM is most effective among the three imputation procedures when the parameters of interest are
a particular GLM that is also used in one of the conditional specifications, although this is not
guaranteed to be the case when the specified GLM poorly describes the relationships in the data.
We considered only data comprising nominal categorical variables. Of course, many datasets
also include ordinal and continuous variables. The MI-CART procedure can be easily applied for
such mixed data types, but obviously MI-DPM cannot. One needs a different joint model, such
as a general location model (Schafer 1997) or the mixture model of MurrayReiter2016 Thus,
one should not generalize findings here to mixed data types. Additionally, we did not use the
ordinal nature of the data when fitting MI-GLM. Models that do so, like cumulative logit models
(Agresti2013), can be more effective than multinomial logistic regressions, provided that their
underlying assumptions (e.g., proportional odds) are sensible for the data at hand. Proportional
odds assumptions do not always match the data distribution, e.g., when the ordinal variable has
most mass at the lowest and highest values of the variable, so that careful model checking is
warranted before using them in MI-GLM in lieu of the weaker multinomial logit assumptions.
The simulation results suggest some useful practical steps to improve MI. First, the perfor-
24
mance of the procedures suffered when variables with probabilities nearly equal to one (or zero)
are included in the models. Additionally, occasionally MI-CART, and less frequently MI-GLM
and MI-DPM, generated completed datasets with b “ 0 for these variables, so that the multiple
imputation variance estimator and degrees of freedom broke down. Accepting such decreased per-
formance seems unnecessary, since imputation from marginal distributions are likely to work just
as effectively for these variables. We suggest that analysts remove such variables before impu-
tation. CART initially suffered the most for probabilities close to zero or one before restricting
analyses only to quantities with np ą 10 and np1 ´ pq ą 10. Imposing that restriction and
removing those seven variables improved the performance of CART. Second, we recommend not
considering multinomial regression modeling, as is done in default applications of MI-GLM, when
some multinomial variables with missing values have many levels. We could not get default ver-
sions of MI-GLM even to fit in such circumstances. It may be possible to collapse categories or
use fewer predictors in the models, although this may sacrifice model quality. This could be prob-
lematic when such variables are central to a secondary analysis. Third, the lack of a clear winner
suggests benefits for assessing the quality of an imputation method for data akin to those at hand;
for example, using repeated sampling simulations with other, representative data sources or, when
large enough, the complete cases. Such evaluations are not routinely used in applications, although
examples exist (e.g., Ezzati-Rice et al. 1995; Raghunathan and Rubin 1997; Schafer et al. 1998;
Tang et al. 2005; van Buuren et al. 2006).
SUPPLEMENTARY MATERIALS
The supplementary material contains a table describing the variables used in the simulation, median
25

coverage rates across all scenarios, and figures for the sensitivity checks in Section 3.
REFERENCES
Arnold, B. C. and S. J. Press (1989), “Compatible Conditional Distributions”, Journal of the Amer-
ican Statistical Association 84, pp. 152–156.
Barnard, J. and X. L. Meng (1999), “Applications of multiple imputation in medical studies: From
AIDS to NHANES”, Statistical Methods in Medical Research 8, pp. 17–36.
Brand, J. P. L. (1999), Development, implementation and evaluation of multiple imputation strate-
gies for the statistical analysis of incomplete data sets, Erasmus University.
Breiman, L., J. H. Friedman, R. A. Olshen, and C. I. Stone (1984), Classification and Regression
Trees, Chapman and Hall/CRC.
Burgette, L. F. and J. P. Reiter (2010), “Multiple imputation for missing data via sequential regres-
sion trees”, American Journal of Epidemiology 172, pp. 1070–1076.
van Buuren, S. (2007), “Multiple imputation of discrete and continuous data by fully conditional
specification”, Statistical Methods in Medical Research 16, pp. 219–242.
— (2012), Flexible imputation of missing data, Boca Raton, FL.: Chapman and Hall/CRC.
van Buuren, S. and K. Groothuis-Oudshoorn (2011), “mice: Multivariate imputation by chained
equations in R”, Journal of Statistical Software 45.3, pp. 1–67.
van Buuren, S. and K. Groothuis-Oudshoorn (2014), “mice: Multivariate imputation by chained
equations”, The Comprehensive R Archive Network.
26

van Buuren, S., H. C. Boshuizen, and D. L. Knook (1999), “Multiple imputation of missing blood
pressure covariates in survival analysis”, Statistics in Medicine 18, pp. 681–694.
van Buuren, S., J. P. L. Brand, C. G. M. Groothius-Oudshoorn, and D. B. Rubin (2006), “Fully
conditional specifications in multivariate imputation”, Journal of Statistical Computation and
Simulation 76.12, pp. 1049–1064.
Dunson, D. B. and C. Xing (2009), “Nonparametric Bayes modeling of multivariate categorical
data”, Journal of the American Statistical Association 104, pp. 1042–1051.
Ezzati-Rice, T. M., E. R. Zell, M. Battaglia, P. Ching, and R. Wright (1995), “The design of the
state and local area immunization coverage and health survey”, Proceedings of the Section on
Survey Research Methods, American Statistical Association, pp. 668–672.
Gelman, A. and T. P Speed (1993), “Characterizing a joint probability distribution by condition-
als”, Journal of the Royal Statistical Society Series B: Statistical Methodology 55, pp. 185–
188.
Harel, O. and X. H. Zhou (2007), “Multiple imputation: review of theory, implementation and
software”, Statistics in Medicine 26, pp. 3057–3077.
Honaker, J., G. King, and M. Blackwell (2011), “Amelia II: A Program for Missing Data”, Journal
of Statistical Software 45.7.
Li, F., M. Baccini, F. Mealli, E. Z. Zell, C. E. Frangakis, and D. B. Rubin (2014), “Multiple impu-
tation by ordered monotone blocks with application to the Anthrax Vaccine Adsorbed Trial”,
Journal of Computational and Graphical Statistics 23.3, pp. 877–892.
Little, R. J. A. and D. B. Rubin (2002), Statistical analysis with missing data, New Jersey: Wiley.
27

Manrique-Vallier, D. and J. P. Reiter (2014a), “Bayesian estimation of discrete multivariate trun-
cated latent structure models”, Journal of Computational and Graphical Statistics 23, pp. 1061–
1079.
— (2014b), “Bayesian multiple imputation for large-scale categorical data with structural zeros”,
Survey Methodology 40, pp. 125–134.
— (2015), “Bayesian simultaneous edit and imputation for multivariate categorical data”, Techni-
cal Report. Dept. of Statistics, Duke University.
Manrique-Vallier, D., J. P. Reiter, J. Hu, and W. Quanli (2014), “NPBayesImpute: Non-parametric
Bayesian multiple imputation for categorical data”, The Comprehensive R Archive Network.
Raghunathan, T. E. and D. B. Rubin (1997), “Roles for Bayesian techniques in survey sampling”,
Proc. Survey Methods Section of the Statistical Society of Canada, pp. 51–55.
Raghunathan, T. E., J. M. Lepkowski, J. van Hoewyk, and P. Solenberger (2001), “A multivari-
ate technique for multiply imputing missing values using a sequence of regression modelss”,
Survey Methodology 27, pp. 85–96.
Raghunathan, T. E., P. W. Solenberger, and V. J. Hoewyk (2002), “IVEware: imputation and vari-
ance estimation software user guide.”, Survey Research Center, Institute for Social Research,
University of Michigan.
Reiter, J. P. and T. E. Raghunathan (2007), “The multiple adaptations of multiple imputation”,
Journal of the American Statistical Association 102, pp. 1462–1471.
Royston, P. and I. R. White (2011), “Multiple Imputation by Chained Equations (MICE): Imple-
mentation in Stata”, Journal of Statistical Software 45.4, pp. 1–20.
28

Rubin, D. B. (1976), “Inference and missing data (with discussion)”, Biometrika 63, pp. 581–592.
— (1987), Multiple imputation for nonresponse in surveys, New York: John Wiley & Sons.
— (1996), “Multiple imputation after 18+ years”, Journal of the American Statistical Association
91, pp. 473–489.
— (2003), “Nested multiple imputation of NMES via partially incompatible MCMC”, Statistica
Neerlandica 57.1, pp. 3–18.
Schafer, J. L. (1997), Analysis of incomplete multivariate data, London: Chapman and Hall.
Schafer, J. L., T. M. Ezzati-Rice, K. M. Johnson W., R. J. A. Little, and D. B. Rubin (1998),
“The NHANES III multiple imputation project”, Proceedings of the survey Research Methods
Section of the American Statistical Association, pp. 28–37.
Si, Y. and J. P. Reiter (2013), “Nonparametric Bayesian multiple imputation for incomplete cat-
egorical variables in large-scale assessment surveys”, Journal of Educational and Behavioral
Statistics 38.5, pp. 199–521.
Si, Y., J. P. Reiter, and D. S. Hillygus (2015), “Semi-parametric selection models for poten-
tially non-ignorable attrition in panel studies with refreshment samples”, Political Analysis
23, pp. 92–112.
Su, Y. S., A. Gelman, J. Hill, and M. Yajima (2011), “Multiple imputation with diagnostics (mi) in
R: Opening Windows into the black box”, Journal of Statistical Software 45.2.
Tang, L., J. Song, T. R. Belin, and J. Unuetzer (2005), “A comparison of imputation methods in a
longitudinal randomized clinical trial”, Statistics in Medicine 24, pp. 2111–2128.
29

Vermunt, J. K., J. R. V. Ginkel, L. A. V. der Ark, and K. Sijtsma (2008), “Multiple imputation of
incomplete categorical data using latent class analysis”, Sociological Methodology 38, pp. 369–
397.
Yang, Y. (2011), “Multiple imputation using SAS software”, Journal of Statistical Software 45 (6).
30