
An Electrospray Ionization Mass Spectrometry Study on the ... · DOI: 10.1007/s13361-017-1685-0...
15
B American Society for Mass Spectrometry, 2017 J. Am. Soc. Mass Spectrom. (2017) 28:1623Y1637 DOI: 10.1007/s13361-017-1685-0 RESEARCH ARTICLE An Electrospray Ionization Mass Spectrometry Study on the BIn Vacuo^ Hetero-Oligomers Formed by the Antimicrobial Peptides, Surfactin and Gramicidin S Marina Rautenbach, 1,2 N. Maré Vlok, 1,2 Hans A. Eyéghé-Bickong, 1,2 Marthinus J. van der Merwe, 2,3 Marietjie A. Stander 2,3 1 BIOPEP® Peptide Group, University of Stellenbosch, Stellenbosch, 7602, Republic of South Africa 2 Department of Biochemistry, University of Stellenbosch, Stellenbosch, 7602, Republic of South Africa 3 LCMS Central Analytical Facility, University of Stellenbosch, Stellenbosch, 7602, Republic of South Africa Abstract. It was previously observed that the lipopeptide surfactants in surfactin (Srf) have an antagonistic action towards the highly potent antimicrobial cyclodecapeptide, gramicidin S (GS). This study reports on some of the molecular aspects of the antagonism as investigated through complementary electrospray ionization mass spectrometry techniques. We were able to detect stable 1:1 and 2:1 hetero- oligomers in a mixture of surfactin and gramicidin S. The noncovalent interaction between GS and Srf, with the proposed equilibrium: GS~Srf↔GS+Srf correlated to apparent K d values of 6–9 μM in gas-phase and 1 μM in aqueous solution. The apparent K d values decreased with a longer incubation time and indicated a slow oligomerization equilibrium. Furthermore, the low μM K d app values of GS~Srf↔GS+Srf fell within the biological concentration range and related to the 2- to 3-fold increase in [GS] needed for bacterial growth inhibition in the presence of Srf. Competition studies indicated that neither Na + nor Ca 2+ had a major effect on the stability of preformed heterodimers and that GS in fact out-competed Ca 2+ and Na + from Srf. Traveling wave ion mobility mass spectrometry revealed near symmetrical peaks of the heterodimers correlating to a compact dimer conformation that depend on specific interactions. Collision-induced dissociation studies indicated that the peptide interaction is most probably between one Orn residue in GS and the Asp residue, but not the Glu residue in Srf. We propose that flanking hydrophobic residues in both peptides stabilize the antagonistic and inactive peptide hetero-oligomers and shield the specific polar interactions in an aqueous environment. Keywords: Surfactin, Gramicidin S, Lipopeptide, Antimicrobial peptide, Antagonism, Molecular interaction, Electrospray ionization mass spectrometry Received: 7 December 2016/Revised: 8 April 2017/Accepted: 11 April 2017/Published Online: 30 May 2017 Introduction R autenbach et al. [1] observed that the anionic lipopeptides in surfactin (Srf) produced by Bacillus subtilis protected their producer from the cationic antimicrobial peptide gramici- din S (GS) from Aneurinibacillus migulanus. GS is a cyclic decapeptide with a β-sheet structure that contains a repeat pentapeptide moiety with sequence L-Val-L-Orn-L-Leu-D- Phe-L-Pro [2–4] (Figure 1a). The Srf lipopeptide complex contains at least five variant groups of analogous anionic cyclic lipopeptides (Table 1). All these Srf lipopeptides have a β- hydroxy fatty acid (C 13 ,C 14 ,C 15 or C 16 ) linked via a lactone bond to L-Glu-L-Leu-D-X 1 -L-Val-L-Asp-D-Leu-L-X 2 , where X 1 can be Leu or Ile and X 2 a Val, Leu, or Ile [5–11] (Figure 1b, Table 1). Noncovalent hetero-oligomers of the lipopeptides in Srf and GS were observed utilizing electrospray ionization mass spectrometry (ESI-MS) [1]. As the participating peptides are amphipathic and membrane active [4, 8, 12, 13], nonspe- cific complex formation between GS and Srf could involve hydrophobic interactions. More specific electrostatic interac- tions could take place between the two basic Orn residues in GS and the two acidic residues in Srf, as well as highly specific Electronic supplementary material The online version of this article (doi:10. 1007/s13361-017-1685-0) contains supplementary material, which is available to authorized users. Correspondence to: Marina Rautenbach; e-mail: [email protected]
-
Upload
truongtuong -
Category
Documents
-
view
231 -
download
0
Transcript of An Electrospray Ionization Mass Spectrometry Study on the ... · DOI: 10.1007/s13361-017-1685-0...
B American Society for Mass Spectrometry, 2017 J. Am. Soc. Mass Spectrom. (2017) 28:1623Y1637DOI: 10.1007/s13361-017-1685-0
RESEARCH ARTICLE
An Electrospray Ionization Mass Spectrometry Studyon the BIn Vacuo^ Hetero-Oligomers Formedby the Antimicrobial Peptides, Surfactin and Gramicidin S
Marina Rautenbach,1,2 N. Maré Vlok,1,2 Hans A. Eyéghé-Bickong,1,2
Marthinus J. van der Merwe,2,3 Marietjie A. Stander2,3
1BIOPEP® Peptide Group, University of Stellenbosch, Stellenbosch, 7602, Republic of South Africa2Department of Biochemistry, University of Stellenbosch, Stellenbosch, 7602, Republic of South Africa3LCMS Central Analytical Facility, University of Stellenbosch, Stellenbosch, 7602, Republic of South Africa
Abstract. It was previously observed that the lipopeptide surfactants in surfactin (Srf)have an antagonistic action towards the highly potent antimicrobial cyclodecapeptide,gramicidin S (GS). This study reports on some of the molecular aspects of theantagonism as investigated through complementary electrospray ionization massspectrometry techniques. We were able to detect stable 1:1 and 2:1 hetero-oligomers in a mixture of surfactin and gramicidin S. The noncovalent interactionbetween GS and Srf, with the proposed equilibrium: GS~Srf↔GS+Srf correlated toapparent Kd values of 6–9 μM in gas-phase and 1 μM in aqueous solution. Theapparent Kd values decreased with a longer incubation time and indicated a slowoligomerization equilibrium. Furthermore, the low μMKd
app values of GS~Srf↔GS+Srffell within the biological concentration range and related to the 2- to 3-fold increase in [GS] needed for bacterialgrowth inhibition in the presence of Srf. Competition studies indicated that neither Na+ nor Ca2+ had a major effecton the stability of preformed heterodimers and that GS in fact out-competed Ca2+ and Na+ from Srf. Travelingwave ion mobility mass spectrometry revealed near symmetrical peaks of the heterodimers correlating to acompact dimer conformation that depend on specific interactions. Collision-induced dissociation studies indicatedthat the peptide interaction is most probably between one Orn residue in GS and the Asp residue, but not the Gluresidue in Srf. We propose that flanking hydrophobic residues in both peptides stabilize the antagonistic andinactive peptide hetero-oligomers and shield the specific polar interactions in an aqueous environment.Keywords: Surfactin, Gramicidin S, Lipopeptide, Antimicrobial peptide, Antagonism, Molecular interaction,Electrospray ionization mass spectrometry
Received: 7 December 2016/Revised: 8 April 2017/Accepted: 11 April 2017/Published Online: 30 May 2017
Introduction
Rautenbach et al. [1] observed that the anionic lipopeptidesin surfactin (Srf) produced by Bacillus subtilis protected
their producer from the cationic antimicrobial peptide gramici-din S (GS) from Aneurinibacillus migulanus. GS is a cyclicdecapeptide with a β-sheet structure that contains a repeatpentapeptide moiety with sequence L-Val-L-Orn-L-Leu-D-
Phe-L-Pro [2–4] (Figure 1a). The Srf lipopeptide complexcontains at least five variant groups of analogous anionic cycliclipopeptides (Table 1). All these Srf lipopeptides have a β-hydroxy fatty acid (C13, C14, C15 or C16) linked via a lactonebond to L-Glu-L-Leu-D-X1-L-Val-L-Asp-D-Leu-L-X2, whereX1 can be Leu or Ile andX2 a Val, Leu, or Ile [5–11] (Figure 1b,Table 1). Noncovalent hetero-oligomers of the lipopeptides inSrf and GS were observed utilizing electrospray ionizationmass spectrometry (ESI-MS) [1]. As the participating peptidesare amphipathic and membrane active [4, 8, 12, 13], nonspe-cific complex formation between GS and Srf could involvehydrophobic interactions. More specific electrostatic interac-tions could take place between the two basic Orn residues inGS and the two acidic residues in Srf, as well as highly specific
Electronic supplementary material The online version of this article (doi:10.1007/s13361-017-1685-0) contains supplementary material, which is availableto authorized users.
Correspondence to: Marina Rautenbach; e-mail: [email protected]
recognition between the two peptides via dipolar and hydrogenbonding. If neutralizing interaction between GS and Srf resultsin inactive peptide hetero-oligomers, such interactions betweenantimicrobial peptides may be a general resistance mechanismallowing peptide-producer microorganisms to co-habituate.Therefore, characterizing the possible noncovalent hetero-oligomer formation and structural influence of Srf on GSwould enhance our understanding of this protective and puta-tive resistance mechanism.
ESI-MS is a well-established Bsoft-ionization^ techniquefor probing noncovalent interactions between biomolecules ingas phase (Bin vacuo^) [14, 15]. ESI-MS has been used withsuccess in several investigations on noncovalent interactionbetween peptides [16–19], as well as to determine dissociationconstants of interacting biomolecules [20–23]. However, theremoval of water and solvent during desolvation of a
noncovalent complex during the electrospray process will sub-stantially weaken the hydrophobic forces, and the relativecontribution of the hydrophobic and polar interactions willdetermine the stability of the complex in the gas phase [24–26]. ESI-MS analysis of noncovalent interactions, therefore,limits determination to interacting partners with a strong polarcomponent in their interactions and can also rule out nonspe-cific hydrophobic aggregation. In the case of Srf and GS, it wasimportant to eliminate the nonspecific contribution of hydro-phobic interactions between the two amphipathic peptides, inorder to probe the more specific polar interactions.
Alves et al. [18] showed with peptide–DNA complexesthat tandem mass spectrometry (MS/MS) can be used todetermine the site of ionic interactions. In another MS/MSstudy on a linear iturin A lipopeptide analogue, it was ob-served that interaction with a sodium ion stabilized some ofthe peptide bonds because it chelated to the carbonyl groupsin one of the type II β-turns [27]. MS/MS in theory can alsobe used to probe the interacting residues of two peptides inan oligomer. During MS/MS collision-induced dissociation(CID) of peptides, the majority of fragmentation reactionstake place at the peptide (amide) bonds [28, 29]. The se-quential product ion spectra are frequently used for de novosequencing [28, 29]. If a peptide is interacting with anothercompound via a salt bridge, hydrogen bonds, or other polar/electrostatic bonds, certain peptide bonds and functionalgroups will be more protected from fragmentation reactionsbecause of group proximity that lead to steric interferencesand/or changes in the electronic environment [18, 27]. It istherefore possible that such interactions in the noncovalenthetero-oligomer of GS with Srf can change the ESI-MSfragmentation patterns, and these changes can be used toobtain information regarding sequences, residues, or groupsinvolved in the interaction within GS~Srf hetero-oligomers.
This study describes the first part of an investigation on themolecular interaction between the anionic lipopeptide Srf andthe cationic cyclodecapeptide GS. Complementary mass spec-trometric data on mixtures of GS with Srf were compared withthat of the single peptides in order to probe the conformation,stability, and the possible interaction partners in GS and Srf.
Materials and MethodsSurfactin, gramicidin S, sodium formate, leucine enkephalinacetate salt hydrate (>95%), and poly-DL-alanine were suppliedby Sigma-Aldrich (St. Louis, MO, USA). Calcium chloride(CaCl2) was from Associated Chemical Enterprises (Glenvista,South Africa), and sodium chloride (NaCl) from Saarchem(Midrand, South Africa). Acetonitrile (HPLC grade, UV cut-off 190 nm) was supplied by Romil Ltd. (Cambridge, UK).Formic acid (>98%) was purchased from Merck Chemicals(Darmstadt, Germany). A Milli Q water purification system(MerckMillipore, Darmstadt, Germany) was used to filter waterfrom a reverse osmosis plant to prepare analytical grade water.
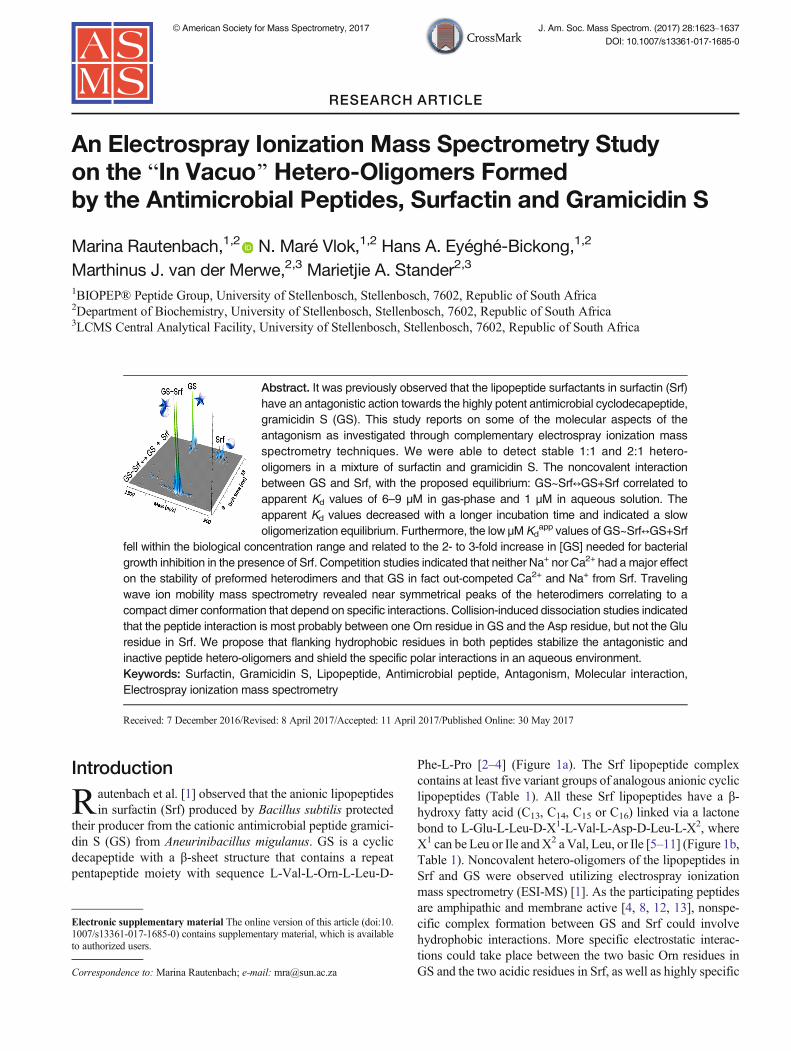
Figure 1. (a) Structural model of GS depicting its proposedantiparallel β-sheet conformation [3, 4]. The two Orn and twoPhe residues are oriented in one plane, forming the hydrophilicside of the molecule and the hydrophobic side, formed by thetwo Leu and two Val residues, is directed to the opposite planeof the molecule [12]. (b) Structural representation of the S1model of surfactin [7]. The two acidic amino acid residuesGlu1 and Asp5 together with Val4 form the hydrophilic side ofthe molecule, whereas the four hydrophobic Leu residues areoriented in the other side of the peptide, forming the hydropho-bic side. The structures were drawn using ACD/ChemSketchsoftware (ACDLABS 12.0 software)
1624 M. Rautenbach et al.: ESI-MS Study of Gramicidin S-surfactin Hetero-oligomers

Tab
le1.
ASu
mmaryof
theAnalysisDataandProposed
Identitiesof
theDifferentSp
eciesinPu
rePeptideSamples
andan
1:1GramicidinS-Su
rfactin
Mixtureas
Detectedwith
HighResolutionESI-M
S,UPL
C-M
S,and
IM-M
S
Peptideor
heterodimer
Abbr.
Peptidesequence
a/com
position
Theoretical
Mr
Ionspecie
Theoretical;o
bserved
m/z
CalculatedM
rb
UPL
CRt(m
in)c
CCS(Å
2)d
Gramicidin
SGS
cyclo[(D
-Phe-L-Pro-L-V
al-L-O
rn-L-Leu) 2]
1140.7059
[M+H]+
1141.7137;
1141.7167
1140.7051
-353±
5
[M+2H
]2+
571.3608;
571.3566
334
Surfactin
1Srf 1
cyclo[(C
13H24O2)-L-G
lu-L-Leu/Ile-D
-Leu-L-V
al-L-A
sp-L-Leu-L-V
al]
993.6361
[M1+H]+
994.6439;
994.6512
993.6403
10.58
344(382)
Surfactin
2Srf 2
cyclo[(C
14H26O2)-L-G
lu-L-Leu/Ile-D
-Leu-L-V
al-L-A
sp-L-Leu-L-V
al]
cyclo-[(C13H
24O2)-L-G
lu-L-Leu-D
-Leu-L-V
al-L-A
sp-L-Leu-L-Leu/ILe]
1007.6518
[M2+H]+
1008.6596;
1008.6644
1007.6552
11.02
348(386)
Surfactin
3Srf 3
cyclo[(C
15H28O2)-L-G
lu-L-Leu/Ile-D
-Leu-L-V
al-L-A
sp-L-Leu-L-V
al]
cyclo[(C
14H26O2)-L-G
lu-L-Leu-D
-Leu-L-V
al-L-A
sp-L-Leu-L-Leu/Ile]
1021.6674
[M3+H]+
1022.6752;
1022.6780
1021.6715
11.58;11.68
352(390)
Surfactin
4Srf 4
cyclo[(C
15H28O2)-L-G
lu-L-Leu-D
-Leu-L-V
al-L-A
sp-L-Leu-L-Leu/Ile]
1035.6831
[M4+H]+
1036.6909;
1036.6898
1035.6881
12.07
356(395)
Surfactin
5Srf 5
cyclo[(C
16H30O2)-L-G
lu-L-Leu-D
-Leu-L-V
al-L-A
sp-L-Leu-L-Leu/Ile]
1049.6988
[M5+H]+
1050.7066;
1050.7050
1049.7032
12.60;12.75
360(398)
Heterodim
er1
GS~
Sr1
GS,
Srf 1
2134.3421
[M+M
1+2H
]2+
1068.1789;
1068.1796
2134.3430
-519
Heterodim
er2
GS~
Sr2
GS,
Srf 2
2148.3577
[M+M
2+2H
]2+
1075.1867;
1075.1984
2148.3638
-519
Heterodim
er3
GS~
Sr3
GS,
Srf 3
2162.3734
[M+M
3+2H
]2+
1082.1945;
1082.1970
2162.3818
-524
Heterodim
er4
GS~
Sr4
GS,
Srf 4
2176.3890
[M+M
4+2H
]2+
1089.2023;
1089.2040
2176.3977
-527
Heterodim
er5
GS~
Sr5
GS,
Srf 5
2190.4047
[M+M
5+2H
]2+
1096.2102;
1096.2190
2190.4102
-527
aGSsequence
from
[2,3];Srfsequencesfrom
[5–11]
bThe
experimentalM
rforeach
peptide,variant,or
complex
was
calculated
with
theMaxEnt
3algorithm
inMassLynxver.4.1.Refer
toFigures2and9forrepresentativ
espectra
cRefer
toFigure
11in
Supplementary
Data
dSrfvariantC
CSvalues
inbracketswerecorrectedwith
11.2%
accordingto
Goodw
inetal.[38].Refer
tomethodology
andSu
pplementary
Datafordetails
onCCScalculations
M. Rautenbach et al.: ESI-MS Study of Gramicidin S-surfactin Hetero-oligomers 1625

Electrospray Ionization Mass Spectrometry
The chemical purity of GS and Srf and the identity of the hetero-oligomers were determined with high resolution ESI-MS utiliz-ing a Waters Synapt G2 Q-TOF mass spectrometer (Milford,MA, USA) fitted with a Z-spray electrospray ionization source(denoted ESI-MS-TOF). GS and Srf were dissolved at 1.00 mMin 50% acetonitrile in water (v/v) and diluted in analyticalquality water or 50% acetonitrile in water (v/v) and eitheranalyzed alone or as an equimolar (1:1) mixture of the peptides.Samples pre-incubated at 22 ±2 °C were prepared at least 1 hbefore analysis. A sample solution (2–5 μL) was introduced intothe spectrometer via a Waters Acquity UPLC utilizing directinfusion at a flow rate of 300 μL/min using 0.1% formic acid in50% acetonitrile/water (v/v/v) as the ESI solvent. The analyteswere subjected to a capillary voltage of 2.5 kV, cone voltage(CV) of 25 V, collision energy in trap and transfer collision cellof 4 eV and 0 eV, respectively, a source temperature of 120 °C,desolvation gas (N2) of 650 L/h, and desolvation temperature of275 °C. The data were collected in positive mode by scanningthrough m/z = 100–2000 in continuum mode at a rate of 0.2scans per second. The high resolution mass calibration of theinstrument was performed using sodium formate, and in-analysis calibration was performed using leucine enkephalinsingle point lock spray (m/z = 556.2771).
High resolution CID analyses in MS/MS mode on the ESI-MS-TOF instrument were performed by injecting 3 μL of thepeptide alone or equimolar peptide mixture (150 μM each inacetonitrile/water) into the mass spectrometer and subjecting theselected precursor ions for decomposition over a collision ener-gy (CE) gradient of 30–80 eV in the trap collision cell with CVat 25 V. Low energy CID was done at 40 eV, with CV set at 30V. The collision energy in transfer collision cell was set at 0 eVand the collision gas was delivered at 0.5 × 10⁻³ bar Ar. Theisolation m/z windows were 1141.7 ± 1, 1022.7 ± 1, and 1182.2± 1. Data were collected in the second mass analyzer throughm/z = 100–2000 in the centroid mode. The rest of the instrumentsettings were as described above for the MS mode.
Ultraperformance liquid chromatography (UPLC) linkedto ESI-MS was performed on ESI-MS-TOF instrument(Waters Synapt G2 linked to the Acquity UPLC system,Dublin, Ireland). Separation of the peptides in the Srfcomplex (injection of 3 μL of a 1.00 mg/mL sample) viaUPLC was done on an Acquity UPLC HSS T3 C18 column(1.8 μm particle size, 2.1 × 150 mm; Waters, Dublin,Ireland). Solvents used in the chromatography were: ana-lytical quality water modified with 0.1% formic acid (v/v)(solvent A) and acetonitrile modified with 0.1% formicacid (v/v) (solvent B). The gradient program with the flowrate at 300 μL/min was as follows: 0–0.5 min sampleloading at 40% B, 0.5–11 min linear gradient from 40%–95% B, and 11–14 min at 95% B, with re-equilibrationfrom 15–16 min at 40% B. The rest of the instrumentsettings were as described above for the MS mode, exceptfor the CV, which was set at 15 V.
Ion mobility mass spectrometry (IM-MS) analysis was alsoutilized for comparative analysis of the peptides and hetero-oligomers. IM-MS on the equimolar mixture (150 μM each) ofGS and Srf and the peptides alone was done by enabling thetraveling-wave ion mobility cell in the ESI-MS-TOF instru-ment. The instrument settings were used as above for the MSmode, except for the cone voltage set at 15 V. The traveling-wave IM-MS tuning was as follows: extraction cone at 4 V,helium cell gas flow at 180.00 mL/min, ion mobility buffer gas(N2) flow at 90 mL/min, trap collision energy at 15 V, a 200 μstrapping release period, mobility trap height at 15 V, mobilityextract height at 0 V, wave height ramp (20%) from 8 to 20 V,wave height linear velocity ramp (20%) from 1000 to 650 m/sat 220 m/s. Calibration of traveling wave ion mobility cell’sdrift time was done by using polyalanine (polyAla) as calibra-tion standard. Refer to the Data Analysis section for details onthe collision cross-section (CCS) calculations.
ESI-MS to determine the stability of the peptides and pep-tide heterodimers and the titration experiments were performedon a Micromass Quattro Triple Quadrupole mass spectrometerfitted with an electrospray ionization source (denoted ESI-MS-TQ). Stock solutions of Srf and GS were dissolved in 50%acetonitrile/water (v/v) and stock solutions of salts (NaCl2 orCaCl2) in 40% acetonitrile/water (v/v). The final solvent con-centration before injection was adjusted to 50% acetonitrile/water. Pre-incubated samples were prepared by incubating Srfand the respective salts overnight. GS was added 5 min beforeanalysis to Srf samples. To determine the optimumGS:Srf ratioto study the GS~Srf hetero-oligomers, 125 μM Srf was titratedwith 1.25–250 μM GS. To investigate the role of electrostaticinteractions in the GS~Srf hetero-oligomers, 90 μM Srf wastitrated with 1.11–35.6 mM of either NaCl or CaCl2. In com-petition assays 90 μM Srf was pre-incubated with 10-foldmolar excess NaCl or CaCl2 and then titrated with GS over1.2–445 μM concentration range.
Samples were injected into the ESI-MS-TQ through aRheodyne injector valve at 20 μL/analysis with the final carriersolvent concentration 50% acetonitrile/water (v/v). A capillaryvoltage of 3.5 kV was applied with the ionization sourcetemperature at 80 °C. The cone voltages for the all the analyseswere 60 V with the skimmer lens offset at 5 V. Data acquisitionwas in the positive mode, scanning the mass range through m/z= 200–2000 at a scan rate of 100 atomic mass units/s. CID toinvestigate peptide and heterodimer stability was executed withthe CE varied from 5 to 75 eV at a collision cell gas pressure of2 × 10–3 bar argon. Product ions were detected by scanning thesecond analyzer fromm/z = 10 to 100 atomic mass units abovethe m/z value of the precursor/molecular ion. Data were ac-quired in the multiple channel acquisition mode.
Data Analysis
All graphs were constructed using GraphPad Prism 4.03(GraphPad Software, San Diego, CA, USA). Sigmoidal andhyperbolic equations were adapted from the GraphPad Prismequation library to fit curves to ESI-MS data.
1626 M. Rautenbach et al.: ESI-MS Study of Gramicidin S-surfactin Hetero-oligomers

All mass spectrometric data were analyzed via MassLynxv4.1 SCN 714 (and earlier versions) and Driftscope 2.1 software(Waters, Milford, MA, USA). Continuum mode data wereanalyzed directly or via the MaxEnt 3 algorithm, while thecentroid mode data were analyzed via the TOF transform algo-rithm. Considering the relationship between analyte ionizationand detection in a mass spectrometer, it is possible that theaddition of a polar compound such as GS or salts, or decreasingthe solvent polarity may influence the ionization characteristicsof the other compounds in solution. We therefore calculated thepercentage signal contribution of each molecular ion or complexions of interest to the total peptide signal.
For calibration of the IM-MS drift time, the standard curveof charge corrected CCS (ln Ω′) of polyAla species versuscorrected drift time (ln t′D on X-axis) was constructed accord-ing to Ruotolo et al. [30] using the following equations:
t0D ¼ t0−
cffiffiffiffiffiffiffi
m=zp
1000
" #
ð1Þ
with c = 1.4 (enhanced duty cycle (EDC) delay coefficient) andto the observed drift time in milliseconds;
Ω0 ¼ Ω
z�ffiffiffiffiffiffiffi
1�
μ
qh i ð2Þ
with z the charge, Ω the CCS for the polyAla specie [31] and1μ ¼ 1
M þ 1mwhereM is the ionmass of the polyAla specie andm
the atomic mass of N2 (ion mobility drift gas).The standard curve was fitted to lnΩ′ =Aln t′D + lnB, where
A is the exponential factor used in Equation 3 and B a fittedparameter.
The double correction of tD was done using the followingequation:
t00D ¼ t
0AD � z�
ffiffiffiffiffiffiffi
1�
μ
q
ð3Þ
The CCS values of the individual peptides and complexeswere calculated, according to Ruotolo et al. [30], from thepolyAla calibration curve of t
0 0D versus CCS (or Ω) values from
literature [31]. Refer to Supplementary Data for detail on theCCS result for polyAla calibration (Supplementary Figure 12A).
The collision energy (CE) to fragment or dissociate 50% ofthe molecular ion specie, which is an approximation of 50% ofELAB or laboratory frame energy to fragment/dissociate molecu-lar ions [32, 33], is denoted as CE50 and was calculated by fittinga Boltzman sigmoidal curve with the equation (Equation 4):
Y ¼ Ymin þ Ymax−Yminð Þ.
1þeð ÞCE50−�ð Þ
.
slope ð4Þ
where Y is the % loss of ion abundance of each of the differentheterodimer species, Srf variants and GS that is recorded foreach CE, Ymin the minimum % loss in ion abundance approx-imating zero (bottom of sigmoid), Ymax the maximum% loss in
abundance approximating 100% (top of sigmoid), and CE50 theCE at 50% response, with x the set CE from 10 to 75 eV.
Center of mass collision energy or ECM was calculated fromthe following equation:
ECM ¼ ELAB �mAr= mAr þMð Þ ð5Þ
where ELAB is taken as the set CE, m is the atomic mass of thecollision gas argon, andM the molar mass of the peptide ion orheterodimer ion [32, 33].
The GS where half maximal GS~Srf ion abundance isreached, denoted as C50, was calculated from the ESI-MStitration data (refer to Figures 5 and 6 under Results andDiscussion) by fitting a sigmoidal curve with variable slopeusing a four parameter logistic equation:
Y ¼ Ymin þ Ymax−Yminð Þ.
1þ10ð ÞlogC50−�ð Þ � slope ð6Þ
where Y is the % ion abundance of each of the differentheterodimer species (or Srf variants) that is recorded for eachGS concentration, Ymin the minimum% ion abundance approx-imating zero (fitted bottom of sigmoid), Ymax the maximum ionabundance approximating saturation (fitted top of sigmoid),and x is the logarithm of GS concentration.
The apparent dissociat ion constant (Kdapp) for
GS∼Sr f↔GSþ Sr f in the gas phase was calculated from theESI-MS-TOF spectra with CV at 25 V (example of spectrumshown in Figure 2) using an equation adapted from [34]:
Kappd ¼ R�ISr f
.
IGS∼Sr f
� �
,
1þR�ISr f
.
IGS∼Sr f
� �
ð7Þ
where I is the signal intensity and R is the ratio of the responsefactors (f) of the molecular ions [GS ~ Srf + 2H]2+ and [Srf +H]+ [34, 35]. We calculated a relative f for Srf (fSrf= (ISrf/IGS) ×1.00), using the signal intensities at standard concentrations(150 and 200 μM) and different injection volumes (3, 4, and 5μL) as 1.0 ± 0.1 (n = 6). Total signal intensity of each ion wasderived using the MaxEnt 3 algorithm considering m/z from800 to 3000. As it was not possible to obtain a true f for [GS ~Srf + 2H]2+, we had tomake an assumption thatR = 1.0.C0 wastaken as [Srf] + [GS~Srf] = [GS]+[GS~Srf]. The term IGS~Srfdenotes the sum of the signals from heterodimeric complexesGS ~ Srf1-5 and ISrf the sum of the signals of Srf1, Srf2, Srf3,Srf4, and Srf5 (refer to Table 1 for structures).
Circular dichroism data from a previous study on GS andSrf interaction [1] was used to calculate the Kd
app for solution-phase interaction. The average molar ellipticity at 206 ± 3 nmfrom the monomer-heterodimer model for GS ~ Srf ↔ GS +Srf, was used in the following equation from [36]:
Kappd ¼ GS½ �� Sr f½ �=GS∼Sr f½ � ¼ 2Pt � 1− f tð Þ2
.
f t ð8Þwhere Pt is the total peptide concentration and ft = (θobserved −θoligomer)/(θGS in TFE − θoligomer); θoligomer was taken as 20.7 ×
M. Rautenbach et al.: ESI-MS Study of Gramicidin S-surfactin Hetero-oligomers 1627

103 deg.cm2.dmol-1, as determined from a pre-incubated sam-ple of GS and Srf.
Results and DiscussionDetection of the ESI-MS Stable Srf-GS Complexes
When an equimolar mixture of GS and Srf in 50% acetonitrilewas subjected to ESI-MS-TOF analysis, a considerably lowerSrf signal was detected, compared with the intense doublycharged specie of GS at m/z 571.36 (Figure 2). This differencewas expected as the five lipopeptide variant groups in the Srfcomplex (refer to Table 1 for structures) are neutral at acidic pHand negative at neutral pH. The Srf signals are lower becausethese lipopeptides Srf will only be protonated (charged) on oneof the amides in the MS source as the ESI-MS was performedin the positive mode. However, the combined signals andresponse of the singly charged Srf ions were highly comparableto the singly charged GS ion at 1141.71 (Figure 2), and wetherefore focused these ion signals in the analysis and calcula-tions. Refer to the Supplementary Data for details on thespectra of the individual peptides (Supplementary Figure 9).
In addition to the individual peptide species, the mixture of GSand Srf contained a range of molecular species corresponding tothe m/z ratios of doubly charged peptide heterodimers (GS~Srf)(C1–C5 in Figure 2, Table 1). Low CE CID of GS~Srf3 (m/z1082.18) showed that this molecular ion complex is composed ofGS and the Srf3 variants withMr = 1022.65 (SupplementaryData,Supplementary Figure 10). The identified components in theGS~Srf3 and other GS~Srf heterodimers are listed in Table 1.
In addition to the 1:1 hetero-oligomers, low abundance 1:2(GS~2Srf) and 2:1 (2GS~Srf) oligomers were also detected insome samples (insert in top spectrum of Figure 2). No triplycharged or quadruply charged species corresponding to hetero-oligomers were detected in our analysis over the m/z = 200–2000. In subsequent analyses over a broaderm/z range, we alsodid not detect doubly changed hetero-oligomer ions containingthree Srf or three GS molecules (results not shown). As Srf5,GS~Srf5, and the heterotrimeric complexes had low abundancein our samples subjected to ESI-MS analysis, we focused therest of this study on Srf1-4 variants and GS~Srf1-4 heterodimers(Figure 2, Table 1).
The complexes that formed were further assessed with IM-MS to determine if the GS~Srf heterodimers had multipleconformers, which would indicate a more random or lessspecific peptide association (Figure 3). We examined the purepeptides and found that both GS and the Srf variants had a drifttime (or arrival time) around 13 ms (compare Figure 3a with c).Three drift peaks of the [GS +H]+molecular specie indicated atleast three GS conformers and corresponded to CCS of 353 ± 5Å2 (Figure 3c), which is about 35% larger than the CSS for GSin He observed by Ruotolo et al. [37]. A change in the GSprofile was observed for the peptide mixture, which yieldedonly one major peak at CCS of 353 Å2 for GS (compareFigure 3c with d). It has previously been shown that GS hasdifferent conformers [3, 4, 37] and this result is a strong
indication that certain conformers of GS (CCS 348 Å2 and358 Å2) preferentially bound to Srf.
Similarly to Srf variant retention on C18-UPLCmatrix, the iondrift time of the singly charged Srf1-4 variants in the pure peptidecomplex increased linearly with Mr and there is a direct linearcorrelation between drift time (tD′′) andUPLCRt (SupplementaryFigure 12C and D in Supplementary Data). This indicated thatthe larger Srf variants with longer fatty acyl chains and Leu/Ileinstead of Val in their peptide sequence moved slower throughthe ion mobility cell because of their larger CCS (refer to Table 1for more detail). Furthermore, they were retained longer on theC18 matrix in the same order because their increase in sizecorrelated directly with an increase in hydrophobicity that trans-lated from the longer fatty acyl chain and Leu/Ile instead of Val(Supplementary Data, Supplementary Figures 11 and 12). Driftpeaks of the five Srf variants clustered with derived CCS valuesbetween 344 and 360 Å2 (Figure 3a, Table 1). Goodwin et al.[38] found that CCS calibrationwith linear peptides such as thosein the polyAla preparation led to an underestimation of CCSvalues of cyclic peptides. We calculated that the derived CCSvalues for the Srf variants may be underestimated by about 11%(refer to Supplementary Data, Supplementary Figure 12B). Re-gardless, there is approximately a 4 Å2 incremental increase fromSrf1 to the largest group Srf5, indicating an identical/incrementalchange in structure, possibly the elongation/methylation of thefatty acyl chain. The profile of the Srf variants changed in theequimolar peptide mixture and we observed two main peaks(compare Figure 3a with b). This can be due to the loss of someSrf variants because they preferentially interacted with GS andwere transferred into a GS~Srf oligomer.
Only heterodimeric complexes of GS~Srf were observed,probably because of the lower sensitivity in the IM-mode and/or because the lower abundance larger oligomers did not survivethe ion mobility cell (Figure 3e–h). The doubly charged ions ofGS~Srf1 and GS~Srf2 heterodimers both had a drift time corre-sponding to a CCS of 519 Å2, whereas slightly larger CSS valuesof 524 Å2 and 527 Å2 were observed for the more hydrophobicGS~Srf3 and GS~Srf4 heterodimers, respectively (Table 1,Figure 3). These clustered CCS values and narrow, nearly sym-metrical IM-MS peaks indicate that the heterodimers have similarconformations and that the two peptides have a compact structuredue to specific interactions. The contribution of each of the Srfvariants to the complex was calculated from the IM-MS profilesas: GS~Srf1 = 3%,GS~Srf2 =11%,GS~Srf3 = 43%, andGS~Srf4= 43%. These IM-MS detected abundances indicated that thesurviving heterodimers were not directly related to the Srf variantabundance but rather to the differences in hydrophobicity of theinteracting Srf variants, as determined by C18-UPLC-MS, whichwill naturally reflect in the heterodimers (refer to SupplementaryData, Supplementary Figures 11 and 12).
Stability of the Peptides and GS~SrfHetero-Oligomers
CID experiments were performed with the ESI-MS-TQ toevaluate the relative gas-phase stability of the peptides and
1628 M. Rautenbach et al.: ESI-MS Study of Gramicidin S-surfactin Hetero-oligomers

their heterodimeric complexes (Figure 4). CID induces aunimolecular decay of selected ions with sufficient internalenergy upon collision with a neutral gas [39] and CID-derived binding energy of noncovalent complexes reflect theorder of solution phase binding energies [21, 22]. The CID
results indicated that all the Srf variants required a similar CE50with an average of 34.0 ± 0.4 eV. The apparent stability of GSwas significantly higher at CE50 = 42.3 ± 2 eV than thedifferent Srf variants. If only the CE is considered, the variousGS~Srf heterodimers showed similar stabilities during CID,
m/z
1000 1020 1040 1060 1080 1100 1120 1140 1160 1180 1200
%S
ig
na
l
0
1001141.72
1082.70
1082.20
1022.68
1008.66
994.64
1075.70
1036.691068.68
1089.20
1090.70
1127.70
1113.68
1142.72
1143.72
1163.70
[M+H]+
[M+Na]+[M1+H]+
[M2+H]+
[M3+H]+
[M4+H]+
[C3+2H]2+
[C4+2H]2+
[C5+2H]2+
[C2+2H]2+
[C1+2H]2+
m/z
1540 1560 1580 1600 1620 1640 1660 1680 1700
%
0
1001599.5437
1593.0342
1592.0406
1586.0334
1585.0248
1578.5101
1578.0243
1571.5240
1600.5397
1606.5566
1652.5410
1607.5547
1651.54681608.0452
1645.5524
1613.5498
1614.5500 1644.5426
1615.0415
1659.5621
1660.0604
1660.5588
1666.5626
1671.0413
GS~Srf
GS~2Srf
2GS~Srf
m/z
300 400 500 600 700 800 900 1000 1100 1200 1300 1400 1500 1600 1700 1800 1900
%S
ig
na
l
0
100571.36
1141.701082.19
2000
1090.21
Figure 2. A representative ESI-MS-TOF ion spectrum of an equimolar Srf-GS mixture. The top spectrum shows the signalcomparison of the intense doubly charged specie of GS at m/z 571.36, with the singly charged GS specie at m/z 1141.7, as wellthe oligomeric species (GS~Srf). The extracted heterotrimeric specie spectrum is shown in the insert of the top spectrum. Theextracted bottom spectrum shows singly charged GS (denoted M) and four different singly charged Srf variants (M1–M4). The fivedoubly charged 1:1 GS~Srf heterodimers (denoted C1–C5) are also indicated
M. Rautenbach et al.: ESI-MS Study of Gramicidin S-surfactin Hetero-oligomers 1629

but these noncovalent heterodimers were more unstable thanthe individual peptides with an average CE50 of 18.9 ± 0.1 eV(Figure 4a).
Slightly different CCS values were found for the different Srfvariants, as deduced from their traveling wave IM behavior(Figure 3, Table 1). Differences in CCS, molecular volume,area, and mass of the peptides and complexes, as well asdifferences in charge complicate the interpretation of the CE50results in terms of comparative stability. As an increase of sizeleads to an increase in CCS of a molecule and the larger CCS ofcomplexes will statistically collide with more target gas atomsthan the individual peptides, this may lead to increased fragmen-tation. On the other hand, smaller molecules have higher kineticenergy that can also translate into increased fragmentation reac-tions. The center-of-mass CE (ECM) takes the size of the mole-cule into account and was calculated to directly compare thestability of the different peptides and heterodimeric complexes[32, 33]. The expected exponential decrease in detection ofintact molecular ions was found when ECM was plotted againstthe ion abundance. The trends of the semi-log plots revealed adistinct difference in stability (Figure 4b, c). GS had a similar
stability to the smaller, less hydrophobic Srf1 and Srf2 variants,which in turn were more stable than the more hydrophobicvariants in Srf3 and Srf4 groups (compare slopes in Figure 4b).In the case of these peptides, the enhancing effect of higherkinetic energy of the smaller peptides on fragmentation reactionswas probably outweighed by the differences in CCS. The sta-bility difference can possibly be attributed to a more rapiddecomposition of the slightly larger Srf3 and Srf4 variants(CCS 352 Å2 and 356 Å2, respectively), versus the smallerSrf1 and Srf2 variants (CCS 344 Å2 and 348 Å2, respectively)and cationic, more fragmentation-resistant peptide chain of GS[39] (refer to Table 1 for peptide structures).
The GS~Srf heterodimers containing the smaller Srf1 andSrf2 variants showed a similar trend with GS~Srf1 being sig-nificantly more stable than GS~Srf2 (compare slopes inFigure 4c). GS~Srf3 and GS~Srf4 were observed to be lessstable than GS~Srf1 and GS~Srf2 (compare slopes in Figure 4c,refer to Table 1 for structures). However, some weak Van derWaals forces (hydrophobic interactions) may survive undercertain ESI-MS conditions as we observed higher survival/abundance of GS~Srf3 and GS~Srf4 during normal mode
0
500
1000
1500
2000
2500
8.42
GS~Srf1; m/z = 1068-1070
EPo
sit
ive
io
n s
ign
al
0
2000
4000
6000
8000
10000
8.42
GS~Srf2; m/z = 1075-1077
Po
sit
ive
io
n s
ign
al
F
10 11 12 13 14 15
0
4000
8000
12000
16000
20000
24000
12.97
GS in mixture; m/z =1041.5-1142.8
Ion drift time (ms)
Po
sit
ive
io
n s
ign
al
D
0
10000
20000
30000
40000
50000
8.45
GPo
sit
ive
io
n s
ign
al GS~Srf3; m/z = 1082-1085
7.0 7.5 8.0 8.5 9.0 9.5 10.0
0
10000
20000
30000
40000
50000 8.49
GS~Srf4; m/z = 1089-1092
H
Ion drift time (ms)
Po
sit
ive
io
n s
ign
al
10 11 12 13 14 15
0
1000
2000
3000
4000
5000
6000
7000
Srf3
12.97
Srf2
12.42
Srf1-4 in mixture;m/z = 994.5-1037.7
B
Ion drift time (minutes)
la
ngi
sn
oie
viti
so
P
0
3000
6000
9000
12000
15000
12.70 Srf 313.04
Srf3
12.14 Srf 1
12.49 Srf 2Srf4
13.25
Pure Srf1-4;m/z = 994.5-1037.7
la
ngi
sn
oie
viti
so
P A0
6000
12000
18000
24000
30000
36000
12.7713.18
12.97
Pure GS;m/z =1041.5-1142.8
CPo
sit
ive
io
n s
ign
al
Sig
nal (
Cou
nts)
1600
GS
Srf1-4
GS~Srf C1-4
Figure 3. A representative 3D IM-MS graph of the equimolar Srf:GS mixture (top graph) and IM-MS of pure Srf (a) and GS (c) andtheir extracted profiles (b) and (d), respectively, in an equimolar Srf:GS mixture. Both the singly charged ions of Srf1-4 variants of Srfalone (a), or in the mixture (b), and the GS ion, alone (c), or in the mixture (d) showed a drift time around 13 ms. The extracted ionmobility profiles of the four doubly charged GS~Srf heterodimeric complexes (GS~Srf1-4) in the mixture were detected at 8.42ms forGS~Srf1 (e) and GS~Srf2 (f), 8.45 ms for GS~Srf3 (g) and 8.49 ms for GS~Srf4 (h). For the extracted ion profiles the major isotopicpeaks for each peptide or complex were considered
1630 M. Rautenbach et al.: ESI-MS Study of Gramicidin S-surfactin Hetero-oligomers

ESI-MS and IM-MS. This stability difference probably relatesto a total loss in residual hydrophobic forces for the heterodi-mers containing more hydrophobic Srf3 and Srf4 variants dur-ing the high energy CID exposure in the gas phase [19, 24, 25].Furthermore, the difference between IM-MS and CID stabilityis probably due to the lower energy experienced in the ionmobility cell versus that in the collision mode, which not onlyconstitutes a higher CE but also a higher concentration ofcollision gas (argon).
Interaction Parameters of the GS~SrfHetero-Oligomers
Antimicrobial peptides are dependent on both electrostatic andhydrophobic interactions with their target membranes. Similarinteractions are possible between the two peptides in this studyto form the hypothesized complexes or hetero-oligomers. Srf,an anionic lipopeptide containing a fatty acyl group, is consid-erably more hydrophobic than the cationic amphipathic GS.Therefore the two peptides can interact via hydrophobic inter-actions, which are generally more non-specific. More specificionic interactions can take place between the two cationic Ornresidues of GS and the anionic Asp and Glu residues in Srf. Asthere are also a number of functional groups in these peptides,polar or electrostatic interactions, such as dipole interactionsand hydrogen bonds in more hydrophobic environments, suchas membranes, are also highly probable.
It is well-known that hydrophobic interactions are highlydependent on the polarity of the solvent and a strong drivingforce in water for interaction between hydrophobic and/oramphipathic molecules. Conversely, the ionic/polar/electrostat-ic interactions are weaker in an aqueous environment, but willnaturally increase in a nonpolar solvent or when a noncovalentcomplex is transferred from an aqueous solvent into gas phase,such as during ESI-MS [26]. We therefore focused on the
polar/electrostatic interactions in the GS~Srf hetero-oligomers.These polar forces are the major contributors in Bin vacuo^interactions between compounds in the ESI-MS in which thehydrophobic force and concomitant Van derWaals interactionsare highly weakened [24–26].
When the individual Srf variants and GS~Srf heterodimerswere followed with ESI-MS-TQ over a GS concentrationrange, a classic sigmoidal concentration-dependent curve wasobserved for both the free Srf variants and the heterodimericcomplexes (Figure 5b). Without making any assumptions, weused Equation 6 to calculate a C50 or [GS] leading to a 50%change in a specific Srf or GS~Srf ion signal and found anaverage C50 of 9.9 ± 0.4 μM with saturation and loss of Srfsignal from 32 to 64 μM GS. As the Srf concentration was125 μM and Srf signals decreased to <10%, this is a strongindication that we did not detect neutral hetero-oligomers and/or larger oligomers.
Utilizing ESI-MS we determined an Bin vacuo^ or apparentdissociation constant (Kd
app) for the equilibrium GS ∼ Srf↔GS + Srf by incubating equimolar peptide mixtures. Kd
app
values were calculated, using Equation 7 [34], as 6.1 ±1.1 μM (n = 8) for the pre-incubated peptide mixtures and as9.2 ± 1.2 μM (n = 8) for the directly analyzed peptide mixtures.These Kd
app values were significantly different (P < 0.0001)and the decrease indicated a slow equilibrium. For a slowassembling process, the initial hydrophobic interactions be-tween Srf and GS can lead to Bseeding^ oligomers, whichsubsequently rearranges over time into more stable hetero-oligomers that are not solely dependent on hydrophobic inter-actions. We then used circular dichroism data from a previousstudy on GS and Srf interaction [1] and calculated a solutionphase Kd
app of 1.2 ± 0.2 μM for a pre-incubated sample usingEquation 8 [36]. As our focus is on the in vacuo interaction, amore detailed study on solution-phase molecular interactionbetween Srf and GS will be reported elsewhere. The observed
0 10 20 30 40 50 60 70 80
10
20
30
40
50
60
70
80
90
100
110
Srf1-4
GS-Srf C 1-4
GS
A
ELAB
(eV)
ec
na
dn
ub
an
oI%
0.0 0.5 1.0 1.5 2.0 2.5 3.0
0.0
0.2
0.4
0.6
0.8
1.0
1.2
1.4
1.6
1.8
2.0
2.2 GS (slope -0.84)
Srf1 (slope -0.83)
Srf2 (slope -0.81)
Srf3 (slope -0.92)
Srf4
(slope -0.90)
B
ECM
(eV)
log
(Io
n a
bu
nd
an
ce
)
0.1 0.3 0.5 0.7 0.9 1.1 1.3 1.5
-1.5
-1.0
-0.5
0.0
0.5
1.0
1.5
2.0
2.5 GS-Srf1 (slope -2.2)
GS-Srf 2 (slope -3.1)
GS-Srf 3 (slope -4.1)
GS-Srf 4 (slope -4.1)
C
ECM
(eV)
log
(io
n ab
un
da
nce
)
Figure 4. ESI-MS-TQ stability of GS, Srf, and GS~Srf heterodimers. (a) CID of GS, Srf1-4 (average of Srf1-4 ± standard error of themean, SEM), and GS~Srf heterodimers (average of GS~Srf1-4 ± SEM); CE was varied from 5 to 75 eV with cone voltage set to 60 V.The dotted line shows the CE50 cutoff. Normalization to 100%was done using the highest signal for eachmolecular ion. (b)Semi-loglinear relationship (solid lines) of ECM (calculated with Equation 5 [32, 33]) with the peptides alone, and (c) with the different GS~Srfheterodimers. Linear regression analyses were done on the data points where at least seven consecutive points showed a linearresponse with the steepest slope. All the linear fits gave R2 > 0.95
M. Rautenbach et al.: ESI-MS Study of Gramicidin S-surfactin Hetero-oligomers 1631

in vacuo Kdapp for the pre-incubated sample was thus about 5-
fold higher than the Kdapp calculated for interaction in an
aqueous solution. Because the hetero-oligomers are exposedto the harsh conditions during the ESI-MS analysis (highsource and desolvation temperatures, low pH, organic solvents,and high voltages), there is most probably a loss of weakerseeding oligomers in the gas phase leading to a higherKd
app forGS ∼ Srf↔GS + Srf than in aqueous solution. This higher invacuo Kd
app could therefore be due to the loss of the hydro-phobic interactions, as well as an underestimation of the Kd
app
due to the approximated R used in Equation 7. It must also beconsidered that the ESI-MS analysis does not allow the obser-vation of neutral oligomeric species and higher order oligo-mers, while the probability of neutral and/or larger oligomerswas indicated by our titration studies (Figure 5, refer to discus-sion above).
Binding Interactions Between GS and Srf
Ionic interactions between GS and Srf are highly probable asGS has a 2+ charge and Srf a 2− charge at neutral pH. Danderset al. [40] and Nagamurthi and Raubhav [41] showed that morethan 98% of GS activity is lost when the two Orn residues areblocked with different groups. Acetylated GS, in which boththe amino groups of the Orn residues were acetylated, did notshow any ESI-MS stable hetero-oligomers with Srf (Supple-mentary Figure 13, Supplementary Data). This indicated that atleast one of the two Orn δ-amino groups of GS is necessary forinteraction with Srf or to form stable ESI-MS detectableoligomers.
It was previously shown that the carboxyl groups of L-Glu1
and L-Asp5 residues of Srf chelates both mono- and divalentcations, resulting in either partial or complete neutralization ofthe acidic residues [13, 42–46]. Since metal ion binding neu-tralizes the acidic residues, it offers a tool to investigate thepossibility of an ionic interaction with these residues through
competition studies. Addition of NaCl or CaCl2 to the peptidemixtures did not affect the signals of preformed ESI-MS-TQstable complexes up to 35.6 mM NaCl and CaCl2 (400-foldmolar excess) (Supplementary Figure 14 in SupplementaryData). The ESI-MS signal of all the heterodimeric GS~Srfcomplexes remained reasonably constant over both salt con-centration ranges (Supplementary Figure 14 in SupplementaryData). Similarly, GS signal intensity was generally unaffectedby increasing salt concentrations. Signal intensity of Srfshowed some fluctuation over the NaCl concentration rangewith a decrease in intensity at 35.6 mM salt, which is probablythe result of signal suppression by Cl− ions and Srf~Na com-plexation leading to the increase in the detection of the sodiatedSrf (Supplementary Figure 14 in Supplementary Data). How-ever, less than 1% sodiated or calciated GS~Srf complexeswere detected under these analyses conditions, indicating thatthese complexes are either unstable or not formed. Addition ofNa+ or Ca2+ to preformed GS~Srf hetero-oligomers does notdisplace GS from Srf, which indicates that the interaction ismore complex than just pure ionic interactions between twooppositely charged peptides. However, this result does not ruleout the possibility of ionic interaction as one of the interactingforces because an Asp~Orn and/or Glu~Orn salt-bridge couldbe buried and shielded within the preformed hetero-oligomers.
This aspect was further investigated by pre-incubation of Srfwith salts and then titration with the GS. As there is alwayssome environmental Na+ in solvents, for example sodiumleaching from soda glass, the sodium adducts of Srf variants,in particular for the Srf3 variants, are generally observed in ESI-MS spectra. We found that the Srf3~Na complex (and othersodiated complexes) decreased in the same manner as the freeSrf3 with the increase inGS andGS~Srf complexes (Figure 5a),indicating that GS out-competes Na+ from Srf.
As it is known that Srf forms ionic complexes via L-Glu1
and L-Asp5 residues with Ca2+ [13, 42–46], the effect of GS onSrf~Ca complexes was investigated by the titration of Srf pre-
0.0
078125
0.0
15625
0.0
3125
0.0
625
0.1
25
0.2
50.5 1 2 4
0
10
20
30
40
50
60
70 GS Srf3-Na
Srf3,4 GS-Srf3,4
A
Ratio [GS]/[Srf]
ec
na
dn
ub
an
oI%
0.0 0.2 0.4 0.6 0.8 1.0 1.2 1.4 1.6 1.8 2.0 2.2
0
10
20
30
40
50
60GS-Srf2
GS-Srf3
GS-Srf4
Srf2
Srf3
Srf4
B
log [GS] M
% Io
n a
bu
nd
an
ce
Figure 5. Influence of GS concentration on the formation and detection of GS~Srf heterodimers, as well as detection of Srf and GS([M + H]+) using the ESI-MS-TQ. Srf at 125 μMwas titrated with GS. (a) The results of a representative titration experiment with totalabundance of Srf3,4 variants and GS~Srf3,4. (b) Sigmoidal response of each of the Srf2-4 variants and GS~Srf2-4 heterodimers tocalculate the C50 values for GS binding to Srf. Percentage ion abundance was calculated in terms of the total molecular ion intensityof the monitored ions in each sample
1632 M. Rautenbach et al.: ESI-MS Study of Gramicidin S-surfactin Hetero-oligomers
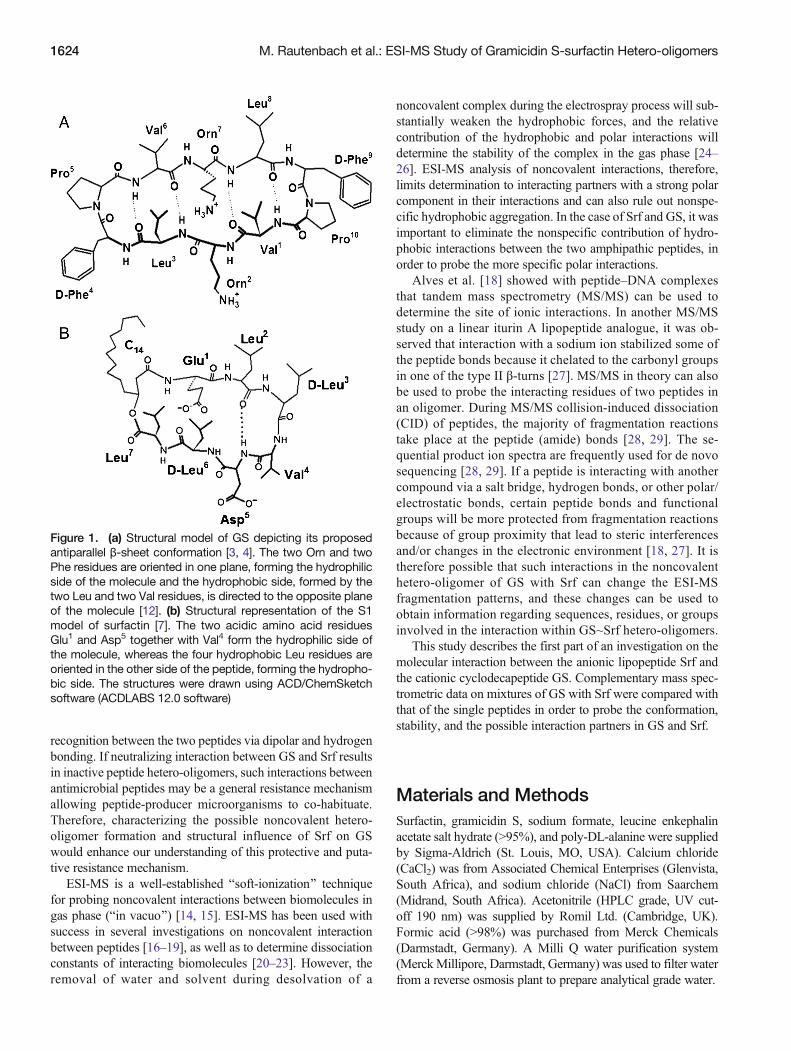
incubated with CaCl2 with GS. In the samples without GS, weobserved calcium–Srf complexes consistent with other reports[13, 42, 44]. These monomeric and dimeric complexes allconsisted of Srf~Ca in an 1:1 ratio. When the calcium-incubated Srf was then titrated with GS, the observed ESI-MS spectral changes indicated that GS~Srf complex formationtakes place in favor of Srf~Ca complex (Figure 6).
All the Srf~Ca complexes decreased over the whole GSconcentration range (Figure 6b), similar to that of the free Srfspecies with Srf3 and Srf4 showing the highest free peptidesignal at low GS (Figure 6a). In the reagent mixture containingCaCl2, at the lowest concentration of GS, the GS~Srf2 signalwas the highest, but decreased with the GS concentrationincrease, whereas GS~Srf1 remained relatively constant. How-ever, GS~Srf3 and GS~Srf4 concomitantly increased with theSrf and Srf~Ca decrease, indicating a dynamic exchange/equilibrium from GS~Srf2 in favor of GS~Srf3 and GS~Srf4at higher GS concentrations (Figure 6c). GS~Srf3 and GS~Srf4each increased up to 45 μMGS (GS:2Srf ratio), after which thesignal remained relatively constant (Figure 6c). It is interestingto note that the free GS signal only started to substantiallyincrease at >40 μM. The total GS~Srf and GS~2Srf oligomer
signals increased over the entire concentration range, with aconcomitant decrease in Srf, Srf~Ca, and 2Srf~2Ca ion signals(Figure 6d). The Kd
app for GS ∼ Srf↔GS + Srf in the presenceof Ca2+, calculated from Equation 7, was 17 ± 4 μM.ThisKd
app
is nearly 2-fold higher than the Kdapp for the directly analyzed
mixtures without Ca2+. This result indicates that GS still bindsto Srf in the presence of Ca2+, but that GSmay have to competewith Ca2+ for binding to Srf or that the specific Ca2+-inducedSrf conformation [43, 47] has a weaker affinity for GS.
The hetero-trimer ion signals for GS bound to two Srfspecies were again detected and increased over the GS concen-tration range, but were much less pronounced than the 1:1heterodimers (Figure 6d). We also observed that GS additioninterferes with multimeric Ca~nSrf complexes, which mayindicate that GS out-competes calcium from the dimeric com-plexes to form GS~2Srf (Figure 6d). Alternatively, as the Srfconcentrations were more than 10-fold the critical micellularconcentration (CMC) of 7.5 μM [46], the interaction of GSmay be with the micellular Srf [43, 47], of which the hydro-phobic interactions are disrupted during the ESI-MSdesolvation process. However, the significance of cyclic pep-tide β-turns in cation chelating has previously been
0.0 0.4 0.8 1.2 1.6 2.0 2.4 2.8
0
2
4
6
8
10
12
14
16
18
Srf3
Srf1
Srf2
Srf4
A
log [GS ] M
la
ngi
S%
0.0 0.4 0.8 1.2 1.6 2.0 2.4 2.8
0
2
4
6
8
10
12
14
16
18 Srf1-Ca
Srf2-Ca
Srf3-Ca
Srf4-Ca
B
log [GS] M
% S
ign
al
0.0 0.4 0.8 1.2 1.6 2.0 2.4
0
2
4
6
8
10
12
14
16
18 GS-Srf1
GS-Srf2
GS-Srf3
GS-Srf4
C
log [GS] M
la
ngi
S%
0.0 0.4 0.8 1.2 1.6 2.0 2.4 2.8
0
10
20
30
40
50 Srf1-4
Srf1-4-Ca GS-Srf1-4
GSD
GS-2Srf2Srf-2Ca
log [GS] M
% S
ign
al
Figure 6. The influence pre-incubation of 90 μM Srf with 10-fold excess CaCl2 on the formation/detection of GS~Srf hetero-oligomerswhen titratedwithGSas analyzedwith ESI-MS-TQ. (a)%Signal of Srf variants 1–4 over theGSconcentration range; (b)%signal of Srf variants 1–4 oligomerizedwith Ca2+ over the GS concentration range; (c)%Signal of GSoligomerized to Srf variants 1–4over the GS concentration range; (d) averaged %signal of the different Srf, Srf~Ca, 2Srf~2Ca, GS~Srf, GS~2Srf, and GS molecularspecies over the GS concentration range. Data are the average of two titration experiments (only [M + H]+ depicted for GS).Normalization of signal data was done using sum of the ion signals of the participating ion species as 100%
M. Rautenbach et al.: ESI-MS Study of Gramicidin S-surfactin Hetero-oligomers 1633

demonstrated for the analogous lipopeptide, iturin A [27, 48];therefore, it is also possible for a cationic δ-amino group of Ornin GS to interact via ion-dipole interactions with the carbonylgroups in a β-turn in Srf [8, 44]. Regardless of the oligomericstate of Srf, these results show that GS competes with Ca2+ forbinding to the anionic Srf or that GS changes Srf’s affinity forCa2+ by its initial interaction and subsequent binding. Theseobservations also support the role of hydrophobic interactionsin that the less hydrophobic Srf1 and Srf2 species seem to favorCa2+ interaction, whereas the more hydrophobic Srf3 and Srf4species favor GS interaction.
CID of a GS~Srf Heterodimer
To further explore noncovalent interaction, the oligomerizationbetween GS and surfactin were investigated utilizing CID. In anoligomer, certain peptide bonds will be protected from fragmen-tation when they are either hidden or partaking in polar orhydrogen bonds. A change in peptide conformation in anoligomer could, on the other hand, expose certain bonds tofragmentation reactions. However, it is highly possible thatduring CID process all noncovalent interactions within anoligomer will be broken prior to the covalent fragmentation. Ifthis is the case, identical fragmentation patterns will be observedbetween the free peptides and those liberated from the oligomer,albeit at lower intensity. If there is a change in product ionpattern, this could indicate strong interactions in hetero-oligomers leading to altered fragmentation of peptide bound inthe oligomer. This altered fragmentation was indeed observed inthis study, which indicated that some of the fragmentationreactions took place within the GS~Srf heterodimer. Thesechanges were used to identify residues and sequences thatpartake in the polar interactions within a GS~Srf heterodimer.
One of the prerequisites in the fragmentation of cyclicpeptides is the controlled opening of the backbone ring. For
GS, the ring opening mostly occurs at the N-terminal side ofone of the Pro residues [49, 50] as a consequence of thepreferential fragmentation of the N-terminal peptide bond ofPro [51, 52]. A second ring opening is between the Orn-Leuresidues [49, 50] and this frequently leads to the so-calledBornithine effect^ [53, 54]. During this, a fragmentation reac-tion at the C-terminal of an Orn residue leads to cyclisation inwhich the Orn side chain participates [53, 54]. The CID on thesingly charged GS (m/z = 1141.7137) yielded all the majorfragment ions from the b-series, except b6 (PVOLFPV) arisingfrom the ring-opening of GS at one of the Pro-Val moieties,correlating with previous research (Figure 7a) [49, 50]. Theabsence of this b6-ion is expected as the C-terminal bond of aPro-residue is more stable than the N-terminal bond, although alow abundance b3 ion (LFP), probably derived from the Orn-Leu ring opening, was observed [51, 52]. Internal fragments orb-ions from a Phe-Pro ring-opening were also abundant in theCID spectrum of GS (Figure 7a). The b2-ion and its a2-ion,corresponding to the Pro-Val sequence, were the most abun-dant product ions (25%–30% abundance) observed for the freeGS, probably because of the inherent stability of the C-terminalpeptide bond with Pro [51, 52] (Figure 7a). Most of the GSproduct ions generated from GS~Srf3 were similar to that offree GS; however, there were a number of major differences inthe product ion pattern (Figure 7a). The b5 ion (PVOLF orLFPVO), one of the most abundant product ions in the free GSspectrum, was not observed upon CID of the heterodimer ion(m/z 1082.1945), whereas the dehydrated b5 ion abundancedecreased significantly (Figures 7 and 8). In our initial CIDanalyses, we did observe the b5 ion in the CID spectrum of GSfrom GS~Srf3, but we found this was due to persistent GScontamination in the instrument from previous analyses (resultsnot shown). No FPV and LFP product ions were observed,whereas the b2 ion, PV, almost doubled in abundance(Figure 7a). The increased b2 abundance could also indicate
FPV (if)
FP (if)
FPVOLF (if) )
2
LF (a
)2
LF (b O
)
2-H3
LFP (b
)3
LFP (b
)4
LFPV (a
)4
LFPV (b O
)
2-H5
LFPVO
/PVOLF (b
)5
LFPVO
/PVOLF (b O
)
2-H6
LFPVO
L (b
)6
LFPVO
L (b O
)
2-H7
LFPVO
LF (b
)7
LFPVO
LF (b O
)
2
OL (if-H V
O (if) )
2
PV (a
)2
PV (b
)3
PVO (b O
)
2-H4
PVOL (b
)4
PVOL (b
)7
PVOLFPV (b
)8
PVOLFPVO (a
O2
GS-H
0
1
2
3
4
5
6
7
8
9
10
11
12
13
14
A
GS1
GS+Srf3
GS fragment sequence
SG
ro
fe
cn
ad
nu
ba
noi
tn
em
ga
rF
%
/if-CO)
2
LX/L
L (y
)/LL (if)
2
LX (y
)3
DLX (y
)/LVDL(if)/L
LVD(if)
4
VDLX(y
)/LLVDL (if)
5
LVDLX (y
)6
LLVDLX (y
+OH)
6
LLVDLX (y
DL (if-C
O)
VDL(if)/L
VD (if)
-H2O)
2
E (b
14
C
)2
E (b
14
C
O)
2-H3
EL (b
14
C
)3
EL (b
14
C
O)
2-H4
ELL (b
14
C
)4
ELL (b
14
C
)5
ELLV (b
14
C
O)
2-H7
ELLVDL (b
14
C
)7
ELLVDL (b
14
C
)8
ELLVDLX (a
14
C
O2
-H3
Srf
0
2
4
6
8
10
12
14
16
18
20
22
24
26
28
B
Srf3
GS-Srf3
Srf fragment sequence
% F
ra
gm
en
t io
n a
bu
nd
an
ce
fo
r S
rf
3
Figure 7. Comparison of CID generated product ions of GS and Srf alone and from the GS~Srf3 heterodimer. (a) Comparative bargraph of the GSproduct ions, and (b)Srf product ions with X being either Ile or Leu. Data are the average ± standard deviation of nineand five CID spectra for the free peptides and heterodimer, respectively. Representative CID spectra are supplied in SupplementaryFigure 15 and for details on product ions refer to Supplementary Table 2 (Supplementary Data)
1634 M. Rautenbach et al.: ESI-MS Study of Gramicidin S-surfactin Hetero-oligomers

that the Val–Orn amide bond is in another environment orconformation in the heterodimer, exposing it to CID reactions.These results also indicate that peptide bonds leading to ringopening and flanking the GS pentapeptide moieties, PVOLF(or LFPVO), are protected in the GS~Srf complex. One part ofthe GS molecule may be participating in interaction with Srf,while a peptide moiety containing an Orn may be exposedleading to the formation of the PVO and PV fragments(Figure 7a). Refer to Supplementary Figure 15 for examplesof product ion spectra and Supplementary Table 2 for details onthe product ions in the Supplementary Data.
As Srf consisted of several peptides, we focused our struc-tural study on the most abundant variant group, namely Srf3with m/z = 1022.6752. In a 2D nuclear magnetic resonancestudy by Eyéghé-Bickong [55] it was found that the mostabundant peptide sequence in the Srf lipopeptide complex usedin this study is L-Glu-L-Leu-D-Leu-L-Val-L-Asp-D-Leu-L-Leu (ELLVDLL). From the CID product ions it was deducedthat C14 is the major fatty acyl group in the Srf3 variant group.We found two major peaks for Srf3 with UPLC-MS, whereasIM-MS only showed one major peak (Figure 3a, and Supple-mentary Figure 11 in Supplementary Data). This indicated twomajor species with nearly similar CCS, but slightly differenthydrophobicity. From these data we deduced the major Srf3variant structure as cyclo[(C14H26O2)-L-Glu-L-Leu-D-Leu-L-Val-L-Asp-L-Leu-L-X] with X as Ile or Leu. For Srf the ringopening generally occurs at the lactone bond [56]. The CID ofthe Srf (m/z = 1022.6752) led to all the major product ions fromthe b-series, except b6 (C14ELLVD) (Figure 7b). The absenceof the b6 fragment ion is expected as the N-terminal peptide
bond of an acidic residue is very labile [57]. Internal fragmentsand the entire y-series of product ions were also observed in theCID spectrum of free Srf (Figure 7b). The hydroxylated y6 ion(LLVDLX) showed the highest abundance at 17%, with mostof the other product ions at 2% to 7% abundance (Figure 7band Figure 8). As for the GS product ions, most of the Srffragments from GS~Srf3 was generated at similar abundancesto that of free Srf3 (Figure 7b). The most dominant product ionwas also the hydroxylated y6-fragment, but its abundanceincreased to 24% (Figure 7b and Figure 8). The decarboxylatedy2 ion (LL or internal fragment LX) and y6 ion (LLVDLX)were not observed (Figure 7b and Figure 8). This indicates thatthe carboxyl group of LL/LX is protected in the heterodimer,whereas y6 ion (LLVDLX) is not formed, probably because theSrf interaction with GS favors the y6 hydroxylation reaction.These results further indicate that peptide bonds in the Srfpeptide moiety, LLVDLX, and especially the highly labile N-terminal bond of the Asp residue, were protected in the GS~Srfcomplex. On the other hand, the peptide bonds in which Glu,the other acidic residue in Srf, participates, were not protectedin GS~Srf3 as CID generated a substantial amount of the b2 ion(C14E), indicating similar exposure in the oligomer than in thefree Srf3. If the C14E is imbedded in the Srf micelles,obstructing GS interaction, this moiety will be exposed tofragmentation reactions, resulting in the b2 ion, when thehydrophobic effect is removed during the dehydration in themass spectrometer [23–25]. Refer to Supplementary Figure 15for examples of product ion spectra and Supplementary Table 2for details on the product ions of Srf3 and GS~Srf3 heterodimerin Supplementary Data.
ConclusionsOur results corroborate the hypothesis that the cationic GS andanionic Srf interact to form GS~Srf hetero-oligomers. Thesenoncovalent interactions could be a factor in the observedantagonism of the GS antimicrobial activity by Srf [1]. ESI-MS of the equimolar GS:Srf mixture revealed the presence ofnoncovalent GS~Srf heterodimers, which were not observed inthe equimolar mixture of diacetylated GS and Srf. This indi-cated that one or both the cationic δ-amino groups of GS areprobably essential for formation of ESI-MS stable and visibleGS~Srf hetero-oligomers. This study revealed that polar inter-actions, including ionic interactions between the two peptidescould take place via a slow equilibrium pointing to an assemblyprocess. These interactions could be shielded as stable GS~Srfhetero-oligomers were observed even in a high salt (NaCl andCaCl2) environment. The CID product ions of GS~Srf3 indi-cated that VOLFP (or LFPVO) from GS was not generated,whereas the hydroxylated LLVDLX fragment from Srf was themost abundant. These two sequences contain an Orn and Aspresidue that can partake in an ionic and/or polar interaction(s).The flanking hydrophobic residues can partake in hydrophobicinteractions that would stabilize the complex and shield suchelectrostatic interactions in an aqueous environment. Eyéghé-
Figure 8. Representative CID spectra over m/z 500–700 forcomparison of CID product ions of GS and Srf alone with that ofGS~Srf3 heterodimer. CID analyses were performed over a CEgradient from 30 to 80 eV at a CV of 25 V. For more details onthe product ions, refer to Supplementary Table 2 (Supplemen-tary Data)
M. Rautenbach et al.: ESI-MS Study of Gramicidin S-surfactin Hetero-oligomers 1635

Bickong [55] found that Srf interaction with GS places the Pheand Orn residues in a more shielded environment, indicating arole of these residues in the Srf interaction. However, from ourstudies, the Glu residue and the fatty acid moiety in Srf do notseem to partake in the oligomerization. This could be a strongindication that the C14Emoiety is obscured in the Srf micellularstructure [43, 47] in an aqueous environment with the Asp andflanking hydrophobic amino acids being available to interactwith the VOLFP moiety in GS leading to the formation ofinactive GS~Srf hetero-oligomers. Furthermore, the GS~Srfheterodimers containing the most hydrophobic Srf3 and Srf4variants were the most abundant species that survived withinthe ESI-MS and especially during IM-MS analysis. This indi-cates that these heterodimers were not only the most abundantin an aqueous solution but that their hydrophobicity and pos-sibly their micellular structures may be important in seedinginteraction with GS. The IM-MS studies also indicated that Srfcould have a preference for specific GS conformers, possiblythose in which an optimal interaction can take place. Nearlysymmetrical IM-MS peaks of the GS~Srf heterodimers furtherindicated a compact dimer conformation, which is dependenton specific noncovalent interactions between the two peptides.
It would be expected that Kd values for GS∼Sr f↔GSþ Sr fwould be in the low micromolar range, considering the 2- to 3-fold increase in the [GS], for example from 2 μM alone to 5 μMwith the presence of Srf, which is needed to inhibit 50% Bacillussubtilis (bacterial) growth [1]. The deduced Kd
app values of6 μM in gas phase and 1 μM in aqueous phase forGS∼Sr f↔GSþ Sr f fell indeed within the peptides’ biologicalconcentration range. However, such antagonistic peptide–pep-tide interaction may not be limited to this antimicrobial peptidepair. In light of the role of such an interaction in bacterialresistance, it may be worth investigating other possible antago-nistic interactions between peptides produced by cohabitingmicroorganisms, for example, small cyclic lipopeptides likesurfactin, iturins, and fengycins, and peptides that contain thegramicidin S VOLFP sequence such as the graticins, tyroci-dines, and streptocidins.
AcknowledgmentsThe authors thank the staff of the LCMS Central Analyticalfacility at the University of Stellenbosch for technical assis-tance with the mass spectrometry on the Synapt G2 instrument.The authors also acknowledge the two excellent reviewers whohelped us to improve this paper. The project was funded by theBIOPEP Peptide Fund; M.R. thanks all the members from theBIOPEP Peptide Group who over the last two decades put inmany extra hours to work on contracts in order to fund orphanresearch projects such as this reported study.
References
1. Rautenbach, M., Eyéghé-Bickong, H.A., Vlok, N.M., Stander, M., DeBeer, A.: Direct surfactin-gramicidin S antagonism supports
detoxification in mixed producer cultures of Bacillus subtilis andAneurinibacillus migulanus. Microbiolgy 158, 3072–3082 (2012)
2. Consden, R., Gordon, A.H., Martin, A.J.P., Synge, R.L.M.: GramicidinS: The sequence of the amino-acid residues. Biochem. J. 41, 596–602(1947)
3. Rackrovsky, S., Scheraga, H.A.: Intermolecular anti-parallel β-sheet:comparison of predicted and observed conformations of gramicidin S.Proc. Natl. Acad. Sci. 77, 6965–6967 (1980)
4. Abraham, T., Prenner, E.J., Lewis, R.N.A.H., Mant, C.T., Keller, S.,Hodges, R.S., McElhaney, R.N.: Structure–activity relationships of theantimicrobial peptide gramicidin S and its analogs: aqueous solubility,self-association, conformation, antimicrobial activity, and interaction withmodel lipid membranes. Biochim. Biophys. Acta Biomembr. 1838,1420–1429 (2014)
5. Kakinuma, A., Ouchida, A., Shima, T., Sugino, H., Isono, M., Tamura,G., Arima, K.: Confirmation of the structure of surfactin by mass spec-trometry. Agric. Biol. Chern. 33, 1669–1671 (1969)
6. Kakinuma, A., Hori, M., Sugino, H., Yoshida, I., Isono, M., Tamura, G.,Arima, K.: Determination of the location of lactone ring in surfactin.Agric. Biol. Chem. 33, 1523–1524 (1969)
7. Bonmatin, J.M., Genest, M., Labbe, H., Ptak, M.: Solution three dimen-sional structure of surfactin: a cyclic lipopeptide studies by 1H-NMR,distance geometry, molecular dynamics. Biopolymers 34, 975–986(1994)
8. Tsan, P., Volpon, L., Besson, F., Lancelin, J.M.: Structure and dynamicsof surfactin studied by NMR in micellar media. J. Am. Chem. Soc. 129,1968–1977 (2007)
9. Kowall, M., Vater, J., Kluge, B., Stein, T., Franke, P., Ziessow, D.:Separation and characterization of surfactin isoforms produced byBacillus subtilis OKB 105. J. Colloid Interface Sci. 204, 1–11 (1998)
10. Bonmatin, J.M., Genest, M., Labbé, H., Grangemard, I., Peypoux, F.,Maget-Dana, R., Ptak, M., Michel, M.: Production, isolation and charac-terization of [Leu4]- and [Ile4]surfactins from Bacillus subtilis. Lett. Pept.Sci. 2, 41–47 (1995)
11. Baumgart, F., Kluge, B., Ullrich, C., Vater, J., Ziessow, D.: Identificationof amino acid substitutions in the lipopeptide surfactin using 2D NMRspectroscopy. Biochem. Biophys. Res. Commun. 177, 998–1005 (1991)
12. Mihailescou, D., Smith, J.C.: Atomic detail peptide–membrane interac-tions: molecular dynamics simulation of gramicidin S in a DMPC bilayer.Biophys. J. 79, 1718–1730 (2000)
13. Maget-Dana, R., Ptak, M.: Interaction of surfactin with membranemodels. Biophys. J. 68, 1937–1943 (1998)
14. Pramanik, B.N., Bartner, P.L., Mirza, U.A., Liu, Y.-H., Ganguly, A.K.:Electrospray ionization mass spectrometry for the study of noncovalentcomplexes: an emerging technology. J. Mass Spectrom. 33, 911–920(1998)
15. Hilton, G.R., Benesch, J.L.P.: Two decades of studying non-covalentbiomolecular assemblies by means of electrospray ionization mass spec-trometry. J. R. Soc. Interface 9, 801–816 (2012)
16. Woods, A.S., Huestis, M.A.: A study of peptide-peptide interaction bymatrix-assisted laser desorption/ionization. J. Am. Soc. Mass Spectrom.12, 88–96 (2001)
17. Woods, A.S., Koomen, J.M., Ruotolo, B.T., Gillig, K.J., Russel, D.H.,Fuhrer, K., Gonin, M., Egan, T.F., Schultz, J.A.: A study of peptide-peptide interactions using MALDI ion mobility o-TOF and ESI massspectrometry. J. Am. Soc. Mass Spectrom. 13, 166–169 (2002)
18. Alves, S., Woods, A., Delvolvé, A., Tabet, J.C.: Influence of salt bridgeinteractions on the gas-phase stability of DNA/peptide complexes. Int. J.Mass Spectrom. 278, 122–128 (2008)
19. Haselmann, K.F., Jørgensen, T.J.D., Budnik, B.A., Jensen, F., Zubarev,R.A.: Electron capture dissociation of weakly bound polypeptidepolycationic complexes. Rapid Commun. Mass Spectrom. 16, 2260–2265 (2002)
20. Mathur, S., Badertscher, M., Scott, M., Zenobi, R.: Critical evaluation ofmass spectrometric measurement of dissociation constants: accuracy andcross-validation against surface plasmon resonance and circular dichro-ism for the calmodulin–melittin system. Phys. Chem. Chem. Phys. 9,6187–6198 (2007)
21. Jørgensen, T.J.D., Delforge, D., Remacle, J., Bojesen, G., Roepstorff, P.:Collision-induced dissociation of noncovalent complexes between van-comycin antibiotics and peptide ligand stereoisomers: evidence for mo-lecular recognition in the gas phase. Int. J. Mass Spectrom. 188, 63–85(1999)
1636 M. Rautenbach et al.: ESI-MS Study of Gramicidin S-surfactin Hetero-oligomers

22. Penn, S.G., He, F., Green, M.K., Lebrilla, C.B.: The use of heatedcapillary dissociation and collision-induced dissociation to determinethe strength of noncovalent bonding interactions in gas-phase peptide–cyclodextrin complexes. J. Am. Soc. Mass Spectrom. 8, 244–252 (1997)
23. Cubrilovic, D., Biela, A., Sielaff, F., Steinmetzer, T., Klebe, G., Zenobi,R.: Quantifying protein-ligand binding constants using electrospray ion-ization mass spectrometry: a systematic binding affinity study of a seriesof hydrophobically modified trypsin inhibitors. J. Am. Soc. MassSpectrom. 23, 1768–1777 (2012)
24. Bich, C., Baer, S., Jecklin, M.C., Zenobi, R.: Probing the hydrophobiceffect of noncovalent complexes by mass spectrometry. J. Am. Soc. MassSpectrom. 21, 286–289 (2010)
25. Wu, Q., Gao, J., Joseph-Mccarthy, D., Sigal, G.B., Bruce, J.E.,Whitesides, G.M., Smith, R.D.: Carbonic anhydrase-inhibitor binding:from solution to the gas phase. J. Am. Chem. Soc. 119, 1157–1158(1997)
26. Daniel, J.M., Friess, S.D., Rajagopalan, S., Wendt, S., Zenobi, R.: Quan-titative determination of noncovalent binding interactions using soft ion-ization mass spectrometry. Int. J. Mass Spectrom. 216, 1–27 (2002)
27. Rautenbach, M., Swart, P., Van Der Merwe, M.J.: Sequence specificstabilization of a linear analogue of iturin A2 with sodium under lowenergy ESI-MS conditions. J. Am. Soc. Mass Spectrom. 12, 505–516(2001)
28. Wysocki, V.H., Tsaprailis, G., Smith, L.L., Breci, L.A.: Mobile andlocalized protons: A framework for understanding peptide dissociation.J. Mass Spectrom. 35, 1399–1406 (2000)
29. Mann, M., Steen, H.: The ABC's (and XYZ's) of peptide sequencing. Nat.Rev. Mol. Cell Biol. 5, 699–711 (2004)
30. Ruotolo, B.T., Benesch, J.L.P., Sandercock, A.M., Hyung, S.-J., Robin-son, C.V.: Ion mobility-mass spectrometry analysis of large proteincomplexes. Nat. Protoc. 3, 1139–1152 (2008)
31. Bush, M.F., Campuzano, I.D., Robinson, C.V.: Ion mobility mass spec-trometry of peptide ions: effects of drift gas and calibration strategies.Anal. Chem. 84, 7124–7130 (2012)
32. Douglas, D.J.: Applications of collision dynamics in quadrupole massspectrometry. J. Am. Soc. Mass Spectrom. 9, 101–113 (1998)
33. Mayer, P.M., Martineau, E.: Gas-phase binding energies for noncovalentAb-40 peptide/small molecule complexes from CID mass spectrometryand RRKM theory. Phys. Chem. Chem. Phys. 13, 5178–5186 (2011)
34. Gabelica, V., Galic, N., Rosu, F., Houssier, C., De Pauw, E.: Influence ofresponse factors on determining equilibrium association constants ofnoncovalent complexes by electrospray ionization mass spectrometry. J.Mass Spectrom. 38, 491–501 (2003)
35. Liu, J., Konermann, L.: Protein–protein binding affinities in solutiondetermined by electrospray mass spectrometry. J. Am. Soc. MassSpectrom. 22, 408–417 (2011)
36. Chao, H., Houston Jr., M.E., Grothe, S., Kay, C.M., O’Connor-McCourt,M., Irvin, R.T., Hodges, R.S.: Kinetic study on the formation of a de novodesigned heterodimeric coiled-coil: use of surface plasmon resonance tomonitor the association and dissociation of polypeptide chains. Biochem-istry 35, 12175–12185 (1996)
37. Ruotolo, B.T., Tate, C.C., Russell, D.H.: Ion mobility-mass spectrometryapplied to cyclic peptide analysis: conformational preferences of grami-cidin S and linear analogs in the gas phase. J. Am. Soc. Mass Spectrom.15, 870–878 (2004)
38. Goodwin, C.R., Fenn, L.S., Derewacz, D.K., Bachmann, B.O., McLean,J.A.: Structural mass spectrometry: rapid methods for separation andanalysis of peptide natural products. J. Nat. Prod. 75, 48–53 (2012)
39. Shukla, A.K., Futell, J.H.J.: Tandem mass spectrometry: dissociation ofions by collisional activation. J. Mass Spectrom. 36, 1069–1090 (2000)
40. Danders, W., Marahiel, A.M., Krause, M.I., Kosui, N., Kato, T., Izumiya,N., Kleinkauf, H.: Antibacterial action of gramicidin S and tyrocidines inrelation to active transport, in vitro transcription, spore outgrowth.Antimicrob. Agents Chemother. 22, 785–790 (1982)
41. Nagamurthi, G., Rambhav, S.: Gramicidin S: structure–activity Relation-ship. J. Biosci. 7, 323–329 (1985)
42. Thimon, L., Peypoux, F., Wallach, J., Michel, G.: Ionophorous andsequestering properties of surfactin, a biosurfactant from Bacillus subtilis.Colloids Surf. B 1, 57–62 (1993)
43. Osman,M., Høiland, H., Holmsen, H., Ishigami, Y.: Tuning micelles of abioactive heptapeptide biosurfactant via extrinsically induced conforma-tional transition of surfactin assembly. J. Pept. Sci. 4, 449–458 (1998)
44. Vass, E., Besson, F., Majer, Z., Volpon, L., Hollosi, M.: Ca2+-inducedchanges of surfactin conformation: a FTIR and circular dichroism Study.Biochem. Biophys. Res. Commun. 282, 361–367 (2001)
45. Sheppard, J.D., Jumarie, C., Cooper, D.G., Laprade, R.: Ionic channelsinduced by surfactin in planar lipid bilayer membranes. Biochim.Biophys. Acta 1064, 13–23 (1991)
46. Heerklotz, H., Seelig, J.: Detergent-like action of the antibiotic peptidesurfactin on lipid membranes. Biophys. J. 81, 1547–1554 (2001)
47. Ishigami, Y., Osman, M., Nakahara, H., Sano, Y., Ishiguro, R.,Matsumoto, M.: Significance of β-sheet formation for micellization andsurface adsorption of surfactin. Colloids Surf B 4, 341–348 (1995)
48. Rautenbach, M., Swart, P., Van Der Merwe, M.J.: The interaction ofanalogues of the antimicrobial lipopeptide, iturin A2, with alkali metalions. Bioorg. Med. Chem. 8, 2539–2548 (2000)
49. Thibault, P., Faubert, D., Karunanithy, S., Boyd, R.K., Holmes, C.F.:Isolation, mass spectrometric characterization, protein phosphatase inhi-bition properties of cyclic peptide analogues of gramicidin-S fromBacillus brevis (Nagano strain). Biol. Mass Spectrom. 21, 367–379(1992)
50. Pittenauer, E., Zehl, M., Belgacem, O., Raptakis, E., Mistrik, R.,Allmaier, G.: Comparison of CID spectra of singly charged polypeptideantibiotic precursor ions obtained by positive-ion vacuum MALDI IT/RTOF and TOF/RTOF AP-MALDI-IT and ESI-IT mass spectrometry. J.Mass Spectrom. 4, 421–447 (2006)
51. Schwartz, B.L., Bursey, M.M.: Some proline substituent effects in thetandem mass spectrum of protonated pentaalanine. Biol. Mass Spectrom.21, 92–96 (1992)
52. Raulfs, M.D.M., Breci, L., Bernier, M., Hamdy, O.M., Janiga, A.,Wysocki, V., Poutsma, J.C.: Investigations of the mechanism of theBproline effect^ in tandemmass spectrometry experiments: the Bpipecolicacid effect^. J. Am. Soc. Mass Spectrom. 25, 1705–1715 (2014)
53. Mcgee, W.M., Mcluckey, S.A.: The ornithine effect in peptide cationdissociation. J. Mass Spectrom. 48, 856–861 (2013)
54. Crittinden, C.M., Parker, W.R., Jenner, Z.B., Bruns, K.A., Akin, L.D.,Mcgee, W.M., Ciccimaro, E., Brodbelt, J.S.: Exploitation of the ornithineeffect enhances characterization of stapled and cyclic peptides. J. Am.Soc. Mass Spectrom. 27, 856–863 (2016)
55. Eyéghé-Bickong, H.A.: Role of surfactin from Bacillus subtilis in protec-tion against antimicrobial peptides produced by selected Bacillus species.Ph.D. thesis, Stellenbosch University. http://scholar. sun.ac.za/ handle/10019.1/6773, pp. 3.26–3.38 (2011).
56. Hue, N., Serani, L., Lapre’Vote, O.: Structural investigation of cyclicpeptidolipids from Bacillus subtilis by high-energy tandem mass spec-trometry. Rapid Commun. Mass Spectrom. 15, 203–209 (2001)
57. Gu, C., Tsaprailis, G., Breci, L., Wysocki, V.H.: Selective gas-phasecleavage at the peptide bond C-terminal to aspartic acid in fixed-chargederivatives of Asp-containing peptides. Anal. Chem. 72, 5804–5813(2000)
M. Rautenbach et al.: ESI-MS Study of Gramicidin S-surfactin Hetero-oligomers 1637


![Electrospray ionization mass spectrometry of ...93)85031-R.pdfElectrospray Ionization Mass Spectrometry of Phosphopeptides Isolated by On-Line ... this purpose [19~22]. Immobilized](https://static.fdocuments.in/doc/165x107/5ad660d07f8b9a6b668b8d17/electrospray-ionization-mass-spectrometry-of-9385031-rpdfelectrospray-ionization.jpg)