An Efficient Study of Scheduling Algorithms with Freidman...
25
Transcript of An Efficient Study of Scheduling Algorithms with Freidman...

UNIVERSITY OF HAUTE ALSACE
RESEARCH PROGRESS REPORT - SPRING 2014
An Efficient Study of Scheduling
Algorithms with Freidman Test in
WiMAX Networks
Abdusy SYARIF
Mohammed-El-Amine BRAHMIA Lecturer, CESI/LUSINE, FranceAbdelha�d ABOUAISSA Ass.Prof, University of Haute Alsace, FrancePascal LORENZ Prof, University of Haute Alsace, France

Abstract
In this work, we propose a scheduling strategy for various IPTV services traf-�c (HD-TV, SD-TV, Web-TV and Mobile-TV) over 802.16j networks. Ourscheme adapts dynamically the scheduler operation to according queue loadand QoS constraints. In particular, the proposed mechanism gives more pri-ority to HD-TV and SD-TV tra�cs by using two schedulers. The proposedscheduling algorithm has been simulated using the QualNet network simu-lator. The Friedman test has been used to address some signi�cant issues ofthe analysis to compare the proposed scheme with the others scheme. Theexperimental result and analysis show that the proposed scheduler schemesoutperform the traditional scheduling techniques for rtPS tra�c, that allowsensuring QoS requirements for IPTV application.
0.1 Introduction
In WiMAX standard, the tools to set up a network of high-speed data havebeen described in [1], but it depends on the operators which implement theirown mechanisms for Quality of Service (QoS) management purpose. It is avery challenge topic to optimize the mechanism of QoS management that weare interested.
A WiMAX technology is an emerging wireless technology for deploy-ing broadband Wireless Metropolitan Area Network (WMAN). It is a verypromising BroadbandWireless Access (BWA) technology which able to trans-mit di�erent service types. This technology could has di�erent constraintssuch as tra�c rate, maximum latency, and jitter tolerance. The IEEE 802.16Medium Access Control (MAC) standard speci�es �ve types of quality of ser-vice (QoS) classes: Unsolicited Grant Service (UGS), real-time Polling Ser-vice (rtPS), extended real-time Polling Service (ertPS), non real-time PollingService (nrtPS), and Best E�ort (BE). However, the IEEE 802.16 standarddoes not specify the scheduling algorithm to be used. The communicationoperators should choice among many existing scheduling techniques. Andalso, they could propose their own scheduling algorithms.
We present a new mechanism to di�erentiate services applied to WiMAXnetwork at the MAC layer. This proposed scheduling mechanism is designedfor IPTV application which is part of real-time Polling Service (rtPS) ser-vice class. We assumed that each video stream could be encoded into fourcategories (HD, SD, Web TV and Mobile TV). The proposed algorithm isweighted based called Weighted Round Robin (WRR) scheduling technology.The aim of this proposed mechanism is to adapt dynamically in relation tothe management of queues and constraints of each class of service. Further-more, we evaluate the performance of the proposed scheduling algorithmwith simulation and statistical analysis.
This work presents a Friedman test [15] which compares the performancesof proposed algorithm with others algorithm. For the Friedman test is oneof the nonparametric tests of multiple group measures. In other words, itcan be used to approve the null hypothesis that the multiple group measureshave the same variance to a certain required level of signi�cance.
The rest of this report is organized as follows. Section 0.2 reviews relatedwork. Section 0.3 discusses the proposed work. Simulation and results arediscussed in Section 0.4 and conclusion of the work is presented in Section0.5.
1
0.2 Related Work
0.2.1 Scheduling in WiMAX Networks
In IEEE 802.16 standard, MAC layer is connection oriented and base sta-tion assigned by a unique connection identi�er (CID) for both transmissions,Up-Link (UL) and Down-Link (DL) [2]. However, at Convergence Sub-layer(CS), data streams are classi�ed into di�erent connections with di�erentscheduling services. Therefore, it is expected that several schedulers are im-plemented to meet heterogeneous demands of users. There are two modelsof resource allocation and scheduling for SSs in 802.16j standard [3], central-ized and distributed scheduling. The �rst model, resources allocation for allnodes is ensured by MR-BS. While the second mode, resources allocationand bandwidth are determined by MR-BS and RSs in non-transparent relay.Knowing that a non-transparent relay can support both modes, and then weare interesting in the centralized method.
Furthermore, as far as we know, there is no scheduling technique speci-�ed in 802.16 standard. Each operator could develop its own technology toprovide its capacity and applications respectively.
The di�erent types of services
The standard in [1] speci�ed �ve types of services to serve connections atMAC layer. Each type of service is an application type with a tra�c pro�leparticular. These services are:
• Unsolicited Grant Service (UGS): This type of service provides a ser-vice �ow which the transmission system automatically and provides ade�ned number of timeslots periodically and �xed packet size whichis used by a particular receiver. UGS is frequently used to provideservices that involve a constant bit rate (CBR), for example audiostreaming application or leased line (T1 or E1) circuit emulation.
• Extended Real-Time Polling Service (ertPS): This service allows real-time service �ows that periodically generate variable-sized data pack-ets, such as VoIP application.
• Real-Time Polling Service (RTPS): This type of service corresponds toreal-time data streams comprising variable-sized data packets whichare released periodically.
• Non-Real-Time Polling Service (nrtPS): This type of service corre-sponds to delay-tolerant data streams comprising variable-sized datapackets for which a minimum data rate is needed, such as �le transfer(FTP) with a guaranteed minimum throughput.
2

• Best E�ort (BE): This type of service corresponds to data streams forwhich no minimum service level is necessary and therefore could betreated on a space-available basis, for example HTTP application.
Scheduling Algorithm
Scheduling algorithm is the most important aspect of resources e�cient inWiMAX networks. A scheduling algorithm should take into account whenconsidering a quality of service (QoS) constraints for all classes of service.There are two types of scheduling algorithms. The �rst type of schedulersknown as RR, WWR, SP, etc.. The second type of scheduler is proposedspeci�cally for WiMAX networks [4].
Among known scheduling techniques which we will compare later withthe proposed scheduler, we chose two scheduling algorithms as following:
• Weighted Round Robin (WRR): This scheduling algorithm is designedfor a better management services with di�erent QoS requirements. Itassigns a weight to each static queue, and then bandwidth is allocatedbased on these static weights [5]. In addition, queues with higherpriority have more connections (bandwidth) than queues with lowerweight. WRR ensures all service classes have access to bandwidthnetwork, which avoids the problem of resource starvation in low priorityqueue [6].
• Strict Priority (SP): This scheduling technique is simple. It begins toserve queues with high priority until empty, and then it goes to thenext queue with highest priority. By using this scheduler, queues withlow priority may encounter the problem of resource starvation [7].
The authors of [8] proposed a modi�ed version of the dynamic sched-uler WRR called MDWRR (Modi�ed Dynamic Weighted Round Robin).The objective of their proposal is to ensure the processing time for real-time applications, while e�ciently managing non-real time tra�c. The ideaof ��their proposed scheduler is a variant of the algorithm DWRR(Dynamic Weighted Round Robin) using a threshold to avoid packet loss ofnon-real time tra�c. Although MDWRR algorithm is more complex thanthe WRR and DWRR technique, it takes into account the priority of servicesand reduces the required size of bu�er. Unlike the MDWRR algorithm, ourproposed mechanism takes into account the QoS constraints of all serviceclasses and load queues.
In [6] the authors presented a scheduling algorithm for WiMAX net-works. Their proposed algorithm based on WRR and appointed to MWRR(Modi�ed Weighted Round Robin). This algorithm designed with to reducethe average end-to-end delay and to improve the average throughput. Theauthors compared the MWRR algorithm with known scheduling techniques
3

(WRR, SP and WFQ). The results show that the algorithm MWRR tendsto be reliable, especially for classes of service low priority which avoids theproblems of the WRR technique that causes unnecessary delays. In the per-formance evaluation section, we compare our proposed scheduling mechanismwith MWRR algorithm.
The authors of [7] conducted a study on scheduling algorithms such asWFQ, RR, WRR and SP in WiMAX network. They analysed and evalu-ated the performance of each scheduler by comparing the behaviour of eachalgorithm with respect to di�erent service classes. Their simulation resultsshowed that the SP scheduler has the best throughput and the minimumdelay for high priority service class. However, it has caused the resourcestarvation problem for BE and nrtPS classes. The results indicated that theSP algorithm as the average end-to-end is important for rtPS class. However,the scheduler RR had good results for classes of service with low priority,ignoring the constraints of QoS classes of high priority. Furthermore, algo-rithms WFQ and WRR can monitor the performance of each service classby assigning di�erent weights to each queue.
In the next section, we present the proposed scheduling algorithm whichis based on the WRR technique. The performance of the proposed schedulerwill be studied by using the QualNet simulator. Then, we perform analysisto compare the performance of proposed algorithm and techniques WRR,SP and MWRR [6].
0.2.2 The Nonparametric Test
Statistical tests frequently are in the form of parametric tests which byde�nition test an hypothesis about the parameters of the probability distri-bution function (pdf) of a sample of data. Contrarily, a non parametric testdoesn't need any formulation of the parameters of the pdf. The test usedin this present work is the Friedman test for the analysis of the variance(ANOVA) in order to perform the comparison of quality of services.
The Friedman test is also a non parametric test of variance performedon ranks, but in contrast to the Kruskal Wallis test it does not need thehypothesis that the samples are independent.
All parametric ANOVA's have to assume that the data is on the intervalor ratio scales and is distributed normally. In the same way that the Mann-Whitney test gives a non-parametric alternative to the t-test, therefore theKruskal-Wallis test gives the alternative non-parametric procedure.
The Kruskal-Wallis test does not require equal sample sizes but it willorder about which post hoc tests can be used. The data does not need to bein matched groups but if it is, there is a further test, the Friedman test thatcan be used instead.
The Kruskal-Wallis test relates to the Friedman test. Therefore essen-tially the Friedman test is used in case you want to use the same sample of
4

subjects or cases and evaluate them at three or more points in time or underdi�ering conditions.
In order to achieve a better performance comparison between the schedul-ing algorithms, we performed a statistical analysis based on the Friedmantest. [16], [17], [18], [19], [20] have performed statistical analysis by usingFriedman test for their work.
The authors in [18], they used two tests, the Kruskal-Wallis and theFriedman test, to address two signi�cant issues of the analysis of long timeseries in their work. In order to address issue of overcoming noise uncer-tainty by exploiting antenna correlation, in [19], the authors presented aFriedman test based spectrum sensing detector which compares the powerof the received signals through antennas and consequently it needs no prioriinformation of the noise and the primary signal. In [17] and [20], the autorsdeal with some QoS in Wireless Sensor Network (WSN) and Wireless MeshNetwork (WMN). They used the Friedman test to compare their proposeddeployment method with others algorithm such as Genetic Algorithm (GA)and Tabu Search (TS).
0.3 Proposed Work
0.3.1 Adaptive scheduling with dynamic weight adjustment(AWRR)
This section show the proposed scheduling algorithm which is based onweighted WRR scheduler. The proposed mechanism is based on two criteria,the load of each queue and the QoS constraints of each service class. Theobjective of this technique is to dynamically adjust the weight of each queuein relation to those two criteria above. This technique is called AdaptiveWeighted Round Robin (AWRR) [9]. The weight management mechanismis provided by a system of equations which is based on the detection ofa crossing certain threshold that anticipates congestion packet loss due toqueue over�ow. The AWRR algorithm allows to provide service di�erentia-tion in a multi-�les system to wait for relays network in case of centralizedmanagement.
Apart from management of all service classes, the proposed schedulergives more priority to IPTV services that have more constraints, such asvideo stream with HD or SD quality. We assume in the proposed transmis-sion process, we use four IPTV services (HD, SD, Web TV and Mobile TV)which are part of the rtPS class.
Moreover, Weighted Round Robin (WRR) is designed to manage di�er-ent classes of service such as real-time application, interactive application,�le transfer, etc. The weight is associated with each queue that is speci�callydedicated to one of the service classes. Each queue is serviced in a roundrobin order according to its weight. The queue with the highest priority
5

weight takes to process more packets [6, 10]. However, the proposed mecha-nism uses WRR scheduling technique for two reasons, �rst, it allows to avoidthe problem of resource starvation for lower priority classes, and the second,it gives the QoS guarantee in high-priority classes.
The idea in this work is to use two schedulers in both case, at input andoutput sides. The scheduler at input side has two queues, �rst,High Priority(HP ) which contains �ow of UGS, ertPS and rtPS classes. Otherwise, the�ow rtPS is only for IPTV services encoded in HD or SD. The second queuecalled Low Priority (LP ) which contains �ow of the rest of service classes,in this case rtPS_web-TV, rtPS_mobile-TV, nrtPS and BE. The schedulerat output side is the main scheduler that can control and manage all serviceclasses (UGS, ertPS, rtPS, nrtPS and BE).
As mentioned above, the role of input scheduler is to support videostreams which have more constraints in terms of bandwidth and latency.Using this scheduler does not have a�ect with the processing time, as thedata packets have a removal time before they are processed by the mainscheduler.
We recall from our previous work [9], Figure 1 shows the overall architec-ture of proposed scheduler with specifying di�erent queues. The proposedalgorithm applies AWRR on both schedulers (input and output) to adjustthe weight of each service class. It also assigns a congestion threshold ateach queue which is used to trigger the dynamic weight adjustment in caseof over�ow. Thus, to meet the QoS constraints and in order to give higherpriority to real-time applications, it assumed that the threshold of the highpriority queues are above the threshold of low-priority queues.
UGS
ErtPS
rtPS
nrtPS
BE
AWRRAWRR
High Priority
Low Priority
Input
Scheduler
Output
Scheduler
Data
Cla
ssifie
r
Cla
ssifie
r
Figure 1: The architecture of AWRR scheduler
The following section presents the detail of two schedulers, in particular,the adjustment of queue weight.
The Input Scheduler
Input scheduler has two queues, high priority queue (HP ) and low priorityqueue (LP ). The classi�cation of data is divided in a manner of HD-TV and
6

SD-TV services which is belong to HP . Web-TV and Mobile-TV servicesare classi�ed in LP .
The main feature of the input scheduler is to control the weight of eachlines according to tra�c load and bu�er size. The weight adjustment canfavour the data processing belonging to HP while guaranteeing a minimumprocessing time for service classes belonging to LP . Figure 2 shows thearchitecture of input scheduler.
AWRR
HP
LP
Data
Classifier
TH
TL
WH
WL
Figure 2: The architecture of input scheduler
Queue Weight Adjustment (Input Scheduler) The weight adjust-ment of two queues takes into account the load and the priority each queue.For this purpose, two thresholds (TH and TL) are used as seen at Figure 2.Every threshold represents the number of packet occupying the queue. Theweight adjustment takes into account the basic constraint: WH +WL = 1.Knowing that the weight of two queues are de�ned by following equations:
WH =WHi +NPH − THNPH
(1)
WL = 1−WH (2)
Where WH is the weight of high priority queue, WL is the weight of low-priority queue, TH is refer to the threshold of high priority queue, and NPHrefers to the number of packet occupying the HP .
The threshold (TH) is used to trigger the weight adjustment the numberof packet occupying the queue exceeds the threshold. WHi is the weightinitial of HP which allows the AWRR scheduler to calculate WH at the �rstweight adjustment.
Weight Calculation Algorithm The algorithm 1 calculates the weightof each queue based on the packet amount in each queue. In this algorithm,TL represents the threshold of low-priority queue and NPL is the number ofpacket occupying the queue.
7

Algorithm 1 Calculation of weight (input scheduler)
WHi = α
(α < 1)
WL = 1−WHi
/ ∗ Initial Conditions ∗ /while (Queues are not empty) do
if NPH ≥ THorNPL ≥ TL then
WH =WHi +NPH−THNPH
;
WL = 1−WH ;
else
Initial_Conditions;end
end
end
The Output Scheduler
The output scheduler is used to meet the requirements in terms of qualityof service. It manages the �ow of all service classes by using AWRR. Figure3 shows the architecture of output scheduler which it has a queue for eachservice class. Each of these service class has a weight and a threshold todetect the certain level of congestion. The weight adjustment must meetthe requirements of each service class, as it must avoids problem of resourcestarvation for low-priority queues. For this reason, the proposed methodrelies on a system of equations in order to adjust the weights dynamically.Knowing that each weight as a linear equation, then the equation takes intoaccount the number of packets occupying a queue, the threshold assignedand the constraints of service class.
UGS
ErtPS
rtPS
nrtPS
BE
AWRR
Input
Sch
edu
ler
Data
Cla
ssifie
r
T1
T2
T3
T4
T5
W1
W2
W3
W4
W5
Figure 3: The architecture of output scheduler
8

Queue Weight Adjustment (Output Scheduler) The adjustment ofqueue weight is a very important function for the proposed mechanism in or-der to improve the management of queue mechanism. This function providesthe weight adjustment of the �ve queues dynamically to take into accountthe following constraints:
Wi > 0 (3)
m∑i=1
Wi = 1 (4)
Where m represents the number of queue and Wi is the weight of thei− th row. However, we assume that:
Wi = fi(k) = aik + bi (5)
ai =NPiTi
(6)
Including NPi is the number of packet occupying the i− th row and Tiis the threshold for the queue. However, bi is a prede�ned constant that cansupport high-priority classes.
(4) =⇒m∑i=1
fi(k) = 1 =⇒m∑i=1
(aik + bi) = 1 (7)
From equation 7, we can solve the system of equations by calculating thevalue of variable k.
(7) =⇒ w1 + w2 + w3 + w4 + w5 = 1 (8)
(8) =⇒ {(a1k + b1) + (a2k + b2) + (a3k + b3) (9)
∩+ (a4k + b4) + (a5k + b5) = 1} (10)
(10) =⇒ k =1− (b1 + b2 + b3 + b4 + b5)
a1 + a2 + a3 + a4 + a5(11)
9

Once variable k is calculated, we can calculate the weight of each queue(service class). Moreover, the values of two constants are arbitrarily pre�xedin order to increase the weight of higher priority classes. In this case, we have�ve queues, so we assume that (b1 = α1 for USG, b2 = α2 for ErtPS, b3 = α3
for rtPS, b4 = α4 for nrtPS and b5 = α5 for BE). The choice of constant bidepends on the application to be implemented under the following conditions:
0 6 bi < 1 (12)
bi > bi+1 (13)
Weight Calculation Algorithm The weight assigned to each queue isalways positive value to ensure a minimum processing time of low-priorityclasses. The proposed mechanism supports to high priority classes using con-stant bi and threshold Ti. The calculation algorithm provides three weightsas we described above.
Algorithm 2 Weight Calculation (Output Scheduler)
Wi > 0;m∑i=1
Wi = 1
/ ∗ Initial Conditions ∗ /b1 = α1; b2 = α2; b3 = α3; b4 = α4; b5 = α5
while (Queues are not empty) do
for i=1 to 5 do
if NPi ≥ Ti thenWeights_Ajustment else
Initial_Conditionsend
end
end
end
0.4 Performance Evaluation.
In order to highlight the proposed scheduling mechanism, we used QualNet[11] simulator to implement the proposed algorithm onWIMAX network. Wecompare AWRR to WRR, SP and MWRR [6] to show the e�ectiveness ofthe proposal. We chose MWRR because it also based on WRR and designedfor WiMAX networks.
10

0.4.1 Parameters Simulation
In this simulation, we used 802.16e since 802.16j version doesn't implementa scheduler. This choice does not in�uence the performance evaluation ofthe proposed algorithm because it is a centralized solution, it means thatbase station which handles the scheduling.
In scenario simulation, we consider that the topology has a WiMAXcell consisting of 1 BS and 50 SSs. At the application layer, we use CBR(Constant Bit Rate) tra�c generator and specifying the service class foreach CBR connection using the precedence �eld (UGS=7, ertPS=4, rtPS=3,nrtPS=2, and BE=0). In addition, we are particularly interested in rtPSclass by changing the number and the quality of IPTV channels in order tostudy the impact of proposed input scheduler.
Table 1 shows the simulation con�gurations. We varied the simulationtime to have a better study.
Table 1: Simulation Parameters
Parameter Value
Radio type 802. 16 RadioAntenna model Omni directionalChannel frequency 2.4 GHzTransmission Power 20 GHzScheduling mode CentralizedTra�c Type CBRNumber of IPTV channels 50Precedence values 0, 2, 3, 4, and 7Scheduling algorithms evaluated SP, WRR, MWRR, AWRRTransport Protocol UDP
0.4.2 Simulation Result
To evaluate and compare the performance of these algorithms; WRR, SP,MWRR, and AWRR, we performed some scenarios adopting conventionalmetrics. The metrics are average throughput and average end-to-end delay.We studied these metrics either in relation to all service classes or to aspeci�c class, for example rtPS class. We also studied the total number ofIPTV channels that scheduler can handle. We present the results of thismetric with statistical analysis.
Figure 4 shows the average throughput compared to the �ve serviceclasses. Tra�c classes of UGS and ertPS have a better throughput perfor-mance while using SP scheduler. However, the tra�c of rtPS class providesthe best performance in terms of throughput with the proposed AWRR al-gorithm. Indeed, the use of input scheduler has improved the performance
11

of rtPS class favouring encoded IPTV services such as HD and SD. Figure 4also shows that WRR and MWRR schedulers o�er a better result in terms ofthroughput for low priority classes (nrtPS and BE). Furthermore, the resultsshow that the proposed scheduler has a better performance in terms of aver-age throughput of all classes. This is due to the proposed weight adjustmentmechanisms which take into account the QoS constraints and the number ofpacket occupying each queue.
Figure 4: Average throughput over service classes
Figure 6 and 7 illustrate the average end-to-end delay of four schedulingalgorithms with respect to di�erent service classes. We realize that AWRRalgorithm o�ers the best performance in terms of average end-to-end delay,particularly at rtPS class. These performances could allowed to achieve anaverage delay about 13%. Also we can see that for UGS class, SP algo-rithm has the best delay because the packet with high priority queues arecompletely served before the low-priority one. Unlike WRR, AWRR gives agood result since it adjusts the weight of the queue for each service class dy-namically. Furthermore, the use of Input scheduler allowed accelerate packetprocessing with high-quality video streams.
Figures 6 and 7 show the average throughput and the average end-to-end delay respectively. Thus, as we mentioned earlier, the video streamof IPTV services is part of rtPS class. To evaluate the performance of thisservice class, we changed the number of IPTV channels user-requested. Eachchannel can be requested with one of qualities (HD-TV, SD-TV, Web-TVand Mobile-TV) in a random manner.
Figures 6 and 7 con�rm that the proposed scheduling, AWRR algorithm,provides the best throughput and the best average end-to-end delay. AWRRhas average 8% in terms of throughput and 19% in terms of end-to-end delay.These results achieved because of the architecture of proposed algorithm us-ing two schedulers which reduce end-to-end delay for video services. Another
12

Figure 5: The average of end-to-end delay
point about the performance of rtPS class is the fact that generating a lotof tra�c at IPTV services class caused exceeding the queue threshold. Thereason is that AWRR algorithm triggers the weight adjustment increasingthe weight value of rtPS class queue. It becomes one of the advantages ofthe proposed algorithm that it can handle more packets of rtPS class.
Figure 6: Average Throughput of rtPS class
In order to better study the behavior of these four algorithms with lowpriority classes, we evaluated the performance of nrtPS class by changing thenumber of CBR connection. Figures 8 and 9 depict the average throughputand the average end-to-end delay of nrtPS class respectively. These �guresshow that the WRR, AWRR, and MWRR have better result compared to SPalgorithm, because it serves UGS, rtPS and ertPS classes before nrtPS class.Moreover, despite a slight superiority of MWRR algorithm, the proposed
13

Figure 7: The average end-to-end delay of rtPS class
scheduler o�ers the best results with its adaptation mechanism.
Figure 8: The Average throughput of nrtPS class
To highlight the interest of the proposed algorithm, we performed sta-tistical test at the next section. This statistical test allows to compare theperformance of WRR, SP, MWRR and AWRR against several metrics. Theresult of this comparison can provide which algorithm is the best one interms of all the metrics for all service classes.
0.4.3 Statistical Analysis of Algorithms
Statistic Tests
The performance evaluation of proposed AWRR algorithm demonstrated itse�ciency of one service class to another respectively. It could better for
14

Figure 9: The average end-to-end delay of nrtPS class
one service but not for the others. The goal is to have a global view ofperformance of proposed AWRR algorithm compared with other algorithms.
Statistical tests are tools for decision support system. They can decidebetween one and two cases but only one is true. Before performing theFriedman test, we made some basic de�nitions as follows:
De�nition 0.4.1. A statistical hypothesis is a statement concerning thecharacteristics (parameter values, form of observations distribution) of a pop-ulation.
De�nition 0.4.2. Statistical hypothesis is a �xed assumption that has pa-rameter population priority at a particular value which called nullhypothesis,denoted by H0. Other assumption that di�ers from the hypothesis H0 calledalternative hypothesis and denoted by H1.
De�nition 0.4.3. A hypothesis test is a method that aims to provide adecision rule, based-on results sample, to make a choice between two hy-potheses statistics.
One of the objectives of a hypothesis test is to predict in advance at whatcondition that one or other hypothesis will be considered. H0 is a subjectthat being tested and the whole testing process is done by considering thishypothesis as true. If the test leads to the rejection of H0, then it considerH1 as probable rather than H0.
To establish the credibility of H0, we should be able to establish decisionrules that will succeed without ambiguity to non-rejection of H0 (or rejec-tion). In practice, we implement an approach that allows, a long-term, ofwrongly rejecting H0 true in a small cases proportion. The conclusion isdeduced from the sample results following the decision rule.
15
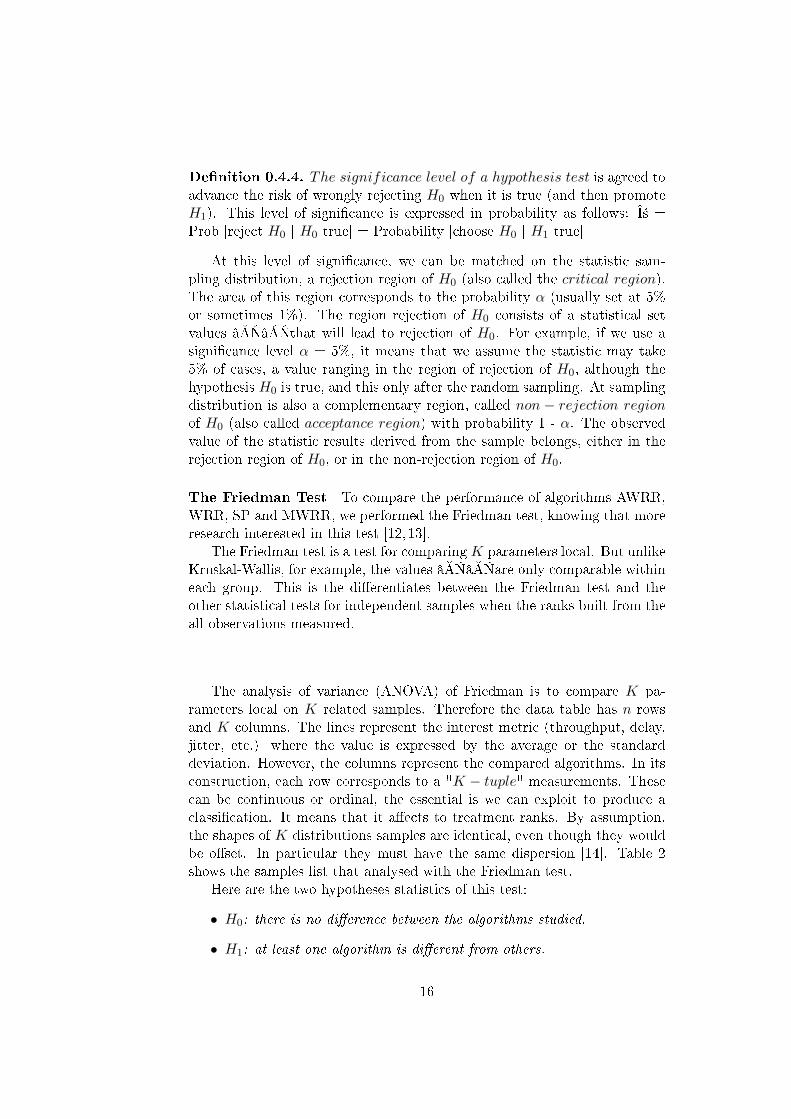
De�nition 0.4.4. The significance level of a hypothesis test is agreed toadvance the risk of wrongly rejecting H0 when it is true (and then promoteH1). This level of signi�cance is expressed in probability as follows: α =Prob [reject H0 | H0 true] = Probability [choose H0 | H1 true]
At this level of signi�cance, we can be matched on the statistic sam-pling distribution, a rejection region of H0 (also called the critical region).The area of this region corresponds to the probability α (usually set at 5%or sometimes 1%). The region rejection of H0 consists of a statistical setvalues â��â��that will lead to rejection of H0. For example, if we use asigni�cance level α = 5%, it means that we assume the statistic may take5% of cases, a value ranging in the region of rejection of H0, although thehypothesis H0 is true, and this only after the random sampling. At samplingdistribution is also a complementary region, called non − rejection regionof H0 (also called acceptance region) with probability 1 - α. The observedvalue of the statistic results derived from the sample belongs, either in therejection region of H0, or in the non-rejection region of H0.
The Friedman Test To compare the performance of algorithms AWRR,WRR, SP and MWRR, we performed the Friedman test, knowing that moreresearch interested in this test [12,13].
The Friedman test is a test for comparingK parameters local. But unlikeKruskal-Wallis, for example, the values ��are only comparable withineach group. This is the di�erentiates between the Friedman test and theother statistical tests for independent samples when the ranks built from theall observations measured.
The analysis of variance (ANOVA) of Friedman is to compare K pa-rameters local on K related samples. Therefore the data table has n rowsand K columns. The lines represent the interest metric (throughput, delay,jitter, etc.) where the value is expressed by the average or the standarddeviation. However, the columns represent the compared algorithms. In itsconstruction, each row corresponds to a "K − tuple" measurements. Thesecan be continuous or ordinal, the essential is we can exploit to produce aclassi�cation. It means that it a�ects to treatment ranks. By assumption,the shapes of K distributions samples are identical, even though they wouldbe o�set. In particular they must have the same dispersion [14]. Table 2shows the samples list that analysed with the Friedman test.
Here are the two hypotheses statistics of this test:
• H0: there is no di�erence between the algorithms studied.
• H1: at least one algorithm is di�erent from others.
16

To perform the Friedman test, �rst it needs to determine the rank ofeach algorithm for each sample being studied. Table 3 gives the rank ofalgorithms based on the average of each sample. From the values ��in3, the calculation of A2 and B2. A2 is the sum of total square ranks:
A2 =b∑i=1
k∑j=1
[R(Xij)]2
A2 = 21 + 114 + 117 + 108 = 360
and B2 is given by the following relationship:
B2 =1
b
k∑j=1
R2j
B2 =1
12(152 + 362 + 352 + 342) = 325.1666
where b is the number of samples studied and k the number of algorithmsto compare.
Then we calculate the statistical test T2 using the following formula:
T2 =(b− 1)[B2 − bk(k + 1)2/4]
A2 −B2
T2 = 7.947
Using the distribution table F with α = 1%, we get the following value:
F1−α,k−1,(b−1)(k−1) = F0.99,3,33 = 4.43678
We chose α = 1% because most of α is less more than the high criticalvalue which makes the strict analysis.
Since T2 > F0.99,4,36, assuming H0 is rejected, i.e there is at least onealgorithm whose performance is di�erent from at least one of the other al-gorithms studied.
To determine which algorithm is di�erent, we performed the test bilateraland results are given in Table 4. Indeed, two algorithms A and B are di�erentif |RA−RB| is greater than the critical value C, where R is the sum of ranksalgorithm i. The critical value C is calculated using the following expression:
C = t1−α2
[2b(A2 −B2)
(b− 1)(k − 1)
] 12
where t1−α2is the (1− α
2 )th coe�cient of distribution t and (b− 1)(k− 1)
is the degrees number of the system.
17

In our case, the critical value C as follows:
C = 2.733
[2× 12× (360− 325.1666)
11× 3
] 12
= 13.7558
.With α= 3% and 5% the critical value C is equal to 11.415 and 10.24
respectively, so that the critical value allows more strict analysis.Table 4 shows that the results obtained by proposed AWRR algorithm
is di�erent from those obtained by the algorithms WRR, SP and MWRR.From this analysis, we can say that proposed AWRR outperforms WRR, SPand MWRR algorithms.
The result obtained by the Friedman test shows that the proposed algo-rithm (AWRR) provides better performance in a comprehensive manner.
0.5 Conclusion
We present a scheduling mechanism for video in WiMAX networks. The pro-posed solution, called Adaptive Weighted Round Robin (AWRR), is designedto optimize the performance of video streams that have more constraints.This technique o�ers di�erent service in de�ning priorities and promotingstreams belonging to multimedia or real time applications. This di�eren-tiation is due to that some applications are generally sensitive to certainparameters such as delay, bandwidth and packet loss rate.
The proposed algorithm is based on two schedulers, input scheduler andoutput scheduler. The input scheduler uses two queues, a high priority queuefor service classes such as UGS, ertPS and rtPS, in case of HD or SD �ow,and low priority queue for service classes such as nrtPS, BE and Web-TVor Mobile-TV video streams. The next contribution of proposed solutionis the weight adjustment system. In this system, we represent the weightof each queue in form of the �rst degree equation. We also set a thresholdfor each queue. These thresholds are used to trigger the weight adjustment.This technique allows to adjust the weights which take into account the QoSconstraints of each queue dynamically.
We performed simulation which compare the proposed algorithm withWRR, SP and MWRR schedulers. We also performed a statistical analysisof four schedulers with the Freidman test. The results obtained show that theproposed scheduler has a better performance especially for rtPS service class(multimedia applications). It shows that the proposed AWRR algorithmprovides advantages such as a better QoS management, reducing loss ofpackets and increasing the overall network performance.
18
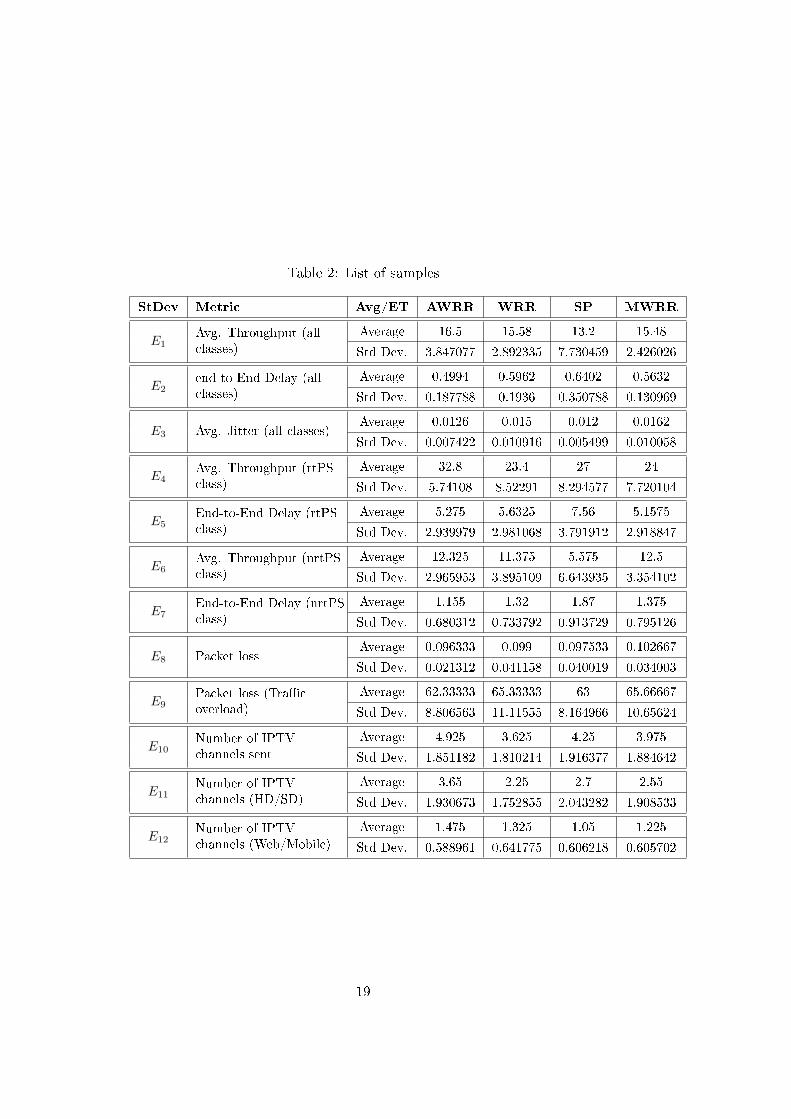
Table 2: List of samples
StDev Metric Avg/ET AWRR WRR SP MWRR
E1Avg. Throughput (allclasses)
Average 16.5 15.58 13.2 15.48
Std Dev. 3.847077 2.892335 7.730459 2.426026
E2end-to-End Delay (allclasses)
Average 0.4994 0.5962 0.6402 0.5632
Std Dev. 0.187788 0.1936 0.350788 0.130969
E3 Avg. Jitter (all classes)Average 0.0126 0.015 0.012 0.0162
Std Dev. 0.007422 0.010916 0.005499 0.010058
E4Avg. Throughput (rtPSclass)
Average 32.8 23.4 27 24
Std Dev. 5.74108 8.52291 8.294577 7.720104
E5End-to-End Delay (rtPSclass)
Average 5.275 5.6325 7.56 5.1575
Std Dev. 2.939979 2.981068 3.791912 2.918847
E6Avg. Throughput (nrtPSclass)
Average 12.325 11.375 5.575 12.5
Std Dev. 2.965953 3.895109 6.643935 3.354102
E7End-to-End Delay (nrtPSclass)
Average 1.155 1.32 1.87 1.375
Std Dev. 0.680312 0.733792 0.913729 0.795126
E8 Packet lossAverage 0.096333 0.099 0.097533 0.102667
Std Dev. 0.021312 0.041158 0.040019 0.034003
E9Packet loss (Tra�coverload)
Average 62.33333 65.33333 63 65.66667
Std Dev. 8.806563 11.11555 8.164966 10.65624
E10Number of IPTVchannels sent
Average 4.925 3.625 4.25 3.975
Std Dev. 1.851182 1.810214 1.916377 1.884642
E11Number of IPTVchannels (HD/SD)
Average 3.65 2.25 2.7 2.55
Std Dev. 1.930673 1.752855 2.043282 1.908533
E12Number of IPTVchannels (Web/Mobile)
Average 1.475 1.325 1.05 1.225
Std Dev. 0.588961 0.641775 0.606218 0.605702
19

Table 3: Algorithms Classi�cation
AWRR WRR SP MWRR
Instances(b) Xb1 R(Xb1) R(Xb1)2 Xb2 R(Xb2) R(Xb2)
2 Xb3 R(Xb3) R(Xb3)2 Xb4 R(Xb4) R(Xb4)
2
E1 -16.5 1 1 -15.58 2 4 -13.2 4 16 -15.48 3 9
E2 0.4994 1 1 0.5962 3 9 0.6402 4 16 0.5632 2 4
E3 0.0126 2 4 0.015 3 9 0.012 1 1 0.0162 4 16
E4 -32.8 1 1 -23.4 4 16 -27.0 2 4 -24.0 3 9
E5 5.275 2 4 5.6325 3 9 7.56 4 16 5.1575 1 1
E6 -12.325 2 4 -11.375 3 9 -5.575 4 16 -12.5 1 1
E7 1.15500 1 1 1.32 2 4 1.87 4 16 1.375 3 9
E8 0.09633 1 1 0.099 3 9 0.09753 2 4 0.10267 4 16
E8 62.33333 1 1 65.33333 3 9 63.0 2 4 65.66667 4 16
E10 -4.925 1 1 -3.625 4 16 -4.25 2 4 -3.975 3 9
E11 -3.65 1 1 -2.25 4 16 -2.7 2 4 -2.550 3 9
E12 -1.475 1 1 -1.325 2 4 -1.05 4 16 -1.225 3 9
Average rank 1.25 3 2.916 2.833
Sum total 15 21 36 114 35 117 34 108
Table 4: Bilateral Test
WRR SP MWRR
AWRR 21 20 19
WRR - 1 2
SP - - 1
20

Bibliography
[1] IEEE-Standard. 802.16j-2009 Part 16: Air Interface for Fixed and MobileBroadbandWireless Access Systems, Multihop Relay Speci�cation. IEEEStandard for Local and Metropolitan Area Networks, 2009.
[2] Francis E Retnasothie, M Kemal Ozdemir, Tev�k Yucek, Hasari Celebi,Joseph Zhang, and Ranesh Muththaiah. Wireless IPTV over WiMAX:Challenges and Applications. In In Proceedings of the IEEE Annual
Wireless and Microwave Technology Conference, Vol.45 of WAMICON
'06, pp. 1�5, Clearwater Beach, FL, December 2006.
[3] S Y Wang, H Y Chen, and S W Chuang. Nctuns Tool for IEEE 802.16jMobile WiMAX Relay Network Simulations. In Nova Science Publish-ers, editor, Computer Science Research and Technology, No.1, pp. 1�31.Addison Wesley, 2009.
[4] Aymen Belghith and Lout� Nuaymi. Comparison of WiMAX SchedulingAlgorithms and Proposals for the RTPS QoS Class. In Proceedings of
the 14th European Wireless Conference 2008, pp. 1�6, Prague, CzechRepublic, 2008.
[5] Ahtsham Sarwar Khan, Ahsan Razza Sattar, Tasleem Mustafa, andShehbaz Ahmad. Performance Evaluation and Enhancement of UplinkScheduling Algorithms in Point to Multipoint WiMAX Networks. In Eu-
ropean Journal of Scienti�c Research, Vol.42, pp. 491�506. EuroJournals,2010.
[6] Wail Mardini and Mai Abu Alfool. Modi�ed WRR Scheduling Algorithmfor WIMAX Networks. In Journal of Network Protocols and Algorithms,Vol.3, pp. 24�43, USA, 2011.
[7] Ahmed H. Rashwan, Hesham M. ElBadawy, and Hazem H. Ali. Com-parative Assessments for Di�erent WiMAX Scheduling Algorithms. InProceedings of the World Congress on Engineering and Computer Sci-
ence, San Francisco, USA, October 2009.
21

[8] Ji-Young Kwak, Ji-Seung Nam, and Doo-Hyun Kim. A Modi�ed Dy-namic Weighted Round Robin Cell Scheduling Algorithm. In ETRI Jour-nal, Vol.24, pp. 360�372, October 2002.
[9] Mohamed El amine Brahmia, Abdelha�d Abouaissa, and Pascal Lorenz.Adaptive Scheduling Mechanism for IPTV over WiMAX IEEE 802.16jNetworks. International Journal of Communication Systems, Vol.27, Is-sue 7, pp. 1009�1019, 2012.
[10] Najah Abu Ali, Pratik Dhrona, and Hossam Hassanein. A PerformanceStudy of Uplink Scheduling Algorithms in Point-to-Multipoint WiMAXNetworks. In Comput. Commun., Vol.32, pp. 511�521, Newton, MA,USA, Butterworth-Heinemann, February 2009.
[11] Scalable Network Technologies (SNT), Qualnet. http://www.
scalable-networks.com/content/products/qualnet/.
[12] Salvador García, Daniel Molina, Manuel Lozano, and Francisco Her-rera. A Study on The Use of Non-parametric Tests for Analyzing TheEvolutionary Algorithms' Behaviour: A Case Study on The CEC'2005Special Session on Real Parameter Optimization. Journal of Heuristics,15(6):617�644, December 2009.
[13] J.G. Villegas. Using Nonparametric Test to Compare The Perfor-mance of Metaheuristics. http://juangvillegas.files.wordpress.
com/2011/08/friedman-test-24062011.pdf, 2011.
[14] Ricco Rakotomalala. Comparison of Populations, NonparametricTests. http://eric.univlyon2.fr/~ricco/cours/cours/Comp_Pop_
Tests_Nonparametriques.pdf, 2008.
[15] M. Friedman. The Use of Ranks to Avoid the Assumption of NormalityImplicit in the Analysis of Variance. Journal of the American Statistical
Association, Vol. 32, No.200, pp. 675�701, 1937.
[16] L. Idoumghar, N. Cherin, R. Roche, P. Siary, A. Miraoui. Hybrid ICA-PSO Algorithm for Continuous Optimization. Journal of Applied Math-
ematics and Computation, Vol. 219, No. 24, pp. 11149�11170, 15 August2013.
[17] Abdusy Syarif, Abdelha�d Abouaissa, Lhassane Idoumghar, Riri FitriSari and Pascal Lorenz. Performance Analysis of Evolutionary Multi-Objective Based Approach for Deployment of Wireless Sensor Networkwith The Presence of Fixed Obstacles. IEEE Global Communication Con-
ference (Globecom), Austin, Texas, USA, 8�12 December, 2014. (Ac-cepted)
22

[18] Luigi Boschetti, Annamaria Kunzle, Pietro Alessandro Brivio, LuigiMussio. Nonparametric Statistical Tests for The Analysis of Multiple-Sensor Time Series of Remotely Sensed Data. IEEE International Con-
ference on Geoscience and Remote Sensing Symposium (IGARSS), pp.200�203, 31 July�4 Aug, 2006.
[19] Ming Jin, Youming Li, Gang Wang, Jiehui Chen. Multiantenna BasedSpectrum Sensing via Friedman Test for Cognitive Radio. 7th Interna-
tional ICST Conference on Communications and Networking in China
(CHINACOM), pp. 321�324, 2012.
[20] Tetsuya Oda, Admir Barolli, Evjola Spaho, Leonard Barolli and FatosXhafa. Analysis of Mesh Router Placement in Wireless Mesh NetworksUsing Friedman Test. IEEE 28th International Conference on Advanced
Information Networking and Applications, pp. 289�296, 2014.
23