The moral economy of inequality: popular views on income ...
210 OXFAM BRIEFING PAPER 18 JANUARY 2016
www.oxfam.org
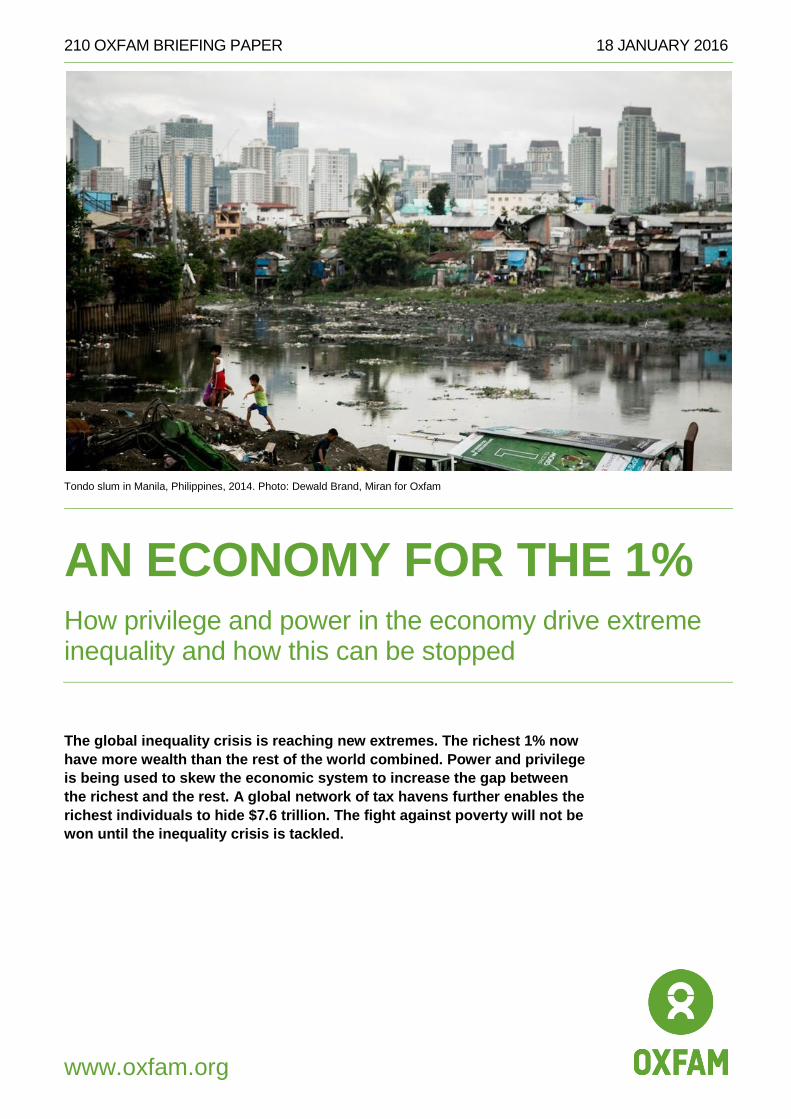
Tondo slum in Manila, Philippines, 2014. Photo: Dewald Brand, Miran for Oxfam
AN ECONOMY FOR THE 1% How privilege and power in the economy drive extreme inequality and how this can be stopped
The global inequality crisis is reaching new extremes. The richest 1% now
have more wealth than the rest of the world combined. Power and privilege
is being used to skew the economic system to increase the gap between
the richest and the rest. A global network of tax havens further enables the
richest individuals to hide $7.6 trillion. The fight against poverty will not be
won until the inequality crisis is tackled.
2
SUMMARY
AN ECONOMY FOR THE 1%
The gap between rich and poor is reaching new extremes. Credit Suisse recently
revealed that the richest 1% have now accumulated more wealth than the rest of
the world put together.1 This occurred a year earlier than Oxfam’s much
publicized prediction ahead of last year’s World Economic Forum. Meanwhile, the
wealth owned by the bottom half of humanity has fallen by a trillion dollars in the
past five years. This is just the latest evidence that today we live in a world with
levels of inequality we may not have seen for over a century.
‘An Economy for the 1%’ looks at how this has happened, and why, as well as
setting out shocking new evidence of an inequality crisis that is out of control.
Oxfam has calculated that:
• In 2015, just 62 individuals had the same wealth as 3.6 billion people – the
bottom half of humanity. This figure is down from 388 individuals as recently as
2010.
• The wealth of the richest 62 people has risen by 45% in the five years since 2010 – that's an increase of more than half a trillion dollars ($542bn), to $1.76 trillion.
• Meanwhile, the wealth of the bottom half fell by just over a trillion dollars in the same period – a drop of 38%.
• Since the turn of the century, the poorest half of the world’s population has
received just 1% of the total increase in global wealth, while half of that
increase has gone to the top 1%.
• The average annual income of the poorest 10% of people in the world has
risen by less than $3 each year in almost a quarter of a century. Their daily
income has risen by less than a single cent every year.
Growing economic inequality is bad for us all – it undermines growth and social
cohesion. Yet the consequences for the world’s poorest people are particularly
severe.
Apologists for the status quo claim that concern about inequality is driven by
‘politics of envy’. They often cite the reduction in the number of people living in
extreme poverty as proof that inequality is not a major problem. But this is to miss
the point. As an organization that exists to tackle poverty, Oxfam is unequivocal in
welcoming the fantastic progress that has helped to halve the number of people
living below the extreme poverty line between 1990 and 2010. Yet had inequality
within countries not grown during that period, an extra 200 million people would
have escaped poverty. That could have risen to 700 million had poor people
benefited more than the rich from economic growth.
3
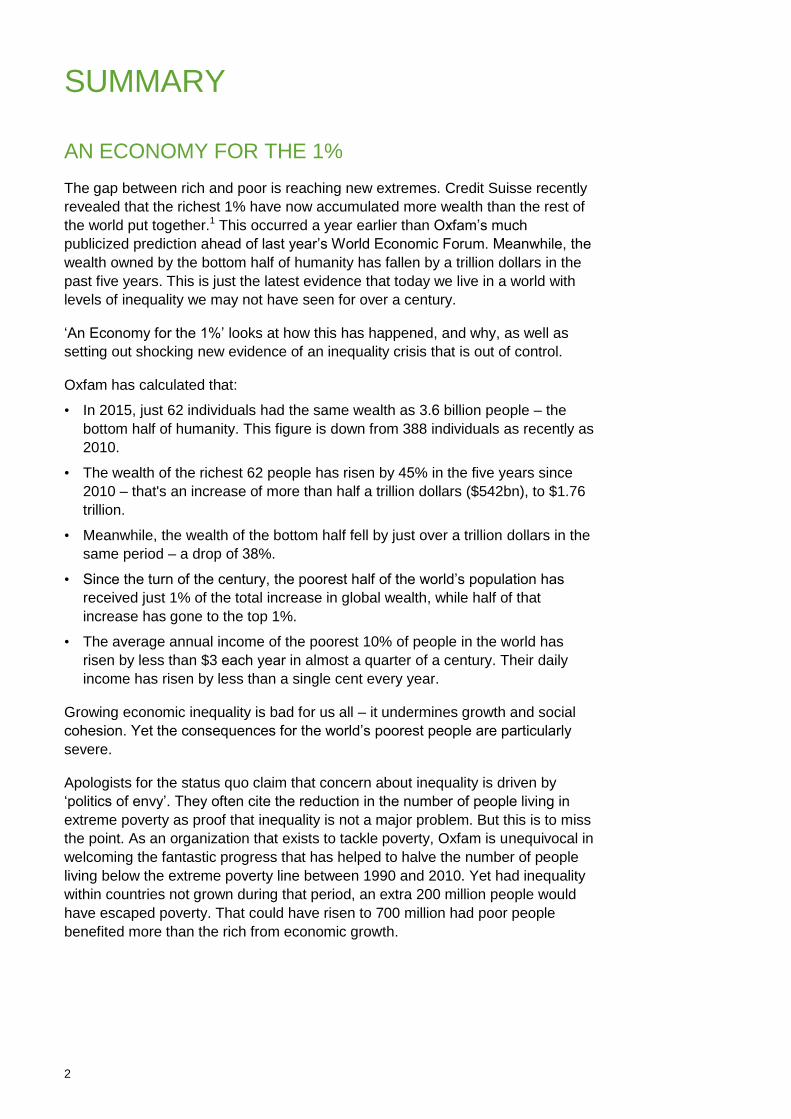
Figure: Global income growth that accrued to each decile 1988–2011: 46% of the
total increase went to the top 10%2
There is no getting away from the fact that the big winners in our global economy
are those at the top. Our economic system is heavily skewed in their favour, and
arguably increasingly so. Far from trickling down, income and wealth are instead
being sucked upwards at an alarming rate. Once there, an ever more elaborate
system of tax havens and an industry of wealth managers ensure that it stays
there, far from the reach of ordinary citizens and their governments. One recent
estimate3 is that $7.6 trillion of individual wealth – more than the combined gross
domestic product (GDP) of the UK and Germany – is currently held offshore.
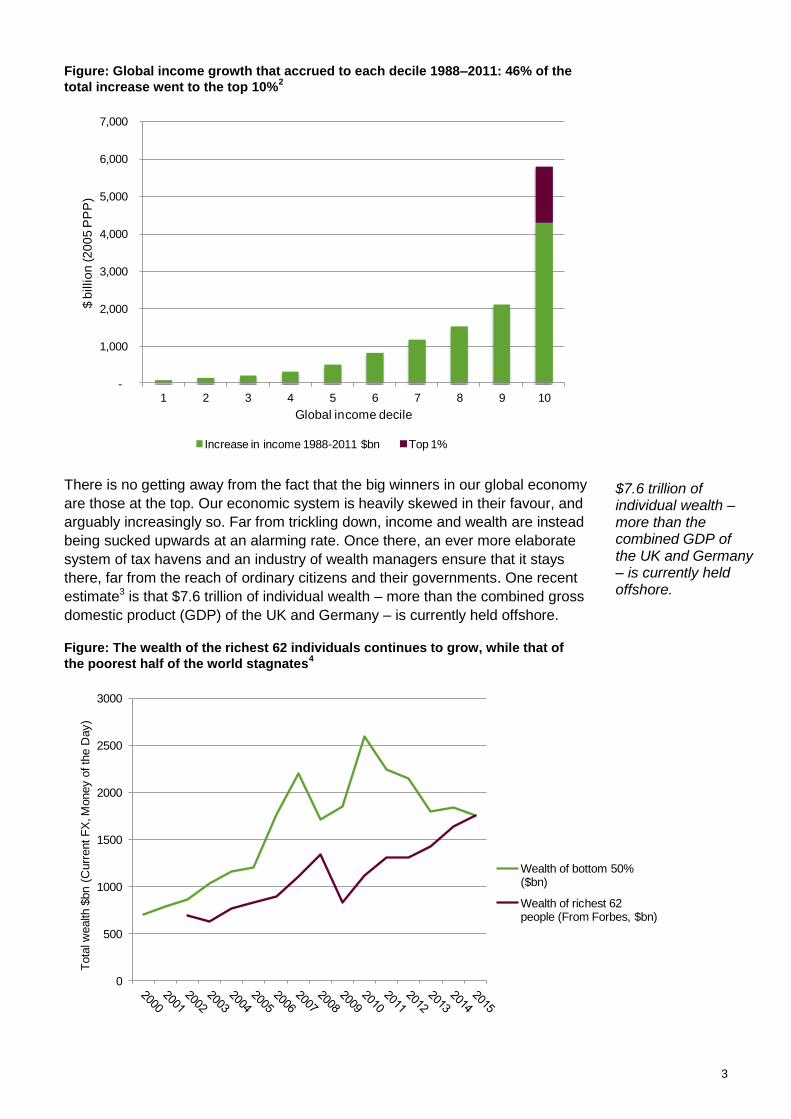
Figure: The wealth of the richest 62 individuals continues to grow, while that of
the poorest half of the world stagnates4
-
1,000
2,000
3,000
4,000
5,000
6,000
7,000
1 2 3 4 5 6 7 8 9 10
$ b
illio
n (2
00
5 P
PP
)
Global income decile
Increase in income 1988-2011 $bn Top 1%
0
500
1000
1500
2000
2500
3000
Tota
l wealth
$bn (
Curr
ent F
X, M
oney o
f th
e D
ay)
Wealth of bottom 50% ($bn)
Wealth of richest 62 people (From Forbes, $bn)
$7.6 trillion of individual wealth – more than the combined GDP of the UK and Germany – is currently heldoffshore.
4
Rising economic inequality also compounds existing inequalities. The
International Monetary Fund (IMF) recently found that countries with higher
income inequality also tend to have larger gaps between women and men in
terms of health, education, labour market participation, and representation in
institutions like parliaments.5 The gender pay gap was also found to be higher in
more unequal societies. It is worth noting that 53 of the world’s richest 62 people
are men.
Oxfam has also recently demonstrated that while the poorest people live in areas
most vulnerable to climate change, the poorest half of the global population are
responsible for only around 10% of total global emissions.6 The average footprint
of the richest 1% globally could be as much as 175 times that of the poorest 10%.
Instead of an economy that works for the prosperity of all, for future generations,
and for the planet, we have instead created an economy for the 1%. So how has
this happened, and why?
One of the key trends underlying this huge concentration of wealth and incomes
is the increasing return to capital versus labour. In almost all rich countries and in
most developing countries, the share of national income going to workers has
been falling. This means workers are capturing less and less of the gains from
growth. In contrast, the owners of capital have seen their capital consistently grow
(through interest payments, dividends, or retained profits) faster than the rate the
economy has been growing. Tax avoidance by the owners of capital, and
governments reducing taxes on capital gains have further added to these returns.
As Warren Buffett famously said, he pays a lower rate of tax than anyone in his
office – including his cleaner and his secretary.
Within the world of work, the gap between the average worker and those at the
top has been rapidly widening. While many workers have seen their wages
stagnate, there has been a huge increase in salaries for those at the top. Oxfam’s
experience with women workers around the world, from Myanmar to Morocco, is
that they are barely scraping by on poverty wages. Women make up the majority
of the world’s low-paid workers and are concentrated in the most precarious jobs.
Meanwhile, chief executive salaries have rocketed. CEOs at the top US firms
have seen their salaries increase by more than half (by 54.3%) since 2009, while
ordinary wages have barely moved. The CEO of India’s top information
technology firm makes 416 times the salary of a typical employee there. Women
hold just 24 of the CEO positions at Fortune 500 companies.
Across the global economy, in different sectors, firms and individuals often use their
power and position to capture economic gain for themselves. Economic and policy
changes over the past 30 years – including deregulation, privatization, financial
secrecy and globalization, especially of finance – have supercharged the age-old
ability of the rich and powerful to use their position to further concentrate their
wealth. This policy agenda has been driven essentially by what George Soros
called ‘market fundamentalism’. It is this that lies at the heart of much of today’s
inequality crisis. As a result, the rewards enjoyed by the few are very often not
representative of efficient or fair returns.
A powerful example of an economic system that is rigged to work in the interests
of the powerful is the global spider’s web of tax havens and the industry of tax
avoidance, which has blossomed over recent decades. It has been given
intellectual legitimacy by the dominant market fundamentalist world view that low

5
taxes for rich individuals and companies are necessary to spur economic growth
and are somehow good news for us all. The system is maintained by a highly
paid, industrious bevy of professionals in the private banking, legal, accounting
and investment industries.
It is the wealthiest individuals and companies – those who should be paying the
most tax – who can afford to use these services and this global architecture to
avoid paying what they owe. It also indirectly leads to governments outside tax
havens lowering taxes on businesses and on the rich themselves in a relentless
‘race to the bottom’.
As taxes go unpaid due to widespread avoidance, government budgets feel the
pinch, which in turn leads to cuts in vital public services. It also means
governments increasingly rely on indirect taxation, like VAT, which falls
disproportionately on the poorest people. Tax avoidance is a problem that is
rapidly getting worse.
• Oxfam analysed 200 companies, including the world’s biggest and the World
Economic Forum’s strategic partners, and has found that 9 out of 10
companies analysed have a presence in at least one tax haven.
• In 2014, corporate investment in these tax havens was almost four times
bigger than it was in 2001.
This global system of tax avoidance is sucking the life out of welfare states in the
rich world. It also denies poor countries the resources they need to tackle poverty,
put children in school and prevent their citizens dying from easily curable
diseases.
Almost a third (30%) of rich Africans’ wealth – a total of $500bn – is held offshore
in tax havens. It is estimated that this costs African countries $14bn a year in lost
tax revenues. This is enough money to pay for healthcare that could save the
lives of 4 million children and employ enough teachers to get every African child
into school.
Tax avoidance has rightly been described by the International Bar Association as
an abuse of human rights7 and by the President of the World Bank as ‘a form of
corruption that hurts the poor’. There will be no end to the inequality crisis until
world leaders end the era of tax havens once and for all.
Companies working in oil, gas and other extractive industries are using their
economic power in many different ways to secure their dominant position. This
has a huge cost to the economy, and secures them profits far higher than the
value they add to the economy. They lobby to secure government subsidies – tax
breaks – to prevent the emergence of green alternatives. In Brazil and Mexico,
indigenous peoples are disproportionately affected by the destruction of their
traditional lands when forests are eroded for mining or intensive large-scale
farming. When privatized – as happened in Russia after the fall of communism for
example – huge fortunes are generated overnight for a small group of individuals.
The financial sector has grown most rapidly in recent decades, and now accounts
for one in five billionaires. In this sector, the gap between salaries and rewards,
and actual value added to the economy is larger than in any other. A recent study
by the OECD8 showed that countries with oversized financial sectors suffer from
greater economic instability and higher inequality. Certainly, the public debt crisis
caused by the financial crisis, bank bailouts and subsequent austerity policies has
hurt the poorest people the most. The banking sector remains at the heart of the
Almost a third (30%) of rich Africans’ wealth – a total of $500bn – is held offshore in tax havens. It is estimated that this costs African countries $14bn a year in lost tax revenues. This is enough money to pay for healthcare that could save the lives of 4 million children and employ enough teachers to get every African child into school.

6
tax haven system; the majority of offshore wealth is managed by just 50 big
banks.
In the garment sector, firms are consistently using their dominant position to insist
on poverty wages. Between 2001 and 2011, wages for garment workers in most
of the world’s 15 leading apparel-exporting countries fell in real terms. The
acceptability of paying women lower wages has been cited as a key factor in
increasing profitability. The world turned its attention to the plight of workers in
garment factories in Bangladesh in April 2013, when 1,134 workers were killed
when the Rana Plaza factory collapsed. People are losing their lives as
companies seek to maximize profits by avoiding necessary safety practices.
Despite all the attention and rhetoric, buyers’ short-term financial interests still
dominate activities in this sector, as reports of inadequate fire and safety
standards persist.
Inequality is also compounded by the power of companies to use monopoly and
intellectual property to skew the market in their favour, forcing out competitors
and driving up prices for ordinary people. Pharmaceutical companies spent more
than $228m in 2014 on lobbying in Washington. When Thailand decided to issue
a compulsory licence on a number of key medicines – a provision that gives
governments the flexibility to produce drugs locally at a far lower price without the
permission of the international patent holder – pharma successfully lobbied the
US government to put Thailand on a list of countries that could be subject to trade
sanctions.
All these are examples of how and why our current economic system – the
economy for the 1% – is broken. It is failing the majority of people, and failing the
planet. There is no dispute that today we are living through an inequality crisis –
on that, the IMF, the OECD, the Pope and many others are all agreed. But the
time has come to do something about it. Inequality is not inevitable. The current
system did not come about by accident; it is the result of deliberate policy
choices, of our leaders listening to the 1% and their supporters rather than acting
in the interests of the majority. It is time to reject this broken economic model.
Our world is not short of wealth. It simply makes no economic sense – or indeed
moral sense – to have so much in the hands of so few. Oxfam believes that
humanity can do better than this, that we have the talent, the technology and the
imagination to build a much better world. We have the chance to build a more
human economy, where the interests of the majority are put first. A world where
there is decent work for all, where women and men are equal, where tax havens
are something people read about in history books, and where the richest pay their
fair share to support a society that benefits everyone.

7
Oxfam is calling on leaders to take action to show they are on the side of the
majority, and to bring a halt to the inequality crisis. From living wages to better
regulation of the activities of the financial sector, there is plenty that policy makers
can do to end the economy for the 1% and start building a human economy that
benefits everyone:
• Pay workers a living wage and close the gap with executive rewards: by
increasing minimum wages towards living wages; with transparency on pay
ratios; and protecting workers’ rights to unionize and strike.
• Promote women’s economic equality and women’s rights: by providing
compensation for unpaid care; ending the gender pay gap; promoting equal
inheritance and land rights for women; and improving data collection to assess
how women and girls are affected by economic policy.
• Keep the influence of powerful elites in check: by building mandatory
public lobby registries and stronger rules on conflict of interest; ensuring that
good-quality information on administrative and budget processes is made
public and is free and easily accessible; reforming the regulatory environment,
particularly around transparency in government; separating business from
campaign financing; and introducing measures to close revolving doors
between big business and government.
• Change the global system for R&D and the pricing of medicines so that
everyone has access to appropriate and affordable medicines: by
negotiating a new global R&D treaty; increasing investment in medicines,
including in affordable generics; and excluding intellectual property rules from
trade agreements. Financing R&D must be delinked from the pricing of
medicines in order to break companies’ monopolies, ensuring proper financing
of R&D for needed therapy and affordability of resulting products.
• Share the tax burden fairly to level the playing field: by shifting the tax
burden away from labour and consumption and towards wealth, capital and
income from these assets; increasing transparency on tax incentives; and
introducing national wealth taxes.
• Use progressive public spending to tackle inequality: by prioritizing
policies, practice and spending that increase financing for free public health
and education to fight poverty and inequality at a national level. Refrain from
implementing unproven and unworkable market reforms to public health and
education systems, and expand public sector rather than private sector
delivery of essential services.
As a priority, Oxfam is calling on all world leaders to agree a global
approach to end the era of tax havens.
World leaders need to commit to a more effective approach to ending tax havens
and harmful tax regimes, including non-preferential regimes. It is time to put an
end to the race to the bottom in general corporate taxation. Ultimately, all
governments – including developing countries on an equal footing – must agree
to create a global tax body that includes all governments with the objective of
ensuring that national tax systems do not have negative global implications.

8
1 THE WORLD IS GETTING RICHER, BUT SOME GAIN MORE THAN OTHERS
IMPRESSIVE GLOBAL PROGRESS
The size of the global economy has more than doubled over the past 30 years.9
In 2014, its value reached nearly $78 trillion. As production and output continue to
grow, there have been absolute increases in gross domestic product (GDP) – one
of the main indicators of economic prosperity – in every region of the world over
this period. In South Asia, combined GDP in 2014 was more than five times what
it was in 1985.
Over the past 30 years, average annual GDP growth has been higher in low- and
middle-income countries than in richer ones.10 Average incomes in poorer
countries are catching up with those in richer ones, and inequality between
nations is falling.11 Emerging economy powerhouses are leading this catch-up
process: China and India, for example, have driven much of the dramatic
increase in the combined GDP of Asian countries. Between 1990 and 2011
economic growth in the region helped nearly a billion people to escape extreme
poverty; 700 million in these two countries alone.12 The proportion of the world’s
population living in extreme poverty fell from 36 percent in 1990 to 16 percent in
2010, such that the Millennium Development Goal to halve extreme poverty was
met five years ahead of the 2015 target.13 Encouraged by this progress, in 2015
the world’s leaders committed to eradicating extreme poverty by 2030 as part of
the Sustainable Development Goals (SDGs).14
Global wealth stocks, the total value of all assets – financial and non-financial –
minus total debt, have also seen robust growth, nearly doubling over the past 15
years from $160 trillion in 200015 to $267 trillion in 2015.16 While the 2008 global
financial crisis had a negative effect on wealth stocks, every region in the world
experienced growth over the period, with some of the biggest increases being in
low- and middle-income countries. Wealth stocks in Latin America and Africa
more than tripled, as did wealth in China and India, two of the fastest-growing
emerging economies.17
DENIED THE BENEFITS OF GROWTH
Global growth and progress in human development give us good reasons to
believe that we can achieve the goal of eradicating poverty for good. However,
the reality of what billions of people in the poorest socio-economic groups have
experienced, and what they can expect if current trends continue, is less
encouraging. Digging behind the global and national aggregates reveals huge
differences in income and wealth at the individual and household levels. Data on
global income shares show that interpersonal income inequality is extremely high
and that those at the top end of the income distribution benefit from a
disproportionately high level of overall growth.

9
If global income growth were distributed equally, one would expect to see roughly
10 percent going to each decile (one-tenth) of the population. However, the reality
is that the distribution is highly unequal: between 1988 and 2011, 46 percent of
overall income growth accrued to the top 10 percent, while the bottom 10 percent
received only 0.6 percent.18 19 In fact, the top 10 percent of the population
received more than the bottom 80 percent and over four times more than the
bottom 50 percent. The picture is even starker when looking at the top 1 percent
of the global income distribution. Between 1988 and 2011, the top 1 percent
received a higher percentage of global income growth than the entire bottom 50
percent (50 times as many people).
Figure 1: Global income growth accruing to each decile 1988–2011; 46% of the
total increase went to the top 10%
Source: Lakner-Milanovic World Panel Income Distribution (LM-WPID) database (2013). Created for C. Lakner
and B. Milanovic (2013) ‘Global Income Distribution: From the Fall of the Berlin Wall to the Great Recession’,
World Bank. Data for 2011 provided through personal correspondence with B. Milanovic, September 2015.
Calculations by Sophia Ayele; more details on the methodology used to construct this chart can be found in the
accompanying methodology note, available at http://oxf.am/ZniS.
Economies may be growing and poorer countries catching up with richer ones,
but the incomes of the poorest people all over the world are not keeping up,
resulting in much slower progress in reducing extreme poverty than could
otherwise be achieved. Research by the Overseas Development Institute (ODI)
has found that, between 1990 and 2010, the bottom 40 percent of people in many
developing countries saw their incomes grow more slowly than the average rate
of growth nationally. If their incomes had grown at the same rate as the average
in all countries, 200 million fewer people would have been living below the
extreme poverty line by 2010.20 If growth had been pro-poor, with the incomes of
the bottom 40 percent growing by 2 percentage points faster than the average,
poverty could be at half the level it is today.21 While the number of people living in
extreme poverty has fallen in recent years, it still remains unacceptably high. The
World Bank estimates that 700 million people were living in extreme poverty
(below $1.90 per day)22 in 2015.23 World Bank economists forecast that, unless
we see pro-poor growth in the next 15 years, we will fail to eradicate extreme
poverty by 2030 and almost half a billion people will remain on income levels
-
1,000
2,000
3,000
4,000
5,000
6,000
7,000
1 2 3 4 5 6 7 8 9 10
$ b
illio
n (2
00
5 P
PP
)
Global income decile
Increase in income 1988-2011 $bn Top 1%
10
below $1.90 a day.24 Inequality of incomes is not just bad for people on the very
lowest incomes, who are being left behind, but is also bad for overall growth
levels and the duration of growth spells. The IMF has found, for example, that an
increase in the income share of the poorest 20 percent of people in a country is
associated with higher GDP growth.25
Looking at the growth rates of the poorest income groups compared with the
average, as the new SDG 10 sets out to do,26 fails to address the stark and
growing gap between the ‘haves’ and the ‘have-nots’ in absolute terms. Even if
the incomes of the poorest people grow at the same rate or faster than the
average, the absolute gap between the rich and the poor will continue to grow.
The incomes of the poorest are so low to start with that any growth in their
incomes remains small in absolute terms, while for those with extremely high
incomes even low growth in percentage terms can result in huge absolute
increases. Research by ODI has found that, over the past three decades, when
countries have experienced prolonged periods of income growth across the
distribution, absolute inequality has always increased. In a sample of developing
countries, over the past 20 years the richest 10 percent of people enjoyed around
one-third of the absolute gains in income from growth, while the bottom 40
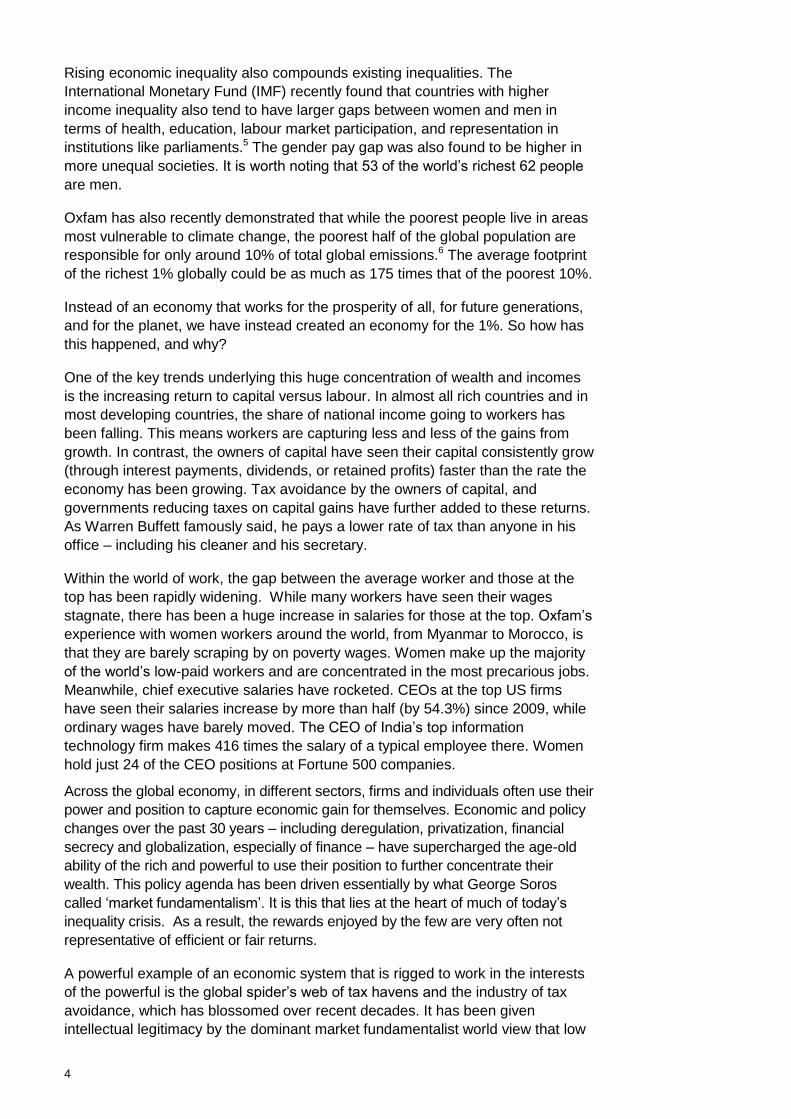
percent saw only around half as much flow their way.27 In Brazil, where income
inequality remains extremely high, the incomes of the poorest 50 percent more
than doubled in real terms between 1988 and 2011, increasing slightly faster than
those of the richest 10 percent. But the increase in the incomes of the top 10
percent equated to many more dollars in absolute terms, such that the absolute
difference between the average incomes of the two groups also nearly doubled.28
Figure 2: In Brazil, the incomes of the poorest 50% have increased faster than
those of the richest 10%, but the gap between the two groups has still grown
Source: Oxfam calculations based on Lakner-Milanovic World Panel Income Distribution (LM-WPID) database
(2013). See sources for Figure 1, and accompanying methodology note, http://oxf.am/ZniS
Oxfam’s analysis for this paper shows that, while both the top 1 percent and the
bottom 10 percent of the global income distribution both experienced growth in per
capita income between 1988 and 2011 – of 31 percent and 33 percent respectively –
these increases had a very different impact on their standards of living. While the per
capita income of the top 1 percent increased from just over $38,000 in 2005 PPP
(purchasing power parity) international dollars to just over $49,800 (an increase of
$11,800),29 that of the bottom 10 percent increased from $196 to $261 (an increase
0
50
100
150
200
250
300
350
400
450
1988 2011
Income bottom 50%
Income top 10%$113bn
gap
$194bn gap

11
of just $65, leaving this group well below the extreme poverty line of $1.90 per day).
Although both groups experienced roughly the same percentage of income growth
over the period, the $65 per capita increase for the bottom 10 percent was dwarfed
by the increase for the top 1 percent, which was 182 times greater.
In terms of wealth stocks, the picture is even more unequal. Last year Oxfam
reported that the richest 1 percent of people held 48 percent of total global wealth
and that, if trends continued, they would have more than half of all wealth by
2016.30 This has happened a year earlier than Oxfam predicted. The average
wealth of each adult belonging to the richest 1 percent is $1.7m, more than 300
times greater than the wealth of the average person in the poorest 90 percent,
although for many people in the bottom 10 percent their wealth is zero or
negative.31 Oxfam also reported last year that the richest 80 individuals on the
Forbes list of billionaires saw their collective wealth increase from $1.3 trillion in
2010 to $1.9 trillion in 2014, giving them the same amount of wealth as the
poorest half of the world. In 2015 the world’s wealthiest 80 billionaires had
collective wealth of more than $2 trillion. Meanwhile, the wealth of the bottom half
of the planet has fallen by approximately $1 trillion in the past five years32 and it
now takes just 62 increasingly wealthy billionaires to equal the wealth of the
bottom half of the world’s population (3.6 billion people). This is down from 388 in
2010, as wealth becomes even more concentrated in the hands of just a few.33
Figure 3: The wealth of the richest 62 individuals continues to grow, while that of
the poorest half of the world stagnates
Sources: Wealth of the bottom 50 percent from Credit Suisse, ‘Global Wealth Databook 2015’. Data on the net
wealth of the richest 62 individuals from Forbes’ annual list of billionaires.
Growing economic inequality also compounds existing inequalities between social
groups, notably gender inequality. Gender inequality is both a cause and a
consequence of income inequality. The IMF recently found that in countries with
higher levels of income inequality, gender inequalities across health, education,
labour market participation and representation were also higher.34 The gender
pay gap, where women earn less than men for doing the same jobs, is also found
to be higher in more unequal societies35 and this is compounded by occupational
segregation and unpaid care responsibilities.36 Women get much less of the
0
500
1000
1500
2000
2500
3000
Tota
l wealth
$bn (
Curr
ent F
X, M
oney o
f th
e D
ay)
Wealth of bottom 50% ($bn)
Wealth of richest 62 people (From Forbes, $bn)

12
economic pie than men do, and the very highest incomes are reserved almost
exclusively for men – 445 of the 500 richest people in the world are men.37
Meanwhile, women make up the majority of the world’s low-paid workers and are
concentrated in the most precarious jobs.38 In addition, a study of emerging
economies found that countries that have seen the most significant long-term
increases in economic inequality – for example, Russia and China – have also
experienced slower than average reductions in gender inequalities.39
Rising inequality is a problem for all of us. The OECD notes that increasing income
inequality poses a risk for social cohesion and threatens to slow down the current
economic recovery.40 The World Bank cites ‘promoting shared prosperity’ as one of
its two primary goals, complementing that of reducing poverty.41 Even the IMF has
highlighted the fact that inequality can have negative consequences not just for the
poorest people but for the overall health of economies.42 If the world is to meet its
recently agreed long-term goal to zero out greenhouse gas emissions by the
second half of the century,43 addressing the distribution of emissions is also critical.
Oxfam recently demonstrated that while the poorest people live in areas most
vulnerable to climate change, the poorest half of the global population are
responsible for only around 10 percent of total global emissions. Meanwhile, the
average carbon footprint of the richest 1 percent of people globally could be as
much as 175 times higher than that of the poorest 10 percent.44
We need to reverse these trends through progressive policies that share
economic rewards between people, rather than concentrating returns to capital.
Income and wealth that are invested in public services and infrastructure could be
used to improve social and economic opportunities and access for the majority,
and to accelerate progress towards eradicating extreme poverty. This would be a
far better outcome for society than an increasing concentration of income and
accumulation of wealth for the few.
CAPITAL OWNERS AND CEOS PROSPER AT THE EXPENSE OF THE AVERAGE WORKER
Income can be split broadly between labour income, which is generated by
workers in the form of wages, salaries and benefits, and capital income, which is
defined as dividends, interest and the retained profits of companies. Over the
past three decades the share of income going to labour has been declining in
most countries around the world,45 while the capital share has been rising. This
was famously highlighted in Thomas Piketty’s best-selling 2014 book Capital in
the Twenty-First Century, which found that returns for the owners of capital have
grown at a faster rate than general economic growth.46 This means that workers
are capturing a smaller share of the gains from growth.
Rich and poor countries alike have been experiencing this trend: the labour share
has declined in nearly all OECD countries over the past 30 years47 and in two-thirds
of low- and middle-income countries between 1995 and 2007.48 Latin America is
the only region that has bucked this trend, with some countries experiencing an
increasing wage share during the period.49 Data from the Penn World Table
indicate that the average labour share of income across 127 countries had fallen
from 55 percent in 1990 to 51 percent by 2011.50 Figure 4 shows that this trend can
be seen in all regions across the world. At the same time, wages are not keeping
up with the productivity of workers.51 A declining labour share reflects the fact that
improvements in productivity and growth in output do not translate into a

13
proportional rise in earnings for workers. This has important consequences
because it removes the link between productivity and prosperity. In the US,
between 1973 and 2014 net productivity grew by 72.2 percent, yet inflation-
adjusted hourly pay for the median worker rose by just 8.7 percent.52
Figure 4: Labour income as a share of GDP in countries of different income levels,
1988–2011
Source: Penn World Table. R.C. Feenstra, R. Inklaar and M.P. Timmer (2015) ‘The Next Generation of the Penn
World Table’, forthcoming, American Economic Review, available for download at www.ggdc.net/pwt
Not only are wages failing to adequately reward workers for their efforts, but
wages are also failing to meet the income needs of individuals and families. In the
European Union, nearly 9 percent of people in employment are at risk of poverty,
and this rate has increased over the past decade.53 Oxfam’s research has
highlighted the challenges faced by the working poor in different countries and
sectors. A recent briefing paper, ‘In Work But Trapped in Poverty’, summarizes
Oxfam research which identifies common findings in five sectors across five
developing countries – workers labouring extremely long hours but still trapped in
poverty.54 In the most recent study (July 2015), garment workers in Myanmar said
that, even with overtime, they could not afford housing, food and medicine with
the incomes they earned in the factories, and expressed concern about low
wages, long hours and safety issues.55 In Morocco in 2009, Oxfam found that
female strawberry pickers were facing numerous violations of their rights,
including harassment by ‘labour providers’, dangerous transport and below-
minimum wages,56 linked to their extreme disempowerment in relation to men.
Low pay can be compounded by other employment vulnerabilities where jobs are
precarious. This is especially the case for women, who make up the majority of
low-paid workers and those in the most precarious forms of work57 and who face
disproportionate responsibilities for unpaid care work, which restricts their
chances of taking up leadership positions or professional or technical jobs.58 On
average, women spend nearly 2.5 times more time on unpaid work than men
each day59 and studies have shown that their responsibilities for unpaid care work
do not reduce as they increase their participation in the labour market.60 Women’s
lower pay rates also have a cumulative effect over their lifetimes, leading to
overall increased insecurity, including lower savings or pensions available for
later in life.61 Women find it harder than men to find decent work, with 84.3
40%
45%
50%
55%
60%
65%
1990 1993 1996 1999 2002 2005 2008 2011
Avera
ge s
hare
of
labour
com
pensa
tion in
GD
P
High-Income Upper-Middle Income Lower-Middle Income Low-Income
14
percent of women in sub-Saharan Africa in vulnerable employment (including
unpaid family work) in 2014, compared with 70.1 percent of men.62 In many
developing regions, 75 percent of women’s employment is informal.63
One efficient way of raising low wages is illustrated by the approach taken by the
Government of Ecuador. The country’s 2008 Constitution contained an article on
the need for a living wage, and by 2014 an associated living wage policy had
been introduced. The minimum wage has increased every year in real terms,
despite high levels of inflation; however, the effect on national employment and
wages has been limited due to non-compliance and the number of informal
workers.64 Companies operating in Ecuador are legally required to pay a living
wage to their workers before issuing dividends to shareholders. Other promising
routes to improving wages include the Freedom of Association Protocol in the
sportswear sector in Indonesia;65 the Action, Collaboration, Transformation (ACT)
process between a group of garment brands and the global union federation
IndustriALL to promote sector-wide bargaining;66 the Malawi 2020 coalition, which
is committed to revitalizing the country’s tea industry and achieving a living wage
by 2020;67 and the Living Wage Foundation accreditation scheme in the UK.68
However, voluntary initiatives such as these have to date delivered negligible
increases in worker incomes when compared with public policy changes such as
those in Ecuador, and to a lesser extent in China, which benefit all workers, not
just those linked to global companies.69
The global economy not only needs to be providing better-paid, decent jobs, but it
also needs more of them. This is particularly vital in the context of continued
population growth and technological developments that provide robotic and
automated substitutes for workers in many sectors. Despite nearly 20 years of
solid growth in GDP, Africa’s economies are creating too few jobs in sectors
where output per worker is high enough to offer a path out of poverty.70 More
worrying still, the fastest-growing sectors in terms of economic activity, such as
high-tech services, are creating the fewest jobs.71 The International Labour
Organization (ILO) estimates that over 201 million people were unemployed
around the world in 2014, an increase of over 31 million since the start of the
global financial crisis.72 To make matters worse, the ILO predicts that the global
employment outlook will continue to deteriorate, with global unemployment
increasing by another 3 million in 2015 alone. Around the world young people,
especially young women, are the most affected by high unemployment rates, with
youth unemployment rates nearly three times higher than those for adults.73 The
ILO reports that this trend is common in all regions of the world, despite an overall
trend of improved educational attainment.
But not all participants in the labour market are missing out. As the overall share of
income going to wages is shrinking, within that share top executives are receiving
larger amounts. In a 2012 report, the OECD found that while low-wage workers
have seen their incomes fall, incomes for the top 1 percent of earners have
increased by 20 percent over the past two decades.74 This is observed in the
dramatic increases in CEOs’ pay packets. The average salary (plus bonuses) of a
CEO at one of the top 350 US firms in 2014 was $16.3m, up 3.9 percent since
2013 and by 54.3 percent since the economic recovery began in 2009 (see Figure
5).75 And this is almost exclusively a realm for men: women hold just 22 of the CEO
positions at S&P 500 companies,76 meaning that this trend is contributing further to
the gender wage gap. High CEO salaries have had a spillover effect, increasing the
pay of other executives and managers and contributing to a doubling of the income

15
shares of the top 1 percent and top 0.1 percent of US households between 1979
and 2007.77 Lower marginal tax rates in the past 30 years – the percentage of tax
applied to income – at top income levels provide a greater incentive for high
earners to devote more energy to shifting more income to their personal pay
packets when the opportunity presents itself.78 Falling marginal tax rates have been
found to have a significant association with higher pre-tax income shares both in
the US and across countries.79
Figure 5: In the US, pay rises for CEOs are far outstripping increases for average
workers
Source: Reproduced from L. Mishel and A. Davis (2015) ‘CEO Pay Has Grown 90 Times Faster than Typical
Worker Pay Since 1978’ EPI. http://www.epi.org/publication/ceo-pay-has-grown-90-times-faster-than-typical-
worker-pay-since-1978/ 80
It is not just in rich countries that CEOs are rewarded with salaries that far outstrip
average incomes. Law makers in India passed a disclosure mandate in 2013
which requires CEO pay ratios to be made public, an important step towards
informing the public about the level of inequality within companies.81 The
Securities and Exchange Board of India is now releasing the first set of
information. This shows that the top executive at the country’s largest cigarette
manufacturer, for example, is being paid 439 times the median salary for
employees at his company, while his counterpart at the top IT services firm
receives 416 times as much as the average employee of that company.82
PRIVILEGE, POWER AND INFLUENCE DRIVE THE CONCENTRATION OF ECONOMIC REWARDS
As people rely on national economies to generate jobs, goods, services and
stability, strong economies are needed to reduce poverty, particularly in the poorest
countries. This is important, while acknowledging that measures of economic
growth omit important non-monetary facets of well-being and progress.83
Free markets have long been promoted as the most efficient approach for an
economy to be managed, with the laws of supply and demand resulting in optimal
prices for all goods and services.84 This perspective has dominated mainstream
economics and has long influenced policy makers, particularly during the 1980s.
997.2%
503.4%
10.9%0%
200%
400%
600%
800%
1000%
1200%
1400%
1978 1982 1986 1990 1994 1998 2002 2006 2010 2014
Pe
rce
nta
ge
ch
an
ge
CEO pay S&P 500 Typical worker pay

16
It lay behind the Washington Consensus, which set out a prescription for
developing countries, broadly recognized as an approach focusing around
privatization, liberalization and macro-stability (meaning mostly price stability).
This approach suggested a minimal need for governments to intervene in the
productive economy in order to let markets flourish.85 But by the 1990s, the
Washington Consensus model had clearly been shown to be deeply flawed,
doing more harm than good in many of the developing countries pursuing these
strategies.86 For example, in Egypt free market fundamentalism and structural
adjustment programmes (SAPs) have been strongly associated with negative
impacts on the ability of women to benefit from growth, due to their concentration
in a limited number of economic sectors, their limited mobility and their
responsibilities for unpaid care work.87
This ‘one size fits all’ model was based on the assumption that we live in a
‘perfectly competitive economy’: everyone knows everyone else’s business and
anyone can participate, an assumption that clearly does not hold true in real life.
Buyers and sellers are constantly seeking to gain advantage over competitors,
disrupting the playing field so that it is anything but level. Technological and
organizational innovation, new products or services and new ways of delivering
them can all give sellers an advantage. But this advantage can also be gained
through entrenched relationships with people in power, the distortion of regulations
and laws in their favour and the exploitation of market failures to their advantage.
Box 1: Rent seeking
‘Resources can be used unproductively to claim output or wealth that already exists,
or to seek policies that create privileged benefits. Such unproductive behaviour is
known as rent seeking. Much of rent seeking involves government or political
decisions … but rent seeking also takes place in personal relations and within firms
and bureaucracies.’
Source: R.D. Congleton and A.L. Hilman (2015) Companion to Political Economy of Rent Seeking,
Edward Elgar Publishing
It is not always necessary to invest hard work, effort and creativity to generate
lucrative returns and a position of economic power and advantage. Income and
wealth generation can in fact be almost completely disconnected from productivity
or added value. An extreme example of this would be a warlord putting up a
barrier at a bridge and charging people to cross, even though he had nothing to
do with the construction of the bridge. However, it is often harder to identify where
returns are disconnected from value. For instance, an oil company might argue
that through its technological expertise and upfront capital investment, profits
generated from the extraction of oil are a genuine reflection of the economic
contribution of its activities. However, the huge profits of the company and the
million-dollar salaries of its executives are also generated as a result of its ability
to exclude others from this industry and the international demand for oil which
pushes up prices; even more so when there is less of it produced.
It would be perverse to argue that the contributions of 62 individual billionaires are
worth the same as those of 3.6 billion other people. It is unimaginable that the
CEO of a tobacco company in India is as productive as 439 of his employees
combined, or that the owner of a UK clothing retailer can produce the same as
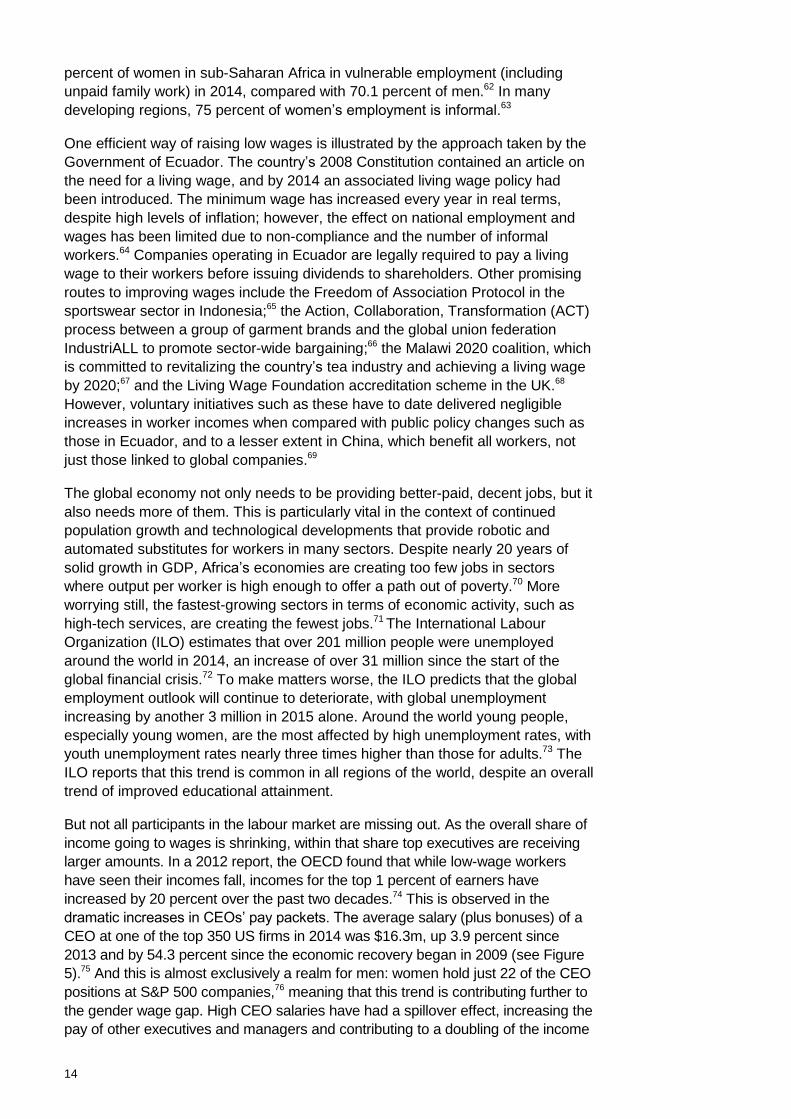
more than 2,000 garment workers.88 But the gap between the richest and the rest
17
continues to grow. The increase in the CEO-to-average pay ratio in the UK has
grown even since Oxfam published its inequality report in 2014 and now stands at
183:1.89 For capital owners and executives the rewards continue to grow,90 while
the average worker receives less for additional contributions as the gap between
workers’ productivity and workers’ wages widens (see Figure 6).
Figure 6: Worker productivity in developed countries has increased but wages
have failed to keep up
Source: Reproduced from Figure 7, ILO, ‘Global Wage Report 2014/15’. ILO Global Wage Database; ILO
Trends Econometric Models, April 2014.
The practices of so-called ‘crony sectors’ illustrate how benefit-free wealth can be
accrued to such a massive extent. Crony sectors are those that are vulnerable to
monopoly or that have a large degree of state involvement, including government
authority to provide licences to operate. The increase in billionaire wealth from
crony sectors also suggests that wealth and income are being accrued in ways
that do not deliver associated benefits or value to the rest of society. Using
Forbes data to calculate the wealth concentrated in crony sectors, The Economist
finds that billionaires from emerging economies who have generated their wealth,
at least in part, from these sectors doubled their wealth relative to the size of the
economy between 2000 and 2014.91 It also finds that individuals have benefited
from urbanization and the associated increase in land and property values; the
commodity price boom has enriched natural resource owners from Brazil to
Indonesia; and privatizations, some of which have taken place on dubious terms,
have also led to lucrative returns for new private owners.92
Looking at the wealth of individuals that derives from both state-dependent
industries and corruption-prone countries, together with extreme wealth that has
been inherited and thus not ‘earned’, Oxfam estimates that at least 50 percent of
the fortunes of the world’s billionaires could have been gained at least in part by
non-meritocratic means.93 In India, 46 percent of billionaires have made their
fortunes from sectors that depend upon market power, influence or preferential
access to licensing.94 In Mexico, four multi-millionaires have seen their combined
100
102
104
106
108
110
112
114
116
118
1999 2001 2003 2005 2007 2009 2011 2013
Ind
ex (b
ase
ye
ar
=1
99
9)
Labour productivity index
Real wage index

18
wealth increase from the equivalent of 2 percent of the country’s GDP in 2002 to
9 percent in 2014.95 A significant portion of the fortunes of all four of these
individuals is derived from sectors that have been privatized, concessioned
and/or regulated by the public sector. German Larrea and Alberto Baillères, for
example, are owners of mining companies that have exploited a boom in the price
of commodities.96
Economic and political institutions have the power to either mitigate or exacerbate
the extent to which rewards can be delinked from effort and merit. They can and
should keep in check how much market power sectors, firms and individuals wield
and how they use this power. Intellectual property protection, for example, can
either ensure that those who put in the hard work and effort are duly rewarded or it
can create opportunities for companies and individuals to dominate markets.
Temporary competitive advantages that come from innovation can be made
permanent by changes in laws and regulation, which skew the game in perpetuity.
In principle, a country’s economy and its political system are separate but, as
Oxfam showed in its 2014 paper ‘Working for the Few’, in reality they are
intrinsically linked.97 The relationship between economic and political power and
inequality creates a cycle which affects the design of institutions established to
govern economies.98 Wealth has the potential to capture government policy
making and bend the rules in favour of the rich, often to the detriment of everyone
else. The consequences of this include the erosion of democratic governance, the
diminishing of social cohesion and the reduction of equal opportunities for all. In
the past, some excesses were reduced through the power of unionized workers
and their influence over economic institutions, but the global decline of private
sector unionization has weakened this power and this decline has been closely
associated with rising inequality.99
Over the past 35 years, decisions on deregulation and privatization, combined
with the advent of the information age and globalization, have created new
opportunities. But these forces have also allowed sectors, firms and individuals to
capture a disproportionate amount of economic power. This is not benign. The
concentration of economic power is used to further the interests of these sectors,
companies and individuals, creating a vicious and unjust cycle that maintains and
increases elite control over economic markets and resources at the expense of
everyone else, from competitors to employees. Women in particular are
disadvantaged, as they are unrepresented in positions of leadership and over-
represented in low-paid sectors, the informal economy and unrecognized unpaid
work. If shared prosperity is to be achieved, where people have the opportunity to
participate in economic growth and see their hard work pay off, the institutions
that govern how our economies work must reflect the interests of ordinary people
rather than those of the economically and politically powerful.
The evidence examined in Section 1 highlights urgent and concerning trends. The
world is not short of income, which continues to grow; or of wealth, which
continues to accumulate. It is unjust that people living in poverty are not getting
the boost to their incomes that they desperately need, while already privileged
capital owners receive a greater share of income and wealth, which become ever
more concentrated, and inequality rises.

19
2 POWER AND PRIVILEGE IN ACTION
Building on the global trends and evidence explored in section 1, section 2 of this
paper looks at mechanisms, organizations and individuals where evidence can be
found of economic and political power being used to shape rules and institutions
to the benefit of the elite few. It first examines the architecture of the global tax
system, which has an impact on all businesses and individuals. It then looks at
specific sectors where substantial gains are being made by people in positions of
power and influence, along with resulting environmental, social and financial
costs faced by ordinary people. The three sectors highlighted – extractives, the
financial sector and the garment sector – are diverse in their structures and their
significance in different economies, but all exhibit a tendency to exclude ordinary
people from the rewards that they generate. This section then identifies corporate
structures and legal provisions that facilitate the concentration of economic
power, and finally focuses on the power that wealthy individuals have to rig the
rules in their favour.
ELITES SHAPING THE GLOBAL TAX SYSTEM AND KEEPING TAX HAVENS OPEN FOR BUSINESS
In every country in the world, tax revenues pay for public services, infrastructure,
regulatory bodies, welfare systems and other goods and services that keep the
country running. Fair tax regimes are vital to finance well-functioning and efficient
states and to enable governments to fulfil their obligations to uphold citizens’
rights to essential services such as healthcare and education. In developing
countries in particular, where there is an even bigger need for strengthening
health and education services for the hundreds of millions of people who still live
in extreme poverty, revenues from taxes provide a sustainable way to raise funds,
and a well-designed and progressive tax system can ensure that those who can
afford it most make the largest contribution. However, national tax codes as well
as the international tax structure, can fail to achieve this and instead work in
reverse, so that the biggest burden falls on the poorest people.100 101
The current global tax architecture also weakens the ability of governments to
collect the taxes they are due by facilitating cross-border tax dodging and the
concealment of wealth. In particular, tax havens102 and offshore financial centres,
which can be characterized by secrecy as well as by low- or zero-tax regimes, are
one of the most obvious facilities used to enable individuals and companies to
escape their tax liabilities. Governments are so far failing to crack down on the
global practice of tax avoidance and the associated network of tax havens.103 This
system is exploited by highly paid and very industrious professional enablers in
the private banking, legal, accounting and investment industries, who take
advantage of an increasingly borderless, frictionless global economy. It is the
wealthiest companies and individuals, who in a progressive tax system should be
paying the most in tax, who have the biggest incentives to exploit this architecture
to avoid paying their fair share in taxes, and who can afford to hire the enablers.

20
Exploiting tax loopholes and engaging in large-scale tax avoidance are integral
components of the profit-making strategies of many multinational corporations
(MNCs). Companies can artificially shift the ownership of assets or the real cost
of transactions to paper subsidiaries in low-tax jurisdictions or jurisdictions that do
not require disclosure of relevant business information. Profits disappear from
countries where real economic activity is taking place, to exist only in tax havens.
In 2012, for example, US MNCs reported $80bn of profits in Bermuda – more
than their reported profits in Japan, China, Germany and France combined. This
huge amount – 3.3 percent of all profits made by these companies worldwide –
clearly does not reflect the real economic activity taking place in Bermuda, where
total sales account for only 0.3 percent and the share of total number of
employees or total wage costs is a tiny 0.01–0.02 percent.104
Companies that reduce their tax bills (including through legal avoidance and
illegal evasion) can gain a significant advantage over domestic competitors and
small and medium-sized enterprises (SMEs). The offshore system and harmful
tax competition are also costing governments billions of dollars each year. While
the exact sums involved remain something of a mystery, it is clear that this is a
significant problem. Oxfam reviewed publicly available data on more than 200
companies, which included the 100 largest firms in the world and the World
Economic Forum’s strategic partners and found evidence that nine out of ten of
them have a presence in at least one tax haven.105 IMF data show that corporate
investment in these same tax havens increased by almost four times between
2000 and 2014.106 The use of tax havens and other tax-dodging practices affects
countries of all income levels, including the poorest countries. It is estimated
that tax dodging by MNCs costs developing countries around $100bn
annually.107
As tax returns from multinational companies and wealthy individuals fall short of
their potential, governments are left with two options: either to cut back on the
essential spending needed to reduce inequality and deprivation or to make up the
shortfall by levying higher taxes on other, less wealthy sections of society and
smaller businesses in the domestic economy. Both options see the poorest
people lose out and the inequality gap grow.
The offshore world and the opacity it offers also provide a safe haven for
laundering the proceeds of political corruption, illicit arms dealing and the global
drugs trade, contributing to the spread of globalized crime and facilitating the
plunder of public funds by corrupt elites. Tax avoidance has rightly been
described by the International Bar Association as an abuse of human rights108 and
by the President of the World Bank as ‘a form of corruption that hurts the poor’.
There will be no end to the inequality crisis until we end the era of tax havens
once and for all.
Achieving a global consensus on a more meaningful approach to tackling harmful
tax practice is long overdue. Eighteen years ago the OECD’s ‘Harmful Tax
Competition’ report proposed that countries should ‘consider terminating their tax
conventions with listed tax havens’.109 Unfortunately, OECD member countries
that operate in practice as tax havens, together with other powerful members that
are home to the world’s largest companies, succeeded in blocking further
progress at that time. Sadly, we are still paying the price for this lack of political
will. The more recent attempt of the G20/OECD Base Erosion and Profit Shifting
(BEPS) project, endorsed by G20 leaders in November 2015, has again done

21
little to curb harmful tax practices,110 and attempts to introduce tougher rules have
been watered down.111 Under this process, there was an historic opportunity to
reverse all the scandals and abusive practices that have been attracting
headlines all over the world – but the chance was not taken.
SECTOR INSIDERS
Extractive industries
Non-renewable oil, gas and mining resources play a dominant role in many
countries’ economies. In these countries, opportunities for income and wealth
generation, technological progress and government revenues associated with
activities in this sector dwarf those of other productive sectors. However, large
gains offered by this sector can in some countries be overwhelmingly
concentrated in the hands of a few and can result in an economy focused on the
extraction of value from these assets, rather than on innovation, job creation and
enterprise that benefit the majority.
Governments and companies make money from natural resources when
technology and know-how enable their extraction at a cost that is economically
viable, and when international commodity markets keep prices high. The
opportunity for generating high returns is also helped by laws, geology and
specialized knowledge that isolate the sector’s activities from competitive market
forces, in effect creating monopolies. Control over the sector often sits in the
hands of state-owned companies, with some, such as Sonangol in Angola, being
responsible for both the administration and regulation of the sector.112 Control can
also be concentrated in private hands: for example, the sale of Russian oil giant
Yukos to Mikhail Khodorkovsky in 1995 effectively created a private oil monopoly
with extreme economic power and market dominance.113
While the rewards flood to the few, they rarely experience the broader economic,
social and environmental costs associated with activities in the sector that
ordinary people cannot escape. Locally, extractive activities affect people’s
homes and environments. In Brazil and Mexico, for example, indigenous peoples
are disproportionately affected when forests are eroded for mining or intensive
large-scale farming and their living space is destroyed.114 Costs are also borne by
people working in other economic sectors: as the appreciation of local currencies
affects the competitiveness of other export industries; national investment and
subsidies targeted to the sector are prioritized at the expense of others; and the
offer of big salaries lures the brightest workers. In the long term, the impacts of
extracting these resources will be felt by people in future years and across
borders, in terms of climate change.115
Actors in the extractives sector are keen to capitalize on the potential to make
substantial returns and use their economic power and political access to maintain
their position and gain further advantage. Government subsidies, for example, are
gifted to the sector to ensure that it remains financially robust, a benefit that is not
afforded to greener and more sustainable forms of energy production to anything
like the same extent. G20 country governments alone are providing $452bn a
year in subsidies for the production of fossil fuels.116 Much secrecy exists around
contracts and finances associated with this sector; vested interests have worked
hard to block legislation designed to improve the transparency of extractive
revenues and strengthen accountability. The American Petroleum Institute (API),
one of the biggest opponents of such measures, spent at least $360m on lobbying

22
the US government between 2010 and 2014.117 Despite conclusive evidence of
the role that hydrocarbons play in accelerating climate change, vested interests in
the sector continue to fund climate change-denying think tanks.118 ExxonMobil
has reportedly been deliberately denying the link between fossil fuels and climate
change for more than 30 years.119
Nigeria is Africa’s largest oil exporter, with oil revenues accounting for 70 percent of
total government revenues in 2011120 and representing 90 percent of the country’s
export earnings. International oil companies dominate activities in the sector,
generating billions of dollars in profits, and Nigerian oil bloc owners have also
profited greatly, with a handful of individuals becoming billionaires.121 122 The sector
is characterized by a close and pernicious relationship between politics and
economics, which has eroded the extent to which proceeds are distributed fairly to
the population. One recent report released to the Nigerian press revealed a list of
persons who own oil blocs due to their ability to capture the machinery of the
state.123 Conditions written into the contracts of international oil companies requiring
them to partner with local companies have been exploited by corrupt political elites
who have created shell companies to capture a slice of the rewards.
While these dynamics play out between the economically and politically powerful,
more than half of the population see no benefits from the sector and live in
extreme poverty on less than $1.90 per day.124 The embezzlement of oil revenues
and proactive lobbying by companies to reduce their contributions to the national
budget (see Box 2) reduce the funds available to pay for much needed public
services and infrastructure that could cut poverty. The poorest citizens also have
to live with environmental damage, which in the Niger Delta is expected to take
30 years to clean up.125 Recognizing these challenges and the importance of
better oversight of the sector, the new government that came to power in May
2015 has made some far-reaching policy pronouncements and has taken action
to remedy the situation, including the idea of reactivating small-scale and local
refineries and requiring the Nigerian National Petroleum Corporation (NNPC) to
publish monthly operational costs for the first time in its history.126
Box 2: Oil companies in Nigeria have actively opposed tax measures that
would benefit communities
The Petroleum Industry Bill was first drafted in 2007 and has been debated for
years. The proposed legislation provides for a new 10 percent tax on profits that is
meant to flow to local communities, and an increase in royalty rates. Oil companies
(mainly Shell, ExxonMobil, Chevron, Texaco and Total, all members of the Oil
Producers Trade Section (OPTS) industry group) have long been opposed to the
new Bill, as various reports attest; as one put it: ‘International oil companies have
been lobbying hard to have the fiscal terms proposed in the now-famous draft
Petroleum Industry Bill (PIB) diluted.’127
Nigeria’s new President, Muhammadu Buhari, was inaugurated on 29 May 2015. On
4 June, the House of Representatives actually passed the PIB. However, on 9 July it
was reported that the new government planned to take the Bill ‘back to square one,
and especially that it would revise its fiscal terms’,128
according to documents leaked
from within the ruling party.129
The campaign appears to have been successful. ‘The
new administration has yet to determine what will go into the new bill but says it will
be based on consultations with international oil companies’, it was reported.130
Source: Case study compiled by Mark Curtis of Curtis Research

23
The financial sector
The financial sector has grown rapidly in recent decades, driven in particular by
the growth of large banks and other financial companies in the US, Canada and
Europe.131 The sector now accounts for an estimated 15 percent of global
GDP.132 It has also created some of the biggest and most profitable companies in
the world, including 437 of the world’s 2,000 largest companies in 2014,
according to the Forbes Global 2000 rankings; financial companies in this group
have assets five times larger on average than non-financial companies.133
Globally the sector has provided more people than ever before with access to
financial services: 62 percent of the world’s adult population now have an
account, up from 51 percent in 2011.134 It has also helped create vast wealth for
individuals, with 20 percent of all dollar billionaires in the world in 2014 being
listed as having interests or activities relating to the finance and insurance
sectors.135
Since the 1980s, the activities of the financial sector have extended beyond
providing financial services for citizens and business. They now include a
sophisticated set of tools and processes designed to create value from
transactions, speculation and asset prices, which are unrelated to value addition,
output or productivity in the real economy, but which now dominate the sector.136
This has been facilitated by the deregulation of the financial sector in the past 30
years.137 The shadow banking sector (i.e. non-bank financial intermediaries who
are not subject to regulatory oversight) now dominates the activities of the
financial sector, as shown in Figure 7.138 In the US, the financial industry now
accounts for about 30 percent of all operating profits, double its share in the
1980s;139 but is responsible for less than 10 percent of value-added in the
economy.140 At the individual level, it has been estimated that roughly 30–50
percent of the earnings of financial sector employees is over and above what they
add in value.141 Arguably the best example of the separation of value-added from
earnings was the remuneration packages of the top executive teams at Bear
Stearns and Lehman Brothers, who earned $650m and $400m respectively
between 2003 and 2008 – a period in which these two firms were heading for one
of the most spectacular failures in American financial history.142
24
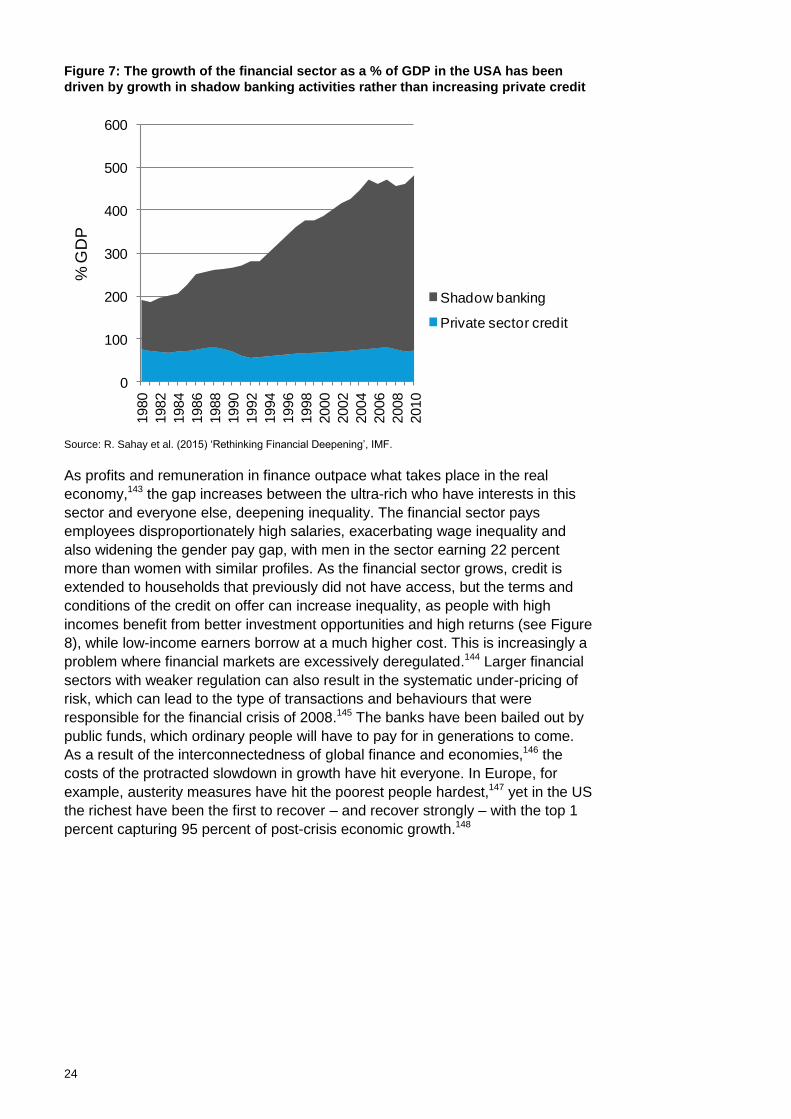
Figure 7: The growth of the financial sector as a % of GDP in the USA has been
driven by growth in shadow banking activities rather than increasing private credit
Source: R. Sahay et al. (2015) ‘Rethinking Financial Deepening’, IMF.
As profits and remuneration in finance outpace what takes place in the real
economy,143 the gap increases between the ultra-rich who have interests in this
sector and everyone else, deepening inequality. The financial sector pays
employees disproportionately high salaries, exacerbating wage inequality and
also widening the gender pay gap, with men in the sector earning 22 percent
more than women with similar profiles. As the financial sector grows, credit is
extended to households that previously did not have access, but the terms and
conditions of the credit on offer can increase inequality, as people with high
incomes benefit from better investment opportunities and high returns (see Figure
8), while low-income earners borrow at a much higher cost. This is increasingly a
problem where financial markets are excessively deregulated.144 Larger financial
sectors with weaker regulation can also result in the systematic under-pricing of
risk, which can lead to the type of transactions and behaviours that were
responsible for the financial crisis of 2008.145 The banks have been bailed out by
public funds, which ordinary people will have to pay for in generations to come.
As a result of the interconnectedness of global finance and economies,146 the
costs of the protracted slowdown in growth have hit everyone. In Europe, for
example, austerity measures have hit the poorest people hardest,147 yet in the US
the richest have been the first to recover – and recover strongly – with the top 1
percent capturing 95 percent of post-crisis economic growth.148
0
100
200
300
400
500
6001980
1982
1984
1986
1988
1990
1992
1994
1996
1998
2000
2002
2004
2006
2008
2010
% G
DP
Shadow banking
Private sector credit

25
Figure 8: The finance curse – a bigger financial sector hurts those at the bottom
most and benefits those at the top149
Note: Simulated effects of credit and stock market expansion vary across the income distribution; the figure
shows a link between household income growth for different deciles and a 10% of GDP expansion of
intermediated credit. Source: http://www.oecd.org/eco/How-to-restore-a-healthy-financial-sector-that-supports-
long-lasting-inclusive-growth.pdf
The development of sophisticated tools and instruments to manage financial
flows globally has also allowed companies and individuals to withdraw their
money from jurisdictions all over the world illicitly and without being traced.150 In
particular, the banking sector has established a strong presence in tax havens,
providing a safe haven for tax dodgers. The majority of offshore wealth is
managed by just 50 banks, and the 10 busiest banks manage 40 percent of these
offshore assets.151 Banks have lobbied hard to preserve havens for international
corporations looking to avoid taxes.152
In addition, the economies of countries with a large and dominant financial sector
have been found to grow more slowly over time than those that are more balanced,
as the dominance of finance crowds out other productive sectors.153 154 Globally,
the growing financial sector is also having an impact on economies beyond those
where it currently dominates. In emerging markets, where there is still a great need
for increased access to finance for the majority of citizens, there are already
worrying signs that the sector is serving financiers and shareholders by working
with high-margin corporate businesses, rather than providing services for the
broader economy.155 Women in particular miss out if the financial sector is not
designed to meet their needs; for example, women in developing countries are 20
percent less likely than men to have a formal bank account, and 17 percent less
likely to have borrowed money from a formal institution in the last year.156
With economic success come power and influence, particularly over the policies
and institutions that are designed to control and regulate the sector’s activities.
Companies use their financial resources to pay thousands of lobbyists to directly
influence policy makers. In 2014, finance and insurance companies spent just
under $500m on lobbying activities in Washington alone.157 Investments by
financial companies in research agendas and think tanks also have a big influence:
-1
-0.8
-0.6
-0.4
-0.2
0
0.2
Bottom decile
Second decile
Third decile
Fourth decile
Fifth decile
Sixth decile
Seventh decile
Eighth decile
Ninth decile
Top decile
Pe
rce
nta
ge
po
ints

26
for example, in 2014 the financial sector gave at least £1.3m to fund the UK’s 18
most powerful think tanks – raising questions about their independence.158
Stretched government regulators face ‘lawyers, lobbyists, and under-written think
tanks – all of whom have the time and money to present extensive, if wildly biased,
legal and economic arguments’, according to one analysis.159
At the individual level, financial managers also exploit opportunities to shift rents
to themselves, sometimes through illicit means.160 A recent survey of financial
sector workers in the US and the UK found that more than one-third (34 percent)
of those earning $500,000 or more annually had witnessed or had first-hand
knowledge of wrongdoing in the workplace. Twenty-three percent of respondents
believed it was likely that fellow employees had engaged in illegal or unethical
activity in order to gain an edge, nearly double the 12 percent who reported this in
2012.161 Similarly, one-third of UK-based finance professionals feel under
pressure to compromise their ethical standards in the workplace.162 Recent
scandals across the world involving bankers engaged in predatory and
discriminatory lending, abusive credit card practices, market manipulation (e.g. of
the Libor rate) and a host of other misdeeds have led to the widespread view that
there is also a moral deficiency, a culture of corruption, in the sector.163
The garment sector
Globalization and with it the increase in cross-border trade have created
opportunities for low-wage economies to be highly competitive in international
markets for goods and services that require a large concentration of employees
for their production and delivery. A number of countries, particularly in East Asia,
have embraced this opportunity, with low-wage employment being a core
foundation of their growth and development. China, for example, has experienced
rapid export-led growth over the past three decades, creating millions of jobs164
and enabling hundreds of millions of people to work their way out of extreme
poverty. In particular, the growth of the garment sector in many Asian economies
has been critical to their development strategies.
For the labour-intensive garment sector, keeping wages low and productivity high
is crucial to success. Retail businesses, particularly in the US and Europe, have
deliberately pursued a model of outsourcing production to low-wage economies,
taking advantage of global-level policy and political changes. The resulting
structure creates a separation between the retail side of the business, where
prices are set and brand reputation is critical, with the production side, diluting the
company’s responsibility and accountability to workers and the conditions they
are employed under. Global brand buyers are able to draw on a variety of
potential suppliers from all over the world, leaving these suppliers in a state of
constant competition for contracts and pitting low-wage workers against each
other across countries, leaving them with little leverage in the supply chain.
Research suggests that wages could be increased with minimal increases in the
prices paid by retailers or consumers.165 However, price pressures and the limited
bargaining power of workers mean that even small increases are resisted
because of their impact on profitability.166 Governments seeking to attract
investment and create jobs also have an incentive to maintain this arrangement,
which keeps labour costs as low as possible for international investors; they often
further encourage MNCs to use local labour by offering tax incentives and access
to land and by overlooking environmental risks. Hence in China, for example,

27
while productivity in the garment sector has doubled, wages have increased by
only half as much (see Figure 9).167
Between 2001 and 2011, wages for garment workers in most of the 15 leading
apparel-exporting countries actually fell in real terms.168 The acceptability of
paying women lower wages has been cited as a key factor in increasing
profitability; in many instances the lowest-paid roles are taken by women, and
gender inequalities are specifically cited as facilitating this process.169 This clearly
pays dividends for companies further up the supply chain, as production costs
remain low and the prices paid by apparel buyers for products fall.170 The majority
of value-added in the garment value chain shifts to the buyers, who control
intangible activities such as product development, design, marketing, branding
and management; these are estimated to constitute some 60–75 percent of
added value.171 The distribution of proceeds from this sector is maintained by
vested interests at the top of the supply chain, who exercise their economic and
political power to extract maximum profit at the expense of workers.
Figure 9: Jobs and productivity grow in the Chinese garment sector, but real
wages fall behind172
Source: M-H. Lim (2014), ‘Globalization, Export-Led Growth and Inequality’
Textiles have made an important contribution to growth and job creation in
Bangladesh,173 with the sector accounting for 75 percent of all manufacturing jobs
in the country. However, its proceeds are primarily captured by companies higher
up the value chain and are absorbed in national growth statistics, which masks
the distributional effects. Most jobs are low-skilled and low-prospect and are often
precarious, and 85 percent of textiles workers are women.174 Compounding this,
Bangladeshi women also shoulder the vast majority of unpaid care and domestic
responsibilities, with little support from men in the household or through state
provision of services. For example, women garment workers are four times more
likely than men to look after sick children or dependants.175 The sector has fallen
disappointingly short of its potential to provide good-quality jobs and good
working conditions, with associated social and development benefits.
The injustice felt by workers goes beyond pay. The plight of workers in garment
factories in Bangladesh captured international attention in April 2013, when 1,134
workers176 were killed in the collapse of the Rana Plaza factory in Dhaka. People
are losing their lives as companies seek to maximize profits by circumventing
necessary safety practices. Despite all the attention and rhetoric following this
tragedy, however, the short-term financial interests of buyers still dominate
0
100
200
300
400
500
600
700
800
900
1000
Labour productivity Index
Real average wage index

28
activities in the sector, and reports of inadequate safety and fire standards
persist.177
The need to distribute rewards more fairly down the supply chain in the garment
sector is now well appreciated and increasingly is being called for. Progress has
been made in several countries where buyers have helped build the case for
higher wages and better conditions for workers, recognizing the injustice of the
current balance of power. In Myanmar, for example, when the government
published its proposed national minimum wage in July 2015, a number of
garment manufacturers called for an opt-out, claiming that paying it would make
their businesses unsustainable. Prompted by Oxfam, and with leadership from
the Ethical Trading Initiative (ETI) in the UK and the Fair Labor Association in the
US, 30 European and US brands (including Tesco, Marks & Spencer, Primark
and Gap) wrote to the Myanmar government, arguing that ‘a minimum wage that
has been negotiated by all parties will attract rather than deter international
companies from buying garments from Myanmar’. This prompted a lively debate
in the local media. The call for an opt-out was rejected and the new minimum
wage was confirmed with effect from 1 September 2015.178
Unfair labour conditions are putting brand reputations at risk, and in response a
plethora of social auditing and certification schemes have been introduced.
Larger brands have placed more staff at the country level to monitor factories and
advise employers on ways to improve working conditions. However, these efforts
fail to address the more structural features of how the global apparel industry
works. Brands and buyers have the power to squeeze costs at one end of the
supply chain while commanding profits at the other, while certain governments
keep wages deliberately low in order to attract business.179 What is needed is a
redesign of the structure to deliver a fairer share of value and to ensure that the
market rewards employers, brands and retailers for delivering good-quality jobs to
the people who make their products.
CORPORATE DOMINATION
Monopoly: the power of one
Where a single company dominates a market, its activities and strategies can
determine the prices and products on offer. A lack of competition presents
opportunities for companies to set prices that enable them to extract returns over
and above real value and productivity. It is unusual to find a pure monopoly,
where a single entity controls 100 percent of the market, but there are many
examples of companies with monopoly power, where they have a market share of
more than 25 percent. Examples include household names such as Google,
which has 69 percent of the global Internet search engine market and in 2014
reported profits of $4bn. Google not only defines how the Internet is used but also
has a major influence on data protection laws around the world.180 Other
monopoly companies are less in the public eye but nevertheless have a
significant impact on people’s lives. Some 80 percent of the corn harvested in the
US is genetically engineered by Monsanto, a company that also dominates the
global research agenda for genetically modified (GM) crops and their safety
standards.181 These corporate behemoths not only have the power to set prices to
maximize their profits, with little threat of competition, but they also influence the
politics of these markets, which has a much further-reaching impact on societies.

29
The alcohol industry has witnessed huge market concentration since the late
1970s. Between 1979 and 2006, the 10 largest beer producers more than
doubled their share of the global market, from 28 percent to 70 percent.182 The
Belgium-based Anheuser-Busch InBev (AB InBev) is the world’s largest brewing
company, and sells over 200 different brands of beer across Europe, Asia and
America. Not only does the company dominate the market – it has a powerful
political voice too. It spent $3.7m lobbying the US government in 2014, and 56 of
the 141 lobbying reports it filed were on issues relating to taxation.183 AB InBev
has used its influence to deliberately target legislation designed in the public
interest, for example establishing voluntary advertising standards to avoid
limitations on advertising to young people.184 In Brazil before the 2014 World Cup,
the company was involved with FIFA in pressuring the government to change a
law banning the consumption of alcohol at football matches, so that its products
could be sold.185 Small retailers also pay a price for corporate dominance. In the
US, the Justice Department is currently probing allegations that AB InBev is
curbing competition by buying up distributors, making it harder for micro-
breweries to get their products onto store shelves.186
Last year AB InBev made a bid to consolidate its hold on the market even further
by proposing to acquire SAB Miller, the second biggest company in the global
beer market (and the largest in Africa). If the deal goes through, the merged
company will have combined sales of $73bn and will further boost the collective
fortune of the three founders of AB InBev, which stood at $49bn in 2015. Brazilian
businessman Marcel Hermann Telles owes much of his wealth to his controlling
shares in the company, which he owns through private equity firm 3G Capital,
together with fellow billionaires and long-time partners Carlos Sicupira and Jorge
Paulo Lemann.187
However, market dominance does not necessarily have to result in exploitation
and political interference. The Japanese group YKK, for instance, has a 45
percent share of the global market for zippers, and 132 subsidies in 62 countries.
It has spent no money on lobbying in the US in recent years and its activities
have been influenced strongly by its corporate ethics and company structure,
which delivers value back to its employees rather than to shareholders.
Intellectual property owners: to have and to hold
Intellectual property rights (IPR), including patents, trademarks and copyright
privileges, are designed to incentivize innovation by striking a balance between
the interests of innovators and the wider public interest. These rights are issued
at a national level, but the standards of IPR are decided at the global level.
Membership of the World Trade Organization (WTO) automatically means that
countries are signatories to the Trade-Related Aspects of Intellectual Property
Rights (TRIPS) agreement, which sets standards for all WTO member countries
regardless of their individual health and development levels and needs.
Applications for international IPR continue to grow in number, with 2.57m patent
applications filed worldwide in 2013, a 9 percent increase compared with 2012.188
The vast majority of these applications – 96 percent – are from businesses in
high- or upper-middle-income countries, and more than 800 were filed with the
China office of the World Intellectual Property Organization alone.189
Intellectual property, especially patents, is strongly guarded by the
pharmaceutical industry, one of the most profitable industries on the planet and

30
one that has helped more than 90 individuals become billionaires.190 191 As new
medicines can be time-consuming and expensive to develop, pharmaceutical
companies consider IPR as almost the only incentive for them to invest in
research and development (R&D). IPR prevent other companies from producing
the same drugs, effectively giving the IP holder a monopoly and hence the ability
to dictate prices – in practice, determining who can access a medicine and who
cannot. By creating a monopoly, IPR also create incentives for ‘Big Pharma’ to
maximize its profits by charging inflated prices, at the expense of sick and
vulnerable people. While IPR are supposed to stimulate innovation, in reality the
system is driven by commercial interests and not by public health.
A flagrant example of this occurred in September 2015 when the price of
Daraprim (pyrimethamine), a 62-year-old medicine used to treat the life-
threatening parasitic infection toxoplasmosis, increased overnight from $13.50 to
$750 per tablet. This followed the purchase of US marketing rights to this
essential medicine by Turing Pharmaceuticals, a company run by a former hedge
fund manager, who spotted the potential for bigger profits by having exclusive
rights over its production. Actavis,192 another pharma company, makes no claims
to invest in R&D and has been established solely to extract profits from the
market.193 This enterprise has so far yielded enormous returns for investors, with
share prices increasing by 350 percent in just over two years.194 In fact, Big
Pharma has been found to be doing less and less high-risk R&D. In the US,
roughly 75 percent of so-called new molecular entities with priority rating (the
most innovative drugs) trace their existence to public funding rather than to Big
Pharma.195 These companies also spend more on marketing then they do on
R&D.196
Pharma companies are well known for their intense and successful lobbying of
policy makers. In 2014 they spent more than $228m in Washington alone.197 In
particular, their lobbying efforts include attempts to extend IPR, both in the
duration of market exclusivity and by widening the scope of IP rules; this is often
in the form of direct pressure, such as US pressure on India to change its IP
rules, or is enshrined in the provisions of free trade agreements (FTAs).198
Companies also frequently lobby against decisions made by governments in the
interests of citizens’ health. When Thailand introduced compulsory licensing for a
number of key medicines in 2006199 – a legal provision in TRIPS that allows
governments flexibility to offer licences to companies to produce medicines locally
or import inexpensive generic versions without the permission of the international
patent holder – pharma companies put intense pressure on the country to revoke
the decision. Influenced by their campaign, the Office of the US Trade
Representative (USTR) put Thailand on the Special 301 list of countries that
could be liable for trade sanctions,200 and the European Commission pressed the
Thai government to reverse its decision.201 Another pharmaceutical company, Eli
Lilly, has taken the Canadian government to court over its move to make drugs
more affordable.202
Pharmaceutical companies are of critical importance to global health, but their
financial strength also gives them undue influence over policies even beyond
access to medicines. Pfizer has regularly lobbied the US government on tax cuts,
claiming that the corporation tax rate in the US makes it uncompetitive with its
rivals. Pfizer has not persuaded the government to reduce the rate, but instead it
plans to shift profits to a jurisdiction with a lower tax rate by acquiring another
company overseas.203 Its recent announcement of a merger with Ireland-based
31
Allergan is an example of tax avoidance by pharmaceutical companies. Pfizer is
the biggest partner, but it is presenting the deal as a takeover by the Irish
company, and therefore tax will be paid based on the much lower rate of
corporation tax in Ireland.204
In India, however, patient groups, other civil society organizations and the
government have challenged the influence of Big Pharma, prioritizing access to
medicines for citizens. For example, the drug Onbrez (indacaterol) could help many
of the estimated 30 million Indians suffering from chronic obstructive pulmonary
disorder (COPD).205 Patient advocacy groups claim that Novartis, the Swiss
company that owns the rights to the drug, has imported only small quantities into
India. To meet demand Cipla, an Indian multinational based in Mumbai, began
making its own version of Onbrez and selling it for just a fraction of the price of the
original.206 Another Indian company, Natco, has been selling the drug Nexavar
(sorafenib), which is used to treat liver and kidney cancers, for just $173 a month
compared with the $5,500 charged by the German company Bayer.207 Bayer went
to India’s Supreme Court to object to the compulsory licence offered to Natco, but
its appeal was rejected in favour of developing the generic drug.
PEOPLE WITH WEALTH, POWER AND CONNECTIONS
Leaders and inventors, investors and owners help drive forward innovation and
organizations. People at the top of companies have immense responsibilities and
for that they should be duly rewarded, as should those with particular skills and
experience, inventors of products and technologies that we all benefit from and
the risk-takers who make investments that facilitate progress.
At the same time, however, the economic rewards accruing to some individuals
are so staggering that it is hard to argue that their income and wealth are a fair
reflection of their productivity and value-added. In 2015, 62 individuals have
collective wealth equal to that of 3.6 billion other people on the planet, and they
have seen their collective wealth increase by half a billion dollars in the past five
years. Oxfam calculated last year that the average rate of return for billionaires
was 5.3 percent, meaning that the richest people made more than $5m every day
from interest payments alone.208 In the UK, pay packages for FTSE 350 directors
increased by more than 250 percent between 2000 and 2013, roughly five times
as rapidly as returns to shareholders. The High Pay Centre has found a negligible
link between incentive payments to executives and shareholder returns in the UK,
more evidence that individual rewards are being delinked from value addition.209
The extremely rich are doing very well. By 2018 it is projected that there will be
more than 18 million millionaires worldwide, who will control about $76 trillion in
personal financial assets. This is 49 percent above current levels and more than
double the post-crisis trough; emerging markets will represent roughly 42 percent
of global millionaire wealth.210
Smart wealth management and the financial infrastructure that facilitates it can
also help the very wealthy to increase their economic returns, in a way that is
clearly delinked from any productive activity and from which ordinary people,
particularly the poorest, are excluded. Wealth management is a growing sector,
and can include moving funds to low-tax and secrecy jurisdictions. By actively
seeking to avoid tax, rather than adding value to society, this imposes a direct
cost, reducing the revenues that governments need to pay for public services.
32
The scale of such activity is hard to calculate, given its opacity and in some cases
its illicit nature, but it is estimated that 8 percent of individual financial wealth sits
offshore, a total of $7.6 trillion. If tax were paid on the income that this wealth
generates, an extra $190bn would be available to governments every year. It is
estimated that as much as 30 percent of all African financial wealth is held
offshore,211 costing an estimated $14bn in lost tax revenues every year. This
same amount of money could provide healthcare for mothers and children that
would save the lives of four million children a year212 and employ enough
teachers to get every African child into school.213 Tax revenue lost in Africa, Asia
and Latin America combined due to the amount of wealth sitting in tax havens
amounts to an estimated $70bn each year.
The tightening of regulations around the use of tax havens and the
implementation of transparency requirements are already being recognized as
‘challenges’ for wealth managers.214 However, far more work needs to be done on
closing loopholes that allow the rich to cheat the system and to enable
progressive tax systems to effectively raise money from those who can most
afford to pay, to ensure that all citizens have access to the basic public services
they need.
Personal connections can also be important for maintaining and increasing the
economic power of individuals. The people who individuals know and have
access to can help them land their next job, or with securing a contract or other
advantageous positions for them and their firms. There is much evidence of the
‘revolving door’, where individuals have overlapping responsibilities within
companies, government regulatory authorities and other entities, or move
between these organizations in order to secure an advantage. In boardrooms,
CEOs deliberately pad their boards of directors with other CEOs, who are all
eager to hike each other’s pay. They hire from the same pool of consultants who
advise on pay structures, and who then tell all of their boards that each of them
deserves to be paid more.215 CEOs can also strategically time the release of
corporate good news to coincide with months in which their equity shares can be
withdrawn.
It is of course possible for organizations to share economic returns more evenly.
This is more likely where strong labour unions are present.216 Fairer distributions
are not just in the interests of the workers in an organization but also benefit
owners, as the degree to which employees feel engaged has a substantial impact
on workplace productivity.217 Collective action in vegetable markets in Tanzania,
for example, not only empowers the mostly female labourers and improves their
economic returns. It also delivers benefits to the welfare of their families and
communities.218 Instead of top-down hierarchies and profit-driven enterprises,
producer organizations and cooperatives which are owned and controlled by
members219 offer an alternative model for doing business which can distribute
returns more fairly, reducing economic and gender inequalities and poverty.220
33
3 FROM EXCLUSIVE ECONOMIES TO INCLUSION AND FAIRNESS
This paper finds that the global economy has been growing, but as incomes and
wealth have become detached from productivity and real added value in
societies, people who work hard but who are not in positions of economic and
political power have lost out. The share of income going to labour compared with
capital is in decline, the gap between wages and productivity is growing and
income inequality is slowing overall growth, further hurting the poorest people
most and preventing millions of people from escaping poverty.
What is needed is a multi-pronged strategy to rebalance power within global and
national economies, empowering people who are currently excluded and keeping
the influence of the rich and powerful in check. This is necessary for economies
to work better in the interests of the majority and in particular in the interests of
the poorest people, who have the most to gain from a fairer distribution of income
and wealth. Governments in particular must work for citizens, representing the will
of the people rather than the interests of big business, and must tackle extreme
inequality. This goes hand in hand with effective governance. The public interest
should be the guiding principle of all global agreements and national policies and
strategies.
To achieve this, Oxfam makes the following recommendations.
• Pay workers a living wage and close the gap with executive rewards:
Corporations are earning record profits worldwide and executive rewards are
skyrocketing, while too many people are without a living wage and decent
working conditions. Specific commitments must include: increasing minimum
wages towards living wages; transparency on pay ratios; and protection of
worker’s rights to unionize and strike.
• Promote women’s economic equality and women’s rights: Economic
policy must tackle economic inequality and gender discrimination together.
Specific commitments must include: compensation for unpaid care; an end to
the gender pay gap; equal inheritance and land rights for women; and data
collection to assess how women and girls are affected by economic policy.
• Keep the influence of powerful elites in check: Work hard to ensure that
policy-making processes become less prone to capture by vested interests
and more democratic. Specific commitments must include: mandatory public
lobby registries and stronger rules on conflicts of interest; ensuring that good-
quality information on administrative and budget processes is made public,
and is free and easily accessible; reform of the regulatory environment,
particularly around transparency in government; separating business from
campaign financing; and cooling periods to close revolving doors between big
business and government.
• Change the global system for R&D and the pricing of medicines so that
everyone has access to appropriate and affordable medicines: Relying on
intellectual property as the only stimulus for R&D gives big pharmaceutical
companies a monopoly on the making and pricing of medicines. This increases
the gap between rich and poor and puts lives on the line. Specific
commitments must include: a new global R&D treaty; increased investment in
34
medicines, including in affordable generics; and excluding intellectual property
rules from trade agreements. Pharma tries to justify high prices by the cost of
R&D, ignoring the fact that initial research and even some clinical trials are
usually funded by the public purse. Financing for R&D must be delinked from
the pricing of medicines in order to break the companies’ monopoly, and
proper financing of R&D for needed therapies must be ensured, as must the
affordability of the resulting products.
• Share the tax burden fairly to level the playing field: Too much wealth is
concentrated in the hands of the few. The tax burden is falling on ordinary
people, while the richest companies and individuals pay too little. Governments
must act together to correct this imbalance. Specific commitments must
include: shifting the tax burden away from labour and consumption and
towards wealth, capital and income from these assets; transparency on tax
incentives; and national wealth taxes.
• Use progressive public spending to tackle inequality: Prioritize policies,
practice and spending that increase financing for free public health and
education to fight poverty and inequality at the national level. Refrain from
implementing unproven and unworkable market reforms to public health and
education systems, and expand public sector rather than private sector
delivery of essential services.
As a priority, Oxfam is calling on world leaders to agree a global approach
to end the era of tax havens.
This paper has examined how the wealthy and powerful have used economic
systems and structures to their benefit, to the exclusion of others. This is most
apparent in tax systems, where companies and individuals actively seek to
reduce their tax burden through the use of complex accounting mechanisms and
international loopholes. This increases their profits, channelling returns to
shareholders as opposed to society in general; societies need tax revenues to
fund essential public services and infrastructure, on which these companies and
individuals also depend. The existence of tax havens in particular allows income
and wealth to flow offshore, untaxed and in secret – a legal means created for the
rich to stay rich and to prevent essential redistribution that would reduce
inequality and benefit society overall. Tax havens are an injustice that
undermines the progressive principles upon which most tax systems are based.
Until the rules are changed and there is fairer global governance of tax matters,
tax dodging will continue to drain public budgets and undermine the ability of
governments to tackle inequality. To change this requires global coordination.
All governments need to commit to a second generation of tax reforms to
effectively put an end to harmful corporate tax practices in a way that benefits all
countries. Specific measures should include:
• An effective approach to tackling corporate tax havens and harmful tax
regimes, including non-preferential regimes, and putting an end to the race to
the bottom in general corporate taxation. Such an approach requires all
countries – including developing countries – to be involved on an equal footing.
Ultimately, truly global cooperation will require the establishment of a global
tax body under the auspices of the United Nations as the only legitimate
representative global institution.
• Addressing the race to the bottom and the role of unproductive tax incentives
35
in harmful tax competition through greater transparency of the incentives
provided to multinational companies (including tax exemptions and holidays,
corporate income tax, withholding tax, VAT and customs duties). Cost–benefit
analysis should be conducted to measure the social impact needs which
should be agreed prior to decisions. The investment climate can often be
improved through more effective measures than tax incentives.
• Promote worldwide tax transparency by requiring multinational companies to
make country-by-country reports publicly available for each country in which
they operate, including a breakdown of their employees, physical assets,
sales, profits and taxes (due and paid), so that there can be an accurate
assessment of whether they are paying their fair share of taxes.
To end the era of secrecy jurisdictions for financial assets, governments should
ensure:
• The establishment of public registers of the beneficial owners of all companies,
foundations and trusts;
• The implementation of a multilateral system for exchanging tax information on
an automatic basis, which would include developing countries with non-
reciprocal commitments (i.e. no obligation to send information until they have
established the capacity to do so).

36
NOTES
1 Credit Suisse (2015) ‘Global Wealth Databook 2015’. Total net wealth at constant exchange rate (USD billion). http://publications.credit-suisse.com/tasks/render/file/index.cfm?fileid=C26E3824-E868-56E0-CCA04D4BB9B9ADD5
2 Source: Oxfam calculations based on Lakner-Milanovic World Panel Income Distribution (LM-WPID) database (2013). See Figure 1.
3 G. Zucman (2014) ‘Taxing Across Borders: Tracking Personal Wealth and Corporate Profits’, Journal of Economic Perspectives. http://gabriel-zucman.eu/files/Zucman2014JEP.pdf
4 Source: Oxfam calculations, see Figure 3.
5 C. Gonzales, S. Jain-Chandra, K. Kochhar, M. Newiak and T. Zeinullayev (2015) ‘Catalyst for Change: Empowering Women and Tackling Income Inequality’. IMF. http://www.imf.org/external/pubs/ft/sdn/2015/sdn1520.pdf
6 T. Gore (2015) ‘Extreme Carbon Inequality: Why the Paris climate deal must put the poorest, lowest emitting and most vulnerable people first’, Oxfam, http://oxf.am/Ze4e
7 M. Cohn (2013) ‘Tax Avoidance Seen as a Human Rights Violation’, Accounting Today. http://www.accountingtoday.com/news/Tax-Avoidance-Human-Rights-Violation-68312-1.html
8 OECD (2012) ‘OECD Employment Outlook 2012’, OECD Publishing. Chapter 3, ‘Labour losing to capital: what explains the declining labour share?’. http://www.oecd.org/els/employmentoutlook-previouseditions.htm
9 Calculations in this paragraph are from Oxfam analysis based on the World Bank, World Development Indicators (2015). http://databank.worldbank.org. Figure for 2014 in current USD; comparisons over time in constant 2005 USD.
10 Oxfam analysis based on the World Bank, World Development Indicators (2015). GDP growth (annual percentage). http://databank.worldbank.org
11 C. Lakner and B. Milanovic (2013) ‘Global Income Distribution: From the Fall of the Berlin Wall to the Great Recession’, World Bank Policy Research Working Paper (6719). http://www-wds.worldbank.org/servlet/WDSContentServer/WDSP/IB/2013/12/11/000158349_20131211100152/Rendered/PDF/WPS6719.pdf
12 World Bank Group (2015) ‘Global Monitoring Report 2014/2015: Ending Poverty and Sharing Prosperity’, Washington, DC: World Bank. http://www.worldbank.org/content/dam/Worldbank/gmr/gmr2014/GMR_2014_Full_Report.pdf
13 Ibid.
14 United Nations Sustainable Development Knowledge Platform. ‘End poverty in all its forms everywhere’. https://sustainabledevelopment.un.org/?menu=1300
15 The actual value of wealth in 2000 was $117 trillion, approximately $160 trillion in 2015 prices.
16 Credit Suisse (2015) ‘Global Wealth Databook 2015’, op. cit.
17 Ibid.
18 Calculations in this paragraph are from Oxfam analysis based on the Lakner-Milanovic World Panel Income Distribution (LM-WPID) database (2013). https://www.gc.cuny.edu/Page-Elements/Academics-Research-Centers-Initiatives/Centers-and-Institutes/Luxembourg-Income-Study-Center/Branko-Milanovic,-Senior-Scholar/Datasets. Created for C. Lakner and B. Milanovic (2013) ‘Global Income Distribution’, op. cit. Source for 2011 data: personal correspondence with B. Milanovic, September 2015.
19 While the global Gini index shows a modest decline in recent years, there is evidence that this decline could be partly or entirely due to the underestimation of top incomes in national income distributions. See C. Lakner and B. Milanovic (2013) ‘Global Income Distribution: From the Fall of the Berlin Wall to the Great Recession’, op. cit.
20 C. Hoy and E. Samman (2015) ‘What if Growth had been as Good for the Poor as Everyone Else?’, London: Overseas Development Institute (ODI). http://www.odi.org/sites/odi.org.uk/files/odi-assets/publications-opinion-files/9655.pdf
21 Ibid.
22 The extreme poverty line represents the dollar income required to pay for essentials for sustenance and survival, based on poverty lines in 15 developing countries. The extreme poverty line was updated in 2015 to $1.90 per person per day, in 2011 purchasing power parity (PPP) USD. This is an update from the $1.25 extreme poverty line, which was based on 2005 prices.
23 M. Cruz, J. Foster, B. Quillin and P. Schellekens (2015) ‘Ending Extreme Poverty and Sharing Prosperity: Progress and Policies’, Policy Research Note PRN/15/03, World Bank Group. http://pubdocs.worldbank.org/pubdocs/publicdoc/2015/10/109701443800596288/PRN03-Oct2015-TwinGoals.pdf
24 C. Lakner, M. Negre and E.B. Prydz (2014) ‘Twinning the Goals: How Can Promoting Shared Prosperity Help to Reduce Global Poverty?’, World Bank Policy Research Working Paper (7106). http://www-wds.worldbank.org/external/default/WDSContentServer/WDSP/IB/2014/11/13/000158349_20141113090851/Rendered/PDF/WPS7106.pdf
25 E. Dabla-Norris, K. Kochhar, F. Ricka, N. Suphaphiphat and E. Tsounta (2015) ‘Causes and Consequences of Income Inequality: A Global Perspective’. International Monetary Fund. http://www.imf.org/external/pubs/ft/sdn/2015/sdn1513.pdf

37
26 United Nations (2015) ‘Goal 10: Reduce inequality within and among countries’. http://www.un.org/sustainabledevelopment/inequality/
27 C. Hoy (2015) ‘Leaving No One Behind: The Impact of Pro-Poor Growth’, London: ODI. http://www.odi.org/sites/odi.org.uk/files/odi-assets/publications-opinion-files/9919.pdf
28 In 1988 the richest 10% of people in Brazil had a total income which was $166bn more than the total income of the poorest 50%. Between 1988 and 2011 the richest 10% saw their income increase from $218bl to $412bl (89%) and the poorest 50% saw their incomes increase much faster, from $51bil to $164bl (220%). Despite this faster growth, the absolute gap between the poorest 50% and the richest 10% who earned $412bn, had increased to $248bn (all values in 2005 PPP).
29 This estimate is likely to be conservative. See accompanying methodology note, available at http://oxf.am/ZniS.
30 D. Hardoon (2015) ‘Wealth: Having it all and wanting more’, Oxford: Oxfam. https://www.oxfam.org/sites/www.oxfam.org/files/file_attachments/ib-wealth-having-all-wanting-more-190115-en.pdf
31 The total wealth of the top 1% in 2015 was $125 trillion, approximately $1.7m for each of the 72 million people in the top 1%. The total wealth of the bottom 90% was $31 trillion, approximately $5,000 for each of the 648 million people in this group. Oxfam calculation based on Credit Suisse (2015) ‘Global Wealth Databook 2015’. http://publications.credit-suisse.com/tasks/render/file/index.cfm?fileid=C26E3824-E868-56E0-CCA04D4BB9B9ADD5
32 The total wealth of the bottom 50% in 2010 was $2.6 trillion, approximately $2.8 trillion in 2015 prices. The total wealth of the bottom 50% in 2015 was $1.7 trillion. Data from Credit Suisse Global Wealth Databook 2014 and 2015.
33 Oxfam recalculation of a statistic originally presented in R. Fuentes-Nieva and N. Galasso (2014) ‘Working for the Few; Political capture and economic inequality’, Oxford: Oxfam. https://www.oxfam.org/en/research/working-few
34 C. Gonzales, S. Jain-Chandra, K. Kochhar, M. Newiak and T. Zeinullayev (2015) ‘Catalyst for Change: Empowering Women and Tackling Income Inequality’. IMF. http://www.imf.org/external/pubs/ft/sdn/2015/sdn1520.pdf
35 R. Wilkinson and K. Pickett (2010) The Spirit Level: Why Equality is Better for Everyone, London: Penguin, p.59.
36 UN Women (2015) ‘Progress of the World’s Women 2015–16: Transforming Economies, Realizing Rights’. http://progress.unwomen.org/en/2015/pdf/UNW_progressreport.pdf
37 Forbes (2015) ‘The World’s Billionaires’. http://www.forbes.com/billionaires/list/#version:static, filtered by ‘Women’: http://www.forbes.com/billionaires/list/ - version:static_tab:women
38 United Nations Statistics Division (2015) ‘The World’s Women 2015: At a Glance’, New York: UN DESA. http://unstats.un.org/unsd/gender/docs/WW2015 at a Glance.pdf
39 D. Ukhova (2015) ‘Gender inequality and inter-household economic inequality in emerging economies: exploring the relationship’, Gender & Development, 23:2, 241–59. http://www.tandfonline.com/doi/abs/10.1080/13552074.2015.1055082
40 OECD (2012) ‘OECD Employment Outlook 2012’, OECD Publishing. Chapter 3, ‘Labour losing to capital: what explains the declining labour share?’. op. cit.
41 C. Lakner, M. Negre, E.B. Prydz (2014) ‘Twinning the Goals: How Can Promoting Shared Prosperity Help to Reduce Global Poverty?’, op. cit.
42 E. Dabla-Norris, K. Kochhar, F. Ricka, N. Suphaphiphat and E. Tsounta (2015) ‘Causes and Consequences of Income Inequality: A Global Perspective’, op. cit.
43 United Nations (2015) ‘Adoption of the Paris Agreement’. http://unfccc.int/resource/docs/2015/cop21/eng/l09.pdf
44 T. Gore (2015) ‘Extreme Carbon Inequality’, op. cit.
45 L. Karabarbounis and B. Neiman (2013) ‘The Global Decline of the Labor Share’. http://isites.harvard.edu/fs/docs/icb.topic1259555.files/Papers%20Spring%202014/NEIMAN%20Brent%20March%202014.pdf. Published as L. Karabarbounis and B. Neiman (2013) ‘The global decline of the labor share’, The Quarterly Journal of Economics (2014), 61-103, Oxford University Press.
46 T. Piketty (2014) Capital in the Twenty-First Century, Cambridge: Harvard University Press.
47 OECD (2012) ‘OECD Employment Outlook 2012’, Chapter 3, op. cit.
48 I. van Staveren and R. van der Hoeven (2012) ‘Global Trends in Labour Market Inequalities, Exclusion, Insecurity and Civic Activism. Background paper for the Democratic Governance Report by UNDP’, Institute of Social Studies. http://www.indsocdev.org/resources/UNDP_DGR_backgroundpaper.pdf
49 Ibid.
50 Oxfam calculation based on data from R.C. Feenstra, R. Inklaar and M.P. Timmer (2015) ‘The Next Generation of the Penn World Table’, forthcoming American Economic Review, available for download at: http://www.ggdc.net/pwt
51 OECD (2012) ‘OECD Employment Outlook 2012’, Chapter 3, op. cit.
52 J. Bivens and L. Mishel (2015) ‘Understanding the Historic Divergence between Productivity and a Typical Worker’s Pay: Why It Matters and Why It’s Real’, Washington DC: Economic Policy Institute. http://www.epi.org/publication/understanding-the-historic-divergence-between-productivity-and-a-typical-workers-pay-why-it-matters-and-why-its-real/

38
53 Data from Statistical Office of the European Union (2013). Luxembourg: Eurostat. http://ec.europa.eu/eurostat/tgm/table.do?tab=table&init=1&language=en&pcode=tesov110&plugin=1
54 R. Wilshaw, S. Hamilton, J. Théroux-Séguin and D. Gardener (2015) ‘In Work But Trapped in Poverty: A summary of five studies conducted by Oxfam, with updates on progress along the road to a living wage’. Oxford: Oxfam. http://policy-practice.oxfam.org.uk/publications/in-work-but-trapped-in-poverty-a-summary-of-five-studies-conducted-by-oxfam-wit-578815
55 Ibid.
56 Ibid.
57 United Nations Statistics Division (2015) ‘The World’s Women 2015: At a Glance’, op. cit.
58 McKinsey & Company (2015) ‘The Power of Parity: How Advancing Women’s Equality Can Add $12 Trillion to Global Growth’. http://www.mckinsey.com/insights/growth/how_advancing_womens_equality_can_add_12_trillion_to_global_growth
59 UN Women (2015) ‘Progress of the World’s Women 2015–2016’, op. cit.
60 P. Telles (2013) ‘Brazil: Poverty and Inequality. Where to next?’, Oxfam. http://csnbricsam.org/brazil-poverty-andinequality-where-to-next
61 UN Women (2015) ‘Progress of the World’s Women 2015–2016’, op. cit. Chapter 2: ‘Transforming work for women’s rights’. http://progress.unwomen.org/en/2015/pdf/ch2.pdf
62 International Labour Organization (ILO) (2015) ‘World Employment and Social Outlook: Trends 2015’. Geneva: International Labour Office. http://www.ilo.org/wcmsp5/groups/public/---dgreports/---dcomm/---publ/documents/publication/wcms_337069.pdf
63 UN Women (2015) ‘Progress of the World’s Women 2015–2016’, op. cit.
64 C. Canelas (2014) ‘Minimum Wage and Informality in Ecuador’, United Nations University. https://www.wider.unu.edu/sites/default/files/wp2014-006.pdf
65 Play Fair, ‘Workers’ Rights: Freedom of Association Protocol’. http://www.play-fair.org/media/index.php/workers-rights/foa-protocol/
66 IndustriALL (2015) ‘Industry bargaining for living wages’. http://www.industriall-union.org/industry-bargaining-for-living-wages
67 R. Wilshaw et al. (2015) ‘In Work But Trapped in Poverty’, op. cit. pp.9–12.
68 Living Wage Foundation, ‘Living wage employers’. http://www.livingwage.org.uk/employers
69 ILO ‘Global Wage Report 2014/15: Wages and Income Inequality’. http://www.ilo.org/wcmsp5/groups/public/@dgreports/@dcomm/@publ/documents/publication/wcms_324678.pdf
70 J. Page (2015) ‘What President Obama didn’t see on his trip to Africa’. Brookings, Africa in Focus. http://www.brookings.edu/blogs/africa-in-focus/posts/2015/07/28-obama-africa-page?rssid=Africa+in+Focus
71 Ibid.
72 ILO (2015) ‘World Employment and Social Outlook: Trends 2015’, op. cit.
73 Ibid.
74 OECD (2012) ‘OECD Employment Outlook 2012’, Chapter 3, ‘op. cit.
75 L. Mishel and A. Davis (2015) ‘Top CEOs Make 300 Times More than Typical Workers: Pay Growth Surpasses Stock Gains and Wage Growth of Top 0.1 Percent’. Economic Policy Institute (EPI) Issue Brief #399. Washington DC: EPI. http://s3.epi.org/files/2015/top-ceos-make-300-times-more-than-typical-workers.pdf
76 Catalyst (2015) ‘Women CEOs of the S&P 500’. http://www.catalyst.org/knowledge/women-ceos-sp-500
77 L. Mishel and A. Davis (2015) ‘Top CEOs Make 300 Times More than Typical Workers’, op. cit.
78 L. Bebchuk and J. Fried (2004) ‘Pay Without Performance: The Unfulfilled Promise of Executive Compensation’.
79 T. Piketty, E. Saez and S. Stantcheva (2014) ‘Optimal taxation of top labour incomes: A tale of three elasticities’, American Economic Journal. http://www.ucl.ac.uk/~uctp39a/PikettySaezStantchevaAEJ2014.pdf
80 Economic Policy Institute analysis of data from Compustat's ExecuComp database, Federal Reserve Economic Data (FRED) from the Federal Reserve Bank of St. Louis, the Current Employment Statistics programme, and the Bureau of Economic Analysis NIPA tables, as cited in L. Mishel and A. Davis (2015) ‘Top CEOs Make 300 Times More than Typical Workers’, op. cit. Includes the value of stock options exercised in a given year plus salary, bonuses, restricted stock grants and long-term incentive pay-outs for chief executives of the top 350 US firms.
81 PWC (2013) ‘Companies Act, 2013: Key highlights and analysis’. https://www.pwc.in/assets/pdfs/publications/2013/companies-act-2013-key-highlights-and-analysis.pdf
82 M. Karnik (2015) ‘Some Indian CEOs make more than 400 times what their employees are paid’. Quartz, India. http://qz.com/445350/heres-how-much-indian-ceos-make-compared-to-the-median-employee-salary/
83 R. Costanza, M. Hart, S. Posner and J. Talberth (2009) ‘Beyond GDP: The Need for New Measures of Progress’, Boston University. http://www.bu.edu/pardee/files/documents/PP-004-GDP.pdf
84 A. Smith (1776) The Wealth of Nations.

39
85 J. Stiglitz (2008) The Washington Consensus Reconsidered: Towards a New Global Governance. Oxford: Oxford University Press. http://intldept.uoregon.edu/wp-content/uploads/2015/03/Yarris-Joya-5.1.15-Brown-Bag-Article.pdf
86 Ibid.
87 R. Assaad and M. Arntz (2005) ‘Constrained geographical mobility and gendered labour market outcomes under structural adjustment: evidence from Egypt’, World Development, 33 (2005): 3, pp.431–54.
88 Based on a comparison of salaries of UK-based CEOs and salaries of garment workers in Bangladesh. Blog by Rachel Wilshaw (10 December 2014) ‘What would it take to deliver a living wage in global supply chains?’ http://policy-practice.oxfam.org.uk/blog/2014/12/how-companies-can-deliver-living-wages-in-global-supply-chains
89 High Pay Centre (2015) ‘Executive pay continues to climb at expense of ordinary workers’. http://highpaycentre.org/pubs/new-high-pay-centre-report-executive-pay-continues-to-climb-at-expense-of-o
90 R. Solow (2015) ‘The Future of Work: Why Wages Aren't Keeping Up’, Pacific Standard. http://www.psmag.com/business-economics/the-future-of-work-why-wages-arent-keeping-up
91 The Economist (2014) ‘The countries where politically connected businessmen are most likely to prosper’. http://www.economist.com/news/international/21599041-countries-where-politically-connected-businessmen-are-most-likely-prosper-planet
92 Ibid.
93 D. Jacobs (2015) ‘Extreme Wealth is Not Merited’, Oxfam Discussion Paper. https://www.oxfam.org/en/research/extreme-wealth-not-merited
94 M. Walton and A. Gandhi (2014) ‘Where Do India’s Billionaires Get Their Wealth?’, Economic & Political Weekly, Vol. 47. No. 40. http://www.michaelwalton.info/wp-content/uploads/2012/10/Where-Do-Indias-Billionaires-Get-Their-Wealth-Aditi-Walton.pdf
95 G. Esquivel Hernandez (2015) ‘Extreme inequality in Mexico: Concentration of economic and political power’, Oxfam Mexico. http://cambialasreglas.org/images/inequality.pdf
96 Ibid.
97 R. Fuentes-Nieva and N. Galasso (2014) ‘Working for the Few’, op. cit.
98 Cycle described as an institutional framework in D. Acemoglu and J. Robinson (2014) ‘The Rise and Decline of General Laws of Capitalism’. http://economics.mit.edu/files/10422
99 F. Jaumotte and C. Osorio Buitron (2015) ‘Inequality and Labor Market Institutions’, IMF Staff Discussion Note. http://www.imf.org/external/pubs/ft/sdn/2015/sdn1514.pdf
100 N. Lustig, C. Pessino and J. Scott (2013) ‘The Impact of Taxes and Social Spending on Inequality and Poverty in Argentina, Bolivia, Brazil, Mexico, Peru and Uruguay: An Overview’, Commitment to Equity. http://www.commitmentoequity.org/publications_files/CEQWPNo13%20Lustig%20et%20al.%20Overview%20Arg,Bol,Bra,Mex,Per,Ury%20April%202013.pdf
101 J. Martinez-Vazquez, V. Vulovic and B. Moreno Dodson (2014) ‘The Impact of Tax and Expenditure Policies on Income Distribution: Evidence from a Large Panel of Countries’. http://scholarworks.gsu.edu/cgi/viewcontent.cgi?article=1036&context=econ_facpub
102 Tax havens are jurisdictions or territories which have intentionally adopted fiscal and legal frameworks allowing non-residents (physical persons or legal entities) to minimize the amount of taxes they should pay where they perform a substantial economic activity. They usually fulfil several of the following criteria (to be applied in a combined way): (i) they grant fiscal advantages to non-resident individuals or legal entities only, without requiring that substantial economic activity be made in the country or dependency; (ii) they provide a significantly lower effective level of taxation, including zero taxation for natural or legal persons; (iii) they have adopted laws or administrative practices that prevent the automatic exchange of information for tax purposes with other governments; or (iv) they have adopted legislative, legal or administrative provisions that allow the non-disclosure of the corporate structure of legal entities (including trusts, charities, foundations etc.) or the ownership of assets or rights.
103 F. Weyzig (2015) ‘Still Broken: Governments must do more to fix the international tax system’, Oxfam. http://policy-practice.oxfam.org.uk/publications/still-broken-governments-must-do-more-to-fix-the-international-corporate-tax-sy-581878
104 Ibid.
105 Methodology: Oxfam examined public information provided by the top 110 companies on the Forbes 2000 list
and the list of WEF strategic partners to identify whether they had a presence in tax havens. For this analysis, Oxfam checked if those companies have presence in tax havens, and more especially in any of the jurisdictions most frequently used for corporate tax avoidance, like Bermuda, Cayman Islands, BritishVirgin Islands, Luxembourg, Switzerland, Ireland, the Netherlands, Singapore, Jersey and Panama, for example (see http://policy-practice.oxfam.org.uk/publications/still-broken-governments-must-do-more-to-fix-the-international-corporate-tax-sy-581878). Note that this estimate is likely to be a significantundercount, given the lack of comprehensive public reporting requirements on corporate tax practices. Until MNCs are required to report a full list of their subsidiaries, their business activities and the taxes they pay in every jurisdiction in which they do business, it is impossible to comprehensively tally their activity in tax havens or to establish whether their presence in tax havens is justified for any reason other than tax avoidance.
106 Data from the IMF Coordinated Portfolio Investment Survey (CPIS) database.
http://data.imf.org/?sk=B981B4E3-4E58-467E-9B90-9DE0C3367363. Foreign direct investment (FDI) investments have been analysed in the following jurisdictions: Bermuda, Cayman Islands, British Virgin Islands, Luxembourg, Switzerland, Ireland, the Netherlands, Singapore, Jersey and Panama.
107 UNCTAD (2015) ‘World Investment Report 2015’. http://unctad.org/en/PublicationsLibrary/wir2015_en.pdf; and
IMF (2015) ‘Base Erosion, Profit Shifting and Developing Countries’, IMF Working Paper.

40
https://www.imf.org/external/pubs/ft/wp/2015/wp15118.pdf
108 M. Cohn (2013) ‘Tax Avoidance Seen as a Human Rights Violation’, op. cit Note 7.
109 OECD (1998) ‘Harmful Tax Competition: An emerging global issue’. Note: no jurisdiction falls under the OECD’s narrow criteria of a tax haven today. http://www.oecd.org/countries/monaco/listofunco-operativetaxhavens.htm
110 OECD ‘Base Erosion and Profit Shifting’. http://www.oecd.org/ctp/beps.htm
111 R. Murphey (2015) ‘Overall Evaluation of the G20/OECD Base Erosion and Profit Shifting (BEPS) Project’. http://www.taxresearch.org.uk/Blog/2015/10/07/overall-evaluation-of-the-g20oecd-base-erosion-and-profit-shifting-beps-project/
112 M. Lya Ramos (2012) ‘Angola’s Oil Industry Operations’, Open Society Initiative for Southern Africa (OSISA). http://www.osisa.org/sites/default/files/angola_oil_english_final_less_photos.pdf
113 A. Krozer (2015) ‘For Richer or Poorer: The capture of growth and politics in emerging economies’. http://policy-practice.oxfam.org.uk/publications/for-richer-or-poorer-the-capture-of-growth-and-politics-in-emerging-economies-578757
114 Ibid.
115 A. Bebbington and J. Bury (eds.) (2013) Subterranean Struggles: New Dynamics of Mining, Oil and Gas in Latin America. Austin: University of Texas Press.
116 E. Bast, A, Doukas, S. Pickard, L. van der Burg and S. Whitley (2015) ‘Empty Promises: G20 subsidies to oil, gas and coal production’, ODI. http://www.odi.org/sites/odi.org.uk/files/odi-assets/publications-opinion-files/9958.pdf
117 Oxfam America (2015) ‘Show Us The Money!’. http://www.oxfamamerica.org/static/media/files/Media_brief_1504_anniversary.pdf. This figure includes spending by the API and 10 of its 631 major oil company members.
118 Greenpeace, ‘Koch Industries: Secretly Funding the Climate Denial Machine’. http://www.greenpeace.org/usa/global-warming/climate-deniers/koch-industries/
119 B. McKibben (2015) ‘Exxon’s Climate Lie: ‘No Corporation Has Ever Done Anything This Big or Bad’, The Guardian. http://www.theguardian.com/environment/2015/oct/14/exxons-climate-lie-change-global-warming
120 Natural Resource Governance Institute, ‘Nigeria’. http://www.resourcegovernance.org/countries/africa/nigeria/overview
121 Shell (2015) ‘Shell in Nigeria: Portfolio’. http://s08.static-shell.com/content/dam/shell-new/local/country/nga/downloads/pdf/portfolio.pdf
122 Forbes, ‘The World’s Billionaires’. http://www.forbes.com/billionaires/list/#version:static_country:Nigeria
123 O. Akukwe (2012) ’30 Facts about Ownership of Nigeria’s Richest Oil Blocks in the Midst of National Poverty’, Africa Reporters. http://www.africareporters.com/index.php/sports/item/906-by-obinna-akukwe-30-facts-about-ownership-of-nigeria-s-richest-oil-blocks-in-the-midst-of-national-poverty
124 Most recent World Banks data (2009) find 53.5% of the Nigerian population, or 83 million people living below $1.90/day Povcalnet, 2009 data, 2011 PPP. http://povertydata.worldbank.org/poverty/country/NGA
125 Amnesty International UK (2015) ‘Shell Profits Won’t Count the True Cost of Niger Delta Oil Spills’. http://www.amnesty.org.uk/press-releases/shell-profits-wont-count-true-cost-niger-delta-oil-spills
126 Premium Times (2015) ‘Nigeria’s State-Owned Oil Company, NNPC, Opens Its Accounts to Public’. http://www.premiumtimesng.com/news/headlines/191366-transparency-nnpc-begins-monthly-publication-of-financial-operational-reports.html
127 E. Whitehead (2013) ‘Nigeria Petroleum bill still causing consternation’, FT blog , http://blogs.ft.com/beyond-brics/2013/11/21/nigeria-petroleum-bill-still-causing-consternation/
128 petroleumindustrybill.com (2105) 'Oil and Gas Industry Reforms to Commence Prior to Passage of the PIB'. http://www.petroleumindustrybill.com/
129 A. Klasa (2015) ‘Nigeria oil bill back to the drawing board’ http://www.ft.com/intl/cms/s/3/85f5b0c2-2618-11e5-9c4e-a775d2b173ca.html - axzz3iDAbvabh
130 Ibid.
131 R. Greenwood and D. Sharfstein (2013) 'The growth of finance', Journal of Economic Perspectives, http://www.people.hbs.edu/dscharfstein/Growth_of_Finance_JEP.pdf
132 Data from IMF, OECD and World Bank, summarized in S. Ross, ‘What Percentage of the Global Economy Is Comprised of the Financial Services Sector?’, Investopedia. http://www.investopedia.com/ask/answers/030515/what-percentage-global-economy-comprised-financial-services-sector.asp
133 Data from Forbes and UNCTAD. Calculations by Uwe Gnieting, Oxfam America.
134 World Bank (2014) ‘Measuring Financial Inclusion Around the World’, Global Findex Database 2014. http://www.worldbank.org/en/programs/globalfindex
135 D. Hardoon (2015) ‘Wealth: Having it all and wanting more’, op. cit.
136 T. Philippon and A. Reshef (2012), ‘Wages and Human Capital in the U.S. Finance Industry: 1909–2006’ Quarterly Journal of Economics, http://qje.oxfordjournals.org/content/127/4/1551.short
137 M. Sherman (2009) ‘A Short History of Financial Deregulation in the United States’.
41
http://www.cepr.net/documents/publications/dereg-timeline-2009-07.pdf
138 R. Sahay et al. (2015) ‘Rethinking Financial Deepening: Stability and Growth in Emerging Markets’, IMF.
139 M. Klein (2015) ‘Crush the financial sector end the great stagnation’ FT blog, http://ftalphaville.ft.com/2015/02/16/2119138/crush-the-financial-sector-end-the-great-stagnation/
140 J. Bianco (2011) ‘Financial Profits’. http://www.ritholtz.com/blog/2011/03/financial-profits/
141 T. Philippon and A. Reshef (2008) op. cit.
142 L. Bebchuck, A. Cohen and H. Spamann (2009) ‘The Wages of Failure: Executive Compensation at Bear Stearns and Lehman 2000–2008’.
143 M. Sherman (2009) ‘A Short History of Financial Deregulation in the United States’, op. cit.
144 OECD (2015) ‘How to restore a healthy financial sector that supports long-lasting, inclusive growth?’. http://www.oecd.org/eco/How-to-restore-a-healthy-financial-sector-that-supports-long-lasting-inclusive-growth.pdf
145 O. Denk and A. Cazenave-Lacroutz (2015) ‘Household Finance and Income Inequality in the Euro Area’, OECD Economics Department Working Papers. http://www.oecd-ilibrary.org/docserver/download/5js04v5wh9zs.pdf?expires=1439570720&id=id&accname=guest&checksum=7F0E011697139B9E1513E0368BF09A45
146 F.S. Mishkin (2010) ‘Over the Cliff: From the Subprime to the Global Financial Crisis’, NBER Working Paper. http://www.nber.org/papers/w16609.pdf
147 T. Cavero and K. Poinasamy (2013) ‘A Cautionary Tale: The true cost of inequality and austerity in Europe’, Oxfam. https://www.oxfam.org/en/research/cautionary-tale
148 E. Saez (2013) ‘Striking it Richer: The evolution of top incomes in the United States’. http://eml.berkeley.edu//~saez/saez-UStopincomes-2012.pdf
149 N. Shaxson and J. Christensen (2013) ‘The Finance Curse: How oversized financial centres attack democracy and corrupt economies’, Tax justice Network. http://www.taxjustice.net/cms/upload/pdf/Finance_Curse_Final.pdf
150 Global Witness (2015) ‘Banks and Dirty Money: How the financial system enables state looting at a devastating human cost‘, https://www.globalwitness.org/documents/18012/GW_Banks_Report_FINAL.pdf
151 J.S. Henry (2010) ‘Tax Offshore Wealth Sitting in First World Banks’, Forbes. http://www.forbes.com/forbes/2010/0719/opinions-taxation-tax-havens-banking-on-my-mind.html
152 OpenSecrets.org, ‘Issue Lookup’, Center for Responsive Politics. http://www.opensecrets.org/lobby/lookup.php?type=i&q=Foreign+Account+Tax+Compliance+Act
153 Bank for International Settlements (2015) ‘Why Does Financial Sector Growth Crowd Out Real Growth?’, BIS Working Papers, No 490. http://www.bis.org/publ/work490.pdf
154 R. Sahay et al. (2015) ‘Rethinking Financial Deepening’, op. cit.
155 KPMG (2015) ‘Financial Services in Africa’. https://www.kpmg.com/Africa/en/IssuesAndInsights/Articles-Publications/Documents/KPMG Financial Services in Africa.pdf
156 World Bank (2014) ‘Expanding Women’s Access to financial Services’. http://www.worldbank.org/en/results/2013/04/01/banking-on-women-extending-womens-access-to-financial-services
157 OpenSecrets.org, ‘Ranked Sectors’. https://www.opensecrets.org/lobby/top.php?showYear=2014&indexType=c
158 The Bureau of Investigative Journalism (2012) ‘Finance Lobby: Big banks and thinktanks’. https://www.thebureauinvestigates.com/2012/07/12/big-banks-and-thinktanks/
159 Transparify (2014) ‘Corporate Interests and Think Tanks – An Overview of Current Debates’. http://static1.squarespace.com/static/52e1f399e4b06a94c0cdaa41/t/534bda65e4b036f444b56ecb/1397480037210/Corporate+Interests+and+Think+Tanks+-+An+Overview+of+Current+Debates+_Transparify+2014_.pdf
160 B. Biais, J. Rochet and P. Wooley (2010) ‘Innovations, Rents and Risk’, Paul Woolley Centre Working Paper, Series No 13, Discussion Paper No 659. http://www.lse.ac.uk/fmg/researchProgrammes/paulWoolleyCentre/workingPapers/dp659PWC13.pdf
161 A. Tenbrunsel and J. Thomas (2015) ‘The Street, the Bull and the Crisis: A Survey of the UK and US Financial Services Industry’, University of Notre Dame and Labaton Sucharow LLP.
162 Ethical Performance (2015) ‘Business Ethics No Longer Just Compliance Issue, says CIMA.’ http://ethicalperformance.com/article/9148
163 J.E. Stiglitz (2012) ‘Market Failures in the Financial System’, New Vision. http://www.newvision.co.ug/news/633096-market-failures-in-the-financial-system.html
164 D. Scutt (2015) ‘China Has Already Created 7 Million Jobs This Year’, Business Insider. http://uk.businessinsider.com/china-has-already-created-7-million-jobs-this-year-2015-7?r=US&IR=T
165 R. Wilshaw (2014) ‘Steps Towards a Living Wage In Global Supply Chains’, op. cit.
166 E. Sahan (2015) ‘Why Companies Fail to Pay a Living Wage (At Least in Their Supply Chain)’, Oxfam blog. http://policy-practice.oxfam.org.uk/blog/2015/01/why-companies-fail-to-pay-a-living-wage
167 M-H. Lim (2014) ‘Globalization, Export-Led Growth and Inequality: The East Asian Story’, South Centre. http://www.southcentre.int/wp-content/uploads/2014/11/RP57_Globalisation-Export-led-Growth-and-Inequality-

42
rev_EN.pdf
168 Worker Rights Consortium (2013) ‘Global Wage Trends for Apparel Workers, 2001–2011’. https://www.americanprogress.org/issues/labor/report/2013/07/11/69255/global-wage-trends-for-apparel-workers-2001-2011/
169 M. Christian, B. Evers and S. Barrientos (2013) ‘Women in Value Chains, Making a Difference’, Capturing the Gains Summit Briefing. http://www.capturingthegains.org/pdf/ctg_briefing_note_6.3.pdf
170 M. Anner, J. Bair and J. Blasi (2012) ‘Buyer Power, Pricing Practices, and Labor Outcomes in Global Supply Chains’, IBS Working Paper, University of Colorado at Boulder. http://www.colorado.edu/ibs/pubs/pec/inst2012-0011.pdf
171 S. Hester (2013) ‘Analyzing the Value Chain for Apparel Designed in the United States and Manufactured Overseas’. Report commissioned by the TPP Apparel Caucus. Seattle, Washington: Moongate Associates.
172 Chart reproduced from M-H. Lim (2014), op. cit. Labour productivity and wages indexed to the year 1995. Between 1995 and 2007, productivity increased by 19%, while wages increased by 11%.
173 J. Keane and D.W. te Velde (2008) ‘The Role of Clothing and Textile Industries in Growth and Development Strategies’, ODI. http://www.odi.org/sites/odi.org.uk/files/odi-assets/publications-opinion-files/3361.pdf
174 M.H. Sikhdar, S.K. Sarkar and S. Sadeka (2014) ‘Socio-Economic Conditions of the Female Garment Workers in the Capital City of Bangladesh’. http://www.ijhssnet.com/journals/Vol_4_No_3_February_2014/17.pdf
175 A. Barkat, S.N. Ahmed, A.K.M. Maksud and M.A. Ali (2003) ‘The Cost for Women Workers of Precarious Employment in Bangladesh’, Human Development Research Centre, Dhaka: Oxfam GB.
176 This was the official death toll. http://www.npr.org/sections/money/2013/12/26/257364509/year-in-numbers-the-tragic-number-that-got-us-all-talking-about-our-clothing
177 Fair Factories Clearinghouse, ‘Accord on Fire and Building Safety in Bangladesh’. http://accord.fairfactories.org/ffcweb/Web/ManageSuppliers/InspectionReportsEnglish.aspx/
178 R. Wilshaw, S. Hamilton, J. Théroux-Séguin and D. Gardener (2015) ‘In Work But Trapped in Poverty’, op. cit.
179 J. Merk (2014) ‘Living Wage in Asia’, Clean Clothes Campaign. http://www.cleanclothes.org/resources/publications/asia-wage-report/view
180 C. Arthur (2013) ‘UK Joins US in Lobbying Brussels Over Data Protection Rules’, The Guardian. http://www.theguardian.com/technology/2013/mar/07/uk-us-eu-data-protection-rules
181 Scientific American (2009) ‘Do Seed Companies Control GM Crop Research?’. http://www.scientificamerican.com/article/do-seed-companies-control-gm-crop-research/
182 D.H. Jernigan (2010) ‘The Extent of Global Alcohol Marketing and Its Impact on Youth’, Sage Publications. http://cdx.sagepub.com/content/37/1/57.abstract
183 OpenSecrets.org (2014) ‘Anheuser-Busch InBev’. https://www.opensecrets.org/lobby/clientissues.php?id=D000042510&year=2014
184 H. Burley (2012) ‘AB InBev – A Key Voice in the EU Alcohol Debate’, Friends of the Earth Europe. http://www.foeeurope.org/sites/default/files/alcohol_lobby_briefing_dec2012.pdf
185 BBC News (2012) ‘Brazil World Cup Beer Law Signed by President Rousseff’. http://www.bbc.co.uk/news/world-latin-america-18348012
186 D. Bartz (2015) ‘U.S. Probes Allegations AB InBev Seeking to Curb Craft Beer Distribution’, reuters. http://www.reuters.com/article/2015/10/12/us-abinbev-doj-antitrust-exclusive-idUSKCN0S623R20151012
187 Forbes 400, ‘149: Alejandro Santo Domingo’. http://www.forbes.com/profile/alejandro-santo-domingo/
188 WIPO (2014) ‘Global Intellectual Property Filings Up In 2013, China Drives Patent Application Growth’. http://www.wipo.int/pressroom/en/articles/2014/article_0018.html
189 WIPO (2014) ‘WIPO IP Facts and Figures’. http://www.wipo.int/edocs/pubdocs/en/wipo_pub_943_2014.pdf
190 L. Chen (2014) ‘2015 Global 2000: The World’s Largest Drug and Biotech Companies’, Forbes. http://www.forbes.com/sites/liyanchen/2015/06/04/2015-global-2000-the-worlds-largest-drug-and-biotech-companies/
191 D. Hardoon (2015) ‘Wealth: Having it all and wanting more’, op. cit.
192 Activis changed its name to Allergan in June 2015 after a series of acquisitions (including of Allergan, maker of Botox, for $70bn). However, the company is still known as Actavis in the US and Canada.
193 S. Cornwell and D. Bartz (2015) ‘After Big Spending and Hard Lobbying, Pfizer Eyes New Tax Home’, Reuters. http://www.reuters.com/article/2015/11/06/us-allergan-m-a-pfizer-lobbying-idUSKCN0SV0IZ20151106#CUlDZTso9BIbS19j.97
194 Ibid.
195 M. Mazuccato (2011) The Entrepreneurial State: Debunking Public vs. Private Sector Myths, Anthem Press.
196 Global data. R. Anderson (2014) ‘Pharmaceutical Industry Gets High on Fat Profits’, BBC News. http://www.bbc.co.uk/news/business-28212223?
197 OpenSecret.org (2014) ‘Pharmaceuticals/Health Products’. https://www.opensecrets.org/lobby/indusclient.php?id=H04&year=2014
198 Commons Network (2014) ‘The Transatlantic Trade and Investment Partnership –TTIP: A Civil Society Response to the Big Pharma Wish List’. http://commonsnetwork.eu/wp-content/uploads/2014/03/A-Civil-Society-Response-to-the-Big-pharma-wish-list_Nov2014.pdf
43
199 Program on Information Justice and Intellectual Property (2009) ‘Timeline for US-Thailand Compulsory licence dispute’, Washington College of Law. http://infojustice.org/wp-content/uploads/2012/11/pijip-thailand-timeline.pdf
200 Ibid.
201 B. Somers (2007) ‘Regulators Warn Thailand Over Drug Pricing Policy’. http://www.law360.com/articles/32129/regulators-warn-thailand-over-drug-pricing-policy
202 Public Citizen (2013) ‘U.S. Pharmaceutical Corporation Uses NAFTA Foreign Investor Privileges Regime to Attack Canada’s Patent Policy, Demand $100 Million for Invalidation of a Patent’. http://www.citizen.org/documents/Eli%20Lilly%20Briefing%20Paper%20Mar%202013%20FINAL.pdf
203 S. Cornwell and D. Bartz (2015) ‘After Big Spending and Hard Lobbying, Pfizer Eyes New Tax Home’, op. cit.
204 A. Sloan (2015) ‘Pfizer Gobbles Up Tax Advantages in a Turkey of a Transaction’, Washington Post. https://www.washingtonpost.com/business/economy/pfizer-gobbles-up-tax-advantages-in-a-turkey-of-a-transaction/2015/11/23/675bb054-9200-11e5-b5e4-279b4501e8a6_story.html
205 S. Salvi and Agarwal (2012) ‘India needs a national COPD prevention and Control program’, Journal of the Association of Physicians of India, 2012; 60 Suppl: 5–7.
206 A. Kazmin (2014) ‘India Assumes Frontline Position over Intellectual Property Rights’, Financial Times. http://www.ft.com/cms/s/0/2cc8d306-6f3b-11e4-8d86-00144feabdc0.html#axzz3u1S64Y3E
207 A. Ward (2014), ‘Bayer loses bid to block cheap version of cancer drug in India’ http://www.ft.com/cms/s/0/36a2d942-8202-11e4-a9bb-00144feabdc0.html#axzz3LamAkOrY
208 E. Seery and A. Caistor Arendar (2014) ‘Even It Up: Time to end extreme inequality’. https://www.oxfam.org/sites/www.oxfam.org/files/file_attachments/cr-even-it-up-extreme-inequality-291014-en.pdf
209 High Pay Centre (2015) ‘No Routine Riches: Reforms to Performance-Related Pay’. http://highpaycentre.org/pubs/no-routine-riches-reforms-to-performance-related-pay
210 McKinsey (2014) ‘Global Wealth Management Survey 2014: An attractive sector in transition.’ , http://www.mckinsey.com/~/media/mckinsey%20offices/france/pdfs/global_wealth_management_survey_2014.ashx
211 G. Zucman (2014) ‘Taxing Across Borders: Tracking Personal Wealth and Corporate Profits’, Journal of Economic Perspectives. http://gabriel-zucman.eu/files/Zucman2014JEP.pdf
212 A total of $8.7bn a year invested in maternal and child health in 46 countries in Africa could save the lives of four million children every year. World Health Organization, The Partnership for Maternal, Newborn and Child Health and the University of Washington (2014) ‘Investment Framework for Women’s and Children’s Health in Africa’, Geneva, Switzerland. http://www.who.int/pmnch/media/news/2014/aif_report.pdf?ua=1
213 It is estimated that $5.2bn would be needed every year to pay the salaries of additional teachers in sub-Saharan Africa to ensure that every child can go to school. UNESCO (2014) ‘Wanted: Trained Teachers to Ensure Every Child’s Right to Primary Education’. http://unesdoc.unesco.org/images/0022/002299/229913E.pdf
214 McKinsey (2014) ‘Global Wealth Management Survey 2014’, op. cit.
215 T. Price (2014) ‘CEO Performance Pay is Bad for Everyone Except CEOs’, Roosevelt Institute. http://www.rooseveltinstitute.org/new-roosevelt/ceo-performance-pay-bad-everyone-except-ceos
216 A. Ellul et al. (2014) Labor unemployment risk and CEO incentive compensation’, http://www.cicfconf.org/sites/default/files/paper_409.pdf
217 M. Lawrence and C. McNeill ((2014) ‘Fair Shares: Shifting the balance of power in the workplace to boost productivity and pay’. IPPR. http://www.ippr.org/files/publications/pdf/Fair-shares_May2014.pdf?noredirect=1
218 M. Walsh (2013), ‘Women’s Collective Action in the Vegetable Sector in Tanzania’ Oxfam case study http://policy-practice.oxfam.org.uk/publications/womens-collective-action-in-the-vegetable-sector-in-tanzania-275774
219 E. Sahan, J. Fischer Mackay (2011), ‘Making Markets Empower the Poor: Programme perspectives on using markets to empower women and men living in poverty’ Oxfam discussion paper, http://policy-practice.oxfam.org.uk/publications/making-markets-empower-the-poor-programme-perspectives-on-using-markets-to-empo-188950
220 L. Schincariol and J.J. McMurtry (2015) ‘Advancing gender equality the cooperative way’, ILO and International Coopertive Alliance http://www.ilo.org/wcmsp5/groups/public/---ed_emp/---emp_ent/---coop/documents/publication/wcms_379095.pdf.
Note, 26 January 2016: In the original version of this report, we stated that the net wealth of the bottom 50% of the global population had declined by 41% and the wealth of the richest 62 individuals had increased by 44%. There was an error in the original calculation which was used to derive these percentage changes. Oxfam calculated the percentage change in wealth based on the nominal value of wealth in 2010, rather than the real 2010 value in 2015 prices after adjusting for inflation. The corrected percentage change in net wealth, which measures the real change in value, was a decline of 38% for the bottom 50% of people and an increase in wealth of 45% for the richest 62 people.
44
© Oxfam International January 2016
This paper was written by Deborah Hardoon, Sophia Ayele and Ricardo Fuentes-Nieva. The
executive summary was written by Max Lawson. Oxfam would like to thank Chris Hoy for peer
reviewing the calculations behind the main empirical results and the final paper itself, and to thank
Branko Milanovic for providing 2011 LM-WPID data, and Branko Milanovic and Maro Lilla for
helpful comments on the global income shares methodology. We would also like to thank Tony
Shorrocks for providing source data for the 2014 Global Wealth Databook and for valuable
insights related to the methodology of the Credit Suisse Global Wealth Report. The authors would
also like to thank Anna Coryndon for excellent editorial advice and Ana Arendar, Jaime Atienza
and Katy Wright for helping to manage the project. Contributions to the analysis have come from
across the Oxfam confederation, including from Jon Slater, Francesca Rhodes, Rachel Wilshaw,
Mohga Kamal Yanni, Uwe Gneiting, Alison Holder, Claire Godfrey and Susana Ruiz.
This is part of a series of papers written to inform public debate on development and humanitarian
policy issues.
For further information on the issues raised in this paper please e-mail
This publication is copyright but the text may be used free of charge for the purposes of
advocacy, campaigning, education, and research, provided that the source is acknowledged in
full. The copyright holder requests that all such use be registered with them for impact
assessment purposes. For copying in any other circumstances, or for re-use in other publications,
or for translation or adaptation, permission must be secured and a fee may be charged. E-mail
The information in this publication is correct at the time of going to press.
Published by Oxfam GB for Oxfam International under ISBN 978-1-78077-993-5 in January 2016.
Oxfam GB, Oxfam House, John Smith Drive, Cowley, Oxford, OX4 2JY, UK.
OXFAM
Oxfam is an international confederation of 17 organizations networked together in more than 90 countries, as part of a global movement for change, to build a future free from the injustice of
poverty. Please write to any of the agencies for further information, or visit www.oxfam.org
Oxfam America (www.oxfamamerica.org)
Oxfam Australia (www.oxfam.org.au)
Oxfam-in-Belgium (www.oxfamsol.be)
Oxfam Canada (www.oxfam.ca)
Oxfam France (www.oxfamfrance.org)
Oxfam Germany (www.oxfam.de)
Oxfam GB (www.oxfam.org.uk)
Oxfam Hong Kong (www.oxfam.org.hk)
Oxfam India (www.oxfamindia.org)
Oxfam Intermón (Spain) (www.oxfamintermon.org)
Oxfam Ireland (www.oxfamireland.org)
Oxfam Italy (www.oxfamitalia.org)
Oxfam Japan (www.oxfam.jp)
Oxfam Mexico (www.oxfammexico.org)
Oxfam New Zealand (www.oxfam.org.nz)
Oxfam Novib (Netherlands) (www.oxfamnovib.nl)
Oxfam Québec Oxfam Québec (www.oxfam.qc.ca)(www.oxfam.qc.ca)
www.oxfam.org