An Economic Analysis of the Food and Agriculture...
50
NDA ECONOMIC ANALYSIS OF THE FOOD AND AGRICULTURE SECTOR March 2016
-
Upload
truonglien -
Category
Documents
-
view
216 -
download
0
Transcript of An Economic Analysis of the Food and Agriculture...
NDA
ECONOMIC ANALYSIS OF THEFOOD AND AGRICULTURE SECTORMarch 2016
AN ECONOMIC ANALYSIS OF THE FOOD AND AGRICULTURE SECTOR 2016
1
Content:
CONTENT: .............................................................................................................................................................. 1
EXECUTIVE SUMMARY: .......................................................................................................................................... 2
INTRODUCTION: .................................................................................................................................................... 4
GENERAL AGRICULTURE TRENDS: .......................................................................................................................... 4
FARM OPERATIONS IN NEVADA:........................................................................................................................................ 5 FOOD AND AGRICULTURE PRODUCTION IN NEVADA: ............................................................................................................. 5 NEVADA’S GROSS DOMESTIC PRODUCT: ............................................................................................................................. 6 FOOD AND AGRICULTURE SECTOR EMPLOYMENT:................................................................................................................. 8 FOOD AND AGRICULTURE SECTOR EXPORT ACTIVITIES: .......................................................................................................... 9
CONTRIBUTION OF FOOD AND AGRICULTURE SECTOR TO THE NEVADA ECONOMY – ECONOMIC IMPACT: ........ 12
NEVADA AGRICULTURE VALUE CHAIN – ECONOMIC CONTRIBUTION TO THE NEVADA ECONOMY: ..................... 14
ECONOMIC ANALYSIS OF THE NEVADA FOOD AND AGRICULTURE VALUE CHAIN: ............................................... 16
Food and Agriculture Production Industries: ...................................................................................................... 16 Livestock Industry: ............................................................................................................................................................ 17
The Cattle and Calf Industry: ....................................................................................................................................... 19 The Dairy and Milk Production Industry: ..................................................................................................................... 23 The Pork Industry: ....................................................................................................................................................... 24
Plant Industry: .................................................................................................................................................................. 25 Field Crops: .................................................................................................................................................................. 27 Fruit and Vegetables Production: ................................................................................................................................ 29 Greenhouse, Nursery, and Floriculture Production:.................................................................................................... 31
Food and Agriculture Manufacturing and Processing Industry: ......................................................................... 33 Food Retailing & Restaurants: ............................................................................................................................ 36
CONCLUSION: ...................................................................................................................................................... 38
GLOSSARY OF ECONOMIC TERMS: ....................................................................................................................... 40
APPENDICES: ....................................................................................................................................................... 42
APPENDIX 1 – ECONOMIC IMPACT ANALYSIS APPROACH: .................................................................................................... 42 APPENDIX 2 – DATA SOURCE: ........................................................................................................................................ 44

AN ECONOMIC ANALYSIS OF THE FOOD AND AGRICULTURE SECTOR 2016
2
Executive Summary
Nevada’s food and agriculture sector is growing. To determine how fast or slow that growth is,
common measurements like economic output and gross domestic product are used. This report
will also address the dynamics of the entire sector: How industries are related to each other,
what jobs are created due to this interconnection and how much income is generated, directly
and indirectly.
Agriculture remains an important part of the Nevada economy. The states’ farms combined cover
nearly 40.5% of Nevada’s total land area in 2012, while woodland covers 8.4% of the state.
However, the economic contributions of agriculture extend beyond the farm and forest.
Nevada is also home to many agriculture-related processing and manufacturing establishments,
such as bread and bakery manufacturing operations, frozen food manufacturing operations and
many others. These establishments are found all over the state—from our largest cities to our
more rural areas, and they employ more than 8,000 Nevadans total.
Using data from 2014, this study updates a prior analysis of the contribution agriculture gives to
the Nevada economy. For consistency with the prior analysis, agriculture is defined as food and
agriculture production and value added food processing, or food and agriculture manufacturing.
Production refers to the crop and livestock industries, as well as forestry and agricultural support
services.
Within the North American Industry Code System (NAICS) industry classification scheme,
production activities refer to any industry classified in sector 11. The processing and
manufacturing activities refer to industries that utilize farm and forest production as the key
input into their finished goods – sector 31.
The main objectives of this report are to look into the following:
(1) general trends (2010 to 2014) of food and agriculture production activity for Nevada (2) economic impact – an update of the contribution of agriculture to the Nevada economy (3) economic analysis of various sector components of Nevada agriculture

AN ECONOMIC ANALYSIS OF THE FOOD AND AGRICULTURE SECTOR 2016
3
Key Findings
In the most recent data set for 2014, it is found that the total direct value of sales for Nevada food and agriculture sector was an estimated $4.4 billion (about 1.9% of Nevada’s total output); the sector employed 14,491 jobs (1% of total Nevada employment) and paid $687 million in total income (about 1% of Nevada’s total income). To provide the best measure of total impact the agriculture sector has on Nevada’s economy, we looked at the contribution of the sector to GDP (or value added). The combined effect of agriculture sector (direct effects + ripple effects) generated an estimated $2.7 billion in value added:
Food and agriculture production contributed 6,239 jobs, $323 million in labor income (wages, salaries and proprietor income), and $1.3 billion to industrial output. Total economic impact of food and agriculture production activities generated an estimated $1.1 million in value added.
Food and agriculture manufacturing activities contributed 8,207 jobs, $384 million to
labor income (wages, salaries and proprietor income), and generated approximately $3.3 billion in total direct value of sales, and total effect of food and agriculture production activities generated an estimated $1.7 billion value added.
Additionally, looking down the food and agriculture value chain, the following activities contributed to the Nevada state economy:
Food and agriculture retail and restaurant services combined contributed 18,972 jobs, $1,002 million to labor income (wages, salaries and proprietor income), and $2.7 billion in industry production value. The economic impact of food and agriculture retail and restaurant services was $2.9 billion value added.
Agricultural supporting industries and activity contributed 2,551 jobs, $138 million to
labor income (wages, salaries and proprietor income), and $406 million to industrial output. The economic impact of agricultural supporting industries and activity was $345 million value added.
AN ECONOMIC ANALYSIS OF THE FOOD AND AGRICULTURE SECTOR 2016
4
Introduction
The food and agriculture system is fairly complex. The supply chain for products produced by this sector goes through several steps:
Inputs are used at the farm level to produce crops, livestock, milk, fruits, and vegetables. Farm products are then collected, graded, sorted, etc. Next, the commodities are sent to food processors to create manufactured food products
or in the case of fresh fruits and vegetables, sent to wholesalers and brokers to be sold to retailers such as supermarkets or the food service industry.
The manufactured food products are then wholesaled and retailed or consumed in restaurants.
As the above outline shows, the food and agricultural system is interconnected. Agriculture is much more than farming. As such, in order to obtain a complete picture of the economic impact of that system on Nevada’s economy, we will be looking at and analyzing the economic impact of the farm, food processor, and wholesale and retail levels of the food and agriculture supply chain. This report aims to provide estimates of the total activity generated by these various levels of the agriculture sector in Nevada. The analysis is based on 2014 data and includes estimates of the total value of sales, value of agriculture production, employment directly linked to agriculture-related industries, and the economic ripple effects that these activities generate in other industries. The primary tool used to generate figures on the total economic impact will be an input-output model with multipliers generated by IMPLAN1
General Agriculture Trends
There are numerous ways to measure the size of the agriculture sector. A few examples include employment, industry sales, value of production, and trade. However, because of its nature, agricultural sales tend to be highly sensitive to swings in commodity prices, and production volumes measured in dollar amounts are also subject to sensitivity to growing conditions. For example, drought conditions for many parts of Nevada caused a downward tick in grain farm activity, further complicating the challenge of feeding dairy animals and other livestock. An assessment of the drought conditions is beyond the scope of this study, but severe drought conditions must be taken into consideration.
1 IMPLAN Pro is an economic analysis software that provides input-output analysis model. IMPLAN Group LLC, IMPLAN System (data
and software),16905 Northcross Dr., Suite 120, Huntersville, NC 28078 www.IMPLAN.com

AN ECONOMIC ANALYSIS OF THE FOOD AND AGRICULTURE SECTOR 2016
5
Farm Operations in Nevada
As of 2014, Nevada was home to nearly 4,200 individual farms covering more than 5.9 million acres. The number of farm operations during the period 1998-2014 shows continued growth (Figure 1). Figure 1. Farm Operations in Nevada, (2010 – 2014)
Source: USDA, NASS
Food and Agriculture Production in Nevada
Between 2010 and 2014, Nevada agricultural production doubled its value from $636 million in 2011 to an estimated $952 million in 2014 (Figure 2). Figure 2. Value of Food and Agriculture Production in Nevada, (2010 – 2014)
Source: USDA, NASS
Nevada farmers and ranchers sold a total of $868 million worth of unprocessed agricultural commodities in 2014. Agriculture production in Nevada is directed primarily toward range livestock production. More than 65% of the agriculture production sales originate from cattle and calf production.
3,750
3,900
4,150 4,1504,200
2010 2011 2012 2013 2014
636,165
799,989766,842 790,542
951,723
2010 2011 2012 2013 2014
AN ECONOMIC ANALYSIS OF THE FOOD AND AGRICULTURE SECTOR 2016
6
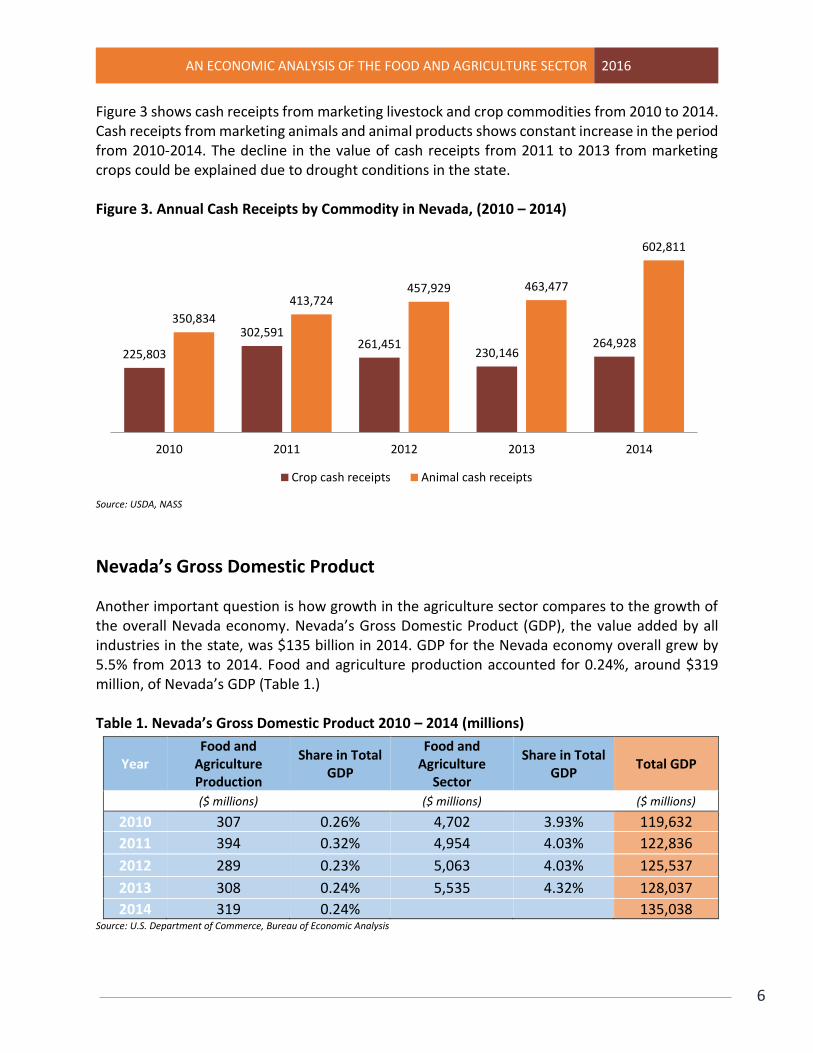
Figure 3 shows cash receipts from marketing livestock and crop commodities from 2010 to 2014. Cash receipts from marketing animals and animal products shows constant increase in the period from 2010-2014. The decline in the value of cash receipts from 2011 to 2013 from marketing crops could be explained due to drought conditions in the state. Figure 3. Annual Cash Receipts by Commodity in Nevada, (2010 – 2014)
Source: USDA, NASS
Nevada’s Gross Domestic Product
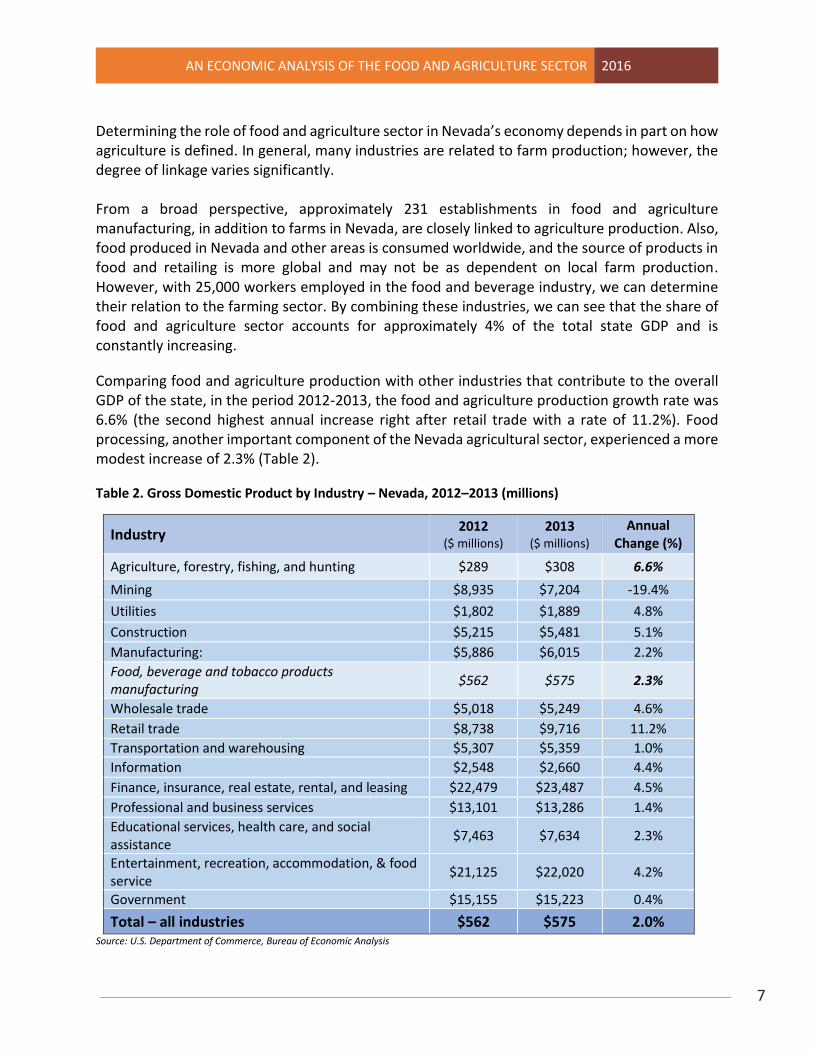
Another important question is how growth in the agriculture sector compares to the growth of the overall Nevada economy. Nevada’s Gross Domestic Product (GDP), the value added by all industries in the state, was $135 billion in 2014. GDP for the Nevada economy overall grew by 5.5% from 2013 to 2014. Food and agriculture production accounted for 0.24%, around $319 million, of Nevada’s GDP (Table 1.) Table 1. Nevada’s Gross Domestic Product 2010 – 2014 (millions)
Year Food and
Agriculture Production
Share in Total GDP
Food and Agriculture
Sector
Share in Total GDP
Total GDP
($ millions) ($ millions) ($ millions)
2010 307 0.26% 4,702 3.93% 119,632
2011 394 0.32% 4,954 4.03% 122,836
2012 289 0.23% 5,063 4.03% 125,537
2013 308 0.24% 5,535 4.32% 128,037
2014 319 0.24% 135,038 Source: U.S. Department of Commerce, Bureau of Economic Analysis
225,803
302,591261,451
230,146264,928
350,834
413,724457,929 463,477
602,811
2010 2011 2012 2013 2014
Crop cash receipts Animal cash receipts
AN ECONOMIC ANALYSIS OF THE FOOD AND AGRICULTURE SECTOR 2016
7
Determining the role of food and agriculture sector in Nevada’s economy depends in part on how agriculture is defined. In general, many industries are related to farm production; however, the degree of linkage varies significantly. From a broad perspective, approximately 231 establishments in food and agriculture manufacturing, in addition to farms in Nevada, are closely linked to agriculture production. Also, food produced in Nevada and other areas is consumed worldwide, and the source of products in food and retailing is more global and may not be as dependent on local farm production. However, with 25,000 workers employed in the food and beverage industry, we can determine their relation to the farming sector. By combining these industries, we can see that the share of food and agriculture sector accounts for approximately 4% of the total state GDP and is constantly increasing.
Comparing food and agriculture production with other industries that contribute to the overall GDP of the state, in the period 2012-2013, the food and agriculture production growth rate was 6.6% (the second highest annual increase right after retail trade with a rate of 11.2%). Food processing, another important component of the Nevada agricultural sector, experienced a more modest increase of 2.3% (Table 2).
Table 2. Gross Domestic Product by Industry – Nevada, 2012–2013 (millions)
Industry 2012
($ millions)
2013 ($ millions)
Annual Change (%)
Agriculture, forestry, fishing, and hunting $289 $308 6.6%
Mining $8,935 $7,204 -19.4%
Utilities $1,802 $1,889 4.8%
Construction $5,215 $5,481 5.1%
Manufacturing: $5,886 $6,015 2.2%
Food, beverage and tobacco products manufacturing
$562 $575 2.3%
Wholesale trade $5,018 $5,249 4.6%
Retail trade $8,738 $9,716 11.2%
Transportation and warehousing $5,307 $5,359 1.0%
Information $2,548 $2,660 4.4%
Finance, insurance, real estate, rental, and leasing $22,479 $23,487 4.5%
Professional and business services $13,101 $13,286 1.4%
Educational services, health care, and social assistance
$7,463 $7,634 2.3%
Entertainment, recreation, accommodation, & food service
$21,125 $22,020 4.2%
Government $15,155 $15,223 0.4%
Total – all industries $562 $575 2.0% Source: U.S. Department of Commerce, Bureau of Economic Analysis
AN ECONOMIC ANALYSIS OF THE FOOD AND AGRICULTURE SECTOR 2016
8
Food and Agriculture Sector Employment
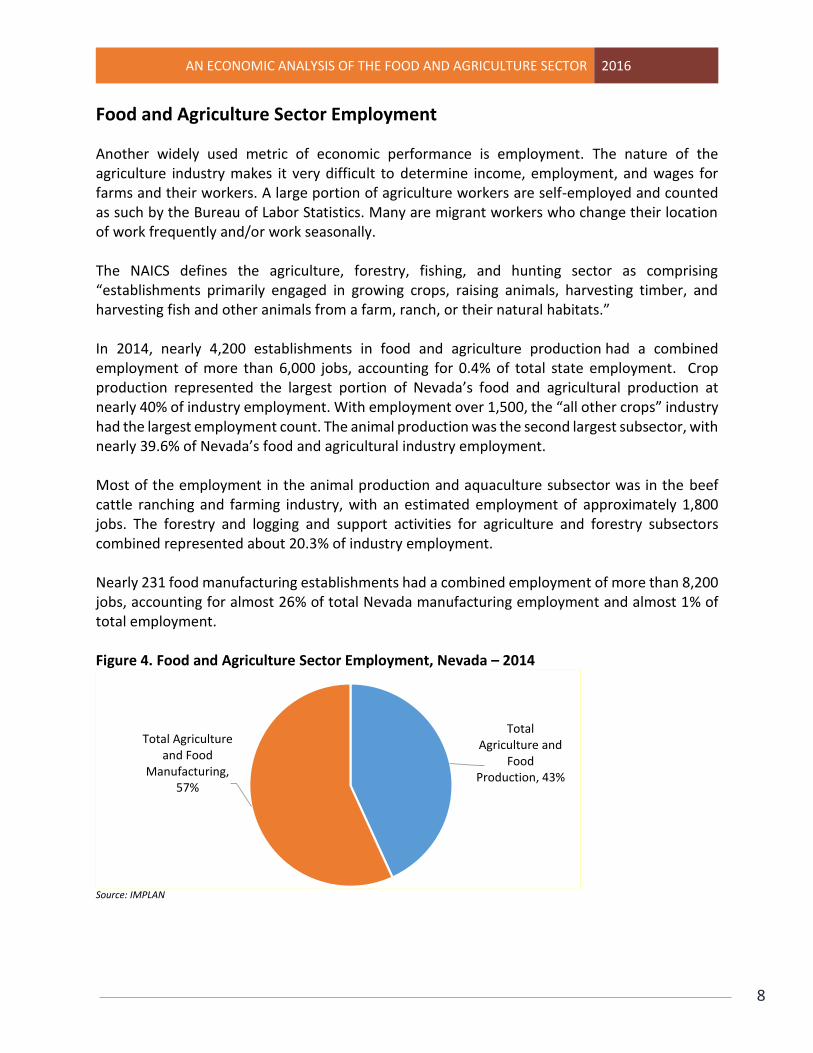
Another widely used metric of economic performance is employment. The nature of the agriculture industry makes it very difficult to determine income, employment, and wages for farms and their workers. A large portion of agriculture workers are self-employed and counted as such by the Bureau of Labor Statistics. Many are migrant workers who change their location of work frequently and/or work seasonally. The NAICS defines the agriculture, forestry, fishing, and hunting sector as comprising “establishments primarily engaged in growing crops, raising animals, harvesting timber, and harvesting fish and other animals from a farm, ranch, or their natural habitats.” In 2014, nearly 4,200 establishments in food and agriculture production had a combined employment of more than 6,000 jobs, accounting for 0.4% of total state employment. Crop production represented the largest portion of Nevada’s food and agricultural production at nearly 40% of industry employment. With employment over 1,500, the “all other crops” industry had the largest employment count. The animal production was the second largest subsector, with nearly 39.6% of Nevada’s food and agricultural industry employment. Most of the employment in the animal production and aquaculture subsector was in the beef cattle ranching and farming industry, with an estimated employment of approximately 1,800 jobs. The forestry and logging and support activities for agriculture and forestry subsectors combined represented about 20.3% of industry employment. Nearly 231 food manufacturing establishments had a combined employment of more than 8,200 jobs, accounting for almost 26% of total Nevada manufacturing employment and almost 1% of total employment. Figure 4. Food and Agriculture Sector Employment, Nevada – 2014
Source: IMPLAN
Total Agriculture and
Food Production, 43%
Total Agriculture and Food
Manufacturing, 57%
AN ECONOMIC ANALYSIS OF THE FOOD AND AGRICULTURE SECTOR 2016
9
As the economy has struggled to recover from the recession, job growth has been frustratingly slow, not only in Nevada, but across the nation. Employment numbers for agriculture on-farm activities increased on average from 2013 to 2014 by 5.1%, and food-processing employment reflects an annual average increase of approximately 9.1% in the same period. 2 Despite the overall conditions, the food and agriculture sector appears to have experienced modest growth in 2014. Modest but continued growth in food processing sector employment demonstrates how the continued promotion of food processing is an important part of the overall agricultural economy. In essence, on-farm activity and food processing are two parts of a complex agricultural economic cluster. Continued growth of food processing not only provides a continued source of economic growth within itself, but it might also spur growth of on-farm activity.
Food and Agriculture Sector Export Activities
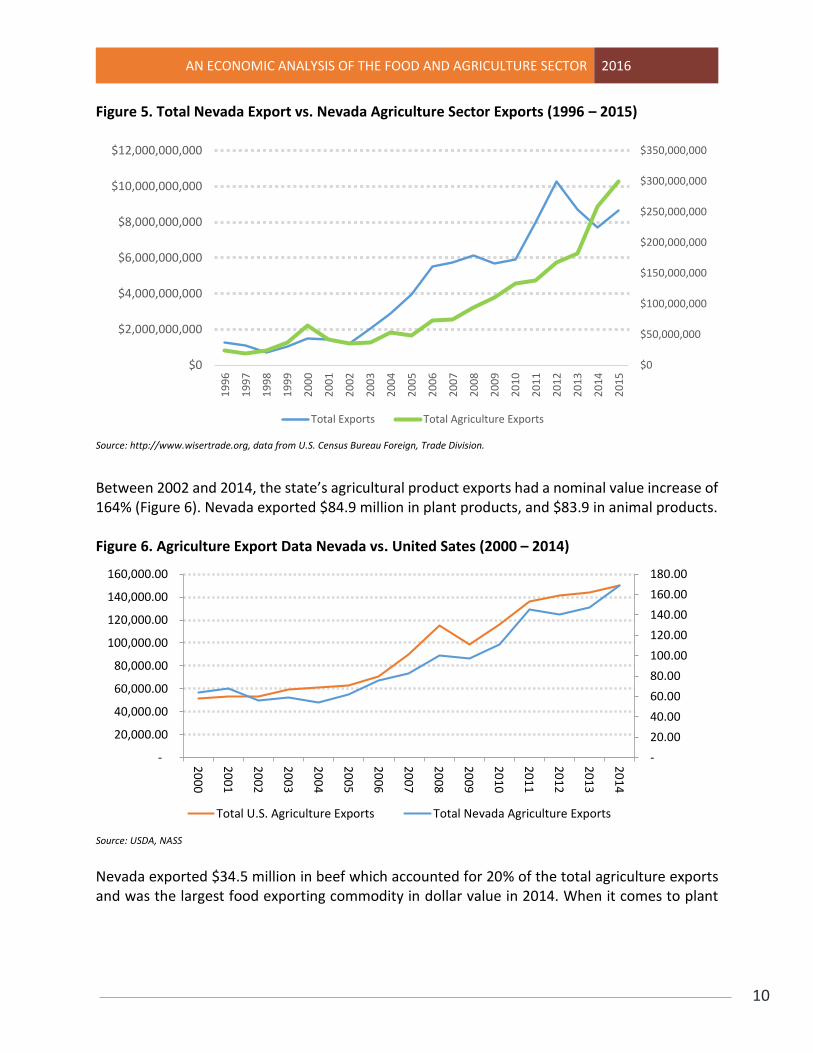
The food and agriculture sector is an important and integral part of Nevada’s economy. Enterprises involved with farming and ranching, or those in food processing and manufacturing, are producing food and food products for the state, the nation and for the global marketplace. The growth of foreign markets for agricultural products has only enhanced the significance of this sector. With the strong performance of the U.S. dollar and a slowing global economy, U.S. exports have slowed down. Year over year exports in the first month of 2015 are down 4.69%. Most industry sectors are experiencing downward trends as well; however the food and agriculture sector in Nevada continues to thrive (Figure 5).
2 Source: USDOL Bureau of Labor Statistics
AN ECONOMIC ANALYSIS OF THE FOOD AND AGRICULTURE SECTOR 2016
10
Figure 5. Total Nevada Export vs. Nevada Agriculture Sector Exports (1996 – 2015)
Source: http://www.wisertrade.org, data from U.S. Census Bureau Foreign, Trade Division.
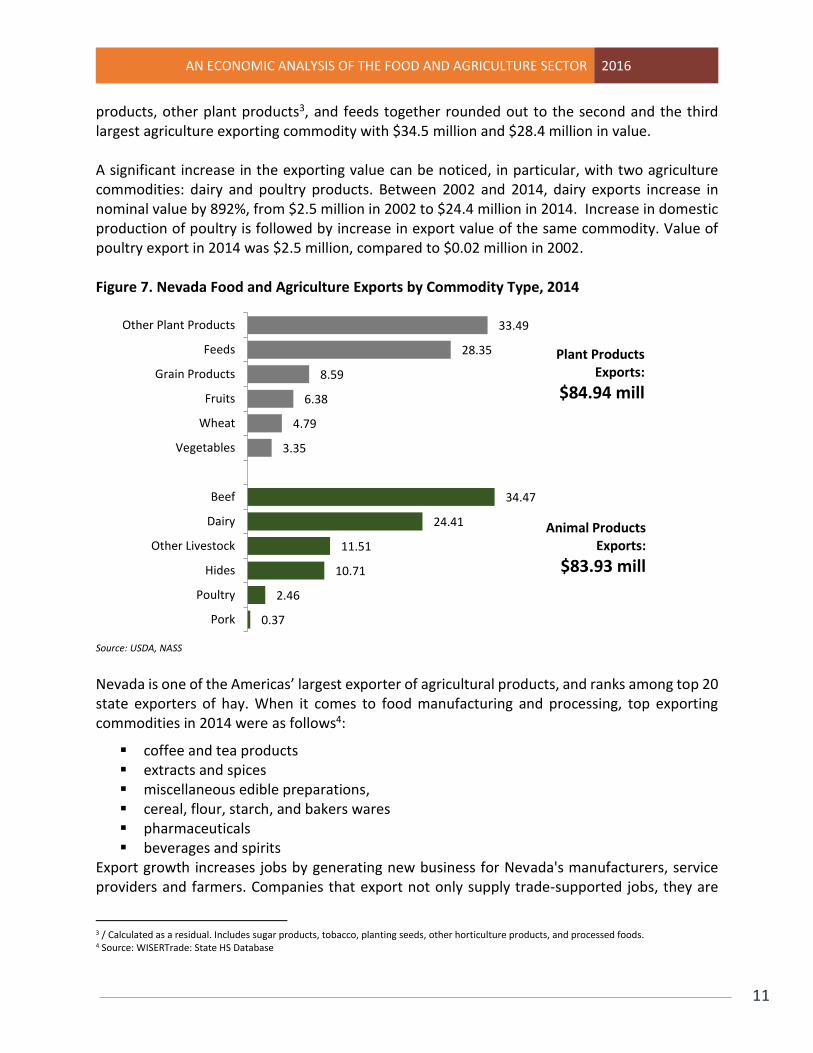
Between 2002 and 2014, the state’s agricultural product exports had a nominal value increase of 164% (Figure 6). Nevada exported $84.9 million in plant products, and $83.9 in animal products. Figure 6. Agriculture Export Data Nevada vs. United Sates (2000 – 2014)
Source: USDA, NASS
Nevada exported $34.5 million in beef which accounted for 20% of the total agriculture exports and was the largest food exporting commodity in dollar value in 2014. When it comes to plant
$0
$50,000,000
$100,000,000
$150,000,000
$200,000,000
$250,000,000
$300,000,000
$350,000,000
$0
$2,000,000,000
$4,000,000,000
$6,000,000,000
$8,000,000,000
$10,000,000,000
$12,000,000,000
19
96
19
97
19
98
19
99
20
00
20
01
20
02
20
03
20
04
20
05
20
06
20
07
20
08
20
09
20
10
20
11
20
12
20
13
20
14
20
15
Total Exports Total Agriculture Exports
-
20.00
40.00
60.00
80.00
100.00
120.00
140.00
160.00
180.00
-
20,000.00
40,000.00
60,000.00
80,000.00
100,000.00
120,000.00
140,000.00
160,000.00
20
00
20
01
20
02
20
03
20
04
20
05
20
06
20
07
20
08
20
09
20
10
20
11
20
12
20
13
20
14
Total U.S. Agriculture Exports Total Nevada Agriculture Exports
AN ECONOMIC ANALYSIS OF THE FOOD AND AGRICULTURE SECTOR 2016
11
products, other plant products3, and feeds together rounded out to the second and the third largest agriculture exporting commodity with $34.5 million and $28.4 million in value. A significant increase in the exporting value can be noticed, in particular, with two agriculture commodities: dairy and poultry products. Between 2002 and 2014, dairy exports increase in nominal value by 892%, from $2.5 million in 2002 to $24.4 million in 2014. Increase in domestic production of poultry is followed by increase in export value of the same commodity. Value of poultry export in 2014 was $2.5 million, compared to $0.02 million in 2002. Figure 7. Nevada Food and Agriculture Exports by Commodity Type, 2014
Source: USDA, NASS
Nevada is one of the Americas’ largest exporter of agricultural products, and ranks among top 20 state exporters of hay. When it comes to food manufacturing and processing, top exporting commodities in 2014 were as follows4:
coffee and tea products extracts and spices miscellaneous edible preparations, cereal, flour, starch, and bakers wares pharmaceuticals beverages and spirits
Export growth increases jobs by generating new business for Nevada's manufacturers, service providers and farmers. Companies that export not only supply trade-supported jobs, they are
3 / Calculated as a residual. Includes sugar products, tobacco, planting seeds, other horticulture products, and processed foods. 4 Source: WISERTrade: State HS Database
0.37
2.46
10.71
11.51
24.41
34.47
3.35
4.79
6.38
8.59
28.35
33.49
Pork
Poultry
Hides
Other Livestock
Dairy
Beef
Vegetables
Wheat
Fruits
Grain Products
Feeds
Other Plant Products
Plant Products Exports:
$84.94 mill
Animal Products Exports:
$83.93 mill

AN ECONOMIC ANALYSIS OF THE FOOD AND AGRICULTURE SECTOR 2016
12
also supporting and creating jobs across the range of the different industry sectors. In 2011, the total value of all food manufacturing industry exporting was $39.4 million creating a total of 1,000 jobs due to exporting activities.5
Contribution of Food and Agriculture Sector to the Nevada Economy – Economic Impact
The food and agriculture sector creates a significant multiplier effect through Nevada’s economy. Every dollar gained in the agriculture sector stimulates additional activity in the form of labor income, job creation, and value added. Multiplier effects are composed of three types: direct, indirect, and induced. Direct effect measures the direct output of the agriculture industry and is determined directly by the industry’s inputs. The indirect effects are the secondary inter-industry effects that one industry has on another. These direct and indirect effects affect employment and income which in turn affects household consumption. Induced effects are the changes in household consumption of goods and services measured in employment, income, and value added. Farm products are produced through converting inputs such as fertilizer, fuel, credit, equipment, land, chemicals, seed, and other factors of production into milk, beef, grains, fruits, vegetables, and other farm products. From fertilizers and fuels to trucking and accounting services, the ripple effects from these supply chain purchases cascade throughout the State’s economy. Furthermore, Nevada’s farms support agricultural processing and manufacturing establishments in the state which also engage other Nevada-based suppliers. This section of the report provides estimates of the economic contributions of Nevada food and agriculture sector comprised of two types of activities: agricultural production and agriculture-dependent processing or manufacturing industries. The reasoning to include only these activities lies in the fact that food processing and manufacturing is closely linked to the farming industries. Other segments of the agriculture food chain, like agriculture input supply and services, as well as food retailing and restaurants that represent final markets in consumption of food and agriculture products, are more global and may not be dependent on farm production. However, these industries are an important part of the value chain, and they have a relationship with agriculture production and manufacturing. We look at the individual impact these industries have on the State’s economy.
5 Source: 2011 Foreign Trade Statistics (Census Bureau unpublished data).

AN ECONOMIC ANALYSIS OF THE FOOD AND AGRICULTURE SECTOR 2016
13
In 2014, considering only direct impact, Nevada’s food and agriculture sector establishments combined to generate an estimated $4.4 billion in direct economic output—a measure which is analogous to total sales, providing 14,491 jobs, and paying more than $686 million in labor income (Table 3).
Table 3. Economic Impact of Nevada’s Food and Agriculture Sector – 20146
Industry
Direct Effect Total Impact Industry Output (Sales)
Employment Labor
Income Value Added
Employment Labor
Income Value Added
($ mill) (Jobs) ($ mill) ($ mill) (Jobs) ($ mill) ($ mill)
Total Agriculture Sector
4,365 14,491 687 1,424 28,388 1,390 2,661
Source: IMPLAN
In addition to this direct effect, the state’s agriculture producers and manufacturers triggered an estimated $1.2 billion in additional economic activity in the state when they purchased inputs from Nevada based suppliers. The total value added economic contribution of Nevada’s food and agriculture sector was estimated at $2.7 billion in 2014. The multiplier offers a useful way to interpret these ripple effects. Table 4 shows the sector multiplier. The ratio of total effects to direct value added yields a multiplier of 1.8, meaning that every dollar invested in Nevada’s food and agriculture sector establishments stimulates another $0.8 in additional economic activity in other industries in the state. The employment multiplier was 1.9, meaning that every 10 jobs directly related to agriculture support an additional nine jobs in the state. Table 4. Industry multipliers for Nevada Food and Agriculture Sector
Industry Employment Labor Income Value Added
(Jobs) ($ mill) ($ mill)
Total Agriculture Sector 1.9 2.0 1.8
Source: IMPLAN
6Total effects include direct, indirect, and induced effects of the industries named in the first column. For total effect, values that utilize
multiplier effects cannot be aggregated to get totals.
Value Added – equals sum of labor income (employee compensation and proprietary income), property income and indirect business
taxes. This is the same as total sales (industry output) less purchased inputs and services.

AN ECONOMIC ANALYSIS OF THE FOOD AND AGRICULTURE SECTOR 2016
14
Nevada Agriculture Value Chain – Economic Contribution to the Nevada Economy As mentioned before, farm products are produced through converting inputs (fertilizer, fuel, equipment, chemicals, seed, etc.) into agriculture products. The farm input supply and service industry is critical for food and agriculture production. For example, in 2014, Nevada’s farmers purchased $27.6 million in fertilizer and lime, $15.5 million in pesticides, and $49.5 million in petroleum fuels and oil.
Agriculture supply and service industries comprise several different activities that are closely related to agriculture production such as fertilizer and pesticide and other agriculture chemical manufacturing, veterinary service, as well as planting and horticulture services and trucking transportation. The next step along the supply chain from the farm level is food processing and manufacturing. Most of the value added in the food and agriculture sector is a result of activities in food retailing and restaurant establishments. These are the main markets for food and agriculture products whether they are used in restaurants as food prepared and served to customers, or sold as part of their retail/wholesale operations. Food and Agriculture Sector Value Chain
In 2014, considering only direct impact, Nevada’s supply and service industry establishments combined generated an estimated $406 million in total sales, providing 2,551 jobs, with more than $167 million in labor income. The total economic contribution of supply and support industries to state GDP was $345 million (Table 5).
Agriculture Supply & Services
Agriculture Production
Agriculture Manufacturing
Agriculture Retail & Restaurants
AN ECONOMIC ANALYSIS OF THE FOOD AND AGRICULTURE SECTOR 2016
15
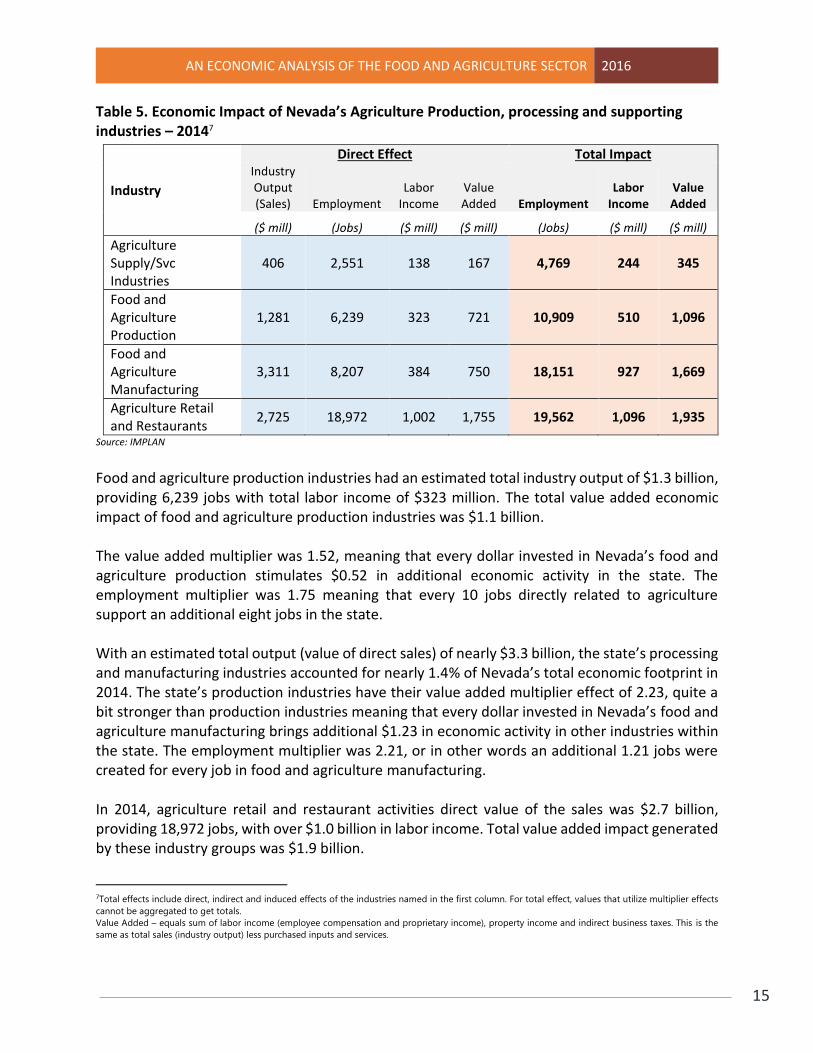
Table 5. Economic Impact of Nevada’s Agriculture Production, processing and supporting industries – 20147
Industry
Direct Effect Total Impact Industry Output (Sales) Employment
Labor Income
Value Added Employment
Labor Income
Value Added
($ mill) (Jobs) ($ mill) ($ mill) (Jobs) ($ mill) ($ mill)
Agriculture Supply/Svc Industries
406 2,551 138 167 4,769 244 345
Food and Agriculture Production
1,281 6,239 323 721 10,909 510 1,096
Food and Agriculture Manufacturing
3,311 8,207 384 750 18,151 927 1,669
Agriculture Retail and Restaurants
2,725 18,972 1,002 1,755 19,562 1,096 1,935
Source: IMPLAN
Food and agriculture production industries had an estimated total industry output of $1.3 billion, providing 6,239 jobs with total labor income of $323 million. The total value added economic impact of food and agriculture production industries was $1.1 billion. The value added multiplier was 1.52, meaning that every dollar invested in Nevada’s food and agriculture production stimulates $0.52 in additional economic activity in the state. The employment multiplier was 1.75 meaning that every 10 jobs directly related to agriculture support an additional eight jobs in the state. With an estimated total output (value of direct sales) of nearly $3.3 billion, the state’s processing and manufacturing industries accounted for nearly 1.4% of Nevada’s total economic footprint in 2014. The state’s production industries have their value added multiplier effect of 2.23, quite a bit stronger than production industries meaning that every dollar invested in Nevada’s food and agriculture manufacturing brings additional $1.23 in economic activity in other industries within the state. The employment multiplier was 2.21, or in other words an additional 1.21 jobs were created for every job in food and agriculture manufacturing. In 2014, agriculture retail and restaurant activities direct value of the sales was $2.7 billion, providing 18,972 jobs, with over $1.0 billion in labor income. Total value added impact generated by these industry groups was $1.9 billion.
7Total effects include direct, indirect and induced effects of the industries named in the first column. For total effect, values that utilize multiplier effects
cannot be aggregated to get totals.
Value Added – equals sum of labor income (employee compensation and proprietary income), property income and indirect business taxes. This is the
same as total sales (industry output) less purchased inputs and services.
AN ECONOMIC ANALYSIS OF THE FOOD AND AGRICULTURE SECTOR 2016
16
Economic Analysis of the Nevada Food and Agriculture Value Chain
Food and Agriculture Production Industries
Food and agriculture production activities include primary livestock and crop production, while agriculture supported activities are those associated with farm operations such as soil preparation, planting, and harvesting. The food and agriculture production industries include establishments primarily engaged in growing and harvesting crops, raising animals, harvesting timber, etc. Establishments are described as farms, ranches, dairies, greenhouses, nurseries, orchards, or hatcheries and can be operated by the operator alone or with the assistance of members of the household or hired employees.
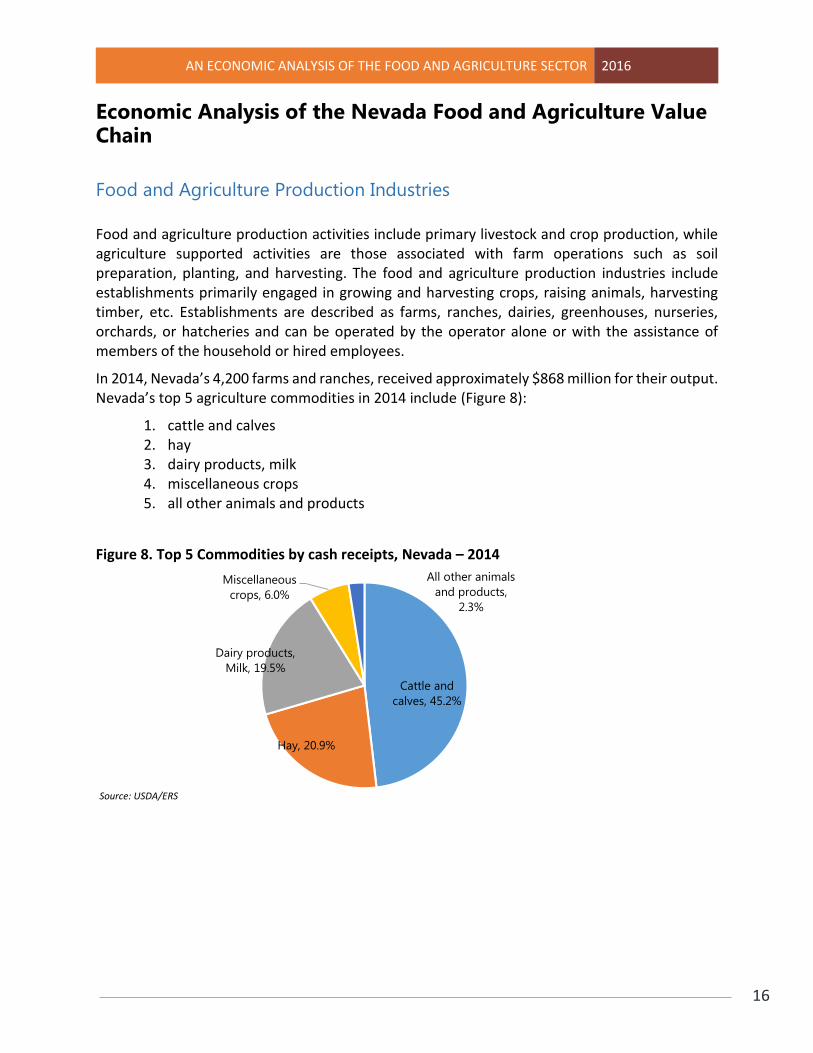
In 2014, Nevada’s 4,200 farms and ranches, received approximately $868 million for their output. Nevada’s top 5 agriculture commodities in 2014 include (Figure 8):
1. cattle and calves 2. hay 3. dairy products, milk 4. miscellaneous crops 5. all other animals and products
Figure 8. Top 5 Commodities by cash receipts, Nevada – 2014
Source: USDA/ERS
Cattle and
calves, 45.2%
Hay, 20.9%
Dairy products,
Milk, 19.5%
Miscellaneous
crops, 6.0%
All other animals
and products,
2.3%

AN ECONOMIC ANALYSIS OF THE FOOD AND AGRICULTURE SECTOR 2016
17
Livestock Industry
The livestock industry is an important value added enterprise in Nevada agriculture. The livestock producers are mostly beef, dairy cows, sheep, and swine producers who raise animals to finishing weight. After finishing, the animals are sold live to other producers or sent to slaughter and returned to the original producer for retail sale. Those producers that do not raise animals to finishing weight sell them to feedlots out of state to be finished. Major markets for producers to sell their products are on site, to farmers markets and to retail stores or restaurants. Many producers identified the lack of a USDA processing facility nearby as a barrier to selling to the local market. The industry sold about $602.8 million worth of goods. The beef, dairy, and hogs production contribute 93% of the state’s livestock output. (Figure 9) Figure 9. Cash receipts by livestock commodity in Nevada, 2014
Source: USDA/ERS
Cattle and calves brought the highest food-related cash receipts into the food and agriculture production in 2014. The cash receipts were $393 million, accounting for 45% of all agricultural and food production receipts, making the livestock industry the largest single agricultural enterprise. After beef industry, dairy and dairy products bring in the highest cash receipts, accounting for 28% of total cash receipts in 2014. Value of animal and meat production products show constant year over year increase during the period from 2010 – 2014 (Figure 10).
Cattle and
calves, 65.1%
Hogs, 0.2%
Dairy products,
Milk, 28.1%
Poultry and
eggs, 2.6% Miscellaneous
animals and
products, 3.8%
AN ECONOMIC ANALYSIS OF THE FOOD AND AGRICULTURE SECTOR 2016
18
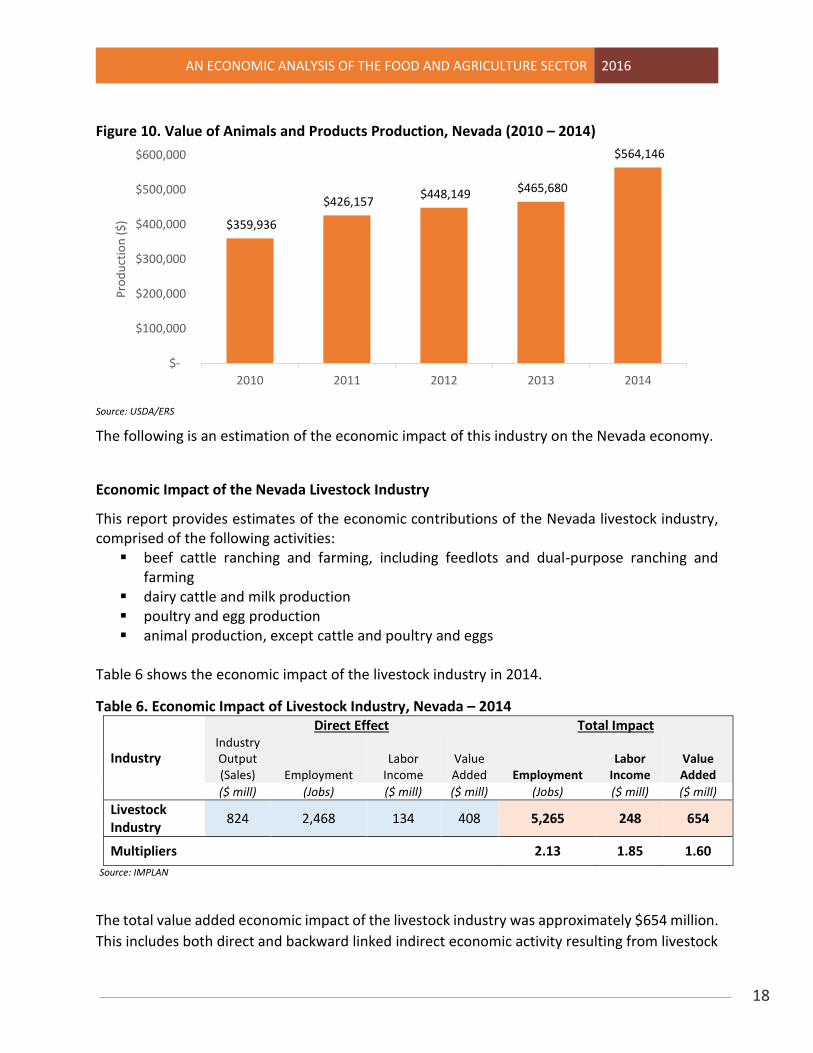
Figure 10. Value of Animals and Products Production, Nevada (2010 – 2014)
Source: USDA/ERS
The following is an estimation of the economic impact of this industry on the Nevada economy.
Economic Impact of the Nevada Livestock Industry
This report provides estimates of the economic contributions of the Nevada livestock industry, comprised of the following activities:
beef cattle ranching and farming, including feedlots and dual-purpose ranching and farming
dairy cattle and milk production poultry and egg production animal production, except cattle and poultry and eggs
Table 6 shows the economic impact of the livestock industry in 2014.
Table 6. Economic Impact of Livestock Industry, Nevada – 2014
Industry
Direct Effect Total Impact Industry Output (Sales) Employment
Labor Income
Value Added Employment
Labor Income
Value Added
($ mill) (Jobs) ($ mill) ($ mill) (Jobs) ($ mill) ($ mill)
Livestock Industry
824 2,468 134 408 5,265 248 654
Multipliers 2.13 1.85 1.60
Source: IMPLAN
The total value added economic impact of the livestock industry was approximately $654 million.
This includes both direct and backward linked indirect economic activity resulting from livestock
$359,936
$426,157 $448,149 $465,680
$564,146
$-
$100,000
$200,000
$300,000
$400,000
$500,000
$600,000
2010 2011 2012 2013 2014
Pro
du
ctio
n (
$)
AN ECONOMIC ANALYSIS OF THE FOOD AND AGRICULTURE SECTOR 2016
19
and dairy farming and other. Of this amount, beef cattle ranching accounted for almost $359
million or about 55% of total added value. Dairy farming is another large single livestock industry
with a total value added impact of $109 million in the state.
The value added multiplier was 1.6, meaning that every dollar invested in Nevada’s livestock production stimulates $0.6 in additional economic activity in the state. The employment multiplier was 2.13, or in other words an additional 1.13 jobs was created for every job in livestock industry.
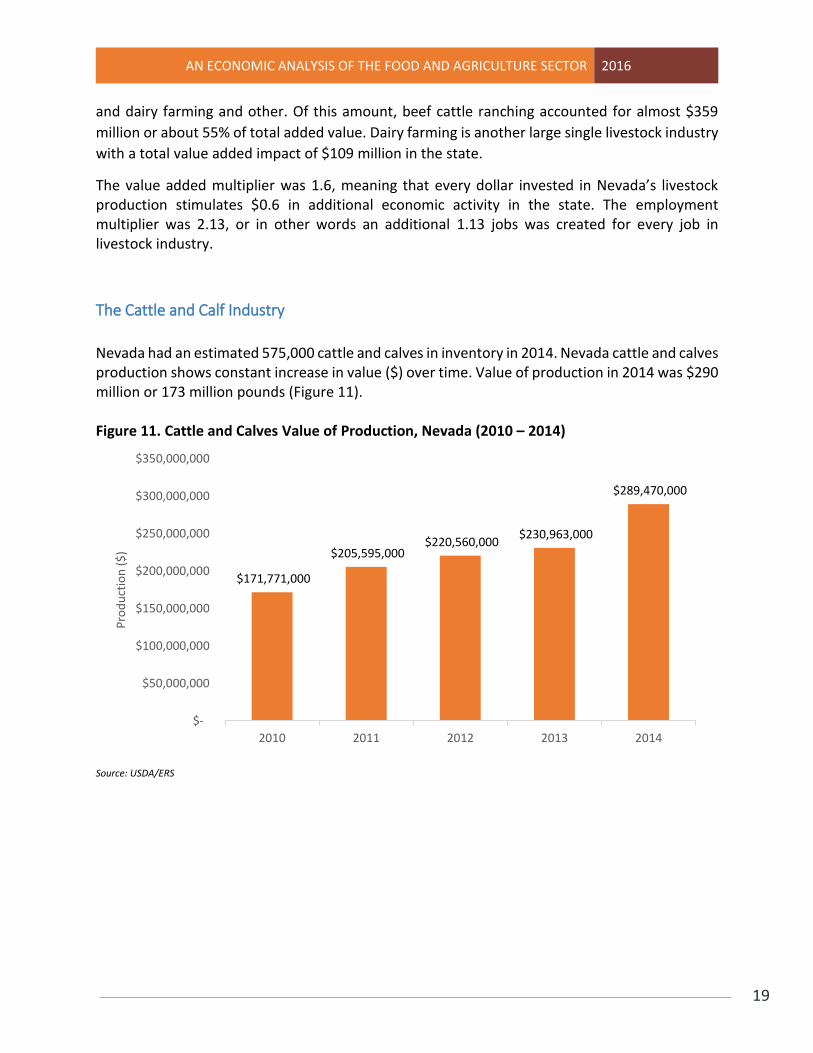
The Cattle and Calf Industry
Nevada had an estimated 575,000 cattle and calves in inventory in 2014. Nevada cattle and calves production shows constant increase in value ($) over time. Value of production in 2014 was $290 million or 173 million pounds (Figure 11). Figure 11. Cattle and Calves Value of Production, Nevada (2010 – 2014)
Source: USDA/ERS
$171,771,000
$205,595,000 $220,560,000
$230,963,000
$289,470,000
$-
$50,000,000
$100,000,000
$150,000,000
$200,000,000
$250,000,000
$300,000,000
$350,000,000
2010 2011 2012 2013 2014
Pro
du
ctio
n (
$)
AN ECONOMIC ANALYSIS OF THE FOOD AND AGRICULTURE SECTOR 2016
20
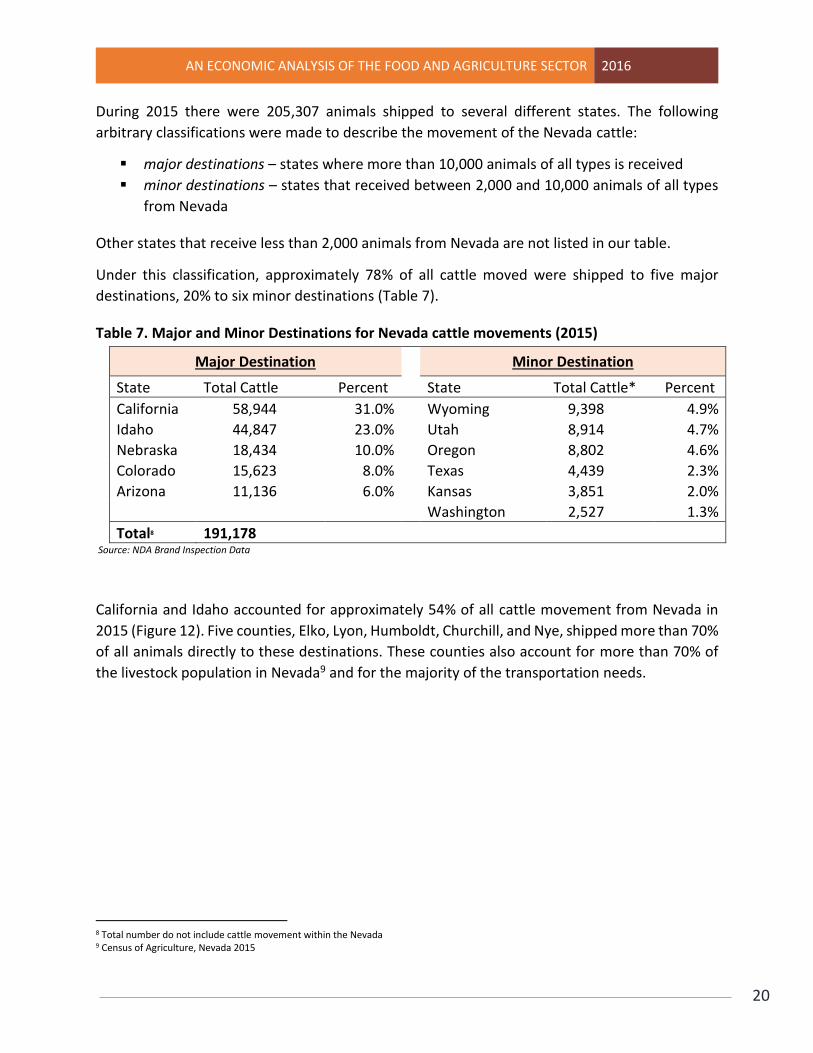
During 2015 there were 205,307 animals shipped to several different states. The following
arbitrary classifications were made to describe the movement of the Nevada cattle:
major destinations – states where more than 10,000 animals of all types is received
minor destinations – states that received between 2,000 and 10,000 animals of all types
from Nevada
Other states that receive less than 2,000 animals from Nevada are not listed in our table.
Under this classification, approximately 78% of all cattle moved were shipped to five major
destinations, 20% to six minor destinations (Table 7).
Table 7. Major and Minor Destinations for Nevada cattle movements (2015)
Major Destination Minor Destination
State Total Cattle Percent State Total Cattle* Percent
California 58,944 31.0% Wyoming 9,398 4.9%
Idaho 44,847 23.0% Utah 8,914 4.7%
Nebraska 18,434 10.0% Oregon 8,802 4.6%
Colorado 15,623 8.0% Texas 4,439 2.3%
Arizona 11,136 6.0% Kansas 3,851 2.0%
Washington 2,527 1.3%
Total8 191,178 Source: NDA Brand Inspection Data
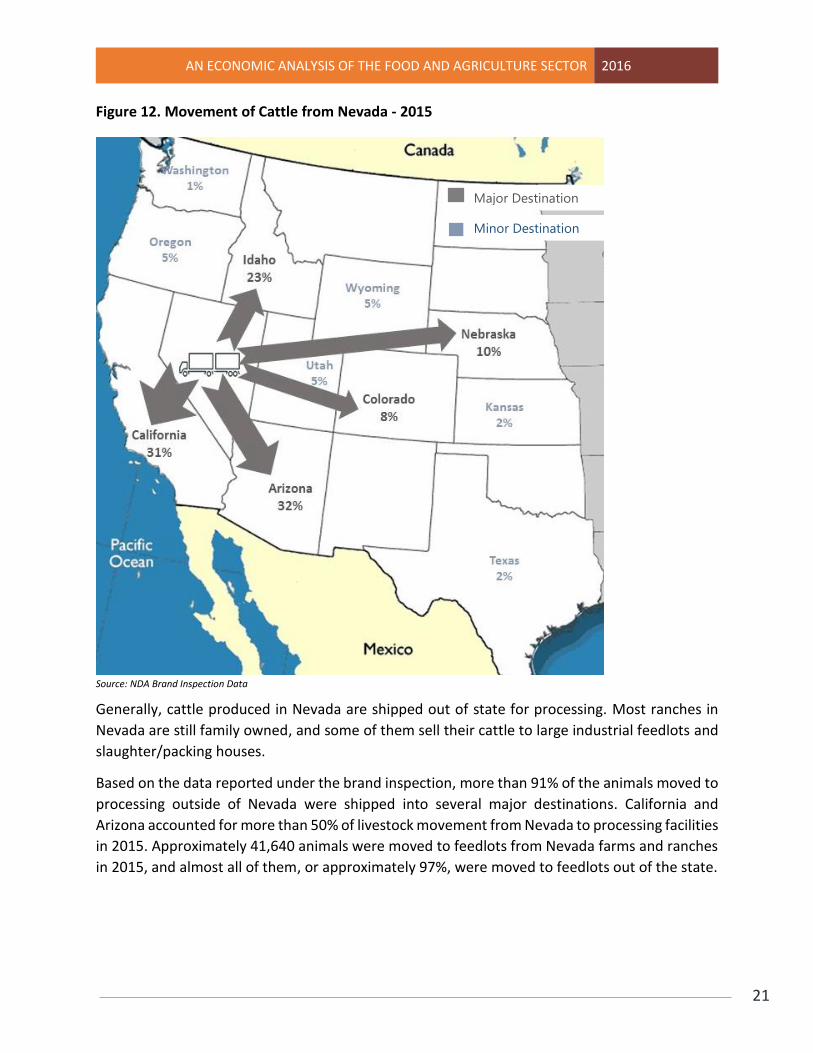
California and Idaho accounted for approximately 54% of all cattle movement from Nevada in
2015 (Figure 12). Five counties, Elko, Lyon, Humboldt, Churchill, and Nye, shipped more than 70%
of all animals directly to these destinations. These counties also account for more than 70% of
the livestock population in Nevada9 and for the majority of the transportation needs.
8 Total number do not include cattle movement within the Nevada 9 Census of Agriculture, Nevada 2015
AN ECONOMIC ANALYSIS OF THE FOOD AND AGRICULTURE SECTOR 2016
21
Figure 12. Movement of Cattle from Nevada - 2015
Source: NDA Brand Inspection Data
Generally, cattle produced in Nevada are shipped out of state for processing. Most ranches in
Nevada are still family owned, and some of them sell their cattle to large industrial feedlots and
slaughter/packing houses.
Based on the data reported under the brand inspection, more than 91% of the animals moved to
processing outside of Nevada were shipped into several major destinations. California and
Arizona accounted for more than 50% of livestock movement from Nevada to processing facilities
in 2015. Approximately 41,640 animals were moved to feedlots from Nevada farms and ranches
in 2015, and almost all of them, or approximately 97%, were moved to feedlots out of the state.
Major Destination
Minor Destination
AN ECONOMIC ANALYSIS OF THE FOOD AND AGRICULTURE SECTOR 2016
22
Economic Impact of the Cattle and Calf Industry
Direct economic impacts are expenditures an industry makes in the local economy. For the
livestock industry, the direct impacts of the industry include all expenditures made to produce
meat. These include livestock purchases from ranchers, building and equipment purchases,
utilities, and management and labor costs. For example, in 2014 expenses for feed purchases
were $119.8 million, which accounts for the largest intermediate production expense.
Indirect economic impacts are expenditures made by firms that sell goods and/or services to
livestock processors. Examples include trucking firms, equipment manufacturers, suppliers,
veterinary services, and financial institutions. Payroll expenses for these firms are also part of the
indirect impacts.
There are few aspects of services involved in the transportation of livestock from Nevada to listed
destinations:
the physical movement of cattle from Nevada ranches to a selected destination
the service and care necessary to bring cattle safely to a determined destination with
minimal losses due to death or injury
suitable and available trucks or rail transportation at particular time and close to places
where it is needed
Nevada shippers of livestock, as well as trucking companies, have to take into consideration all
of these factors as part of their cost when hauling livestock interstate or instate. Most livestock
transportation is done by trucks, and many different kinds of equipment are used for
transportation – from small short bed farm trucks and stock trailers to highly specialized and
modified equipment – designed for livestock hauling. This equipment, specially designed and
modified to haul livestock is costly, and some of it is not easily adapted to haul anything else but
livestock. Total expenses for marketing, storage and transportation that Nevada ranches had,
that include hauling of livestock was $18.7 million in 2014, showing a significant year over year
increase compared to $13.1 million in 2013.
All these activities, when applied, provide an estimate of the overall economic impact, household
earnings, and jobs supported in Nevada by the cattle and calf industry. In 2014, considering only
direct impact, the cattle and calf industry generated an estimated $466 million in total sales,
providing 1,803 jobs and paying over $69 million in labor income (Table 8).
AN ECONOMIC ANALYSIS OF THE FOOD AND AGRICULTURE SECTOR 2016
23
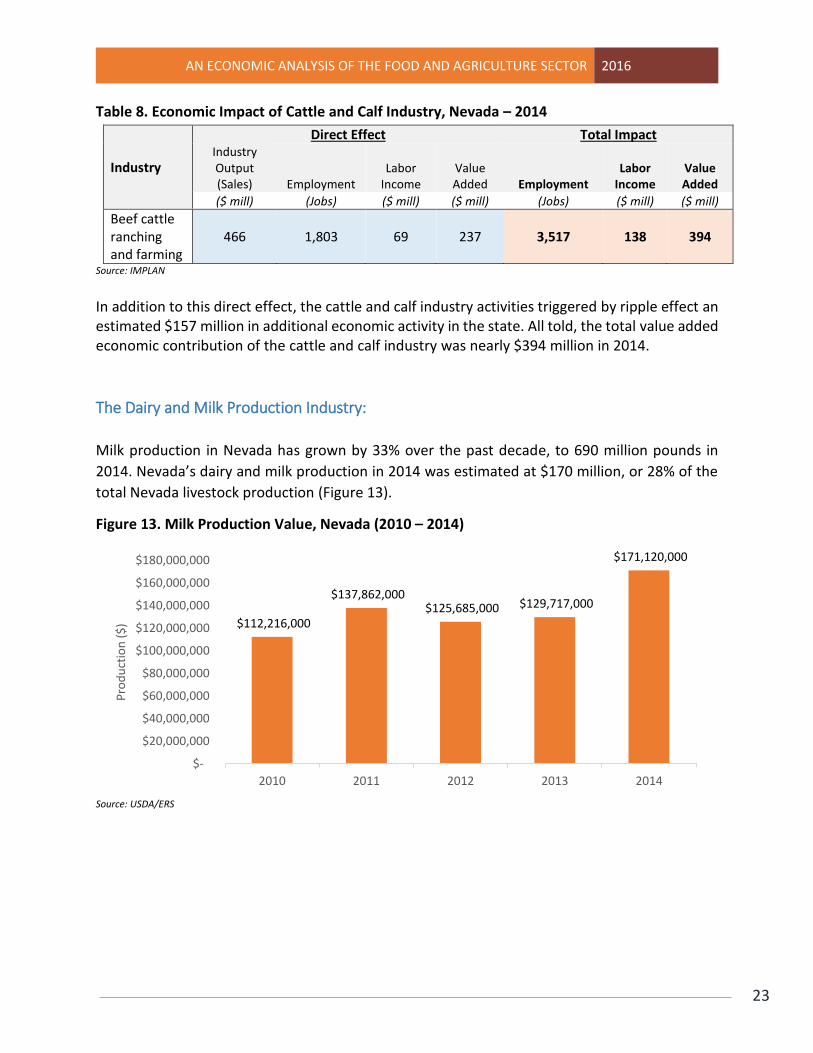
Table 8. Economic Impact of Cattle and Calf Industry, Nevada – 2014
Industry
Direct Effect Total Impact Industry Output (Sales) Employment
Labor Income
Value Added Employment
Labor Income
Value Added
($ mill) (Jobs) ($ mill) ($ mill) (Jobs) ($ mill) ($ mill)
Beef cattle ranching and farming
466 1,803 69 237 3,517 138 394
Source: IMPLAN
In addition to this direct effect, the cattle and calf industry activities triggered by ripple effect an estimated $157 million in additional economic activity in the state. All told, the total value added economic contribution of the cattle and calf industry was nearly $394 million in 2014.
The Dairy and Milk Production Industry:
Milk production in Nevada has grown by 33% over the past decade, to 690 million pounds in
2014. Nevada’s dairy and milk production in 2014 was estimated at $170 million, or 28% of the
total Nevada livestock production (Figure 13).
Figure 13. Milk Production Value, Nevada (2010 – 2014)
Source: USDA/ERS
$112,216,000
$137,862,000 $125,685,000 $129,717,000
$171,120,000
$-
$20,000,000
$40,000,000
$60,000,000
$80,000,000
$100,000,000
$120,000,000
$140,000,000
$160,000,000
$180,000,000
2010 2011 2012 2013 2014
Pro
du
ctio
n (
$)
AN ECONOMIC ANALYSIS OF THE FOOD AND AGRICULTURE SECTOR 2016
24
Economic Impact of the Dairy and Milk Production Industry
In 2014, considering only direct impact, the dairy and milk production industry generated an estimated $168 million in total sales, providing 469 jobs and paying over $39 million in labor income (Table 9).
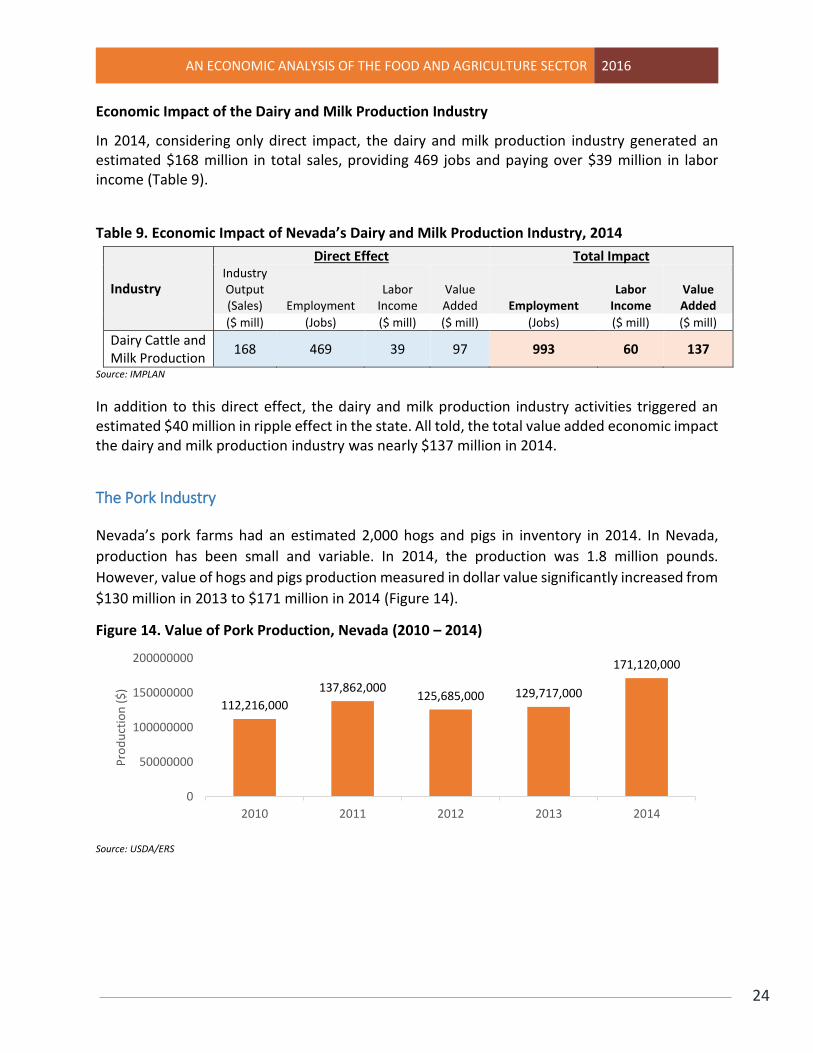
Table 9. Economic Impact of Nevada’s Dairy and Milk Production Industry, 2014
Industry
Direct Effect Total Impact Industry Output (Sales) Employment
Labor Income
Value Added Employment
Labor Income
Value Added
($ mill) (Jobs) ($ mill) ($ mill) (Jobs) ($ mill) ($ mill)
Dairy Cattle and Milk Production
168 469 39 97 993 60 137
Source: IMPLAN
In addition to this direct effect, the dairy and milk production industry activities triggered an estimated $40 million in ripple effect in the state. All told, the total value added economic impact the dairy and milk production industry was nearly $137 million in 2014.
The Pork Industry
Nevada’s pork farms had an estimated 2,000 hogs and pigs in inventory in 2014. In Nevada,
production has been small and variable. In 2014, the production was 1.8 million pounds.
However, value of hogs and pigs production measured in dollar value significantly increased from
$130 million in 2013 to $171 million in 2014 (Figure 14).
Figure 14. Value of Pork Production, Nevada (2010 – 2014)
Source: USDA/ERS
112,216,000
137,862,000125,685,000 129,717,000
171,120,000
0
50000000
100000000
150000000
200000000
2010 2011 2012 2013 2014
Pro
du
ctio
n (
$)
AN ECONOMIC ANALYSIS OF THE FOOD AND AGRICULTURE SECTOR 2016
25
Plant Industry
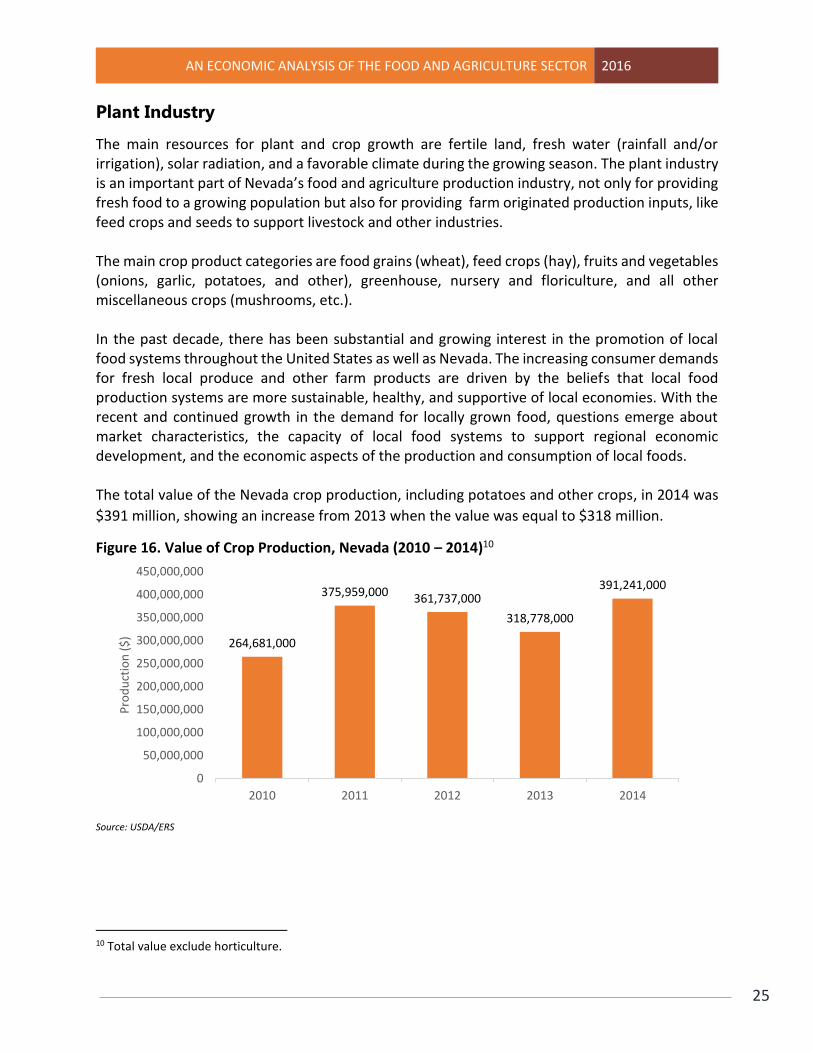
The main resources for plant and crop growth are fertile land, fresh water (rainfall and/or irrigation), solar radiation, and a favorable climate during the growing season. The plant industry is an important part of Nevada’s food and agriculture production industry, not only for providing fresh food to a growing population but also for providing farm originated production inputs, like feed crops and seeds to support livestock and other industries. The main crop product categories are food grains (wheat), feed crops (hay), fruits and vegetables (onions, garlic, potatoes, and other), greenhouse, nursery and floriculture, and all other miscellaneous crops (mushrooms, etc.). In the past decade, there has been substantial and growing interest in the promotion of local food systems throughout the United States as well as Nevada. The increasing consumer demands for fresh local produce and other farm products are driven by the beliefs that local food production systems are more sustainable, healthy, and supportive of local economies. With the recent and continued growth in the demand for locally grown food, questions emerge about market characteristics, the capacity of local food systems to support regional economic development, and the economic aspects of the production and consumption of local foods. The total value of the Nevada crop production, including potatoes and other crops, in 2014 was
$391 million, showing an increase from 2013 when the value was equal to $318 million.
Figure 16. Value of Crop Production, Nevada (2010 – 2014)10
Source: USDA/ERS
10 Total value exclude horticulture.
264,681,000
375,959,000 361,737,000
318,778,000
391,241,000
0
50,000,000
100,000,000
150,000,000
200,000,000
250,000,000
300,000,000
350,000,000
400,000,000
450,000,000
2010 2011 2012 2013 2014
Pro
du
ctio
n (
$)
AN ECONOMIC ANALYSIS OF THE FOOD AND AGRICULTURE SECTOR 2016
26
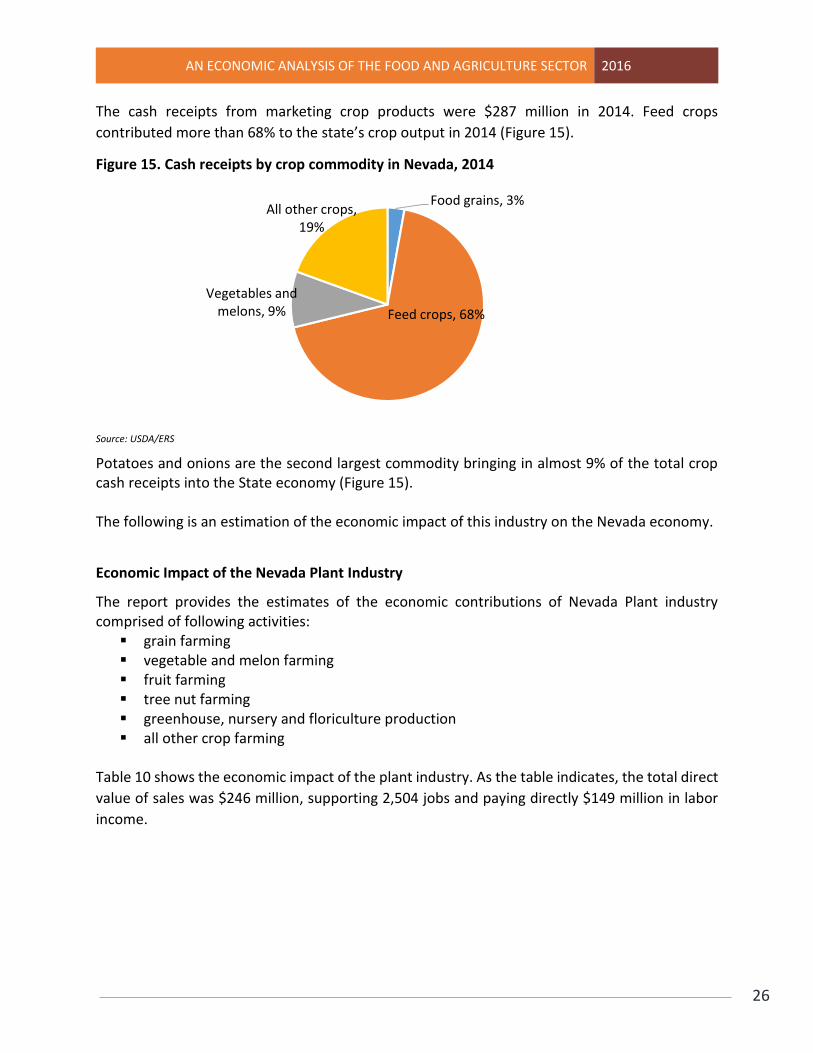
The cash receipts from marketing crop products were $287 million in 2014. Feed crops
contributed more than 68% to the state’s crop output in 2014 (Figure 15).
Figure 15. Cash receipts by crop commodity in Nevada, 2014
Source: USDA/ERS
Potatoes and onions are the second largest commodity bringing in almost 9% of the total crop cash receipts into the State economy (Figure 15). The following is an estimation of the economic impact of this industry on the Nevada economy.
Economic Impact of the Nevada Plant Industry
The report provides the estimates of the economic contributions of Nevada Plant industry comprised of following activities:
grain farming vegetable and melon farming fruit farming tree nut farming greenhouse, nursery and floriculture production all other crop farming
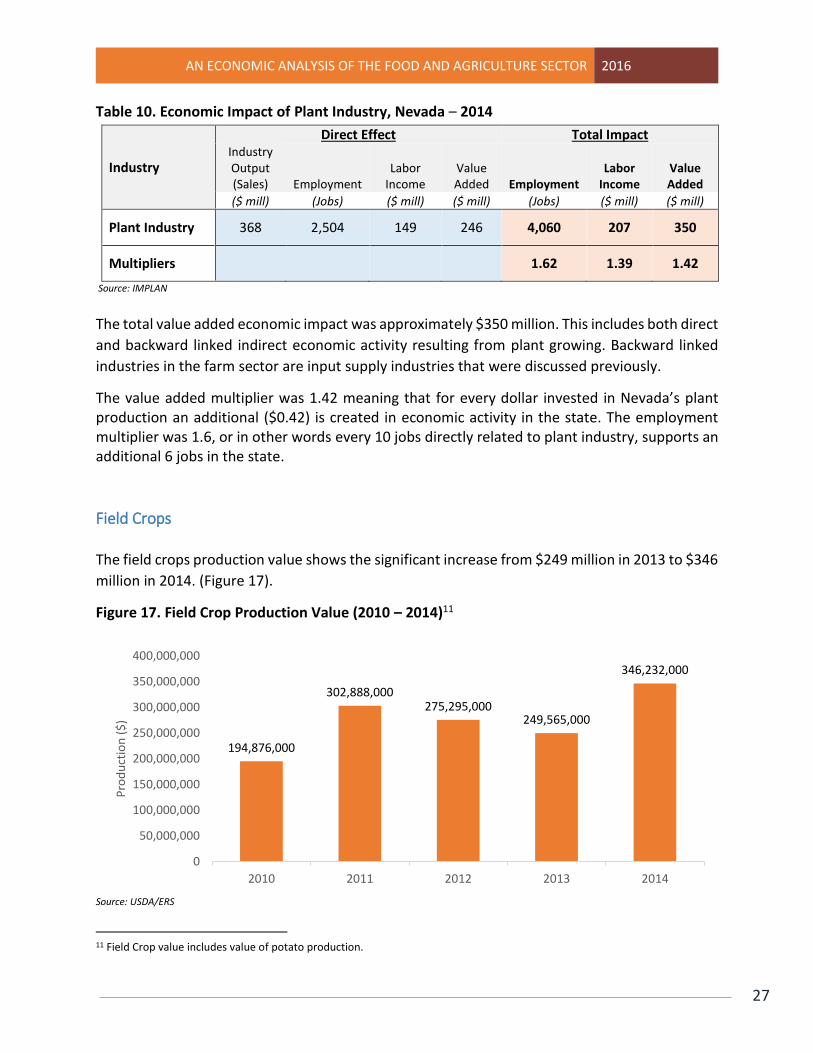
Table 10 shows the economic impact of the plant industry. As the table indicates, the total direct
value of sales was $246 million, supporting 2,504 jobs and paying directly $149 million in labor
income.
Food grains, 3%
Feed crops, 68%
Vegetables and melons, 9%
All other crops, 19%
AN ECONOMIC ANALYSIS OF THE FOOD AND AGRICULTURE SECTOR 2016
27
Table 10. Economic Impact of Plant Industry, Nevada – 2014
Industry
Direct Effect Total Impact Industry Output (Sales) Employment
Labor Income
Value Added Employment
Labor Income
Value Added
($ mill) (Jobs) ($ mill) ($ mill) (Jobs) ($ mill) ($ mill)
Plant Industry 368 2,504 149 246 4,060 207 350
Multipliers 1.62 1.39 1.42
Source: IMPLAN
The total value added economic impact was approximately $350 million. This includes both direct
and backward linked indirect economic activity resulting from plant growing. Backward linked
industries in the farm sector are input supply industries that were discussed previously.
The value added multiplier was 1.42 meaning that for every dollar invested in Nevada’s plant production an additional ($0.42) is created in economic activity in the state. The employment multiplier was 1.6, or in other words every 10 jobs directly related to plant industry, supports an additional 6 jobs in the state.
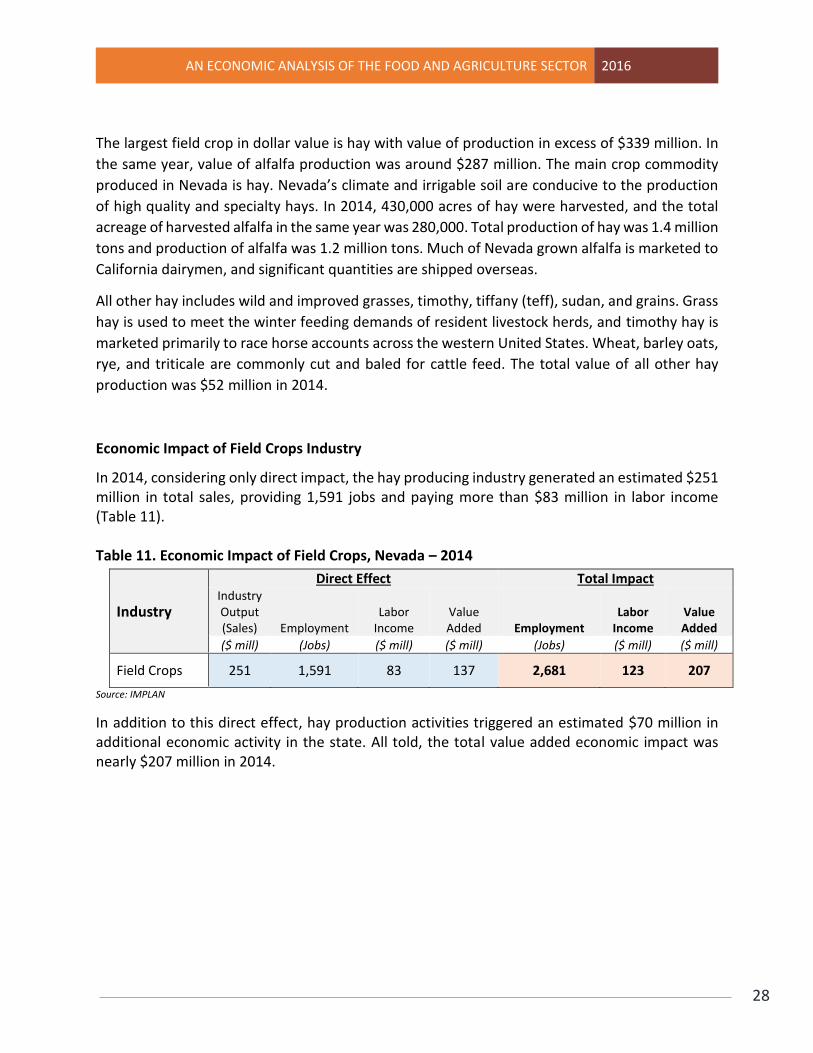
Field Crops The field crops production value shows the significant increase from $249 million in 2013 to $346
million in 2014. (Figure 17).
Figure 17. Field Crop Production Value (2010 – 2014)11
Source: USDA/ERS
11 Field Crop value includes value of potato production.
194,876,000
302,888,000275,295,000
249,565,000
346,232,000
0
50,000,000
100,000,000
150,000,000
200,000,000
250,000,000
300,000,000
350,000,000
400,000,000
2010 2011 2012 2013 2014
Pro
du
ctio
n (
$)
AN ECONOMIC ANALYSIS OF THE FOOD AND AGRICULTURE SECTOR 2016
28
The largest field crop in dollar value is hay with value of production in excess of $339 million. In
the same year, value of alfalfa production was around $287 million. The main crop commodity
produced in Nevada is hay. Nevada’s climate and irrigable soil are conducive to the production
of high quality and specialty hays. In 2014, 430,000 acres of hay were harvested, and the total
acreage of harvested alfalfa in the same year was 280,000. Total production of hay was 1.4 million
tons and production of alfalfa was 1.2 million tons. Much of Nevada grown alfalfa is marketed to
California dairymen, and significant quantities are shipped overseas.
All other hay includes wild and improved grasses, timothy, tiffany (teff), sudan, and grains. Grass
hay is used to meet the winter feeding demands of resident livestock herds, and timothy hay is
marketed primarily to race horse accounts across the western United States. Wheat, barley oats,
rye, and triticale are commonly cut and baled for cattle feed. The total value of all other hay
production was $52 million in 2014.
Economic Impact of Field Crops Industry
In 2014, considering only direct impact, the hay producing industry generated an estimated $251 million in total sales, providing 1,591 jobs and paying more than $83 million in labor income (Table 11). Table 11. Economic Impact of Field Crops, Nevada – 2014
Industry
Direct Effect Total Impact Industry Output (Sales) Employment
Labor Income
Value Added Employment
Labor Income
Value Added
($ mill) (Jobs) ($ mill) ($ mill) (Jobs) ($ mill) ($ mill)
Field Crops 251 1,591 83 137 2,681 123 207
Source: IMPLAN
In addition to this direct effect, hay production activities triggered an estimated $70 million in additional economic activity in the state. All told, the total value added economic impact was nearly $207 million in 2014.

AN ECONOMIC ANALYSIS OF THE FOOD AND AGRICULTURE SECTOR 2016
29
Fruit and Vegetables Production
Fruit and vegetable production in Nevada is limited by climate, but specific regions of Nevada
have proven favorable for fruit and vegetable crops like melons, potatoes, onions, and garlic. The
state is a producer of many specific categories of vegetables. However, the state’s leading
commodities are potatoes, garlic, and onions. Nevada’s onions are primarily produced for fresh
market use, and Nevada garlic is used primarily for seed, although some is also dehydrated. Most
of the acreage planted for these crops are in Lyon County.
The value of onion production in 2014 was approximately $11 million, and the value of garlic
production for the same year was $2 million. Along with onions and garlic, potatoes are another
important row crop in Nevada. Warm days, cold nights, and quality soil provide excellent growing
conditions for potatoes. The value of potato production was $12 million, according to 2014 data.
Fruit and nut tree production as well as many other vegetables and fruits were produced in the
state but their production is small, and for that reason the value of production is in the “other”
category. Fruits and vegetables grown by local producers were tomatoes, lettuce, peppers,
onions, garlic, berries, and apples. Additional products, like pomegranate, melons, pumpkins,
asparagus, eggplant, carrots, basil, peaches, eggs, and microgreens are also grown in Nevada.
With sales of $24.6 million in 2014, locally marketed food through both direct and intermediated
channels accounted for only 2.8% of total annual food sales. Unfortunately, sales numbers are
showing a decrease over time. A significant decrease was seen in the period between 2011 and
2012 and that could be partially explained due to dry climate and lack of water resources during
those years (Figure 18).
Figure 18. Fruits and Vegetable Production Value (2010 – 2014)
Source: USDA ERS
$88,052.00 $97,740.00
$39,001.00 $29,890.00
$24,580.00
$-
$20,000.00
$40,000.00
$60,000.00
$80,000.00
$100,000.00
$120,000.00
2010 2011 2012 2013 2014
Pro
du
ctio
n (
$)
AN ECONOMIC ANALYSIS OF THE FOOD AND AGRICULTURE SECTOR 2016
30
While most locally produced fruits and vegetables are sold through intermediated markets by large farms in large quantities, the majority of producers supplying local food are small farms, selling through direct markets. In recent decades, these direct markets have experienced substantial growth, representing an important market opportunity for producers. Direct markets are not only more accessible to small producers but can also present distinct advantages over intermediated markets. As noted, most farms that produce local food are small farms working directly with buyers. Small producers sell on site, to restaurants, or at farmers markets. Some small producers sell to retail stores, and a small percentage of them sell to institutional buyers (e.g., senior living facilities). A majority of producers connect with their buyers through personal relationships and over the phone; however farmers markets and community events are another important connection with buyers. Large farms that supply in great quantity – and generally through intermediated markets – account for the majority of the total sales volume, but for small producers, direct marketing tends to be the most profitable – with a combination of direct market outlets allowing optimization of produce sales. In terms of relative sales volume, more than 50% of farms that supply local food are small farms with gross annual sales below $10,000; however, these farms account for approximately 1% of total sales. Meanwhile, large farms with annual gross sales of $500,000 or more and distribution through intermediated markets represent only 6% of all farms producing local foods, but they account for more than 70% of local food sales.12 There are approximately 175 small farm producers certified in Nevada by the Nevada Department of Agriculture. A majority, or 61% of these small producers, are located in two metropolitan areas; Washoe and Clark County. Of these small farm producers, 27% are located in the 3 rural counties of Lyon, Churchill, and Nye County. In certain regions, especially urban areas like Las Vegas, of the state, demand for local food is greater than supply today. This suggests a significant market potential for producers of locally marketed foods. Local supply – through direct and intermediated markets – meets only a small portion of total demand for food products. But selling food products through local supply chains enables farmers to capture a greater share of retail prices, even when accounting for additional costs. Direct marketing channels, especially important for small-scale farmers, offer an accessible market compared to wholesale purchasers preferences for high volume production.
12 USDA/National Agriculture Statistics Services.

AN ECONOMIC ANALYSIS OF THE FOOD AND AGRICULTURE SECTOR 2016
31
Economic Impact of the Fruit and Vegetable Industry
The report provides estimates of economic contributions of the fruit and vegetable industry and is comprised of the following activities:
vegetable and melon farming fruit farming tree nut farming
In 2014, considering only direct impact, the fruit and vegetable production industry generated an estimated $71 million in total sales, providing 494 jobs and paying $40 million in labor income (Table 12).
Table 12. Economic Impact of Fruit and Vegetable production, Nevada – 2014
Industry
Direct Effect Total Impact Industry Output (Sales) Employment
Labor Income
Value Added Employment
Labor Income
Value Added
($ mill) (Jobs) ($ mill) ($ mill) (Jobs) ($ mill) ($ mill)
Fruit and Vegetable Production Industry
71 494 40 69 779 50 90
Source: IMPLAN
In addition to this direct effect, fruit and vegetable production triggered an estimated $21 million in additional economic activity in the state. The total value added economic contribution of this industry was nearly $90 million in 2014.
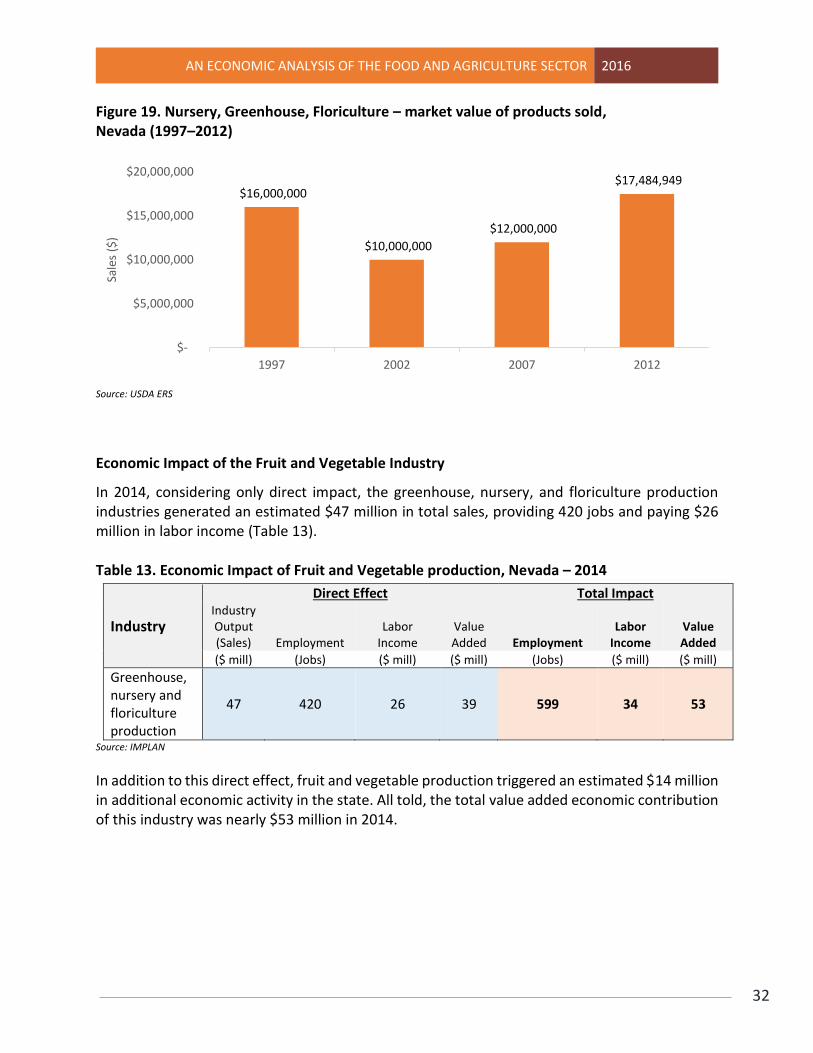
Greenhouse, Nursery, and Floriculture Production Greenhouse and nursery crops are sometimes an overlooked category when it comes to traditional agriculture production. These crops are typically grown in greenhouses and nurseries, and they are grown mostly for residential and commercial landscaping, gardening, or indoor use. Growing food under cover or indoors is becoming a popular method of crop production. Growth in urban areas of the state has provided a demand base for these crops. These crops are considered high value crops, and they usually do not require significant land. However, they do require a significant amount of water, fertilizers, and pesticides so their production could be considered fairly capital intensive. The estimated operating expenses; value of green house, nursery, and horticulture production in 2014 was $28.3 million. The estimated market value of products sold in the same year was $17.5 million in 2012 (Figure 19).
AN ECONOMIC ANALYSIS OF THE FOOD AND AGRICULTURE SECTOR 2016
32
Figure 19. Nursery, Greenhouse, Floriculture – market value of products sold, Nevada (1997–2012)
Source: USDA ERS
Economic Impact of the Fruit and Vegetable Industry
In 2014, considering only direct impact, the greenhouse, nursery, and floriculture production industries generated an estimated $47 million in total sales, providing 420 jobs and paying $26 million in labor income (Table 13).
Table 13. Economic Impact of Fruit and Vegetable production, Nevada – 2014
Industry
Direct Effect Total Impact Industry Output (Sales) Employment
Labor Income
Value Added Employment
Labor Income
Value Added
($ mill) (Jobs) ($ mill) ($ mill) (Jobs) ($ mill) ($ mill)
Greenhouse, nursery and floriculture production
47 420 26 39 599 34 53
Source: IMPLAN
In addition to this direct effect, fruit and vegetable production triggered an estimated $14 million in additional economic activity in the state. All told, the total value added economic contribution of this industry was nearly $53 million in 2014.
$16,000,000
$10,000,000
$12,000,000
$17,484,949
$-
$5,000,000
$10,000,000
$15,000,000
$20,000,000
1997 2002 2007 2012
Sale
s ($
)
AN ECONOMIC ANALYSIS OF THE FOOD AND AGRICULTURE SECTOR 2016
33
Food and Agriculture Manufacturing and Processing Industry
The next step along the supply chain from the farm level is food processing and manufacturing. There is a wide range of activities carried out by the food processors and manufacturers in the state. In 2014, Nevada was home to 252 private food and manufacturing establishments, receiving approximately $3.1 million for their output.
The top 5 food producing industries when it comes to number of establishments are:
1. retail bakeries 2. perishable prepared food manufacturing 3. commercial bakeries 4. coffee and tea manufacturing 5. confectionery manufacturing from purchased chocolate
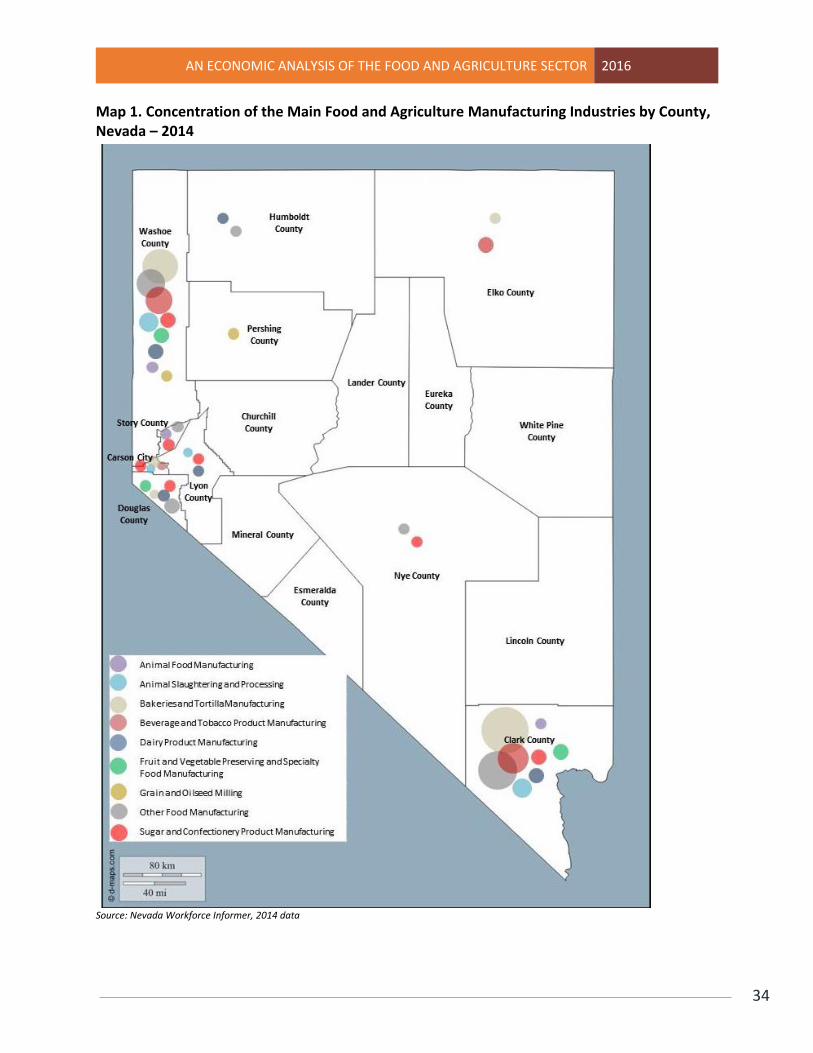
Map 1 represents the concentration of food and manufacturing establishment in Nevada by county. The largest concentration of food and manufacturing and processing industry establishments is evident in two major urban counties, Washoe and Clark County. Those two counties have the largest population, and they are also the major markets for food and agriculture products creating more than 80% of the food demand in the state. The importance of bread and bakery product entrepreneurs can be seen in the size of the bread and bakery production industry in the state which accounts for more than $368 million in industry sales. The size of the Nevada dairy industry is reflected in the size of the fluid milk industry, and the production of other dairy products with total industry sales of $278 million in 2014. Another important industry in the state, reflected by its size, is the ice cream and frozen dessert manufacturing industry totaling $251 million in production value. Employment in the food and agriculture manufacturing and processing industries is estimated to be 8,207 jobs which accounted for 0.52% of the total state employment and paid $350 million in labor income. When it comes to employment numbers, the bread and bakery production hired a total of 3,249 jobs accounting for the 40% of total food manufacturing industry employment. The top 3 food processing industries based on the number of employment are as follows:
bread and bakery product, except frozen, manufacturing all other food manufacturing ice cream and frozen dessert manufacturing
Map 1 also shows the concentration of major food and manufacturing industry groups by different counties in Nevada. It is evident that the majority of food manufacturing and processing is located in urban areas. The rural counties with the most food manufacturing facilities are Storey, Carson, Douglas, and Lyon County.
AN ECONOMIC ANALYSIS OF THE FOOD AND AGRICULTURE SECTOR 2016
34
Map 1. Concentration of the Main Food and Agriculture Manufacturing Industries by County, Nevada – 2014
Source: Nevada Workforce Informer, 2014 data
AN ECONOMIC ANALYSIS OF THE FOOD AND AGRICULTURE SECTOR 2016
35
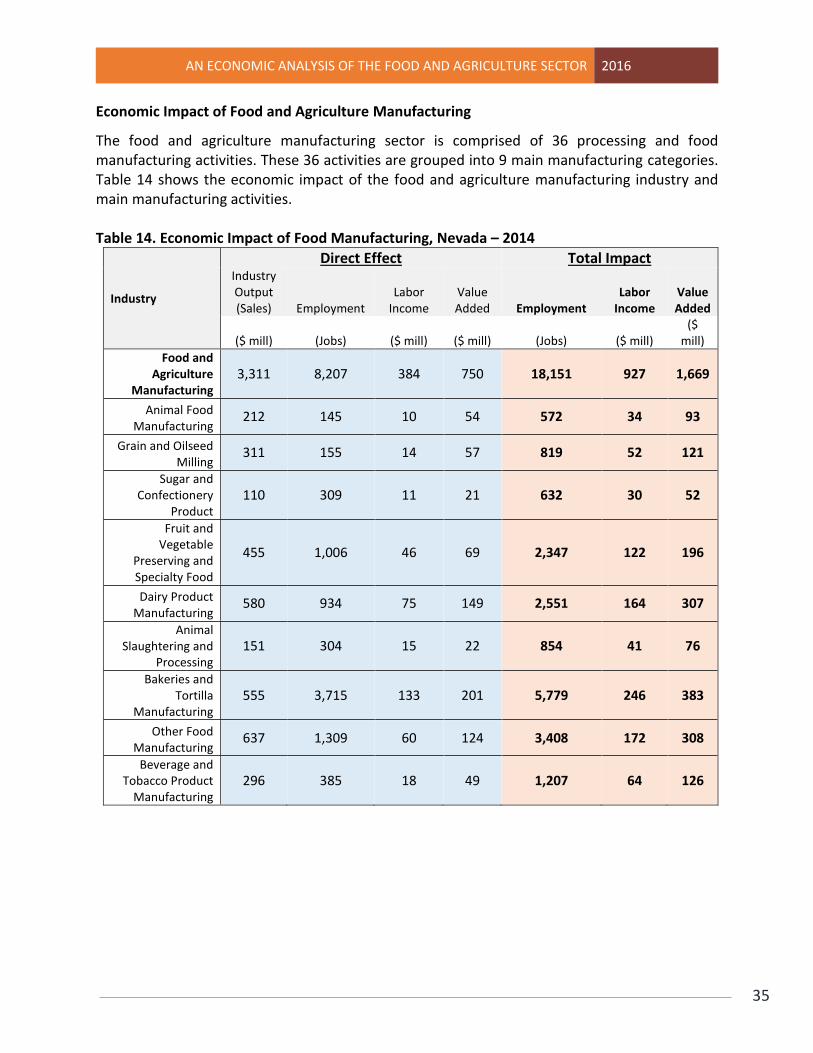
Economic Impact of Food and Agriculture Manufacturing
The food and agriculture manufacturing sector is comprised of 36 processing and food manufacturing activities. These 36 activities are grouped into 9 main manufacturing categories. Table 14 shows the economic impact of the food and agriculture manufacturing industry and main manufacturing activities. Table 14. Economic Impact of Food Manufacturing, Nevada – 2014
Industry
Direct Effect Total Impact Industry Output (Sales) Employment
Labor Income
Value Added Employment
Labor Income
Value Added
($ mill) (Jobs) ($ mill) ($ mill) (Jobs) ($ mill) ($
mill)
Food and Agriculture
Manufacturing 3,311 8,207 384 750 18,151 927 1,669
Animal Food Manufacturing
212 145 10 54 572 34 93
Grain and Oilseed Milling
311 155 14 57 819 52 121
Sugar and Confectionery
Product 110 309 11 21 632 30 52
Fruit and Vegetable
Preserving and Specialty Food
455 1,006 46 69 2,347 122 196
Dairy Product Manufacturing
580 934 75 149 2,551 164 307
Animal Slaughtering and
Processing 151 304 15 22 854 41 76
Bakeries and Tortilla
Manufacturing 555 3,715 133 201 5,779 246 383
Other Food Manufacturing
637 1,309 60 124 3,408 172 308
Beverage and Tobacco Product
Manufacturing 296 385 18 49 1,207 64 126
AN ECONOMIC ANALYSIS OF THE FOOD AND AGRICULTURE SECTOR 2016
36
Food Retailing & Restaurants
Most of the value added in the food and agriculture system is a result of activities in food
wholesaling and retailing. Food products are sold virtually everywhere: gas stations, club stores,
bookstores, golf courses, and bowling alleys to name a few. Consumers in this category are
buyers of agriculture products, whether they used them in their restaurants, or sell them as part
of their retail/wholesale operations.
The products these markets are sourcing locally are onions, garlic, potatoes, tomatoes, lettuce,
melons, peppers, herbs, and microgreens, as well as local beef, pork, lamb, and chicken. They
also purchase local dairy and milk products, as well as seeds, nursery products, flowers, etc. The
food buyers – which include distributors, retail, and restaurants – show increasing interest in
purchasing locally produced foods. However, a number of common barriers in supply chains limit
the volume of such purchases and prevent greater penetration of locally produced food in
conventional markets.
These barriers involve the need for consistency of supply, high product volume, descriptive
product information and labels for produces, distribution logistics, and the means to connect
with suppliers. Wholesale and retail food buyers also see trust as an important factor in building
supply chains for local food.
In 2014, there were 1,255 retail establishment and wholesalers selling food and beverage
products, and 5,386 full service, limited service, and other food and drinking places. Counties
with the largest number of these establishments are the two metropolitan areas – Reno/Sparks
and Las Vegas – due to the largest number of population.
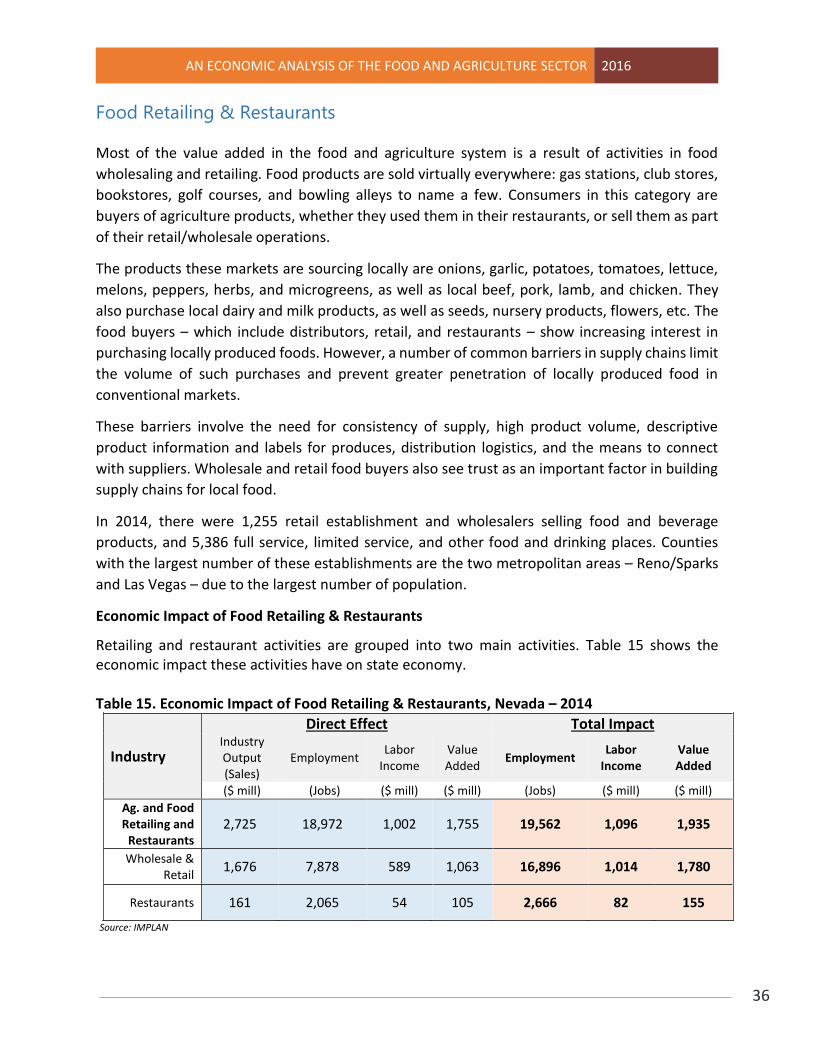
Economic Impact of Food Retailing & Restaurants
Retailing and restaurant activities are grouped into two main activities. Table 15 shows the economic impact these activities have on state economy. Table 15. Economic Impact of Food Retailing & Restaurants, Nevada – 2014
Industry
Direct Effect Total Impact Industry Output (Sales)
Employment Labor
Income Value Added
Employment Labor
Income Value Added
($ mill) (Jobs) ($ mill) ($ mill) (Jobs) ($ mill) ($ mill)
Ag. and Food Retailing and
Restaurants 2,725 18,972 1,002 1,755 19,562 1,096 1,935
Wholesale & Retail
1,676 7,878 589 1,063 16,896 1,014 1,780
Restaurants 161 2,065 54 105 2,666 82 155
Source: IMPLAN
AN ECONOMIC ANALYSIS OF THE FOOD AND AGRICULTURE SECTOR 2016
37
The restaurant and food retail industry is the largest private employers in Nevada within the food
and agriculture sector. Retail directly and indirectly supports 18,972 jobs, provides $1 million in
labor income, and contributes $2.7 million annually to Nevada’s GDP. The figures for these
activities were estimated using IMPLAN.
However, employment in retailing and restaurants is extremely difficult to estimate.
Furthermore, much of the employment at the retail and restaurants level is part-time. This is
especially true for those employed in the food service industry. Conversely, not all purchases at
grocery stores or other traditional food outlets are spent on food products.
Food retailing & restaurants continue to power our state economy and create opportunities for producers within the food and agriculture sector to grow their production as well as our state economy.
AN ECONOMIC ANALYSIS OF THE FOOD AND AGRICULTURE SECTOR 2016
38
Conclusions
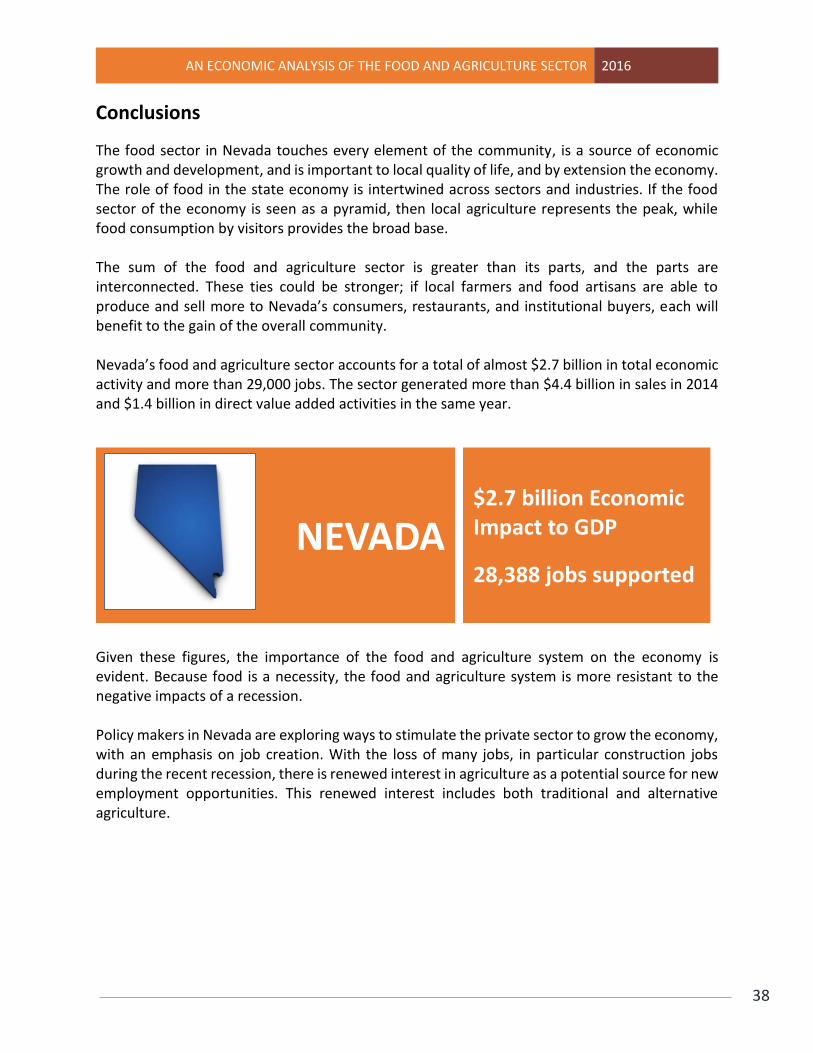
The food sector in Nevada touches every element of the community, is a source of economic growth and development, and is important to local quality of life, and by extension the economy. The role of food in the state economy is intertwined across sectors and industries. If the food sector of the economy is seen as a pyramid, then local agriculture represents the peak, while food consumption by visitors provides the broad base. The sum of the food and agriculture sector is greater than its parts, and the parts are interconnected. These ties could be stronger; if local farmers and food artisans are able to produce and sell more to Nevada’s consumers, restaurants, and institutional buyers, each will benefit to the gain of the overall community. Nevada’s food and agriculture sector accounts for a total of almost $2.7 billion in total economic activity and more than 29,000 jobs. The sector generated more than $4.4 billion in sales in 2014 and $1.4 billion in direct value added activities in the same year. Given these figures, the importance of the food and agriculture system on the economy is evident. Because food is a necessity, the food and agriculture system is more resistant to the negative impacts of a recession. Policy makers in Nevada are exploring ways to stimulate the private sector to grow the economy, with an emphasis on job creation. With the loss of many jobs, in particular construction jobs during the recent recession, there is renewed interest in agriculture as a potential source for new employment opportunities. This renewed interest includes both traditional and alternative agriculture.
NEVADA $2.7 billion Economic Impact to GDP
28,388 jobs supported

AN ECONOMIC ANALYSIS OF THE FOOD AND AGRICULTURE SECTOR 2016
39
Also with the recent and continued growth in the demand for locally grown food, questions emerge about market characteristics, the capacity of local food systems to support regional economic development, and the economic aspects of the production and consumption of local foods. Strong demand creates substantial room for growth and economic development in the local food sector. Further expanding demand and growing supply will yield much greater overall economic activity in this sector. Locally-produced food has larger multiplier effects than food “imported” from outside the region that is consumed in Nevada. Local production and processing/manufacturing means that more money stays in the region than would otherwise be the case, yielding a larger overall local economic impact (roughly two to one). Expansion of cost-competitive agriculture, as well as increased food-related processing and production, should be an economic development target.

AN ECONOMIC ANALYSIS OF THE FOOD AND AGRICULTURE SECTOR 2016
40
Glossary of Economic Terms
Terms Definition
Direct Impacts Direct impacts are the economic impacts of an industry that are due to changes to front end businesses that receive expenses or operating revenue as a direct consequence of an industry. Direct impacts are related to original purchases or “direct sales” from primary suppliers.
Indirect Impacts Indirect impacts are due to changes in the activity of an industry’s suppliers. Indirect impacts include the spending that cattle producer’s suppliers make when purchasing goods and services from their own suppliers (i.e. secondary suppliers) in order to meet the demand generated by the cattle industry.
Induced Impacts Induced impacts are due to shifts in spending on goods and services as a consequence of the payroll of the directly and indirectly affected businesses. In the case of cattle production, induced impacts reflect the additional spending by the employees of the cattle producers’ suppliers (primary suppliers) and their suppliers’ suppliers (secondary suppliers).
GDP GDP is the “value added” to the economy (the unduplicated total value of goods and services).
Output Output represents the value of industry production. In IMPLAN, these are annual production estimates for the year of the data set and are in producer prices. For manufacturers this would be sales plus/minus change in inventory. For service sectors production equals sales. For retail and wholesale trade, output equals gross margin and not gross sales.
Output Multipliers Derived from the I-O total requirements tables, the output multipliers show the amount of output required to satisfy a given level of final-use expenditures. For the commodity-by-commodity total requirements table, it is the production required both directly and indirectly of the commodity at the beginning of each row per dollar of delivery to final use of the commodity at the top of the column. For the industry-by-commodity total requirements table, it is the industry output required to deliver a dollar of a commodity to final users. For the industry-by-industry total requirements table, it is the industry output required to deliver a dollar of industry output to final users. (BEA)
Employment A job in IMPLAN equals the annual average of monthly jobs in that industry (this is the same definition used by QCEW, BLS, and BEA nationally). A job can be either full-time or part-time.

AN ECONOMIC ANALYSIS OF THE FOOD AND AGRICULTURE SECTOR 2016
41
Employment multipliers
I-O multipliers used to estimate the total number of jobs (both full-time and part-time) throughout the economy that are needed, directly and indirectly, to deliver $1 million of final demand for a specific commodity. (BEA)
Labor Income All forms of employment income, including Employee Compensation (wages and benefits) and Proprietor Income.
AN ECONOMIC ANALYSIS OF THE FOOD AND AGRICULTURE SECTOR 2016
42
Appendices
Appendix 1 – Economic Impact Analysis Approach
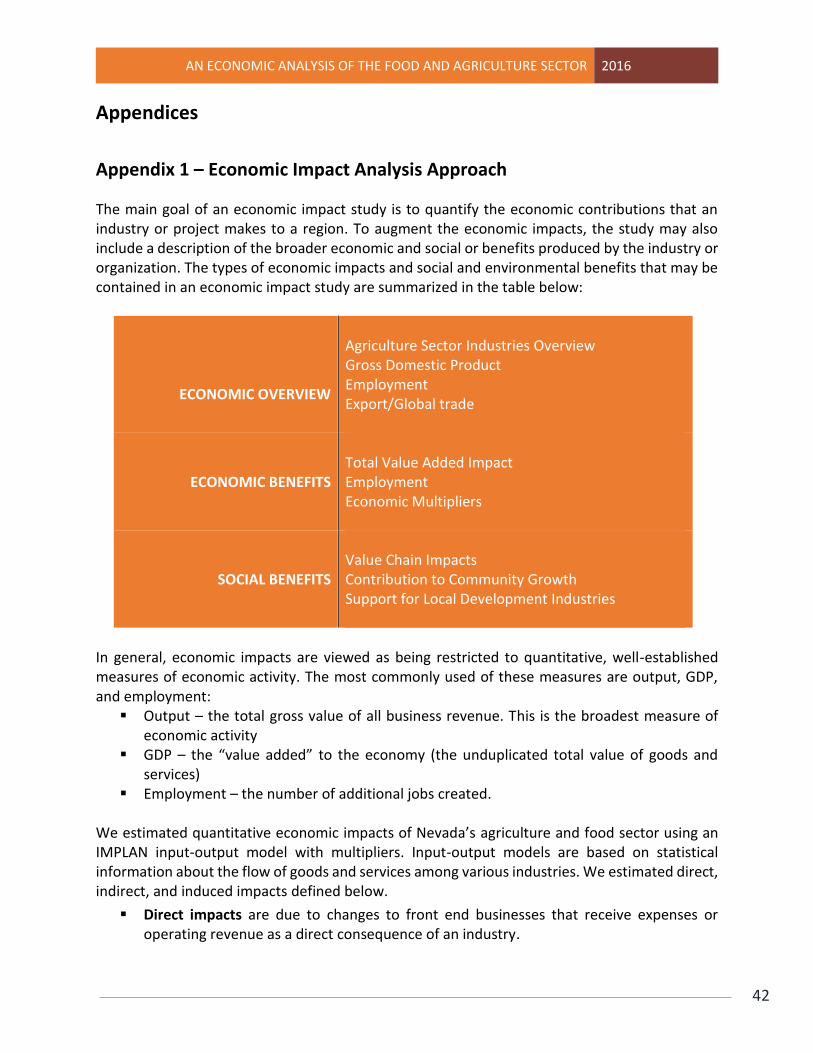
The main goal of an economic impact study is to quantify the economic contributions that an industry or project makes to a region. To augment the economic impacts, the study may also include a description of the broader economic and social or benefits produced by the industry or organization. The types of economic impacts and social and environmental benefits that may be contained in an economic impact study are summarized in the table below:
ECONOMIC OVERVIEW
Agriculture Sector Industries Overview Gross Domestic Product Employment Export/Global trade
ECONOMIC BENEFITS
Total Value Added Impact Employment Economic Multipliers
SOCIAL BENEFITS
Value Chain Impacts Contribution to Community Growth Support for Local Development Industries
In general, economic impacts are viewed as being restricted to quantitative, well-established measures of economic activity. The most commonly used of these measures are output, GDP, and employment:
Output – the total gross value of all business revenue. This is the broadest measure of economic activity
GDP – the “value added” to the economy (the unduplicated total value of goods and services)
Employment – the number of additional jobs created. We estimated quantitative economic impacts of Nevada’s agriculture and food sector using an IMPLAN input-output model with multipliers. Input-output models are based on statistical information about the flow of goods and services among various industries. We estimated direct, indirect, and induced impacts defined below.
Direct impacts are due to changes to front end businesses that receive expenses or operating revenue as a direct consequence of an industry.

AN ECONOMIC ANALYSIS OF THE FOOD AND AGRICULTURE SECTOR 2016
43
Indirect impacts are due to changes in the activity of suppliers. Induced impacts are due to shifts in spending on goods and services as a consequence of
the payroll of the directly and indirectly affected businesses. For more detailed definitions of direct, indirect, and induced impacts, please see the glossary.

AN ECONOMIC ANALYSIS OF THE FOOD AND AGRICULTURE SECTOR 2016
44
Appendix 2 – Data Source This appendix lists the data sources that we consulted as part of industry and economic impact analysis in our report.
Research Studies and Papers
Economics and Performance of Northeastern Nevada Feeder Cattle Feedlot Phase - Fact Sheet 99-48
Animal Agriculture Economic Analysis: Nevada 202 – 2012; A Report for United Soybean Board, July 2013
Analysis of the Impact of the Agriculture Cluster on the State of Nevada – Estimated Economic Impact of the Cattle Ranching and Farming Sector of the Elko County Economy – University of Nevada Reno Technical Report, UCED 2005
Nevada Agriculture Statistical Bulletin – 2012 – 2013, USDA
Websites
http://www.bea.gov/itable/index.cfm
http://www.angus.org/Commercial/Links/CommFeedlotRpt.aspx#NV
http://www.census.gov/manufacturing/exports/
http://www.ctre.iastate.edu/marketsize/about.html#limitations
http://nercrd.psu.edu/publications/rdppapers/rdp26.pdf
http://www.statsamerica.org/innovation/reports/aggregated_cluster_definitions.pdf
http://www.santabarbaracountywib.org/uploadedFiles/wib/SB%20Industry%20Cluster%20Report%202012_%20Final%2002.24.12%281%29.pdf
http://www.nortec.org/mc/NoRTEC%20Natural%20Res%20Cluster%20060612%20FINAL.pdf
http://www.coeccc.net/environmental_scans/ag_scan_cv_11.pdf
http://education.vermont.gov/new/pdfdoc/pgm_teched/pubs/educ_teched_pubs_sustainable_food_systems_cluster_study.pdf
Databases
Nevada Department of Agriculture - Brand Inspection database Nevada Department of Agriculture - Certified Producers Quarterly Census of Employment and Wages (QCEW) Nevada Workforce Informer - Nevada Employer Directory Nevada workforce Informer - Find a Business in Nevada USDA – NASS Stats
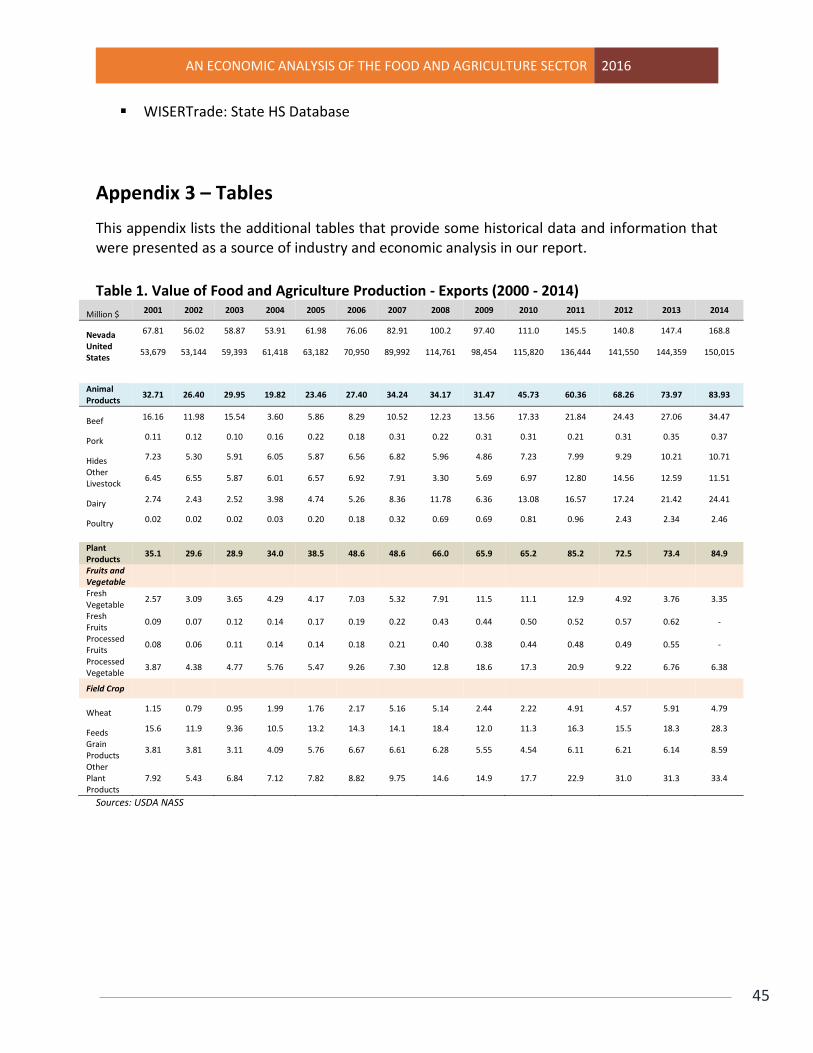
AN ECONOMIC ANALYSIS OF THE FOOD AND AGRICULTURE SECTOR 2016
45
WISERTrade: State HS Database
Appendix 3 – Tables
This appendix lists the additional tables that provide some historical data and information that were presented as a source of industry and economic analysis in our report.
Table 1. Value of Food and Agriculture Production - Exports (2000 - 2014)
Million $ 2001 2002 2003 2004 2005 2006 2007 2008 2009 2010 2011 2012 2013 2014
Nevada 67.81 56.02 58.87 53.91 61.98 76.06 82.91 100.2 97.40 111.0 145.5 140.8 147.4 168.8
United States
53,679 53,144 59,393 61,418 63,182 70,950 89,992 114,761 98,454 115,820 136,444 141,550 144,359 150,015
Animal Products
32.71 26.40 29.95 19.82 23.46 27.40 34.24 34.17 31.47 45.73 60.36 68.26 73.97 83.93
Beef 16.16 11.98 15.54 3.60 5.86 8.29 10.52 12.23 13.56 17.33 21.84 24.43 27.06 34.47
Pork 0.11 0.12 0.10 0.16 0.22 0.18 0.31 0.22 0.31 0.31 0.21 0.31 0.35 0.37
Hides 7.23 5.30 5.91 6.05 5.87 6.56 6.82 5.96 4.86 7.23 7.99 9.29 10.21 10.71
Other Livestock
6.45 6.55 5.87 6.01 6.57 6.92 7.91 3.30 5.69 6.97 12.80 14.56 12.59 11.51
Dairy 2.74 2.43 2.52 3.98 4.74 5.26 8.36 11.78 6.36 13.08 16.57 17.24 21.42 24.41
Poultry 0.02 0.02 0.02 0.03 0.20 0.18 0.32 0.69 0.69 0.81 0.96 2.43 2.34 2.46
Plant Products
35.1 29.6 28.9 34.0 38.5 48.6 48.6 66.0 65.9 65.2 85.2 72.5 73.4 84.9
Fruits and Vegetable
Fresh Vegetable
2.57 3.09 3.65 4.29 4.17 7.03 5.32 7.91 11.5 11.1 12.9 4.92 3.76 3.35
Fresh Fruits
0.09 0.07 0.12 0.14 0.17 0.19 0.22 0.43 0.44 0.50 0.52 0.57 0.62 -
Processed Fruits
0.08 0.06 0.11 0.14 0.14 0.18 0.21 0.40 0.38 0.44 0.48 0.49 0.55 -
Processed Vegetable
3.87 4.38 4.77 5.76 5.47 9.26 7.30 12.8 18.6 17.3 20.9 9.22 6.76 6.38
Field Crop
Wheat 1.15 0.79 0.95 1.99 1.76 2.17 5.16 5.14 2.44 2.22 4.91 4.57 5.91 4.79
Feeds 15.6 11.9 9.36 10.5 13.2 14.3 14.1 18.4 12.0 11.3 16.3 15.5 18.3 28.3
Grain Products
3.81 3.81 3.11 4.09 5.76 6.67 6.61 6.28 5.55 4.54 6.11 6.21 6.14 8.59
Other Plant Products
7.92 5.43 6.84 7.12 7.82 8.82 9.75 14.6 14.9 17.7 22.9 31.0 31.3 33.4
Sources: USDA NASS
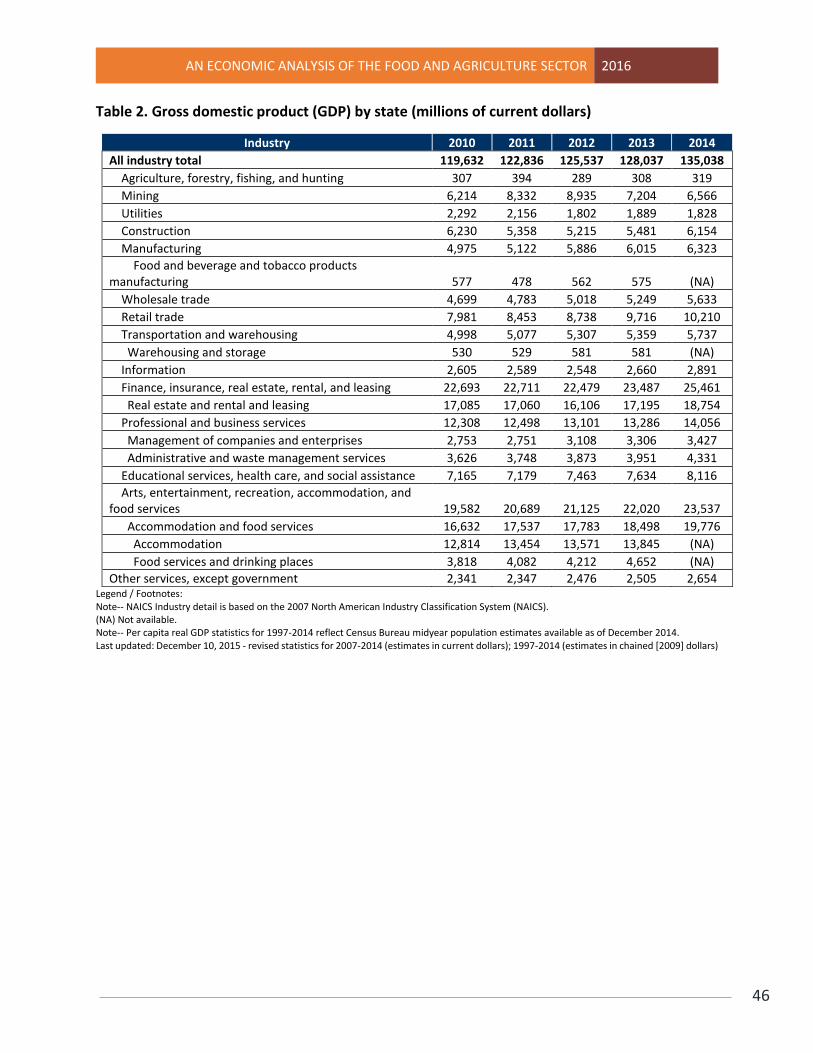
AN ECONOMIC ANALYSIS OF THE FOOD AND AGRICULTURE SECTOR 2016
46
Table 2. Gross domestic product (GDP) by state (millions of current dollars)
Industry 2010 2011 2012 2013 2014
All industry total 119,632 122,836 125,537 128,037 135,038
Agriculture, forestry, fishing, and hunting 307 394 289 308 319
Mining 6,214 8,332 8,935 7,204 6,566
Utilities 2,292 2,156 1,802 1,889 1,828
Construction 6,230 5,358 5,215 5,481 6,154
Manufacturing 4,975 5,122 5,886 6,015 6,323
Food and beverage and tobacco products manufacturing 577 478 562 575 (NA)
Wholesale trade 4,699 4,783 5,018 5,249 5,633
Retail trade 7,981 8,453 8,738 9,716 10,210
Transportation and warehousing 4,998 5,077 5,307 5,359 5,737
Warehousing and storage 530 529 581 581 (NA)
Information 2,605 2,589 2,548 2,660 2,891
Finance, insurance, real estate, rental, and leasing 22,693 22,711 22,479 23,487 25,461
Real estate and rental and leasing 17,085 17,060 16,106 17,195 18,754
Professional and business services 12,308 12,498 13,101 13,286 14,056
Management of companies and enterprises 2,753 2,751 3,108 3,306 3,427
Administrative and waste management services 3,626 3,748 3,873 3,951 4,331
Educational services, health care, and social assistance 7,165 7,179 7,463 7,634 8,116
Arts, entertainment, recreation, accommodation, and food services 19,582 20,689 21,125 22,020 23,537
Accommodation and food services 16,632 17,537 17,783 18,498 19,776
Accommodation 12,814 13,454 13,571 13,845 (NA)
Food services and drinking places 3,818 4,082 4,212 4,652 (NA)
Other services, except government 2,341 2,347 2,476 2,505 2,654 Legend / Footnotes: Note-- NAICS Industry detail is based on the 2007 North American Industry Classification System (NAICS). (NA) Not available. Note-- Per capita real GDP statistics for 1997-2014 reflect Census Bureau midyear population estimates available as of December 2014. Last updated: December 10, 2015 - revised statistics for 2007-2014 (estimates in current dollars); 1997-2014 (estimates in chained [2009] dollars)
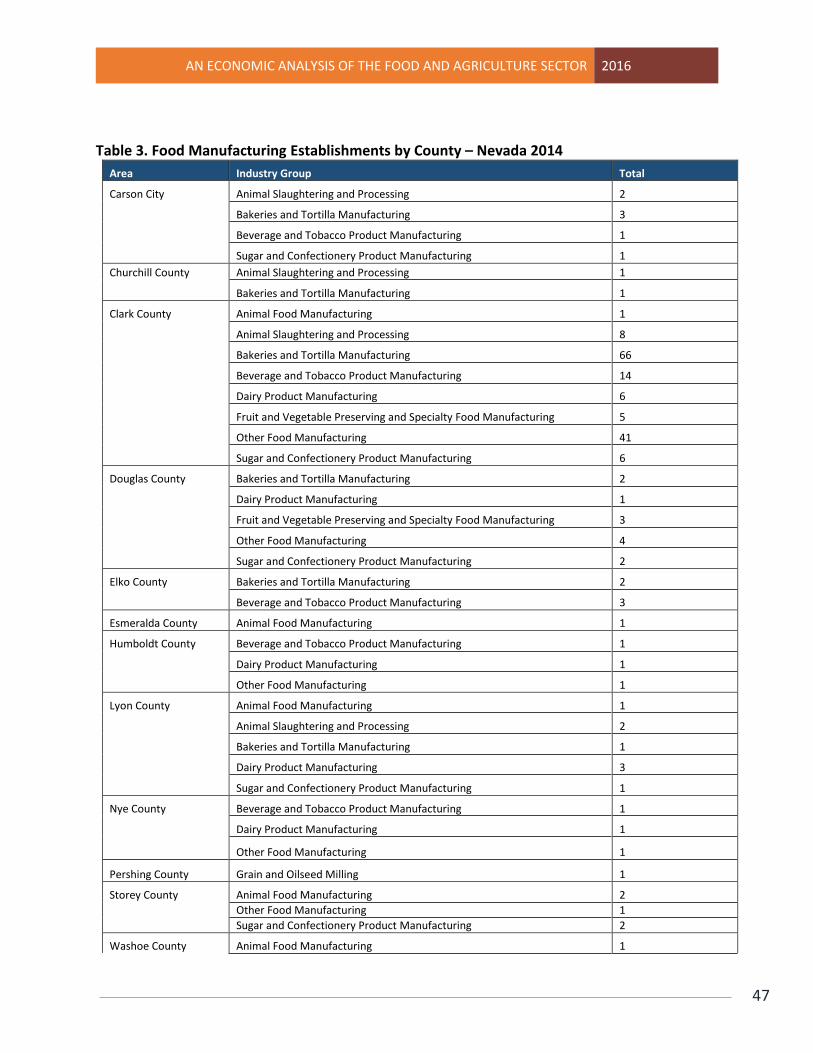
AN ECONOMIC ANALYSIS OF THE FOOD AND AGRICULTURE SECTOR 2016
47
Table 3. Food Manufacturing Establishments by County – Nevada 2014
Area Industry Group Total
Carson City Animal Slaughtering and Processing 2
Bakeries and Tortilla Manufacturing 3
Beverage and Tobacco Product Manufacturing 1
Sugar and Confectionery Product Manufacturing 1
Churchill County Animal Slaughtering and Processing 1
Bakeries and Tortilla Manufacturing 1
Clark County Animal Food Manufacturing 1
Animal Slaughtering and Processing 8
Bakeries and Tortilla Manufacturing 66
Beverage and Tobacco Product Manufacturing 14
Dairy Product Manufacturing 6
Fruit and Vegetable Preserving and Specialty Food Manufacturing 5
Other Food Manufacturing 41
Sugar and Confectionery Product Manufacturing 6
Douglas County Bakeries and Tortilla Manufacturing 2
Dairy Product Manufacturing 1
Fruit and Vegetable Preserving and Specialty Food Manufacturing 3
Other Food Manufacturing 4
Sugar and Confectionery Product Manufacturing 2
Elko County Bakeries and Tortilla Manufacturing 2
Beverage and Tobacco Product Manufacturing 3
Esmeralda County Animal Food Manufacturing 1
Humboldt County Beverage and Tobacco Product Manufacturing 1
Dairy Product Manufacturing 1
Other Food Manufacturing 1
Lyon County Animal Food Manufacturing 1
Animal Slaughtering and Processing 2
Bakeries and Tortilla Manufacturing 1
Dairy Product Manufacturing 3
Sugar and Confectionery Product Manufacturing 1
Nye County Beverage and Tobacco Product Manufacturing 1
Dairy Product Manufacturing 1
Other Food Manufacturing 1
Pershing County Grain and Oilseed Milling 1
Storey County Animal Food Manufacturing 2
Other Food Manufacturing 1
Sugar and Confectionery Product Manufacturing 2
Washoe County Animal Food Manufacturing 1
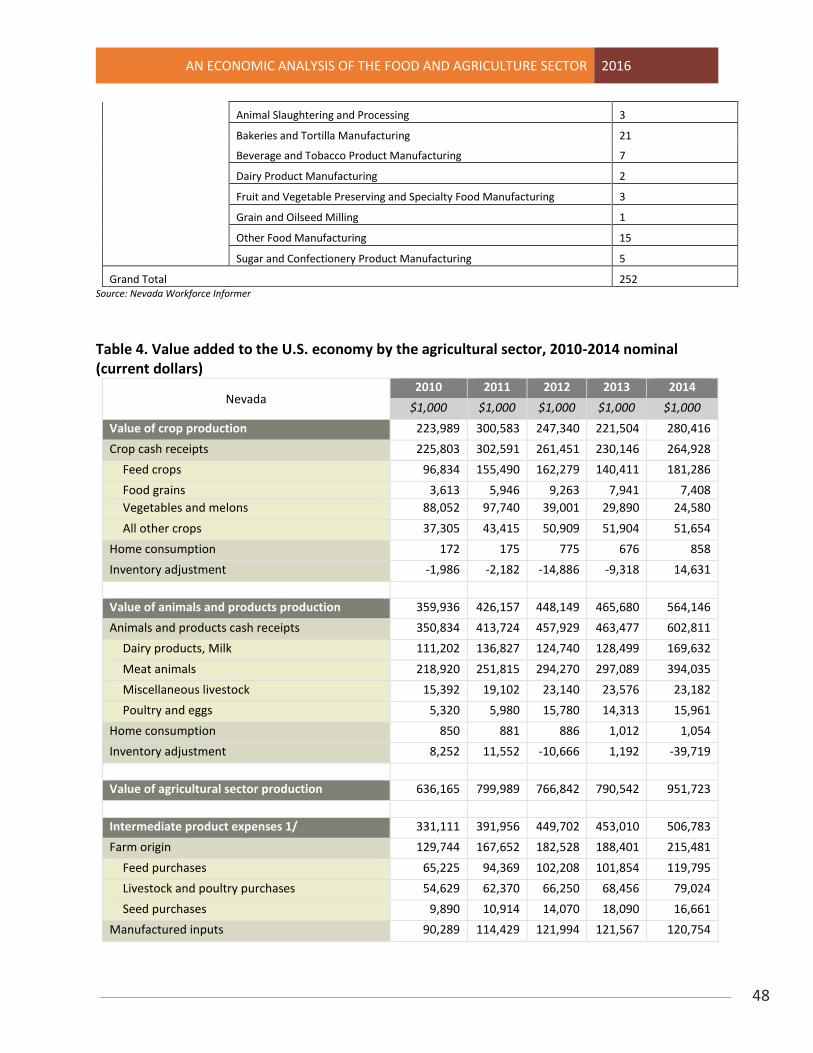
AN ECONOMIC ANALYSIS OF THE FOOD AND AGRICULTURE SECTOR 2016
48
Animal Slaughtering and Processing 3
Bakeries and Tortilla Manufacturing 21
Beverage and Tobacco Product Manufacturing 7
Dairy Product Manufacturing 2
Fruit and Vegetable Preserving and Specialty Food Manufacturing 3
Grain and Oilseed Milling 1
Other Food Manufacturing 15
Sugar and Confectionery Product Manufacturing 5
Grand Total 252 Source: Nevada Workforce Informer
Table 4. Value added to the U.S. economy by the agricultural sector, 2010-2014 nominal (current dollars)
Nevada 2010 2011 2012 2013 2014
$1,000 $1,000 $1,000 $1,000 $1,000
Value of crop production 223,989 300,583 247,340 221,504 280,416
Crop cash receipts 225,803 302,591 261,451 230,146 264,928
Feed crops 96,834 155,490 162,279 140,411 181,286
Food grains 3,613 5,946 9,263 7,941 7,408
Vegetables and melons 88,052 97,740 39,001 29,890 24,580
All other crops 37,305 43,415 50,909 51,904 51,654
Home consumption 172 175 775 676 858
Inventory adjustment -1,986 -2,182 -14,886 -9,318 14,631
Value of animals and products production 359,936 426,157 448,149 465,680 564,146
Animals and products cash receipts 350,834 413,724 457,929 463,477 602,811
Dairy products, Milk 111,202 136,827 124,740 128,499 169,632
Meat animals 218,920 251,815 294,270 297,089 394,035
Miscellaneous livestock 15,392 19,102 23,140 23,576 23,182
Poultry and eggs 5,320 5,980 15,780 14,313 15,961
Home consumption 850 881 886 1,012 1,054
Inventory adjustment 8,252 11,552 -10,666 1,192 -39,719
Value of agricultural sector production 636,165 799,989 766,842 790,542 951,723
Intermediate product expenses 1/ 331,111 391,956 449,702 453,010 506,783
Farm origin 129,744 167,652 182,528 188,401 215,481
Feed purchases 65,225 94,369 102,208 101,854 119,795
Livestock and poultry purchases 54,629 62,370 66,250 68,456 79,024
Seed purchases 9,890 10,914 14,070 18,090 16,661
Manufactured inputs 90,289 114,429 121,994 121,567 120,754
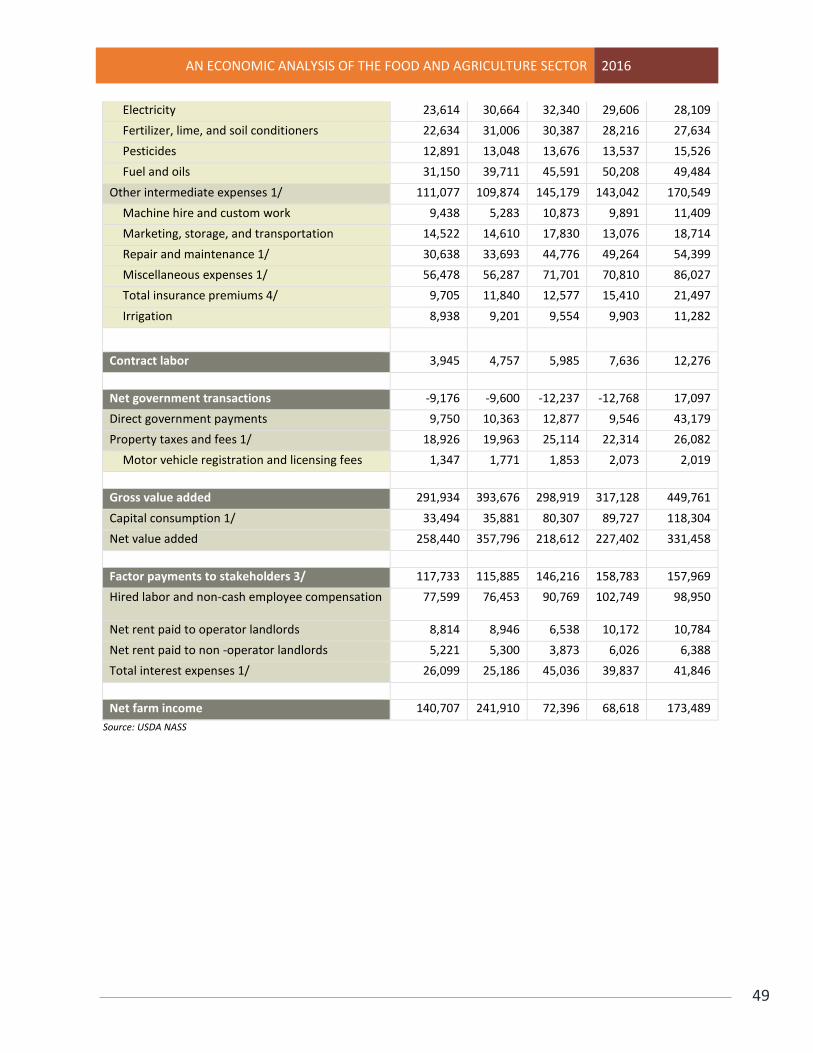
AN ECONOMIC ANALYSIS OF THE FOOD AND AGRICULTURE SECTOR 2016
49
Electricity 23,614 30,664 32,340 29,606 28,109
Fertilizer, lime, and soil conditioners 22,634 31,006 30,387 28,216 27,634
Pesticides 12,891 13,048 13,676 13,537 15,526
Fuel and oils 31,150 39,711 45,591 50,208 49,484
Other intermediate expenses 1/ 111,077 109,874 145,179 143,042 170,549
Machine hire and custom work 9,438 5,283 10,873 9,891 11,409
Marketing, storage, and transportation 14,522 14,610 17,830 13,076 18,714
Repair and maintenance 1/ 30,638 33,693 44,776 49,264 54,399
Miscellaneous expenses 1/ 56,478 56,287 71,701 70,810 86,027
Total insurance premiums 4/ 9,705 11,840 12,577 15,410 21,497
Irrigation 8,938 9,201 9,554 9,903 11,282
Contract labor 3,945 4,757 5,985 7,636 12,276
Net government transactions -9,176 -9,600 -12,237 -12,768 17,097
Direct government payments 9,750 10,363 12,877 9,546 43,179
Property taxes and fees 1/ 18,926 19,963 25,114 22,314 26,082
Motor vehicle registration and licensing fees 1,347 1,771 1,853 2,073 2,019
Gross value added 291,934 393,676 298,919 317,128 449,761
Capital consumption 1/ 33,494 35,881 80,307 89,727 118,304
Net value added 258,440 357,796 218,612 227,402 331,458
Factor payments to stakeholders 3/ 117,733 115,885 146,216 158,783 157,969
Hired labor and non-cash employee compensation 77,599 76,453 90,769 102,749 98,950
Net rent paid to operator landlords 8,814 8,946 6,538 10,172 10,784
Net rent paid to non -operator landlords 5,221 5,300 3,873 6,026 6,388
Total interest expenses 1/ 26,099 25,186 45,036 39,837 41,846
Net farm income 140,707 241,910 72,396 68,618 173,489
Source: USDA NASS