An Economic Analysis of Financial and Intangible Assets ...
29
2012 BY JOHN L. DOBRA, PH.D. 10/1/2012 An Economic Analysis of Financial and Intangible Assets Firms in Nevada
Transcript of An Economic Analysis of Financial and Intangible Assets ...

2012
BY JOHN L. DOBRA, PH.D.
10/1/2012
An Economic Analysis of Financial and Intangible Assets
Firms in Nevada

2
An Economic Analysis of Financial
and Intangible Assets
Firms in Nevada
By
John L. Dobra, Ph.D.
Director, Natural Resource Industry Institute and
Associate Professor of Economics
University of Nevada, Reno
With Forward by John H. O. La Gatta
and Technical Appendix Provided by
Thomas R. Harris, Ph.D.
Director, Center for Economic Development and
Professor of Economics
University of Nevada, Reno
Published by the Natural Resource Institute at the University of Nevada, Reno with
the support of the Financial and Intangible Asset Enterprises of Nevada.
October 2012.
ALL RIGHTS RESERVED.

3
FORWARD
Our attempt herein is to create two proper names, “Intangible Industries” and “FIA
Firms” which we have used for several years but, if new to you, may seem unclear.
“Intangible Industries” is intended to aggregate, under one name, a dozen or so industries
that have certain things in common even if this is not widely understood. The enterprises
identified as being Intangible Industries are “FIA Firms.”
A tangible industry would be one that makes something physical (e.g., shoes) or retails
something physical in a bricks and mortgage store (e.g., shoes).
But, Intangible Industries include investment managers, insurance, intellectual property
management and administration functions, and many more.
The world has changed in the last 50 years. No longer are paper stock certificates
physically delivered by seller to buyer and, therefore, there is no need for brokers, investment
managers and banks to be clustered near Wall Street; corporate headquarters need not be
clustered near their advertising agencies; their lawyers and accountants, or be near to each other
as trading partners, etc.
The key concept is that many of the FIA Firms can be located anywhere they wish, not
having to locate in a proximity to physical resources, seaports, or trading partners.
With electronic communication, air travel and other modern means of transportation or
telecommuting many FIA Firms can elect to be located where they please. This translates into
high quality of life and a good business environment, including tax considerations.
John H. O. La Gatta
4
TABLE OF CONTENTS
Forward.......................................................................................................................................................................... 3
Executive Overview ...................................................................................................................................................... 5
Intangible Industries Overview ...................................................................................................................................... 7
Economic Impacts ......................................................................................................................................................... 9
FIA Industry Employment ........................................................................................................................................... 10
Direct and Indirect Household Income ........................................................................................................................ 16
Direct and Indirect Output and Value Added .............................................................................................................. 18
Indirect Taxes .............................................................................................................................................................. 20
Market Overview and Nevada Potential ...................................................................................................................... 23
Policy Issues ................................................................................................................................................................ 25
Business and Tax Environment ................................................................................................................................... 25
Appendix: Model and Data Used to Estimate Employment and Income Multipliers .................................................. 28
Appendix References ................................................................................................................................................... 29

5
EXECUTIVE OVERVIEW
Financial and Intangible Asset Firms1 (“FIA Firms”) can be described as a diverse but
significant collection of companies that provide many jobs for Nevadans and pay wages, salaries
and taxes that are significantly higher than most other industries in the state. Because these firms
are diverse in nature they are not frequently lumped together like manufacturing, mining or
gaming. What they have in common is that what they produce are intangible services ranging
from artistic design, management consulting, other kinds of consulting such as geotechnical
services, and financial services. They are part of the growing knowledge and learning-based
economy that has been a driving force in the U.S. economy in general and Nevada’s economy
specifically.
According to the State Department of Employment, Training and Rehabilitation (DETR),
there are 55,000 plus employed in the Intangible Industries. The IMPLAN model, a useful tool
for analyzing economic impacts, captures 44,000 of these jobs. The IMPLAN model assists in
analyzing the indirect jobs and spending by employees. IMPLAN indicates FIA Firms generate
92,000 jobs and $7.7 billion in economic activity.
This amounts to more employees than other important sectors of the state economy such
as manufacturing and mining. When you add in indirect jobs in firms in other sectors that supply
1 A FIA Firm is one of the 10,000 Nevada firms within the “silos” of the specified industries. “FIAE” is the
acronym for the newly formed non-profit, 501 (c) 6, “Financial and Intangible Asset Enterprises of Nevada” that
will advocate the interests of the dues –paying members of FIAE and their allies.
6
FIA Firms and the spending of all of the employees of these firms, IMPLAN indicates FIA Firms
generate over 92,000 jobs in the state economy. These firms directly generate $7.7 billion in
economic activity in the state and induce an estimated total of $13.7 billion.2
Based upon the IMPLAN estimates, direct household income for Nevadans generated by
FIA Firms amounted to more than $4 billion in 2011, an average of about $90,000 per direct job.
Total induced household income for Nevadans from these firms in 2011 was over $6 billion.
These firms and individuals working in these and affiliated industries also pay a variety
of taxes that benefit the state and local governments. Firms pay the Modified Business Tax (a
payroll tax) as well as sales and use taxes, property taxes and numerous fees for the privilege of
doing business in Nevada. Our analysis suggests that the total state and local government
revenues generated by FIA Firms was over $717 million in 2011 (excluding property taxes).
This amounts to over $16,000 per direct employee.
A final and important point about FIA Firms is that, for the most part, they can locate
wherever they choose. They choose to locate in Nevada for a number of reasons, many of which
are obvious. Nevada’s favorable tax climate relative to alternatives like California and
Washington has attracted firms such as Apple subsidiary Braeburn Capital and Microsoft
Licensing to Nevada. Numerous other examples can be cited. Another significant factor
2 Estimates of indirect and induced jobs and other estimates are generated by the IMPLAN model maintained by the
Center for Economic Development at the University of Nevada, Reno. The IMPLAN model is explained in detail in
an appendix.
7
frequently cited is the general quality of life in Nevada which includes outdoor recreation and
accessibility to major markets, people in the western U.S. and beyond.
INTANGIBLE INDUSTRIES OVERVIEW
What we are calling “Intangible Industries” or “FIA Firms” consists of a broad and
diverse array of sectors of the State economy that have the common characteristic of selling
services that are the product of an emerging knowledge and learning-based economy. Rather
than companies that produce traditional “tangible” goods like manufacturing and construction,
intangible industries produce services based on science and technology; artistic, cultural, and
fashion design; financial and insurance services, management of intangible assets such as
patents, trademarks, licenses and royalties; agents of athletes and performers; wholesale goods
and commodity brokers and traders; and related services.
As previously mentioned, another characteristic shared by these kinds of firms is that, for
the most part, they can locate wherever they choose completely unrelated to physical resources
(e.g., timber, ore, cheap energy). There is a small locational advantage for geotechnical and
mining engineering consulting firms, for example, to be located in Nevada because of its mining
industry. However, many of these firms choose other locations, notably Denver and Salt Lake
City for a variety of reasons including the quality of air service. Similarly, firms that provide
artistic and fashion design services for the gaming and entertainment industries in Las Vegas
could locate there but many choose the Los Angeles area because that is one of the two main
national centers of talent and opportunities in the entertainment and fashion industries.
Finally, financial and intangible asset management firms like Microsoft Licensing and
others locate in Nevada for its favorable tax climate but also for other factors such as quality of
life, proximity to their headquarters, etc.
The interest in these industries is based on several factors: these are among the fastest
growing sectors in the national and state economies; FIA Firms have low environmental and
negative community impacts; average employee compensation in these industries is over twice
Nevada’s statewide average; and in spite of the somewhat amorphous nature of “Intangible
Industries,” IMPLAN estimates they employed over 44,000 Nevadans in 2011.
8
The Nevada Department of Employment, Training and Rehabilitation (DETR) tracks
official employment records from employers and shows direct employment in FIA Firms at
55,000 in 2011. The IMPLAN model, which is used below to estimate economic impacts (see
appendix) estimates total direct employment of FIA Firms at about 44,000 in 2011. Whether
using DETR or IMPLAN estimates, the point is that FIA Firms are a substantial part of the
Nevada economy, employing almost four percent of the state’s workforce in terms of direct
employment and almost eight percent when total employment impacts are considered. FIA
Firms’ direct employment of 55,000 compares to 37,500 in manufacturing, 49,400 in
construction, and 16,400 in mining.3
In addition, because of the small size of most FIA Firms, they have often been
overlooked in economic development and diversification efforts. Economic development
agencies are likely to emphasize attracting large, tangible employers because of their obvious
impact on their new community. Firms in the intangible sectors, on the other hand, tend to be
small, with many only about five employees per firm in over 10,000 establishments. Individual
FIA Firms are not obvious recruiting targets and probably will not earn headlines in the press,
but in aggregate they are attractive targets for promoting economic development and
diversification of Nevada.
Economic Impacts: This report looks at Intangible Industries from several perspectives.
The next section examines the economic impacts of these industries in terms of employment;
contributions to state economic output, or Gross State Product; household income generated in
the state; and direct and indirect taxes paid. These impacts are developed using data from
Nevada’s DETR and analysis using the Nevada IMPLAN input/output model from the Center for
Economic Development at the University of Nevada, Reno.
Overview of the Market: The next section provides an overview of the market for
Intangible Industries. Because this is a diverse set of industries, it would take inordinate space to
3 Nevada Department of Employment, Training and Rehabilitation, Economy in Brief, June 2012,
http://www.nevadaworkforce.com.

9
address the individual sectors. However, there has been a secular trend favoring knowledge-
based industries in aggregate for the past few decades and this can be documented.
Policy Issues and Business and Tax Environment: The final section looks at policy
issues ranging from the general business climate in Nevada, tax policy, and infrastructure issues.
ECONOMIC IMPACTS
The economic impacts of Intangible Industries or any other industry are generally viewed
in terms of employment, output and household income generated. A more detailed description of
the methodology for estimating these impacts is provided in a technical appendix to this report,
but a more basic explanation starts with the premise that economic growth is “export led.”4 That
is, economies grow by producing goods and services that can be sold outside (or to persons from
outside) the state, region, or country where it is produced. These sales then generate a
“multiplier effect” that, to one degree or another, raises employment, incomes and output in the
local economy generally.
FIA Firms, to some extent, constitute export or primary industries in that they provide
services to non-Nevadan firms and individuals. But equally important from the standpoint of the
state’s economic development and diversification, FIA Firms provide services to Nevada firms
and individuals that would otherwise have to be imported from non-Nevada firms. This import
substitution has essentially the same economic impact as exports.
This analysis uses the IMPLAN input/output model which was originally developed by
the U.S. Forest Service to capture linkages between primary (export) industries and other sectors
of the local economies that provide goods and services to the primary sectors. The result is that
we get estimates of “direct” impacts, “indirect” impacts and “induced” impacts.
4 The classic statement of the export led growth hypothesis comes from Douglass C. North’s The Economic Growth
of the United States 1790 – 1860, Prentice Hall, Inc., 1961. Most economic models since that time have
incorporated the idea of export led growth as a core idea. The alternative to export led growth that has much the
same effect is import substitution. See, for example, Henry Bruton, “Import Substitution” in Handbook of
Development Economics, Vol. II. H. Chenery and T. N. Srinivason, Eds., Elsevier Science Publishers B.V., 1989.
10
In this case “direct” impacts include data such as the number of persons employed in a
primary sector, payrolls, etc., as reported to DETR and the U.S. Department of Labor, Bureau of
Labor Statistics. The Nevada IMPLAN model is maintained by the Center for Economic
Development at the University of Nevada, Reno and has been slightly modified to more
accurately reflect the linkages between Nevada businesses. This model is used widely in studies
of this type.
“Indirect” impacts include purchases from suppliers in other sectors of the local
economies which, of course includes payrolls of firms in these other sectors. Finally, we
consider “induced” impacts which, in most basic terms, occur when employees in the direct and
indirect sectors spend their incomes in the broader economy and provide incomes for the
proverbial “butchers, bakers and candlestick makers.”
The tables in the remainder of this section generally reflect the distinction between
“direct,” “indirect” and “induced” impacts.
In Nevada’s economy the major primary industry in recent times has been the gaming
industry, which has suppliers that manufacture equipment, provide uniforms for employees,
provide entertainment related services, transportation, etc. Other significant primary industries
include manufacturing and mining, which have their own unique supply chains. “Direct” and
“indirect” employees, that is, workers in the primary industries and their supply chains, then
spend their incomes in the broader economy which induces a broader economic impact. The
“total” impact is the sum of the direct, indirect and induced impacts.
FIA INDUSTRY EMPLOYMENT
Table 1 shows the impact multipliers considered derived from the IMPLAN model
sectors considered to represent FIA Firms and shows their impacts on employment, household
income, output (or contribution to Gross State Product (GSP), and their value added (basically,
the value of their output less cost of goods sold) in Nevada. Hence, for example, each FIA Firm
job creates a total of 2.12 jobs in the state economy – the FIA Firm job plus 1.12 jobs elsewhere.
Similarly, each dollar of income earned by an employee of a FIA Firm generates an additional
52¢ in household income in other sectors of the state economy. Output and value added
multipliers should be interpreted similarly.

11
Table 2, below, shows employment and employment growth rates for FIA Firms and all
Nevada firms from 2002 to 2011. The data used is from the North American Industrial
Classification System (NAICS) maintained by the Nevada Department of Employment, Training
and Rehabilitation. The main difference between the NAICS and IMPLAN databases is that the
NAICS database comes from an actual headcount of employees reported by employers for the
purpose of paying payroll taxes, while the IMPLAN data is an estimate. (See Appendix).
Table 2 – FIA Firms and NAICS Nevada Employment, 2002 – 2011
FIA
FIRMS
FIA
FIRMS NEVADA NEVADA
FIA
FIRMS
EMPL0Y. EMPL0Y. TOTAL EMPL0Y. EMPL0Y.
GROWTH EMPLOY GROWTH % OF
NEVADA
TOTAL
2002 40,896
1,066,477
3.83%
2003 44,024 7.65% 1,093,507 2.53% 4.03%
2004 45,929 4.33% 1,128,223 3.17% 4.07%
2005 47,607 3.65% 1,173,425 4.01% 4.06%
2006 52,140 9.52% 1,222,277 4.16% 4.27%
2007 55,956 7.32% 1,245,102 1.87% 4.49%
2008 57,249 2.31% 1,254,483 0.75% 4.56%
2009 55,539 -2.99% 1,207,767 -3.72% 4.60%
2010 55,202 -0.61% 1,195,309 -1.03% 4.62%
2011 55,584 0.69% 1,198,140 0.24% 4.64%
Source: Nevada Department of Employment, Training and Rehabilitation
Table 1 - FIAE Industry IMPLAN Impact Multipliers
Employment 2.12
Household Income 1.52
Output 1.78
Value Added 1.70
12
By far, the largest of the sectors among FIA Firms is “management of companies and
enterprises” with over 40 percent direct employment. Many of these management services
involve financial services. Other sectors that involve financial services include insurance
carriers (as opposed to insurance agents), managers of funds, trusts and other financial vehicles,
and business support services.
The firms may manage some enterprises located in Nevada but they also manage
operations in multiple states since employees in management of firms strictly in the state would
be classified in their respective industries such as gaming, mining or manufacturing. When we
add in other sectors on the table that are related to management, “management, scientific, and
technical consulting services,” and “all other miscellaneous professional, scientific, and technical
services,” management in a broad sense constitutes almost half of all employment in these FIA
Firms.
The second largest FIA sector by employment is “wholesale trade” with approximately
18.4 percent of total direct employment. It is important to note that this sector is not the same as
warehousing which basically involves holding goods in inventory or in transit to final buyers.
The wholesale trades that have been identified as FIA Firms are involved in buying, selling, and
brokering trade between producers and ultimate buyers. There may be some warehousing
involved, but that is not their principal business.
After these two groups of sectors, management and wholesale trade, the remaining
sectors are relatively small – generally in single digits in percentage terms of FIA Firms’
employment. But again, if we combine sectors related to computer services and programming,
the numbers get larger.
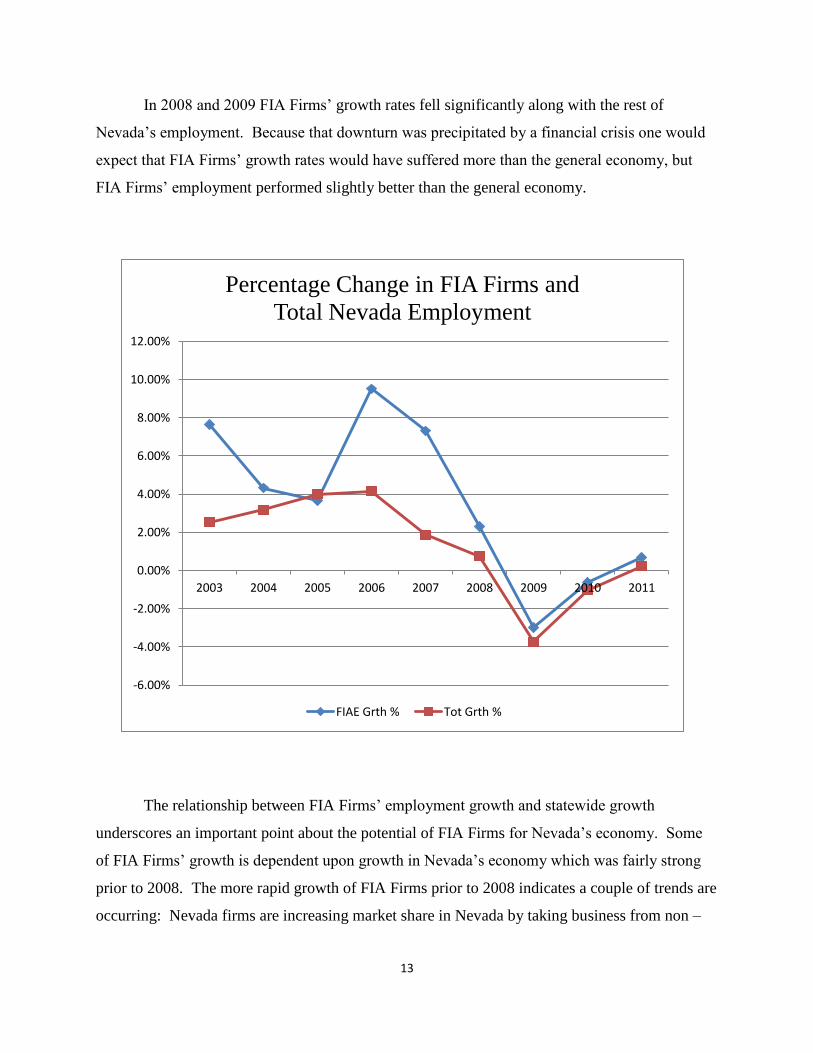
The following graph shows the percentage growth in FIA Firms and total Nevada
employment since 2003 based on the data in Table 2.5 The graph shows that there was strong
growth in these industries and all Nevada industries in the mid 2000’s until 2007. However,
during this period FIA Firms’ growth rate was far above the state average employment growth.
5 It is difficult to go back further than 2002 because the U.S. Department of Labor changed its industrial
classification system in that year.
13
In 2008 and 2009 FIA Firms’ growth rates fell significantly along with the rest of
Nevada’s employment. Because that downturn was precipitated by a financial crisis one would
expect that FIA Firms’ growth rates would have suffered more than the general economy, but
FIA Firms’ employment performed slightly better than the general economy.
The relationship between FIA Firms’ employment growth and statewide growth
underscores an important point about the potential of FIA Firms for Nevada’s economy. Some
of FIA Firms’ growth is dependent upon growth in Nevada’s economy which was fairly strong
prior to 2008. The more rapid growth of FIA Firms prior to 2008 indicates a couple of trends are
occurring: Nevada firms are increasing market share in Nevada by taking business from non –
-6.00%
-4.00%
-2.00%
0.00%
2.00%
4.00%
6.00%
8.00%
10.00%
12.00%
2003 2004 2005 2006 2007 2008 2009 2010 2011
Percentage Change in FIA Firms and
Total Nevada Employment
FIAE Grth % Tot Grth %
14
Nevada based FIA Firms, and Nevada based FIA Firms are increasing their market share outside
of Nevada. The first type of growth represents import substitution and benefits the state
economy by reducing leakages of purchasing power from the state economy but, as noted, has
limited potential. On the other hand, the second type of growth – increasing market share in Non
– Nevada markets – has virtually unlimited potential.
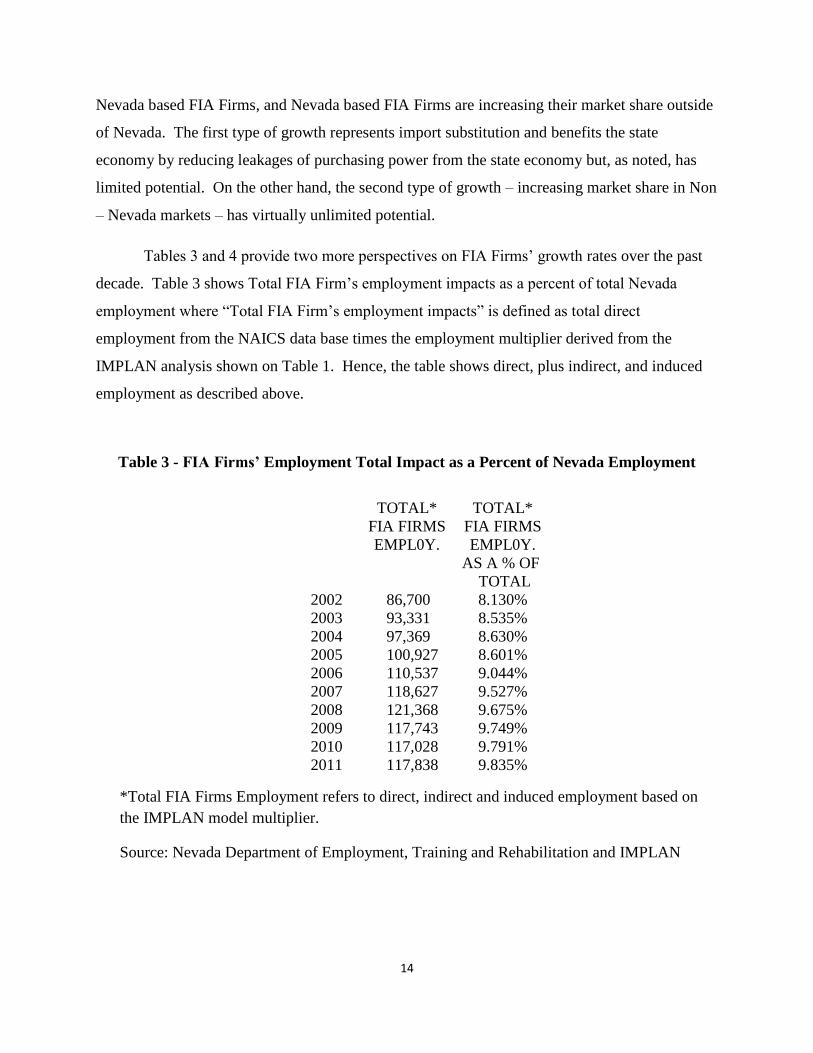
Tables 3 and 4 provide two more perspectives on FIA Firms’ growth rates over the past
decade. Table 3 shows Total FIA Firm’s employment impacts as a percent of total Nevada
employment where “Total FIA Firm’s employment impacts” is defined as total direct
employment from the NAICS data base times the employment multiplier derived from the
IMPLAN analysis shown on Table 1. Hence, the table shows direct, plus indirect, and induced
employment as described above.
Table 3 - FIA Firms’ Employment Total Impact as a Percent of Nevada Employment
TOTAL* TOTAL*
FIA FIRMS FIA FIRMS
EMPL0Y. EMPL0Y.
AS A % OF
TOTAL
2002 86,700 8.130%
2003 93,331 8.535%
2004 97,369 8.630%
2005 100,927 8.601%
2006 110,537 9.044%
2007 118,627 9.527%
2008 121,368 9.675%
2009 117,743 9.749%
2010 117,028 9.791%
2011 117,838 9.835%
*Total FIA Firms Employment refers to direct, indirect and induced employment based on
the IMPLAN model multiplier.
Source: Nevada Department of Employment, Training and Rehabilitation and IMPLAN
15
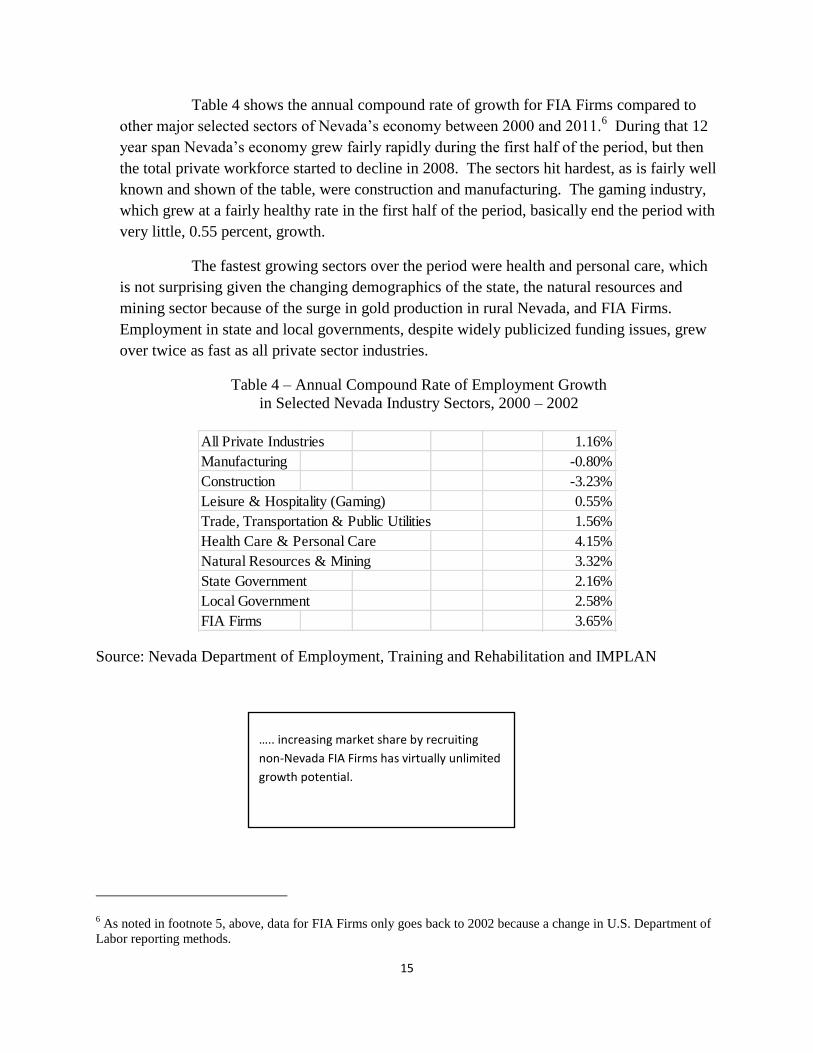
Table 4 shows the annual compound rate of growth for FIA Firms compared to
other major selected sectors of Nevada’s economy between 2000 and 2011.6 During that 12
year span Nevada’s economy grew fairly rapidly during the first half of the period, but then
the total private workforce started to decline in 2008. The sectors hit hardest, as is fairly well
known and shown of the table, were construction and manufacturing. The gaming industry,
which grew at a fairly healthy rate in the first half of the period, basically end the period with
very little, 0.55 percent, growth.
The fastest growing sectors over the period were health and personal care, which
is not surprising given the changing demographics of the state, the natural resources and
mining sector because of the surge in gold production in rural Nevada, and FIA Firms.
Employment in state and local governments, despite widely publicized funding issues, grew
over twice as fast as all private sector industries.
Table 4 – Annual Compound Rate of Employment Growth
in Selected Nevada Industry Sectors, 2000 – 2002
Source: Nevada Department of Employment, Training and Rehabilitation and IMPLAN
6 As noted in footnote 5, above, data for FIA Firms only goes back to 2002 because a change in U.S. Department of
Labor reporting methods.
All Private Industries 1.16%
Manufacturing -0.80%
Construction -3.23%
Leisure & Hospitality (Gaming) 0.55%
Trade, Transportation & Public Utilities 1.56%
Health Care & Personal Care 4.15%
Natural Resources & Mining 3.32%
State Government 2.16%
Local Government 2.58%
FIA Firms 3.65%
….. increasing market share by recruiting
non-Nevada FIA Firms has virtually unlimited
growth potential.

16
DIRECT AND INDIRECT HOUSEHOLD INCOME
Table 5 shows the household income generated by FIA Firms in Nevada. As would be
expected, the percentage breakdown of each of the sectors on the table closely resembles the
breakdown of employment shown on Table 1 with management related firms accounting for
almost half of the direct income generated. However, as noted above, many of the sectors
represent financial services related sectors.
Total direct household income of over $4 billion (shown on Table 5) amounts to about
almost $92,000 per direct job (derived from the IMPLAN model). This is more than twice the
state average for all industries.7 Even including total household income which includes indirect
and induced income, i.e., jobs not in FIA Firms, such as grocery clerks, the implied household
earnings of over $66,000 per year is almost 160 percent of the state average. Hence, FIA Firms
generate jobs – direct, indirect and induced – that pay incomes far above the state average.
Moreover, the financial sectors on the table such as “Securities, commodity contracts,
investments, and related activities” and “Funds, trusts, and other financial vehicles” (sectors 356
and 359), for example, had average household earnings of over $93,000 and $105,000 per year,
respectively.
This, in turn, implies that employees of FIA Firms pay more in sales and use taxes and
property taxes, and FIA Firms pay more per employee to the state through the Modified Business
Tax, which is essentially a payroll tax. Also to be noted is that FIA Firms provide their
employees with health care insurance and pension benefits that are not included in earnings
figures cited above. FIA Firms have to pay these taxes and provide these benefits because they
are competing to hire professional employees with other FIA Firms in and out of the state of
Nevada.
7 Nevada Department of Employment, Training and Rehabilitation,
http://www.nevadaworkforce.com/cgi/dataanalysis/industryReport.asp?menuchoice=industry. The state average
weekly wage for 52 weeks is $43,108. (52 x $829)

17
Table 5 –FIA Firms’ Contributions to Household Incomes (1,000s)
Household Income Impacts
IMPLAN IMPLAN Description DIRECT INDIRECT INDUCED TOTAL %
Sector
319 Wholesale trade $721,207 $96,658 $222,658 $1,040,523 18.01%
345 Software publishers $81,853 $25,011 $29,088 $135,952 2.04%
350 Internet publishing and broadcasting $41,724 $9,510 $13,966 $65,200 1.04%
351 Telecommunications $31,485 $16,848 $13,156 $61,489 0.79%
356 Investments, and related activities $90,976 $34,448 $34,132 $159,555 2.27%
357 Insurance carriers $186,315 $97,842 $77,361 $361,517 4.65%
358 Other Insurance related activities $33,550 $10,383 $11,967 $55,900 0.84%
359 Funds, trusts, & other financial vehicles $66,945 $15,277 $22,394 $104,617 1.67%
366 Lessors of nonfin. intangible assets $9,605 $6,102 $4,277 $19,985 0.24%
367 Legal services $102,875 $8,362 $30,307 $141,545 2.57%
368 Accounting and related services $61,459 $4,013 $17,834 $83,305 1.53%
369 Architectural, eng., & related services $8,647 $1,487 $2,760 $12,893 0.22%
370 Specialized design services $3,271 $170 $937 $4,378 0.08%
371 Computer programming services $231,740 $25,063 $69,937 $326,739 5.79%
372 Computer systems design services $188,158 $17,207 $55,942 $261,308 4.70%
373 Other computer related services $65,865 $8,726 $20,320 $94,910 1.64%
374 Mgt., scientific, and technical consulting $196,890 $26,092 $60,745 $283,727 4.92%
377 Advertising and related services $39,208 $2,931 $11,474 $53,613 0.98%
380 Other misc. prof., sci., and tech. svs. $63,910 $5,660 $18,945 $88,515 1.60%
381 Management of companies $1,643,574 $358,133 $544,545 $2,546,253 41.05%
382 Employment services $12,099 $335 $3,384 $15,818 0.30%
384 Office administrative services $56,863 $9,174 $17,978 $84,015 1.42%
386 Business support services $5,498 $359 $1,594 $7,452 0.14%
404 Promoters and agents for public figures $53,049 $7,628 $16,524 $77,201 1.32%
424 Grantmaking, and social advocacy orgs. $7,349 $1,559 $2,424 $11,332 0.18%
Totals $4,004,115 $788,978 $1,304,651 $6,097,744 100.00%

18
DIRECT AND INDIRECT OUTPUT AND VALUE ADDED
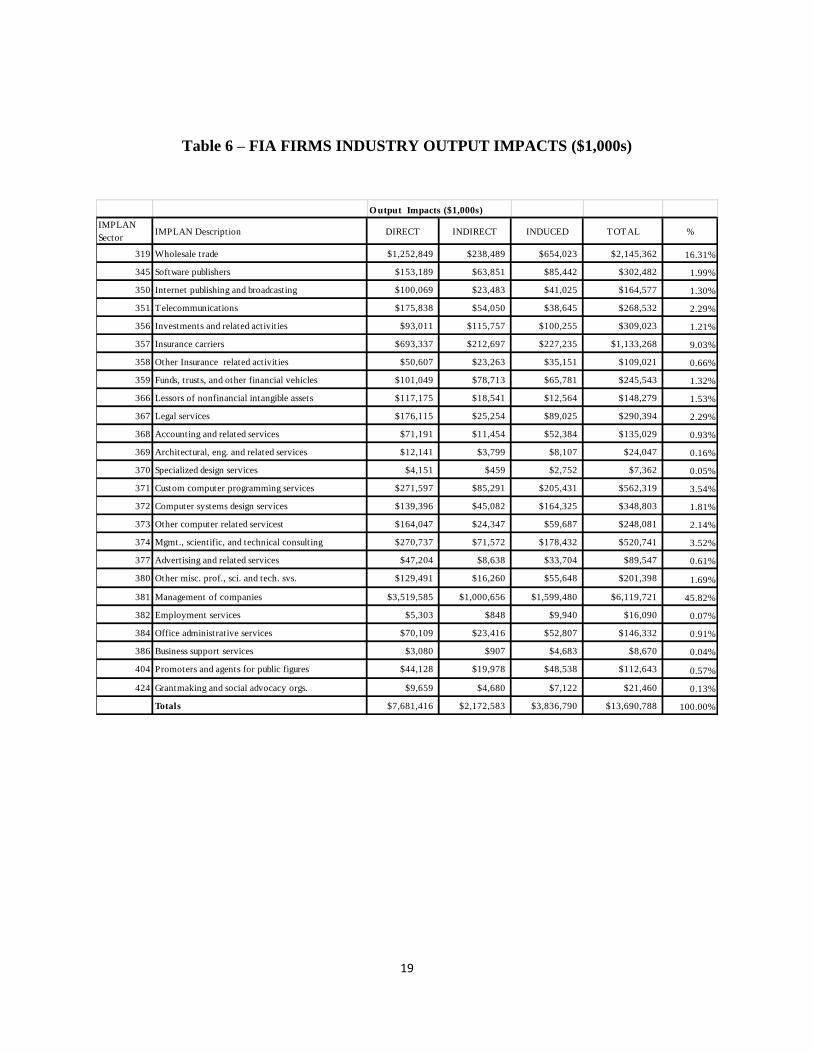
Tables 6 and 7 show output and value added impacts, respectively, for the intangible
sectors identified. Output represents the gross receipts of FIA Firms from the sale of final goods
and services. Output of $7.7 billion shown on Table 6 represents these industries’ share of
Nevada Gross State Product (GSP) of approximately $130 billion8 or approximately six percent
of total state GSP for all industries. As Table 6 shows, direct plus indirect and induced output
amounts to about $13.7 billion, just over 10 percent of Nevada GSP.
As noted above, value added represents gross sales (or output from Table 5) minus the
cost of goods and services sold and, in this case because we are examining industries that sell
intangible services, the cost of services sold would include primarily labor costs but also the cost
of office space, computer operating systems, energy, etc. A major part of the uniqueness of FIA
Firms as opposed to firms producing tangible output like manufacturers is that FIA Firms’ cost
of “goods” sold mostly consists of “services” sold, and there are very few tangible inputs. The
accounting concept remains the same, however. Table 7 shows direct value added of $5.4 billion
and total value added of $9.2 billion. This amounts to 71 percent of direct output and 67 percent
of total output from Table 6. In other words, these tend to be profitable businesses.
8 Nevada Department of Employment, Training and Rehabilitation, Economy in Brief, June 2012,
http://www.nevadaworkforce.com.
19
Table 6 – FIA FIRMS INDUSTRY OUTPUT IMPACTS ($1,000s)
O utput Impacts ($1,000s)
IMPLAN
SectorIMPLAN Description DIRECT INDIRECT INDUCED TOTAL %
319 Wholesale trade $1,252,849 $238,489 $654,023 $2,145,362 16.31%
345 Software publishers $153,189 $63,851 $85,442 $302,482 1.99%
350 Internet publishing and broadcasting $100,069 $23,483 $41,025 $164,577 1.30%
351 Telecommunications $175,838 $54,050 $38,645 $268,532 2.29%
356 Investments and related activities $93,011 $115,757 $100,255 $309,023 1.21%
357 Insurance carriers $693,337 $212,697 $227,235 $1,133,268 9.03%
358 Other Insurance related activities $50,607 $23,263 $35,151 $109,021 0.66%
359 Funds, trusts, and other financial vehicles $101,049 $78,713 $65,781 $245,543 1.32%
366 Lessors of nonfinancial intangible assets $117,175 $18,541 $12,564 $148,279 1.53%
367 Legal services $176,115 $25,254 $89,025 $290,394 2.29%
368 Accounting and related services $71,191 $11,454 $52,384 $135,029 0.93%
369 Architectural, eng. and related services $12,141 $3,799 $8,107 $24,047 0.16%
370 Specialized design services $4,151 $459 $2,752 $7,362 0.05%
371 Custom computer programming services $271,597 $85,291 $205,431 $562,319 3.54%
372 Computer systems design services $139,396 $45,082 $164,325 $348,803 1.81%
373 Other computer related servicest $164,047 $24,347 $59,687 $248,081 2.14%
374 Mgmt., scientific, and technical consulting $270,737 $71,572 $178,432 $520,741 3.52%
377 Advertising and related services $47,204 $8,638 $33,704 $89,547 0.61%
380 Other misc. prof., sci. and tech. svs. $129,491 $16,260 $55,648 $201,398 1.69%
381 Management of companies $3,519,585 $1,000,656 $1,599,480 $6,119,721 45.82%
382 Employment services $5,303 $848 $9,940 $16,090 0.07%
384 Office administrative services $70,109 $23,416 $52,807 $146,332 0.91%
386 Business support services $3,080 $907 $4,683 $8,670 0.04%
404 Promoters and agents for public figures $44,128 $19,978 $48,538 $112,643 0.57%
424 Grantmaking and social advocacy orgs. $9,659 $4,680 $7,122 $21,460 0.13%
Totals $7,681,416 $2,172,583 $3,836,790 $13,690,788 100.00%

20
Table 7 – FIA Firms Industry Value Added Impacts (1,000s)
INDIRECT TAXES
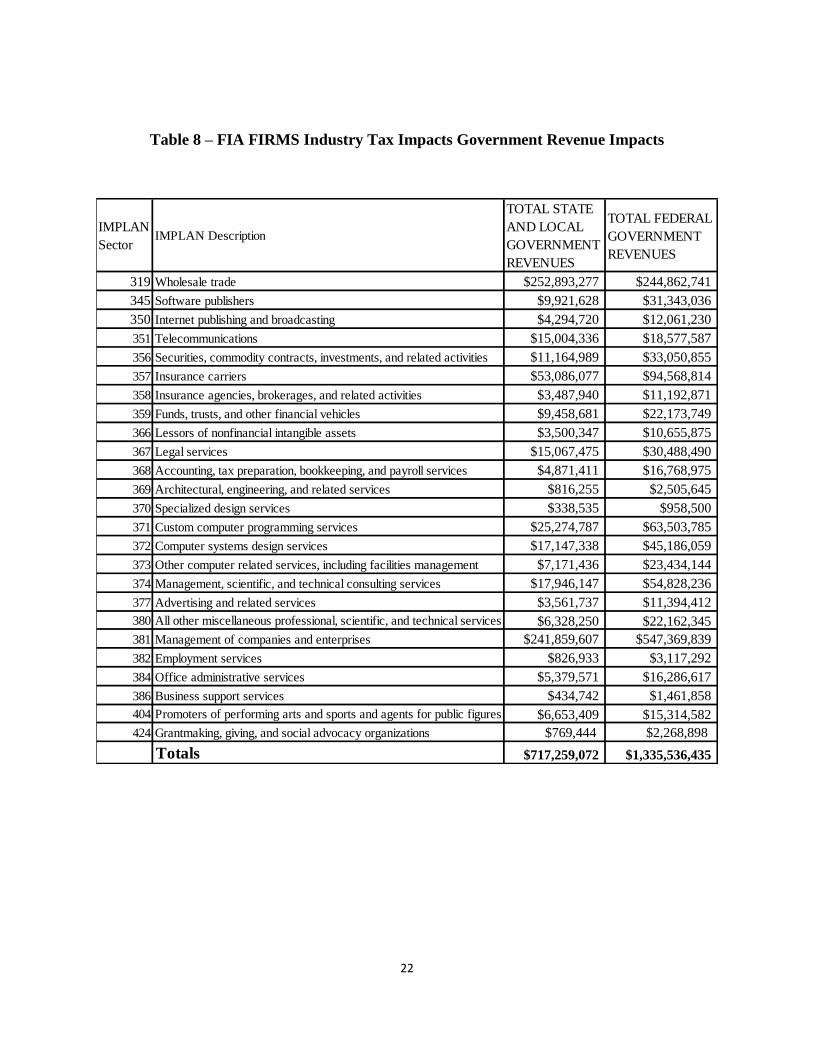
Table 8 shows state and local and federal tax impacts or receipts, respectively, for the
Intangible Industries identified. The IMPLAN model identifies these taxes as “indirect” taxes
which includes, in Nevada, primarily sales and use taxes and the Modified Business Taxes (a
payroll tax) paid by FIA Firms and their employees because Nevada does not have either a
personal or business income tax. Table 8 does not include property taxes which collectively
(direct, indirect and induced) would be considerable. The IMPLAN results do not show the
direct, indirect and induced impacts as in previous tables; it only shows the total tax impacts.
A total of $747.3 million in state and local revenue is generated by FIA Firms and their
employees. The results imply that each direct employee leads to about $16,400 in state and local
revenues, and $1.3 billion in federal tax revenues. Even if we consider total employment (i.e.,
direct, plus indirect and induced employment) from Table 1 of 92,382, that still amounts to
$7,700 per job created in state and local revenues.
IMPLAN
SectorIMPLAN Description DIRECT INDIRECT INDUCED TOTAL %
319 Wholesale trade $1,180,982 $155,379 $419,892 $1,756,253 21.7%
345 Software publishers $136,129 $41,394 $54,848 $232,371 2.5%
350 Internet publishing and broadcasting $40,770 $14,101 $26,365 $81,236 0.7%
351 Telecommunications $102,730 $33,120 $24,808 $160,658 1.9%
356 Securities, commodity contracts, investments, and related activities $90,980 $60,129 $64,344 $215,454 1.7%
357 Insurance carriers $488,213 $132,715 $145,889 $766,816 9.0%
358 Insurance agencies, brokerages, and related activities $38,987 $15,085 $22,577 $76,649 0.7%
359 Funds, trusts, and other financial vehicles $88,426 $27,089 $42,247 $157,762 1.6%
366 Lessors of nonfinancial intangible assets $99,014 $12,188 $8,068 $119,270 1.8%
367 Legal services $150,893 $16,633 $57,190 $224,716 2.8%
368 Accounting, tax preparation, bookkeeping, and payroll services $74,514 $7,462 $33,645 $115,622 1.4%
369 Architectural, engineering, and related services $8,762 $2,436 $5,206 $16,404 0.2%
370 Specialized design services $4,906 $296 $1,767 $6,969 0.1%
371 Custom computer programming services $219,586 $59,181 $131,925 $410,693 4.0%
372 Computer systems design services $125,039 $28,402 $105,547 $258,988 2.3%
373 Other computer related services, including facilities management $139,486 $15,405 $38,339 $193,231 2.6%
374 Management, scientific, and technical consulting services $205,198 $45,363 $114,614 $365,175 3.8%
377 Advertising and related services $53,352 $5,557 $21,642 $80,551 1.0%
380 All other miscellaneous professional, scientific, and technical services $134,422 $10,431 $35,734 $180,586 2.5%
381 Management of companies and enterprises $1,925,277 $625,981 $1,026,292 $3,577,550 35.4%
382 Employment services $12,409 $532 $6,380 $19,321 0.2%
384 Office administrative services $53,452 $14,719 $33,903 $102,074 1.0%
386 Business support services $5,479 $584 $3,006 $9,069 0.1%
404 Promoters of performing arts and sports and agents for public figures $57,096 $12,234 $31,169 $100,500 1.0%
424 Grantmaking, giving, and social advocacy organizations $7,189 $2,706 $4,571 $14,465 0.1%
Totals $5,443,291 $1,339,124 $2,459,967 $9,242,382 100.0%

21
Table 8 does not include property taxes. IMPLAN has no provision for property taxes
because each county, etc. assesses differently and property taxes are “direct” taxes as opposed to
taxes imputed by the model.
By using rules of thumb used by the residential real estate brokers and lenders, there is a
ratio between personal income and debt payments as to personal income to mortgage financing
availability. Based upon the ratio of house value to gross income (2.5 times) and the tax rates for
Clark County and Washoe County where the preponderance of Nevada office workers live (we
assume 80% in Clark and 20% in Washoe), after adjustments, residential property taxes paid by
the 55,000 families would be about $114,000,000. This is a conservative number as it assumes
these families have one-income earner, rather than two.
This may well be a serious under estimate as many of these families may be two-income
earners, one at a FIA Firm and one not with a FIA Firm.
22
Table 8 – FIA FIRMS Industry Tax Impacts Government Revenue Impacts
IMPLAN
SectorIMPLAN Description
TOTAL STATE
AND LOCAL
GOVERNMENT
REVENUES
TOTAL FEDERAL
GOVERNMENT
REVENUES
319 Wholesale trade $252,893,277 $244,862,741
345 Software publishers $9,921,628 $31,343,036
350 Internet publishing and broadcasting $4,294,720 $12,061,230
351 Telecommunications $15,004,336 $18,577,587
356 Securities, commodity contracts, investments, and related activities $11,164,989 $33,050,855
357 Insurance carriers $53,086,077 $94,568,814
358 Insurance agencies, brokerages, and related activities $3,487,940 $11,192,871
359 Funds, trusts, and other financial vehicles $9,458,681 $22,173,749
366 Lessors of nonfinancial intangible assets $3,500,347 $10,655,875
367 Legal services $15,067,475 $30,488,490
368 Accounting, tax preparation, bookkeeping, and payroll services $4,871,411 $16,768,975
369 Architectural, engineering, and related services $816,255 $2,505,645
370 Specialized design services $338,535 $958,500
371 Custom computer programming services $25,274,787 $63,503,785
372 Computer systems design services $17,147,338 $45,186,059
373 Other computer related services, including facilities management $7,171,436 $23,434,144
374 Management, scientific, and technical consulting services $17,946,147 $54,828,236
377 Advertising and related services $3,561,737 $11,394,412
380 All other miscellaneous professional, scientific, and technical services $6,328,250 $22,162,345
381 Management of companies and enterprises $241,859,607 $547,369,839
382 Employment services $826,933 $3,117,292
384 Office administrative services $5,379,571 $16,286,617
386 Business support services $434,742 $1,461,858
404 Promoters of performing arts and sports and agents for public figures $6,653,409 $15,314,582
424 Grantmaking, giving, and social advocacy organizations $769,444 $2,268,898
Totals $717,259,072 $1,335,536,435
23
MARKET OVERVIEW AND NEVADA POTENTIAL
The principle policy issues facing FIA Firms includes business climate in general, but
this involves a large number of factors – quality of life issues like environmental quality and
recreational opportunities, public safety, education opportunities and quality, infrastructure, and
business issues like taxes and regulations. Below we will give a general overview of these issues
in Nevada from the perspective of employers and employees in intangible industries.
But first it is important to recall that there are over 10,000 FIA Firms in the state with
over 55,000 direct employees. There are a few relatively large employers among the group such
as Microsoft Licensing, but by in large, we are talking about operations with five or fewer
employees.
It is not a criticism of economic development authorities to point out that they have not
been successful in recruiting these kinds of firms because they are difficult to identify and
recruit. Additionally, a ribbon cutting ceremony at a distribution center employing several
hundred employees is much more newsworthy and easier for the public to understand than a
capital asset management firm with five employees. Nonetheless, the data above shows that FIA
Firms are highly desirable, if elusive, targets for economic recruitment efforts.
Most of these FIA Firms are relatively unpublicized and prefer a low profile. Despite
such preference, Apple, Inc.’s subsidiary Braeburn Capital, according to Wikipedia on-line
encyclopedia, had $97 billion in cash and securities under management in 2011 received much
press recently.9 Apple’s Braeburn Capital reportedly only employs a very small number of
persons in Northern Nevada. Apple has also recently announced plans to develop a data storage
center east of Sparks and a campus/business park near downtown Reno. Consequently, Apple
will become one of the larger employers with FIA Firm implications in Nevada if plans work
out.
9 http://en.wikipedia.org/wiki/Braeburn_Capital. However, it should be noted that Wikipedia is not generally
considered to be an authoritative source.

24
Another well-known FIA Firm in northern Nevada is Microsoft Licensing which is
located in Reno and is a fairly large employer among FIA Firms. The Nevada location allows
Microsoft to take advantage of Nevada’s tax structure. Microsoft’s headquarters are in
Washington State which has a gross receipts tax and would tax Microsoft’s worldwide sales.
This would be like Nevada imposing a Gross Gaming Receipts tax on a Nevada gaming
corporation’s earnings in Macao or Mississippi. In Nevada, Microsoft pays the same taxes other
Nevada businesses pay on property, sales and use taxes, and payroll taxes.
But a look at Microsoft Licensing’s website10
suggests the importance of Northern
Nevada’s physical environment in location selection and employee recruitment. The photos on
the site show the shoreline of Lake Tahoe, skiing, and mountain biking. Hence, while Nevada’s
tax structure provides a significant inducement for locating in Nevada, the physical environment
is also significant for recruiting and retaining employees.
Other well known corporations with financial management operations in northern Nevada
are Oracle and Harley-Davidson. While both firms produce tangible goods like Apple, Oracle
also produces intangible goods like Java software and other software products. Also, like Apple,
they maintain a financial management subsidiary in Northern Nevada.
Harley-Davidson Financial Services is basically an industrial bank that provides
financing for Harley-Davidson’s customers to finance their purchases, much like General Motors
Acceptance Corporation (GMAC, which is now Ally Bank) which finance the purchase of GM
cars and trucks for buyers. Like most of the other examples listed above, Harley-Davidson has a
very small physical footprint in Nevada, but it clearly fits the mold of a FIA Firm. And recall,
there are over 10,000 FIA Firms located in Nevada, most of which few people have ever heard
of, that are located here for precisely the same reasons.
10 http://mslicense.com/.
25
POLICY ISSUES
This brief discussion of policy issues of concern to FIA Firms is not intended to be an
exhaustive or detailed analysis of issues important to FIA Firms. In fact, some of the issues
discussed below, like Nevada’s location relative to California, are not a matter of policy but
geography. However, there are policy issues involved in how to take advantage of that location.
A big advantage Nevada has in attracting FIA Firms is that it is next to, but not much
like, California from a public policy perspective. California has an onerous tax and regulatory
regime which Nevada does not, and the flight of firms from California is well documented.
Since FIA Firms can locate wherever they wish, this has led some significant California-based
firms such as those noted above to locate financial and other intangible functions in Nevada.
Some of these strategic moves have been partly based on the proximity of these companies’
headquarters in Northern California, but it is primarily based on Nevada’s favorable tax and
regulatory regime compared to California.
A recent study by the Manhattan Institute11
uses IRS and U.S. Census data to show that
three states, Texas, Arizona and Nevada had the highest net immigration from California
between the 2000 and 2010 censuses. Over 200,000 Californians migrated to each of these states
with Nevada showing the highest migration rate (because of its smaller population). And, over
that decade, California emigrants brought over $5.6 billion in income to Nevada.
BUSINESS AND TAX ENVIRONMENT
Washington State’s Gross Receipts Tax (which is similar to the margins tax currently
being proposed by the Nevada State Education Association) was a significant factor in
Microsoft’s decision to locate its licensing division in Nevada. Nevada currently has no
corporate income tax but has a broad-based business tax in the form of the Modified Business
Tax (MBT), which is essentially a payroll tax assessed on payrolls paid to Nevada based
employees and is not a significant deterrent to FIA Firms locating in Nevada since these firms
11 Tom Gray and Robert Scardamalia, The Great California Exodus: A Closer Look, Manhattan Institute, Civic Report
No. 71, September 2012. http://www.manhattan-institute.org/html/cr_71.htm.

26
tend to be small, profitable, pay high salaries, provide health insurance (which is deductible
under the MBT regime), and provide other employee benefits. And, because FIA Firms pay such
high salaries, the MBT generates much more revenue per employee from FIA Firms than other
industries.
Education is clearly a significant input into FIA Firms. They are, after all, learning and
knowledge-based enterprises. Finance, management, technology, and related fields require a
highly educated workforce. However, it should also be pointed out that FIA Firms can import
educated employees from other states and countries. Markets for education and educated
employees are like financial markets, they are global in scope and reach.
Of much greater concern in trying to recruit FIA Firms with their educated professional
employees is the quality of education available for their children. One often hears expressions of
concern about trying to recruit FIA Firms to move to Nevada due to the perceived low-quality
education available for children in K-12 public schools. Low graduation rates and low
proficiency are cited. Nevada does have some good public schools and those recruited from out
of state will find them.
For the immediate term, the Governor and other elected officials have made improving
public education a very high priority (partly in keeping with their other high priority: Economic
Development). The Governor has spearheaded streamlining the Department of Education,
brought in a seasoned, accomplished Superintendent of Public Instruction and directed a
commission to outline the steps toward having an advanced electronic data system that tracks
both student and teachers’ performance.
For Nevada to continue attracting
FIA Firms, it needs to maintain its
business and tax friendly environment.

27
If both the education bureaucracy and teacher’s union can be enlisted to participate in real
reform, we can make real progress. Ever since Race to the Top was executed, a variety of
reforms have been under discussion, such as Choice, Merit Pay, etc.
We believe that we should let the Governor, the Legislature and the Department of
Education carefully sort out the needs and cost of public education first, rather than clamoring
for or against taxes at this time. Funding for public education is clearly a priority for FIA Firms
but proposals for funding through tax increases should be considered with great caution. Indeed,
the two issues need to be considered separately and on their own merits. Taxes like Washington
State’s gross receipts tax, that tax economic activity outside of the state would clearly hurt FIA
Firms. Great care should be taken that any proposed new taxes do not interfere with Nevada’s
perceived high rank as business-tax friendly.
All in all, Nevada’s business climate and physical environment provide fertile ground for
FIA Firms. And, FIA Firms represent many of the growth industries of the future.
28
APPENDIX: MODEL AND DATA USED TO ESTIMATE EMPLOYMENT AND
INCOME MULTIPLIERS
By
Thomas R. Harris, Ph.D., Director
Center for Economic Development and Professor of Economics
University of Nevada, Reno
The economic impacts and secondary benefits of economic activity presented in this report are
measured by multipliers using an input-output model and data from IMPLAN, a model that is
widely used by economists and other academics in the United States. A computer spreadsheet
that uses state IMPLAN multipliers was developed by to enable community development
specialists to measure the secondary benefits of economic sectors on state, regional, or county
economies.
Input-output (I/O) analysis is designed to analyze the transactions among industries in an
economy (Miernyk 1965). These models are largely based on the work of Wassily Leontief
during the 1930s. Detailed I/O analysis captures the indirect and induced interrelated circular
behavior of the economy. For example, an increase in the demand for intangible industries
requires more equipment, more labor, and more supplies, which, in turn, requires more labor to
produce the supplies, and so on. By simultaneously accounting for structural interaction between
sectors and industries, I/O analysis gives expression to the general economic equilibrium
systems. The analysis utilizes assumptions based on linear and fixed coefficients and limited
substitutions among inputs and outputs. The analysis assumes that average and marginal I/O
coefficients are equal. Nonetheless, the framework has been widely accepted and used by
economists and policymakers. I/O analysis is useful when carefully executed and interpreted in
defining the structure of a region, the interdependencies among industries, and forecasting
economic outcomes. The I/O model coefficients describe the structural interdependencies of an
economy. From the coefficients, various predictive devices can be computed, which can be
useful in analyzing economic changes in a state, region, or county. Multipliers indicate the
relationship between some observed change in the economy and the total change in economic
activity created through the economy.
MicroIMPLAN is a computer program developed by the United States Forest Service to
construct I/O accounts and models (Alward, et al. 1989). Typically, the complexity of I/O
modeling has hindered practitioners from constructing models specific to a community
requesting an analysis. Too often, inappropriate multipliers have been used to estimate local
economic impacts. In contrast, IMPLAN can construct a model for any state, region, county, or
zip code area in the United States by using available state, region, county, or zip code data.
Impact analysis can be performed once a regional I/O model is constructed.
Five different sets of multipliers are estimated by IMPLAN, corresponding to five measures of
regional economic activity: (1) total industry output, (2) personal income, (3) total income, (4)

29
value added, and (5) employment. Three types of multipliers are generated. Type I multipliers
measure the impact in terms of direct and indirect effects. Direct impacts are the changes in the
activities of the focus industry or firm, such as the construction of an intangible industry business
or the closing of an intangible industry business. The focus business changes its purchases s
inputs as a result of the direct impacts. This produces indirect impacts in other business sectors.
However, the total impact of a change in the economy consists of direct, indirect, and induced
changes. Both the direct and indirect impacts change the flow of dollars to the state, region, or
county’s households. Subsequently, the households alter their consumption. The effect of the
changes in household consumption on businesses in a community is referred to as an induced
effect. To measure the total impact, a Type II multiplier is used. The Type II multiplier compares
direct, indirect, and induced effects with the direct effects generated by a change in final demand
(the sum of direct, indirect, and induced effects divided by direct effects). IMPLAN also
estimates a modified Type II multiplier that also includes the direct, indirect, and induced effects.
The Type III multiplier further modifies the induced effect to include spending patterns of
households based on a breakdown of households by nine different income groups.
Additional information on the data, methodology, and software requirements of I/O modeling
and IMPLAN analysis can be found in guides developed by Alward, et al., (1989), and the
Minnesota IMPLAN Group (MIG) (2010).
APPENDIX REFERENCES
Alward, G., et al. Micro IMPLAN Software Manual. Stillwater MN: University of Minnesota
Press, 1989.
Miernyk, W.H. The Element of Input-Output Analysis. New York: Random House, 1965.
Minnesota IMPLAN Group, Inc. “Version 3.0 Users’ Guide”. Minnesota IMPLAN Group, Inc.:
Hudson, WI, 2010.
Minnesota IMPLAN Users’ Group, Inc. “IMPLAN System Data: Mono, County, 2010”,
Minnesota IMPLAN Users’ Group, Inc.: Hudson, WI, 2012.