AN ECONOMIC ANALYSIS OF A MECHANIZED SYSTEMS …
76
AN ECONOMIC ANALYSIS OF A MECHANIZED SYSTEMS APPROACH TO CASSAVA PRODUCTION IN SUB-SAHARAN AFRICA BY KEVIN MONK THESIS Submitted in partial fulfillment of the requirements for the degree of Master of Science in Agricultural and Applied Economics in the Graduate College of the University of Illinois at Urbana-Champaign, 2015 Urbana, Illinois Master’s Committee: Associate Professor Paul McNamara, Chair Associate Professor Peter Goldsmith Professor Gary Schnitkey
Transcript of AN ECONOMIC ANALYSIS OF A MECHANIZED SYSTEMS …

AN ECONOMIC ANALYSIS OF A MECHANIZED SYSTEMS APPROACH TO
CASSAVA PRODUCTION IN SUB-SAHARAN AFRICA
BY
KEVIN MONK
THESIS
Submitted in partial fulfillment of the requirements
for the degree of Master of Science in Agricultural and Applied Economics
in the Graduate College of the
University of Illinois at Urbana-Champaign, 2015
Urbana, Illinois
Master’s Committee:
Associate Professor Paul McNamara, Chair
Associate Professor Peter Goldsmith
Professor Gary Schnitkey

ii
Abstract
The importance of increasing African agriculture productivity is gaining attention
as population is expected to grow by 1.3 billion people between now and the year 2050
(Haub & Kaneda, 2013). Adoption of mechanization has long been eyed as an important
component that could propel Sub-Saharan Africa to increased levels of productivity.
Historically, however, increased adoption of mechanization has failed partially because of
a short-term focus (Houmy, Kienzle, & Ashburner, 2012), because of not accounting for
non-agriculture uses of machines (Mrema, Baker, & Kahan, 2008; Takesima, Nin-Pratt, &
Diao, 2013), because of technology transfer issues (Akinola, 1987), and because there has
been a singular focus on substituting mechanized tillage for hand tillage (Mrema, Baker,
& Kahan, 2008; Houmy, Clarke, Ashburner, & Kienzle, 2013). The singular focus on
tillage to mechanize agriculture without looking at a complete mechanized system
approach is part of the reason for previous failures (Houmy, Kienzle, & Ashburner, 2012).
A complete mechanized systems approach, including not only tillage, but planting,
spraying, weeding, and harvesting, along with how those operations are delivered to the
smallholder farmer, needs to be considered to better understand the opportunity for
smallholder mechanization in cassava production.

iii
Table of Contents
Chapter 1 – Introduction ………………………………………………………… 1
Chapter 2 - Literature Review …………………………………………………… 5
Chapter 3 – Methodology …...…………………………………………………… 22
Chapter 4 – Survey Highlights …………………………………………………… 34
Chapter 5 – Cost Analysis Model Output and Discussion ………………………. 39
Chapter 6 – Service Delivery Output and Discussion …………………………… 45
Chapter 7 – Conclusions ………………………………………………………… 52
Chapter 8 – Areas for Future Study …………………………………………….. 58
Appendix A - List of Figures and Tables……………………………………....... 59
Appendix B – Sahel Capital Smallholder Survey Questionnaire……………….. 60
Appendix C - Sahel Capital Service Provider Questionnaire.……….………….. 65
References ………………………………………………………………………. 70

1
Chapter 1 - Introduction
Low agriculture output in Sub-Saharan Africa and the current lack of self-sufficient
production throughout that region has been the topic of discussion and debates for several
decades. Despite the intense focus and research in the area, agricultural productivity in
Sub-Saharan Africa is among the lowest in the world (Cunguara & Darnhofer, 2011). The
importance of increasing African agriculture output in the region is gaining even more
attention as there is projected population growth of 1.3 billion people between now and the
year 2050. With this growth, Africa will add more population than any other world region.
Virtually all of that growth will be in the 51 countries of Sub-Saharan Africa, the region’s
poorest (Haub & Kaneda, 2013). The need for this area to increase agriculture output and
provide sustainable nutrition to its people is a critical component to meeting the first of the
United Nations Millennial Development Goals, which is to eradicate extreme poverty and
hunger. This thesis investigates the potential contribution of agriculture mechanization to
increasing the productivity of smallholder farmers in the case of the cassava value chain in
Sub-Saharan Africa.
Much of the concern for Sub-Saharan Africa revolves around the ability for
smallholder farmers to provide food and any possible surplus for their families.
Apprehension for the sustainability of the smallholder farmer and their low farm
productivity has long dominated food policy discussions about Sub-Saharan Africa
(Woodhouse, 1989). Africa’s smallholder farmers make up at least 73% of all rural
Africans. The main reason for concern with smallholder productivity and sustainability is
because agriculture production in Africa has virtually been dominated by smallholder
farmers who are known to produce up to 90% of the food consumed in some countries on

2
the continent (Odulaja & Kiros, 1996). New technology is a must if smallholders are to
achieve sustainable increases in production. Adoption of mechanization has long been
eyed as an important component that could propel Sub-Saharan Africa to increased levels
of productivity. Trends in mechanization worldwide show that there are strong correlations
between economic growth and mechanization (Mrema, Baker, & Kahan, 2008). While
there have been several attempts at bringing in mechanization into Sub-Saharan Africa, it
is widely accepted that most of these attempts have failed. It seems the situation of the
smallholder has improved little with most of the previous attempts. The fragmented
approach to mechanize agriculture without looking at the complete mechanized system is
part of the reason for previous failures (Houmy, Kienzle, & Ashburner, 2012).
Recent attempts at improving the productivity of smallholder farmers in Sub-
Saharan Africa have begun to look differently at the production cycle. New attempts for
improved production are beginning to take a more systems approach. A systems approach
to farming looks at all aspects of the farming cycle together, and takes into consideration
how those pieces are interconnected. The systems approach takes into account how one
activity impacts other activities in the system. A mechanized system approach implements
the use of mechanization throughout the farming cycle. It not only looks at how
mechanization impacts production efficiencies, but how the use of machinery impacts the
agronomic output. It connects agronomy to the use of machinery through the quality and
timeliness of mechanized activities. It breaks down the silo view of production activities
and looks at the bigger picture of how activities impact results downstream. A recent
example of a good mechanized systems approach to agriculture is the Cassava
Mechanization and Agro-Processing Project (CAMAP) that is being implemented by the

3
African Agricultural Technology Foundation (AATF). The AATF is working with
smallholder farmers in this project to demonstrate that cassava yield improvements are
achievable when a systems approach to farming is used, with the additional side benefit of
improved overall labor efficiency. Through the use of good seed stock, proper fertilizers
appropriate chemicals, and a complete mechanized system to deliver the production
activities, results from the first year of this project, 2013, were very positive. Yield
improvement in one region, Osun State, Nigeria, the CAMAP cassava increased from an
average 7 tons per hectare to an average of 28 ton per hectare with some farmers getting as
much as 33 tons per hectare (Marechera, 2014). Obviously not all of the yield increase
that was realized in the CAMAP project can be attributed solely to mechanization, but a
combination of mechanization delivering good agronomic inputs and farming practices.
Cassava is the second most important food staple in Africa, after maize, in terms of calories
consumed (Oni & Oyelade, 2013). Given the aforementioned population increase,
sustainable yield increases of cassava will be important to meeting nutritional needs. A
mechanized systems approach to production will be key to deliver the required yield
increase.
Previous researchers developed budget models to evaluate the sustainability of
individual mechanized services, namely plowing (Houssou, Diao, Cossar, Kolavalli,
Jimah, & Aboagye, 2013). The conclusion from previous mechanization assessments is
that mechanization services are unsustainable. As noted earlier, a disconnected approach
to delivering mechanization causes issues with the feasibility of delivering services. A
focus on only one aspect, primary tillage, results in equipment utilization rates to be
unprofitable. The mechanized systems approach to production not only increases yield

4
benefits for the smallholder, but increases utilization for the equipment provider as to make
operating the equipment sustainable. Budget models that only focus on a single aspect of
mechanization disregard a major portion of the farming cycle. A systems approach to
mechanization takes into account more of the farming cycle. Despite previous analysis
showing unsustainability of mechanized services in Sub-Saharan Africa, a system
approach to mechanization including not only tillage, but planting, spraying, weeding, and
harvesting, along with how those operations are delivered, needs to be considered to better
understand the opportunity for smallholder mechanization in cassava production.

5
Chapter 2 – Literature Review
Production agriculture not only serves as a way for a country to grow the food,
fiber, fuel and feed needed to support its people and livestock, it is also a livelihood for the
people involved, and way for them to earn the economic returns needed to support their
households and create surplus. Agriculture has the potential to generate economic growth
in developing economies. Agriculture contributes to both income growth and poverty
reduction in developing countries by generating income and employment in rural areas, as
well as for providing food at reasonable prices in urban areas (Dethier & Effenberger,
2012). The maximum capacity of a region to produce food and grow income from
agriculture is directly tied to the ability of the land to produce food. This ability is limited.
Limits of production are set by soil and climatic conditions, in addition to the management
applied to the land (Hassett & Banwart, 1992). For the most part, the soil and climatic
conditions are out of human control, but one factor that can be controlled is the
management applied to the land. Sub-Saharan Africa has climates and soil types capable
of agriculture production (see Figure 1) so finding the best management practices suited to
the region gives us the opportunity to increase output. For instance, as Hassett and
Banwart point out,
the Food and Agriculture Organization of the United Nations predicts that for low
level inputs, Zaire can support 1.3 people/hectare (ha), for a medium level of inputs
Zaire can support 5.4 people/ha, and for a high level of inputs Zaire can support
12.44 people/ha. Low level inputs assumes only hand labor, no fertilizer or
pesticide application, no conservation measures, and cultivation of presently grown
mixtures of crops on potentially cultivable rain fed land. An intermediate level of

6
inputs assumes the use of improved hand tools or draft implements, some fertilizer
and pesticides some simple soil conservation measures and cultivation with both
the present mixture of crops as well as some use of the most calorie-protein
productive crops on potentially cultivable rain fed land. A high level of inputs
assumes complete mechanization, full use of optimum plant genetic material,
necessary farm chemicals and soil conservation measures and cultivation of only
the most calorie-protein productive crops on potentially cultivable rain fed lands
(1992).
Figure 1. Global Soil Regions (2005). Regions by Soil Order.
2.1 Production Management Practices
Historically, the management practices for agriculture output growth in Africa has
been from focusing on extensification because of available area and low pressure to
intensify production. Agriculture output has been growing mostly due to land expansion
while yields have been stagnant. There is the realization that in much of Africa, the
extensification path is rapidly becoming unsustainable or impractical as land grows scarcer
in the face of population growth (Reardon, Barrett, Kelly, & Savadogo, 1999).
Several considerations need to be taken into account when looking at the
desirability of land expansion from the farmer’s perspective, i.e. as a function of: (a) bio-

7
physical and agro-ecological factors; (b) output prices, input costs, and transport costs; (c)
the influence of disease and conflict on settlement patterns; (d) the costs farmers face in
preparing land for cultivation; and (e) the strength of institutions and policies to protect
local communities’ land rights (Chamberlin, Jayne, & Headey, 2014). Understanding all
of the complexities involved with extensification, the potential for land expansion could
soon be exhausted in Africa (Dethier & Effenberger, 2012). Thus, in order to realize the
agriculture output required to feed and support the growing population, further growth will
have to come from yield increases.
Conventional wisdom would then say that intensification in agriculture will emerge
as the way to increase yields when extensification becomes unable to continue as the path
for output growth. As a result, in order to increase output, farmers will need to change
their farming management to practices that focus on yield gains over just farming new
areas. This assumes major increases in productivity will take place that depend on a range
of factors such as new technologies and their adoption, access to training, farm size and
access to land, and environmental challenges (Dethier & Effenberger, 2012).
There are a myriad of considerations that need to come together in order for
sustainable agriculture intensification to evolve in Sub-Saharan Africa. According to
Dethier and Effenberger, agricultural research and development and its capacity to produce
more productive technologies are at the heart of long run agricultural growth. Households
that derive their main income from farm activities can benefit from improved agricultural
technologies. The potential to learn about and make full use of these new technologies
also depends on the available information about new technologies and their profitability.
Additionally, current land tenure and property rights throughout much of Sub-Saharan

8
Africa drives smaller land holdings. Titling of land can increase productivity in the
agricultural sector if it increases investment incentives or relaxes credit constraints for
landholders. Finally, the issue of the sustainability of agricultural systems is high on the
agenda, and the preservation of ecosystems and biodiversity will be important for the
potential of agriculture in the future (Dethier & Effenberger, 2012).
The best instrument to protect farmers from income shocks is to increase agriculture
productivity (Dethier & Effenberger, 2012). Increasing productivity requires more
intensive agriculture. More intensive agriculture cannot happen without more power
available to perform work because agriculture intensification creates a power bottleneck
(Pingali, 2007).
2.2 Available Farm Power
The power that farmers have available to them to perform production functions is
a factor in determining output. The three main sources for agriculture power utilized in
Sub-Saharan Africa are human, animal and mechanized. When farming intensities
increase, the number of tasks performed increases, as does the energy required for each of
the tasks, hence the need for adaptation of mechanical technology (Pingali, 2007). Farm
productivity is directly related to the farm power available, which implies that significant
increases in agricultural production can only be achieved through increasing power-based
mechanization (Kienzle, Hancox, & Ashburner, 2010). Farming methods with no
mechanization place a physical limit on the amount of land that can be cultivated and can
lessen the timeliness of farming operations like land preparation, planting, fertilizing, and
harvesting (Skelton, Limiac, Lumkes, 2014). The capability to perform arduous tasks
over long hours, and the cost associated with these sources of power, vary greatly. An

9
adult human can produce approximately 150 W (.2 hp) of power or .15 kW-h of
energy/hour while working continuously. A good diesel tractor can produce 3.0 kW-h of
energy/L (15.2 hp-h/gal) of fuel (Goering, 1992). Tests performed at the University of
Nebraska Tractor test lab in Lincoln Nebraska show that an 80 hp tractor, which is the size
of tractor AATF used in the CAMAP projects, produces 3.05 kW-h of energy/L at rated
speed, while using 19.63 L/h. This would equate to producing nearly 60 kW-h of energy
for that same hour (Nebraska Tractor Test 1961, 2009). The increase in power (energy)
available when moving from manual to mechanized farming enables farms to overcome
power bottlenecks created by intensification.
In their 2006 study, Nkakini, Aytamunno, Ogaji, & Probert, documented how the
increase in power allows for major improvements in productivity. When studying cassava
and yam production in Nigeria they noted that 32.6 man days/ha of manual labor were used
for land prep to achieve the same as .1 machine days/ha with machine power. Further
operational differences in their study were; ridging cassava, 43.8 man days/ha by hand and
.15 man days/ha machine; mound making and yam planting 57.8 man-days/ha and .18
machine days/ha; first generation weeding, 40 man days/ha and .14 machine days-ha; root
weeding, 36.7 man-days/ha or .12 machine days/ha.
It is evident the management choice a farmer has in choosing to use mechanization
will have an impact on the work that they will be able to get done. The amount of work
that is done directly impacts the output levels. The number of people a farmer can feed is
related to his output levels. Comparing the output from the three sources of power, with
manual labor a man can feed himself and up to three other humans, using animal draught
power a man can feed himself and up to six others, when integrating mechanical power

10
into a farming system a man can feed himself and up to 50 others (Ashburner & Kienzle,
2011). This is important to remember as we consider historically, Sub-Saharan Africa
has used the lowest level of mechanical power (Ehui & Polson, 1993).
2.3 Mechanization Benefits
Farm mechanization is an opportunity to increase yields and reduce loss in addition
to lowering cost. Mechanization of farm work has three primary objectives: reduce the
drudgery of farm work, increase the productivity of farm workers, and increase the
timeliness and quality of farm work (Goering, 1992). According to Goering, the hard
work and low pay of many farm operations is what drives many younger children off the
farm. Mechanization allows for the work to be less difficult and the skill required to
operate the machines often times increases wages. Mechanization has also been a major
contributor to the increases in hectares completed per hour of work. However, since a
problem of the developing countries is one of increasing the production of food, the highest
priority for power and equipment should be for kinds that will contribute to increased yields
(Giles, 1967). Mechanization can increase yield through timelier performance of
operations and higher quality performance of operations. There is an optimum time for
performing critical farming operations such as planting and harvesting. Crop yields tend
to be highest when these critical operations are done closest to the optimum time (Goering,
1992). Mechanization allows for timelier performance of critical operations, thus helping
to increase yields. Additionally, mechanization improves the quality of the farm operation.
For example, plows pulled by the farm tractor can plow deeper and at a more consistent
depth than manual plowing. This breaks up any underlying hardpan in the soil, allows for

11
better mixing of the soil, and permits deeper root penetration. This is also important for
cassava as it allows for easier expansion for the cassava tuber underground.
2.4 Productivity through Mechanization
Accelerated growth in agriculture needs to be driven by enhanced productivity like
the Green Revolution in Asia rather than through land expansion (Shamsudeen, Paul, &
Samuel, 2013). The appropriate choice of, and successive proper use of, mechanized inputs
into agriculture has a direct and significant effect on the achievable levels of land
productivity and labor productivity, as well as with the profitability of farming,
sustainability of the environment, and enhancement of the quality of life of the people
engaged in agriculture (Adewoyin, & Ajav, 2013). The Green Revolution in Asia increased
land productivity faster than labor productivity, with the result being that agriculture was
able to absorb more labor and helped to reduce poverty (de Janvry, & Sadoulet, 2009).
Tractor mechanization in Asia in the 1960s and 1970s accelerated due to increased demand
for timely land preparation caused largely by the introduction of high yielding varieties of
wheat and rice, and the opportunities that arose for intensifying agricultural production.
The resulting introduction of tractors by farmers on the larger land holdings not only led to
timely land preparation, but also an expansion of the cultivated area and increased cropping
intensity (Kienzle, Hancox, & Ashburner, 2010). Agriculture mechanization is an essential
factor for growing agriculture output (productivity) and reducing poverty (and hunger)
among smallholder households is (Takesima, Nin-Pratt, & Diao, 2013). Countries that
have achieved unprecedented economic growth over the past three decades and have
succeeded in solving their food problems have also advanced to higher levels of
mechanization in their agriculture (Mrema, Baker, & Kahan, 2008).

12
As previously mentioned, the quality of production activities is increased with
mechanization, as well as the timeliness of activities. Both of these factors are drivers of
yield. One example of how mechanized operations increased production was cited by
Itodo and Daudu. They reported that substantial improvements were possible with the
cassava harvester as the range of breakages of the same cultivar tested after hand harvesting
reduced from 32.0 per cent to 2.6 per cent (2013). Increased yield allows for increased
income opportunity for farmers when there is a market outlet for crops.
2.5 Mechanization Programs
African governments and donor agencies have encouraged farmers to use
agricultural machinery through many supply sided development programs and tractor
hiring schemes (Houssou, Diao, Cossar, Kolavalli, Jimah, & Aboagye, 2013). While
multiple efforts tried to increase tractor usage, these efforts have not seemed to bring the
lasting benefits expected from mechanization. If the goal of Sub-Saharan Africa is to
increase production, and if the relationship between mechanization and productivity is so
evident, the question that we are left with is why has Sub-Saharan Africa failed to adopt
mechanization more widely?
One of the obvious reasons is that the size of the majority of farms in Sub-Saharan
Africa is too small to justify the return for the smallholder farmer to purchase mechanized
equipment to perform production activities. Overall, the vast majority of farms in Africa
are below two hectares, with median farm size near one hectare in most countries (Collier
& Dercon, 2014). Additionally, many smallholders do not have access to credit and cannot
obtain loans. It is evident that due to capital constraints, every farm household cannot own
a tractor, but they do need to have access to tractor-based services.

13
Governments have introduced tractor hire schemes in the past to promote access to
tractor based services, but these have, in most cases, been abandoned as uneconomical
(Kienzle, Hancox, & Ashburner, 2010). Previous attempts to mechanize agriculture, which
took place from the 1950s until the early 1980s, resulted in large quantities of tractors
supplied to developing countries in the form of aid (Benin, 2014). In many of these cases,
the governments of these developing countries heavily incentivized the price and interest
rate of a tractor and plow, with the intention of increasing the number of working tractors
out in the field. Persons interested in obtaining a tractor could purchase the tractor and
implement at the subsidized price and interest rate, making payments to the government
agency in charge over a time period. These programs supplied people with equipment to
perform services, but often they lacked the training required to effectively operate and
maintain the equipment.
Evaluating one such tractor program effort in Ghana, Benin et al. (2012) discovered
that compared to tractors bought by private operators not in the government program, the
newer government tractors seem to break down more frequently, about 17-64 percent more.
The effect was that government sponsored tractors had 1.1 breakdowns per age-year and
0.7 per months of operation per year compared to 0.7 breakdowns per age-year and 0.6 per
months of operation per year for non-program tractors. Government program tractors
worked about four months in a year while those of non-government worked about five
months.
2.6 Agricultural Machinery Usage
Despite some progress, it is admitted that the role and use rate of agricultural
machinery is still below that which could be expected (Houmy, Kienzle, & Ashburner,

14
2012). In 1961, Sub-Saharan Africa had 2.4, 3.3, and 5.6 times more tractors in use than in
Brazil, India, and the People’s Republic of China respectively, but by the year 2000 the
reverse was the case, and India, the People’s Republic of China and Brazil had respectively
6.9, 4.4, and 3.7 times more tractors in use than in the entire Sub-Saharan Africa, including
South Africa (Mrema, Baker, & Kahan, 2008). Many projects failed and now Africa is
less mechanized than the land-scarce, labor abundant countries of south Asia. Additionally,
there is widespread acknowledgement that previous attempts to “transfer” technology, or
bring in large quantities of mechanized power to African farmers have largely failed to
improve food output (Woodhouse, 1989).
As noted by Houssou et al. (2013), low operational acreage caused agriculture
service provider businesses not to be viable. Additionally, many of the government and
donor agency initiatives failed to achieve lasting results because supporting infrastructure
for the introduction of mechanization technology failed to materialize (Pingali, Bigot, &
Binswanger, 1987). Little development effort was given to the establishment of new and
efficient supply chains for agricultural machinery and spare parts. Technical training for
mechanics, technicians and engineers did not evolve as anticipated. Training and extension
facilities for the users of mechanical equipment were not established or upgraded. Finally
the entrepreneurial skills of commercial farmers and agribusiness managers failed to be
strengthened (Ashburner & Kienzle, 2011).
Similar challenges in farm size and labor availability were evident in Southeast
Asia, but that region has realized the benefits of mechanization. Thus, the question is why
have so many previous attempts at mechanization schemes in Sub-Saharan Africa failed to
produce the results seen in other regions of the world?

15
2.7 Failure of Mechanization Attempts in Africa
Increased adoption of mechanization has failed partially because of a short-term
focus (Houmy, Kienzle, & Ashburner, 2012), because of not accounting for non-agriculture
uses of machines (Mrema, Baker, & Kahan, 2008; Takesima, Nin-Pratt, & Diao, 2013),
because of technology transfer issues (Akinola, 1987), and because there has been a
singular focus on substituting mechanized tillage for hand tillage (Mrema, Baker, & Kahan,
2008; Houmy, Clarke, Ashburner, & Kienzle, 2013). It is this last issue of singular focus
which causes much of the mechanized inefficiency and unsustainability in Sub-Saharan
African mechanization. Production agriculture should be viewed as interconnected, where
each part of the farming cycle interacts with and depends upon the integration of
management practices throughout the system. Without transforming the entire farming
system accompanied by using modern inputs and technologies and mechanizing the chain
of farm operations, it is difficult to see how yields can be sustainably increased by
introducing tractors merely for land preparation (Benin, 2014).
2.8 Preoccupation with Tillage
The preoccupation with a tillage focus stems from an old adage in the
mechanization literature that mechanization starts with power intensive operations,
followed by operations and equipment that require greater precision (Binswanger &
Pingali, 1989). While there is truth behind this statement, solely focusing mechanization
efforts on these power intensive efforts, without consideration of the entire agriculture
system, has resulted in conclusions not favorable to mechanization. Because they have
only looked at one part of the farming cycle, previous studies have failed to approach the
system holistically, and then address the problem with a comprehensive solution. There

16
are many mechanization options and opportunities in addition and complementary to
mechanization of land preparation. Mechanization is about many types of power and
equipment, not just land preparation (Mrema, Baker, & Kahan, 2008).
Where mechanization has taken place in other parts of the world, there have been
fundamental interlinked changes in the structure of agricultural sectors, in the nature and
performance of agricultural support services, and in the livelihood strategies of farmers and
agro-processors. Distribution networks that can facilitate spare parts, service, and training
along with sales are a critical component in the supply chain structure. Engineering and
manufacturing entrepreneurs who develop innovative tools to perform production activities
and increase the utilization of tractors are important as well. These agribusinesses provide
opportunities for workers to be involved in the supply chain without working directly on
the farm. The reality is that mechanization is not just an issue of substituting motorized
power for hand power in land preparation. There is both the supply chain side as well as
the complete agronomic system side. For the most part, previous attempts focused mostly
on the simple substitution of tractor tillage for hand tillage, ignoring a major portion of the
farming cycle. The requirements of the complete supply chain were not established.
Additionally, the agronomic impacts to the production side of a complete system were not
evaluated (Houmy, Clarke, Ashburner, & Kienzle, 2013).
2.9 Impacts of a Complete Mechanized System
Management of the farming system includes the inputs used, such as seeds and
fertilizers, as well as the tools used prepare the soil, plant, care for, and harvest the crops.
Previously, the inputs and technology used to produce the crop were thought of as
independent and studied in separate silos. Inputs and the technology were managed

17
separately. Even highly acclaimed researchers thought that “Too much emphasis has been
placed on self-defeating effort to tie biological technology to mechanical technology”
(Pingali, Bigot, & Binswanger, 1987). However, advancements in biotechnology and
agriculture equipment have shown that the two work hand in hand. A recent study by
Jafari, Sabzevari, and Valilian (2014) on planting impact to chickpea yield is one example
that shows how these two factors are interconnected. This study compared different
mechanized planting methods to traditional hand planting methods. The results
demonstrated that the two mechanized planting treatments (the grain drill planter and
pneumatic row planter) increased the average crop yield from traditional hand planting
values (1753 kg/ha) to 2486 and 2379 kg/ha, respectively.
Looking at production as an interaction between the mechanical and agronomic
systems is not a new concept. Advantages of mechanization have been studied and noted.
Early study examples comparing hand and mechanized labor list a proper seedbed, placing
of fertilizer and uniform distribution of chemicals as major benefit drivers of
mechanization (Giles, 1967). Other studies conclude that mechanization allows for yield
increases as a result of timelier seedbed preparation, planting, weeding, and harvesting
(Bloom, 1979). More recently, the benefits were again stated that power and equipment
accomplish increased yields through more timely and effective operations. Mechanization
can contribute to increasing production, productivity, and profitability of agriculture by
improving the timeliness, quality, and efficiency of the operations (Benin, 2014). Benin
found that the impact of mechanization to perceived drudgery, farm practices, and yield
was positive, in that mechanization reduced the perception of drudgery and increased yield.

18
The quality of work that mechanization allows is a benefit to yield. The power
available with mechanization allows for uniform and consistent operations. When using
mechanization for deep tillage, the hard pan deep in the ground can be broken up which
facilitates the development of larger roots with an increased number of principle roots, thus
greater surface contact between root and soil. Improved root systems give the crops better
possibility to increase the intake and conservation of water and mineral, which eventually
leads to increases in production (Bloom, 1979).
Mechanization benefits can even be seen after the crop has reached maturity. A
timely harvest and improved harvesting will help save what is produced and minimize what
is lost (Giles, 1967). Additionally as noted in section 2.4, Itodo and Daudu reported that
substantial improvements were possible with the cassava harvester as the range of
breakages decreased with mechanical harvester. (2103). Along with yield and the
agronomic benefits, farmers who used mechanization for more services were more
technically efficient than farmers who used mechanization for fewer services (Shamsudeen,
Paul, & Samuel, 2013) and had higher quality product (Itodo & Daudu, 2013).
2.10 Discounting Mechanization Impacts
While these studies have shown the positive benefits of mechanized agriculture,
there have been other reports that discount the impact mechanization has on output
compared to manual or animal labor. Some researchers concluded that tractors do little to
boost yield (Pingali, Bigot, & Binswanger 1987; Binswanger, Pingali, 1989) while other
studies concluded that manual tillage is sufficient because they found no increase in
marketable yield (Tueche, Norgrove, Hauser, & Cadisch, 2013). Pingali, Bigot and
Binswanger acknowledge that yield increases could come about if the quality of tillage

19
were improved and list reasons such as shallow plowing replaced by deep plowing, change
of plowing type to better incorporate residue, or more timelier completion leads to better
yield. They then assert that the existing evidence indicates that there is generally no
significant difference in yield on a given farm between mechanized plowing and just using
animal labor. The issue arises again that the only focus of comparison is tillage and not a
systems view of mechanization. The conclusion by Tuesche, et al. was derived from a one
year study conducted for tomatoes that were transplanted by hand, so again, a singular
focus on tillage. Alternative research asserted that yield increases are possible only when
mechanization improves tilling quality, but failed to mention opportunities for increased
yield due to timeliness, quality of operations, or interactions with other mechanized
activities (Pingali, 2007).
2.11 Mechanization Utilization Rates
Concentrating on the factor substitution of tillage, as well as labor efficiency
benefits, created utilization problems that made it difficult to gain payback for mechanized
equipment. Demonstrating effective demand for tractor-based services, and that economic
rates of utilization and profitability are achievable is a challenge when only looking at one
aspect of the farming cycle. The reason for low rates of tractor utilization is the result of a
failure to achieve continuity of work throughout the year (Kienzle, Hancox, & Ashburner,
2010). Most tractor services focused only on tillage and as a result were usually parked and
remained unused after plowing. This obviously caused low operational scale to be the most
important constraint to the profitability of investment in specialized agricultural
mechanization service provision (Houssou, Diao, Cossar, Kolavalli, Jimah, & Aboagye,
2013). The conclusion was that tractor mechanization within the prevailing smallholder

20
farming is not profitable (Eziakor, 1990). The limitations on efficiency by looking at
tillage only was acknowledged, and the idea of offering more services to increase
efficiency was identified, but little work was done looking at the system (Benin, Johnson,
Jimah, Taabazuing, Tenga, Abokyi, Nasser, Ahorbo, & Owusu, 2012).
2.12 Mechanized Service providers
To overcome the efficiency problem, service providers traveled further distances
from a home station to increase usage. Geographical spread of farmers resulted in some
hire units operating very far from their home. This increased the un-reliability of service
and caused service repair issues. The services were untimely, leading to the frustration of
many farmers. Additionally, the greater distance caused irregular fuel supplies and high
frequency of tractor and equipment breakdowns (Akinola, 1987).
Another factor in the poor dissemination of services other than tillage, is that tractor
hiring services often failed to transfer the knowledge of the complete farming system and
system approach to mechanization. A 2014 study of cassava farmers and service providers
in Nigeria, by Sahel Capital, revealed that of the survey respondents, 100% of the service
providers offered tillage and 100% of the smallholder farmers were aware of the service,
with 42% adopting mechanized tillage. However, in contrast, only 14% of the service
providers offered any service other than tillage and 0% of smallholders interviewed
adopted any other service. The level of unawareness of mechanical technology by
smallholder farmers was 38% planting, 77% weeding, 48% harvesting. Forty-three percent
of the service providers interviewed who were aware of the other services either were not
planning to offer the services or were unsure if they were going to offer the services.
Service providers cited lack of demand for the other services as the reason they were not

21
planning to offer other services. This leads us to a “chicken and egg” problem where
farmers were unaware of the services so they did not ask for them. Since service providers
were not asked about the services they did not make farmers aware or offer them.
An effort throughout Sub-Saharan Africa was placed on training service providers
and developing businesses focusing on providing mechanization services to smallholder
farmers. It appears that the training provided to those service providers, in some cases, has
not been passed on to the smallholder farmers, which suggest that there may be a need for
a different method to deliver services.
2.13 A Systems View
Increasing agriculture productivity in Sub-Saharan Africa will become more
intensive. More intensive agriculture cannot happen without more power available, and
the power that farmers have available to them to perform production functions is a factor
in determining output (Pingali, 2007). The proper choice and use of mechanized inputs
into agriculture has a direct and significant effect on the achievable levels of land
productivity and labor productivity. The use of mechanization is best viewed as integral
part of a production system for the complete farming cycle and not just a tool to substitute
labor. Mechanization can have positive impacts on the profitability of farming and the
livelihood of the farmer.

22
Chapter 3 - Methodology
There are many alternative approaches to analyzing the issues with smallholder
mechanization. Often times in Sub-Saharan Africa survey methods are used to understand
the realities facing smallholder farmers from a first-hand perspective. Other methods of
economic research include cost analysis models, farm optimization models, or linear
programming optimization models. For this thesis a mixed approach is used to investigate
the challenges, highlight the opportunity and review alternatives. The three methods used
in this thesis are reviewing available survey data to correctly address and account for in-
country factors, creating a cost analysis model to identify economic possibilities, and linear
programing optimization to understand implications to various objectives.
3.1 Survey Review
The first step in comprehending the economic impacts that mechanization can have
on the smallholder farmers and service providers is to understand current metrics for both
manual and mechanized farming operations, as well as farm expense characteristics.
Metrics such as cost to perform operation, time to complete operation, and yield impact are
key to evaluating economic returns. These key metrics are used in a cost analysis model
for the economic analysis. Forty-eight Nigerian smallholder farmers and fifteen Nigerian
service providers were interviewed in late 2014 by Sahel Capital for a cassava value chain
study prepared for the Gates Foundation. The study was designed to calculate the benefit
of mechanized activities (time and labor savings, quality of field ops, and reduction of
production cost) for smallholder farmers, determine potential hurdles to adoption based on
capacity, breakeven or service range requirements, and identify players best positioned to
provide services and equipment. The goal was to help the Gates Foundation determine

23
where intervention mechanisms may be best applied to jumpstart sustainable and scalable
mechanized services to smallholder cassava farmers. The Context Network, a global
agribusiness consulting organization, developed the surveys with input from Sahel Capital
and commissioned Sahel Capital to perform the work. Appendix A is a copy of the
interview guide for smallholder farmers and Appendix B is the interview guide for service
providers. Access to that survey and the survey results was granted and reviewed for this
thesis for use in deriving variables in the farm cost analysis model and linear programming
optimization. The use of real data from Nigerian cassava farmers and service providers
allows for more confidence in model output.
3.2 Cost Analysis Models
The cost analysis models developed for this thesis begins with a breakeven study
for providing various levels and combination of services. It also includes a cost comparison
model between mechanized and manual operations, and an opportunity of labor cost model.
This model is an adaptation of a budget model developed in 2013 by Houssou, Diao,
Cossar, Kolavalli, Jimah, and Aboagye. Their focus was to understand the profitability
of specialized mechanization service provision in Ghana based upon various cost and
revenue assumptions. The main assumptions used in their paper was that the mechanized
business would perform only plowing services. They were able to calculate out the
breakeven acreages for plowing services and then compare those with the theoretical
acreages in Ghana that a tractor could cover. The conclusion from the 2013 paper by
Houssou et al. is that a specialized agriculture mechanization service provision model could
not be sustained and that low operational scale is the most important constraint to the
profitability of investment. Given their constraints of looking only at tillage they are

24
probably correct. In the closing of the 2013 paper, the authors identify that there are many
other farming operations that still are performed, but the authors did not include those in
their model.
For purposes of understanding the impact of a full systems approach to
mechanization, the cost analysis model for this thesis includes breakeven acreages for
multiple steps in a systems approach for cassava mechanization in Nigeria. The five
operations that the cost analysis model analyze are tillage, planting, spraying, weeding, and
harvest. These five operations match the CAMAP project discussed in the introduction, so
delivery of these operations is known to be feasible. A breakeven analysis was performed
for each of these operations individually, as well as for subsets evaluating two operations,
three operations, four operations, and all five operations. Due to the nature of mechanized
farming where the tractor should not run over previously planted crop, a constraint was
placed on the subsets evaluated that required mechanized planting in order to complete
spraying, weeding and harvesting. This would look at situations where row spacing would
be consistent for operations that were performed later in the year. It was also assumed that
in order for the planter to run, tillage had to be performed first due to the constraints of the
cassava planter. Table 1 shows the combinations of operations that were evaluated.
Table 1 - Combination of Evaluated Operations
One OperationTwo
Operations
Three
Operations
Four
Operations
Five
Operations
Tillage (T) T+P T+P+S T+P+S+W T+P+S+W+H
Planter (P) T+P+W T+P+S+H
Sprayer (S) T+P+H T+P+W+H
Weeder (W)
Harvester (H)

25
The required breakeven hectares were calculated for these combinations taking the
yearly cost (equipment, maintenance, savings opportunity) divided by the per hectare
margin for performing the services (service charge minus service cost). This gives us a
breakeven equation
H = Cy/M
where
H = breakeven hectares
Cy = yearly cost
M = service gross margin.
The yearly cost (Cy) were calculated from principle and interest cost for equipment,
savings opportunity cost of the initial down payment, and yearly maintenance cost. Service
gross margin was calculated using per hectare service charge and subtracting the per
hectare cost including fuel, lubricant, and labor.
The equations making up the yearly cost and the per hectare margin are:
Cy = e + s + m
M = h - c
Where
e = tractor and implement yearly cost
s = savings opportunity cost
m = yearly maintenance cost

26
h = hiring charge
c = cost per hectare to perform service
Interviews with AATF, CaseIH Equipment Distributors and the AGCO business
manager for Africa identified initial equipment investment cost for tractors and the required
implements. The useful life of the equipment was estimated to be ten years. Interviews
with African distributors for CaseIH and African lending institutions formed financial
assumptions of a required 25% down payment and loan rate offered at 15% on a five year
note. The opportunity cost on the down payment was estimated at 4% interest. The yearly
maintenance was calculated as a percentage of the purchase price as given in American
Society of Agriculture and Biological Engineering Standard 497.7 divided over the
expected life of the equipment. These figures were used to calculate the yearly principle
and interest charge for the equipment (e), savings opportunity cost (s), and maintenance
charge (m). Interviews with AATF, service providers and farmers presented per hectare
hiring charge and interviews with AATF concerning operation cost for fuel used per
hectare of each operation and lubricant estimate. Skilled labor rate was estimated at twice
the unskilled rate of $.63/hour acquired through interviews. This gives a skilled rate of
$1.28/hr used for the model.
Obviously if we are covering the hectares with the same tractor, the tractor cannot
be used for two separate operations at the same time. Therefore we need to understand the
farming cycle for cassava in Nigeria to understand when these operations take place. Again
interviews with the AATF, cassava growers and service providers in Nigeria has helped to
develop an activity calendar that calculates the available days for each activity. As table 2
shows, for most months there are multiple activities that could be performed during that

27
month. In order to account for multiple activities, the days available to perform each
activity during the time slot was divided by the number of activities.
Table 2 - Twelve Month Operation Calendar
For the combinations of services in table 1, a cost comparison and opportunity cost
model were developed to calculate implications for each type of power used. The cost
comparison model used an average of the direct cost for each of the services discovered
through the surveys and interviews with AATF, these cost were considered additive for
addition combination of services. These models used this information to compare the
actual cost of operations on a per hectare basis in addition to a per hour basis. The cost on
a per hectare basis was calculated for the individual operations and combinations explored
for both manual and mechanized operations. Having the cost per hectare of both manual
and mechanized services allows us the ability to define the out of pocket cost difference
for the farmer. In all cases the manual operations had a higher cost on a per hectare basis.
The cost of the mechanized operations were subtracted from the manual operations to find
the cost difference.
The opportunity cost model used an average of the time requirement for each of the
services discovered through the surveys and interviews with AATF. The time required for
the combination of services was considered additive required for the combination of
12
Tillage 1 1 1 1 1 1 1 1 1 1 1 1
Planter
Sprayer
Weeder
Harvester
Jan Feb Mar Apr May Jun Jul Aug Sep Oct Nov Dec

28
operations. The opportunity cost model calculated the difference in time used for
mechanical and mechanized services per hectare. Obviously the time required for
mechanized operations on a per hectare basis was lower compared to manual. The
mechanized time for the operations was subtracted from the manual time to calculate a time
difference. This time difference was the basis for determining the opportunity cost of that
time. A labor recoup assumption of 50% was used as a conservative estimate of the percent
of that time saved that the farmer could go out on the open market and sell his time. A
labor rate of $.63 per hour was used as an unskilled labor wage rate which the farmer could
realize if working off the farm. These estimates gave us the output of the farmers
opportunity cost for choosing to continue farming with manual labor.
3.3 Linear Programming Optimization
The breakeven analysis model discussed in section 3.2 gave us the hectares required
to breakeven for a suite of tools used in the mechanized systems approach. The activity
calendar for cassava production in Nigeria identified the maximum capacities for a systems
approach to mechanization. These capacities were above the breakeven requirement so the
potential exist for profitable mechanization. The question then exists of how to deliver
these services to the smallholder farmer.
Akinola identified that there are often technology transfer issues and un-reliability
of service with service providers (Akinola, 1987). The interviews from Sahel Capital
confirmed that challenges exist to delivering a systems approach through service providers.
Service providers are often unwilling to invest in implements other than tillage due to low
demand for those services. Without offering non-tillage services to customers, the
knowledge of those other services often does not get transferred to the people needing those

29
services most. The cycle is repeated. At the heart of the matter is that the service providers
are unable or unwilling to invest in other equipment due to capital constraints or are hesitant
to invest in the other implements due to the risk involved with sufficiently utilizing their
equipment providing services to customers.
One alternative to this situation would be to deliver the services through medium
or large size farms that have already invested in the equipment to perform the work on their
own farm and have the ability to supply the smallholder market with their excess capacity.
Developing mechanized service hiring market in which medium and large scale farmers
who are tractor owners provide hiring out services to small scale farmers represents a
promising model for sustainable mechanization in Ghana (Diao, Cossar, Houssou, &
Kolavalli, 2014).
In order to understand the impact that such a situation could provide a linear
programing model was developed to optimize farm acreages and service provisions based
upon different objective criteria. The three different objectives reviewed for this thesis
were 1) maximize medium-size farmer gross profit, 2) maximize the number of
smallholders served, and 3) perform services on hectares greater than or equal to land
farmed by medium-size farms for self-production. All three farm budgets used the same
production considerations for cassava yield and price shown in table 3. Likewise, all three
models used the same variable production cost of seed, fertilizer, herbicide, pesticide, and
land shown in table 4. Charges for providing the service operations, cost of service
operations (table 5) and fixed cost (table 6) were also held consistent between the three
scenarios. These values were established from the Sahel survey’s and interviews with
AATF.

30
Table 3 - Yield and Price Budget Numbers
Table 4 - Farm Budget Variable Production Cost
Table 5 - Per Hectare Service Charge and Cost
Table 6 - Yearly Equipment Fixed Cost
Mechanized Yield (Ton/Ha) 28.00
Price ($/Ton) 40.00
Mechanized Yield and Price
Seed 20.00
Fertilizer 102.00
Herbicide 58.00
Pesticide 36.00
Land 25.00
Variable Production Cost
($/Ha)
Variable Machine Cost
($/Ha)Service Charge OpperatingCost
Tillage 85.83 27.29
Planter 50.00 16.07
Sprayer 30.00 10.50
Weeder 70.00 12.73
Harvester 70.00 27.72
EquipmentYearly Cost
(E+S+M)
Tractor 20,488$
Tillage 2,780$
Planter 4,865$
Sprayer 2,675$
Weeder 4,103$
Harvester 2,180$

31
The linear program seeking to maximize farmer gross profit used the objective
function formula,
max (Rt-Vt-Ft)
such that
Tt <= 279
Pt <= 339
St <= 469
Wt <= 490
Ht <= 275
Pc <= Tc
Sc <= Pc
Wc <= Pc
Hc <= Pc
Where
Rt = Total Revenue
Vt = Total Variable Cost
Ft = Total Fixed Cost
Tt = Total Tillage Hectares
Pt = Total Planted Hectares
St = Total Seeding Hectares
Wt = Total Weeding Hectares

32
Ht = Total Harvested Hectares
Tc = Custom Tillage
Pc = Custom Planted
Sc = Custom Seeding
Wc = Custom Weeding
Hc = Custom Harvest
The linear program seeking to maximize the numbers of smallholders used the
objective function formula,
max (X).
Where
X = Ct/As
X = Total Number of Smallholders Served
Ct = Custom Hectares Served by System Approach
As = Farm Size for Smallholder Farmers. (1.3 ha/farmer)
The constraints used for this optimization were the same for the maximize farmer revenue.
The final linear program that aimed to provide services on hectares greater than or
equal to the amount of hectares medium size farmer farmed on his farm. This objective
had the same objective as maximize farmer gross profit with the addition of one extra
constraint that forced hectares farmed by the medium holder farmer for self-production to

33
be less than or equal to the hectares that were serviced for smallholders. The objective
function for this linear program was to maximize medium-size farmer revenue.
max (Rt-Vt-Ft).
The additional constraint to
Am <= min( Tc, Pc, Sc, Wc, Hc)
Where
Am = Farm Area of Medium Producer
Tc = Custom Tillage
Pc = Custom Planted
Sc = Custom Seeding
Wc = Custom Weeding
Hc = Custom Harvest
As expected the different constraints and objectives of these linear programs
resulted in different amounts of services being offered to smallholder farmers and different
acreages farmed by the larger farmer. This highlights the importance of clearly defining
the objectives sought when investigating how to mechanize farm production in Sub-
Saharan Africa.

34
Chapter 4 - Survey Highlights
Interviews of smallholder farmers, service providers, research institutes, and
government agencies were conducted in late 2014 by Sahel Capital for a cassava value
chain study prepared for the Gates Foundation. This study focused on Nigeria, specifically
the three states of Oyo, Kogi, and Imo. The study was designed to calculate the benefit of
mechanized activities (time and labor savings, quality of field operations, and reduction of
production cost) for smallholder farmers, determine potential hurdles to adoption based on
capacity, breakeven or service range requirements, and identify players best positioned to
provide services and equipment. Access to the interview output and notes was granted to
this thesis. Several insights were gained from reviewing the interview output. Interviews
were reviewed for the 48 smallholder farmers and 15 tractor service providers that Sahel
recorded.
The smallholders were asked about their input practices for seed, fertilizer,
pesticides, and herbicides and the cost associated with these inputs. Table 7 below shows
the percentage of respondents from the survey from each state and the total who were using
the various inputs. Along with the percentage of respondents who were using no inputs or
at least clean seed, fertilizer, and herbicide. Table 8 below shows the average cost per
hectare for the different inputs by state and total average cost.
Table 7 - Input Usage by State and Total
Oyo 92% Oyo 31% Oyo 46% Oyo 8% Oyo 0% Oyo 8%
Kogi 35% Kogi 57% Kogi 22% Kogi 22% Kogi 22% Kogi 4%
Imo 67% Imo 83% Imo 33% Imo 33% Imo 17% Imo 33%
Total 57% Total 52% Total 31% Total 19% Total 14% Total 10%
% using seed, fert,
herb% using Fertilizer% using Herbicide % using Seed % using Pesticide % using none

35
Table 8 - Input Cost – $/Ha
Overall 42% of the smallholders interviewed were using mechanized tillage, and
all of the smallholders interviewed were aware of mechanized tillage. Table 9 shows the
percent of smallholders who were either aware or unaware of mechanical services for
different operations.
Table 9 - Smallholder Service Awareness
Table 10 shows, for those not using mechanized tillage, 75% cited not having
access to the services as the reason for not using, 14% cited cost, and 11% cited other
reasons such as operational timing or land issues. In contrast to tillage, there were no
farmers interviewed that were using mechanical planting, weeding or harvesting.
Interestingly, as table 10 shows below, for those farmers who were aware of the services,
access to them was the major limiting factor in all cases.
State Fertilizer Pesticide Herbicide Seed
Oyo 92.88$ 12.00$ 32.29$ 65.75$
Kogi 62.69$ 50.20$ 103.06$ 80.00$
Imo 213.90$ 13.50$ 48.25$ 145.00$
Total 102.55$ 36.25$ 58.54$ 83.42$
Average $/Ha for inputs
Tillage Planting Weeding Harvest
Unaware 0% 38% 77% 48%
Aware 100% 63% 23% 52%
Smallholder Awareness of Mechanical Services

36
Table 10 - Smallholder Reasons for Not Using Service
Table 11 below shows that 53% of the service providers were unaware of the other
services, but as shown in table 12 of those who were aware of the services only 14% offered
those services. Forty three percent of those service providers who are aware of the services
either don’t plan to offer them or are unsure if they will offer them.
Table 11 - Service Provider Service Awareness
Table 12 - Other Service Offering Intention
The president of the Agricultural Cooperative Federation in Kogi state responded
in the interview that part of the reason that more service providers are not offering more
services is due to the cost of the additional implements and risks associated in recouping
Tillage Planting Weeding Harvest
No Access 75% 48% 10% 42%
Cost 14% 10% 6% 6%
Other 11% 4% 6% 4%
Reasons smallholders who were aware of services
are not using.
Unaware 53%
Aware 47%
Service Provider Awareness of
services other than tillage
Offer 14%
Plan to Offer 43%
Don’t Plan to offer 29%
Unsure 14%
Availability of services other than tillage by service
providers who were aware of other services.

37
cost. Another interviewee from Oyo State mentioned that he went through training
sponsored by the International Institute of Tropical Agriculture (IITA) in 2012 on
additional equipment but has never received any request from smallholders for services so
that is why he does not offer them.
The smallholder farmer and service provider surveys completed by Sahel Capital,
along with insights from AATF, highlights not only the current practices, but gives insights
to the cost to the smallholder for the various operations of both mechanized and manual
services. Table 13 shows the comparison of per hectare cost for manual and mechanized
services. A key insight to table 13 below is that on a hectare basis, manual operations are
more expensive than mechanized. Some of the issues with cost sighted by smallholders
could be due to the upfront cost of the services required before mechanized services are
performed compared to daily rates for manual workers.
Table 13 - Mechanized and Manual Service - $/Ha
In addition to cost, the operational timing per hectare for both manual and
mechanized services were calculated. Table 14 compares average services times per
hectare reported by AATF, smallholders, and service providers.
$/ha Manual Mechanized
Tillage 104.96 85.83
Planter 59.81 50.00
Sprayer 101.69 30.00
Weeder 82.23 70.00
Harvester 88.38 70.00
Total 437.07 305.83

38
Table 14 - Mechanized and Manual Service Times
Interviews of service providers highlighted that most of the service providers were
traveling from 5 to 50 km away from a home base to provide services, however some
service providers were traveling anywhere from 100, 200, and even 300 km away from a
home base to offer services. Most service providers were able to perform services for 3-5
customers a day, but information was limited as to actual utilization and efficiency the
service providers were being able to reach for the year. Common challenges listed by
service providers were issues with tractor mechanical issues and spare parts availability.
Access to the survey from Sahel Capital was valuable in understanding cost and
timing factors as well as farm budget numbers. These factors were used in cost analysis
and farm budget models as well as linear program optimization exercises. Not only was
the survey was able to reveal insights on production practices and cost, it was able to
highlight awareness issues by smallholders and service providers of services other than
tillage. The survey also identified technology transfer concerns for service providers who
were aware of the other services but are not planning to or are unsure about offering other
services.
Hr/Ha Manual Mechanized
Tillage 40.44 1.66
Planter 24.08 0.75
Sprayer 7.00 0.33
Weeder 35.98 0.50
Harvester 28.31 2.00
Total 135.81 5.24

39
Chapter 5 – Cost Analysis Model Output and Discussion
The noticeable factor of the equipment required for a mechanized systems approach
is that the tractor cost is a significant percentage of the total cost. Table 15 shows that for
the five operations used for cassava mechanization, the tractor which pulls the implements
is above 50% of the total cost.
Table 15 - Equipment Price and Percentage of Total
Maximizing the utilization of that investment is a driver of profitability. The ability
to spread that investment out over several operations that can increase utilization year
around is a key advantage of the systems approach to mechanization. The breakeven
hectares required for the different services is a reflection of the equipment prices and
market price of services. Market prices for the different operations was shown earlier in
Table 5. The lower the purchase price for equipment and per hectare cost and the higher
the service charge able to be captured will decrease the breakeven hectares.
Breakeven hectares required for each individual five operations as well as the
hectares required for combinations of two operations, three operations, four operations, and
five operations are shown here in table 16.
Equipment Price - USD % of total
Tractor 55,000$ 53%
Tillage 8,000$ 8%
Planter 14,000$ 13%
Sprayer 6,000$ 6%
Weeder 13,000$ 13%
Harvester 8,000$ 8%
Total 104,000$

40
Table 16 - Operational Breakeven Hectares
It is obvious, the low market price for spraying services results in a high breakeven
hectares. Table 16 highlights the stair step effect that adding operations has on break even
hectares. It is also evident that for three and four operations that different combinations of
implements gives a different break even requirement. Comparing the hectares required to
breakeven, table 17 shows the percentage decrease in surface area the service provider will
need to cover to break even as compared to just providing tillage. With five operations,
the area that the operator will need to cover is 44% of the area needed to cover with tillage
only.
Table 17 - Percent of Tillage Area Breakeven
This becomes quite important when considering the infrastructure issues with Sub-
Saharan Africa. The less distance required to travel allows for less issue with roads,
support services and other major challenges in African infrastructure. This also means less
time traveling and more time working in the field, which allows for higher profitability.
Tillage (T) 397 T+P 304 T+P+S 275 T+P+S+W 206 175
Planter (P) 747 T+P+W 215 T+P+S+H 214
Sprayer (S) 1188 T+P+H 225 T+P+W+H 179
Weeder (W) 429
Harvester (H) 536
Breakeven Hectares
One Operation Two Operations Three Operations Four Operations Five Operations
T+P+S+
W+H
Tillage 100% T+P 77% T+P+S 69% T+P+S+W 52%
Planter 188% T+P+W 54% T+P+S+H 54%
Sprayer 299% T+P+H 57% T+P+W+H 45%
Weeder 108%
Harvester 135%
T+P+S+
W+H44%
Percent Area Covered Compared to Tillage Only
One Operation Two Operations Three Operations Four Operations Five Operations

41
As noted earlier, when using one tractor to provide multiple services, the tractor
can only perform one of the operations at a time. This impacts how much time the tractor
can operate on individual operations in the year. When multiple activities need to happen
at the same timeframe the tractor operator much choose which service to perform. Table
18 below shows the farming operation windows for the individual tasks as well as the
combination of operations. The model evaluates how many days a tractor operator has to
perform any one of the operations in that time frame. This allows us to calculate the
theoretical hectares that are available to be completed in the given time. Comparing this
number to our breakeven hectares required allows us to calculate a breakeven efficiency
for each operation in a combination of operations and average breakeven efficiency for that
combination. This break even takes in to account an 80% probability of work day and a
factor for travel efficiency. The table shows that for cassava tillage alone an operator needs
to be 76% efficient in order to meet the breakeven hectares. That means tillage alone could
be profitable if the operator operated above this. When looking at the average required
efficiencies for multiple operations, it is noticeable various combinations require different
breakeven efficiencies. There are some combinations of operations, such as when a
spraying operation is added with planting, that need to be slightly more efficient due to the
high overlap in timing of those operations and the low service charge of an operation.
Another example is when harvesting is added to a combination, greater average efficiency
is needed due to the slower pace of harvesting. The lower efficiency target allows for a
lower hurdle rate in order to breakeven, thus a greater profit potential, or cushion to absorb
challenges seen with production in Africa.

42
Table 18 - Service Activity and Breakeven Efficiencies
While manual cost is cheaper per hour, the hours required to perform the services
outweigh the lower cost. The impact of the cost difference for multiple services can result
12 BE Effic Avg Effic
Tillage 1 1 1 1 1 1 1 1 1 1 1 1 76% 76%
Planter 137% 137%
Sprayer 110% 110%
Weeder 42% 42%
Harvester 133% 133%
BE Effic Avg Effic
Tillage 1 1 1 1 1 0 0 1 1 1 1 0 0 0 0 0 0 0 1 1 1 0 0 0 58%
Planter 0 0 0 0 0 1 1 0 0 0 0 1 1 0 0 0 0 0 0 0 0 1 1 0 56%
BE Effic Avg Effic
Tillage 1 1 1 1 0.33 0 0 1 1 1 0.33 0 0 0 0 0 0 0 1 1 0.33 0 0 0 63%
Planter 0 0 0 0 0 0.67 1 0 0 0 0 0.67 1 0 0 0 0 0 0 0 0 0.67 1 0 61%
Sprayer 0 0 0 0 0.67 0.33 0 0 0 0 0.67 0.33 0 0 0 0 0 0 0 0 0.67 0.33 0 0 51%
BE Effic Avg Effic
Tillage 1 1 1 0.5 0.33 0 0 1 1 1 1 0 0 0 0 0 0 0 0.5 0.5 1 0 0 0 50%
Planter 0 0 0 0 0 1 1 0 0 0 0 0.5 0.5 0 0 0 0 0 0 0 0 1 1 0 47%
Weeder 0 0 0 0.5 0.67 0 0 0 0 0 0 0.5 0.5 0 0 0 1 1 0.5 0.5 0 0 0 0 32%
BE Effic Avg Effic
Tillage 0.5 0.5 1 1 1 0 0 0.5 0.5 1 1 0 0 0 0 0 0 0 1 1 1 0 0 0 51%
Planter 0 0 0 0 0 1 1 0 0 0 0 1 1 0 0 0 0 0 0 0 0 1 0.5 0 45%
Harvester 0.5 0.5 0 0 0 0 0 0.5 0.5 0 0 0 0 1 1 1 1 1 0 0 0 0 0.5 1 72%
BE Effic Avg Effic
Tillage 1 1 1 0.5 0.2 0 0 1 1 1 0.33 0 0 0 0 0 0 0 0.5 0.5 0.33 0 0 0 56%
Planter 0 0 0 0 0 0.67 1 0 0 0 0 0.4 0.5 0 0 0 0 0 0 0 0 0.67 1 0 54%
Sprayer 0 0 0 0 0.4 0.33 0 0 0 0 0.67 0.2 0 0 0 0 0 0 0 0 0.67 0.33 0 0 44%
Weeder 0 0 0 0.5 0.4 0 0 0 0 0 0 0.4 0.5 0 0 0 1 1 0.5 0.5 0 0 0 0 33%
BE Effic Avg Effic
Tillage 0.5 0.5 1 1 0.33 0 0 0.5 0.5 1 0.33 0 0 0 0 0 0 0 1 1 0.33 0 0 0 61%
Planter 0 0 0 0 0 0.67 1 0 0 0 0 0.67 1 0 0 0 0 0 0 0 0 0.67 0.5 0 52%
Sprayer 0 0 0 0 0.67 0.33 0 0 0 0 0.67 0.33 0 0 0 0 0 0 0 0 0.67 0.33 0 0 40%
Harvester 0.5 0.5 0 0 0 0 0 0.5 0.5 0 0 0 0 1 1 1 1 1 0 0 0 0 0.5 1 69%
BE Effic Avg Effic
Tillage 0.5 0.5 1 0.5 0.33 0 0 0.5 0.5 1 1 0 0 0 0 0 0 0 0.5 0.5 1 0 0 0 52%
Planter 0 0 0 0 0 1 1 0 0 0 0 0.5 0.5 0 0 0 0 0 0 0 0 1 0.5 0 44%
Weeder 0 0 0 0.5 0.67 0 0 0 0 0 0 0.5 0.5 0 0 0 0.5 0.5 0.5 0.5 0 0 0 0 33%
Harvester 0.5 0.5 0 0 0 0 0 0.5 0.5 0 0 0 0 1 1 1 0.5 0.5 0 0 0 0 0.5 1 65%
BE Effic Avg Effic
Tillage 0.5 0.5 1 0.5 0.2 0 0 0.5 0.5 1 0.33 0 0 0 0 0 0 0 0.5 0.5 0.33 0 0 0 63%
Planter 0 0 0 0 0 0.67 1 0 0 0 0 0.4 0.5 0 0 0 0 0 0 0 0 0.67 0.5 0 52%
Sprayer 0 0 0 0 0.4 0.33 0 0 0 0 0.67 0.2 0 0 0 0 0 0 0 0 0.67 0.33 0 0 37%
Weeder 0 0 0 0.5 0.4 0 0 0 0 0 0 0.4 0.5 0 0 0 0.5 0.5 0.5 0.5 0 0 0 0 36%
Harvester 0.5 0.5 0 0 0 0 0 0.5 0.5 0 0 0 0 1 1 1 0.5 0.5 0 0 0 0 0.5 1 64%
Jan Feb Mar Apr May Jun
47%
55%
49%
57%
58%
43%
56%
Jul Aug Sep Oct Nov Dec
Aug Sep Oct Nov Dec
Oct Nov
50%
Jun Jul Aug Sep Oct Nov DecMar Apr MayJan Feb
FebJan Mar Apr May DecJun Jul Aug Sep Oct Nov
Feb Mar Apr MayJan Jun Jul
DecJun Jul Aug Sep Oct NovJan Feb Mar Apr May
DecApr May Jun Jul Aug SepJan Feb Mar
Aug Sep Oct Nov DecFeb Mar Apr May Jun JulJan
Feb Mar Apr May
DecApr MayJan Feb Jun Jul Aug SepMar
DecJun Jul Aug Sep Oct Nov
Nov
Jan
Oct

43
in major savings for the smallholder farmer. Table 19 shows the savings for individual
operations plus cumulative services. As table 19 shows, the benefits of using mechanized
power can be extremely beneficial to the individual farmers. The usual requirement for
using mechanized work in Sub-Saharan Africa is to pay for the service 100% up front.
This could pose a cash outlay problem for some smallholder farmers. The respondents
who know about the services and failed to use them due to cost constraints often cited the
initial upfront cash outlay for the services as the reason for not adopting them over doling
out the payments to workers daily.
Table 19 - Saving from Mechanized Operations - $/Ha
Another factor that is often overlooked when studying mechanization is the
opportunity cost of labor (Ehui & Polson, 1993). When family members are performing
the manual labor they are not able to sell their time on the labor market. Impact of
mechanization may be to replace household labor use on farm and increase non-farm
income earning. This is important because tractor users have a positive correlation with
non-farm income earners (Takesima, Nin-Pratt, Diao, 2013). If the smallholder is present
for the mechanized service, then the difference between the manual and mechanized
service is the hours that they would have to sell to the labor market, assuming that there is
demand for labor off farm. Interviews related that the unskilled per hour labor rate was
Tillage 19.13 T+P 28.94 T+P+S 100.64 T+P+S+W 112.87
Planter 9.81 T+S 90.83 T+P+W 41.17 T+P+S+H 119.02
Sprayer 71.69 T+P+H 47.32 T+P+W+H 59.55
Weeder 12.23
Harvester 18.38
T+P+S+W
+H 131.25
Mech Savings ($/Ha)
One Operation Two Operations Three Operations Four Operations Five Operations
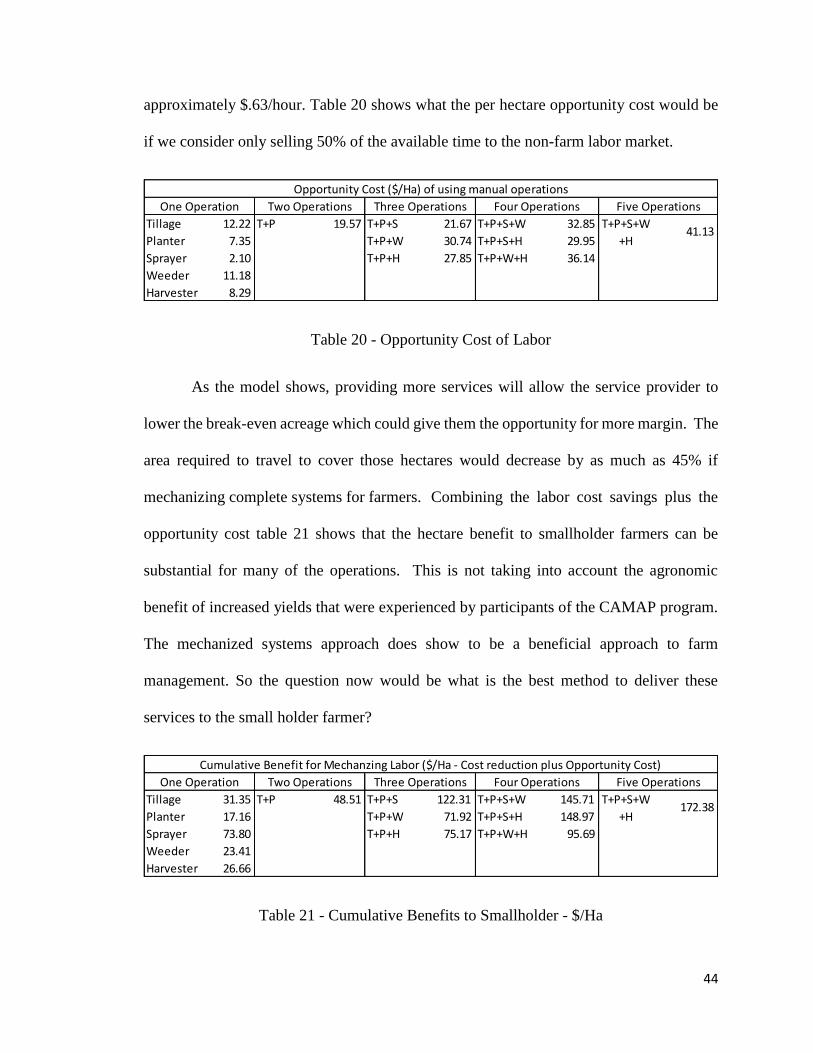
44
approximately $.63/hour. Table 20 shows what the per hectare opportunity cost would be
if we consider only selling 50% of the available time to the non-farm labor market.
Table 20 - Opportunity Cost of Labor
As the model shows, providing more services will allow the service provider to
lower the break-even acreage which could give them the opportunity for more margin. The
area required to travel to cover those hectares would decrease by as much as 45% if
mechanizing complete systems for farmers. Combining the labor cost savings plus the
opportunity cost table 21 shows that the hectare benefit to smallholder farmers can be
substantial for many of the operations. This is not taking into account the agronomic
benefit of increased yields that were experienced by participants of the CAMAP program.
The mechanized systems approach does show to be a beneficial approach to farm
management. So the question now would be what is the best method to deliver these
services to the small holder farmer?
Table 21 - Cumulative Benefits to Smallholder - $/Ha
Tillage 12.22 T+P 19.57 T+P+S 21.67 T+P+S+W 32.85
Planter 7.35 T+P+W 30.74 T+P+S+H 29.95
Sprayer 2.10 T+P+H 27.85 T+P+W+H 36.14
Weeder 11.18
Harvester 8.29
Opportunity Cost ($/Ha) of using manual operations
T+P+S+W
+H 41.13
One Operation Four OperationsTwo Operations Three Operations Five Operations
Tillage 31.35 T+P 48.51 T+P+S 122.31 T+P+S+W 145.71
Planter 17.16 T+P+W 71.92 T+P+S+H 148.97
Sprayer 73.80 T+P+H 75.17 T+P+W+H 95.69
Weeder 23.41
Harvester 26.66
T+P+S+W
+H 172.38
Cumulative Benefit for Mechanzing Labor ($/Ha - Cost reduction plus Opportunity Cost)
One Operation Two Operations Three Operations Four Operations Five Operations

45
Chapter 6 – Service Delivery Output and Discussion
The major costs of doing business for the tractor owner is funding the initial capital
costs of purchasing the tractor and working capital for running costs. Tractor owners take
on the risk of the underutilizing equipment and then not being able to meet the loan
repayments (Ashburner & Kienzle, 2011). As the Sahel survey reported, service providers
in most cases have taken on the risk associated with providing tillage services but are often
unwilling take on the risk to invest in implements other than tillage. The knowledge then
of those other services and the benefits that they hold for smallholder farmers often does
not get transferred to the people needing those services most.
One way to reduce the risk involved with sufficiently utilizing equipment is
medium and larger farming operations to provide the services to smallholder farmers. The
idea for a farmer to contract out his excess capacity is not new. This approach has been
given different names such as “core-satellite”, “nucleus farms” “out-grower model”, but
generally a common conclusion is that this approach can have significant impact on rural
incomes and medium-scale farmers should be encouraged to provide mechanization
services to their smallholder neighbors (Ashburner, & Kienzle, 2011). The concept of
nucleus estate (and similar approaches) was developed in order to ensure that smallholders
were included in the drive for agricultural diversification and promotion of exports (Bowles
& MacPhail, 1990). One of the most promising feature of these types of approaches are
their effectiveness in transferring technology to small farmers (Glover, 1987).
Additionally, these approaches help link smaller operations with agribusiness. Smaller
operations not linked with agribusiness will have increasing difficulty in gaining the
economies of size and the access to technology that is required in order to be competitive

46
(Sartorius &Kirsten, 2007). These approaches can be both sustainable and scalable.
Medium and large scale commercial farmers are early drivers for investment and
productivity growth complemented by growth of agribusiness firms (Mrema, Baker, &
Kahan, 2008). What small farmers seem to want from these approaches is the availability
of inputs normally unavailable or more expensively obtained through other sources (Porter
& Phillips-Howard, 1997). When smallholders and medium size prdocuers are connected,
encouraging the growth of the medium holder segment could have positive benefits for
smallholder producers. A linear program optimization was developed for this thesis to
provide insight to the overall level of benefits to medium-size and smallholder farmers
enabled by using medium size producers to provide services to their neighboring
smallholder farmers.
The three different objective functions;1) maximize medium-size farmer gross
profit, 2) maximize the number of smallholders served, 3) maximize medium-size farmer
gross profit with the land farmed for self-production being less than or equal to the hectares
that were serviced for smallholders
In the first objective, the medium-size farmer seeks to maximize his overall gross
profit with no constraints on providing services to smallholders. This farmer will perform
the activities that give him the highest return regardless if it is on his own field or custom
farming for a smallholder. The output from the model shows that, for this objective, the
profit maximizing choice for the farmer is to put all available resources first towards his
own farming production before providing services for smallholders. This makes sense as
he has a greater ability to generate higher income from growing his own product and selling
it on the market than to provide services for others. With the given constraints on tractors

47
and equipment, the farmer would put 275 hectares into his own production. The limiting
factor for this farmer is the harvesting capacity at his farm. The 275 hectares that he would
operate on his farm for tillage, planting, spraying and weeding, match the amount that he
is able to harvest. By farming only 275 hectares, the farmer still would have excess
capacity for tilling, planting, spraying and weeding. This farmer has 4 hectares of capacity
for tillage and would be the amount that he would provide to smallholders. Due to the
farming operation constraint requiring tillage to be done before planting, and planting to
be done before the other operations, this farmer would be limited to providing services of
4 hectares for planting, spraying and weeding. In this scenario, 99.6% of his revenue comes
from his own operations, with a small revenue stream from the custom tillage. The gross
profit experienced by this medium-size farmer is slightly over $179,000. The four hectares
of custom work would allow him to impact roughly 3 smallholder farmers.
In the second objective, the medium-size farmer seeks to maximize the number of
smallholder neighbors he can serve. Obviously by maximizing the number of
smallholders, all his efforts would be put towards serving smallholders and no efforts
would be towards working his own land. In effect this would be the same as a regular
service provider. Given the objective, this farmer would provide custom tillage, planting,
spraying, and weeding for 279 hectares and 275 hectares of custom harvesting. The gross
profit for this medium-size farmer would be nearly $22,000 and he could reach 214
smallholder farmers. The farmer’s revenue stream would be weighted towards tillage with
29% coming from that service. Harvesting and weeding would each account for 23% of
his revenues, with planting accounting for 16% and spraying accounting for 10% of his
revenues.

48
In the third objective, the farmer seeks to maximize his gross profit, but he has an
additional constraint that he is allowed to only farm hectares less than or equal to the
amount he provides in services. With this constraint the medium-size farmer will farm
roughly 137 hectares for his own production. With the excess capacity he has, this farmer
will provide 142 hectares of custom work for each tillage, planting, spraying, weeding.
The farmer will provide nearly 137 hectares of custom harvesting, which is the limiting
factor for his own operation. The gross profit for this farmer would be slightly over
$100,500 and he would reach 109 smallholder farmers. In this scenario revenue from his
farming operations account for 78% of total revenues and custom work accounts for 22%
of his revenue.
Table 22 below recaps the different hectares performed for the various operations
based upon objective and constraints.
Table 22 - Hectares Operated by Objective
Medium-size farmer revenue is only one piece of the equation when evaluating
these alternatives. Each smallholder that receives a service from a farmer benefits from
not only reduced operational cost as discussed in the last section, but also could receive a
yield increase as experienced by the AATF program. For the purposes of the linear
program optimization, each operation was considered an equal contributor towards
increase yield. Therefore, when calculating yield impact, the percentage of the operations
ObjectiveSelf
Production
Custom
Tillage
Custom
Planting
Custom
Spraying
Custom
Weeding
Custom
Harvest
Maximize Goss Profit 275 4 4 4 4 0
Maximize Small Holder 0 279 279 279 279 275
Equal Acreage 137 142 142 142 142 137

49
executed was the determining factor for the overall smallholder yield increase. Table 23
below compares the total benefit for the three scenarios and shows the source of that
benefit. Table 24 shows the percentage benefit experienced by medium-size farmers and
the smallholder for the specific objective.
Table 23 - Total Benefit by Objective
Table 24 - Percent Benefit Split
The total tonnage output is roughly consistent between all objectives at 7,790 tons
of cassava produced. No option has a clear advantage of producing more, but rather each
option determines how much benefit is created and who gets what share of that benefit.
The answer to the question of which optimization is best depends on whose perspective is
being viewed. Obviously the grower maximizing his own gross profit would want to farm
as much land for himself. However, this option impacts the fewest number of smallholders.
It also does not have the highest overall societal impact, but it is very good for that one
grower. The firm that operates as strictly a service provider does touch the most
Objective Farmer
Gross Profit
Small Holder
Yield Increase
Small Holder
Cost Reduction
Total
Benefit
Maximize Goss Profit 179,265$ 865$ 496$ 180,626$
Maximize Small Holder 21,759$ 81,796$ 36,544$ 140,098$
Equal Acreage 100,536$ 72,781$ 18,532$ 191,849$
ObjectiveFarmer %
of Benefit
Smallholder %
of Benefit
Maximize Revenue 99.2% 0.8%
Maximize Small Holder 16% 84%
Equal Acreage 52% 48%
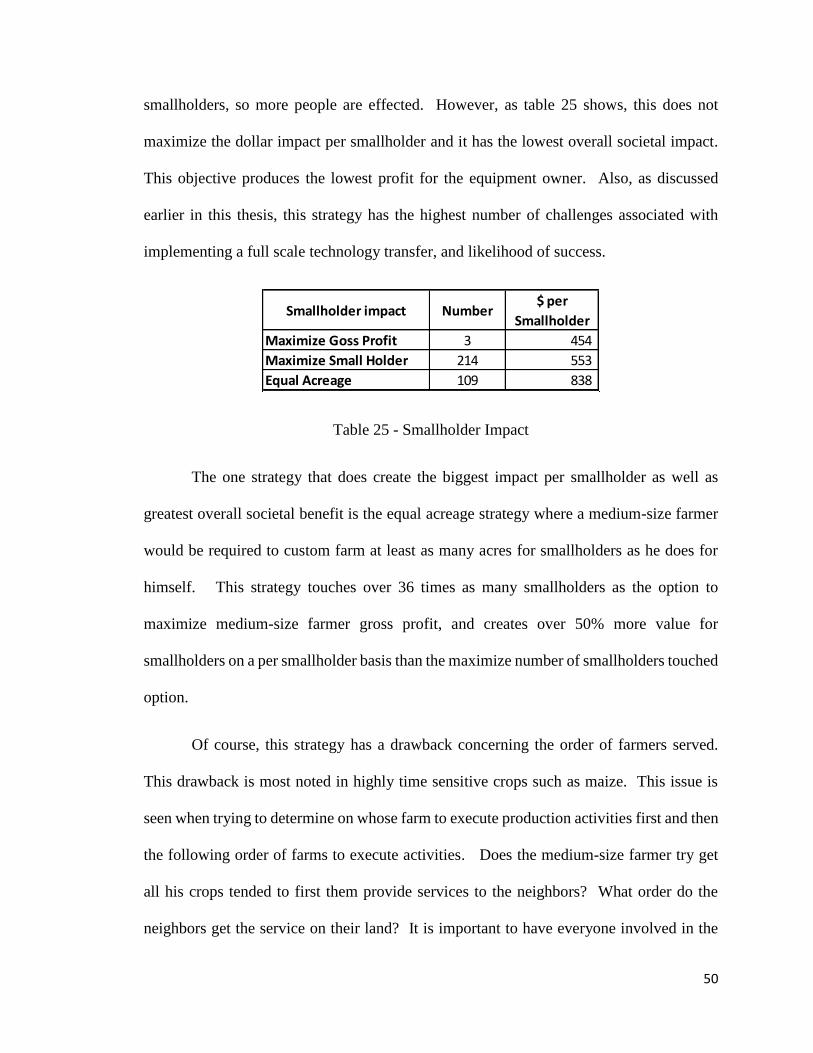
50
smallholders, so more people are effected. However, as table 25 shows, this does not
maximize the dollar impact per smallholder and it has the lowest overall societal impact.
This objective produces the lowest profit for the equipment owner. Also, as discussed
earlier in this thesis, this strategy has the highest number of challenges associated with
implementing a full scale technology transfer, and likelihood of success.
Table 25 - Smallholder Impact
The one strategy that does create the biggest impact per smallholder as well as
greatest overall societal benefit is the equal acreage strategy where a medium-size farmer
would be required to custom farm at least as many acres for smallholders as he does for
himself. This strategy touches over 36 times as many smallholders as the option to
maximize medium-size farmer gross profit, and creates over 50% more value for
smallholders on a per smallholder basis than the maximize number of smallholders touched
option.
Of course, this strategy has a drawback concerning the order of farmers served.
This drawback is most noted in highly time sensitive crops such as maize. This issue is
seen when trying to determine on whose farm to execute production activities first and then
the following order of farms to execute activities. Does the medium-size farmer try get
all his crops tended to first them provide services to the neighbors? What order do the
neighbors get the service on their land? It is important to have everyone involved in the
Smallholder impact Number$ per
Smallholder
Maximize Goss Profit 3 454
Maximize Small Holder 214 553
Equal Acreage 109 838

51
agreement know exactly what is expected of him or her and the ramifications for not
following the agreement. (Weness, 2001). Having standard agreements in place for this
would help maintain the neighbor relationship by not jeopardizing a base level of existing
trust. (Sutherland & Burton, 2011).
Obviously these are not the only situations that could be activated to provide benefit
to smallholder farmers and medium-size farmers. Other scenarios could involve
smallholders deciding not to farm their land and renting it to medium-size farmers and
working exclusively off farm. The linear programming optimization does highlight a
significant trade-off problem between smallholders, service providers, or medium size
farmers. It is important to keep these tradeoffs in mind when developing a strategy to
increase productivity in Sub-Saharan Africa.
52
Chapter 7 – Conclusions
As Benin points out, mechanization can in fact contribute to increasing production,
productivity, and profitability of agriculture by improving the timeliness, quality, and
efficiency of the operations (2014). When developing strategies for increasing agricultural
productivity in Sub-Saharan Africa it is important to remember that there is a link between
economic growth, intensive farming and mechanization. In order maximize the growth
potential, a mechanized systems approach should be implemented. A systems approach to
farming looks at all aspects of the farming cycle together and takes into consideration how
those pieces are interconnected. It takes into account how the agronomy and machine
components interact and impact the farming cycle. Past mechanization projects that have
simply tried to replace hand tillage with tractor tillage by infusing large numbers of tractors
into the market without understanding the supporting infrastructure have usually not been
scalable nor sustainable. Increasing the number of production activities that are performed
by mechanization will increase utilization and should lower the breakeven hurdles.
Increasing utilization of the machines allows for the mechanization efforts to be more
scalable and sustainable. At the same time, increasing the number of production activities
mechanized can increase the total yield and reduce labor cost.
This thesis explored the benefits of a mechanized systems approach to agriculture
and its impact on smallholder farmers in Sub-Saharan Africa. Available research was used
to evaluate baseline cost and timing metrics for both mechanized and manual services, as
well as gain insights on technology transfer issues. Three cost analysis models were
developed to highlight the different breakeven hectares various combinations of
mechanized operations, cost difference for combinations of manual and mechanized

53
operations, and labor opportunity cost involved for using manual labor instead of
mechanized. Three delivery scenarios were investigated to understand the benefits to
medium size farmers, service providers, and smallholder farmers. The benefit increase to
each group and total societal benefits were calculated along with the number of
smallholders that could be reached in each scenario. This mixed methodology approach
highlighted that a mechanized systems approach to cassava production in Nigeria does
have potential to increase yields and lower overall cost for smallholder farmers.
The survey data that was reviewed revealed that there could be an awareness
problem impacting the availability of services other than tillage. Of the smallholders
interviewed, all farmers were aware of tillage, but for services such as mechanical weeding,
77% of smallholders were unaware the service existed. The other issue that was brought
out is that even when they are aware of the services other than tillage, they have a problem
accessing those services. Over 40% of the respondents who were aware of mechanized
planting and harvesting cited that access to those services prevented them from attaining
them. The survey also revealed that over 50% of the service providers were also not aware
of services other than tillage. For those who were aware, only 14% offered services other
than tillage and 43% did not offer or were unsure if they were going to offer those services.
This highlighted the technology transfer problem facing service providers. Often service
providers are unwilling to take on the risk of offering services other than tillage due to low
customer demand, and customers are not demanding the service because they are unaware
of the service.
The breakeven model which used actual cost and operational data from
smallholders and service providers in the three focus states in Nigeria revealed that the

54
possibility exist for a systems approach to mechanization to be profitable for tractor
owners. There are some operations by themselves that could not break-even, including
planting, spraying and harvesting. However, when viewed as a systems approach the
combined operations of tillage, planting, spraying, weeding and harvesting would require
an average efficiency of 50% to breakeven. Not only would this systems approach be
beneficial to tractor owners, but smallholders could benefit as well. The mechanized
systems approach would lower smallholder’s overall cost per hectare for the operations, as
well as allow them to sell their extra time to the labor market and increase household
income from non-farm earnings. The combined benefits from decreased cost and labor
opportunity for a systems approach were over $170 per hectare. This does not include any
agronomic benefits from a systems approach which, when combined with mechanization,
using with good seed stock, proper fertilizers appropriate chemicals, could increase yield
as experienced with the AATF CAMAP project.
Given that a mechanized systems approach to cassava farming is beneficial to
reducing cost and increasing yield, understanding how delivering those services impacts
overall societal benefit and stakeholder benefits is important. A tractor owner with access
to land and a complete set of tillage, planting, spraying, and weeding implements could
have the option to utilize all his efforts towards his own operation, utilize all his efforts
towards providing services to smallholders, or some combination of those two. This tractor
owner would create the most value for himself if he directed all his efforts towards his own
farm, but this would impact the least number of people. If this tractor owner decided to
spend all his time providing services to smallholders, he would maximize the number of
smallholders reached, but would not maximize his profit. This would also create the

55
minimum amount of societal value for the three option. If a medium-size farmer on his
own, or encouraged through a government policy, decided to provide services equal to the
acreage that he farmed for himself, he would increase the value per smallholder reached,
as well as provide the highest overall societal value. The output from the linear program
was able to confirm that the best objective to pursue depends on who perspective is being
viewed, and their objectives.
While the analysis and modeling highlight the opportunity for mechanization there
are limitations and societal impacts that were not modeled in the analysis. Regarding the
opportunity cost of labor, the model demonstrated what the possibilities are for
smallholders, but assumed that there is a market for the labor. If the farmer cannot find
work off the farm then there is no opportunity cost for their time. This thesis did not extend
to looking at the societal impacts to the workforce of mechanizing production. The
question exists that if farm labor is mechanized, will there be negative impacts to the people
providing the manual services today. The experience with the Green Revolution in Asia
as de Janvry and Sadoulet (2009) point out is that land productivity increased faster than
labor productivity, with the result being that agriculture was able to absorb more labor and
helped to reduce poverty. When developing complete agribusiness infrastructures, other
off farm jobs will be developed such as equipment, seed, fertilizer, and pesticide
distribution, training, service and support. These newly created jobs could be outlets for
replaced on farm labor.
The model also does not take into account impacts for agency problems that could
occur from service providers or medium-size farmers providing services to smallholders.
Especially when looking at agronomic benefits, timing of operations is one element in
56
increasing production. The model assumed 80% of available days would be suitable for
working days. Actual experienced percentages of working days could not be discovered
through literature reviews or interviews. The risk is that this assumption is too low for the
actual on ground experience. Lowering the percent available days change the required
break-even efficiencies. Decreasing the time available to actually work in the field puts
more emphasis the importance of whose farm is being worked first.
Finally the model assumed that the smallholder would be able to pay for the
services upfront. The financial and cash constraints of smallholder farmers were not taken
into consideration. Without the upfront capital to purchase services, smallholders would
not have the opportunity to hire the service provider. Understanding the credit market, or
alternative barter systems, needed to allow smallholders the ability to hire services
requiring upfront payment is important.
There are other benefits to mechanization on top of increasing yield and reducing
labor cost. In addition to production activities, mechanization equipment offers value in
non-production activities. Some operations are not strictly time bound, such as de-
stumping, milling, and grinding. Even other opportunities are to use tractors for transport
and other non-agricultural tasks, such as the construction and maintenance of the rural
infrastructure (Ashburner & Kienzle, 2011). In order for mechanization benefits to be fully
realized the required supply chain and supporting elements need to be in place. The Asian
experience has shown that the availability of an effective agricultural machinery supply
chain and services is essential to stimulate demand for machinery (Ashburner & Kienzle,
2011). In order for farmers to have access to machinery and equipment, there needs to be
in place a system of retail outlets, support services, spare parts, and training. The

57
development and use of mechanization as an input to agriculture is a complex and long
term process and calls for a correspondingly long term, consistent effort (Houmy, Clarke,
Ashburner, & Kienzle, 2013). Commitment has to be in place to see through the long term
effort required to build this supply chain.

58
Chapter 8 – Areas for Future Study
The models developed for this thesis were enhanced by actual equipment,
operational and timing cost for both mechanized and manual services. Interviews of
smallholders, service providers, and equipment providers were helpful in gaining on-the-
ground experiences. Models were also enhanced by actual overall experience of the
CAMAP project by the AATF. The CAMAP project provided insights into total potential
yield increase for using the mechanized system, but no study was done on the impacts of
each step in the mechanization process. No previous research was found in literature
review or interviews with AATF, equipment providers, or service providers for how much
of the yield increase could be attributed to the different operations in combination with the
improved seed cultivars, fertilizers, and pesticides. In order to understand how much of
the total yield impact can be contributed to each of the steps; tillage, planting, spraying,
weeding, harvesting, and the interaction of subset combinations, suggested future research
is to perform field research in this area.
The models for this thesis also only considered one size of tractor and implements.
It was not tested if this size would be the optimum size to maximize return on investment
to medium-size farmers, service providers, or smallholder farmers. Future field research
should investigate the impacts of different sizes of tractor and implement combinations to
understand how available horsepower impacts returns. It is important to understand how
different size machines impact the hectares per hour that can be worked. Understanding
how the different upfront capital cost for different sizes of machines and the ability of the
person providing those services to recover those cost would help determine optimum
horsepower size.

59
Appendix A - List of Figures and Tables
Figure 1 - Global Soil Regions (2005). Regions by Soil Order…………..……… 6
Table 1 - Combination of Evaluated Operations…………………………………. 24
Table 2 - Twelve Month Operation Calendar…………………………………….. 27
Table 3 - Yield and Price Budget Numbers………………………………………. 30
Table 4 - Farm Budget Variable Production Cost………………………………… 30
Table 5 - Per Hectare Service Charge and Cost…………………………………... 30
Table 6 - Yearly Equipment Fixed Cost………………………………………….. 30
Table 7 - Input Usage by State and Total…………………………………………. 34
Table 8 - Input Cost – $/Ha……………………………………………………….. 35
Table 9 - Smallholder Service Awareness………………………………………… 35
Table 10 - Smallholder Reasons for Not Using Service………………………….. 36
Table 11 - Service Provider Service Awareness………………………………….. 36
Table 12 - Other Service Offering Intention………………………………………. 36
Table 13 - Mechanized and Manual Service - $/Ha……………………………….. 37
Table 14 - Mechanized and Manual Service Times……………………………….. 38
Table 15 - Equipment Price and Percentage of Total……………………………... 39
Table 16 - Operational Breakeven Hectares………………………………………. 40
Table 17 - Percent of Tillage Area Breakeven……………………………………. 40
Table 18 - Service Activity and Breakeven Efficiencies…………………………. 42
Table 19 - Saving from Mechanized Operations - $/Ha………………………….. 43
Table 20 - Opportunity Cost of Labor…………………………………………….. 44
Table 21 - Cumulative Benefits to Smallholder - $/Ha…………………………… 44
Table 22 - Hectares Operated by Objective……………………………………….. 48
Table 23 - Total Benefit by Objective…………………………………………….. 49
Table 24 - Percent Benefit Split…………………………………………………… 49
Table 25 - Smallholder Impact……………………………………………………. 50

60
Appendix B – Sahel Capital Smallholder Survey Questionnaire
Cassava Producers/Farmers Interview Questions
Producer Data
Name
Name of Farm
Location
Age
Years of Experience
Produce
Phone No.
Date
QUESTIONS RESPONSE
Tillage
What is the main factor that determines
when tillage work is done?
What happens if tillage work is delayed?
Do you use mechanized or manual tillage?
How many hectares per hour for
mechanized and manual tillage?
What is the cost per hectare for
mechanized and manual tillage?
If not using manual tillage, what is
inhibiting?
Who is providing the services today?
(Please provide names of service
providers)
Bedding
What is the main factor that determines
when bedding work is done?

61
What happens if bedding work is delayed?
Do you use mechanized or manual
bedding?
How many hectares per hour for
mechanized and manual bed
forming?
What is the cost per hectare for
mechanized and manual bed
forming?
If not using manual bedding, what is
inhibiting?
Who is providing the services today?
(Please provide names of service
providers)
Planting
What is the main factor that determines
when planting is done?
What happens if planting is delayed?
Do you use mechanized or manual
planting?
What is the cost per hectare for
mechanized and manual planting?
If not using mechanized planting, what is
inhibiting?
Who is providing the services today?
(Please provide names of service
providers)
Weeding
What is the main factor that determines
when weeding is done?
What happens if weeding is delayed?
Do you use mechanized or manual
weeding?
Who is providing the services today?
(Please provide names of service
providers)
Harvesting

62
What is the main factor that determines
when harvest is done?
What happens if harvest is delayed?
Do you use mechanized or manual
harvesting?
What is the cost per hectare for
mechanized and manual
harvesting?
If not using mechanical harvesting, what is
inhibiting?
Who is providing the services today?
(Please provide names of service
providers)
Farming System
Do you Intercrop?
If yes, what intercrops do you use?
Participation of females on your farm
What is the size of your farm?
How many workers do you have?
% Marketed/Sold
Volume of Production
Transporting
How far is most crop transported?
What is the cost per ton for transporting?
How widely adopted is motorized
transporting today?
Who is providing the services today?
(Please provide names of service
providers)
What happens if transporting is delayed?
Inputs
Seed Systems: Where do you source seed
materials from?
How many bundles or kg of cuttings do
you need to plant 1ha of Cassava?

63
How readily available are cuttings for
planting?
Fertilizer: Which types of fertilizer (s) do
you apply on cassava?
At what quantity (kg) do you apply each
fertilizer (s) per hectare?
What is the cost per kg of the fertilizer (s)
applied?
How readily available are fertilizers for
production?
Pesticide: Which types of pesticide (s) do
you apply on cassava?
Herbicide: Which types of herbicide (s) do
you apply on cassava?
At what quantity (kg) do you apply each
herbicide (s) per hectare?
What is the cost per kg of the herbicide (s)
applied?
How readily available are herbicides for
production?
Do you apply all inputs at the
recommended rate?
If no, why do you apply below
recommended rate?
Have you being trained on how to
correctly applied and use these inputs?
If yes, who trained you?
Based on your level of inputs, what is your
current yield per hectare?
Do you reach targeted yield levels?
Planting Decisions
Why are you growing Cassava?
How do you like to consume Cassava?

64
Do you practice land rotation for crops?
Is your farm fully utilized?
When do you plant and harvest Cassava?
How many months must it stay on the
field before harvesting?
Post-harvest Losses
How much of your Cassava is lost to
animals, pest & diseases, natural harsh
weather, poor storage etc.?
Is there any on-farm processing that can be
done to increase the value of the crop after
harvest and reduce losses?
Please mention them
Market Price
How much do you sell Cassava at the farm
gate?
How much do you sell to the local/rural
market?
How do you set the market price?
What informs your decision on market
price?
What is the best time to sell cassava in
order to achieve the highest price?
What percent of your Cassava do you sell
to markets?
ACCESS TO FINANCING
1. Do you have access to credit for inputs? (Planting materials, fertilizers, pesticides,
herbicides)
2. If yes, which financial institution, or contribution group?
(Please, name the financial institution (s))
a. How do you source for credit?
b. What are the requirements for obtaining credit?
c. What is the interest rate?
3. If no, are you interested in credit facilities? Why?
4. How has access to credit facilities affected your production/business?
5. What are the challenges associated with obtaining credit from financial
institutions?
65
Appendix C - Sahel Capital Service Provider Questionnaire
Cassava, Yam & Sweet Potato
Service Providers (Tractor Operators) Interview Questions
Personal Data
Name
Name of Company
Location
Age
Years of Experience
Services Provided
Phone No.
Date
QUESTIONS RESPONSE
Getting Started
As a tractor operator, how did you get
started?
Was there any program assistance e.g.
government, private companies or NGOs
or just your own idea and capital?
How did you decide what tractor and
implements to buy?
How did you get financing for tractor
and implement purchase?
How many different tractors do you
operate?
(Plough, harrow, planter, weeder,
harvester etc.)
Are you thinking to expand this and
operate more?
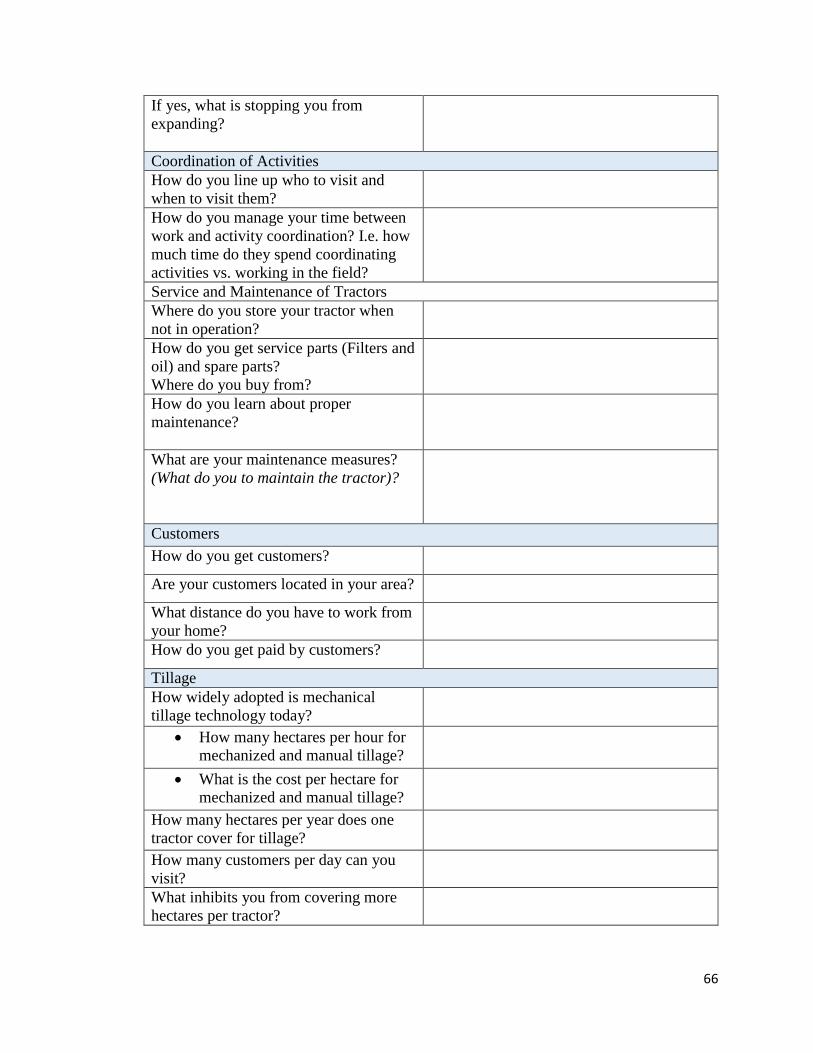
66
If yes, what is stopping you from
expanding?
Coordination of Activities
How do you line up who to visit and
when to visit them?
How do you manage your time between
work and activity coordination? I.e. how
much time do they spend coordinating
activities vs. working in the field?
Service and Maintenance of Tractors
Where do you store your tractor when
not in operation?
How do you get service parts (Filters and
oil) and spare parts?
Where do you buy from?
How do you learn about proper
maintenance?
What are your maintenance measures?
(What do you to maintain the tractor)?
Customers
How do you get customers?
Are your customers located in your area?
What distance do you have to work from
your home?
How do you get paid by customers?
Tillage
How widely adopted is mechanical
tillage technology today?
How many hectares per hour for
mechanized and manual tillage?
What is the cost per hectare for
mechanized and manual tillage?
How many hectares per year does one
tractor cover for tillage?
How many customers per day can you
visit?
What inhibits you from covering more
hectares per tractor?

67
How do you know what is the
best/proper tillage, or how deep to go
during tillage operation?
What inhibits you from providing
services for more customers?
How far from the home office do you
provide services?
What is the cost for tractors and
equipment?
What type of technical support and
service do you provide?
How do you learn about new mechanical
services (Planting, harvesting,
mechanical weeding)?
Bedding
How widely adopted is mechanical
bedding technology today?
How many hectares per hour for
mechanized bedding?
What is the cost per hectare for
mechanized bedding?
How many hectares per year does one
tractor cover for bedding?
How many customers per day can you
visit?
What inhibits you from covering more
hectares per tractor?
How do you know what makes a good
bed? Please describe.
Did you receive training?
What inhibits you from providing
services for more customers?
How far from the home office do you
provide services?
What is the cost for tractors and
equipment?
What type of technical support and
service do you provide?
Planting
How widely adopted is mechanical
planting technology today?

68
How many hectares per hour for
mechanized vs. manual planting?
What is the cost per hectare for
mechanized and manual
planting?
How many hectares per year does one
tractor cover for planting?
How many customers per day can you
visit?
What inhibits you from covering more
hectares per tractor?
What inhibits you from providing
services for more customers?
How far from the home office do you
provide services?
What is the cost for tractors and
equipment?
What type of technical support and
service do you provide?
Weeding
How widely adopted is mechanical
weeding technology today?
How many hectares per hour for
mechanized and manual
weeding?
What is the cost per hectare for
mechanized and manual
weeding?
How many hectares per year does one
tractor cover for weeding?
How many customers per day can you
visit?
What inhibits you from covering more
hectares per tractor?
What inhibits you from providing
services for more customers?
How far from the home office do you
provide services?
What is the cost for tractors and
equipment?
What type of technical support and
service do you provide?
Harvest
How widely adopted is mechanical
harvest technology today?

69
How many hectares per hour for
mechanized and manual harvest?
What is the cost per hectare for
mechanized and manual harvest?
How many hectares per year does one
tractor cover for harvest?
How many customers per day can you
visit?
What inhibits you from covering more
hectares per tractor?
What inhibits you from providing
services for more customers?
How far from the home office do you
provide services?
What is the cost for tractors and
equipment?
What type of technical support and
service do you provide?
Transporting
How widely adopted is renting tractors
for transportation?
What is the cost per hour for motorized
transportation?
How many hours do you rent a tractor
for transport a year?
What inhibits you from renting transport
tractors for more hours
How far from the home office do
customers rent tractors for transport
Apart from the above listed services, are
there any other services you provide?
Challenges
What is keeping you from growing?
What types of hurdles/challenges do you
have from providing more services?
Why are you not providing other types of
tractors and implements?

70
References
Adewale Olaniyi Adewoyin, Emmanuel Atoo Ajav (July, 2013). Field and Economic
Performance of Three Tractor Models for Ploughing Operations in Sandy-clay soil of
Nigeria. Paper presented at 2013 ASABE International Meeting, Kansas City, Missouri,
USA.
Akinola, A. A. (1987). Government Tractor Hire Service Scheme as a Tractorization
Policy in Africa: The Nigerian Experience. Agricultural Administration and Extension,
25(2), 63-71.
Ashburner, J. E., & Kienzle, J. (2011). Investment in Agricultural Mechanization in
Africa: Conclusions and Recommendations of a Round Table Meeting of Experts. Rome:
Food and Agriculture Organization and United Nations Industrial Development
Organization.
Benin, S. (2014). Impact of Ghana's Agricultural Mechanization Services Center
Program. IFPRI Discussion Paper 01330. Washington DC: International Food Policy
Research Institute. Benin, S., M. Johnson, K. Jimah, J. Taabazuing, A. Tenga, E. Abokyi, G. Nasser, G.
Ahorbo, and V. Owusu. (2012). Evaluation of Four Special Initiatives of the Ministry of
Food and Agriculture, Government of Ghana. Final report, Ministry of Food and
Agriculture, Accra, Ghana.
Binswanger, H., Pingali, P., (1989). Technological Priorities for Farming in SSA. Journal
of International Development: Vol. 1 No. 1, 46-65
Bowles, P., MacPhail, F., (1990). Nucleus Estates in Sulawesi: A Lifeline for
Smallholders?. Canadian Journal of Development Studies, Vol XI, No. 2, 375-380
Bloom, R., (1979). A Review of Technical Evidence on the Use of Animal Traction in
Sahelian Farming Systems. Department of Agriculture Economics Michigan State
University, East Lansing, Michigan.
Chamberlin, J., Jayne, T. S., & Headey, D. (2014). Scarcity amidst abundance?
Reassessing the potential for cropland expansion in Africa. Food Policy, 48, 51-65.
Collier, P., & Dercon, S. (2014). African Agriculture in 50Years: Smallholders in a
Rapidly Changing World?. World Development, 63, 92-101.
Cunguara, B., Darnhofer, I., (2011). Assessing the Impact of Improved Agricultural
Technologies on Household Income in Rural Mozambique. Food Policy 36, 378-390.
de Janvry, A., Sadoulet, E., (2009). Agriculture Growth and Poverty Reduction:
Additional Evidence. The World Bank Research Observer, Vol. 25, No. 1. 1-20.

71
Dethier, J-J., Effenberger, A. (2012). Agriculture and Development: A Brief Review of
the Literature. Economic Systems 36, 175-205.
Diao, X., Cossar, F., Houssou, N., & Kolavalli, S. (2014). Mechanization in Ghana:
Emerging demand, and the search for alternative supply models. Food Policy, 48, 168-
181.
Eziakor, I. G. (1990). Comparative Analysis of the Effectiveness of Manual versus
Mechanized Tillage among Third World Smallholders: A Case Study in Bauchi State of
Nigeria. Agriculture, Ecosystems & Environment, 31(4), 301-312.
Ehui, S., Polson, R., (1993). A Review of the Economic and Ecological Constraints on
Animal Draft Cultivation in Sub-Saharan Africa. Soil & Tillage Research, 27, 195-210.
Giles, G. W. (1967). Agricultural Power and Equipment. 175-208. The World Food
Problem, Vol. III. A Report of the President's Science Advisory Committee. Washington,
D.C.
Glover, D., (1987). Increasing the Benefits to smallholders from Contract Farming:
Problems for Farmers’ Organizations and Policy Makers. World Development, Vol 15,
No. 4, 441-448.
Goering, C., (1992) Engine & Tractor Power, St. Joseph, MI: American Society of
Agriculture Engineers.
Hassett, J., Banwart, W., (1992). Soils & Their Environment, Englewood Cliffs, NJ:
Prentice-Hall, Inc.
Haub, C., Kaneda,T., (2013). World Population Data Sheet, Washington, DC:
Population Reference Bureau.
Houmy, K., Kienzle, J., & Ashburner, J. (July 2012). The Current Situation of the
Intervention of Private Sector in Agricultural Mechanization Development in African
Countries. International Conference of Agricultural Engineering-CIGR-AgEng 2012:
Agriculture and Engineering for a Healthier Life, Valencia, Spain.
Houmy, K., Clarke, L. J., Ashburner, J. E., & Kienzle, J. (2013). Agricultural
Mechanization in Sub Saharan Africa: Guidelines for preparing a strategy. Integrated
Crop Management (FAO). Vol 22-2013.
Houssou, N., Diao, X., Cossar, F., Kolavalli, S., Jimah, K., Aboagye, P., (2013).
Agricultural Mechanization in Ghana: Is specialized Agricultural Mechanization Service
Provision a Viable Business Model. American Journal of Agriculture Economics, 95,
1237-1244.
Itodo, I, Daudu, J., (July, 2013). Performance Evaluation of a Tractor Mounted Yam
[Dioscorea spp.] Harvester fitted with a Collection Unit. Paper presented at 2013
ASABE International Meeting, Kansas City, Missouri, USA.

72
Jafari, M., Sabzevari, A., & Vakilian, K. A. (2014). Effects of planting methods on yield
and morphological traits of three chickpea cultivars in rain fed conditions. Russian
Agricultural Sciences, 40(5), 339-343.
Kienzle, J., Hancox, W., & Ashburner, J. (June, 2010). Tractor Based Services and Related
Support Policies in Developing Countries. Paper presented at XVIIth World Congress of the
International Commission of Agricultural and Biosystems Engineering (CIGR), Quebec City,
Canada.
Marechera, G. (2014). Cassava Mechanisation and Agro-processing Project (CAMAP)
Progress Report for October 2014. African Agricultural Technology Foundation.
Mrema, G., Baker, D., Kahan, D., (2008). Agriculture Mechanization in sub-Saharan
Africa: Time for a new look. Rome: Food and Agriculture Organization of the United
Nations.
University of Nebraska Tractor Test Lab, Report of the Nebraska Tractor Test 1961,
John Deere 50595 Diesel 16 Speed, (2009). Lincoln, Nebraska.
Nkakini, S. O., Aytamunno, M.J., Ogaji, S.O.T, Probert, S.D., (2006). Farm
Mechanization Leading to More Effective Energy Utilizations for Cassava and Yam
Cultivations in Rivers State, Nigeria. Applied Energy 83, 1317-1325.
Odulaja, A., & Kiros, F. G. (1996). Modelling Agricultural Production of Small-Scale
Farmers in Sub-Saharan Africa: A case study in Western Kenya. Agricultural Economics,
14(2), 85-91.
Oni, K. C., & Oyelade, O. A. (July, 2013). Mechanization of Production and Processing
of Cassava for Value Addition in Nigeria. Paper presented at 2013 ASABE International
Meeting, Kansas City, Missouri, USA.
Pingali, P., Bigot, Y., Binswanger, H., (1987) Agriculture Mechanization and the
Evolution of Farming Systems in Sub-Saharan Africa. Baltimore, Md.: Johns Hopkins
University Press.
Pingali, P., (2007). Chapter 54: Agriculture Mechanization: Adoption Patterns and
Economic Impact. Handbook of Agricultural Economics, Vol.3, 2779-2805. Elsevier B.V.
DOI: 10.1016/S1574-0072(06)03054-4.
Porter, G., Phillips-Howard, K., (1997). Comparing Contracts: An Evaluation of Contract
Farming Schemes in Africa. World Development, Vol. 25, No. 2, 227-238.
Reardon, T., Barrett, C., Kelly, V., Savadogo, K., (1999). Policy Reforms and
Sustainable Agricultural Intensification in Africa. Development Policy Review, Vol. 17.
375-395.
73
Sartorius, K., Kirsten, J., (2007). A Framework to Facilitate Institutional Arrangements
for Smallholder Supply in Developing Countries: An Agribusiness Perspective. Food
Policy, 32. 640-655.
Shamsudeen, A., Paul, K. N., & Samuel, A. D. (2013). Technical efficiency of maize
production in Northern Ghana. African Journal of Agricultural Research, 8(43), 5251-
5259.
Skelton, D., Limiac, C., & Lumkes, J., (July, 2014). Mechanized Agriculture in Rural
Developing Countries, Paper presented at 2014 ASABE and CSBE/SCGAB Annual
International Meeting, Montreal, Quebec Canada.
Sutherland, L. A., & Burton, R. J. (2011). Good Farmers, Good Neighbours? The Role of
Cultural Capital in Social Capital Development in a Scottish Farming Community.
Sociologia Ruralis, 51(3), 238-255.
Takesima. H., Nin-Pratt, A., Diao, X., (2013). Mechanization and Agricultural
Technology Evolution, Agricultural Intensification in Sub-Saharan Africa: Typology of
Agricultural Mechanization in Nigeria. American Journal of Agriculture Economics,
95(5), 1230-1236.
Tueche, J., Norgrove, L., Hauser, S., Cadisch, G., (2013). Tillage and Varietal Impacts on
Tomato (Solanum Lycopersicum L.) Production on an Ultisol in Central Cameroon. Soil
& Tillage Research 128, 1-8.
Weness, E. (2001). Sharing Farm Machinery. University of Minnesota Extension. August
Woodhouse, P., (1989). From Green Revolution to Food Security in Sub-Saharan Africa:
Issues in Research and Technology Development. Food Policy, February, 7-12