An Ecological Response Model for the Cache la Poudre River ... · ecological conditions, including...
112
An Ecological Response Model for the Cache la Poudre River through Fort Collins DECEMBER 2014
Transcript of An Ecological Response Model for the Cache la Poudre River ... · ecological conditions, including...
An Ecological Response Model for the Cache la Poudre River through Fort Collins
DECEMBER 2014

AN ECOLOGICAL RESPONSE MODEL FOR THE CACHE LA POUDRE RIVER
THROUGH FORT COLLINS
ECOLOGICAL RESPONSE MODELING TEAM
THE ECOLOGICAL RESPONSE MODELING TEAM The development of the Ecological Response Model (ERM) has been a collaborative team effort that includes watershed scientists, policy analysts, and environmental planners. The ERM Team members include (listed alphabetically):
• Dr. Gregor Auble, Riparian Ecologist, U.S. Geological Survey, contributed to development and application of riparian model components
• Dr. Daniel Baker, Hydrologist, Research Scientist, Department of Civil and Environmental Engineering, Colorado State University
• Dr. Kevin Bestgen, Biologist, Director and Research Scientist in Larval Fish Laboratory, Department of Fish, Wildlife, and Conservation Biology, Colorado State University
• Dr. Brian Bledsoe, Hydrologist, Department of Civil and Environmental Engineering and Graduate Degree Program in Ecology, Colorado State University
• Dr. Boris Kondratieff, Entomologist, Department of Bioagricultural Sciences and Pest Management, Colorado State University
• Mark Lorie, Policy Analyst, independent consultant specializing in water resources planning • Dr. David Merritt, Riparian Ecologist, National Stream and Aquatic Ecology Center, U.S. Forest
Service • Dr. LeRoy Poff, Aquatic Biologist, Department of Biology and Director of the Graduate Degree
Program in Ecology, Colorado State University • Dr. John Sanderson, Co-director for Colorado’s Center of Science and Strategy, Freshwater
Biologist, The Nature Conservancy • Jennifer Shanahan, Environmental Planner for the City of Fort Collins, Natural Areas
Department • John Stokes, Natural Areas Department Director and City of Fort Collins point person for Poudre
River issues
Abbreviated biographical information for each Team member can be found in Appendix A
Any use of trade, firm, or product names is for descriptive purposes only and does not imply endorsement by the U.S. Government.
Suggested Citation:
Shanahan J.O., D.W. Baker, B.P. Bledsoe, N.L. Poff, D.M. Merritt, K.R. Bestgen, G.T. Auble, B.C. Kondratieff, J.G. Stokes, M. Lorie and J.S. Sanderson. 2014. An Ecological Response Model for the Cache la Poudre River through Fort Collins. City of Fort Collins Natural Areas Department, Fort Collins, CO. 93 pp + appendices.

TABLE OF CONTENTS Abstract ........................................................................................................................................................ v
List of Figures ........................................................................................................................................... vii
List of Tables .............................................................................................................................................. ix
List of Symbols, Chemicals, Units of Measure, and Abbreviations .................................................... xii
Section I: The Foundation .......................................................................................................................... 1 Introduction .......................................................................................................................................... 1
Scope of this Project and Report ............................................................................................... 2 Background ......................................................................................................................................... 3
The Poudre River Ecosystem .................................................................................................... 3 The Contemporary, Urban Poudre River ................................................................................... 4 Data-Based Understanding of the Poudre River ....................................................................... 4 Developing the ERM Team ....................................................................................................... 6
Study Area ........................................................................................................................................... 7 ERM Overview .................................................................................................................................... 8
Indicators of River Condition ..................................................................................................... 8 Final Bayesian Network Structure ............................................................................................. 9 Hydrologic Scenarios ............................................................................................................... 11
Section II: Methods and Model Components ......................................................................................... 13 Overview ........................................................................................................................................... 13 Methods for the Overall ERM ............................................................................................................ 13
Site Selection ........................................................................................................................... 13 Bayesian Network .................................................................................................................... 16 Hydrologic Scenarios ............................................................................................................... 18 Strengths and Limitations of the Bayesian Approach ............................................................. 24
Channel Structure ............................................................................................................................. 25 Background.............................................................................................................................. 25 Data Sources ........................................................................................................................... 26 Methods and Probability Tables .............................................................................................. 27
Algae ................................................................................................................................................. 31 The Impact of Nutrients on Algae ............................................................................................ 31 Background.............................................................................................................................. 33 Data Sources ........................................................................................................................... 34 Methods and Probability Tables .............................................................................................. 34
Aquatic Insects .................................................................................................................................. 35 Background.............................................................................................................................. 35 Data Sources ........................................................................................................................... 35 Methods and Probability Tables .............................................................................................. 36
Native Fish and Brown Trout ............................................................................................................. 39 Background.............................................................................................................................. 39
Ecological Response Model for Cache la Poudre River December 2014 City of Fort Collins iii

Data Sources ........................................................................................................................... 40 Methods and Probability Tables for Brown Trout .................................................................... 40 Methods and Probability Tables for Native Fish ...................................................................... 45
Riparian Vegetation – Rejuvenating Mosaic, Functional Riparian Zone and Riverine Wetlands ............................................................................................................................. 48
Background.............................................................................................................................. 48 Methods and Probability Tables .............................................................................................. 50 Geospatial Probabilities of Occurrence ................................................................................... 55
Summary of Components Analyses .................................................................................................. 57
Section III: Results and Discussion ........................................................................................................ 58 Overview ........................................................................................................................................... 58 Bayesian Model Results .................................................................................................................... 58
Channel Structure Results ....................................................................................................... 58 Algae Results........................................................................................................................... 61 Aquatic Insects Results ........................................................................................................... 63 Native Fish Results .................................................................................................................. 65 Brown Trout Results ................................................................................................................ 67 Rejuvenating Mosaic Results .................................................................................................. 69 Functional Riparian Zone Results ........................................................................................... 71 Riverine Wetlands Results ...................................................................................................... 73
Development of a Single Metric to Provide Expected Condition ...................................................... 75 Summary of River Condition by Flow Scenario ................................................................................ 80 ERM Evaluation................................................................................................................................. 81
Testing the ERM ...................................................................................................................... 81 Elements Not Included in the Model ........................................................................................ 82 Influence of Low-Flow Data on Modelling Process and Results ............................................. 83
Enhancing Predictive Ability in the Future ........................................................................................ 83
Section IV: Conclusions ........................................................................................................................... 86 Overview ........................................................................................................................................... 86 Possible Next Steps .......................................................................................................................... 90
Literature Cited .......................................................................................................................................... 91
Appendix A Abbreviated Bios for ERM Team Members
Appendix B Empirical Justification of Model Components
Appendix C Model Results
Appendix D Peer Review
Ecological Response Model for Cache la Poudre River December 2014 City of Fort Collins iv

ABSTRACT The Poudre River Ecological Response Model (ERM) is a collaborative effort initiated by the City of Fort Collins and a team of nine river scientists to provide the City with a tool to improve its understanding of the past, present, and likely future conditions of the Cache la Poudre River ecosystem. The overall ecosystem condition is described through the measurement of key ecological indicators such as shape and character of the stream channel and banks, streamside plant communities and floodplain wetlands, aquatic vegetation and insects, and fishes, both coolwater trout and warmwater native species. The 13-mile-long study area of the Poudre River flows through Fort Collins, Colorado, and is located in an ecological transition zone between the upstream, cold-water, steep-gradient system in the Front Range of the Southern Rocky Mountains and the downstream, warm-water, low-gradient reach in the Colorado high plains. The City wanted to better understand the ecological response of the Poudre River ecosystem to potential changes in stream flow and other physical parameters through the conceptual framework of a multi-variable integrated model. This goal was met through the use of a probabilistic model based on Bayesian concepts. This construct allowed the integration of a wide range of data and expert opinion (as informed by local data) to predict potential changes to ecosystem conditions under various flow scenarios. Nine flow scenarios representing past, present, and possible future hydrology were developed as the primary model input. Both reach-scale drivers such as stream channel conditions and pollutant loads, as well as ecological conditions, including species composition, interactions, and habitat requirements influenced model-predicted ecosystem outcomes. Model output consisted of probability distributions for eight ecological indicators collectively representing the physical setting, aquatic life, and riparian habitats of the river ecosystem. We are confident in model predictions related to probable trends, relative magnitude of changes and potential ecosystem responses to changing flow conditions, though data availability and the process of converting diverse data types into a common unit (probabilities) limit precision of individual results. Key findings suggest that:
• The present ecological function of the Poudre River is altered as a result of more than 150 years of human influences that include highly managed flows, urbanization, gravel mining, channelization and urban and industrial encroachment in the floodplain, underscoring the vulnerable and complex character of the Poudre River;
• A continuation of today’s flow management will lead to ongoing changes in ecosystem condition, and additional water depletions will compromise ecological conditions;
• High flows play an essential role in maintaining and improving the aquatic and riparian condition of the river;
• Adequate flows in base-flow periods are critical to desirable water quality, and thriving fish and insect populations; Improvement of native aquatic life is possible if issues related to channel modifications, siltation, invasive species, and base and high flow conditions are managed properly;
• The present confined river channel and modified flows has reduced the potential for a keystone and iconic species, plains cottonwood, to be self-sustaining in the study area;
• The streamside corridor retains the potential to support a functioning riparian forest that provides important ecological services if periodic floodplain inundation occurs.
Environmental flows that combine stable and adequate flows in base-flow periods with occasional rejuvenating high flows that meet target levels defined in this study are likely improve all biological indicators across the system. ERM test scenarios that include both stable base flows and rejuvenating high flows indicate that substantial improvements in the river ecosystem can be achieved with improved management of flow volumes similar to those observed in the river during the last half century of intensive water development. These results underscore the possibility of improving the river ecosystem through active management while still maintaining the Poudre’s diverse economic benefits and role as a working river.
Ecological Response Model for Cache la Poudre River December 2014 City of Fort Collins v

The ERM was designed to represent the multi-dimensional ecological character of the contemporary urban Poudre River. It provides a scientific foundation that can serve as a decision support tool and foster a more informed community discussion about the future of the river as it provides a better understanding of the likely response of the Poudre River ecosystem to environmental flow management and other stewardship activities. In particular, model results can assist managers in developing specific management actions to achieve desirable goals for key indicators of river health.
Ecological Response Model for Cache la Poudre River December 2014 City of Fort Collins vi
LIST OF FIGURES Figure I.1: Comparison of the monthly average flows at the Lincoln Gage in downtown
Fort Collins for Water Years 1970-2005 between the recent past and reconstructed native hydrologic scenarios. ................................................................................................................... 4
Figure I.2: ERM study area within the Poudre watershed ........................................................................... 7
Figure I.3: The overall structure of the Poudre River ERM. ......................................................................... 9
Figure I.4: Overall structure of the Bayesian network for the Poudre ERM. .............................................. 10 Figure II.1: Designated ERM reaches through the City of Fort Collins, starting near the
town of Laporte and flowing downstream to just east of Interstate 25. ................................................ 14
Figure II.2: Overall structure of the Bayesian network for the Poudre ERM as reproduced from Section I. ....................................................................................................................................... 17
Figure II.3: Hydrographs of Water Years 1994 and 1995 across the five core hydrologic scenarios. ............................................................................................................................................. 22
Figure II.4: Comparison of median (25% to < 75%) annual hydrographs of the four test hydrologic Scenarios. ........................................................................................................................... 22
Figure II.5: Annual load rates. .................................................................................................................... 32
Figure II.6: Number of young Brown Trout (< 160 mm total length, about six inches) captured with electrofishing in the Poudre River at McMurry Park, 1990–2006 (except 1997 and 1999) in autumn samples as a function of flow level (cfs) in the prior winter (1 November-1 March) during incubation. ............................................................................................ 41
Figure II.7: Area between Overland Trail and Taft Hill roads in 1937. ....................................................... 49
Figure II.8: This shows the same area as Figure II.3 after a century of land use changes (including extensive gravel mining). ..................................................................................................... 49
Figure II.9. Probability of herbaceous hydrophytic species guild as a function of inundation fit to 2009 Poudre River riparian plot data using logistic regression. ................................. 56
Figure III.1: Relative likelihood of four states of Channel Structure associated with nine flow scenarios. ...................................................................................................................................... 59
Figure III.2. Relative likelihood of three states of Algae associated with nine flow scenarios. ............................................................................................................................................. 62
Figure III.3. Relative likelihood of three states of Aquatic Insects associated with nine flow scenarios. ...................................................................................................................................... 64
Figure III.4: Relative likelihood of four states of Native Fish associated with nine flow scenarios. ............................................................................................................................................. 66
Figure III.5. Relative likelihood of four states of Brown Trout associated with nine flow scenarios. ............................................................................................................................................. 68
Figure III.6: Relative likelihood of four states of the Rejuvenating Mosaic associated with nine flow scenarios. .............................................................................................................................. 70
Figure III.7: Relative likelihood of four states of Functional Riparian Zone width associated with nine flow scenarios. .................................................................................................... 72
Figure III.8. Relative likelihood of four states of Riverine Wetlands associated with nine flow scenarios. ...................................................................................................................................... 74
Ecological Response Model for Cache la Poudre River December 2014 City of Fort Collins vii

Figure III.9: Results presented in single metric form for all hydrologic scenarios for Channel Structure (above) and Algae (below) for all three reaches (distinguished by symbol). ................................................................................................................................................ 76
Figure III.10 Results presented in single metric form for all hydrologic scenarios for Aquatic Insects (above) and Native Fish (below) for all three reaches (distinguished by symbol). ........................................................................................................................................... 77
Figure III.11 Results presented in single metric form for all hydrologic scenarios for Brown Trout (above) and Rejuvenating Mosaic (below) for all three reaches (distinguished by symbol). .................................................................................................................... 78
Figure III.12 Results presented in single metric form for all hydrologic scenarios for Functional Riparian Zone (above) and Riverine Wetland (below) for all three reaches (distinguished by symbol). .................................................................................................................... 79
Figure IV.1 Secondary drivers of river condition including fragmentation of aquatic habitat from diversion dams (left) and pollutant loading as occurs when oil is dumped directly into storm drains (right). ........................................................................................................................ 86
Figure IV.2 Recent lowering of a high berm (remnant from gravel mining activity) between the Poudre River and Sterling Pond upstream of Shields St. allowed high spring flows in June 2014 to overtop its banks, inundate a wider riparian area, and flow into the pond.................................................................................................................................. 89
Figure IV.3 Bank stabilization, confinement at bridge underpasses, and development encroachment into the floodplain is observed where the Poudre travels under Mulberry St. and Lemay Ave. bridges and parallel to Riverside Ave. .................................................. 89
Ecological Response Model for Cache la Poudre River December 2014 City of Fort Collins viii
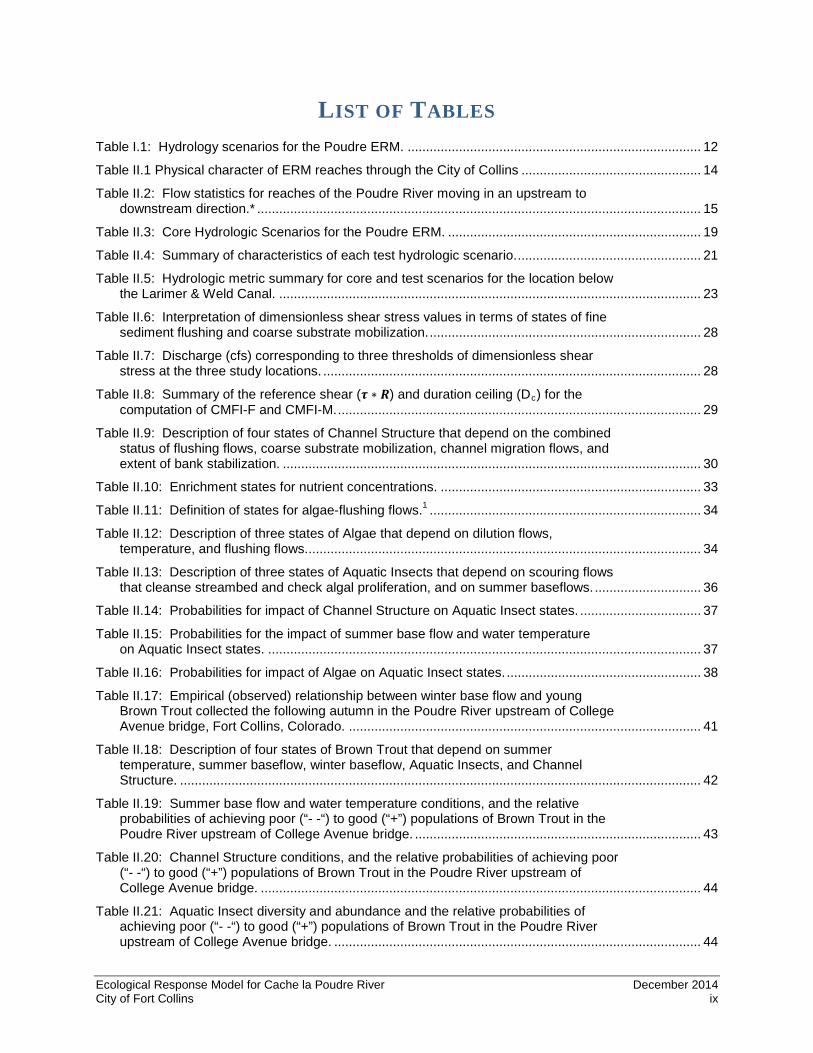
LIST OF TABLES Table I.1: Hydrology scenarios for the Poudre ERM. ................................................................................ 12
Table II.1 Physical character of ERM reaches through the City of Collins ................................................. 14
Table II.2: Flow statistics for reaches of the Poudre River moving in an upstream to downstream direction.* ......................................................................................................................... 15
Table II.3: Core Hydrologic Scenarios for the Poudre ERM. ..................................................................... 19
Table II.4: Summary of characteristics of each test hydrologic scenario. .................................................. 21 Table II.5: Hydrologic metric summary for core and test scenarios for the location below
the Larimer & Weld Canal. ................................................................................................................... 23
Table II.6: Interpretation of dimensionless shear stress values in terms of states of fine sediment flushing and coarse substrate mobilization. .......................................................................... 28
Table II.7: Discharge (cfs) corresponding to three thresholds of dimensionless shear stress at the three study locations. ....................................................................................................... 28
Table II.8: Summary of the reference shear (𝝉𝝉 ∗ 𝑹𝑹) and duration ceiling (Dc) for the computation of CMFI-F and CMFI-M. ................................................................................................... 29
Table II.9: Description of four states of Channel Structure that depend on the combined status of flushing flows, coarse substrate mobilization, channel migration flows, and extent of bank stabilization. .................................................................................................................. 30
Table II.10: Enrichment states for nutrient concentrations. ....................................................................... 33
Table II.11: Definition of states for algae-flushing flows.1 .......................................................................... 34
Table II.12: Description of three states of Algae that depend on dilution flows, temperature, and flushing flows. ........................................................................................................... 34
Table II.13: Description of three states of Aquatic Insects that depend on scouring flows that cleanse streambed and check algal proliferation, and on summer baseflows. ............................. 36
Table II.14: Probabilities for impact of Channel Structure on Aquatic Insect states. ................................. 37
Table II.15: Probabilities for the impact of summer base flow and water temperature on Aquatic Insect states. ...................................................................................................................... 37
Table II.16: Probabilities for impact of Algae on Aquatic Insect states. ..................................................... 38
Table II.17: Empirical (observed) relationship between winter base flow and young Brown Trout collected the following autumn in the Poudre River upstream of College Avenue bridge, Fort Collins, Colorado. ................................................................................................ 41
Table II.18: Description of four states of Brown Trout that depend on summer temperature, summer baseflow, winter baseflow, Aquatic Insects, and Channel Structure. .............................................................................................................................................. 42
Table II.19: Summer base flow and water temperature conditions, and the relative probabilities of achieving poor (“- -“) to good (“+”) populations of Brown Trout in the Poudre River upstream of College Avenue bridge. .............................................................................. 43
Table II.20: Channel Structure conditions, and the relative probabilities of achieving poor (“- -“) to good (“+”) populations of Brown Trout in the Poudre River upstream of College Avenue bridge. ........................................................................................................................ 44
Table II.21: Aquatic Insect diversity and abundance and the relative probabilities of achieving poor (“- -“) to good (“+”) populations of Brown Trout in the Poudre River upstream of College Avenue bridge. .................................................................................................... 44
Ecological Response Model for Cache la Poudre River December 2014 City of Fort Collins ix
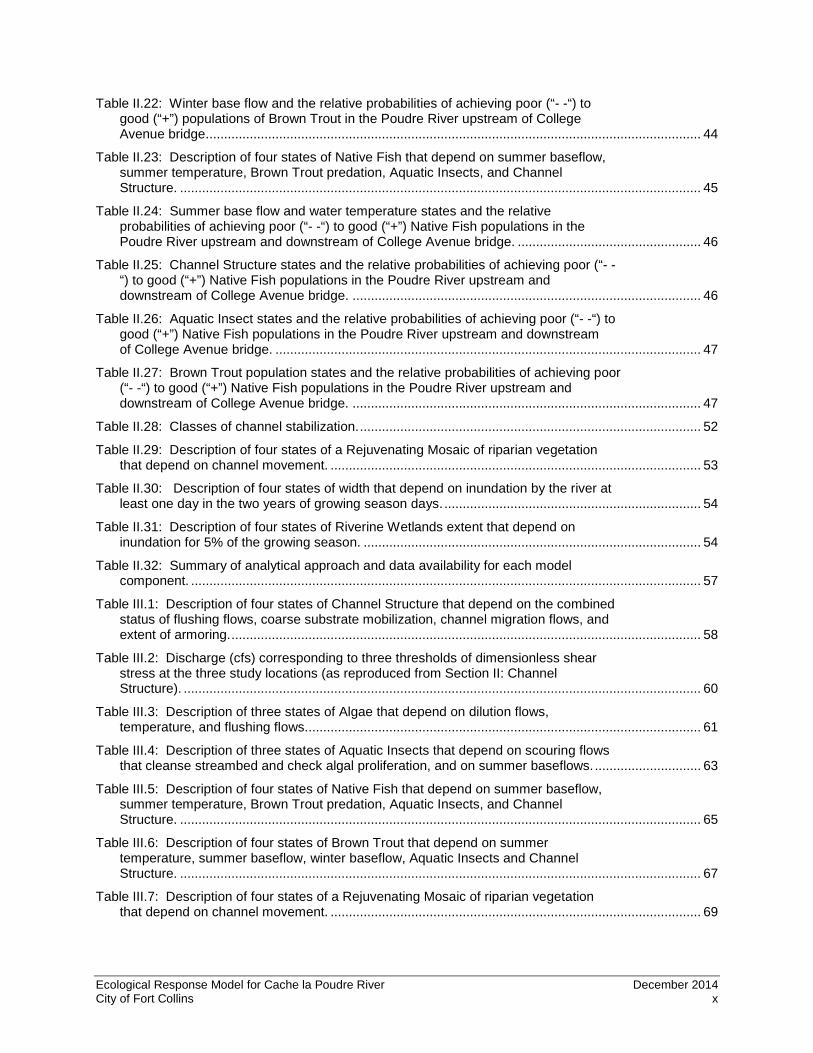
Table II.22: Winter base flow and the relative probabilities of achieving poor (“- -“) to good (“+”) populations of Brown Trout in the Poudre River upstream of College Avenue bridge....................................................................................................................................... 44
Table II.23: Description of four states of Native Fish that depend on summer baseflow, summer temperature, Brown Trout predation, Aquatic Insects, and Channel Structure. .............................................................................................................................................. 45
Table II.24: Summer base flow and water temperature states and the relative probabilities of achieving poor (“- -“) to good (“+”) Native Fish populations in the Poudre River upstream and downstream of College Avenue bridge. .................................................. 46
Table II.25: Channel Structure states and the relative probabilities of achieving poor (“- -“) to good (“+”) Native Fish populations in the Poudre River upstream and downstream of College Avenue bridge. ............................................................................................... 46
Table II.26: Aquatic Insect states and the relative probabilities of achieving poor (“- -“) to good (“+”) Native Fish populations in the Poudre River upstream and downstream of College Avenue bridge. .................................................................................................................... 47
Table II.27: Brown Trout population states and the relative probabilities of achieving poor (“- -“) to good (“+”) Native Fish populations in the Poudre River upstream and downstream of College Avenue bridge. ............................................................................................... 47
Table II.28: Classes of channel stabilization. ............................................................................................. 52
Table II.29: Description of four states of a Rejuvenating Mosaic of riparian vegetation that depend on channel movement. ..................................................................................................... 53
Table II.30: Description of four states of width that depend on inundation by the river at least one day in the two years of growing season days. ...................................................................... 54
Table II.31: Description of four states of Riverine Wetlands extent that depend on inundation for 5% of the growing season. ............................................................................................ 54
Table II.32: Summary of analytical approach and data availability for each model component. ........................................................................................................................................... 57
Table III.1: Description of four states of Channel Structure that depend on the combined status of flushing flows, coarse substrate mobilization, channel migration flows, and extent of armoring. ................................................................................................................................ 58
Table III.2: Discharge (cfs) corresponding to three thresholds of dimensionless shear stress at the three study locations (as reproduced from Section II: Channel Structure). ............................................................................................................................................. 60
Table III.3: Description of three states of Algae that depend on dilution flows, temperature, and flushing flows. ........................................................................................................... 61
Table III.4: Description of three states of Aquatic Insects that depend on scouring flows that cleanse streambed and check algal proliferation, and on summer baseflows. ............................. 63
Table III.5: Description of four states of Native Fish that depend on summer baseflow, summer temperature, Brown Trout predation, Aquatic Insects, and Channel Structure. .............................................................................................................................................. 65
Table III.6: Description of four states of Brown Trout that depend on summer temperature, summer baseflow, winter baseflow, Aquatic Insects and Channel Structure. .............................................................................................................................................. 67
Table III.7: Description of four states of a Rejuvenating Mosaic of riparian vegetation that depend on channel movement. ..................................................................................................... 69
Ecological Response Model for Cache la Poudre River December 2014 City of Fort Collins x

Table II.8: Description of four states of width that depend on inundation by the river at least one day in the two years of growing season days. ...................................................................... 71
Table III.10: Description of four states of Riparian Wetlands extent that depend on inundation for 5% of the growing season. Widths include both sides of channel and represent total area divided by channel length. .................................................................................... 73
Table III.10: Example computation of relative condition for Native Fish in Reach 3a under the Additional Water Development scenario. ....................................................................................... 75
Ecological Response Model for Cache la Poudre River December 2014 City of Fort Collins xi
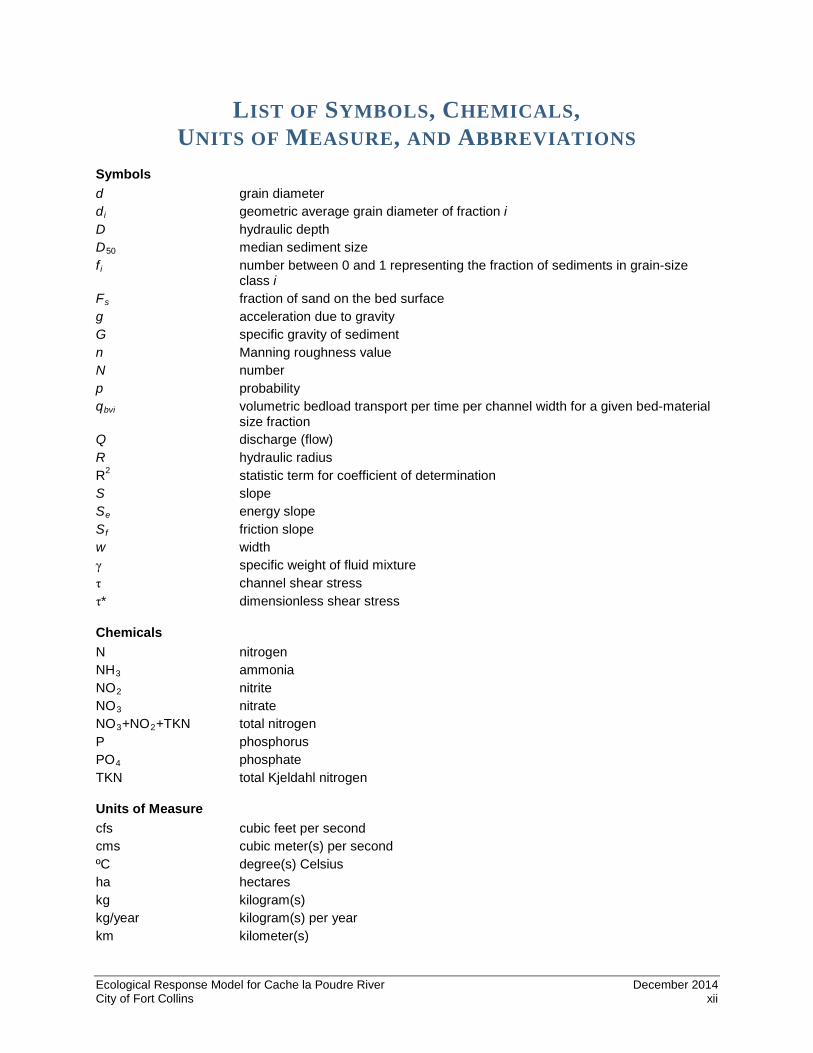
LIST OF SYMBOLS, CHEMICALS, UNITS OF MEASURE, AND ABBREVIATIONS
Symbols d grain diameter di geometric average grain diameter of fraction i D hydraulic depth D50 median sediment size fi number between 0 and 1 representing the fraction of sediments in grain-size
class i Fs fraction of sand on the bed surface g acceleration due to gravity G specific gravity of sediment n Manning roughness value N number p probability qbvi volumetric bedload transport per time per channel width for a given bed-material
size fraction Q discharge (flow) R hydraulic radius R2 statistic term for coefficient of determination S slope Se energy slope Sf friction slope w width γ specific weight of fluid mixture τ channel shear stress τ* dimensionless shear stress
Chemicals N nitrogen NH3 ammonia NO2 nitrite NO3 nitrate NO3+NO2+TKN total nitrogen P phosphorus PO4 phosphate TKN total Kjeldahl nitrogen
Units of Measure cfs cubic feet per second cms cubic meter(s) per second ºC degree(s) Celsius ha hectares kg kilogram(s) kg/year kilogram(s) per year km kilometer(s)
Ecological Response Model for Cache la Poudre River December 2014 City of Fort Collins xii

l liter(s) m meter(s) m2 square meter(s) m3/s cubic meter(s) per second mg milligram(s) mg/L milligram(s) per liter mm millimeter(s) Pa Pascal(s) µm micrometer(s) % percent # number
Abbreviations +, 0, -, -- probability category or state definitions 1, 2, 3a, 3b, 4, 5, 6, 7 Poudre River reaches 3a, 3b, 6 Poudre River reaches modeled with ERM ACE Anderson Consulting Engineers, Inc. ASCE American Society of Civil Engineers BAGS Bedload Assessment in Gravel-bedded Streams; U.S. Forest Service software
package BMP best management practice BN Bayesian network BNR Biological Nutrient Removal BOR Bureau of Reclamation CDPHE Colorado Department of Public Health and Environment CFC City of Fort Collins CSU Colorado State University CTP Common Technical Platform D5, D16, D35, D50, diameter of sediment percentiles (e.g., D5 is 5th percentile diameter) D65, D84, D95 DEM digital elevation model DWRF Drake Water Reclamation Facility EIS Environmental Impact Statement ELC Environmental Learning Center, Colorado State University EMAP Environmental Monitoring and Assessment Program ENV environment EPA U.S. Environmental Protection Agency EPT Sensitive macroinvertebrate taxa (Ephemeroptera, Plecoptera, and Trichoptera) %EPT Percent of sample consisting of orders Ephemeroptera, Plecoptera, and
Trichoptera ERM Ecological Response Model FORTRAN programming language GCM global circulation model GIS geographic information system GPS global positioning system H Historic gage record ERM hydrologic scenario HEC-RAS 1-dimensional hydraulic model from the Hydrologic Engineering Center of
U.S. Army Corps of Engineers
Ecological Response Model for Cache la Poudre River December 2014 City of Fort Collins xiii
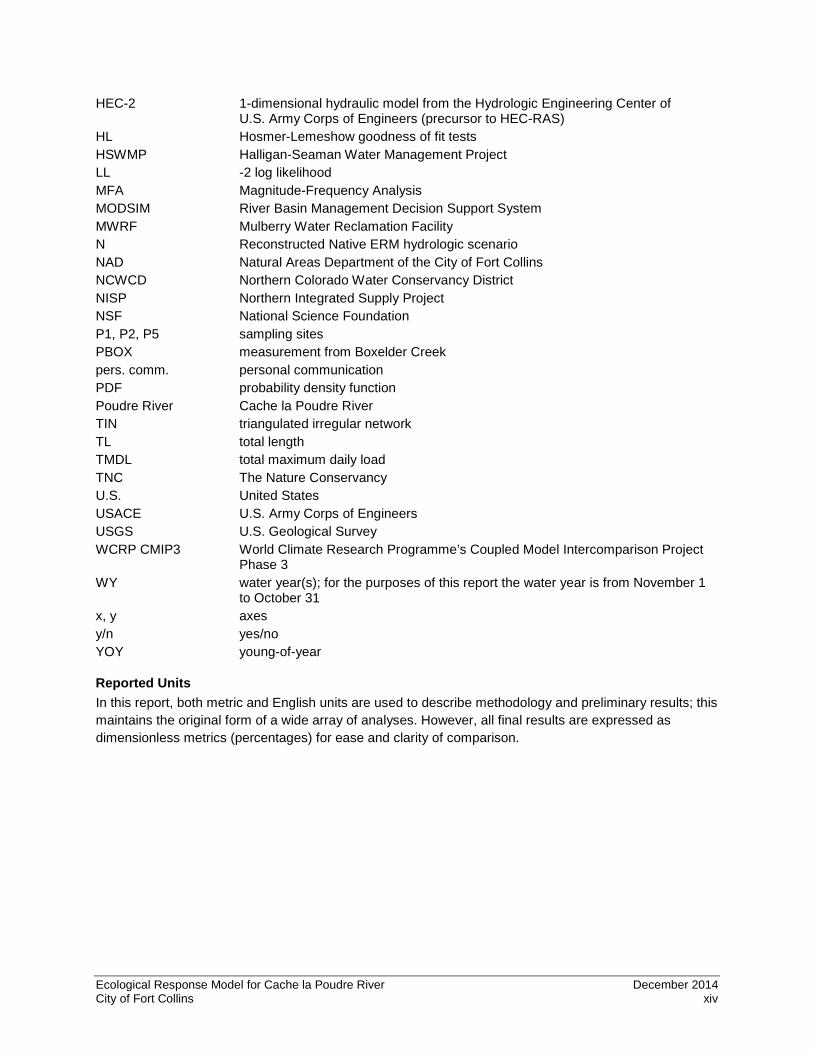
HEC-2 1-dimensional hydraulic model from the Hydrologic Engineering Center of U.S. Army Corps of Engineers (precursor to HEC-RAS)
HL Hosmer-Lemeshow goodness of fit tests HSWMP Halligan-Seaman Water Management Project LL -2 log likelihood MFA Magnitude-Frequency Analysis MODSIM River Basin Management Decision Support System MWRF Mulberry Water Reclamation Facility N Reconstructed Native ERM hydrologic scenario NAD Natural Areas Department of the City of Fort Collins NCWCD Northern Colorado Water Conservancy District NISP Northern Integrated Supply Project NSF National Science Foundation P1, P2, P5 sampling sites PBOX measurement from Boxelder Creek pers. comm. personal communication PDF probability density function Poudre River Cache la Poudre River TIN triangulated irregular network TL total length TMDL total maximum daily load TNC The Nature Conservancy U.S. United States USACE U.S. Army Corps of Engineers USGS U.S. Geological Survey WCRP CMIP3 World Climate Research Programme’s Coupled Model Intercomparison Project
Phase 3 WY water year(s); for the purposes of this report the water year is from November 1
to October 31 x, y axes y/n yes/no YOY young-of-year
Reported Units In this report, both metric and English units are used to describe methodology and preliminary results; this maintains the original form of a wide array of analyses. However, all final results are expressed as dimensionless metrics (percentages) for ease and clarity of comparison.
Ecological Response Model for Cache la Poudre River December 2014 City of Fort Collins xiv

Ecological Response Model for Cache la Poudre River December 2014 City of Fort Collins xv

SECTION I: THE FOUNDATION
INTRODUCTION The Cache la Poudre River (hereafter Poudre River, or Poudre) is a treasured community resource and asset. The City of Fort Collins recognizes that a healthy Cache la Poudre River provides the community with a broad set of ecological, municipal, industrial, and agricultural benefits that are highly valued by the public. Ecosystem benefits include providing a high quality water supply, flood conveyance, and native flora and fauna. Associated benefits include recreation and aesthetic appeal. Healthy and diverse river ecosystems are more resilient to extreme weather events such as floods and fires and community’s resilience is intricately tied to the condition of the rivers and watersheds in which they live.
The quantity and timing of flow in the river, known as its hydrologic or flow regime, is of fundamental importance in the provision and maintenance of these benefits. The Poudre River ecosystem has many existing and anticipated future demands on its water. These demands and other stresses on the river (such as non-point source pollution) have caused fundamental changes to its ecosystem. The ecosystem will likely experience additional stresses and changes over the coming decades, as demands increase with a growing population and changes in water delivery from the Poudre River watershed. During the next decade, the City of Fort Collins and the region will be faced with the challenge of determining local and regional priorities for consumptive use of water, while also providing for non-consumptive benefits and amenities, such as ecological health and recreation.
The goal of achieving consumptive and non-consumptive uses has been embraced by statewide, regional, and local planning and management agencies in Colorado. In 2013, Governor Hickenlooper issued an executive order directing the Colorado Water Conservation Board to develop a Colorado Water Plan that, among other objectives, provides for “a strong environment that includes healthy watersheds, rivers and streams, and wildlife” (Hickenlooper, 2013).
There are numerous local entities focused on the future of the Poudre River, including The Poudre Runs Through It Study/Action Group, a collaborative group convened by the Colorado Water Institute at Colorado State University. This group reflects a diversity of stakeholder values, including municipal water suppliers, farmers, and environmental interests. In their recent progress report (Colorado State University, 2013), the group conveys agreement that “we all want a river that meets our human needs AND is a healthy river in its own right.” This sentiment provokes a number of questions:
• How is a healthy Poudre River defined? • What is the current state of river health? • What are possible future states of the river? • What can be done to achieve and sustain river health in balance with the provision of
consumptive and ecosystem services?
In September 2011, the City of Fort Collins Natural Areas Department initiated a science-based collaborative project by convening a team of scientists to help quantify long-term environmental trends and opportunities for improvement on the Poudre River. The product of that effort, the Poudre River Ecological Response Model (ERM), is presented in this report and was conceived and developed to help the City’s leaders and citizens better understand the changes that would likely occur in the Poudre River ecosystem under a range of plausible hydrologic futures that reflect increasing human demand and climate change. This information is critical to helping the City and public forge a vision for the long-term
Ecological Response Model for Cache la Poudre River December 2014 City of Fort Collins 1
health and resilience for the Poudre River ecosystem. It identifies possible alternative actions to pursue that vision.
The ERM is one of many tools and approaches that have been developed and applied during the past two decades to understand the relationship between streamflow and the condition of fish, plants, and other species residing in and along the Poudre River and elsewhere in Colorado. Some examples of other tools include the Indicators of Hydrologic Alteration (descriptions of ecologically relevant streamflow conditions relative to pre-flow altered conditions); R2Cross (estimates of minimum flows for sustaining fish); River2D (modeling of available fish habitat at various flow levels); HEC-RAS (modeling flows required for sediment movement and the elevation of the water surface at various flow volumes); and the Watershed Flow Evaluation Tool (estimates potential risks to fish and streamside vegetation based on current or potential future streamflow conditions). The ERM fills a particular niche among these tools because it is specific to a 13-mile reach of the Poudre River, and it addresses and integrates multiple physical and ecological aspects of the river system. Like the other tools, the ERM was developed and is applied primarily to understand how streamflow sustains species and ecosystems, and to define the streamflow conditions necessary to maintain certain ecosystem conditions in the Poudre River.
The ERM project has two overarching goals:
1. To provide a broad and integrated evaluation of future river conditions given past, present, and potential future flow scenarios and multiple interacting ecological drivers and
2. To inform flow and management scenarios that help the community attain its vision of a healthy river.
To achieve these goals, the team developed an integrated model that could be used to explore how the hydrologic regime of the Poudre River influences several different ecosystem responses. This requires a framework to explicitly define connections between different ecosystem components and their relationship to key environmental drivers (such as the magnitude, duration, and timing of river flows) with known geomorphic or ecological functions (such as flushing fine sediment and inundating floodplains that control habitat structure). The ERM makes it possible to perform what-if analyses and to examine ecosystem responses to a number of plausible scenarios of future hydrologic regimes.
Scope of this Project and Report This report provides a comprehensive description of the ERM. Section I describes the background, scope and general approach used to develop the overall model. Section II provides a more detailed description of the overall strength of the model and its methods, followed by a description of the unique analytical approach used for each model component or node. Section III presents and discusses the results of the ERM, as well as some limitations of the model in its current form and recommendations for its further improvement and application. Section IV presents conclusions from the model and new insights gained from the ERM process.
The ERM offers objective science-based insight into how the Poudre River ecosystem will respond to water resources development and various forms of management activity. As such it can be used to help inform decisions about improving and sustaining river health. The ERM project does not evaluate the legal, technical, and administrative feasibility of attaining specific flow conditions or enacting specific floodplain or in-channel management actions. The model also does not directly generate decisions or determine priorities; however, the scientific results of the model may be able to help inform managers’ decision making and prioritization.
Ecological Response Model for Cache la Poudre River December 2014 City of Fort Collins 2
This project covers the reach of the Poudre River through Fort Collins, specifically from Overland Trail Road to Interstate 25. Hydrologic data for the model come from the past 60 years of flow records at multiple gages upstream of and within Fort Collins and simulations of river flow (described in Section II). By applying contemporary and proposed operations (diversion extraction, transbasin augmentation, and storage) to this historical flow record, the model provides a comprehensive view of current and possible future river conditions based on currently available data.
BACKGROUND The Poudre River Ecosystem Prior to agricultural and urban development that began in the mid-1800s, the river ecosystems of Colorado’s Front Range (an area located between the Great Plains to the east and the foothills of the Rocky Mountains to the west) evolved with periodic high flows driven by spring snowmelt. These high flows provided scour, deposition, and associated movement of the river channel back and forth across the floodplain. Native animals and plants in the river ecosystem became adapted to and/or dependent on these predictable patterns of flood disturbance, as well as on late summer and fall base flows that were typically low and extended through the winter. The native Poudre River through Fort Collins was highly sinuous, oftentimes with multiple channels, and bordered by riparian forests of plains cottonwood and other water-dependent plant, animal and insect species. The patterns of growth, reproduction and survival of the aquatic and riparian life (aquatic insects, native fishes, and riparian vegetation) closely followed the seasonal pattern of flows and disturbance.
These patterns of natural flow and disturbance varied from year to year in terms of magnitude and duration, creating a heterogeneous river corridor with a spatial mosaic of habitats in which the cover, species, composition, and establishment of aquatic and riparian species also varied. In wet years, high flows inundated the floodplain, physically altering the structure of the channel and creating complex off-channel habitats that supported a range of habitats and supporting diverse aquatic and riparian communities. Recruitment and establishment (successful reproduction) among riparian species also depended on the intensity and lateral extent of annual floodplain inundation. High flows, and the associated scouring and burial, could cause some immediate mortality of aquatic species. However, the complex channel structure and off-channel habitats created and maintained by high flows provided refuges, such as cleansed beds for insects and spawning native fishes. These contributed to a shifting mosaic of habitat types that favored different species in different years, and thus maintained the potential for high biodiversity and for rapid recovery from extreme events.
The stretch of the Poudre River running through the City of Fort Collins is characterized as a transitional zone (an ecotone in ecological terms). The Poudre originates in the high-elevation mountains of the Front Range as a fast-flowing, steep, physically confined cold montane river. As the Poudre emerges from the foothills to the wider, lower gradient valley reaches of the transition zone (approximately 1,600-1,900m altitude), it changes to a river that is less confined and begins to meander across a wide floodplain. Prior to development of the area that began in the mid-1800s, the composition of the plant and wildlife communities was characteristic of the unique conditions found in a transitional zone. For example, upper reaches of the river were almost entirely dominated by narrowleaf cottonwood, whereas downstream reaches were dominated by plains cottonwood. A similar shift occurred in shrubs and herbaceous plant communities, as well as in aquatic species, such as native fish and insects; cold-water species dominated the upper reaches and warm-water species the lower reaches. Additionally, several native fishes were restricted in their occurrence to only this transition zone.
Ecological Response Model for Cache la Poudre River December 2014 City of Fort Collins 3

The Contemporary, Urban Poudre River A common local saying is that “the Poudre River is the hardest-working river in Colorado.” Existing diversions from the river for agriculture, municipal water supply, and return flow, including sewage effluent and other uses, have significantly altered its flow regime and water quality compared to the period prior to water development. Figure I.1 compares the typical pattern of the Poudre’s monthly average flows (expected under native conditions) with the pattern of flows that has actually occurred over the last 40 years. The change from the native condition is substantial; on average the spring peak monthly flow is reduced by nearly 1,200 cfs (59%), while the lowest monthly flow, typically in February, is 57% lower. Because of the strong and direct link between flow quantity, timing, and ecosystem condition, these changes in flow patterns have substantially impacted the character of the river. Furthermore, it is apparent from multiple lines of evidence that changes are ongoing. Future demands for water are likely to increase the degree of flow alteration, resulting in additional changes to river condition. To conserve a healthy working river, it is important to understand the consequences and possibilities of alternative water management actions.
Figure I.1: Comparison of the monthly average flows at the Lincoln Gage in downtown Fort Collins for Water Years 1970-2005 between the recent past and reconstructed native hydrologic scenarios. Note: Both scenarios are discussed in detail later in Section II.
In addition to the numerous water diversions from the river, urbanization surrounding this reach of the Poudre River has physically constrained its ability to expand and migrate laterally within the floodplain during high runoff periods. This confinement limits the available habitat for both plants and aquatic animals, and reduces the ability of the river to create and maintain habitats over time.
Data-Based Understanding of the Poudre River Scientific knowledge of the Poudre River ecosystem comes from studies specifically focused on the Poudre River and from numerous studies about similar snowmelt-driven rivers in the western United States. Some of the most comprehensive research relevant to the urban reach of the river includes an analysis of flushing flow needs of the lower Poudre River (Milhous, 2007); an effort to determine a flow regime necessary to maintain overall health of the river (Bartholow, 2010); a management plan of natural areas within the floodplain (City of Fort Collins, 2011); and, most recently, extensive studies related to multiple Environmental Impact Statements (EISs) supporting federal permitting of proposed expansion or creation of reservoirs in the basin (U.S. Army Corps of Engineers (COE), 2008).
Ecological Response Model for Cache la Poudre River December 2014 City of Fort Collins 4
Applied research currently being conducted on the Poudre includes periodic sampling of fish populations, investigations into the effects of the High Park fire runoff on aquatic invertebrates, and collection of data on sediment movement, water quality, and vegetation along the river. These disparate projects provide valuable insight into individual components and reaches of the Poudre River ecosystem.
Models used in the regulatory processes, such as the EISs currently being conducted for both the Northern Integrated Supply Project (NISP) and the Halligan-Seaman Water Management Plan (HSWMP) under the National Environmental Policy Act, typically address a fairly broad range of important river resources such as fish, sediment, and wetlands. They can provide valuable new information and understanding. However, the EISs are being developed for the specific purpose of evaluating and describing the impacts of the proposed projects and possible alternatives under Section 404 of the Clean Water Act (U.S. Environmental Protection Agency, 2012). The City has different interests: What is the range of possible futures and under what conditions can a desirable healthy future river system be achieved? The ERM is not intended to replace the models used in the HSWMP and NISP regulatory processes. Furthermore, because of the different modeling framework used across these studies, ERM outputs should not be viewed as directly comparable with outputs from the EIS models. Failure to recognize that the ERM was developed with a different modeling approach than EIS models risks drawing inaccurate conclusions when comparing outputs between the models.
The ERM was built as a probability-based model known as a Bayesian network. A graphical representation of the relationship between variables, this powerful platform allows incorporation of a range of data inputs – from collected field data, to simulated outputs from sub models, to expert opinion. All these different types of data can have different degrees of associated certainty. The ERM’s flexibility is required to build an integrated ecosystem model that can paint a broad picture of ecosystem responses even when some aspects of the ecosystems are less well understood than others. The greatest value of the Bayesian model is that it captures known and inferred relationships among hydrology, sediment/geomorphology and ecology to investigate ecosystem-level responses to a range of plausible hydrologic futures. Comparison of ecosystem responses across the hydrologic futures provides insight into the relative impacts to the overall Poudre River ecosystem under different runoff scenarios, both directly through management interventions and indirectly through climate change.
A series of water storage and supply projects have been proposed in recent years that may have a direct effect on the Poudre River. These include HSWMP on the North Fork of the Poudre as well as implementation of NISP. Initially, these two projects were being evaluated independently, but the U.S. Army Corps of Engineers (COE) realized that a Common Technical Platform (CTP) for hydrologic analysis (as well as other analyses) would be merited to better analyze the effects of all proposed projects. The continuing development of EISs for both projects has improved the understanding of the Poudre River ecosystem. At the time of publication, a draft EIS for HSWMP and supplemental draft EIS for NISP are under development. Future rounds of EISs will likely include the following:
1. Detailed hydrologic modeling that captures how current and proposed future operations affect river flow patterns
2. Two-dimensional modeling of the hydraulics of the river under different flow regimes 3. Modeling of how flows and hydraulics will affect available fish habitat during low flows 4. Modeling of sediment movement during high-flow events and the resulting impact on the structure
and character of the channel 5. Modeling of water quality as it depends on flow patterns and other factors 6. Modeling of floodplain inundation and its impact on riparian vegetation
Ecological Response Model for Cache la Poudre River December 2014 City of Fort Collins 5
Despite the improved understanding of the Poudre River that is being derived from the EIS analyses, several important questions about relationships and tradeoffs in river management will likely remain, such as:
1. Is it better to restore high flows or low flows for native fishes and introduced species such as brown trout?
2. If conditions for brown trout are improved, how will that impact native fishes? 3. What impact does the legacy of channelization and stabilization have on the ecosystem condition,
and is this system-wide or reach-specific? 4. If the City of Fort Collins wants to manage against the growth of filamentous algae, would it be
more effective to increase low flows, reduce pollutant loads, or promote high scouring flows?
These types of questions are important for the City, but may fall largely outside the scope of EIS development and may not be easily answered with the sort of models and analyses generated for that purpose. Thus, City staff recognized the need for a model designed to support proactive investigations into the long-term drivers of and requirements for ecosystem health. The ERM offers progress on this range of questions, with the understanding that no single model will answer all questions conclusively.
Developing the ERM Team In September 2011, the City of Fort Collins Natural Areas Department convened a team of scientists to develop the ERM. The nine members of the team, recognized at the beginning of this report, represent top expertise in their respective sub-disciplines of river science. Collectively this group has more than 370 peer-reviewed publications, many of which have contributed to cross-disciplinary and applied river science. The level of experience and expertise across the team is important to note because developing the ERM was a novel and challenging undertaking. Team members have extensive knowledge of river science (from both practical experience and peer-reviewed published literature) and they applied empirical data for the Poudre River to create the current integrated modeling framework.
The team met regularly, including several day-long workshops, from September 2011 to June 2013 to conceptualize, design, test, and improve the model and to review outputs. It reviewed available data and models that could support development of the ERM and devised methods to fill in knowledge gaps. Members conducted independent research and analysis to develop each component, or node, of the ERM (described in Section II). After implementation of the individual components, the team discussed, reviewed and interpreted results of this holistic model of the Poudre River ecosystem.
The model as presented includes an evaluation of a range of flow scenarios over multiple key ecosystem elements. It provides results that support broad, integrated investigations into long-term ecosystem drivers. The ERM was developed using the best available input data, with the appreciation that any new data could be used to potentially improve model performance. For example, data from the current EIS processes and from the post-2013 flooding and High Park fire research could be incorporated into the model to update it.
Ecological Response Model for Cache la Poudre River December 2014 City of Fort Collins 6

STUDY AREA The geographic scope is a 13-mile stretch of the Poudre River (Figure I.2). This river reach sits at the base of the Front Range of the northern Colorado Rocky Mountains and runs through the City of Fort Collins from Overland Trail Road to Interstate 25. This largely urban stretch of the Poudre was segmented into eight reaches as determined by the location of major diversion structures. A more detailed description of the study area is provided in Section II.
Figure I.2: ERM study area within the Poudre watershed Like any large-scale, natural riverine ecosystem that has been altered by decades of engineering activities, the Poudre River ecosystem is highly complex. Because the underlying factors that drive the ecosystem processes and states that we observe consist of complicated and often unknown interactions between both natural processes and human activities, building a highly detailed model of the entire system is pragmatically impossible. For purposes of regional planning, any model of the Poudre River ecosystem with an appropriate scale and prediction accuracy requires that the ecosystem be simplified to key drivers and components. Ecosystem output variables can be averaged over space (river segments) and time (response periods of decades) to provide insight into the consequences of different management actions on the necessarily simplified version of the river ecosystem.
The ERM was first conceived as a conceptual framework and then refined into more distinct relationships in a Bayesian network. Nine hydrologic scenarios were compiled for analysis, using the best field and modeling data available.
Ecological Response Model for Cache la Poudre River December 2014 City of Fort Collins 7
ERM OVERVIEW The model considers the impacts of water use and development, changes in climate, and pollutant loading on the Poudre River ecosystem. The general structure of the model is depicted in Figure I.3. Water use and development, climate, degree of riverbank armoring (and hence potential for channel migration), and pollutant loading are characterized as drivers that act as inputs to force ecosystem responses. The model itself incorporates variables and relationships that describe how these factors affect physical and ecological processes such as sediment movement and riparian vegetation regeneration, which themselves are then represented by indicators of river condition.
The ERM is built and used to predict potential future states of the Poudre River. The primary input is a series of hydrologic scenarios that represent variations in operations, water use/demand, and climate. (Section I provides only a broad structural overview; additional detail on the model is provided in Section II.)
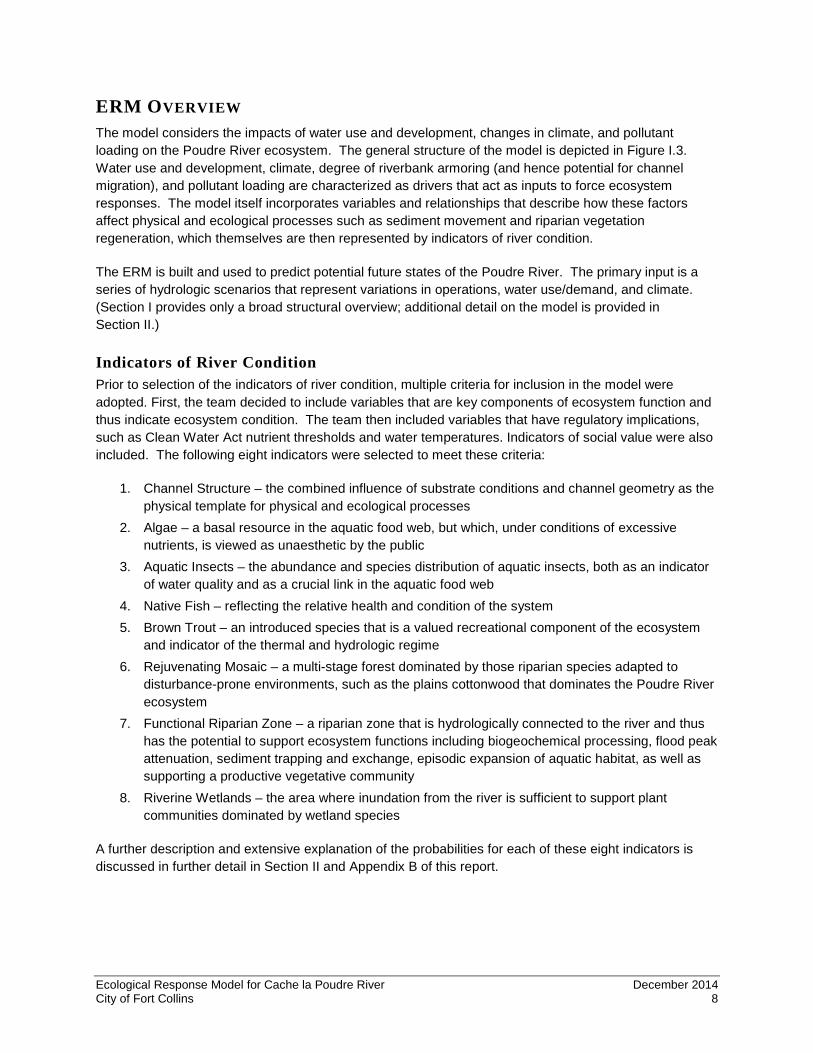
Indicators of River Condition Prior to selection of the indicators of river condition, multiple criteria for inclusion in the model were adopted. First, the team decided to include variables that are key components of ecosystem function and thus indicate ecosystem condition. The team then included variables that have regulatory implications, such as Clean Water Act nutrient thresholds and water temperatures. Indicators of social value were also included. The following eight indicators were selected to meet these criteria:
1. Channel Structure – the combined influence of substrate conditions and channel geometry as the physical template for physical and ecological processes
2. Algae – a basal resource in the aquatic food web, but which, under conditions of excessive nutrients, is viewed as unaesthetic by the public
3. Aquatic Insects – the abundance and species distribution of aquatic insects, both as an indicator of water quality and as a crucial link in the aquatic food web
4. Native Fish – reflecting the relative health and condition of the system 5. Brown Trout – an introduced species that is a valued recreational component of the ecosystem
and indicator of the thermal and hydrologic regime 6. Rejuvenating Mosaic – a multi-stage forest dominated by those riparian species adapted to
disturbance-prone environments, such as the plains cottonwood that dominates the Poudre River ecosystem
7. Functional Riparian Zone – a riparian zone that is hydrologically connected to the river and thus has the potential to support ecosystem functions including biogeochemical processing, flood peak attenuation, sediment trapping and exchange, episodic expansion of aquatic habitat, as well as supporting a productive vegetative community
8. Riverine Wetlands – the area where inundation from the river is sufficient to support plant communities dominated by wetland species
A further description and extensive explanation of the probabilities for each of these eight indicators is discussed in further detail in Section II and Appendix B of this report.
Ecological Response Model for Cache la Poudre River December 2014 City of Fort Collins 8

Figure I.3: The overall structure of the Poudre River ERM.
Final Bayesian Network Structure The ERM team mapped the linkages that determine the condition of these indicators (see Figure I.4) for the final Bayesian network structure. First, the key aspects of flow regime on the physical and ecological systems were identified and represented by a set of universally important flow metrics that would have differential influence depending on the specific nature of the imposed flow scenario. Next, non-hydrologic environmental drivers such as water temperature, nutrient loads and bank stabilization were included as important drivers that interact with flow regime metrics to influence aquatic and riparian ecological outputs.
Ecological Response Model for Cache la Poudre River December 2014 City of Fort Collins 9
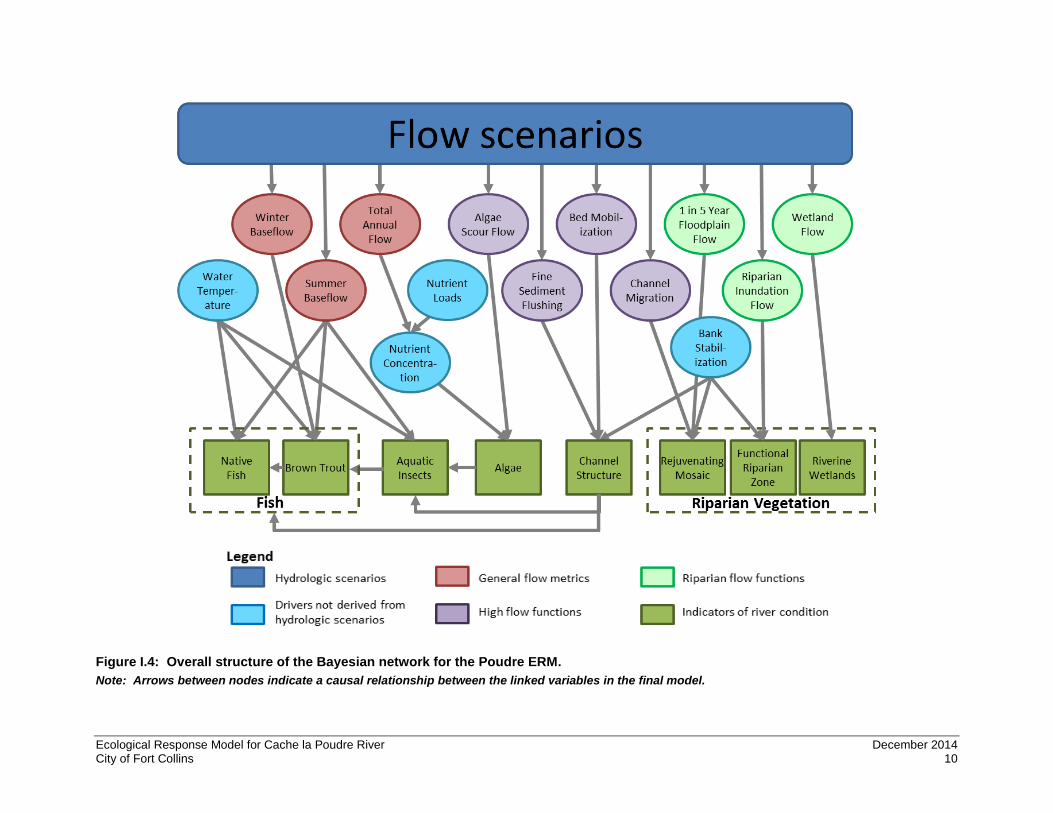
Figure I.4: Overall structure of the Bayesian network for the Poudre ERM. Note: Arrows between nodes indicate a causal relationship between the linked variables in the final model.
Ecological Response Model for Cache la Poudre River December 2014 City of Fort Collins 10
The final model structure was developed after several months of extensive debate and the evaluation of a wide array of potential influence diagrams. Given the breadth of expertise and experience of the modeling team, there is high confidence that a comprehensive set of elements and causal linkages are included in the model. The linkages explicitly included represent the most important and dominant processes, connections, and interactions that control ecosystem condition and functioning as judged by the team of experts. Although this is not a comprehensive representation of ecosystem structure and function, the model adopted has an appropriate balance of including those key drivers and response variables of interest on the one hand, and of the ability to confidently quantify the hydro-ecological relationships between the drivers and responses on the other hand. A more highly detailed model would suffer from lack of driver-response specification. As described further in Section II of this report, the selected nodes and linkages are based upon the best data and understanding currently available, yet the underlying sub-models vary substantially in terms of approach. Empirical data relied upon to construct the conditional probability tables are presented in Appendix C.
Hydrologic Scenarios Following establishment of the final influence diagram, the next step of model development was to develop input data. This consisted primarily of the development of nine hydrologic scenarios (Table I.1). Statistics derived from these hydrologic scenarios (such as the frequency of a high flow threshold or the duration of low flows) characterize their effects on the ecosystem. Nine hydrologic scenarios were developed for this project, allowing a better understanding of the past, current and future possible conditions. The nine scenarios are divided into two groups, based coarsely on the method upon which they were developed:
1. Core Hydrologic Scenarios – based upon the past, present, and plausible future flow conditions on the Poudre River and derived from gage and operations data for the system.
2. Test Hydrologic Scenarios – synthetically derived hydrographs designed to test what-if scenarios of base flow magnitude, base flow consistency, and peak flow magnitude, duration and frequency.
Ecological Response Model for Cache la Poudre River December 2014 City of Fort Collins 11

Table I.1: Hydrology scenarios for the Poudre ERM.
Name General description
Core hydrologic scenarios Reconstructed Native This scenario represents flows for the Poudre River with all human influences of the
past 150 years removed. Flow alterations from operations are accounted for, leaving just the native flow conditions.
Recent Past This scenario is derived from the historical gage data and includes historical climate variability and operationsa evolving over time.
Present Operations This scenario represents the river as though current operations are imposed on the period of record. It is different from the Recent Past scenario because operations have evolved and more water is being diverted today than in the 1950s.
Additional Water Development This scenario builds on present conditions and, additionally, includes preliminary estimates of potential flow alteration based on construction and operation of three proposed water development projects: 1) expansion of Halligan Reservoir, 2) expansion of Seaman Reservoir, and 3) construction of the Northern Integrated Supply Project. It also factors in an anticipated increase in municipal demand. It does not include all possible changes to flow based on new uses of existing water rights, nor does it consider possible mitigation flows associated with these projects. This scenario was modeled by City of Fort Collins staff and may differ from the final hydrology determined in the project EISs, which will likely have more refined low flows and daily disaggregation.
Driest Climate This scenario also builds on present conditions. It maintains the inclusion of present conditions, but then superimposes the driest conditions forecasted from a collection of climate models.
Test hydrologic scenarios StableBase-LowPeak This scenario is similar in condition to the Additional Water Development scenario
(reduced peak flows and minimum base flows), with the exception that the base flows remain consistent.
HighBase-ModeratePeak Based upon Bartholow (2010), this scenario uses the 25th percentile of monthly averages from native flows and recommendations for managed changes in streamflow in all months, including a moderate level peak flow magnitude.
DryBase-HighPeak This scenario is designed to test the question “Even if the peak flows are ample, what is the ecological effect of intermittent periods of no flow?” The percent of dry days were patterned on the Present Operations scenario and the high flows were based on the StableBase-HighPeak scenario below.
StableBase-HighPeak This scenario is designed to use the minimum amount of flow necessary to elevate most of the ERM indicators of river condition to their highest levels.
a Operations refers to all trans-basin basin diversions, diversion withdrawals, and reservoir storage
This concludes an overview of the background, scope and development of the Poudre River ERM. In Section II, considerably greater scientific detail is provided on the study methods and components.
Ecological Response Model for Cache la Poudre River December 2014 City of Fort Collins 12
SECTION II: METHODS AND MODEL COMPONENTS
OVERVIEW Section II first provides a deeper look into the methods for the overall model. A description of the study area and three selected focus sites is followed by some brief background and an explanation of the basic steps of the Bayesian network approach. Next, the development of nine hydrologic scenarios is described in greater detail. The strengths, limitations and elements not included in the ERM are then explained.
Following the methods for the overall model, the methods for each of the components is provided. Each model component, or indicator, is summarized in three parts.
1. The background of the component is discussed with regard to how it functions and connects with other elements in the system, as well as the controls and constraints on its ecological condition. Special attention was given to the local condition of the indicators for the study reach, which is influenced by both the transitory nature of the system as it moves from the mountains to the plains and the substantial alteration of the system to meet human demands.
2. Next, the data sources for each component (from a wide variety of sources and expert opinion) are summarized, falling across the spectrum from quantitative to qualitative.
3. Finally, an overview description of the methods of empirical analysis that justify the development of the probability tables for each component is provided. This included the merging of new analysis with both published thresholds and expert opinion to form probabilities for each variable.
The foundation of the integrative Bayesian model requires converting continuous empirical data into categorical probabilities, making this element of the project distinctive, challenging, and complex. The narrative and data in Section II is augmented with a more comprehensive description of the empirical basis for the development of probabilities in Appendix B.
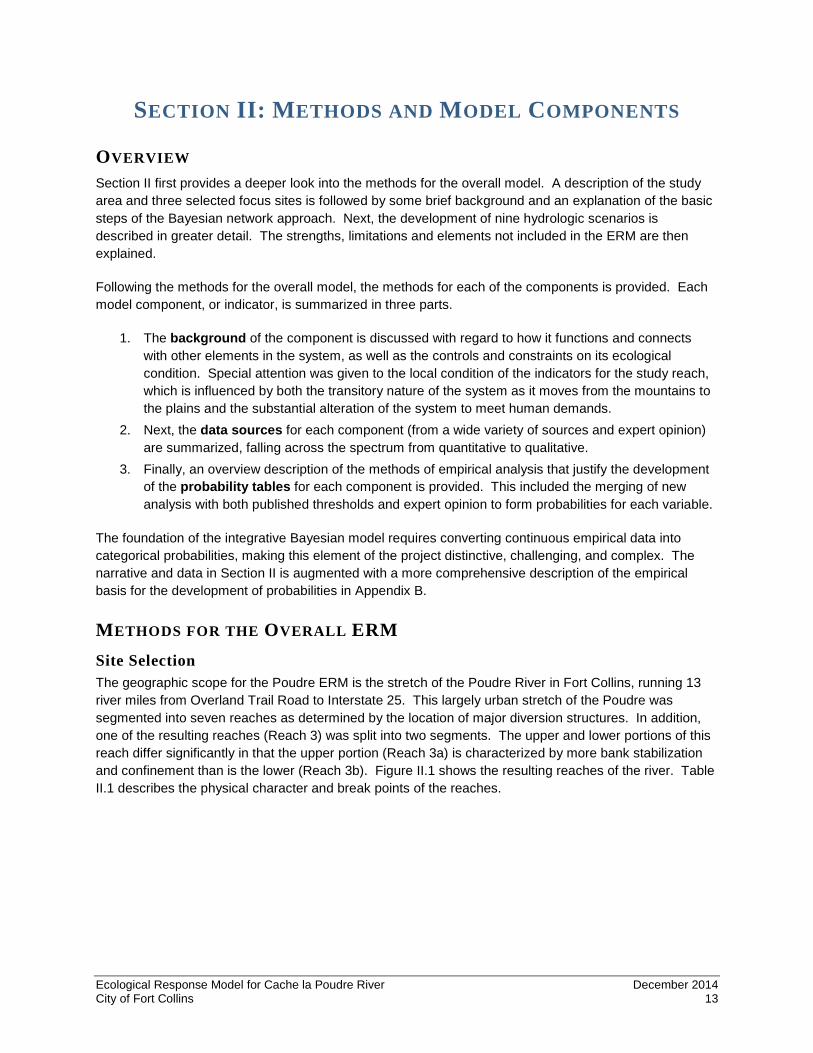
METHODS FOR THE OVERALL ERM Site Selection The geographic scope for the Poudre ERM is the stretch of the Poudre River in Fort Collins, running 13 river miles from Overland Trail Road to Interstate 25. This largely urban stretch of the Poudre was segmented into seven reaches as determined by the location of major diversion structures. In addition, one of the resulting reaches (Reach 3) was split into two segments. The upper and lower portions of this reach differ significantly in that the upper portion (Reach 3a) is characterized by more bank stabilization and confinement than is the lower (Reach 3b). Figure II.1 shows the resulting reaches of the river. Table II.1 describes the physical character and break points of the reaches.
Ecological Response Model for Cache la Poudre River December 2014 City of Fort Collins 13
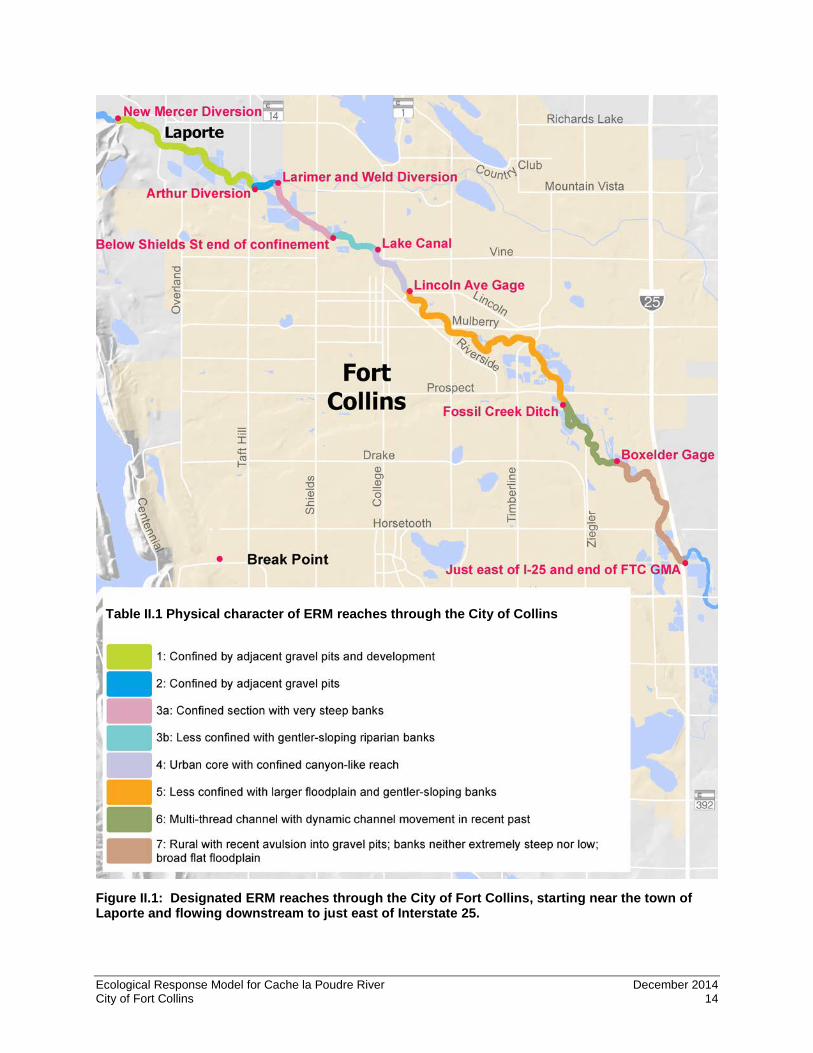
Figure II.1: Designated ERM reaches through the City of Fort Collins, starting near the town of Laporte and flowing downstream to just east of Interstate 25.
Table II.1 Physical character of ERM reaches through the City of Collins
Ecological Response Model for Cache la Poudre River December 2014 City of Fort Collins 14

Three of the eight reaches of the river corridor were selected to be modeled in the ERM, and represent the range of variability in channel form, floodplain connectivity, and boundary conditions (such as substrate composition and lateral armoring) that occur in the urban river corridor. Those reaches, from upstream to downstream, are as follows:
• Reach 3a: Begins at the Larimer & Weld Irrigation Canal, about 0.5 miles below Taft Hill Road, and ends at a point about 0.25 miles below Shields Street. Reach 3a is a highly confined stretch of river with a high degree of bank stabilization.
• Reach 3b: Starts at the downstream terminus of Reach 3a and continues to Lake Canal, just upstream of College Avenue. Reach 3b is less confined and represents an intermediate stretch of river where there might be opportunities to restore natural riverine and riparian functions.
• Reach 7: Begins at the U.S. Geological Survey (USGS) stream gage just above Boxelder Creek and ends just downstream of Interstate 25. Reach 7 has a mix of armored banks and open floodplain and is the least confined of the three reaches modeled in the ERM.
Not only does the character of the Poudre River vary among its reaches, its discharge varies as well. While most natural rivers in this region increase in flow in the downstream direction, the Poudre’s flow generally decreases downstream through Fort Collins due to extractions for municipal and agricultural uses. This is evident by a decreasing trend in both the median and mean values in Table II.2. Additionally, flow variability appears to increase (as evidenced by the increasing coefficient of variation) in the downstream direction, particularly in the reaches covered by this report (Reaches 3a, 3b, and 7).
Table II.2: Flow statistics for reaches of the Poudre River moving in an upstream to downstream direction.*
Canyon Gage
Below Greeley
Diversion
Below Hansen Canal
Below Pleasant
Valley Pipeline
Below Jackson
Ditch
Below New
Mercer Diversion
Below Arthur Ditch
Below Larimer & Weld
Diversion
Below Lake Canal
Lincoln Gage
Boxelder Ditch
Boxelder Gage
ERM reaches
1 2 3a+3b 4 5 6 7
Median (cfs)
67 50 70 64 58 45 49 31 29 30 36 13
Mean (cfs)
324 308 403 386 296 257 259 164 153 154 158 133
Standard deviation (cfs)
581 582 628 613 528 495 494 430 423 425 420 408
Coefficient of variation (cfs)
1.8 1.9 1.6 1.6 1.8 1.9 1.9 2.6 2.8 2.8 2.7 3.1
Number of zero flow days
0 449 0 164 29 884 5 1848 70 27 66 0
Percent zero flow days
0.0% 3.0% 0.0% 1.1% 0.2% 5.9% 0.0% 12.3% 0.5% 0.2% 0.4% 0.0%
* Based upon a Recent Past scenario, which is a daily point flow model using 40 years of historic gage data and operations records as developed by the Northern Colorado Water Conservancy District (NCWCD).
Ecological Response Model for Cache la Poudre River December 2014 City of Fort Collins 15

Bayesian Network
Background Bayesian, or probabilistic, networks are a graphical representation of the relationships among a series of independent variables (see Borsuk et al., 2004, and Uusitalo, 2007, for more general information). Bayesian networks are becoming a more commonly used tool in the environmental sciences because the modeled systems are complex, interactive, and non-linear, and they require an integrated framework that can incorporate a range of data and model types. As an example, Bayesian networks have been used by the USACE to examine risk levels of dredging operations (Schultz et al., 2011) by combining a range of highly quantitative and qualitative information. Additionally, Bayesian modeling has been used for a wide variety of riverine topics including modeling estuary eutrophication (Borsuk et al., 2004), fish population dynamics (Marcotet al., 2001), and watershed restoration (Stewart-Koster et al., 2010). For a comprehensive list of Bayesian network application in watershed studies, see Schultz et al. (2011).
The Bayesian network developed for this study included a series of seven general steps, described below, similar to other ecological models using a Bayesian approach. These steps are illustrated in detail for the ERM in the remainder of this report.
1. Define conceptual model – Translate a conceptual model of the system into a top-to-bottom influence diagram with variables as nodes and with arrows between nodes indicating influence of one variable on another (Figure II.2). The top are input data and the bottom indicate results.
2. Define states of each variable – Explicitly define the states (or classes) for each variable in the model.
3. Use data to populate input variables – All input variables (those nodes having arrows from them but not to them) must be populated from available data or simulated data (for example, the hydrologic time series described immediately following this subsection and all additional variables described in Section II).
4. Compute conditional probabilities – Use the best available data and scientific knowledge to compute conditional probabilities that define the interactions among the causal variables and the response variables.
5. Run model – Run the model using a range of input data to compute the expected values of the response variables.
6. Synthesize and interpret data – The model computes the probability that the response variables will fall into each of their pre-defined states. Additionally, a single expected value (the mean of the full probability distribution scaled from 0-1) is computed to enable a summation of a wide range of outputs into a single figure (Section III).
7. Refine model – As better data become available adjust conditional probabilities for each variable so that the results most closely fit actual data.
Building the Bayesian ERM After the team determined the eight ecological indicators, they worked to map the linkages that determine the condition of these indicators (see Figure II.2, reproduced below from Section I, for the final Bayesian network structure). First, the influence of general flow metrics, high-flow functions, and riparian functions from each flow scenario were derived. Next, the influence of water temperature and nutrient loads were included in addition to the hydrologic scenarios. Finally, the effects of bank stabilization on lateral channel mobility were included.
Ecological Response Model for Cache la Poudre River December 2014 City of Fort Collins 16
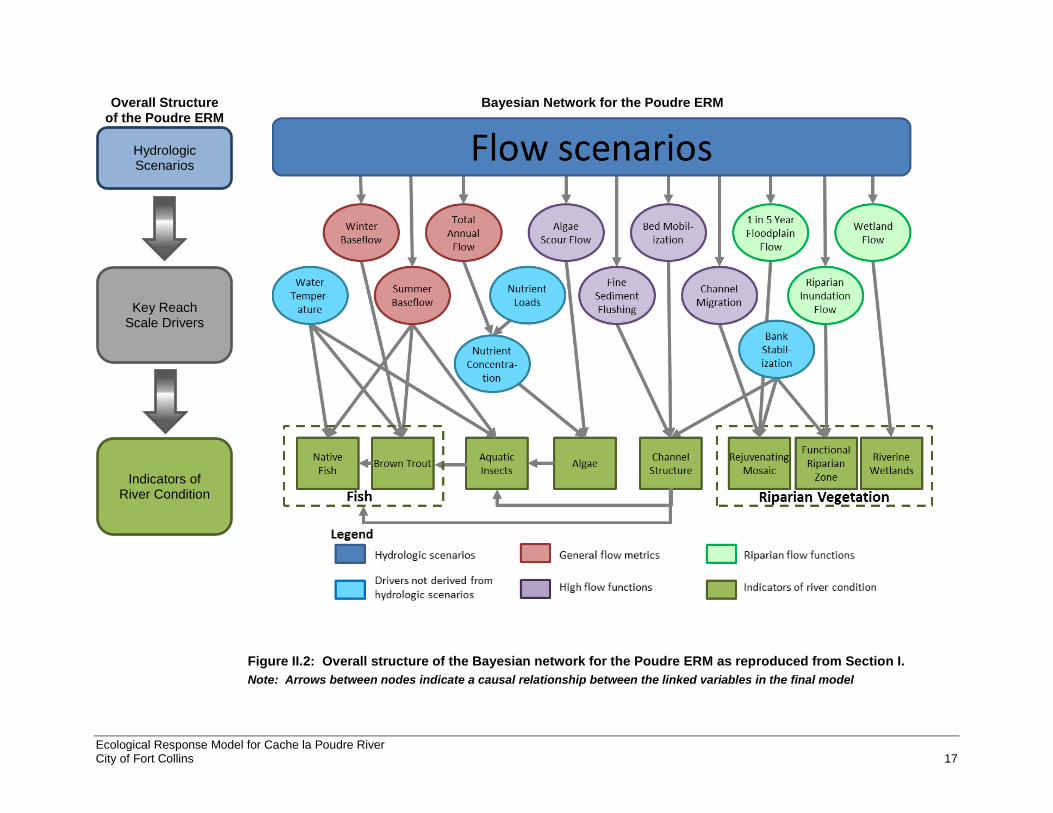
Overall Structure of the Poudre ERM
Bayesian Network for the Poudre ERM
Figure II.2: Overall structure of the Bayesian network for the Poudre ERM as reproduced from Section I. Note: Arrows between nodes indicate a causal relationship between the linked variables in the final model
Key Reach Scale Drivers
Indicators of River Condition
Hydrologic Scenarios
Ecological Response Model for Cache la Poudre River City of Fort Collins 17

A refined model structure was developed over a period of several months through extensive debate and the evaluation of a wide array of potential influence diagrams. Given the breadth of expertise and experience of the modeling team, there is high confidence that a comprehensive set of elements and causal linkages were included in the model. The linkages explicitly included in the model represent the most important and dominant processes, connections, and interactions that control ecosystem condition and functioning, as judged by the ERM’s team of experts. As described later in this report, the selected nodes and linkages are based upon the best data and understanding currently available, yet the underlying sub-models vary substantially in terms of approach. Empirical data relied upon to construct the conditional probability tables are presented in Appendix B.
The ERM model runs the software SMILE (Structural Modeling, Inference, and Learning Engine) running within the GeNIe (Graphical Network Interface). Both are found at http://genie.sis.pitt.edu/ (Decision Systems Laboratory (2014). The model computes resulting conditional probabilities of input data through each step of the model, using the general form:
Where A and B are possible outcomes and P(Ai|B) is interpreted the conditional probability of Ai given B.
Hydrologic Scenarios The second step of development for the ERM, developing input data, consisted primarily of analyzing probable hydrologic scenarios. Statistics derived from these hydrologic scenarios (such as frequency of a high flow threshold, or the duration of low flows) characterize the effects of scenarios on the ecosystem. Nine hydrologic scenarios were developed for this project to allow a better understanding of past, current and plausible-future conditions. These nine scenarios can be divided into two groups, based coarsely on the method upon which they were developed:
1. Core hydrologic scenarios – based upon the past, present, and plausible future flow conditions on the Poudre River and derived from gage and operations data for the system
2. Test hydrologic scenarios – synthetically-derived hydrographs designed to test what-if scenarios of peak flow magnitude, base flow magnitude, and base flow consistency.
Core Hydrologic Scenario Development The core hydrologic scenarios originate from a series of models used by Fort Collins Utilities and other regional water users and managers (see Table II.3 for more details). These models simulate the native hydrology and all the operations of diversions and reservoirs within the Poudre River Basin. Together, these models produce time series of simulated flow at a daily or monthly time step. Additionally, a hydrologic metric summary for all the hydrologic scenarios can be found at the end of this subsection in Table II.5.
Ecological Response Model for Cache la Poudre River December 2014 City of Fort Collins 18

Table II.3: Core Hydrologic Scenarios for the Poudre ERM.
Name Period of record General description Source
Reconstructed Native
11/1/1949 to 10/31/2005
This scenario represents flows for the Poudre River with all human influences of the past 150 years removed. Flow alterations from operations are accounted for, leaving just the native flow conditions.
Monthlyb model that factors in water diversions, trans-basin augmentation (water added to the Poudre from other watersheds), return flows, and retimes the water held back in reservoirs to the historic hydrologic record. Developed in a MODSIM model by the City of Fort Collins.
Recent Past 11/1/1969 to 10/31/2010
This scenario is derived from the historical gage data and includes historical climate variability and operationsa evolving over time.
Historic daily point flow model based on historic gage data (Canyon Mouth, Lincoln Street, and Boxelder) and operation records of diversion structures as developed by the Northern Colorado Water Conservancy District (NCWCD) (Andy Pineda, 2012, pers. comm.)
Present Operations
11/1/1949 to 10/31/2005
This scenario represents the river as though current operations are imposed on the period of record. It is different from the Recent Past scenario because operations have evolved and more water is being diverted today than in the 1950s.
Monthlyb model that applies 2010 operations to the Reconstructed Native scenario. Developed in a MODSIM model by the City of Fort Collins as part of the HSWMP draft EIS process.
Additional Water Development
11/1/1949 to 10/31/2005
This scenario builds on present conditions and additionally includes preliminary estimates of potential flow alteration based on construction and operation of three proposed water development projects: 1) expansion of Halligan Reservoir, 2) expansion of Seaman Reservoir, and 3) construction of the Northern Integrated Supply Project. It additionally factors in an anticipated increase in municipal demand. It does not include all possible changes to flow based on new uses of existing water rights, nor does it consider possible mitigation flows associated with these projects.
Monthlyb model that applies projected 2050 operations to the Reconstructed Native scenario. Developed in a MODSIM model by the City of Fort Collins. Data and models used for this scenario were preliminary, and may differ from the final hydrology determined in the HSWMP and NISP EISs, which will likely have more refined low flows and daily disaggregation
Driest Climate 11/1/1949 to 10/31/2005
This scenario also builds on present conditions. It maintains the inclusion of present conditions, but then superimposes the driest conditions forecasted from a collection of climate models.
Present Operations scenario data as modified using the driest climate projection available using the Bias Corrected and Downscaled WCRP CMIP3 Climate and Hydrology Projectionsc
a Operations refers to all trans-basin basin diversions, diversion withdrawals, and reservoir storage. b Later disaggregated to daily using historic data from the USGS Poudre Canyon Mouth gage: http://www.dwr.state.co.us/SurfaceWater/data/detail_graph.aspx?ID=CLAFTCCO. c http://gdo-dcp.ucllnl.org/downscaled_cmip_projections/dcpInterface.html.
The current core hydrologic scenarios provide a reasonable starting point for model testing using hypothetical future conditions based on currently available data; however, the ERM team recognizes that upon public release of the Common Technical Platform (linking the hydrologic analysis of the Halligan and Seaman expansions with the NISP), all four modeled scenarios (Reconstructed Native, Recent Past,
Ecological Response Model for Cache la Poudre River December 2014 City of Fort Collins 19

Additional Water Development, and Driest Climate) will likely be updated. At that time the newly modified scenarios may be incorporated into the ERM model.
To incorporate the impacts of climate changes in the ERM, the Present Operations scenario was modified into a plausible Driest Climate scenario (see Bureau of Reclamation (BOR, 2011) for details). Climate change data from the BOR includes output from a number of global circulation models (GCMs) and emissions scenarios. Together, the different GCMs and emissions scenarios create 112 possible climate projections. The data for each climate projection were spatially downscaled (to the extents of the Poudre watershed) and used to create projections of unit runoff at a resolution of 1/8 degree latitude-longitude (12 km x 12 km). The model run selected for use as the Driest Climate scenario in the Poudre ERM was the overall driest GCM (Diansk and Volodin, 2002). As the spatial scale of the GCM models was so much greater than the spatial scale of the model that the Present Operations scenario was based upon, it was necessary to calculate a percent change between the driest climate GCM and the average runoff under all available GCMs for the Poudre River watershed. This ratio was then multiplied by the monthly average of the Present Operations scenario to arrive at the Driest Climate scenario.
Monthly to Daily Disaggregation All hydrologic scenarios based on the monthly time step MODSIM models were disaggregated to a daily time step using the patterning of the Recent Past daily data. This use of analog years helps reproduce hydrologic patterns from similar years (wet years, dry years, etc.). This was done to support the shorter time scale ecological functions captured by the ERM, as it is easier to predict ecosystem responses to changes in patterns of daily average flow than to changes in patterns of monthly average flow. The following disaggregation procedure was used:
1. Identify analog year – The annual average for each year in the monthly time-step scenarios was first matched to an analog water year in the Recent Past scenario.
2. Calculate daily-to-monthly ratios – For each month of the Recent Past scenario (42yr x 12mo = 492 total months) a daily-to-monthly ratio (each day’s flow divided by the average flow for that month) was calculated, such that each month of the record has a unique set of daily ratios.
3. Disaggregate monthly data – The daily record from the analog water year was then used to pattern the daily flows for the other scenarios. Computationally the daily-to-monthly ratios from the selected analog year were multiplied by the monthly averaged model data to produce a daily record with the same monthly and annual averages as the original model data.
This disaggregation approach does not provide a precise calculation of daily flows under a given scenario, but it does provide a reasonable distribution and seasonal pattern of daily flow while preserving the average flow in each month of a given time series. As all flow scenarios are inherently based upon the Recent Past scenario, the pattern of inter-annual variability is the same for all scenarios.
Test Hydrologic Scenarios In addition to the base set of five core hydrologic scenarios, the team wanted to be able to use the ERM to test some additional what-if scenarios. These test scenarios are related to the influence of future water use and management decisions aimed at improving specific parameters of the flow regime. The test hydrologic scenarios vary across the following characteristics.
• Base flow magnitude – Base flows provide habitat for fish and aquatic insects during the majority of the year and are related to aquatic habitat volume and quality as well as water temperature and nutrient levels.
Ecological Response Model for Cache la Poudre River December 2014 City of Fort Collins 20
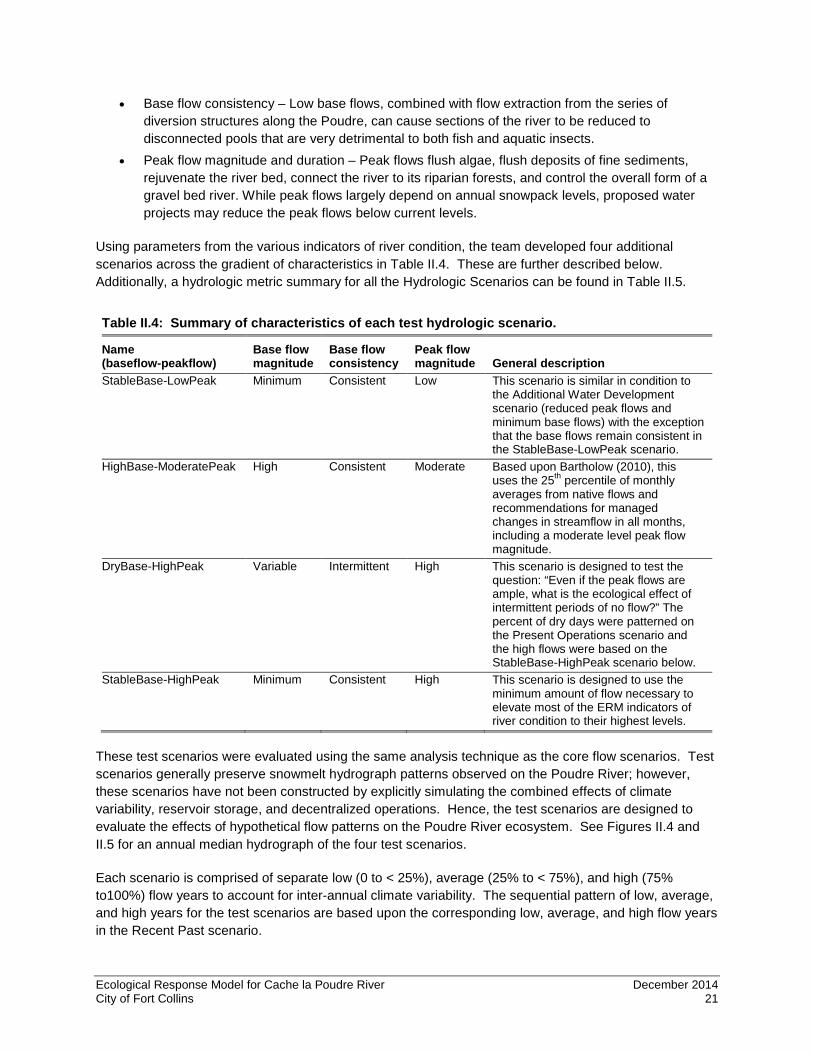
• Base flow consistency – Low base flows, combined with flow extraction from the series of diversion structures along the Poudre, can cause sections of the river to be reduced to disconnected pools that are very detrimental to both fish and aquatic insects.
• Peak flow magnitude and duration – Peak flows flush algae, flush deposits of fine sediments, rejuvenate the river bed, connect the river to its riparian forests, and control the overall form of a gravel bed river. While peak flows largely depend on annual snowpack levels, proposed water projects may reduce the peak flows below current levels.
Using parameters from the various indicators of river condition, the team developed four additional scenarios across the gradient of characteristics in Table II.4. These are further described below. Additionally, a hydrologic metric summary for all the Hydrologic Scenarios can be found in Table II.5.
Table II.4: Summary of characteristics of each test hydrologic scenario.
Name (baseflow-peakflow)
Base flow magnitude
Base flow consistency
Peak flow magnitude General description
StableBase-LowPeak Minimum Consistent Low This scenario is similar in condition to the Additional Water Development scenario (reduced peak flows and minimum base flows) with the exception that the base flows remain consistent in the StableBase-LowPeak scenario.
HighBase-ModeratePeak High Consistent Moderate Based upon Bartholow (2010), this uses the 25th percentile of monthly averages from native flows and recommendations for managed changes in streamflow in all months, including a moderate level peak flow magnitude.
DryBase-HighPeak Variable Intermittent High This scenario is designed to test the question: “Even if the peak flows are ample, what is the ecological effect of intermittent periods of no flow?” The percent of dry days were patterned on the Present Operations scenario and the high flows were based on the StableBase-HighPeak scenario below.
StableBase-HighPeak Minimum Consistent High This scenario is designed to use the minimum amount of flow necessary to elevate most of the ERM indicators of river condition to their highest levels.
These test scenarios were evaluated using the same analysis technique as the core flow scenarios. Test scenarios generally preserve snowmelt hydrograph patterns observed on the Poudre River; however, these scenarios have not been constructed by explicitly simulating the combined effects of climate variability, reservoir storage, and decentralized operations. Hence, the test scenarios are designed to evaluate the effects of hypothetical flow patterns on the Poudre River ecosystem. See Figures II.4 and II.5 for an annual median hydrograph of the four test scenarios.
Each scenario is comprised of separate low (0 to < 25%), average (25% to < 75%), and high (75% to100%) flow years to account for inter-annual climate variability. The sequential pattern of low, average, and high years for the test scenarios are based upon the corresponding low, average, and high flow years in the Recent Past scenario.
Ecological Response Model for Cache la Poudre River December 2014 City of Fort Collins 21

Figure II.3: Hydrographs of Water Years 1994 and 1995 across the five core hydrologic scenarios.
Figure II.4: Comparison of median (25% to < 75%) annual hydrographs of the four test hydrologic Scenarios. Note: Right side of figure is zoomed into the baseflow portion (0–500 cfs). Ecological Response Model for Cache la Poudre River December 2014 City of Fort Collins 22

Table II.5: Hydrologic metric summary for core and test scenarios for the location below the Larimer & Weld Canal. Core hydrologic scenarios Test hydrologic scenarios
Hydrologic Metric
Reconstructed Native
Recent Past
Present Operations
Additional Water
Development Driest
Climate StableBase-
LowPeak HighBase-
ModeratePeak DryBase-HighPeak
StableBase-HighPeak
Period of record (WY)
1950–2005 1970–2010 1950–2005 1950–2005 1950–2005 1950–2005 1950–2005 1950–2005 1950–2005
Average daily flow (cfs)
383 164 99 48 27 65 182 133 147
Average summer (July–September) base flow (cfs)
347 126 81 52 13 59 188 67 61
Average winter base flow (cfs)
70 24 12 5 4 24 55 21 35
Average peak daily flow (cfs)
3,287 1,947 1,094 524 472 1,000 1,900 2,555 2,535
Wetland flow (cfs)a
2,645 1,638 1,007 424 246 700 1,000 2,250 2,250
Functioning riparian zone flow (cfs)b
4,172 3,832 2,190 1,488 793 1,080 1,750 3,350 3,350
5-year return period flow
4,210 2,795 1,582 521 575 1,200 2,050 3,350 3,350
Percent zero flow days
0.0% 12.3% 30.7% 40.0% 30.7% 0.0% 0.0% 30.4% 0.0%
Annual volumetric discharge (acre-ft)
277,634 118,685 71,996 35,533 19,309 46,897 131,812 96,538 106,339
a Flow occurring two weeks of the growing season, May–September, every other year (later described in more detail in the Riparian Vegetation section). b Flow occurring one day per year (later described in more detail in the Riparian Vegetation section).
Ecological Response Model for Cache la Poudre River December 2014 City of Fort Collins 23
Strengths and Limitations of the Bayesian Approach A challenge confronting the assembly of any model that represents a complex system (such as the Poudre River ecosystem) is deciding which system elements to include and how to represent their relationships in time and space. The saying goes that all models are wrong, but some are useful (Box, 1976). The ERM was constructed as a Bayesian network model that could serve the useful purpose of accurately representing ecosystem complexity, but in an intentionally simplified manner that nonetheless allows major system components to be incorporated and their interactions modeled. Of course, no model is perfect and no modeling effort is able to comprehensively capture every ecological interaction of a complex system with feedback loops, additive impacts over time and unknown future changes to the system. Both the strengths and weaknesses of the ERM lie in its Bayesian approach and efforts to develop an integrated model.
For purposes of this project, the Bayesian network approach has several advantages (Uusitalo, 2007):
1. It uses an established methodology to integrate across various ecosystem functions that are typically modeled as independent with little interaction. A Bayesian network is intended to capture most or all of the dominant functions in a system, which allows for a systematic, integrated evaluation of cause, effect and response among different elements of the ecosystem.
2. A Bayesian network can incorporate different and distinct sources of data, ranging from quantitative output from other models and databases to qualitative, expert judgment.
3. A Bayesian network is explicit about uncertainty, because causal relationships between variables are described probabilistically and the outcomes are described in terms of their combined probabilities.
4. Finally, this kind of model is very flexible; it can be used to test various kinds of scenarios and the sensitivity of outcomes to individual factors in those scenarios. For example, the model will allow the testing of how various restoration projects might function under different flow conditions.
This approach also has some limitations. The limits on the complexity of the Bayesian network arise from the degree to which causal relationships can be expressed between all the causal and response nodes in the network and the amount of information needed to populate the probability and conditional probability tables. As noted above, the model is built with a mixture of data and data-informed expert judgment. Expert judgment, which is based on research experience and broad knowledge of ecological and hydro-geomorphic principles published in peer-reviewed literature, was used to create parts of the model for which scant site-specific empirical data exist. Use of expert judgment in modeling and decision analysis is a well-established practice, but not without pitfalls (von Winterfeldt and Edwards, 1986; Otway and von Winterfeldt, 1992). One way to account for uncertainty associated with expert judgment is to be more conservative with the assignment of conditional probabilities based upon expert judgment informed by empirical data, and that principle was followed in this study. As new data become available, this expert judgment can be refined and/or replaced to continually improve the ERM as a tool.
The subsections that follow provide in-depth information on the eight biological indicators used as model components in the ERM.
Ecological Response Model for Cache la Poudre River December 2014 City of Fort Collins 24
CHANNEL STRUCTURE This focus of the ERM was led by and is reported on by the following experts:
• Daniel Baker, Ph.D., Hydrologist, Research Scientist, Department of Civil and Environmental Engineering, Colorado State University
• Brian Bledsoe, Ph.D., Hydrologist, Department of Civil and Environmental Engineering and Graduate Degree Program in Ecology, Colorado State University
Background Moderate to high flows in the Poudre River support many amenities including water quality, fisheries and their food base, riparian habitats, recreational opportunities, and aesthetic benefits. High flows can prevent excessive accumulation of fine sediments and algae, and maintain habitats, channels, riparian corridors, and groundwater connections that moderate stream temperatures (Whiting, 2002). Excessive deposition of fine sediment can impair aquatic life in a variety of ways. For example, trout and aquatic insects (invertebrates), such as mayflies and stoneflies, depend on clean interstitial spaces between gravels and cobbles in the river bed to carry out their life cycles (Waters, 1995). These effects can also propagate out of the channel to the riparian ecosystem as birds and other animals depend on aquatic insects as a food source.
Reductions of moderate to high flows over the 20th century have altered the capacity of the Poudre River to maintain physical habitat for fishes and aquatic invertebrates by reducing the number of days that flows exceed the thresholds necessary to flush fine sediment and clean the river bed. The period of years between flushing events is now longer than what river biota are adapted to in terms of habitat availability and reproduction. In addition to being critical components of the river ecosystem, fishes and aquatic invertebrates are standard indicators used for water-quality assessment performed under the auspices of the Clean Water Act, because they integrate many physical and chemical factors. Furthermore, the Colorado Water Quality Commission has promulgated a narrative water quality standard for protecting aquatic life uses against excessive deposition (5 CR 1002-31, Section 31.11). Thus, the maintenance of flows that periodically cleanse the river bed is directly linked to the attainment of aquatic life uses.
The Poudre has been affected by a combination of flow alterations and directly imposed channel changes such as straightening, levee building, aggregate mining, and extensive bank stabilization with riprap (large angular stones) placed to protect river banks from scour. Because the quality and quantity of habitat is determined by the interaction between streamflow and the structure of the river channel, the effects of flow changes on the ecosystem must be considered in the context of the current channel structure and its variability along the river. Because of these changes to the structure of the river channel a return to pre-settlement levels of streamflow would not yield pre-settlement habitat, given the relatively simplified and static form of the present-day river channel in some segments of the urban corridor. Therefore, the ERM had to be designed to account for the unique characteristics of each river segment in terms of its flows, channel forms, and boundary materials (i.e., sizes of rocks on the bed and extent of riprap along the banks).
Hydraulic and geomorphic analyses are important for understanding the linkages between flow patterns, instream habitat quality, and river biota. Such analyses inform river stewardship by providing physically-based, quantitative targets for the flows that maintain habitat quality. To quantify the effects of moderate to high flows on Native Fish, Brown Trout, Aquatic Insects, and three riparian vegetation indicators in the ERM, a shear stress analysis and an effective discharge analyses were performed at representative locations in each of the three reaches modeled in the ERM along the Fort Collins river corridor. Hydraulic modeling was performed to identify the discharges at which critical thresholds of shear stress, associated
Ecological Response Model for Cache la Poudre River December 2014 City of Fort Collins 25
with river bed flushing and rejuvenation, are met based on the unique flow characteristics, channel geometry, and substrate composition at each site.
Frequency and Duration of Flushing Flows Implementation of flushing flows necessitates specification of a target frequency and duration. Two interrelated lines of evidence were considered with respect to frequency: return periods of high flows to which regional river biota are adapted, and the reproductive cycles of trout and aquatic insects. Previous studies of numerous Colorado snowmelt rivers with gravel beds (Andrews, 1984), as well as similar systems in the western U.S. (Emmett and Wolman, 2001), indicate that events that transport appreciable amounts of coarse bed material tend to occur with a return period of less than two years in the annual maximum series. Regional river biota have adapted over long time scales to this inter-annual pattern of high flow. Numerous studies also indicate that the non-native trout species that dominate the Poudre River (upstream from College Avenue) and its tributaries depend on high flows that provide suitable habitat conditions as in their native range (Waters, 1995). Recent research conducted in comparable river segments downstream of the ERM study area has clearly documented habitat degradation and degradation of aquatic insect communities in the absence of flushing flows (Nehring et al., 2011).
Given that trout are a highly valued amenity and primary indicator of aquatic ecological health in the Poudre River, maintenance of their food base is an important consideration. Trout depend on aquatic insects at all life stages from rearing to death, and production of aquatic insects depends on the quantity and quality of habitat available in the river substrate. Most of the aquatic insects that support the trout fishery in the Poudre River reproduce one or more times per year (Ward and Kondratieff, 1992). Current scientific understanding of the ecology of these systems therefore indicates that providing an annual high flow pulse capable of at least flushing surface deposits of fine sediment is a logical precautionary measure.
Widespread mobilization of the coarse fractions of the river bed is a somewhat less-frequent occurrence (approximately two out of three years to three out of four years) in low-gradient segments of undepleted Rocky Mountain streams and rivers (Emmett and Wolman, 2001). Coarse substrate mobilization may occur much less frequently in high gradient channels (> 2%), (Grant et al.,1990 and Wohl, 2010). From a biological standpoint, trout reproduction varies considerably from year to year and population maintenance does not require high levels of recruitment every year. However, brown trout populations in the Poudre River do depend on recruitment events approximately every three years. Although substrate quality is a critical limiting factor in trout reproduction, other factors, such as late summer temperatures, can limit recruitment even when other habitat characteristics are adequate. It follows that a high flow that at least partially cleans interstices in the river bed every two years on average will increase the likelihood that the multiple factors supporting reproduction of both brown trout and aquatic insects are synchronized and maintained over decadal and longer time scales. In practice, an effective flushing event on a strict interval of every other year is not likely to be feasible under the current management infrastructure, given inter-annual variability and the inevitability of multi-year dry spells. Accordingly, an average return period of two years is a reasonable target over time.
Data Sources Existing data on cross-sectional geometry available from previous studies (USACE, 2008; Brad Anderson, 2011, pers. comm.) were used to perform shear stress and effective discharge analyses at three locations on the Poudre River mainstem. As described earlier, these locations were selected to represent three relatively distinct geomorphic contexts:
Ecological Response Model for Cache la Poudre River December 2014 City of Fort Collins 26
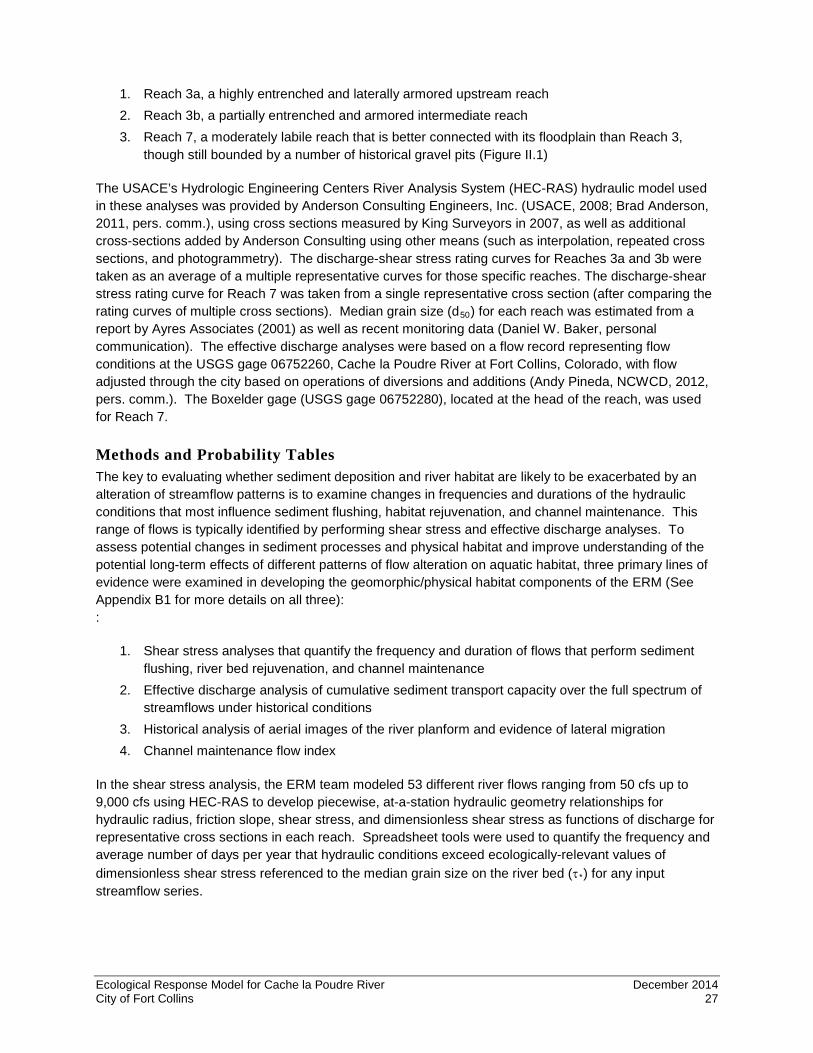
1. Reach 3a, a highly entrenched and laterally armored upstream reach 2. Reach 3b, a partially entrenched and armored intermediate reach 3. Reach 7, a moderately labile reach that is better connected with its floodplain than Reach 3,
though still bounded by a number of historical gravel pits (Figure II.1)
The USACE’s Hydrologic Engineering Centers River Analysis System (HEC-RAS) hydraulic model used in these analyses was provided by Anderson Consulting Engineers, Inc. (USACE, 2008; Brad Anderson, 2011, pers. comm.), using cross sections measured by King Surveyors in 2007, as well as additional cross-sections added by Anderson Consulting using other means (such as interpolation, repeated cross sections, and photogrammetry). The discharge-shear stress rating curves for Reaches 3a and 3b were taken as an average of a multiple representative curves for those specific reaches. The discharge-shear stress rating curve for Reach 7 was taken from a single representative cross section (after comparing the rating curves of multiple cross sections). Median grain size (d50) for each reach was estimated from a report by Ayres Associates (2001) as well as recent monitoring data (Daniel W. Baker, personal communication). The effective discharge analyses were based on a flow record representing flow conditions at the USGS gage 06752260, Cache la Poudre River at Fort Collins, Colorado, with flow adjusted through the city based on operations of diversions and additions (Andy Pineda, NCWCD, 2012, pers. comm.). The Boxelder gage (USGS gage 06752280), located at the head of the reach, was used for Reach 7.
Methods and Probability Tables The key to evaluating whether sediment deposition and river habitat are likely to be exacerbated by an alteration of streamflow patterns is to examine changes in frequencies and durations of the hydraulic conditions that most influence sediment flushing, habitat rejuvenation, and channel maintenance. This range of flows is typically identified by performing shear stress and effective discharge analyses. To assess potential changes in sediment processes and physical habitat and improve understanding of the potential long-term effects of different patterns of flow alteration on aquatic habitat, three primary lines of evidence were examined in developing the geomorphic/physical habitat components of the ERM (See Appendix B1 for more details on all three): :
1. Shear stress analyses that quantify the frequency and duration of flows that perform sediment flushing, river bed rejuvenation, and channel maintenance
2. Effective discharge analysis of cumulative sediment transport capacity over the full spectrum of streamflows under historical conditions
3. Historical analysis of aerial images of the river planform and evidence of lateral migration 4. Channel maintenance flow index
In the shear stress analysis, the ERM team modeled 53 different river flows ranging from 50 cfs up to 9,000 cfs using HEC-RAS to develop piecewise, at-a-station hydraulic geometry relationships for hydraulic radius, friction slope, shear stress, and dimensionless shear stress as functions of discharge for representative cross sections in each reach. Spreadsheet tools were used to quantify the frequency and average number of days per year that hydraulic conditions exceed ecologically-relevant values of dimensionless shear stress referenced to the median grain size on the river bed (τ*) for any input streamflow series.
Ecological Response Model for Cache la Poudre River December 2014 City of Fort Collins 27
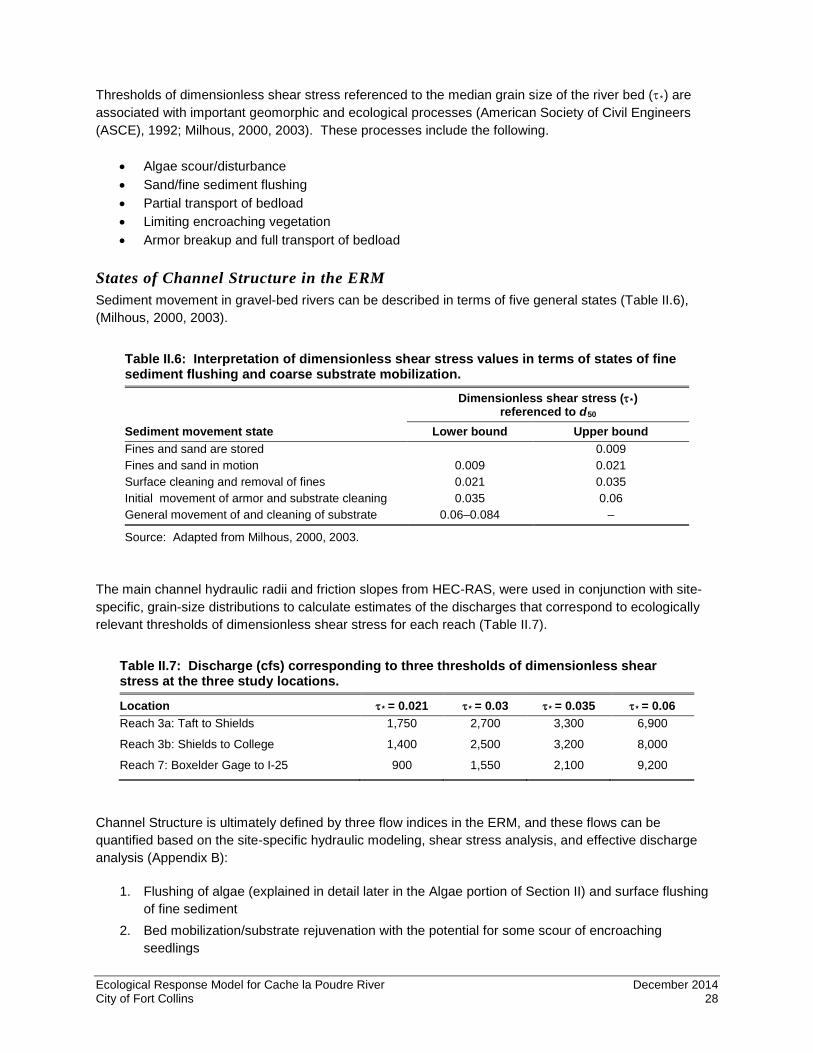
Thresholds of dimensionless shear stress referenced to the median grain size of the river bed (τ*) are associated with important geomorphic and ecological processes (American Society of Civil Engineers (ASCE), 1992; Milhous, 2000, 2003). These processes include the following.
• Algae scour/disturbance • Sand/fine sediment flushing • Partial transport of bedload • Limiting encroaching vegetation • Armor breakup and full transport of bedload
States of Channel Structure in the ERM Sediment movement in gravel-bed rivers can be described in terms of five general states (Table II.6), (Milhous, 2000, 2003).
Table II.6: Interpretation of dimensionless shear stress values in terms of states of fine sediment flushing and coarse substrate mobilization.
Sediment movement state
Dimensionless shear stress (τ*) referenced to d50
Lower bound Upper bound Fines and sand are stored 0.009 Fines and sand in motion 0.009 0.021 Surface cleaning and removal of fines 0.021 0.035 Initial movement of armor and substrate cleaning 0.035 0.06 General movement of and cleaning of substrate 0.06–0.084 –
Source: Adapted from Milhous, 2000, 2003.
The main channel hydraulic radii and friction slopes from HEC-RAS, were used in conjunction with site-specific, grain-size distributions to calculate estimates of the discharges that correspond to ecologically relevant thresholds of dimensionless shear stress for each reach (Table II.7).
Table II.7: Discharge (cfs) corresponding to three thresholds of dimensionless shear stress at the three study locations.
Location τ* = 0.021 τ* = 0.03 τ* = 0.035 τ* = 0.06 Reach 3a: Taft to Shields 1,750 2,700 3,300 6,900
Reach 3b: Shields to College 1,400 2,500 3,200 8,000
Reach 7: Boxelder Gage to I-25 900 1,550 2,100 9,200
Channel Structure is ultimately defined by three flow indices in the ERM, and these flows can be quantified based on the site-specific hydraulic modeling, shear stress analysis, and effective discharge analysis (Appendix B):
1. Flushing of algae (explained in detail later in the Algae portion of Section II) and surface flushing of fine sediment
2. Bed mobilization/substrate rejuvenation with the potential for some scour of encroaching seedlings
Ecological Response Model for Cache la Poudre River December 2014 City of Fort Collins 28

3. Channel migration habitat diversity flow with effectiveness that depends on categorical states of bank stabilization along a particular reach (as described in the Riparian Vegetation portion of Section II)
The surface flushing of fine sediment and bed mobilization were addressed using a channel maintenance flow approach that incorporates flow magnitude, duration, and frequency. This approach has been formulated in the context of this project; however, the intent of the methodology outlined here is to be readily adaptable to other rivers as well. First, a flow magnitude and duration metric, called the channel maintenance flow index (CMFI), was developed in the form of:
𝐶𝐶𝐶𝐶𝐶𝐶𝐶𝐶 = � �𝜏𝜏∗𝑖𝑖𝜏𝜏∗𝑅𝑅
�1.5
(𝐷𝐷𝐷𝐷𝑐𝑐
)𝑖𝑖=1,𝑛𝑛
Wherein:
𝜏𝜏∗ = 𝐷𝐷𝐷𝐷𝐷𝐷𝐷𝐷𝐷𝐷𝐷𝐷𝐷𝐷𝐷𝐷𝐷𝐷𝐷𝐷𝐷𝐷𝐷𝐷𝐷𝐷 𝐷𝐷ℎ𝐷𝐷𝑒𝑒𝑒𝑒 𝐷𝐷𝑠𝑠𝑒𝑒𝐷𝐷𝐷𝐷𝐷𝐷 𝜏𝜏∗𝑅𝑅 = 𝑅𝑅𝐷𝐷𝑅𝑅𝐷𝐷𝑒𝑒𝐷𝐷𝐷𝐷𝑅𝑅𝐷𝐷 𝐷𝐷ℎ𝐷𝐷𝑒𝑒𝑒𝑒 𝐷𝐷𝑠𝑠𝑒𝑒𝐷𝐷𝐷𝐷𝐷𝐷 𝑅𝑅𝑒𝑒𝑐𝑐𝑒𝑒𝑐𝑐𝐷𝐷𝐷𝐷 𝐷𝐷𝑅𝑅 𝐷𝐷𝐷𝐷𝐷𝐷𝑠𝑠𝐷𝐷𝑒𝑒𝑠𝑠𝐷𝐷𝐷𝐷𝑖𝑖 𝑖𝑖𝐷𝐷𝐷𝐷𝐷𝐷𝐷𝐷𝑒𝑒𝑐𝑐ℎ𝐷𝐷𝑅𝑅 𝑐𝑐𝑒𝑒𝐷𝐷𝑅𝑅𝐷𝐷𝐷𝐷𝐷𝐷 𝐷𝐷𝑅𝑅 𝐷𝐷𝐷𝐷𝑠𝑠𝐷𝐷𝑒𝑒𝐷𝐷𝐷𝐷𝑠𝑠 𝐷𝐷 = 𝐷𝐷𝐷𝐷𝑒𝑒𝑒𝑒𝑠𝑠𝐷𝐷𝐷𝐷𝐷𝐷 (𝑑𝑑𝑒𝑒𝑑𝑑𝐷𝐷) 𝐷𝐷𝑐𝑐 = 𝐷𝐷𝐷𝐷𝑒𝑒𝑒𝑒𝑠𝑠𝐷𝐷𝐷𝐷𝐷𝐷 𝑅𝑅𝐷𝐷𝐷𝐷𝐷𝐷𝐷𝐷𝐷𝐷𝑖𝑖 𝑒𝑒𝑐𝑐𝐷𝐷𝑎𝑎𝐷𝐷 𝑤𝑤ℎ𝐷𝐷𝑅𝑅ℎ 𝐷𝐷𝐷𝐷 𝑒𝑒𝑑𝑑𝑑𝑑𝐷𝐷𝑠𝑠𝐷𝐷𝐷𝐷𝐷𝐷𝑒𝑒𝐷𝐷 𝑖𝑖𝐷𝐷𝐷𝐷𝐷𝐷𝐷𝐷𝑒𝑒𝑐𝑐ℎ𝐷𝐷𝑅𝑅 𝑐𝑐𝐷𝐷𝐷𝐷𝐷𝐷𝑅𝑅𝐷𝐷𝑠𝑠 𝐷𝐷𝐷𝐷 𝑅𝑅𝑒𝑒𝐷𝐷𝑅𝑅𝐷𝐷𝐷𝐷𝑒𝑒𝑠𝑠𝐷𝐷𝑑𝑑 𝐷𝐷 = 𝑁𝑁𝐷𝐷𝐷𝐷𝑐𝑐𝐷𝐷𝑒𝑒 𝐷𝐷𝑅𝑅 𝑑𝑑𝑒𝑒𝑑𝑑𝐷𝐷 𝑑𝑑𝐷𝐷𝑒𝑒𝐷𝐷𝐷𝐷𝑖𝑖 𝑒𝑒 𝑑𝑑𝐷𝐷𝑒𝑒𝑒𝑒 𝐷𝐷𝑅𝑅 𝑒𝑒𝐷𝐷𝑅𝑅𝐷𝐷𝑒𝑒𝑑𝑑 𝐷𝐷𝐷𝐷 𝑤𝑤ℎ𝐷𝐷𝑅𝑅ℎ 𝜏𝜏∗𝑅𝑅 𝐷𝐷𝐷𝐷 𝐷𝐷𝑒𝑒𝑅𝑅𝐷𝐷𝐷𝐷𝑑𝑑𝐷𝐷𝑑𝑑
This index provides a continuous metric of flushing effectiveness based on excess shear stress and its duration; therefore, it avoids issues associated with discretization approaches based on categorical thresholds of shear stress that are relatively insensitive to differences among similar scenarios. This metric was calculated for each year of the flow record for both flushing and bed mobilization using the reference shear and duration ceiling values found in Table II.8. An annual average CMFI was then computed for each flow scenario.
Table II.8: Summary of the reference shear (𝝉𝝉∗𝑹𝑹) and duration ceiling (Dc) for the computation of CMFI-F and CMFI-M.
Function 𝝉𝝉∗𝑹𝑹 𝑫𝑫𝒄𝒄 Fine sediment flushing (CMFI-F) 0.021 5 Bed mobility (CMFI-M) 0.030 5
The end product is a physically-based and intuitive equation for quantifying flows associated with sedimentation such as surface flushing of fine sediments and coarse substrate mobilization.
Next, the two CMFI metrics were combined with information on flood flow frequency and site-specific bank stabilization to produce a single channel condition metric for the ERM biological metrics. This single channel condition metric is based on the likely channel condition from 0.0 (poorest condition) to 1.0 (ideal condition for fish and aquatic insects). Upon investigating CMFI-F and CMFI-M values for a range of flushing and mobility conditions suggested by available literature (e.g., Kondolf and Wilcock, 1996, Milhous, 2009; Milhous, 2012), a linear value function was developed between the channel condition probability and the two CMFI metrics. The combined channel condition metric was assumed to have a normal distribution; thus, a mean and standard deviation were computed and, before distribution, binned into the states described in Table II.9 (see Appendix B1 for more information):
Ecological Response Model for Cache la Poudre River December 2014 City of Fort Collins 29

Table II.9: Description of four states of Channel Structure that depend on the combined status of flushing flows, coarse substrate mobilization, channel migration flows, and extent of bank stabilization. State Description
Clean and diverse Flushing and bed mobility flow functions intact, substrate clean on surface, interstitial space open, vegetation encroachment not advancing, channel has wide variety of depth, velocity, substrate combinations with morphologically diverse features such as side channels, chutes, bars owing to substantial removal of lateral bank stabilization.
Partially mobile and diverse All three flow functions at least partially intact, flushing occurs at least every few years, interstitial space open in high-stress zones such as riffles, vegetation encroachment slowly advancing in low-stress zones, habitat diversity flows may be intact but bank stabilization partially limiting channel complexity.
Largely immobile and homogeneous
Bed mobilization and/or channel migration flows not intact, flushing partially or not intact, vegetation encroachment likely advancing, river increasingly canal-like with homogeneous habitat until partially reset by an extreme event that overcomes bank stabilization in isolated locations, substrate flushing at least partially intact, habitat diversity flows could be intact but stabilization present.
Entrenched Partial to no substrate cleaning, channel maintenance absent, interstitial space not opened > 3–5 years, extensive bank stabilization, canal-like homogeneous channel.
Additional details on the entire hydraulic and geomorphic modeling approach are provided in Appendix B (Subsection B1).
Ecological Response Model for Cache la Poudre River December 2014 City of Fort Collins 30
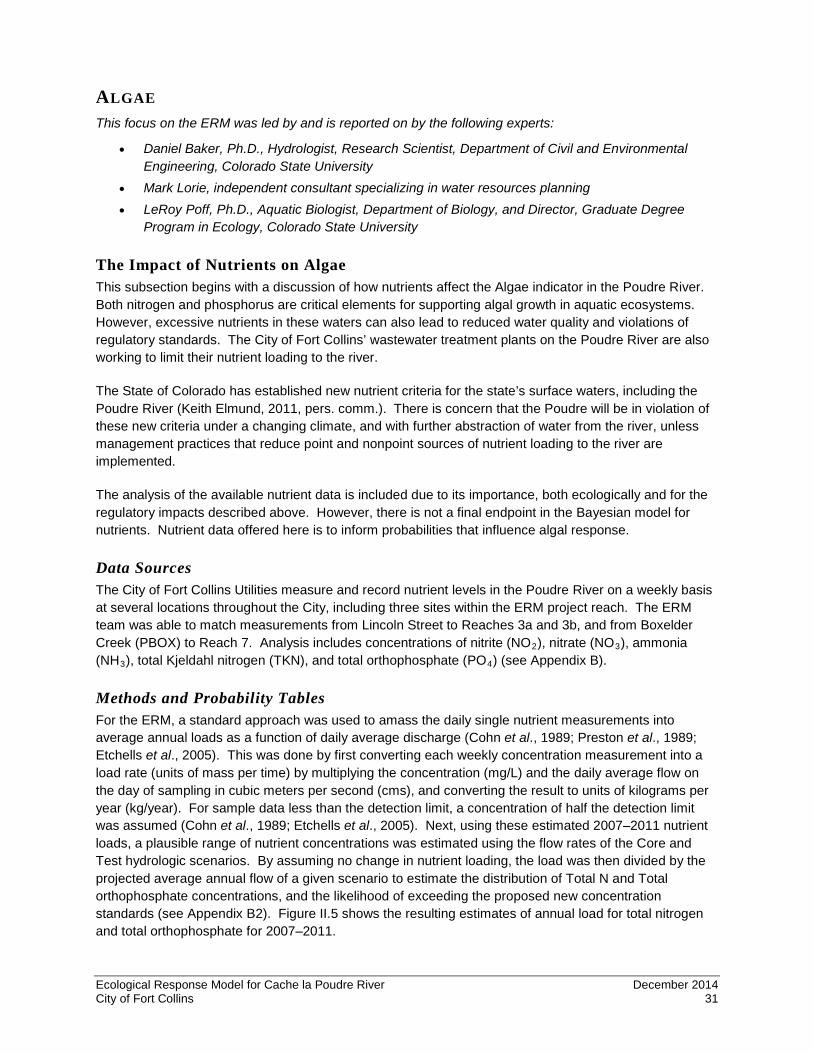
ALGAE This focus on the ERM was led by and is reported on by the following experts:
• Daniel Baker, Ph.D., Hydrologist, Research Scientist, Department of Civil and Environmental Engineering, Colorado State University
• Mark Lorie, independent consultant specializing in water resources planning • LeRoy Poff, Ph.D., Aquatic Biologist, Department of Biology, and Director, Graduate Degree
Program in Ecology, Colorado State University
The Impact of Nutrients on Algae This subsection begins with a discussion of how nutrients affect the Algae indicator in the Poudre River. Both nitrogen and phosphorus are critical elements for supporting algal growth in aquatic ecosystems. However, excessive nutrients in these waters can also lead to reduced water quality and violations of regulatory standards. The City of Fort Collins’ wastewater treatment plants on the Poudre River are also working to limit their nutrient loading to the river.
The State of Colorado has established new nutrient criteria for the state’s surface waters, including the Poudre River (Keith Elmund, 2011, pers. comm.). There is concern that the Poudre will be in violation of these new criteria under a changing climate, and with further abstraction of water from the river, unless management practices that reduce point and nonpoint sources of nutrient loading to the river are implemented.
The analysis of the available nutrient data is included due to its importance, both ecologically and for the regulatory impacts described above. However, there is not a final endpoint in the Bayesian model for nutrients. Nutrient data offered here is to inform probabilities that influence algal response.
Data Sources The City of Fort Collins Utilities measure and record nutrient levels in the Poudre River on a weekly basis at several locations throughout the City, including three sites within the ERM project reach. The ERM team was able to match measurements from Lincoln Street to Reaches 3a and 3b, and from Boxelder Creek (PBOX) to Reach 7. Analysis includes concentrations of nitrite (NO2), nitrate (NO3), ammonia (NH3), total Kjeldahl nitrogen (TKN), and total orthophosphate (PO4) (see Appendix B).
Methods and Probability Tables For the ERM, a standard approach was used to amass the daily single nutrient measurements into average annual loads as a function of daily average discharge (Cohn et al., 1989; Preston et al., 1989; Etchells et al., 2005). This was done by first converting each weekly concentration measurement into a load rate (units of mass per time) by multiplying the concentration (mg/L) and the daily average flow on the day of sampling in cubic meters per second (cms), and converting the result to units of kilograms per year (kg/year). For sample data less than the detection limit, a concentration of half the detection limit was assumed (Cohn et al., 1989; Etchells et al., 2005). Next, using these estimated 2007–2011 nutrient loads, a plausible range of nutrient concentrations was estimated using the flow rates of the Core and Test hydrologic scenarios. By assuming no change in nutrient loading, the load was then divided by the projected average annual flow of a given scenario to estimate the distribution of Total N and Total orthophosphate concentrations, and the likelihood of exceeding the proposed new concentration standards (see Appendix B2). Figure II.5 shows the resulting estimates of annual load for total nitrogen and total orthophosphate for 2007–2011.
Ecological Response Model for Cache la Poudre River December 2014 City of Fort Collins 31
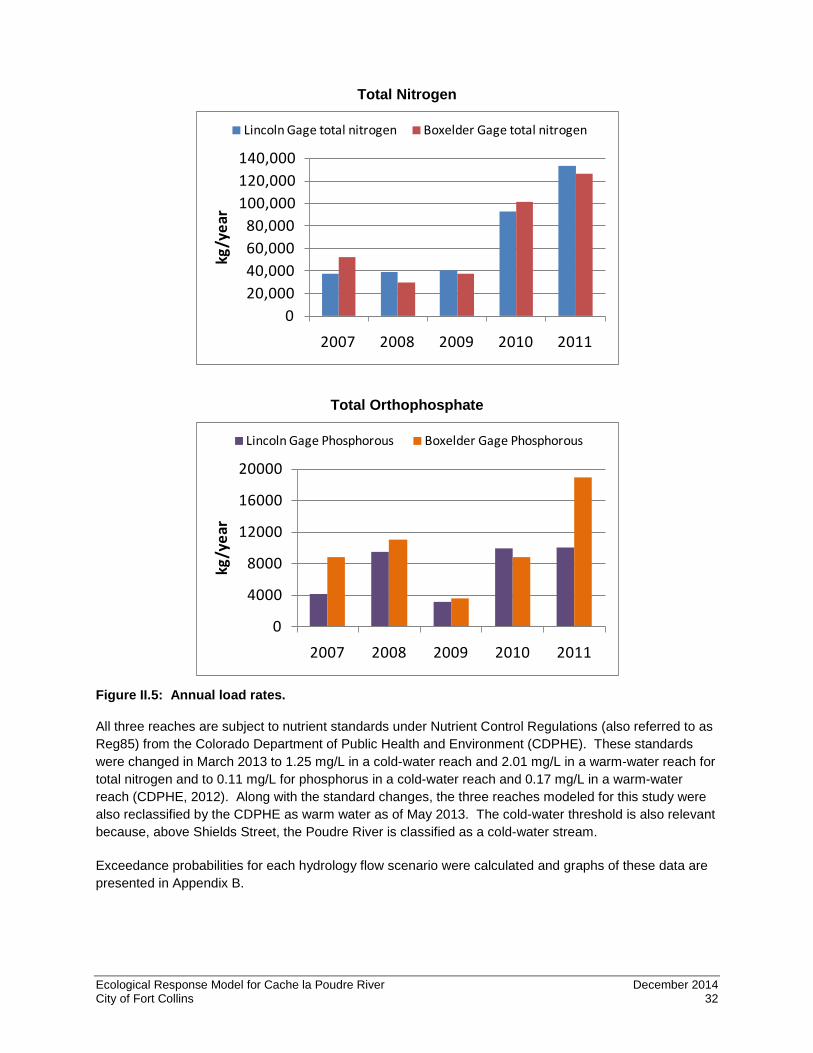
Total Nitrogen
Total Orthophosphate
Figure II.5: Annual load rates.
All three reaches are subject to nutrient standards under Nutrient Control Regulations (also referred to as Reg85) from the Colorado Department of Public Health and Environment (CDPHE). These standards were changed in March 2013 to 1.25 mg/L in a cold-water reach and 2.01 mg/L in a warm-water reach for total nitrogen and to 0.11 mg/L for phosphorus in a cold-water reach and 0.17 mg/L in a warm-water reach (CDPHE, 2012). Along with the standard changes, the three reaches modeled for this study were also reclassified by the CDPHE as warm water as of May 2013. The cold-water threshold is also relevant because, above Shields Street, the Poudre River is classified as a cold-water stream.
Exceedance probabilities for each hydrology flow scenario were calculated and graphs of these data are presented in Appendix B.
020,00040,00060,00080,000
100,000120,000140,000
2007 2008 2009 2010 2011
kg/y
ear
Lincoln Gage total nitrogen Boxelder Gage total nitrogen
0
4000
8000
12000
16000
20000
2007 2008 2009 2010 2011
kg/y
ear
Lincoln Gage Phosphorous Boxelder Gage Phosphorous
Ecological Response Model for Cache la Poudre River December 2014 City of Fort Collins 32

Finally, the exceedance probabilities were used to calculate a state variable representing the degree of enrichment as compared to threshold concentrations for the nuisance growth of algae. These threshold concentrations were 0.4 mg/L for total nitrogen (Dodds et al., 1997, 2002) and 0.11 mg/L for total phosphorous (representing the cold-water limit) (CDPHE, 2012; Elmund et al., 2011). The exceedance was then converted to a state variable (quantifying changes in overall algae abundance compared to recent conditions) as input to the Algae component of the model. Thus, each exceedance probability was normalized to that of the Recent Past hydrologic scenario. Finally, the enrichment was categorized into three enrichments (Table II.10). Thus, the state for a given scenario is determined by calculating the difference in frequency of exceedance of the thresholds between that scenario and the Recent Past scenario. An example, using total Nitrogen at Lincoln Street: If under the Recent Past scenario the standard is exceeded 65% of the time, and under Present Operations the standard is exceeded 67% of the time, the difference of 2% would land the state of nutrients in Present Operations into the 0 (about the same) category.
Table II.10: Enrichment states for nutrient concentrations. State Definition Significant improvement At least 25% less frequent exceedance of the threshold than under Recent
Past conditions. About the same Within ±25% of the frequency of exceedance under Recent Past conditions. Significant enrichment At least 25% more frequent exceedance of the threshold than under Recent
Past conditions.
Background Benthic, or attached, algae play two roles in the ERM.
First, algae are a component of the food web, providing a source of food for many aquatic insects (Allan and Castillo, 2007). Algal production is a direct response to several factors, including the positive effects of nutrients as discussed above (primarily orthophosphate, nitrate and ammonium) and the reducing effects of consumption by aquatic insects and scouring by high flows (Biggs, 1996).
In late summer, extensive algal mats can form in the slow-flowing parts of the river. Observation of the Poudre over the last several years by members of the ERM team strongly suggest that years with low summer base flows are much more likely to support high densities of late-summer algal mats than high-flow years, such as N. L. Poff’s personal observation with CSU Stream Ecology class on several late-summer field trips to the Poudre River. As another example, in 2011, with its high runoff into late summer, there was very little algal mat production observed in the river near Martinez Park compared to previous years and 2012.
These benthic algal mats are comprised of filamentous green and bluegreen algae, which are often not palatable to most aquatic insects and which can be difficult for many insects to eat because of the algae’s large filament size. During the daytime, thick mats can become supersaturated with oxygen due to high algal productivity; at night the oxygen demand of the algal mat can create unfavorable dissolved oxygen availability for aquatic insects that live in close association with the mat.
The second role of algae in the model is as an ecological endpoint of aesthetic concern. Thick mats of filamentous algae are viewed by many as undesirable (nuisance algae). Therefore, the Algae indicator in the ERM is considered as a socially-relevant indicator of ecosystem health, as well as a more basic ecological indicator.
Ecological Response Model for Cache la Poudre River December 2014 City of Fort Collins 33

Data Sources Estimates of benthic algae in relation to flow conditions in the Poudre River were based on the combined influences of nutrient enrichment (as defined above) and algae-flushing flows (see Table II.11). As nutrient data were limited to the Lincoln and Boxelder gages, Reaches 3a and 3b were calculated with the Lincoln Street data and Reach 7 with the Boxelder data.
Table II.11: Definition of states for algae-flushing flows.1
State Definition Intact Q exceeds 1,500 cfs for 14+ days 1 out of 2 years
Partially intact Q exceeds 1,000 cfs for 7+ days 1 out of 2 years
Absent Less than above
1 Based upon field observations and the expert judgment of the ERM team.
Historical levels of algae in the river are poorly documented. However, it is reasonable to expect that the abundance of algae has been increasing over time as more nutrients are added to the river from land use and agricultural runoff, perhaps ameliorated by nutrient reductions associated with water treatment plants.
The nutrient states (Table II.10) and the states for algae flushing flow (Table II.11) were both used as inputs to estimate algal production in the Poudre River.
Methods and Probability Tables Estimates of benthic algae in relation to flow conditions in the Poudre are based on expert knowledge and observation by members of the ERM team. These estimates are applied uniformly to all three reaches of the model.
The ERM includes three possible states for Algae, defined in Table II.12. Given the lack of monitoring data, the states for the Algae indicator are defined in very general terms and are defined relative to the general algae conditions in recent years.
Table II.12: Description of three states of Algae that depend on dilution flows, temperature, and flushing flows. State Definition Less than today Less frequent and/or less severe algal blooms than have been
typical in recent years. About the same as today About the same frequency and severity of algal blooms as
have been typical in recent years. More than today More frequent and/or more severe algal blooms than have
been typical in recent years.
The probability tables for the impacts of nutrient enrichment (total nitrogen and dissolved phosphorus) and scouring flows are based on general observations by experts of river conditions in recent years. The probabilities are presented in Appendix B and are derived from the following logic: Significant improvement in both sources of nutrients leads to the greatest chances of reduced Algae, especially in conjunction with sustained high flows that scour the streambed. Probability of algal abundance increases if either nutrient source does not improve or as scouring flows are reduced. Under possible significant enrichment of nutrients and reduction of scouring flows, algal abundance is very likely to increase greatly.
Ecological Response Model for Cache la Poudre River December 2014 City of Fort Collins 34
AQUATIC INSECTS This focus of the ERM was led by and is reported on by the following expert:
• Boris Kondratieff, Ph.D., Entomologist, Department of Bioagricultural Sciences and Pest Management, Colorado State University
Background Stream biotas reflect the chemical, physical, and biological conditions in which they evolved. Biological community changes and, therefore, biological evaluation, reflect many environmental conditions and anthropogenic impacts. Surveillance of aquatic and habitat quality using macroinvertebrate species or communities as indicators of biotic integrity has become common practice (Rosenberg and Resh, 1993; Rosenberg et al., 2008). Benthic macroinvertebrates, or aquatic insects for the purposes of this report, are especially useful for this purpose because they are:
• Common in most streams • Readily collected • Relatively easily identified • Not very mobile • Expected to have life cycles of a year or more
Benthic macroinvertebrates are defined as those aquatic insects that are retained by a 500-µm net or sieve (Hauer and Lamberti, 2006). They have been used to assess water quality in a number of ways including toxicological assays, bioaccumulation, indicator species, and community measures that include biotic indices, diversity indices, similarity indices, description of community structure, and function (Rosenberg et al., 2008).
In 1842 and 1843, John C. Frémont crossed the Poudre River near present-day Fort Collins in early summer and noted a river that was clear and running across clean gravel (Jackson and Spence, 1970). At that time native greenback cutthroat trout occurred throughout the river, even as far east as Greeley, depending on the magnitude of the water year or sequence of years (Fausch and Bestgen, 1997). No doubt dynamic, diverse aquatic insect communities also existed throughout the length in the Poudre River, transitioning from typical higher elevation southern Rocky Mountain taxa in the upper canyon reaches to perhaps a unique mix of taxa and more typical High Plains Steppe taxa along the Front Range. Unfortunately, no surveys or collections of these taxa were apparently made before the substantial impacts of irrigated agriculture, gravel mining, logging, channelization, and establishment of settlements by the 1860s (Wohl, 2001). It is known that several species of mayflies (Ephemeroptera) and stoneflies (Plecoptera) were extirpated from the lower Poudre River by the late 1880s (Zuellig et al., 2011).
Currently, the aquatic insect communities are composed of relatively resilient species that can vary in diversity and abundance depending on the yearly flow regime and biotic condition of the river (Grotheer et al., 1994; Shieh et al., 1999, 2002; Voelz et al., 2000, 2005; USGS, 2003; Rice and Bestgen, 2006; Douglas Rice, 2011, pers. comm.).
Data Sources Many of the sampling sites on the Poudre River have been described by various authors (Grotheer et al., 1994; Shieh et al., 1999, 2002; Voelz et al., 2000, 2005; USGS, 2003; Rice and Bestgen, 2006). Aquatic insect data for the years 2000–2010 for several sites in Fort Collins (Martinez Park, Lincoln Bridge,
Ecological Response Model for Cache la Poudre River December 2014 City of Fort Collins 35
Prospect Street Bridge, Mulberry Street, and Moore Farm) were provided by Douglas A. Rice, Environmental Health Services, Colorado State University. These samples were collected using a standard square foot Surber sampler (0.09 m2) (Merritt et al., 2008). Three replicates were taken at each site and the three samples composited. Sampling at three sites (at Lee Martinez Park above the bike path and foot bridge between College and Shields, near Fort Collins Nursery on Mulberry, and on the east side of the river at the CSU Environmental Learning Center) was terminated in 2007. Aquatic invertebrates were identified to the lowest practical taxonomic level, usually genus, but in the case of non-insect taxa higher categories were identified. In some of the above studies, individual samples were subsampled to determine the number of organisms of each taxon for the entire sample.
Methods and Probability Tables The biological health of the aquatic insect community of the Poudre River was evaluated for the ERM by using a standard approach of calculating the percentage of all species in the collected samples that are comprised of species from three sensitive orders (hereafter referred to as the EPT): Ephemeroptera (mayflies), Plecoptera (stoneflies), and Trichoptera (caddisflies). These insect orders are generally regarded as sensitive and loss of taxa in these groups is an indication of potential perturbation (Wallace et al., 1996). The percent EPT (%EPT) is a universal metric applicable in many stream systems (Plafkin et al., 1989). Percent EPT was computed for the genera identified for the months of April and August in the years provided. A master list for the taxa of Aquatic Insects used as an indicator in the ERM is given in Appendix B (Subsection B3).
Based on the above studies, other unpublished data, the known life cycles of the aquatic insects, available environmental tolerance values (e.g., Platts et al., 1983; Hilsenhoff, 1987), and known substrate preferences, three states for Aquatic Insect abundance and diversity were defined for the ERM. Table II.13 reports these states and definitions.
Table II.13: Description of three states of Aquatic Insects that depend on scouring flows that cleanse streambed and check algal proliferation, and on summer baseflows. State Definition + Presence of species that take one (univoltine) to two (semivoltine) years to complete life
cycles; semivoltine species present in all size classes, indicating successful annual reproduction and similar abundance to upstream/canyon areas; similar overall diversity to upstream/canyon reaches.
0 Mostly univoltine taxa present; reproduction during favorable conditions; less abundant than upstream/canyon areas; low diversity compared to upstream/canyon reaches.
- Mostly univoltine taxa present; low abundance or high abundance dominated by tolerant taxa such as oligochaete worms, Turbellaria (flatworms), and chironomid worms.
It is anticipated that there would be little change in aquatic invertebrate community composition due to the resiliency of the existing, relatively non-sensitive taxa (as most sensitive taxa have been largely extirpated from the lower Poudre River). The remaining communities are generally composed of species that can survive and reproduce in the lower Poudre River in the City of Fort Collins, where short-term hydrologic and temperature fluctuations exceed what was typical under Recent Past scenario conditions.
For purposes of the ERM, three important drivers of Aquatic Insect abundance and diversity were modeled:
1. Channel Structure 2. Summer base flow and water temperature (as one combined variable) 3. Algae
Ecological Response Model for Cache la Poudre River December 2014 City of Fort Collins 36
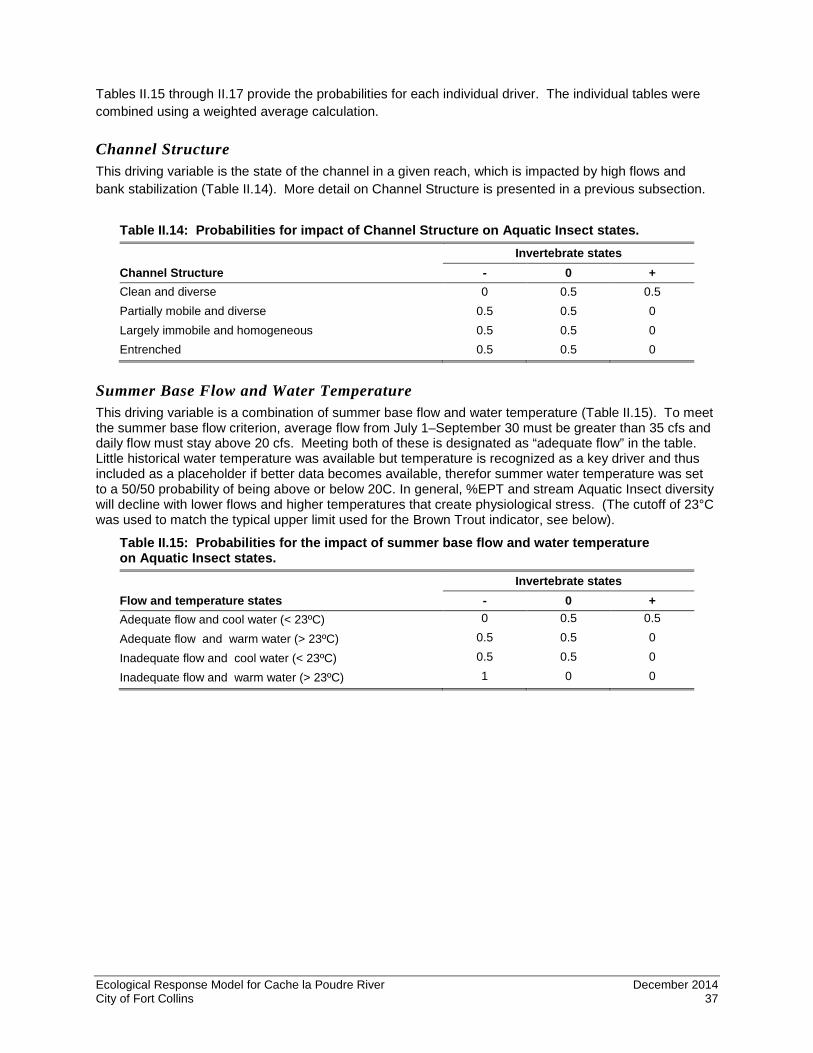
Tables II.15 through II.17 provide the probabilities for each individual driver. The individual tables were combined using a weighted average calculation.
Channel Structure This driving variable is the state of the channel in a given reach, which is impacted by high flows and bank stabilization (Table II.14). More detail on Channel Structure is presented in a previous subsection.
Table II.14: Probabilities for impact of Channel Structure on Aquatic Insect states.
Channel Structure Invertebrate states
- 0 + Clean and diverse 0 0.5 0.5 Partially mobile and diverse 0.5 0.5 0 Largely immobile and homogeneous 0.5 0.5 0 Entrenched 0.5 0.5 0
Summer Base Flow and Water Temperature This driving variable is a combination of summer base flow and water temperature (Table II.15). To meet the summer base flow criterion, average flow from July 1–September 30 must be greater than 35 cfs and daily flow must stay above 20 cfs. Meeting both of these is designated as “adequate flow” in the table. Little historical water temperature was available but temperature is recognized as a key driver and thus included as a placeholder if better data becomes available, therefor summer water temperature was set to a 50/50 probability of being above or below 20C. In general, %EPT and stream Aquatic Insect diversity will decline with lower flows and higher temperatures that create physiological stress. (The cutoff of 23°C was used to match the typical upper limit used for the Brown Trout indicator, see below).
Table II.15: Probabilities for the impact of summer base flow and water temperature on Aquatic Insect states.
Flow and temperature states Invertebrate states
- 0 + Adequate flow and cool water (< 23ºC) 0 0.5 0.5
Adequate flow and warm water (> 23ºC) 0.5 0.5 0
Inadequate flow and cool water (< 23ºC) 0.5 0.5 0
Inadequate flow and warm water (> 23ºC) 1 0 0
Ecological Response Model for Cache la Poudre River December 2014 City of Fort Collins 37
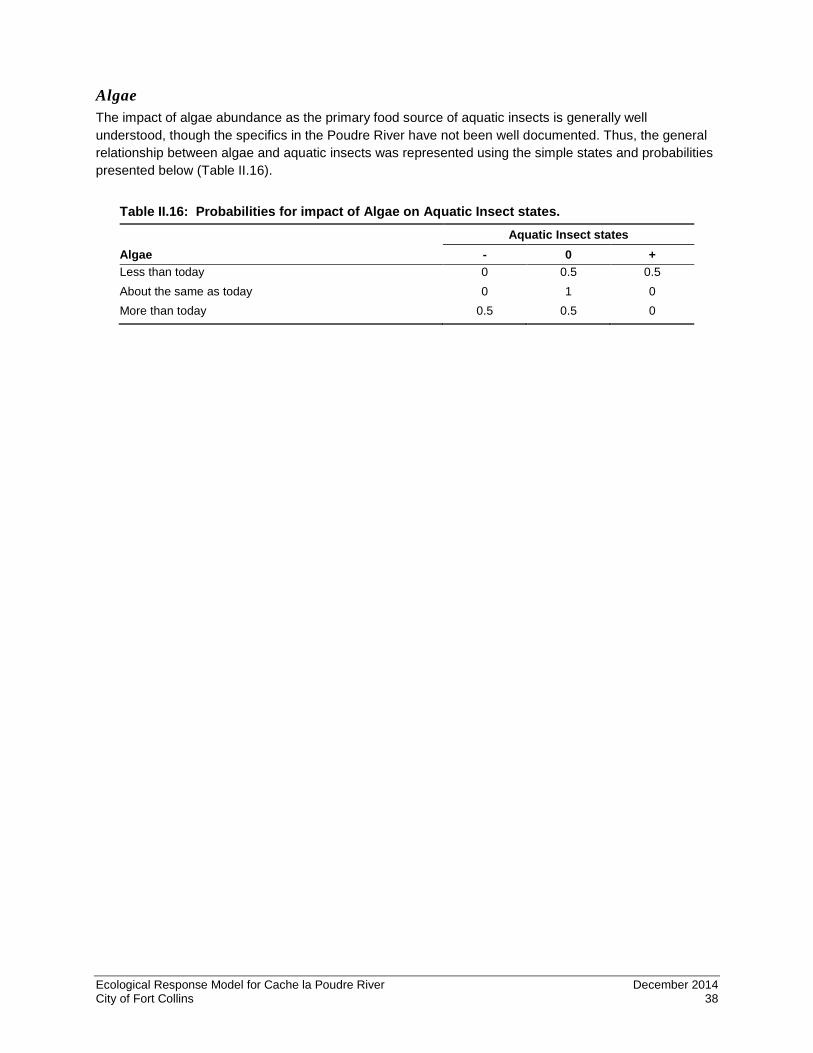
Algae The impact of algae abundance as the primary food source of aquatic insects is generally well understood, though the specifics in the Poudre River have not been well documented. Thus, the general relationship between algae and aquatic insects was represented using the simple states and probabilities presented below (Table II.16).
Table II.16: Probabilities for impact of Algae on Aquatic Insect states.
Algae Aquatic Insect states
- 0 + Less than today 0 0.5 0.5 About the same as today 0 1 0 More than today 0.5 0.5 0
Ecological Response Model for Cache la Poudre River December 2014 City of Fort Collins 38
NATIVE FISH AND BROWN TROUT This focus of the ERM was led by and is reported on by the following experts:
• Kevin Bestgen, Ph.D., Director and Senior Research Scientist, Larval Fish Laboratory, Department of Fish, Wildlife and Conservation Biology, Colorado State University
• LeRoy Poff, Ph.D., Aquatic Biologist, Department of Biology, and Director, Graduate Degree Program in Ecology, Colorado State University
Background Fish communities integrate a host of watershed conditions (including the individual and combined effects of stressors) that are manifest as population responses over time. Changes in native fish communities and the Poudre River trout fishery are of interest because they reflect the relative health and condition of the system. Data that describe the biota and water chemistry of the Poudre River from Fort Collins to near Greeley have been collected over relatively long periods with a goal to monitor water quality of the Poudre River. Therefore, some of those data are used to describe the fish communities of the Poudre River near Fort Collins to understand trends in species richness and abundance of native fishes and salmonids (mostly brown trout) related to stream flow patterns and habitat changes over time. These patterns will be used to project changes in the ERM’s Native Fish and Brown Trout indicators in the section of the Poudre River under a range of simulated future flow conditions from just west of College Avenue downstream to the Environmental Learning Center (ELC). (For more information on Brown Trout and Native Fish and environmental conditions in the Poudre River generally, see Appendix B (Subsection B4)).
For this study, patterns of native fishes and total fish species richness were examined (number of each species at a site), fish abundance (number of all individuals collected), and fish community biomass at the McMurry Natural Area (ERM Reach 3b) and ELC (ERM Reach 7) sites relative to various flow metrics and relative to year (time effect) in an attempt to discern meaningful patterns. Environmental variables examined included average winter flow (November–February), average annual flow, maximum annual flow, and minimum annual flow.
In general, there are more species, all taxa as well as native kinds, downstream compared to upstream. This is because the cooler water upstream supports fewer taxa that are cool-water tolerant than the warm water downstream. Persistence of native fishes upstream may also be inhibited by the occasional high abundances of brown trout, which are predators and may limit the diversity and abundance of native fishes at the McMurry Natural Area site. Few other meaningful patterns relative to environmental variables were apparent, except for those associated with species richness and biomass relative to time. Species richness, both for native species and all taxa, declined over time from 1982–2011. This pattern reflects the generally reduced state of native fishes and habitat in the Poudre River study area, historically and now. Many sensitive species, especially those that require clean spawning gravel for reproduction have disappeared from the Poudre River entirely. Gravel spawning species include common shiner (Luxilus cornutus), central stoneroller (Campostoma anomalum), and creek chub (Semotlius atromaculatus); brassy minnow (Hybognathus hankinsoni) is a habitat specialist that has largely disappeared. The fish community that remains is a relatively low percentage of what likely occurred historically, and is represented by an array of species that are tolerant to moderate or high levels of degradation.
Reductions in biomass over time may reflect the relatively simplified state of habitat at sites in the study area and efforts to maintain that state. For example, periodic channelization of the ELC site reduced the deep pool habitat (and large trees that acted as cover) that held many fish, particularly large-bodied
Ecological Response Model for Cache la Poudre River December 2014 City of Fort Collins 39

suckers and common carp that constituted much of the biomass present. At the McMurry Natural Area site, deep pools and cover were reduced when flows were low and when riparian trees that had fallen into the river were removed, again reducing habitat for suckers and trout. The lower habitat diversity may also explain the low abundance or near extirpation of cover-seeking species such as creek chub at those sites.
Because few patterns were evident for trends within the Native Fish indicator relative to flow or other river or environmental conditions, the ERM team used expert judgment to assign probability states for Native Fish related to driving variables that are thought to influence populations. Information used included knowledge of the habitat types used and preferred, the processes and river functions that create such habitats, sensitivity of species to toxicants or siltation, relative diet specialization, and other information about river conditions where such species exist in Colorado.
Data Sources Data were collected in these reaches from 1993–present. Data from an upstream site, which was adjacent to McMurry Natural Area and Martinez Park (Site #1 in Bestgen and Fausch, 1993), were used to draw inferences about Brown Trout abundance and dynamics. The second site, near the ELC (Site #3 in Bestgen and Fausch, 1993) provided data on Native Fish (Brown Trout were rare there). More details on these sites and the sampling methods used to collect fish are provided in Appendix B (Subsection B4).
Methods and Probability Tables for Brown Trout The number of age-0 (young) brown trout captured in autumn samples at the McMurry Natural Area site was used as an index of reproductive success the prior winter. Brown trout spawn in autumn and winter, so an age-0 fish captured in autumn (a fish ≤ 160 mm total length (TL), about six inches total length or less) was produced about nine to ten months earlier, and hatched the same winter. For example, a fish captured in autumn 2000 was produced from an embryo that was fertilized in late autumn 1999, hatched in winter of 2000, and grew during the spring and summer before being captured in autumn.
It was reasoned that numbers of young trout should be reflective of the conditions leading up to and during the incubation period (defined as November 1–March 1) and that, in order to have a productive trout fishery, reproduction must be relatively high in most or all years. Production of young brown trout is also a function of the number of adult brown trout in general, so those metrics were correlated with each other, but numbers of young fish were used in ERM calculations because that was likely a more sensitive metric of winter habitat conditions. Such data were available at the McMurry Natural Area site for the period 1990–2006, except for 1997 and 1999. The empirical data show that the number of young brown trout are correlated to average winter streamflow (November 1–March 1), with a higher probability of observing more trout with years with higher winter base flows (Figure II.6).
Ecological Response Model for Cache la Poudre River December 2014 City of Fort Collins 40
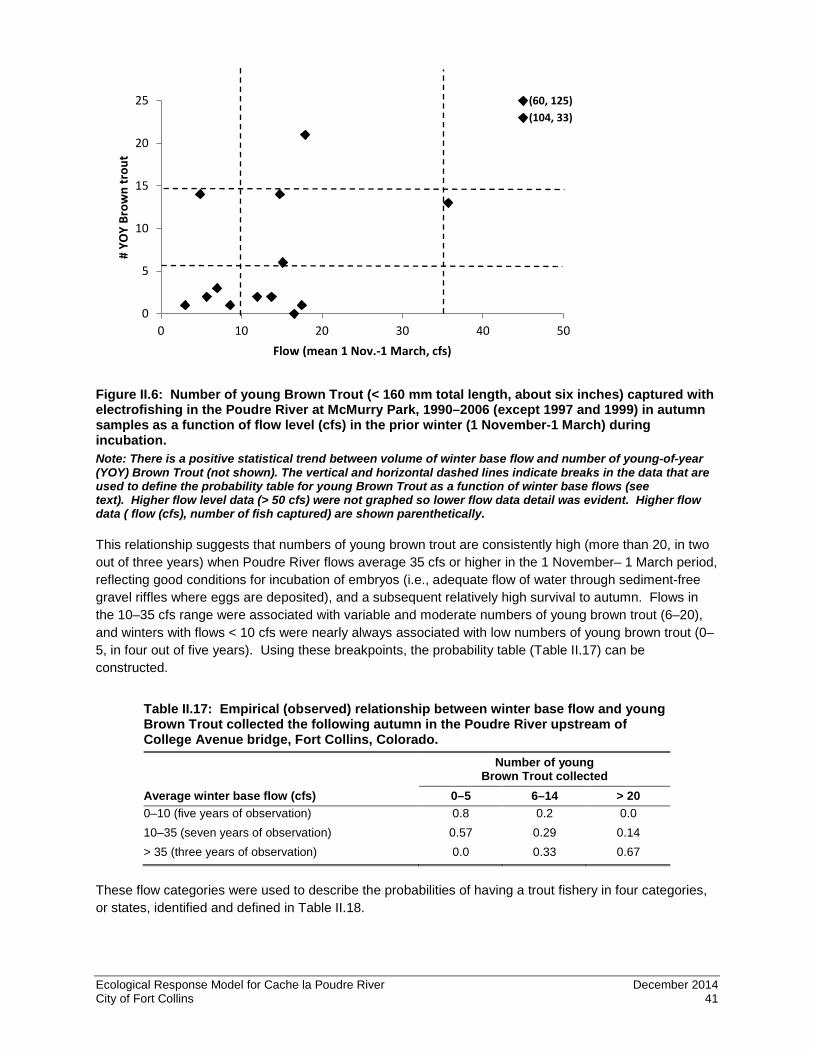
Figure II.6: Number of young Brown Trout (< 160 mm total length, about six inches) captured with electrofishing in the Poudre River at McMurry Park, 1990–2006 (except 1997 and 1999) in autumn samples as a function of flow level (cfs) in the prior winter (1 November-1 March) during incubation. Note: There is a positive statistical trend between volume of winter base flow and number of young-of-year (YOY) Brown Trout (not shown). The vertical and horizontal dashed lines indicate breaks in the data that are used to define the probability table for young Brown Trout as a function of winter base flows (see text). Higher flow level data (> 50 cfs) were not graphed so lower flow data detail was evident. Higher flow data ( flow (cfs), number of fish captured) are shown parenthetically.
This relationship suggests that numbers of young brown trout are consistently high (more than 20, in two out of three years) when Poudre River flows average 35 cfs or higher in the 1 November– 1 March period, reflecting good conditions for incubation of embryos (i.e., adequate flow of water through sediment-free gravel riffles where eggs are deposited), and a subsequent relatively high survival to autumn. Flows in the 10–35 cfs range were associated with variable and moderate numbers of young brown trout (6–20), and winters with flows < 10 cfs were nearly always associated with low numbers of young brown trout (0–5, in four out of five years). Using these breakpoints, the probability table (Table II.17) can be constructed.
Table II.17: Empirical (observed) relationship between winter base flow and young Brown Trout collected the following autumn in the Poudre River upstream of College Avenue bridge, Fort Collins, Colorado.
Average winter base flow (cfs)
Number of young Brown Trout collected
0–5 6–14 > 20 0–10 (five years of observation) 0.8 0.2 0.0 10–35 (seven years of observation) 0.57 0.29 0.14 > 35 (three years of observation) 0.0 0.33 0.67
These flow categories were used to describe the probabilities of having a trout fishery in four categories, or states, identified and defined in Table II.18.
0
5
10
15
20
25
0 10 20 30 40 50
# YO
Y Br
own
trou
t
Flow (mean 1 Nov.-1 March, cfs)
(104, 33) (60, 125)
Ecological Response Model for Cache la Poudre River December 2014 City of Fort Collins 41
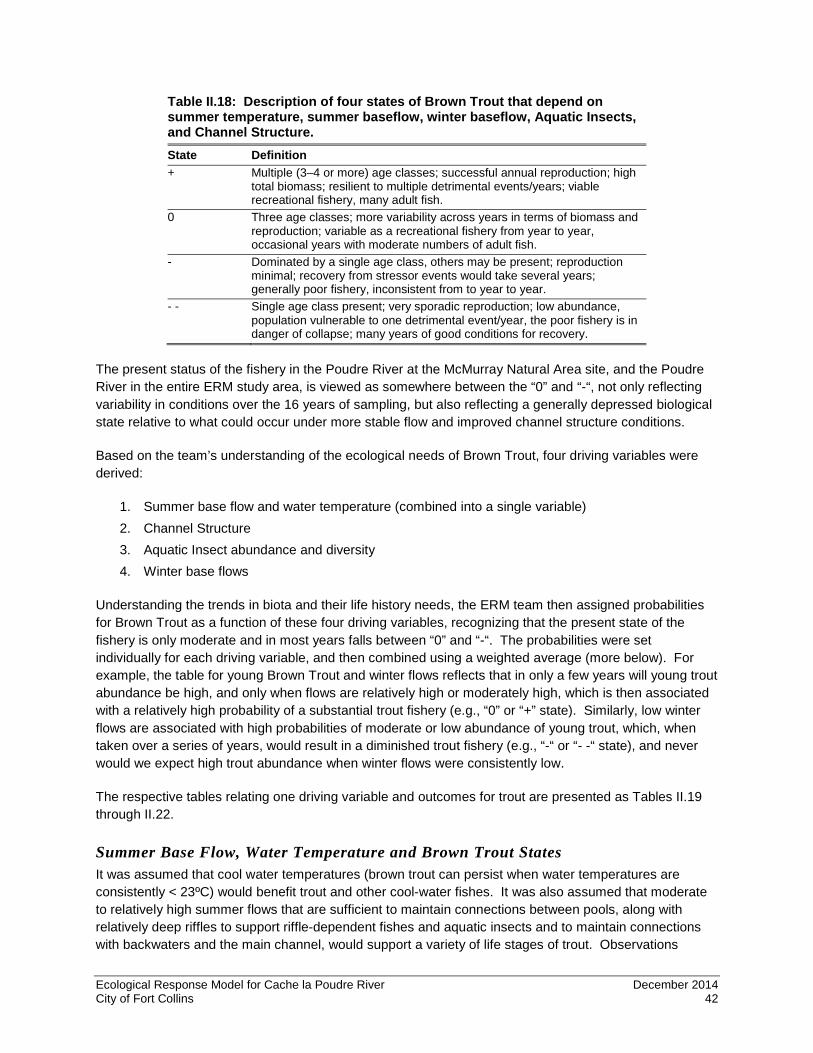
Table II.18: Description of four states of Brown Trout that depend on summer temperature, summer baseflow, winter baseflow, Aquatic Insects, and Channel Structure. State Definition + Multiple (3–4 or more) age classes; successful annual reproduction; high
total biomass; resilient to multiple detrimental events/years; viable recreational fishery, many adult fish.
0 Three age classes; more variability across years in terms of biomass and reproduction; variable as a recreational fishery from year to year, occasional years with moderate numbers of adult fish.
- Dominated by a single age class, others may be present; reproduction minimal; recovery from stressor events would take several years; generally poor fishery, inconsistent from to year to year.
- - Single age class present; very sporadic reproduction; low abundance, population vulnerable to one detrimental event/year, the poor fishery is in danger of collapse; many years of good conditions for recovery.
The present status of the fishery in the Poudre River at the McMurray Natural Area site, and the Poudre River in the entire ERM study area, is viewed as somewhere between the “0” and “-“, not only reflecting variability in conditions over the 16 years of sampling, but also reflecting a generally depressed biological state relative to what could occur under more stable flow and improved channel structure conditions.
Based on the team’s understanding of the ecological needs of Brown Trout, four driving variables were derived:
1. Summer base flow and water temperature (combined into a single variable) 2. Channel Structure 3. Aquatic Insect abundance and diversity 4. Winter base flows
Understanding the trends in biota and their life history needs, the ERM team then assigned probabilities for Brown Trout as a function of these four driving variables, recognizing that the present state of the fishery is only moderate and in most years falls between “0” and “-“. The probabilities were set individually for each driving variable, and then combined using a weighted average (more below). For example, the table for young Brown Trout and winter flows reflects that in only a few years will young trout abundance be high, and only when flows are relatively high or moderately high, which is then associated with a relatively high probability of a substantial trout fishery (e.g., “0” or “+” state). Similarly, low winter flows are associated with high probabilities of moderate or low abundance of young trout, which, when taken over a series of years, would result in a diminished trout fishery (e.g., “-“ or “- -“ state), and never would we expect high trout abundance when winter flows were consistently low.
The respective tables relating one driving variable and outcomes for trout are presented as Tables II.19 through II.22.
Summer Base Flow, Water Temperature and Brown Trout States It was assumed that cool water temperatures (brown trout can persist when water temperatures are consistently < 23ºC) would benefit trout and other cool-water fishes. It was also assumed that moderate to relatively high summer flows that are sufficient to maintain connections between pools, along with relatively deep riffles to support riffle-dependent fishes and aquatic insects and to maintain connections with backwaters and the main channel, would support a variety of life stages of trout. Observations
Ecological Response Model for Cache la Poudre River December 2014 City of Fort Collins 42
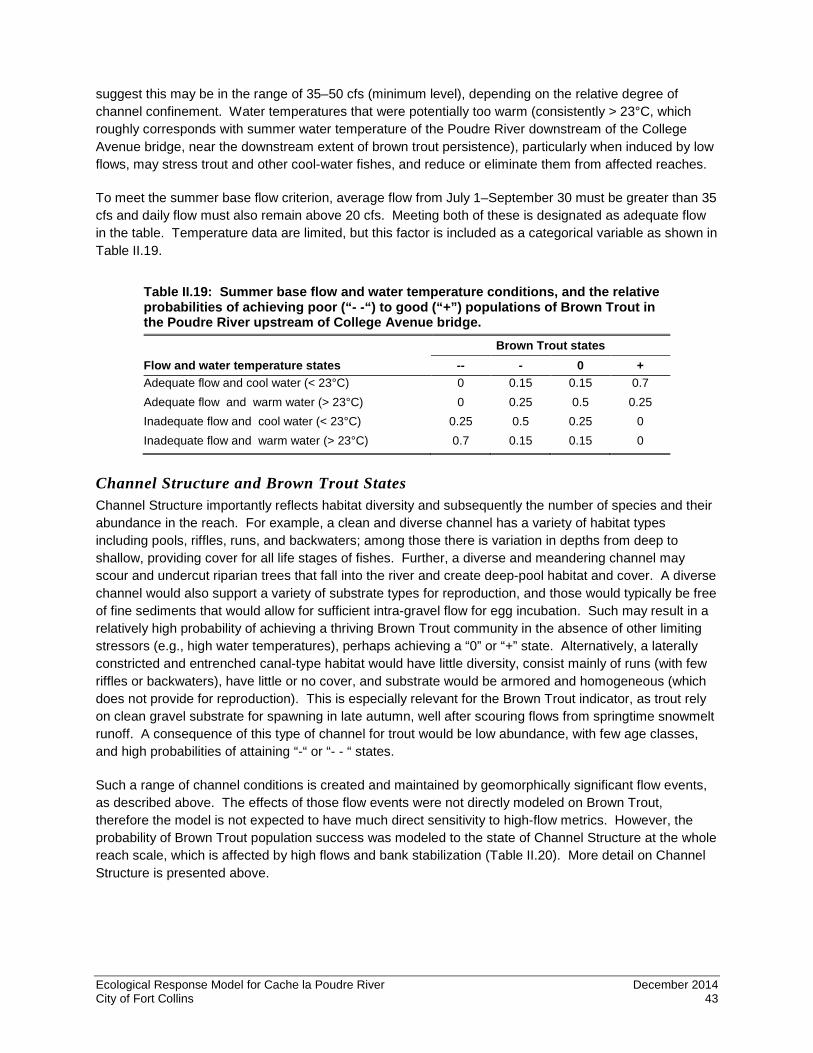
suggest this may be in the range of 35–50 cfs (minimum level), depending on the relative degree of channel confinement. Water temperatures that were potentially too warm (consistently > 23°C, which roughly corresponds with summer water temperature of the Poudre River downstream of the College Avenue bridge, near the downstream extent of brown trout persistence), particularly when induced by low flows, may stress trout and other cool-water fishes, and reduce or eliminate them from affected reaches.
To meet the summer base flow criterion, average flow from July 1–September 30 must be greater than 35 cfs and daily flow must also remain above 20 cfs. Meeting both of these is designated as adequate flow in the table. Temperature data are limited, but this factor is included as a categorical variable as shown in Table II.19.
Table II.19: Summer base flow and water temperature conditions, and the relative probabilities of achieving poor (“- -“) to good (“+”) populations of Brown Trout in the Poudre River upstream of College Avenue bridge.
Flow and water temperature states Brown Trout states
-- - 0 + Adequate flow and cool water (< 23°C) 0 0.15 0.15 0.7 Adequate flow and warm water (> 23°C) 0 0.25 0.5 0.25 Inadequate flow and cool water (< 23°C) 0.25 0.5 0.25 0 Inadequate flow and warm water (> 23°C) 0.7 0.15 0.15 0
Channel Structure and Brown Trout States Channel Structure importantly reflects habitat diversity and subsequently the number of species and their abundance in the reach. For example, a clean and diverse channel has a variety of habitat types including pools, riffles, runs, and backwaters; among those there is variation in depths from deep to shallow, providing cover for all life stages of fishes. Further, a diverse and meandering channel may scour and undercut riparian trees that fall into the river and create deep-pool habitat and cover. A diverse channel would also support a variety of substrate types for reproduction, and those would typically be free of fine sediments that would allow for sufficient intra-gravel flow for egg incubation. Such may result in a relatively high probability of achieving a thriving Brown Trout community in the absence of other limiting stressors (e.g., high water temperatures), perhaps achieving a “0” or “+” state. Alternatively, a laterally constricted and entrenched canal-type habitat would have little diversity, consist mainly of runs (with few riffles or backwaters), have little or no cover, and substrate would be armored and homogeneous (which does not provide for reproduction). This is especially relevant for the Brown Trout indicator, as trout rely on clean gravel substrate for spawning in late autumn, well after scouring flows from springtime snowmelt runoff. A consequence of this type of channel for trout would be low abundance, with few age classes, and high probabilities of attaining “-“ or “- - “ states.
Such a range of channel conditions is created and maintained by geomorphically significant flow events, as described above. The effects of those flow events were not directly modeled on Brown Trout, therefore the model is not expected to have much direct sensitivity to high-flow metrics. However, the probability of Brown Trout population success was modeled to the state of Channel Structure at the whole reach scale, which is affected by high flows and bank stabilization (Table II.20). More detail on Channel Structure is presented above.
Ecological Response Model for Cache la Poudre River December 2014 City of Fort Collins 43
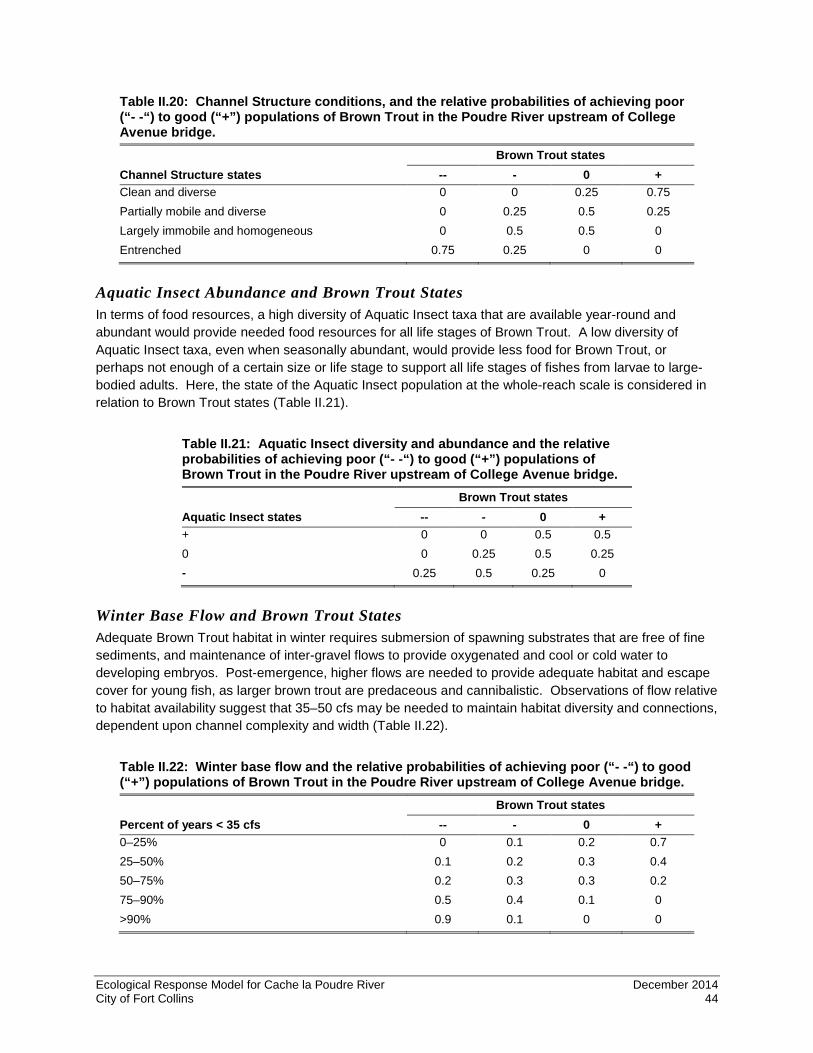
Table II.20: Channel Structure conditions, and the relative probabilities of achieving poor (“- -“) to good (“+”) populations of Brown Trout in the Poudre River upstream of College Avenue bridge.
Channel Structure states Brown Trout states
-- - 0 + Clean and diverse 0 0 0.25 0.75 Partially mobile and diverse 0 0.25 0.5 0.25 Largely immobile and homogeneous 0 0.5 0.5 0 Entrenched 0.75 0.25 0 0
Aquatic Insect Abundance and Brown Trout States In terms of food resources, a high diversity of Aquatic Insect taxa that are available year-round and abundant would provide needed food resources for all life stages of Brown Trout. A low diversity of Aquatic Insect taxa, even when seasonally abundant, would provide less food for Brown Trout, or perhaps not enough of a certain size or life stage to support all life stages of fishes from larvae to large-bodied adults. Here, the state of the Aquatic Insect population at the whole-reach scale is considered in relation to Brown Trout states (Table II.21).
Table II.21: Aquatic Insect diversity and abundance and the relative probabilities of achieving poor (“- -“) to good (“+”) populations of Brown Trout in the Poudre River upstream of College Avenue bridge.
Aquatic Insect states Brown Trout states
-- - 0 + + 0 0 0.5 0.5 0 0 0.25 0.5 0.25 - 0.25 0.5 0.25 0
Winter Base Flow and Brown Trout States Adequate Brown Trout habitat in winter requires submersion of spawning substrates that are free of fine sediments, and maintenance of inter-gravel flows to provide oxygenated and cool or cold water to developing embryos. Post-emergence, higher flows are needed to provide adequate habitat and escape cover for young fish, as larger brown trout are predaceous and cannibalistic. Observations of flow relative to habitat availability suggest that 35–50 cfs may be needed to maintain habitat diversity and connections, dependent upon channel complexity and width (Table II.22).
Table II.22: Winter base flow and the relative probabilities of achieving poor (“- -“) to good (“+”) populations of Brown Trout in the Poudre River upstream of College Avenue bridge.
Percent of years < 35 cfs Brown Trout states
-- - 0 + 0–25% 0 0.1 0.2 0.7 25–50% 0.1 0.2 0.3 0.4 50–75% 0.2 0.3 0.3 0.2 75–90% 0.5 0.4 0.1 0 >90% 0.9 0.1 0 0
Ecological Response Model for Cache la Poudre River December 2014 City of Fort Collins 44
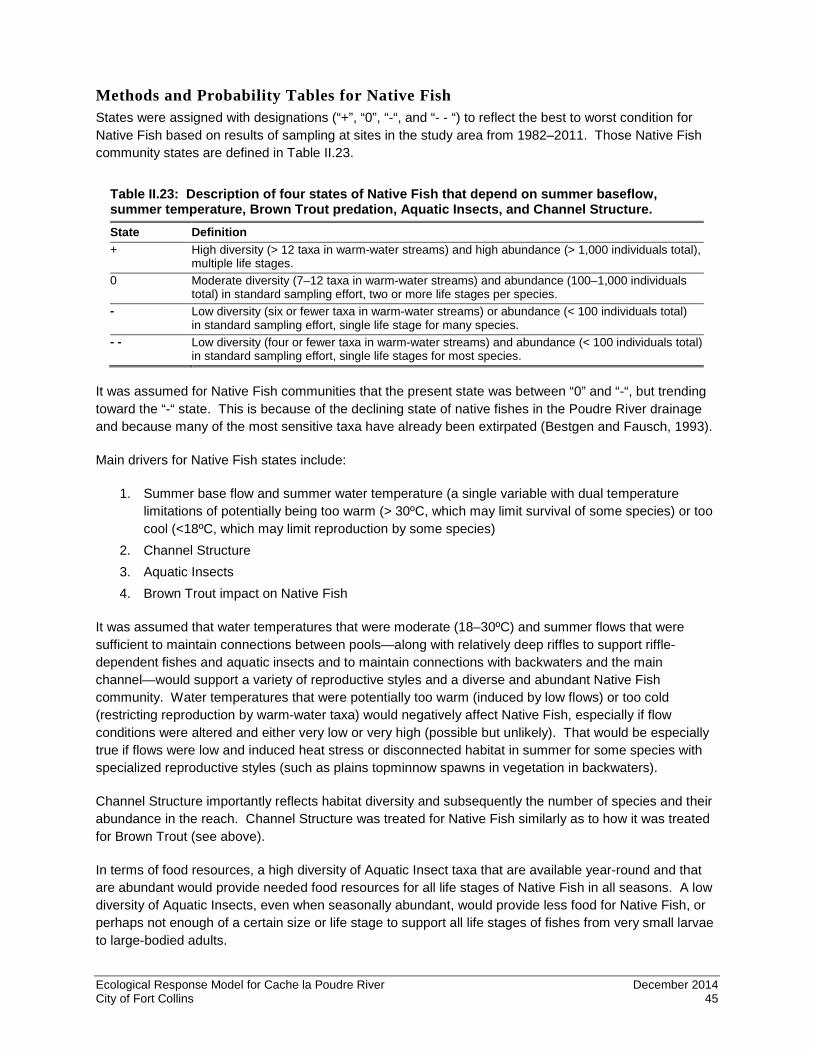
Methods and Probability Tables for Native Fish States were assigned with designations (“+”, “0”, “-“, and “- - “) to reflect the best to worst condition for Native Fish based on results of sampling at sites in the study area from 1982–2011. Those Native Fish community states are defined in Table II.23.
Table II.23: Description of four states of Native Fish that depend on summer baseflow, summer temperature, Brown Trout predation, Aquatic Insects, and Channel Structure. State Definition + High diversity (> 12 taxa in warm-water streams) and high abundance (> 1,000 individuals total),
multiple life stages. 0 Moderate diversity (7–12 taxa in warm-water streams) and abundance (100–1,000 individuals
total) in standard sampling effort, two or more life stages per species. - Low diversity (six or fewer taxa in warm-water streams) or abundance (< 100 individuals total)
in standard sampling effort, single life stage for many species. - - Low diversity (four or fewer taxa in warm-water streams) and abundance (< 100 individuals total)
in standard sampling effort, single life stages for most species.
It was assumed for Native Fish communities that the present state was between “0” and “-“, but trending toward the “-“ state. This is because of the declining state of native fishes in the Poudre River drainage and because many of the most sensitive taxa have already been extirpated (Bestgen and Fausch, 1993).
Main drivers for Native Fish states include:
1. Summer base flow and summer water temperature (a single variable with dual temperature limitations of potentially being too warm (> 30ºC, which may limit survival of some species) or too cool (<18ºC, which may limit reproduction by some species)
2. Channel Structure 3. Aquatic Insects 4. Brown Trout impact on Native Fish
It was assumed that water temperatures that were moderate (18–30ºC) and summer flows that were sufficient to maintain connections between pools—along with relatively deep riffles to support riffle-dependent fishes and aquatic insects and to maintain connections with backwaters and the main channel—would support a variety of reproductive styles and a diverse and abundant Native Fish community. Water temperatures that were potentially too warm (induced by low flows) or too cold (restricting reproduction by warm-water taxa) would negatively affect Native Fish, especially if flow conditions were altered and either very low or very high (possible but unlikely). That would be especially true if flows were low and induced heat stress or disconnected habitat in summer for some species with specialized reproductive styles (such as plains topminnow spawns in vegetation in backwaters).
Channel Structure importantly reflects habitat diversity and subsequently the number of species and their abundance in the reach. Channel Structure was treated for Native Fish similarly as to how it was treated for Brown Trout (see above).
In terms of food resources, a high diversity of Aquatic Insect taxa that are available year-round and that are abundant would provide needed food resources for all life stages of Native Fish in all seasons. A low diversity of Aquatic Insects, even when seasonally abundant, would provide less food for Native Fish, or perhaps not enough of a certain size or life stage to support all life stages of fishes from very small larvae to large-bodied adults.
Ecological Response Model for Cache la Poudre River December 2014 City of Fort Collins 45

The ERM team also included a variable regarding the impact of Brown Trout on Native Fish because, at high abundance levels, Brown Trout can suppress diversity and abundance of Native Fish via predation. Probability values for that metric reflect that even if physical habitat conditions are good for Native Fish, a healthy Brown Trout population has the ability to suppress Native Fish to a relatively low state. Conversely, if physical habitat conditions are good and Brown Trout abundance is low, the Native Fish community (at least the elements that now remain) has a moderate to high probability of achieving a “0” or “+” state.
The respective tables relating one driving variable and outcomes for Native Fish are presented in Tables II.24–II.27.
One key driving variable is a combination of summer base flow and summer water temperature (Table II.24). To meet the summer base-flow criterion, average flow from July 1–September 30 must be greater than 35 cfs and daily flow must remain above 20 cfs. Meeting both of these criteria is designated as adequate flow in the table. Temperature data are limited, but this factor is included as a categorical variable and associated with the flow driver.
Table II.24: Summer base flow and water temperature states and the relative probabilities of achieving poor (“- -“) to good (“+”) Native Fish populations in the Poudre River upstream and downstream of College Avenue bridge.
Flow and temperature states Native Fish states
-- - 0 + Adequate flow and water temperatures (18–30ºC) 0 0.15 0.15 0.7 Adequate flow and inadequate water temperatures (< 18ºC or > 30ºC) 0 0.25 0.5 0.25 Inadequate flow and adequate water temperatures (18–30ºC) 0.25 0.5 0.25 0 Inadequate flow and inadequate water temperatures (< 18ºC or > 30ºC) 0.7 0.15 0.15 0
Channel Structure is impacted by high flows and bank stabilization, and the effects of the different types of Channel Structure on Native Fish were estimated (Table II.25). More detail on Channel Structure is presented above in the Brown Trout section.
Table II.25: Channel Structure states and the relative probabilities of achieving poor (“- -“) to good (“+”) Native Fish populations in the Poudre River upstream and downstream of College Avenue bridge.
Channel Structure states Native Fish states
-- - 0 + Clean and diverse 0 0 0.25 0.75 Partially mobile and diverse 0 0.5 0.25 0.25 Largely immobile and homogeneous 0.25 0.5 0.25 0 Entrenched 0.75 0.25 0 0
For the driving variable of Aquatic Insect populations at the whole-reach scale, Table II.26 shows the estimated response of Native Fish to different levels of Aquatic Insect biomass and diversity. (More detail on Aquatic Insect modeling is provided above.)
Ecological Response Model for Cache la Poudre River December 2014 City of Fort Collins 46
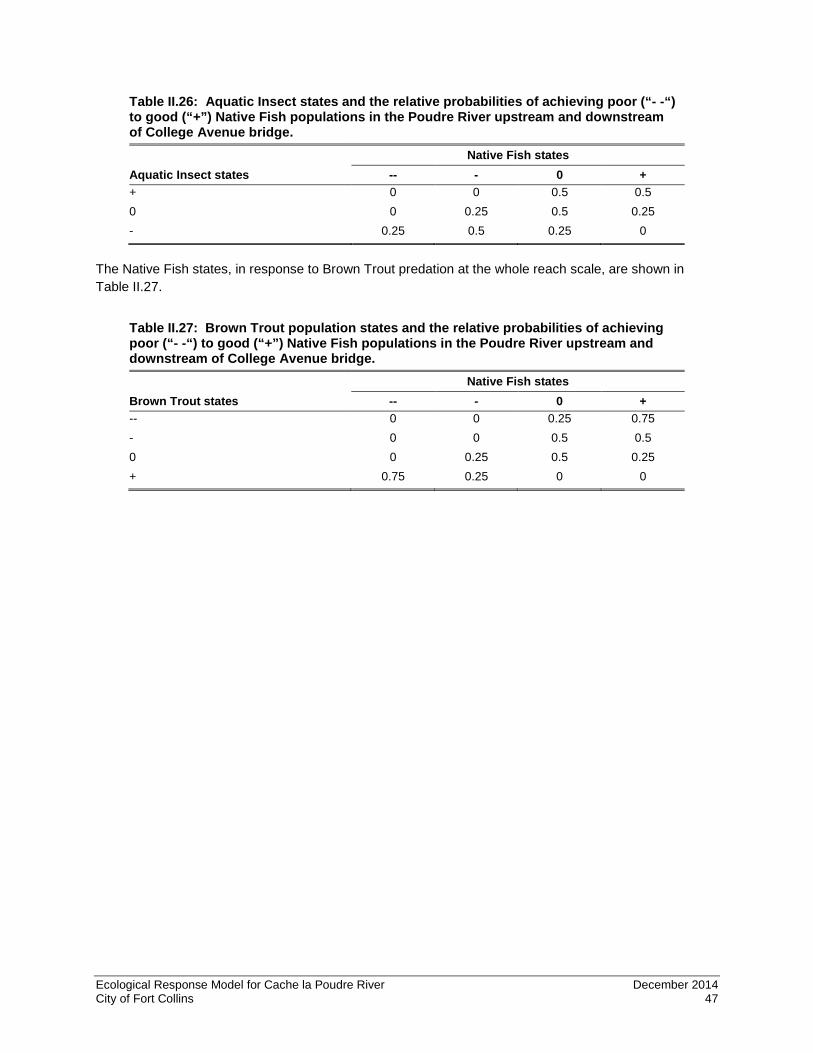
Table II.26: Aquatic Insect states and the relative probabilities of achieving poor (“- -“) to good (“+”) Native Fish populations in the Poudre River upstream and downstream of College Avenue bridge.
Aquatic Insect states Native Fish states
-- - 0 + + 0 0 0.5 0.5 0 0 0.25 0.5 0.25 - 0.25 0.5 0.25 0
The Native Fish states, in response to Brown Trout predation at the whole reach scale, are shown in Table II.27.
Table II.27: Brown Trout population states and the relative probabilities of achieving poor (“- -“) to good (“+”) Native Fish populations in the Poudre River upstream and downstream of College Avenue bridge.
Brown Trout states Native Fish states
-- - 0 + -- 0 0 0.25 0.75 - 0 0 0.5 0.5 0 0 0.25 0.5 0.25 + 0.75 0.25 0 0
Ecological Response Model for Cache la Poudre River December 2014 City of Fort Collins 47
RIPARIAN VEGETATION – REJUVENATING MOSAIC, FUNCTIONAL RIPARIAN ZONE AND RIVERINE WETLANDS This focus of the ERM was led by and is reported on by the following experts:
• Gregor Auble, Ph.D., Riparian Ecologist, United States Geological Survey • David Merritt, Ph.D., Riparian Ecologist, United States Forest Service
Background The riparian zone is the portion of stream channel occurring between the low and high water marks and the adjacent terrestrial areas extending from the high water mark toward the uplands where vegetation may be influenced by elevated water tables or flooding. The riparian zone is an integral part of the overall river system in a number of important respects. Occasional inundation of this area:
1. Expands the physical habitat and food resources available to aquatic organisms 2. Enables transport and exchange of water-borne materials including sediment, nutrients,
propagules, and contaminants 3. Influences the pattern of streamflow by storing and slowing water
In turn, the moisture and physical disturbance provided by the river produce terrestrial flora and fauna that are generally distinct from those in surrounding uplands.
Streamflow acting on the bottomland topography governs the characteristics and composition of these riparian zones and the nature of riparian vegetation. Species composition of vegetation varies across a gradient, from locations near the channel that are inundated for a long duration each growing season and subjected to intense physical disturbance, to locations further from the channel that are less frequently and intensely flooded. Plants growing along river margins typically have adaptations to flooding, scour, occasional burial, submergence, and seasonally varying water availability (Lytle and Poff, 2004).
The riparian portion of the Poudre River system in Fort Collins is set in an alluvial fan associated with the change from a steep canyon setting to the lower gradient plains. A number of physical variables change rapidly in the upstream-downstream direction with implications for the behavior of the riparian system. The change in gradient produces an unstable geomorphic setting that is naturally prone to channel movement. The steep gradients of temperature and elevation encompass the edges of distributional ranges for some species. One example is cottonwood. Narrow-leaved cottonwood (Populus angustifolia) occurs in the higher-elevation, cooler Poudre Canyon, shifting to plains cottonwood (Populus deltoidies) downstream in the lower-elevation, warmer plains. This transition occurs within Fort Collins with sites near the canyon mouth dominated by narrow-leaved cottonwood, which can exhibit substantial vegetative reproduction, and sites on the eastern edge of Fort Collins dominated by plains cottonwood, which is almost exclusively dependent on regeneration from seed.
The Poudre River riparian system in Fort Collins is heavily modified in several fundamental ways. Streamflow has been altered substantially. Topography and bank stability have been altered to restrict the extent of inundation and lateral channel movement. In combination with clearing and land development, this has narrowed the functional riparian zone (Figures II.7 and II.8). Furthermore, beaver are likely having a much smaller role in enhancing channel complexity today than in the 1800s. The combination of gravel mining, water conveyance and storage, and applied water (irrigation) has made the uplands adjacent to the river wetter. This tends to blur the vegetative transition, or boundary between riparian and upland, by allowing plants that might otherwise be restricted to a riparian zone (where
Ecological Response Model for Cache la Poudre River December 2014 City of Fort Collins 48

supplemental river moisture was available) to extend farther into the surrounding uplands. Finally, the species pool has changed dramatically in the last 150 years. For example, introduced species such as crack willow (Salix fragilis), Siberian elm (Ulmus pumila), Russian-olive (Elaeagnus angustifolia), and saltcedar (Tamarix ramosissima) are now important components of the woody riparian communities in Fort Collins and generally throughout the western U.S. (Friedman et al., 2005).
Figure II.7: Area between Overland Trail and Taft Hill roads in 1937. Note: In this image, a wide zone of channel movement and cottonwood forests of various ages that have established along the former paths of the river may be seen.
Figure II.8: This shows the same area as Figure II.3 after a century of land use changes (including extensive gravel mining). Note: In combination with bank stabilization, these land use and topographic changes have confined and simplified the channel, reduced channel migration and the associated rejuvenation of plant species (such as plains cottonwood) that require bare, moist sites for establishment. This transition to an urban geomorphology has effectively narrowed the riparian zone and mediates the biological responses to Poudre River streamflows.
Ecological Response Model for Cache la Poudre River December 2014 City of Fort Collins 49

Methods and Probability Tables
Approach A number of procedures have been developed for quantifying relationships between streamflow and the distribution and abundance of riparian vegetation (Merritt et al., 2010). Many of these involve the following basic steps.
1. Estimate how streamflow determines physical conditions throughout the bottomland 2. Relate physical conditions to riparian vegetation through the use of modeling, empirical data, and
expert judgment 3. Project the likely physical conditions (duration of inundation) at various locations associated with
alternative streamflow regimes 4. Estimate new riparian vegetation from projected physical attributes (reflecting different future flow
scenarios)
The ERM team implemented the steps listed above using existing data (from aforementioned sources) to produce three Bayesian network indicators:
1. Rejuvenating Mosaic, an index of the potential for floodplain turnover and creation of new bare, moist sites
2. Functional Riparian Zone, an indicator of the area providing general riparian functions 3. Riverine Wetlands, an indicator of riverine wetland area (width) based on surface water
inundation from the river
Finally, a set of more-detailed geospatial probability of occurrence models were established for selected individual plant species and riparian guilds.
Data The City of Fort Collins Natural Areas Department sampled riparian vegetation along the Poudre River along 55 transects in 2009 (Shanahan, 2009). The City provided a digital elevation model (DEM) for the Poudre River corridor in the form of a Triangulated Irregular Network (TIN) of elevations (±1 m). It also used a linear coverage of known riprap and hardened levee locations (J. Shanahan, 2011, pers. comm.). An ArcGIS shapefile of cross-sectional data and a HEC-RAS (1-dimensional hydraulic) model of the Poudre River were obtained from Anderson Consulting Engineers (USACE, 2008; Brad Anderson, 2011, pers. comm.). The HEC-RAS hydraulic model was used for the Poudre River from the town of Laporte to slightly downstream of Interstate 25. Finally, a flow partitioning algorithm was used to relate measured or predicted flows at gage locations to the pattern of flows in reaches of the river as influenced by locations of water withdrawals and accretions (Andy Pineda, 2012, pers. comm.).
Relationship of Streamflow to Physical Conditions in the Bottomland From the elevational TIN data, the ERM team first created an ArcGIS grid coverage of the Poudre River bottomland from the town of Laporte to slightly below Interstate 25. It then created a channel center line of the main channel and, as described in the Overview subsection, subdivided the total area into eight reaches based on a combination of geomorphic characteristics (e.g., degree of confinement) and known flow changes due to major diversion structures.
The hydraulic model was run at a series of discharges: 200, 300, 400, 500, 600, 700, 800, 900, 1,000, 1,500, 2,000, 2,500, 3,000, 3,500, 4,000, 4,500, 5,000, 5,500, 6,000, 6,500, and 7,000 cfs. Water-surface
Ecological Response Model for Cache la Poudre River December 2014 City of Fort Collins 50

elevations were obtained for each discharge for all the grid cells within the study area by natural neighbor interpolation between the spatially referenced hydraulic cross sections. Within the limitations of accuracy and the discrete cells and given discharges, these calculations provide an estimate of the stream discharge required to inundate each cell (water surface at or higher than ground elevation) as well as the aggregate area inundated by various discharges. These calculations were then used to provide an estimate of the pattern of inundation associated with a given flow regime at the scales of both individual geospatial cells and aggregated areas along different reaches.
The riparian study area was restricted to cells above the river stage at 200 cfs (excluding the channel itself, where bathymetry was unavailable) and below the 7,000 cfs flow line. The area above 7,000 cfs was excluded because it was very rarely inundated, and it contained a large fraction of fully-developed land. Cells that were in strongly anthropogenic cover types (such as structures, parking lots, and roads) were also excluded, as were areas where inundation was not dominated by the river (such as permanent ponds created by gravel mining). Further details of these calculations are given in Appendix B.
Rejuvenating Mosaic Condition Many riparian species do well near the river because they have adaptations, tolerances, or requirements for a moist, moveable, and frequently disturbed environment. These communities and species tend to decline in the absence of disturbances, channel movement, and periodic turnover of near channel substrates. The clearest example of this in Fort Collins is plains cottonwood, whose regeneration from seed is highly dependent upon new bare, moist disturbance patches (Mahoney and Rood, 1998; Scott and Auble, 2002; Rood et al., 2007). Once established, plains cottonwood trees can survive well in the absence of disturbance, but are very unlikely to be replaced in undisturbed locations by subsequent generations of plains cottonwood.
Floodplain turnover creates new disturbance patches for the rejuvenation of riparian forests, but can also have deleterious effects on human infrastructure. Floodplain turnover and channel movement tend to be episodic and are difficult to predict. There is a strong temptation to avoid considering floodplain turnover or channel migration at all, because that is difficult to do with confidence. However, this reluctance needs to be balanced against the limitations of any analysis that ignores what is known to be a critical driving variable. Some of the primary controlling factors of floodplain turnover are topographic constraints that define the low-lying area of most likely channel movement, the ability of the river to mobilize and transport sediment, and the natural and human-hardened resistance of the banks and sediment to mobilization. The Rejuvenating Mosaic variable combines these factors as an index to the relative potential for a rejuvenating riparian mosaic. The result is an index of relative potential, rather than a prediction of the extent, timing, or location of channel change.
The Rejuvenating Mosaic index is calculated as the product of:
a. area (expressed as average width) of potential floodplain turnover (low-lying, occasionally flooded area where movement is most likely)
b. the ability of the flow regime to mobilize substrate based on shear stresses associated with a flow regime
c. a fractional reduction due to extent of bank stabilization
The area of potential floodplain turnover is estimated using maximum daily flows (partial duration series of all days in the years), excluding area below the 200 cfs flow line (corresponding to the upper edge of the primarily aquatic zone). These areas, and corresponding average widths, are calculated using
Ecological Response Model for Cache la Poudre River December 2014 City of Fort Collins 51
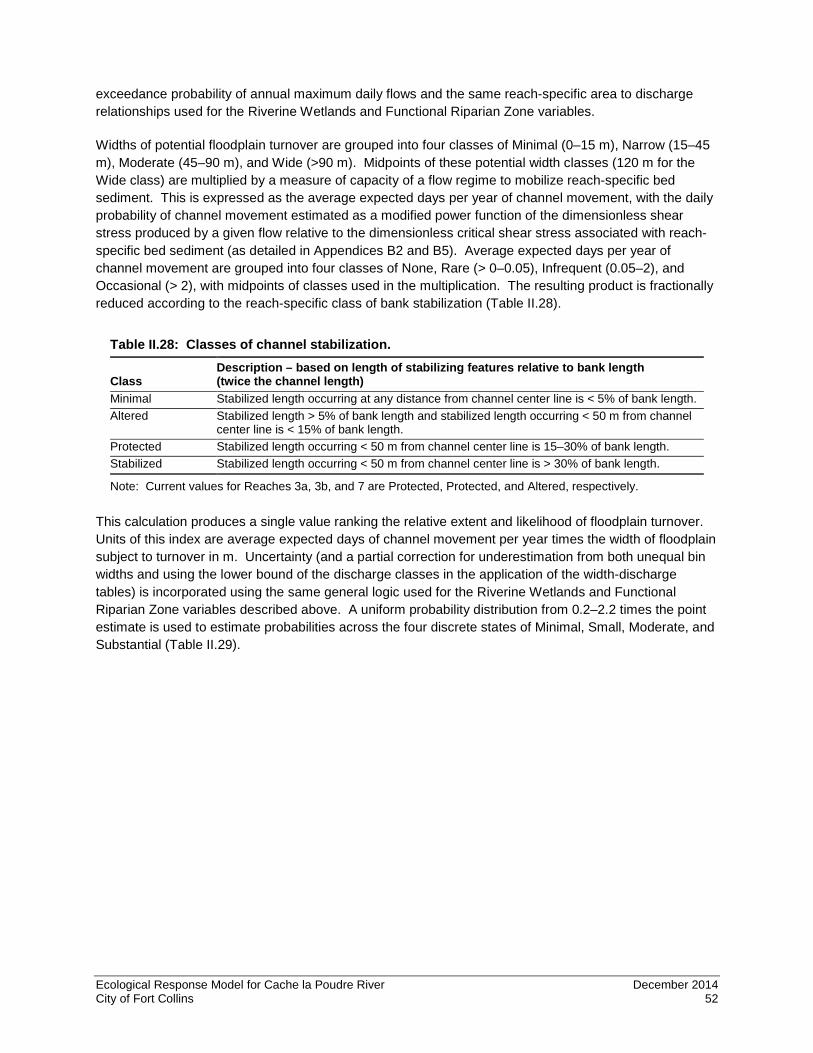
exceedance probability of annual maximum daily flows and the same reach-specific area to discharge relationships used for the Riverine Wetlands and Functional Riparian Zone variables.
Widths of potential floodplain turnover are grouped into four classes of Minimal (0–15 m), Narrow (15–45 m), Moderate (45–90 m), and Wide (>90 m). Midpoints of these potential width classes (120 m for the Wide class) are multiplied by a measure of capacity of a flow regime to mobilize reach-specific bed sediment. This is expressed as the average expected days per year of channel movement, with the daily probability of channel movement estimated as a modified power function of the dimensionless shear stress produced by a given flow relative to the dimensionless critical shear stress associated with reach-specific bed sediment (as detailed in Appendices B2 and B5). Average expected days per year of channel movement are grouped into four classes of None, Rare (> 0–0.05), Infrequent (0.05–2), and Occasional (> 2), with midpoints of classes used in the multiplication. The resulting product is fractionally reduced according to the reach-specific class of bank stabilization (Table II.28).
Table II.28: Classes of channel stabilization.
Class Description – based on length of stabilizing features relative to bank length (twice the channel length)
Minimal Stabilized length occurring at any distance from channel center line is < 5% of bank length. Altered Stabilized length > 5% of bank length and stabilized length occurring < 50 m from channel
center line is < 15% of bank length. Protected Stabilized length occurring < 50 m from channel center line is 15–30% of bank length. Stabilized Stabilized length occurring < 50 m from channel center line is > 30% of bank length.
Note: Current values for Reaches 3a, 3b, and 7 are Protected, Protected, and Altered, respectively.
This calculation produces a single value ranking the relative extent and likelihood of floodplain turnover. Units of this index are average expected days of channel movement per year times the width of floodplain subject to turnover in m. Uncertainty (and a partial correction for underestimation from both unequal bin widths and using the lower bound of the discharge classes in the application of the width-discharge tables) is incorporated using the same general logic used for the Riverine Wetlands and Functional Riparian Zone variables described above. A uniform probability distribution from 0.2–2.2 times the point estimate is used to estimate probabilities across the four discrete states of Minimal, Small, Moderate, and Substantial (Table II.29).
Ecological Response Model for Cache la Poudre River December 2014 City of Fort Collins 52
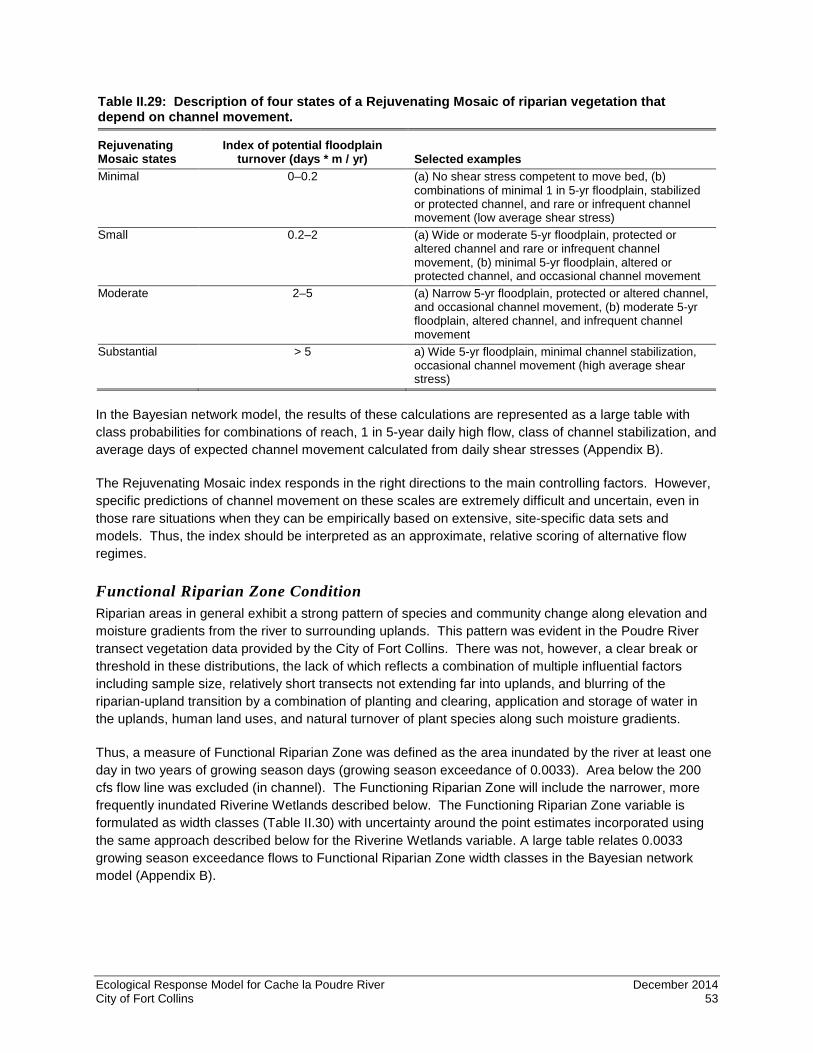
Table II.29: Description of four states of a Rejuvenating Mosaic of riparian vegetation that depend on channel movement.
Rejuvenating Mosaic states
Index of potential floodplain turnover (days * m / yr) Selected examples
Minimal 0–0.2 (a) No shear stress competent to move bed, (b) combinations of minimal 1 in 5-yr floodplain, stabilized or protected channel, and rare or infrequent channel movement (low average shear stress)
Small 0.2–2 (a) Wide or moderate 5-yr floodplain, protected or altered channel and rare or infrequent channel movement, (b) minimal 5-yr floodplain, altered or protected channel, and occasional channel movement
Moderate 2–5 (a) Narrow 5-yr floodplain, protected or altered channel, and occasional channel movement, (b) moderate 5-yr floodplain, altered channel, and infrequent channel movement
Substantial > 5 a) Wide 5-yr floodplain, minimal channel stabilization, occasional channel movement (high average shear stress)
In the Bayesian network model, the results of these calculations are represented as a large table with class probabilities for combinations of reach, 1 in 5-year daily high flow, class of channel stabilization, and average days of expected channel movement calculated from daily shear stresses (Appendix B).
The Rejuvenating Mosaic index responds in the right directions to the main controlling factors. However, specific predictions of channel movement on these scales are extremely difficult and uncertain, even in those rare situations when they can be empirically based on extensive, site-specific data sets and models. Thus, the index should be interpreted as an approximate, relative scoring of alternative flow regimes.
Functional Riparian Zone Condition Riparian areas in general exhibit a strong pattern of species and community change along elevation and moisture gradients from the river to surrounding uplands. This pattern was evident in the Poudre River transect vegetation data provided by the City of Fort Collins. There was not, however, a clear break or threshold in these distributions, the lack of which reflects a combination of multiple influential factors including sample size, relatively short transects not extending far into uplands, and blurring of the riparian-upland transition by a combination of planting and clearing, application and storage of water in the uplands, human land uses, and natural turnover of plant species along such moisture gradients.
Thus, a measure of Functional Riparian Zone was defined as the area inundated by the river at least one day in two years of growing season days (growing season exceedance of 0.0033). Area below the 200 cfs flow line was excluded (in channel). The Functioning Riparian Zone will include the narrower, more frequently inundated Riverine Wetlands described below. The Functioning Riparian Zone variable is formulated as width classes (Table II.30) with uncertainty around the point estimates incorporated using the same approach described below for the Riverine Wetlands variable. A large table relates 0.0033 growing season exceedance flows to Functional Riparian Zone width classes in the Bayesian network model (Appendix B).
Ecological Response Model for Cache la Poudre River December 2014 City of Fort Collins 53

Table II.30: Description of four states of width that depend on inundation by the river at least one day in the two years of growing season days.
Functional Riparian Ecosystem states Average width in m
(total area / channel length) Minimal < 15 Narrow 15–45 Moderate 45–90 Wide > 90
Note: Widths include both sides of the channel and represent total area divided by channel length.
Data from the vegetation transect plots did indicate a significant difference in plant species composition above (drier) compared to below (wetter) the stage of the 0.0033 exceedance flow (ANOSIM, p = 0.004). However, the Functional Riparian Ecosystem variable is not focused on specific and abrupt vegetation differences. Rather it is intended to provide an index of the area of connected floodplain that occasionally provides functions such as organic matter exchange, sediment trapping, nutrient and contaminant processing, expansion of aquatic habitat, and flood peak attenuation.
Riverine Wetlands Condition This Bayesian network indicator estimates the area where inundation from the river is sufficient to support plant communities dominated by species that tend to occur in wetlands. The variable represents the average width of this zone (total area in a reach divided by length of channel in a reach) summarized in four width classes (Table II.31). Because they are defined as total area divided by length, the states include area on either side of the channel (for example, 5 m on one side and 15 m on the other side would be a width of 20 m, classified as Moderate).
Table II.31: Description of four states of Riverine Wetlands extent that depend on inundation for 5% of the growing season.
Riparian Wetlands states Average width in m
(total area / channel length) Minimal < 5 Narrow 5–15 Moderate 15–30 Wide > 30
Note: Widths include both sides of channel and represent total area divided by channel length.
The upper, higher elevation edge of this zone is defined as land that is inundated 5% of the growing season. Current regulatory procedures (Environmental Laboratory, 1987–201, online version) for the wetland hydrology criterion specify continuous inundation or saturation for at least 5% of the growing season in most (50%) years. The Natural Research Council (NRC, 1995) recommended a hydrology threshold of two growing season weeks of soil saturation (to within 0.3 m of surface) at least every other year (an overall frequency of approximately 0.05 of May–September days) for supporting hydrophytes. The ERM includes a threshold value of 0.05 of all growing season (May–September) days of surface inundation. This hydrologic threshold of 0.05 of growing season days closely corresponds to the flow exceedance value associated with a 50% (prevalence) probability of occurrence of the hydrophytic vegetation guild from the field data and geospatial probability of occurrence modeling (Figure II.9 and Appendix B5). The lower (streamward) edge of the Riverine Wetlands zone was assumed to be the 200-cfs flow line. Ecological Response Model for Cache la Poudre River December 2014 City of Fort Collins 54
Calculation of this indicator begins with the discharge that is equal to or exceeds the 0.05 fraction of the growing season in a given flow scenario and reach. This value is used to access area-discharge relationships that summarize the area, and corresponding average width, inundated by different discharges as determined by hydraulic model output. Flows intermediate between the discrete discharges used in the hydraulic model are assigned the width at the lower end of the range. This point estimate of width is unreasonably precise and somewhat biased to underrepresent the width by using the width associated with the lower end of each flow range. Thus, each point estimate of width (w) was expanded to a width range of 0.6w to 1.6w (addressing both uncertainty in the exact value and bias toward lower values). This range of widths was then converted to probabilities for the discrete width classes (Table II.24) by assuming a uniform probability across the range and considering how much of the range fell within different width classes. The results of these calculations are represented in the Bayesian network model as a table discretely relating 0.05 growing season exceedance flows to width class probabilities for each reach. The portions of this table corresponding to the focal Reaches 3a, 3b, and 7 are presented in Appendix B5 (Table B.12).
Geospatial Probabilities of Occurrence In addition to the three riparian indicators used in the Bayesian network model, the same underlying formulation of the relationship between streamflow and physical conditions in the bottomland—streamflow sequence apportioned across reaches, hydraulic model of water surfaces across discharges, and topography—was used to model probabilities of occurrence of select plant species and species groups (Appendix B). The resulting models are computationally intensive and geographically detailed, and thus not directly incorporated into the ERM. Rather, they represent an alternative and corroborating formulation of the relationship between streamflow regime and riparian vegetation response.
In order to calibrate probability of occurrence models, global positioning system (GPS) coordinates of the vegetation transects and the spacing of plots along those transects was used to determine geospatial coordinates of vegetation plots sampled in 2009. Their location on the grid coverage allowed an estimate of their elevation and inundating discharge from detailed digital elevation models. Their location in a specific reach, in combination with the flow partitioning algorithm applied to the historic flow record, produced a history of inundation at each of these plots. Fitting observed occurrence associated with historic inundation at the sampled plots yielded response curves (logistic regression models) relating probability of occurrence to a given inundation duration. As illustrated in Appendix B (Subsection B5), these curves could then be used to project probabilities of occurrence throughout the study area from the patterns of inundation associated with an alternative flow scenario for every grid cell across the area of interest. To project change in response to various future water scenarios, the ERM team then predicted probability of occurrence of several cover types as a function of exceedance probability, determined the number of grid cells with probabilities of occurrence of 60% or higher, and then calculated the areas of high probability occurrence.
Figure II.9 shows the model-predicting probability of occurrence of a hydrophytic vegetation guild as a function of growing season inundation. Prevalence of hydrophytic vegetation is a wetland delineation criterion that should correspond to the hydrologic criterion used in the Riverine Wetlands indicator. The model fit to Poudre River data (Figure II.9) predicts a 50% probability of occurrence of hydrophytic vegetation very near the 0.05 growing season inundation value, providing strong corroboration of the simpler Bayesian network indicator. More detailed descriptions and results from these probability-of-occurrence models are presented in Appendix B (Subsection B5).
Ecological Response Model for Cache la Poudre River December 2014 City of Fort Collins 55

Figure II.9. Probability of herbaceous hydrophytic species guild as a function of inundation fit to 2009 Poudre River riparian plot data using logistic regression. Note: Exceedance probability is fraction of growing season that the plot is inundated (higher values are wetter). Circles are individual plots where presence=1 or absence=0. Shaded zone is the 95% confidence interval. The dashed vertical line is the 0.05 exceedance value used for the Riverine Wetlands indicator.
Ecological Response Model for Cache la Poudre River December 2014 City of Fort Collins 56

SUMMARY OF COMPONENTS ANALYSES The ERM was modelled to represent the multi-dimensional character for the modern, urban Poudre river landscape. Table II.32 provides an at-a-glance summary for all the analyses conducted for model components to assist in understanding this project.
Table II.32: Summary of analytical approach and data availability for each model component. Model component Analytical approaches Availability of data for each reach Channel Structure Hydraulic modeling of reach-specific shear
stresses and sediment mobility, effective discharge analysis, and historical analysis of aerial images.
Channel geometry, sediment size distributions, and hydrologic data available for all three reaches (3a, 3b, and 7).
Algae and Nutrients Algae based upon estimates and observations. Nutrients concentrations converted to probabilities of annual loading.
Algae; no data Nutrients; Reaches 3a and 3b have single nutrient data source (Lincoln Street gage) Boxelder gage provided data for Reach 7
Aquatic Insects Percent EPT (percent sensitive species). Available for all three reaches. Fish - Brown Trout Compared abundance of young trout to
important flow parameters, including those during reproductive periods. Categorized data that showed a positive relationship between young trout abundance and flow the previous winter.
Reaches 3a and 3b treated together with data from site near McMurray Natural Area/Martinez Park. Reach 7 used data from Environmental Learning Center (ELC).
Fish –Native Species Explored relationships between mean, peak, and base flow levels to fish species richness, abundance, and biomass. Trends and spatial patterns observed were weak so species habitat use patterns and expert judgment were used to hypothesize population responses to flow and management actions.
Reaches 3a and 3b treated together with data from site near McMurray Natural Area/Martinez Park. Reach 7 data provided from samples at ELC.
Riparian Vegetation - Rejuvenating Mosaic
Potential zone of movement reduced by shear stress and extent of bank stabilization.
Hydraulic, topographic, and channel stabilization data available for entire study area. Little empirical data on actual rates of channel movement.
Riparian Vegetation - Functioning Riparian Zone
Area inundated by the river at least one day out of every two growing seasons and supported by a significant difference in plant species composition above (drier) compared to below (wetter) that elevation
Hydraulic, topographic, and vegetation transect plot data available for entire study area.
Riparian Vegetation - Riparian Wetlands
Threshold based in inundation duration during growing season corroborated by probability of occurrence of hydrophytic (water loving) vegetation guild.
Hydraulic, topographic, and vegetation transect plot data available for entire study area.
Ecological Response Model for Cache la Poudre River December 2014 City of Fort Collins 57

SECTION III: RESULTS AND DISCUSSION
OVERVIEW Section III describes the estimated ecological response to each hydrology scenario and examines differences among flow scenarios for each of the three reaches studied through the ERM. As discussed in Section II, each indicator was scaled on a spectrum from higher functioning condition to most degraded condition. The results presented in this section are appropriately interpreted in comparative terms. The relative differences for indicators across scenarios and reaches, and the patterns of indicator responses, are considered more important than the absolute value of any indicator in isolation.
Section III provides indicator results for all nine hydrological scenarios (five core and four test) over the three river reaches (Figures III.1–III.8). Graphical results are preceded by state definition tables (as reproduced from Section II) along with explanations that link back to the Bayesian model structure to facilitate interpretation of the figures.
Next, the same complete set of results is presented as a single expected value (the mean of the full probability distribution) in Figures III.9-III.12.
BAYESIAN MODEL RESULTS The following series of graphs and figures demonstrates the ERM results for each indicator, along with a discussion of their relative relevance.
Channel Structure Results Table III.1 is presented below (as reproduced from Section II: Channel Structure) as a useful reference for interpreting the results for Channel Structure that follow.
Table III.1: Description of four states of Channel Structure that depend on the combined status of flushing flows, coarse substrate mobilization, channel migration flows, and extent of armoring. State Description
Clean and diverse Flushing and bed mobility flow functions intact, substrate clean on surface, interstitial space open, vegetation encroachment not advancing, channel has wide variety of depth, velocity, substrate combinations with morphologically diverse features such as side channels, chutes, bars owing to substantial removal of lateral armoring.
Partially mobile and diverse All three flow functions at least partially intact, flushing occurs at least every few years, interstitial space open in high-stress zones such as riffles, vegetation encroachment slowly advancing in low-stress zones, habitat diversity flows may be intact but lateral armoring partially limiting channel complexity.
Largely immobile and homogeneous
Bed mobilization and/or channel migration flows not intact, flushing partially or not intact, vegetation encroachment likely advancing, river increasingly canal-like with homogeneous habitat until partially reset by an extreme event that overcomes riprap armoring in isolated locations, substrate flushing at least partially intact, habitat diversity flows could be intact but lateral armor present
Entrenched Partial to no substrate cleaning, channel maintenance absent, interstitial space not opened > 3–5 years, extensive lateral armoring, canal-like homogeneous channel.
Ecological Response Model for Cache la Poudre River December 2014 City of Fort Collins 58
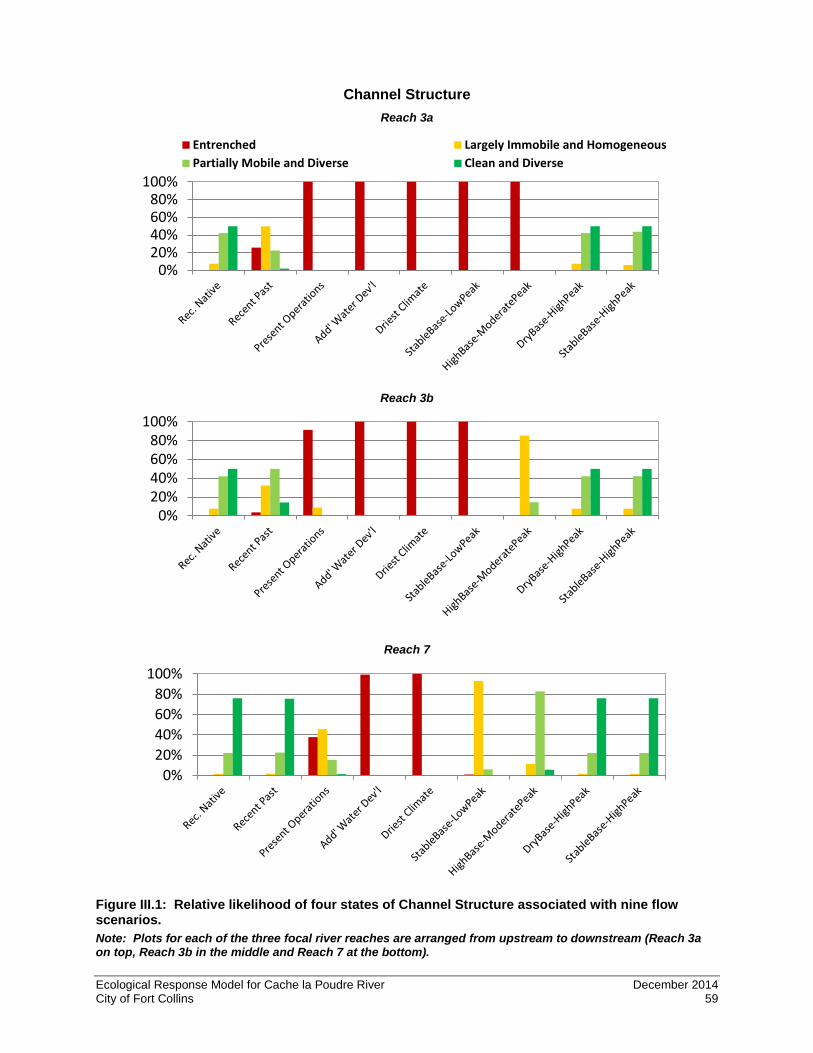
Channel Structure Reach 3a
Reach 3b
Reach 7
Figure III.1: Relative likelihood of four states of Channel Structure associated with nine flow scenarios. Note: Plots for each of the three focal river reaches are arranged from upstream to downstream (Reach 3a on top, Reach 3b in the middle and Reach 7 at the bottom).
0%20%40%60%80%
100%
Entrenched Largely Immobile and HomogeneousPartially Mobile and Diverse Clean and Diverse
0%20%40%60%80%
100%
0%20%40%60%80%
100%
Ecological Response Model for Cache la Poudre River December 2014 City of Fort Collins 59
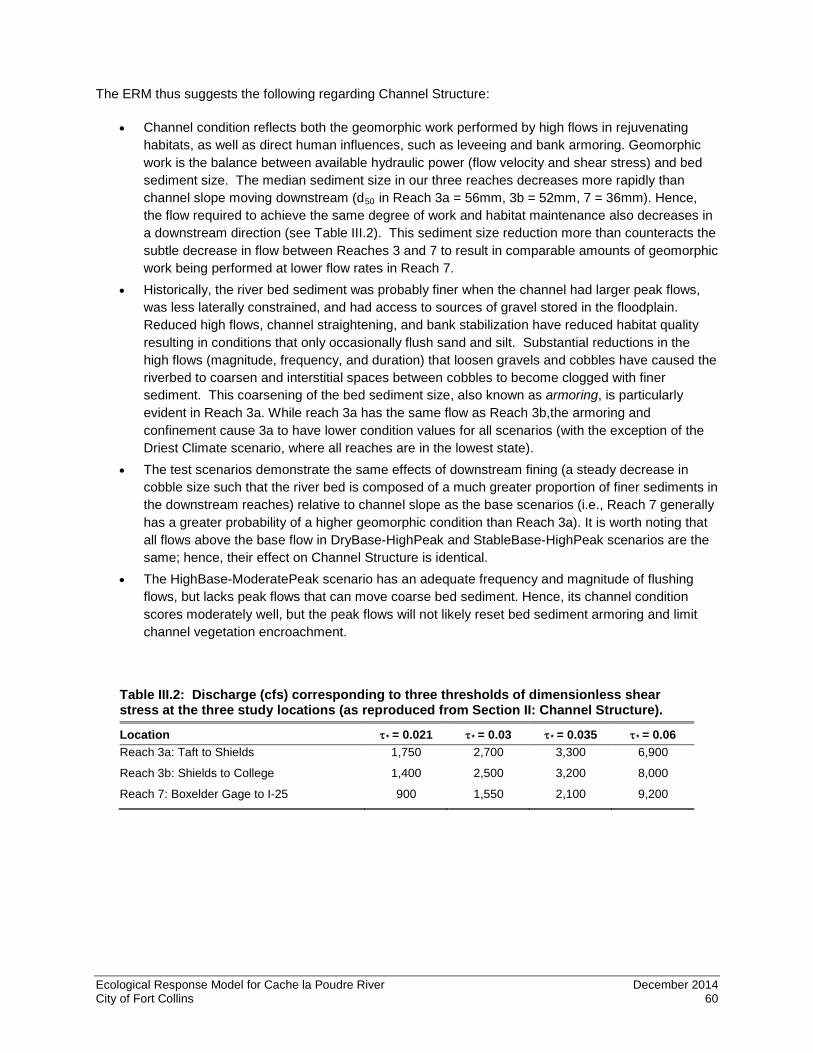
The ERM thus suggests the following regarding Channel Structure:
• Channel condition reflects both the geomorphic work performed by high flows in rejuvenating habitats, as well as direct human influences, such as leveeing and bank armoring. Geomorphic work is the balance between available hydraulic power (flow velocity and shear stress) and bed sediment size. The median sediment size in our three reaches decreases more rapidly than channel slope moving downstream (d50 in Reach 3a = 56mm, 3b = 52mm, 7 = 36mm). Hence, the flow required to achieve the same degree of work and habitat maintenance also decreases in a downstream direction (see Table III.2). This sediment size reduction more than counteracts the subtle decrease in flow between Reaches 3 and 7 to result in comparable amounts of geomorphic work being performed at lower flow rates in Reach 7.
• Historically, the river bed sediment was probably finer when the channel had larger peak flows, was less laterally constrained, and had access to sources of gravel stored in the floodplain. Reduced high flows, channel straightening, and bank stabilization have reduced habitat quality resulting in conditions that only occasionally flush sand and silt. Substantial reductions in the high flows (magnitude, frequency, and duration) that loosen gravels and cobbles have caused the riverbed to coarsen and interstitial spaces between cobbles to become clogged with finer sediment. This coarsening of the bed sediment size, also known as armoring, is particularly evident in Reach 3a. While reach 3a has the same flow as Reach 3b,the armoring and confinement cause 3a to have lower condition values for all scenarios (with the exception of the Driest Climate scenario, where all reaches are in the lowest state).
• The test scenarios demonstrate the same effects of downstream fining (a steady decrease in cobble size such that the river bed is composed of a much greater proportion of finer sediments in the downstream reaches) relative to channel slope as the base scenarios (i.e., Reach 7 generally has a greater probability of a higher geomorphic condition than Reach 3a). It is worth noting that all flows above the base flow in DryBase-HighPeak and StableBase-HighPeak scenarios are the same; hence, their effect on Channel Structure is identical.
• The HighBase-ModeratePeak scenario has an adequate frequency and magnitude of flushing flows, but lacks peak flows that can move coarse bed sediment. Hence, its channel condition scores moderately well, but the peak flows will not likely reset bed sediment armoring and limit channel vegetation encroachment.
Table III.2: Discharge (cfs) corresponding to three thresholds of dimensionless shear stress at the three study locations (as reproduced from Section II: Channel Structure).
Location τ* = 0.021 τ* = 0.03 τ* = 0.035 τ* = 0.06 Reach 3a: Taft to Shields 1,750 2,700 3,300 6,900
Reach 3b: Shields to College 1,400 2,500 3,200 8,000
Reach 7: Boxelder Gage to I-25 900 1,550 2,100 9,200
Ecological Response Model for Cache la Poudre River December 2014 City of Fort Collins 60
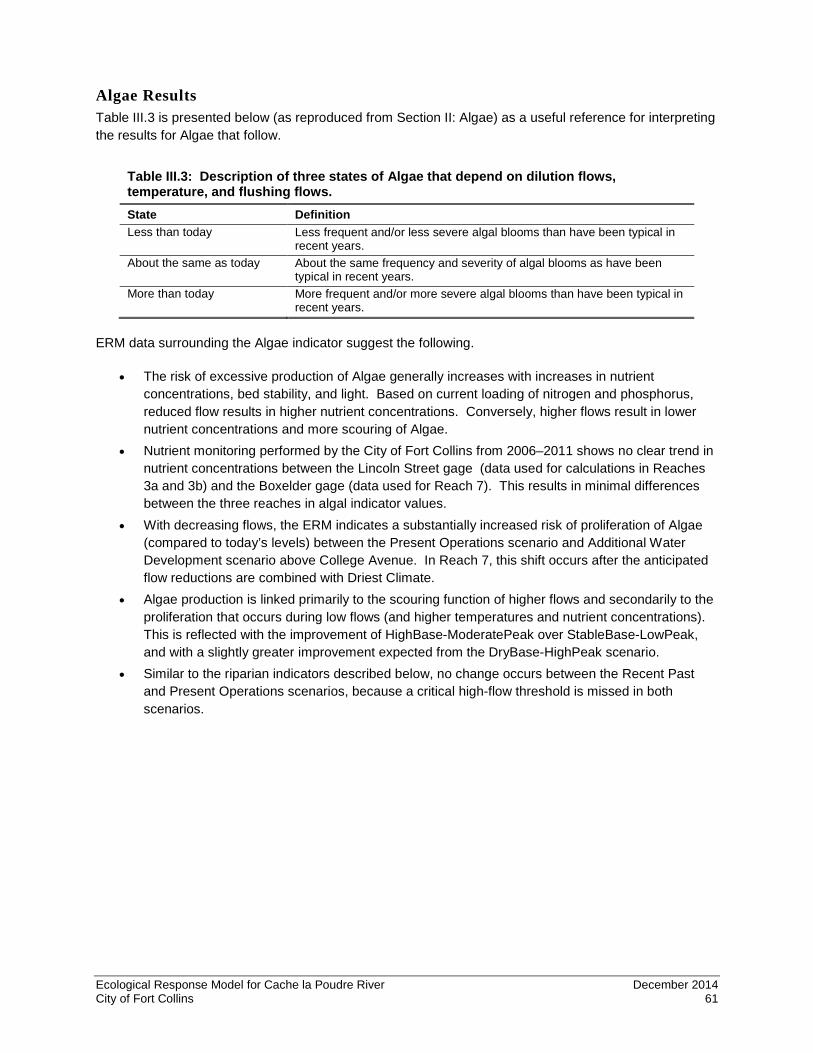
Algae Results Table III.3 is presented below (as reproduced from Section II: Algae) as a useful reference for interpreting the results for Algae that follow.
Table III.3: Description of three states of Algae that depend on dilution flows, temperature, and flushing flows. State Definition Less than today Less frequent and/or less severe algal blooms than have been typical in
recent years. About the same as today About the same frequency and severity of algal blooms as have been
typical in recent years. More than today More frequent and/or more severe algal blooms than have been typical in
recent years.
ERM data surrounding the Algae indicator suggest the following.
• The risk of excessive production of Algae generally increases with increases in nutrient concentrations, bed stability, and light. Based on current loading of nitrogen and phosphorus, reduced flow results in higher nutrient concentrations. Conversely, higher flows result in lower nutrient concentrations and more scouring of Algae.
• Nutrient monitoring performed by the City of Fort Collins from 2006–2011 shows no clear trend in nutrient concentrations between the Lincoln Street gage (data used for calculations in Reaches 3a and 3b) and the Boxelder gage (data used for Reach 7). This results in minimal differences between the three reaches in algal indicator values.
• With decreasing flows, the ERM indicates a substantially increased risk of proliferation of Algae (compared to today’s levels) between the Present Operations scenario and Additional Water Development scenario above College Avenue. In Reach 7, this shift occurs after the anticipated flow reductions are combined with Driest Climate.
• Algae production is linked primarily to the scouring function of higher flows and secondarily to the proliferation that occurs during low flows (and higher temperatures and nutrient concentrations). This is reflected with the improvement of HighBase-ModeratePeak over StableBase-LowPeak, and with a slightly greater improvement expected from the DryBase-HighPeak scenario.
• Similar to the riparian indicators described below, no change occurs between the Recent Past and Present Operations scenarios, because a critical high-flow threshold is missed in both scenarios.
Ecological Response Model for Cache la Poudre River December 2014 City of Fort Collins 61
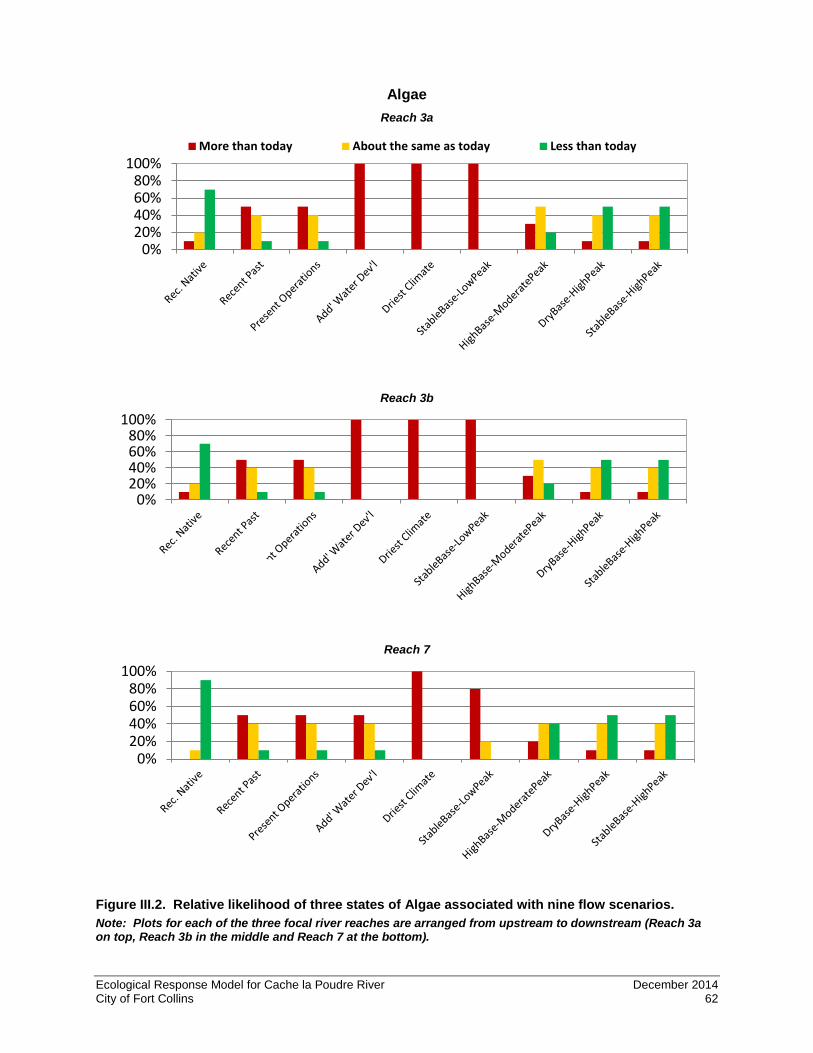
Algae Reach 3a
Reach 3b
Reach 7
Figure III.2. Relative likelihood of three states of Algae associated with nine flow scenarios. Note: Plots for each of the three focal river reaches are arranged from upstream to downstream (Reach 3a on top, Reach 3b in the middle and Reach 7 at the bottom).
0%20%40%60%80%
100%More than today About the same as today Less than today
0%20%40%60%80%
100%
0%20%40%60%80%
100%
Ecological Response Model for Cache la Poudre River December 2014 City of Fort Collins 62

Aquatic Insects Results Table III.4 is presented below (as reproduced from Section II: Aquatic Insects) as a useful reference for interpreting the results for aquatic insects that follow.
Table III.4: Description of three states of Aquatic Insects that depend on scouring flows that cleanse streambed and check algal proliferation, and on summer baseflows. State Definition + Presence of species that take one (univoltine) to two (semivoltine) years to complete life
cycles; semivoltine species present in all size classes, indicating successful annual reproduction and similar abundance to upstream/canyon areas; similar overall diversity to upstream/canyon reaches.
0 Mostly univoltine taxa present; reproduction during favorable conditions; less abundant than upstream/canyon areas; low diversity compared to upstream/canyon reaches.
- Mostly univoltine taxa present; low abundance or high abundance dominated by tolerant taxa such as oligochaete worms, Turbellaria (flatworms), and chironomid worms.
The following points are relevant to the Aquatic Insects results.
• As a result of a long legacy of flow extraction and human development, the most sensitive species of Aquatic Insects became locally extinct in the system long ago. Thus, the remaining species do not exhibit as much sensitivity to flow alteration. Because empirical data describing response to flow alteration are sparse and inconclusive, probabilities within the model were developed with a more conservative approach such that relatively large changes in flow and other inputs are required to shift ecological states. The subtle responses observed for Aquatic Insects reflect this conservative approach and relative uncertainty in the absence of adequate data.
• For Aquatic Insect conditions, the StableBase-HighPeak test scenario (with both high- and low-flow improvements) consistently outperformed the test scenarios with only a single type of flow (high or low) improved. This is due to the positive response of Aquatic Insects to both improved channel substrate conditions and consistent summer base flows.
• The urban corridor of the river, because of its position in the transition zone from the mountains to the plains, has the potential to support overall high diversity of species given the overlapping mix of plains and montane biological communities. The Reconstructed Native and StableBase-HighPeak scenarios show the best possible results for aquatic insects, but a positive response would still be limited by the existing pool of species. Under improved conditions, recolonization of sensitive species would depend on both the degree of improvement and proximity of a species pool.
Ecological Response Model for Cache la Poudre River December 2014 City of Fort Collins 63

Aquatic Insects Reach 3a
Reach 3b
Reach 7
Figure III.3. Relative likelihood of three states of Aquatic Insects associated with nine flow scenarios. Note: Plots for each of the three focal river reaches are arranged from upstream to downstream (Reach 3a on top, Reach 3b in the middle and Reach 7 at the bottom).
0%20%40%60%80%
100% - 0 +
0%20%40%60%80%
100%
0%20%40%60%80%
100%
Ecological Response Model for Cache la Poudre River December 2014 City of Fort Collins 64
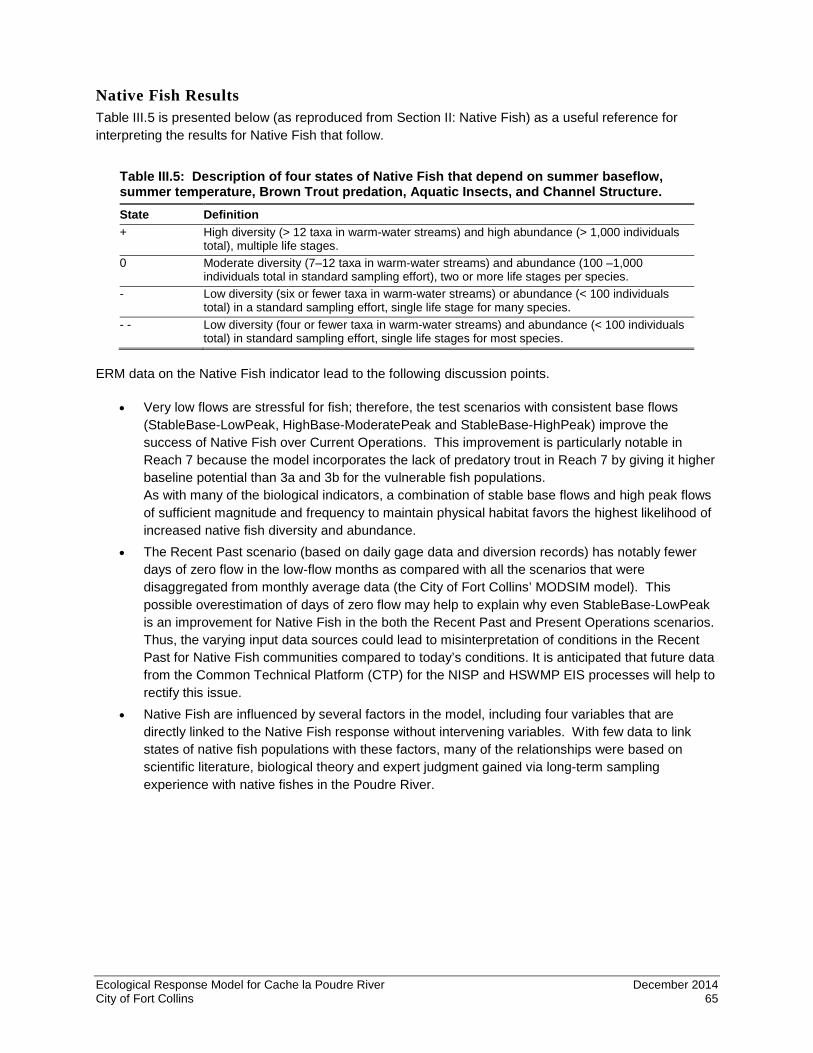
Native Fish Results Table III.5 is presented below (as reproduced from Section II: Native Fish) as a useful reference for interpreting the results for Native Fish that follow.
Table III.5: Description of four states of Native Fish that depend on summer baseflow, summer temperature, Brown Trout predation, Aquatic Insects, and Channel Structure. State Definition + High diversity (> 12 taxa in warm-water streams) and high abundance (> 1,000 individuals
total), multiple life stages. 0 Moderate diversity (7–12 taxa in warm-water streams) and abundance (100 –1,000
individuals total in standard sampling effort), two or more life stages per species. - Low diversity (six or fewer taxa in warm-water streams) or abundance (< 100 individuals
total) in a standard sampling effort, single life stage for many species. - - Low diversity (four or fewer taxa in warm-water streams) and abundance (< 100 individuals
total) in standard sampling effort, single life stages for most species.
ERM data on the Native Fish indicator lead to the following discussion points.
• Very low flows are stressful for fish; therefore, the test scenarios with consistent base flows (StableBase-LowPeak, HighBase-ModeratePeak and StableBase-HighPeak) improve the success of Native Fish over Current Operations. This improvement is particularly notable in Reach 7 because the model incorporates the lack of predatory trout in Reach 7 by giving it higher baseline potential than 3a and 3b for the vulnerable fish populations. As with many of the biological indicators, a combination of stable base flows and high peak flows of sufficient magnitude and frequency to maintain physical habitat favors the highest likelihood of increased native fish diversity and abundance.
• The Recent Past scenario (based on daily gage data and diversion records) has notably fewer days of zero flow in the low-flow months as compared with all the scenarios that were disaggregated from monthly average data (the City of Fort Collins’ MODSIM model). This possible overestimation of days of zero flow may help to explain why even StableBase-LowPeak is an improvement for Native Fish in the both the Recent Past and Present Operations scenarios. Thus, the varying input data sources could lead to misinterpretation of conditions in the Recent Past for Native Fish communities compared to today’s conditions. It is anticipated that future data from the Common Technical Platform (CTP) for the NISP and HSWMP EIS processes will help to rectify this issue.
• Native Fish are influenced by several factors in the model, including four variables that are directly linked to the Native Fish response without intervening variables. With few data to link states of native fish populations with these factors, many of the relationships were based on scientific literature, biological theory and expert judgment gained via long-term sampling experience with native fishes in the Poudre River.
Ecological Response Model for Cache la Poudre River December 2014 City of Fort Collins 65
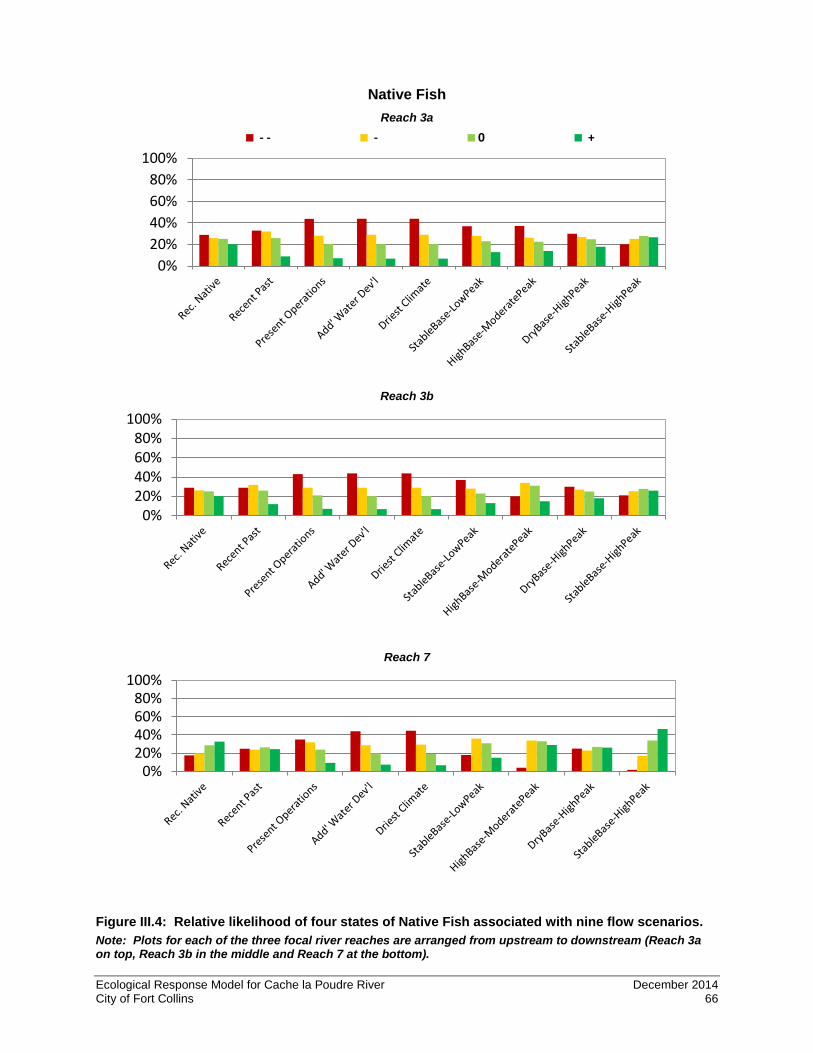
Native Fish Reach 3a
Reach 3b
Reach 7
Figure III.4: Relative likelihood of four states of Native Fish associated with nine flow scenarios. Note: Plots for each of the three focal river reaches are arranged from upstream to downstream (Reach 3a on top, Reach 3b in the middle and Reach 7 at the bottom).
0%20%40%60%80%
100% - - - 0 +
0%20%40%60%80%
100%
0%20%40%60%80%
100%
Ecological Response Model for Cache la Poudre River December 2014 City of Fort Collins 66

Brown Trout Results Table III.6 is presented below (as reproduced from Section II: Brown Trout) as a useful reference for interpreting the results for Brown Trout that follow.
Table III.6: Description of four states of Brown Trout that depend on summer temperature, summer baseflow, winter baseflow, Aquatic Insects and Channel Structure. State Definition + Multiple (3–4 or more) age classes; successful annual reproduction; high total biomass;
resilient to multiple detrimental events/years; viable recreational fishery, many adult fish. 0 Three age classes; more variability across years in terms of biomass and reproduction;
variable as a recreational fishery from year to year, occasional years with moderate numbers of adult fish.
- Dominated by a single age class, others may be present; reproduction minimal; recovery from stressor events would take several years; generally poor fishery, inconsistent from to year to year.
- - Single age class present; very sporadic reproduction; low abundance, population vulnerable to one detrimental event/year, the poor fishery is in danger of collapse; many years of good conditions needed for recovery.
An interpretation of the above data leads to the following:
• In the ERM model, Brown Trout are directly influenced by five factors (Figure I.4), with a heavier influence by the low-flow conditions than by other biological indicators (due to incorporation of both critical summer and winter base flows). High flows remain important for creation of clean substrates and diverse channel structure, but Brown Trout are strongly affected by extreme low flows, elevated water temperature, and depleted oxygen levels.
• Due to the influence of both summer and winter baseflows, the likelihood of improving the state of Brown Trout is much higher in the HighBase-ModeratePeak scenario compared to the DryBase-HighPeak scenario. All four test scenarios yield higher likelihoods of Brown Trout improvement relative to the three present and future flow scenarios (Present Operations, Additional Water Development, and Driest Climate). This reflects the erratic low flows and reduced peak flows that rarely exceed thresholds for maintaining physical habitat in drier core flow scenarios. Similarly, even the StableBase-HighPeak test scenario outperforms Reconstructed Native due to consistent base flows.
• The language in the highest condition class, resilient to multiple detrimental events/years, is even more important under the future climate scenarios that predict more extreme flow and water conditions. Trout can survive through cycles of extremes if they have a healthy population prior to the extreme. Brown Trout are known to be relatively tolerant and able to thrive in diverse conditions. (Note that the Brown Trout node in the model can act as a surrogate for rainbow trout – a species that is also desired for recreational purposes – although local populations have recently been eliminated by whirling disease. Spring spawning rainbow trout would be more sensitive to peak flows.)
Ecological Response Model for Cache la Poudre River December 2014 City of Fort Collins 67
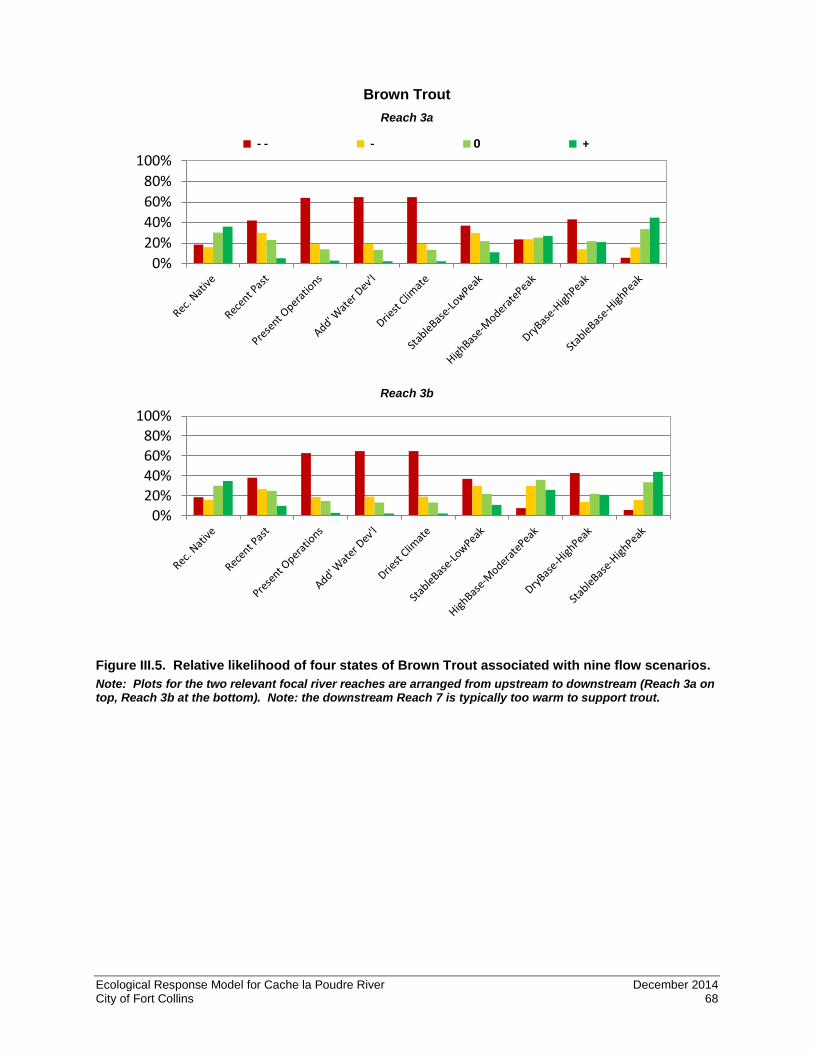
Brown Trout Reach 3a
Reach 3b
Figure III.5. Relative likelihood of four states of Brown Trout associated with nine flow scenarios. Note: Plots for the two relevant focal river reaches are arranged from upstream to downstream (Reach 3a on top, Reach 3b at the bottom). Note: the downstream Reach 7 is typically too warm to support trout.
0%20%40%60%80%
100% - - - 0 +
0%20%40%60%80%
100%
Ecological Response Model for Cache la Poudre River December 2014 City of Fort Collins 68
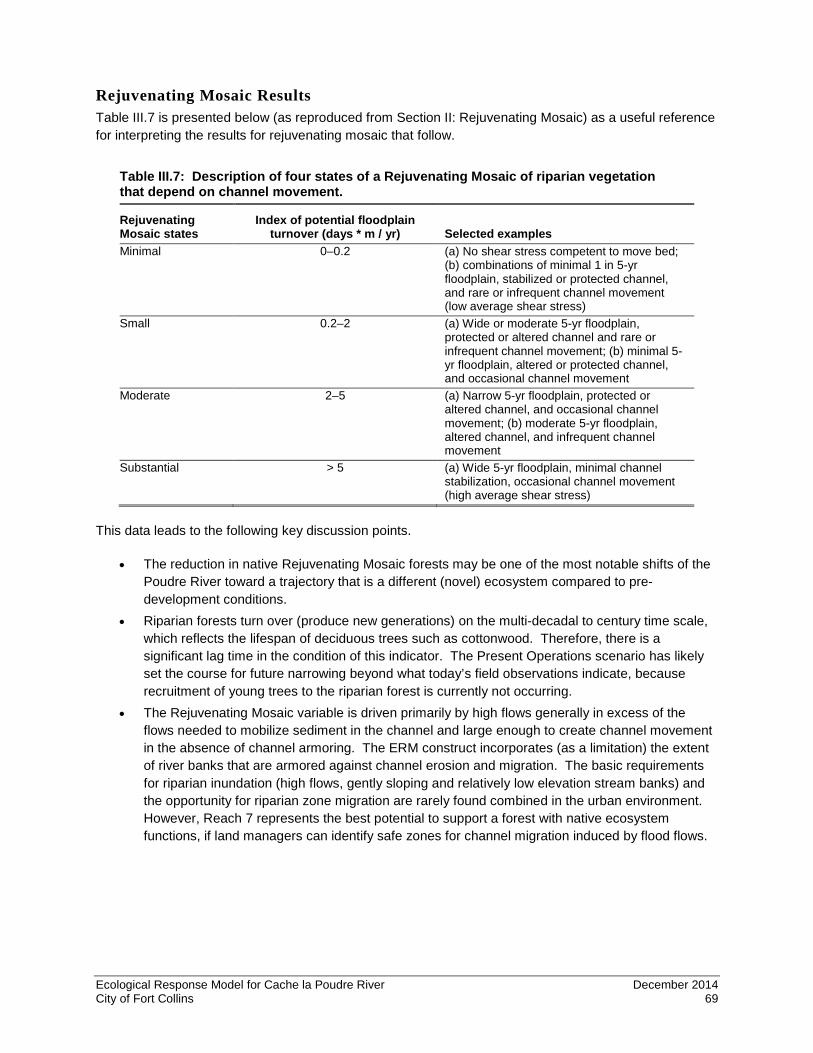
Rejuvenating Mosaic Results Table III.7 is presented below (as reproduced from Section II: Rejuvenating Mosaic) as a useful reference for interpreting the results for rejuvenating mosaic that follow.
Table III.7: Description of four states of a Rejuvenating Mosaic of riparian vegetation that depend on channel movement.
Rejuvenating Mosaic states
Index of potential floodplain turnover (days * m / yr) Selected examples
Minimal 0–0.2 (a) No shear stress competent to move bed; (b) combinations of minimal 1 in 5-yr floodplain, stabilized or protected channel, and rare or infrequent channel movement (low average shear stress)
Small 0.2–2 (a) Wide or moderate 5-yr floodplain, protected or altered channel and rare or infrequent channel movement; (b) minimal 5-yr floodplain, altered or protected channel, and occasional channel movement
Moderate 2–5 (a) Narrow 5-yr floodplain, protected or altered channel, and occasional channel movement; (b) moderate 5-yr floodplain, altered channel, and infrequent channel movement
Substantial > 5 (a) Wide 5-yr floodplain, minimal channel stabilization, occasional channel movement (high average shear stress)
This data leads to the following key discussion points.
• The reduction in native Rejuvenating Mosaic forests may be one of the most notable shifts of the Poudre River toward a trajectory that is a different (novel) ecosystem compared to pre-development conditions.
• Riparian forests turn over (produce new generations) on the multi-decadal to century time scale, which reflects the lifespan of deciduous trees such as cottonwood. Therefore, there is a significant lag time in the condition of this indicator. The Present Operations scenario has likely set the course for future narrowing beyond what today’s field observations indicate, because recruitment of young trees to the riparian forest is currently not occurring.
• The Rejuvenating Mosaic variable is driven primarily by high flows generally in excess of the flows needed to mobilize sediment in the channel and large enough to create channel movement in the absence of channel armoring. The ERM construct incorporates (as a limitation) the extent of river banks that are armored against channel erosion and migration. The basic requirements for riparian inundation (high flows, gently sloping and relatively low elevation stream banks) and the opportunity for riparian zone migration are rarely found combined in the urban environment. However, Reach 7 represents the best potential to support a forest with native ecosystem functions, if land managers can identify safe zones for channel migration induced by flood flows.
Ecological Response Model for Cache la Poudre River December 2014 City of Fort Collins 69
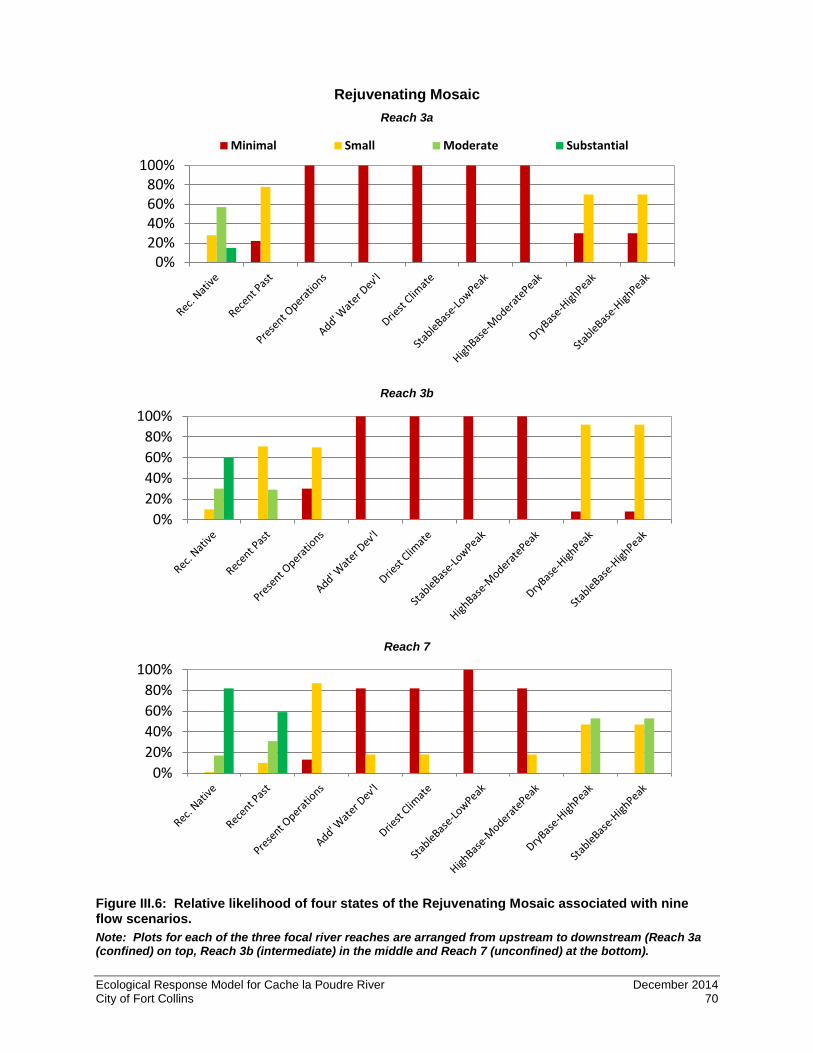
Rejuvenating Mosaic Reach 3a
Reach 3b
Reach 7
Figure III.6: Relative likelihood of four states of the Rejuvenating Mosaic associated with nine flow scenarios. Note: Plots for each of the three focal river reaches are arranged from upstream to downstream (Reach 3a (confined) on top, Reach 3b (intermediate) in the middle and Reach 7 (unconfined) at the bottom).
0%20%40%60%80%
100%Minimal Small Moderate Substantial
0%20%40%60%80%
100%
0%20%40%60%80%
100%
Ecological Response Model for Cache la Poudre River December 2014 City of Fort Collins 70

Functional Riparian Zone Results Table III.8 is presented below (as reproduced from Section II: Functional Riparian Ecosystem) as a useful reference for interpreting the results that follow.
Table II.8: Description of four states of width that depend on inundation by the river at least one day in the two years of growing season days.
Functional Riparian Ecosystem states Average width in m
(total area / channel length) Minimal < 15 Narrow 15–45 Moderate 45–90 Wide > 90
Note: Widths include both sides of channel and represent total area divided by channel length.
The following interpretations can be made from these results.
• When the river is highly confined, as in Reach 3a, the potential zone for a Functional Riparian Ecosystem is limited.
• Results indicate Reaches 3b and 7 consistently provide more suitable conditions for riparian development and function than Reach 3a. This demonstrates the importance of gently sloping and relatively low-elevation stream banks for riparian inundation.
• The DryBase-HighPeak and StableBase-HighPeak test scenarios substantially increase the likelihood of maintaining a relatively wide functional riparian extent compared to Present Operations and Additional Water Development scenarios.
• Test scenarios that improve base flows have little or no benefit for the riparian forest in the ERM model.
• The results for both test scenarios that improve the base flows (StableBase-LowPeak and HighBase-ModeratePeak) area relatively poorer than the two test scenarios that improve the peak flows (DryBase-HighPeak and StableBase-HighPeak). This is based upon a functional riparian zone’s dependence on peak flows to provide hydrologic connectivity to the river.
Ecological Response Model for Cache la Poudre River December 2014 City of Fort Collins 71

Functional Riparian Zone Reach 3a
Reach 3b
Reach 7
Figure III.7: Relative likelihood of four states of Functional Riparian Zone width associated with nine flow scenarios. Note: Plots for each of the three focal river reaches are arranged from upstream to downstream (Reach 3a on top, Reach 3b in the middle and Reach 7 at the bottom).
0%20%40%60%80%
100%Minimal Narrow Moderate Wide
0%20%40%60%80%
100%
0%20%40%60%80%
100%
Ecological Response Model for Cache la Poudre River December 2014 City of Fort Collins 72
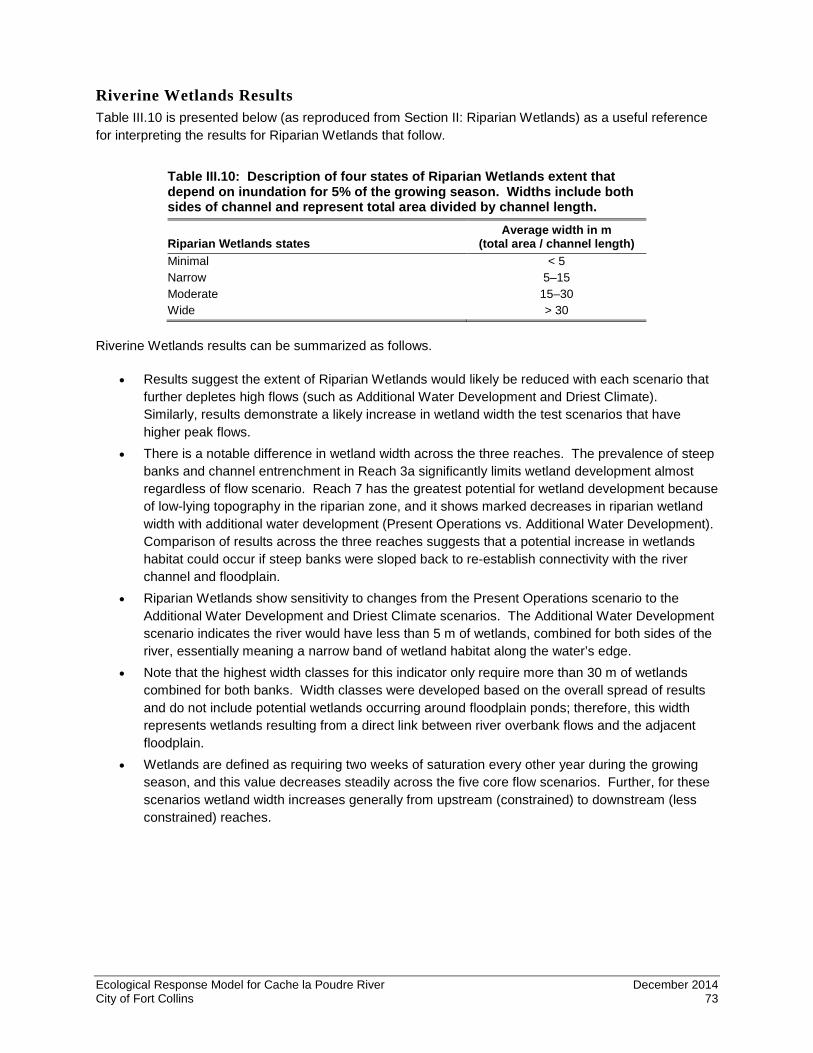
Riverine Wetlands Results Table III.10 is presented below (as reproduced from Section II: Riparian Wetlands) as a useful reference for interpreting the results for Riparian Wetlands that follow.
Table III.10: Description of four states of Riparian Wetlands extent that depend on inundation for 5% of the growing season. Widths include both sides of channel and represent total area divided by channel length.
Riparian Wetlands states Average width in m
(total area / channel length) Minimal < 5 Narrow 5–15 Moderate 15–30 Wide > 30
Riverine Wetlands results can be summarized as follows.
• Results suggest the extent of Riparian Wetlands would likely be reduced with each scenario that further depletes high flows (such as Additional Water Development and Driest Climate). Similarly, results demonstrate a likely increase in wetland width the test scenarios that have higher peak flows.
• There is a notable difference in wetland width across the three reaches. The prevalence of steep banks and channel entrenchment in Reach 3a significantly limits wetland development almost regardless of flow scenario. Reach 7 has the greatest potential for wetland development because of low-lying topography in the riparian zone, and it shows marked decreases in riparian wetland width with additional water development (Present Operations vs. Additional Water Development). Comparison of results across the three reaches suggests that a potential increase in wetlands habitat could occur if steep banks were sloped back to re-establish connectivity with the river channel and floodplain.
• Riparian Wetlands show sensitivity to changes from the Present Operations scenario to the Additional Water Development and Driest Climate scenarios. The Additional Water Development scenario indicates the river would have less than 5 m of wetlands, combined for both sides of the river, essentially meaning a narrow band of wetland habitat along the water’s edge.
• Note that the highest width classes for this indicator only require more than 30 m of wetlands combined for both banks. Width classes were developed based on the overall spread of results and do not include potential wetlands occurring around floodplain ponds; therefore, this width represents wetlands resulting from a direct link between river overbank flows and the adjacent floodplain.
• Wetlands are defined as requiring two weeks of saturation every other year during the growing season, and this value decreases steadily across the five core flow scenarios. Further, for these scenarios wetland width increases generally from upstream (constrained) to downstream (less constrained) reaches.
Ecological Response Model for Cache la Poudre River December 2014 City of Fort Collins 73

Riverine Wetlands Reach 3a
Reach 3b
Reach 7
Figure III.8. Relative likelihood of four states of Riverine Wetlands associated with nine flow scenarios. Note: Plots for each of the three focal river reaches are arranged from upstream to downstream (Reach 3a on top, Reach 3b in the middle and Reach 7 at the bottom).
0%20%40%60%80%
100%Minimal Narrow Moderate Wide
0%20%40%60%80%
100%
0%20%40%60%80%
100%
Ecological Response Model for Cache la Poudre River December 2014 City of Fort Collins 74
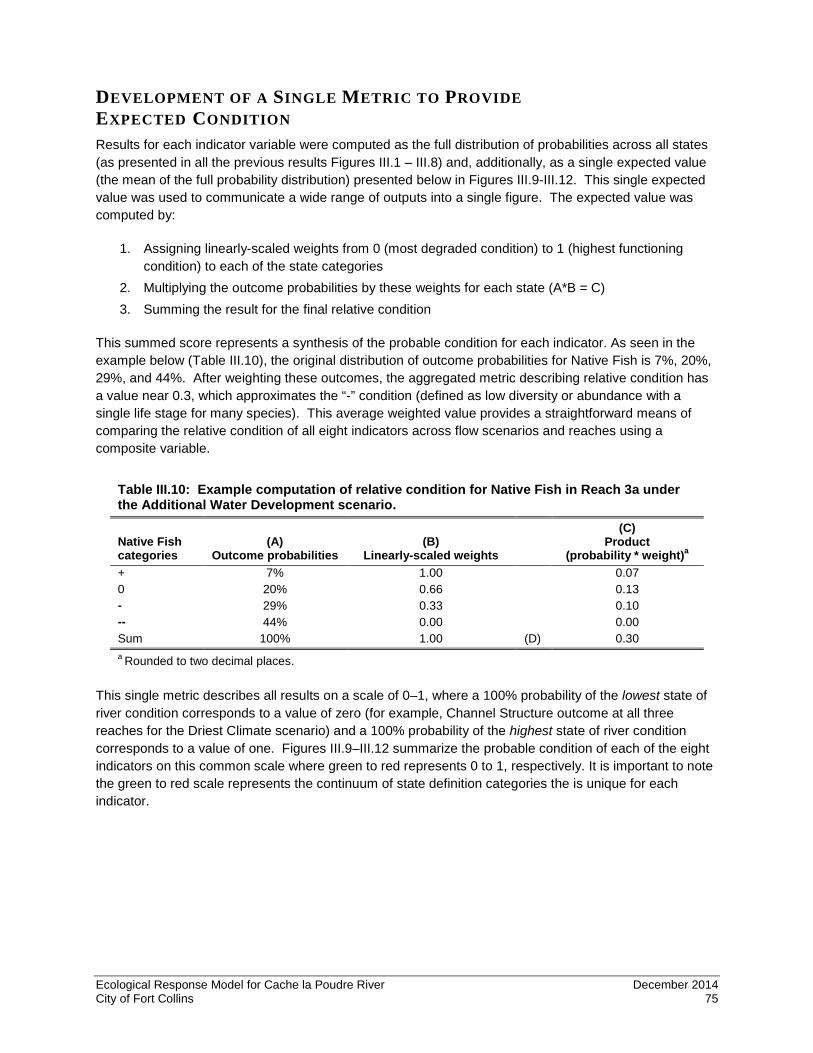
DEVELOPMENT OF A SINGLE METRIC TO PROVIDE EXPECTED CONDITION Results for each indicator variable were computed as the full distribution of probabilities across all states (as presented in all the previous results Figures III.1 – III.8) and, additionally, as a single expected value (the mean of the full probability distribution) presented below in Figures III.9-III.12. This single expected value was used to communicate a wide range of outputs into a single figure. The expected value was computed by:
1. Assigning linearly-scaled weights from 0 (most degraded condition) to 1 (highest functioning condition) to each of the state categories
2. Multiplying the outcome probabilities by these weights for each state (A*B = C) 3. Summing the result for the final relative condition
This summed score represents a synthesis of the probable condition for each indicator. As seen in the example below (Table III.10), the original distribution of outcome probabilities for Native Fish is 7%, 20%, 29%, and 44%. After weighting these outcomes, the aggregated metric describing relative condition has a value near 0.3, which approximates the “-” condition (defined as low diversity or abundance with a single life stage for many species). This average weighted value provides a straightforward means of comparing the relative condition of all eight indicators across flow scenarios and reaches using a composite variable.
Table III.10: Example computation of relative condition for Native Fish in Reach 3a under the Additional Water Development scenario.
Native Fish categories
(A) Outcome probabilities
(B) Linearly-scaled weights
(C) Product
(probability * weight)a + 7% 1.00
0.07
0 20% 0.66
0.13 - 29% 0.33
0.10
-- 44% 0.00
0.00 Sum 100% 1.00 (D) 0.30 a Rounded to two decimal places.
This single metric describes all results on a scale of 0–1, where a 100% probability of the lowest state of river condition corresponds to a value of zero (for example, Channel Structure outcome at all three reaches for the Driest Climate scenario) and a 100% probability of the highest state of river condition corresponds to a value of one. Figures III.9–III.12 summarize the probable condition of each of the eight indicators on this common scale where green to red represents 0 to 1, respectively. It is important to note the green to red scale represents the continuum of state definition categories the is unique for each indicator.
Ecological Response Model for Cache la Poudre River December 2014 City of Fort Collins 75
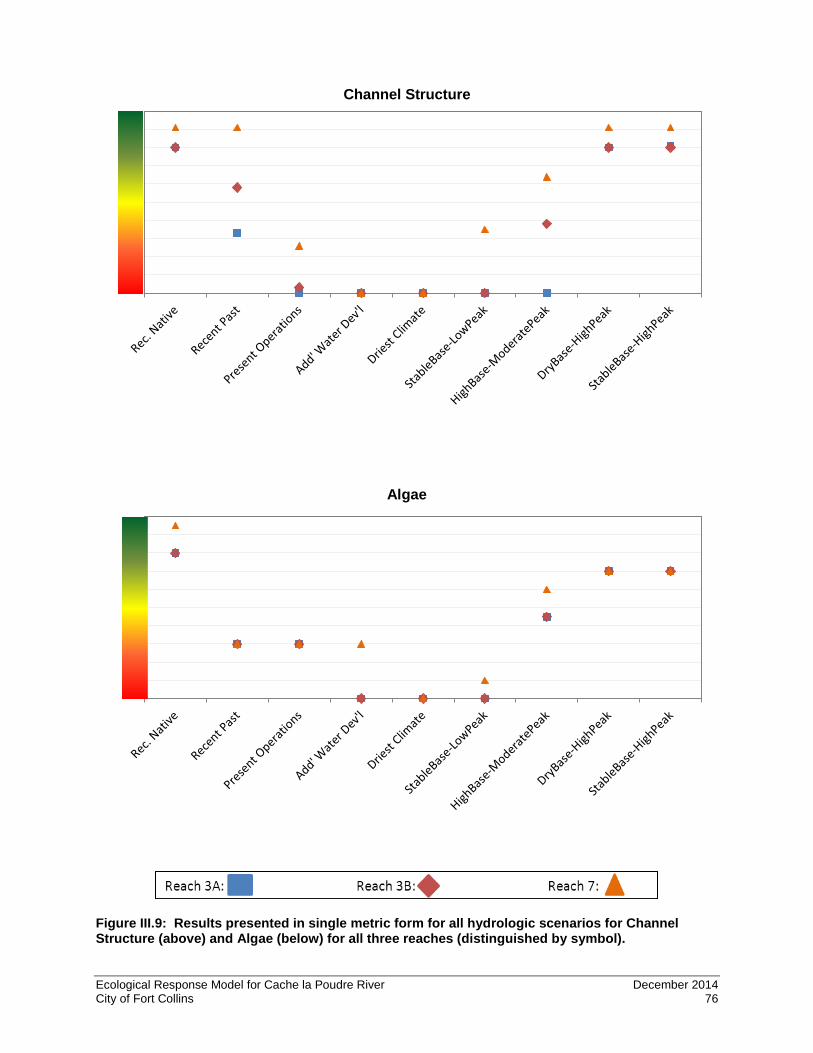
Channel Structure
Algae
Figure III.9: Results presented in single metric form for all hydrologic scenarios for Channel Structure (above) and Algae (below) for all three reaches (distinguished by symbol).
Ecological Response Model for Cache la Poudre River December 2014 City of Fort Collins 76

Aquatic Insects
Native Fish
Figure III.10 Results presented in single metric form for all hydrologic scenarios for Aquatic Insects (above) and Native Fish (below) for all three reaches (distinguished by symbol).
Ecological Response Model for Cache la Poudre River December 2014 City of Fort Collins 77
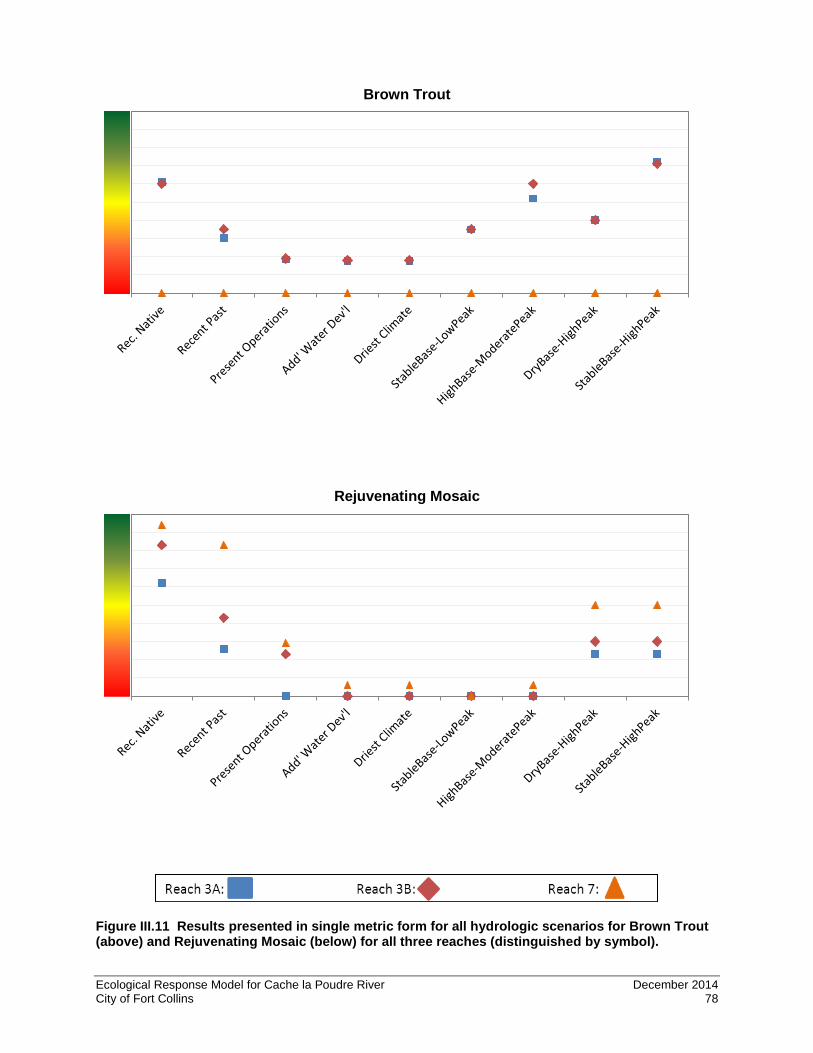
Brown Trout
Rejuvenating Mosaic
Figure III.11 Results presented in single metric form for all hydrologic scenarios for Brown Trout (above) and Rejuvenating Mosaic (below) for all three reaches (distinguished by symbol).
Ecological Response Model for Cache la Poudre River December 2014 City of Fort Collins 78

Functioning Riparian Zone
Riverine Wetland
Figure III.12 Results presented in single metric form for all hydrologic scenarios for Functional Riparian Zone (above) and Riverine Wetland (below) for all three reaches (distinguished by symbol). Ecological Response Model for Cache la Poudre River December 2014 City of Fort Collins 79
SUMMARY OF RIVER CONDITION BY FLOW SCENARIO Reconstructed Native. As expected, this flow scenario yields the highest-predicted condition for all indicators; however, it does not optimize outcomes for all indicators or reaches. Flows are the primary factor determining river health, yet human-induced changes to this system have resulted in a reduced ability of the system to reach potential natural flow benefits. For example, for all three riparian indicators the steep and stabilized banks of Reach 3a lead to a substantially lower condition compared to Reaches 3b and 7, which are less confined. For Aquatic Insects and Native Fish, there appears to be a limit on potential improvement from the changing of flow alone. While this is in part due to the inherent conservatism of a theory-based relationship, it is also limited by irreversible alterations to the ecosystem (such as local extinctions of the most sensitive insects and fishes, and introduction of non-native, warm-water fishes).
Recent Past. These flows reflect conditions as they existed over the past 40 years; they were developed from historic gage and operations data. Over this time period, flow was increasingly diverted from the river, and thus there has been a consistent decrease in flows (beyond any climactic variability). Ecological conditions that we observe in the river today reflect the time-integrated response to these declining flow levels over this historical period. For example, the lack of young trees in the riparian zone reflects a lack of overbank flooding and channel movement, and it portends a future riparian zone that will continue to shift from cottonwood trees to upland trees (including non-natives) in the absence of high flows that exceed recruitment thresholds.
Present Operations. This scenario refers to the application of today’s operations over the 40-year historical record; thus, the sustained increase in operational demands are likely to result in ecological decline relative to the Recent Past scenario. ERM results support this hypothesis, indicating that, had flow levels been consistently reduced over this entire period, the ecological status of the river would likely be in a more degraded state. Given the lag time in ecosystem indicators to reduced flow levels, a projection of the Present Operations into the future suggests that the river ecosystem will degrade further in the coming years if climate, hydrology, and current operations continue. A further degradation in ecological indicators would reflect a likely loss in system resilience in the face of extreme disturbance events, such as prolonged drought.
Additional Water Development. The impact of proposed additional water development is represented in this scenario, together with projected future water demands. ERM results indicate that this scenario will further deplete flows in the Poudre River through Fort Collins. Additional depletions will likely come from both low and high flows. The ERM suggests that the increased depletions associated with new projects and future diversions are likely to produce substantial reductions in river health from the current condition. With few exceptions, most of the ERM indicators in all three reaches yield their lowest results with this scenario. The ERM predicts increased risk of excessive Algae, a substantial narrowing of the Functional Riparian Zone and Riverine Wetlands, diminished Aquatic Insect communities, and reduced Brown Trout and Native Fish. The Additional Water Development scenario also misses critical flow thresholds, causing wetland and riparian functions to decline substantially.
The Additional Water Development scenario is based on preliminary information, and may not represent hydrologic conditions expected to be shown in the various project EISs. Results for this scenario may change with the more refined low flow and daily disaggregated data from the upcoming EISs.
Driest Climate. This scenario projects similarly degraded ecological conditions. It also generates flows that fail to reach critical thresholds for wetland and riparian function. In Reach 7, where there is a gently
Ecological Response Model for Cache la Poudre River December 2014 City of Fort Collins 80
sloping channel and relatively low elevation stream banks, Riverine Wetlands reach the narrowest category and are almost completely lost.
Within the following ERM test scenarios, a combination of stable base flows and rejuvenating high flows are shown to improve all indicators of river health relative to current conditions.
StableBase-LowPeak. When low flows alone are restored, as in this scenario, very little improvement is seen compared to Present Operations in aquatic or wetland/riparian indicators. This is due to the absence of high flows that rejuvenate the bed or inundate the floodplain.
HighBase-ModeratePeak. This scenario also fails to improve wetland and riparian functions because the peak flows remain at lower levels. However, the aquatic indicators do improve as stable base flows, combined with streambed scouring flows, improve habitat quality for these aquatic species.
DryBase-HighPeak. All indicators are improved relative to Present Operations by exceeding thresholds of moderate and high flows that prevent excessive accumulation of fine sediments and perform important geomorphic and ecological functions (including maintenance of channel habitat for fish and insects, scouring of excess algal biomass, and inundation of riparian areas to promote wetland and riparian function and vegetation mosaics). However, the very low flows in this test scenario act to limit the potential of some aquatic indicators, especially Brown Trout, as can be seen in comparing the HighBase-ModeratePeak and DryBase-HighPeak scenarios.
StableBase-HighPeak. This scenario provides similar peak flow conditions to the DryBase-HighPeak scenario, and thus it supports similarly high values for the aquatic and wetland/riparian indicators. The stable base flows in this scenario exceed the threshold necessary to sustain more robust Brown Trout populations, and this indicator reaches its maximum value in this scenario. Based on the results of the StableBase-HighPeak scenario, it is estimated with confidence that a combination of stable base flows and habitat-rejuvenating high flows provides synergistic benefits for the Poudre River ecosystem that substantially exceed the benefits provided by improvements in only one type of flow.
ERM EVALUATION Testing the ERM In the development phase, each indicator was individually evaluated and tested against available empirical data and current scientific understanding. Some indicators had a large amount of available data (such as Riparian Wetlands) while others had very little (Native Fish) and thus had to be more reliant on expert judgment. As discussed in Section I, one way to account for uncertainty associated with expert judgment is to be more conservative with the assignment of conditional probabilities based upon expert judgment instead of empirical data. While this conservatism may lead to less variation in the absolute expected values of each indicator, the relative differences across the flow scenarios remain robust.
The ERM will be further refined as new biologic, geomorphic, and hydrologic data become available. One of the strengths of the Bayesian model is its ability to refine the conditional probabilities as scientific understanding is refined or additional empirical data produced. This may lead to expert judgment relationships being replaced by empirical relationships, continually improving the tool.
After the model was developed for the core hydrologic scenarios, it was additionally tested through the formation and evaluation of the four test hydrologic scenarios. Additional test scenarios could also be developed to answer a broader range of questions related to a water development or augmentation proposal. Ecological Response Model for Cache la Poudre River December 2014 City of Fort Collins 81

Elements Not Included in the Model Other endpoints could certainly be included in an ecosystem-scale model. For the ERM the number of nodes was limited to those shown in Figure II.2 because the team concurred that a) these are key components that capture the major dimensions of the Poudre River ecosystem, and b) there was sufficient data or data-informed expert knowledge available for modeling these elements. Certainly, additional linkages can be imagined in an ecosystem model, such as additional ecological feedback loops, numerous anthropogenic influences, or potential future management actions. However, adding additional elements for which no data and/or expert judgment exist is more problematic and would carry with it a penalty of increasing the model’s complexity with no benefit of additional insight. Therefore, the final ERM is viewed as one that balances representation of system complexity with available knowledge base. This model construction generates results that meaningfully contrast system responses to different water management and climate scenarios. The purpose of the model is to facilitate a comparison of diverse, plausible trajectories of the Poudre River ecosystem, rather than producing precise predictions of future ecosystem states under some specific management or climate scenario.
The following is a list of ecosystem linkages that were intentionally not captured in the model for the reasons stated above:
• The time sequence of flows that control vegetation encroachment through mechanical removal and inundation (e.g., a high flow period that build bars following by a drought) are not accounted for in the models. Similarly, mechanisms that control bar and island formation are not explicitly incorporated into the models. Both of these phenomena have the potential to alter baseline conditions of channel geometry, sediment transport capacity, lateral erodibility, and/or degree of overbank flooding and ultimately affect the risk of channel miniaturization which would have wide-ranging effects on the system.
• Input of terrestrial food resources for fish • Implications of water temperature beyond the 23C threshold (for Brown Trout, Native Fish, and
Aquatic Insects) related to nutrient processing and algae growth • Interaction between riparian shading and water temperature • Impacts of the hyporheic zone and alluvial groundwater on surface hydrology, water temperature,
and/or biotic refuges • Short-term deviation from average conditions (for example, the large fires in the upper watershed
in 2012 that caused numerous short-term impacts and could potentially alter the long-term trajectory of the system including short-term increases in flows, turbidity, and sediment that could lead to degraded water quality for aquatic wildlife and accelerated channel narrowing)
• Impact of increased presence of aggressive, non-native (or newly introduced) species on desired species, including predation or utilization of resources (especially with regard to riparian vegetation), disease (for example, whirling disease, chytrid fungus, and emerald ash borer), and migration of undesirable filamentous algae into the reach
• Effects of hourly scale flow fluctuations caused by diversion operations on aquatic organisms
Management actions, current or potential, that were not included in the model include the following:
• Hard or soft engineering approaches to riparian restoration and bank erosion (such as lowering banks to increase the width of overbank flooding on the 2-year return interval, but with hardened structures underneath)
• Management of non-native riparian species (for example, extensive Russian olive management)
Ecological Response Model for Cache la Poudre River December 2014 City of Fort Collins 82

• Further bank alterations including changes to topography or new lateral constraints, or, conversely, the reduction of existing lateral constraints to allow for expansion of aquatic and riparian areas and channel movement into areas currently isolated from the river
• Local sediment balance/imbalance as a result of many anthropogenic activities locally and fires in the upper watershed
Influence of Low-Flow Data on Modelling Process and Results Accurate characterization of low-flow hydrology is very important for understanding aquatic habitat conditions and biological responses in river systems. The ERM is sensitive to the accuracy of hydrologic input data in describing low-flow characteristics. Model results for trout, native fishes, and invertebrates are influenced by the occurrence of zero- and extreme low-flow days in the input series of daily flows. Differences for the low-flow months between disaggregated monthly data versus daily gage data can represent either an exaggeration of zero-flow days or minimization of extreme low-flow days due to basing daily variability off monthly averages and consequential loss of accurate portrayal of the minimum flow days. Hence, the ERM underestimates negative consequences for biological indicators when extreme low flows are under-represented as a result of erroneous smoothing, errors in disaggregation, or other modeling errors. Conversely, the ERM overestimates the biological effects of flow extraction when extreme low flows are over-represented. Improving the accuracy of current hydrologic models in predicting key low-flow characteristics (magnitude, frequency, duration, timing and rate of change) at daily and sub-daily time intervals would substantially enhance our predictive ability.
ENHANCING PREDICTIVE ABILITY IN THE FUTURE Through the development of a Bayesian network model, the ERM effort has facilitated analysis of multiple flow scenarios and reach types to assess relative influences on key ecosystem functions and attributes.
The results of this study illustrate broad trends in the overall ecosystem and individual components without overestimating precision. In other words, the ERM provides comparisons of outcomes across scenarios to draw conclusions about which direction the ecosystem is likely to trend and the relative magnitude of such change. Despite the uncertainty inherent in ecosystem modeling, this approach provides a systematic means of estimating likely trends in ecosystem response that can then inform educational efforts, goal setting, decision making, and adaptive management.
Decision makers can consider a variety of stakeholder interests and the engineering, ecological, economic, and societal consequences associated with all policy options. The probabilistic scientific predictions provided by the ERM provide a rational and transparent basis for decision making by explicitly recognizing uncertainty and helping managers understand the likely consequences of their policy choices.
The team’s experts were purposely conservative in their construction of these relationships and probabilities. Transitions between indicator states required very large changes in driving variables (flows), so that an indicator that registered the “best” or “worst” condition was difficult to achieve. This conservatism in indicator response provides a desirable stability given the uncertainties of assigning indicator probabilities. This conservatism also is reflected in the subtle differences between scenarios in many of these aquatic indicators, but it does allow confidence that where relatively large differences occur among scenarios, these differences are robust. Again, however, the absolute values of the indicators are not of greatest interest. Rather, it is the relative change in indicators across scenarios that are most informative. The consistent patterns that emerge for the many aquatic indicators across the scenarios add additional confidence to the results and our interpretations.
Ecological Response Model for Cache la Poudre River December 2014 City of Fort Collins 83

There is higher confidence for indicators that were derived from relatively strong empirical relationships and analysis, and they are more responsive to flow differences across the scenarios. For example, Channel Structure and the three wetland/riparian relationships are formulated mainly from empirical analysis. Similarly, the relationship between winter low flows and Brown Trout is empirically derived and modelled with confidence.
Examples of additional information that would improve predictive capability of the ERM would include the following:
Flows • Improve empirical basis for understanding low-flow variability, low-flow days, and the impact of
future water depletions on low flows. • Derive data from daily or hourly gage data rather than disaggregated monthly data, which is not
well suited to daily time-scales.
Channel Structure • Improve the accuracy and resolution of hydraulic and sediment-transport models through
additional calibration and validation with field data. • Improve the spatial resolution of the hydraulic models to account for longitudinal variability in
sediment sizes, shear stress/discharge relationships, and lateral armoring among segments throughout the corridor.
• Monitor fine sediment to understand flushing flows needed to provide a clean substrate under different levels of sediment delivery and watershed disturbance.
• Develop a river sediment budget to aid in understanding how habitat could be enhanced through changes in channel form and gravel supply.
• Identify potential safe locations for re-establishing dynamic connectivity between the channel and its floodplain.
Algae and Aquatic Insects • Initiate a systematic approach toward monitoring streambed algae and pair these data with other
water-quality parameters, especially nutrient concentrations. This information can be very helpful in projecting future river conditions in the face of increasing nutrient loading and/or reduced summer base flows.
Fish • Seek a more complete understanding of the complex interplay between fish habitat, channel
structure, streamflow, and native fish and trout population response to better predict the future state of these resources in the Poudre River.
• Continue monitoring aquatic resources, including Native Fish and Brown Trout populations, to better understand their dynamics and response to disturbances such as habitat change or further streamflow modifications.
Riparian Forest and Wetlands • Develop better understanding of the characteristics and composition of the Functional Riparian
Zone • Improve current methods by incorporating new HEC-RAS hydraulic models. • Develop better understanding and estimates of likely channel movement in context of altered
topography, bank stability, and flow regimes. Ecological Response Model for Cache la Poudre River December 2014 City of Fort Collins 84

In summary, the ERM team has confidence in the model outputs. It also acknowledges that improved understanding of relationships between indicators and river flow conditions would be desirable to better develop some of the more conservatively modeled indicators in the ERM. A strength of the ERM is that future data can be incorporated to further validate and improve it.
Ecological Response Model for Cache la Poudre River December 2014 City of Fort Collins 85
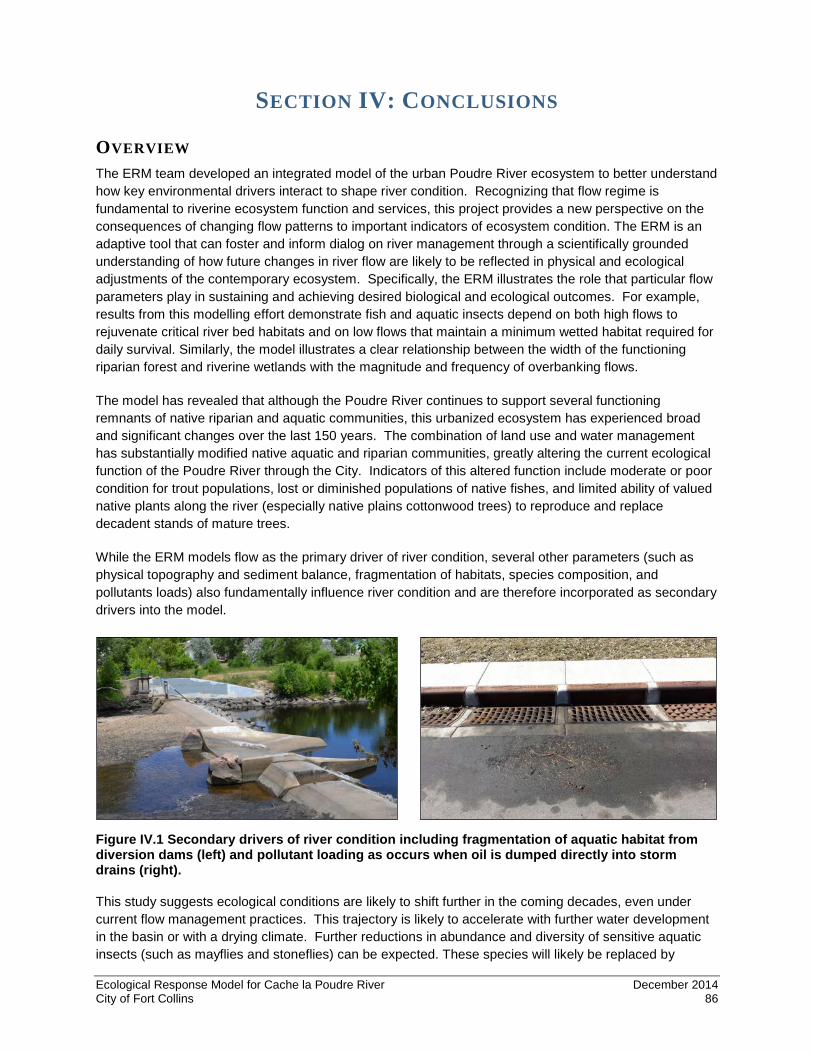
SECTION IV: CONCLUSIONS
OVERVIEW The ERM team developed an integrated model of the urban Poudre River ecosystem to better understand how key environmental drivers interact to shape river condition. Recognizing that flow regime is fundamental to riverine ecosystem function and services, this project provides a new perspective on the consequences of changing flow patterns to important indicators of ecosystem condition. The ERM is an adaptive tool that can foster and inform dialog on river management through a scientifically grounded understanding of how future changes in river flow are likely to be reflected in physical and ecological adjustments of the contemporary ecosystem. Specifically, the ERM illustrates the role that particular flow parameters play in sustaining and achieving desired biological and ecological outcomes. For example, results from this modelling effort demonstrate fish and aquatic insects depend on both high flows to rejuvenate critical river bed habitats and on low flows that maintain a minimum wetted habitat required for daily survival. Similarly, the model illustrates a clear relationship between the width of the functioning riparian forest and riverine wetlands with the magnitude and frequency of overbanking flows.
The model has revealed that although the Poudre River continues to support several functioning remnants of native riparian and aquatic communities, this urbanized ecosystem has experienced broad and significant changes over the last 150 years. The combination of land use and water management has substantially modified native aquatic and riparian communities, greatly altering the current ecological function of the Poudre River through the City. Indicators of this altered function include moderate or poor condition for trout populations, lost or diminished populations of native fishes, and limited ability of valued native plants along the river (especially native plains cottonwood trees) to reproduce and replace decadent stands of mature trees.
While the ERM models flow as the primary driver of river condition, several other parameters (such as physical topography and sediment balance, fragmentation of habitats, species composition, and pollutants loads) also fundamentally influence river condition and are therefore incorporated as secondary drivers into the model.
Figure IV.1 Secondary drivers of river condition including fragmentation of aquatic habitat from diversion dams (left) and pollutant loading as occurs when oil is dumped directly into storm drains (right).
This study suggests ecological conditions are likely to shift further in the coming decades, even under current flow management practices. This trajectory is likely to accelerate with further water development in the basin or with a drying climate. Further reductions in abundance and diversity of sensitive aquatic insects (such as mayflies and stoneflies) can be expected. These species will likely be replaced by Ecological Response Model for Cache la Poudre River December 2014 City of Fort Collins 86
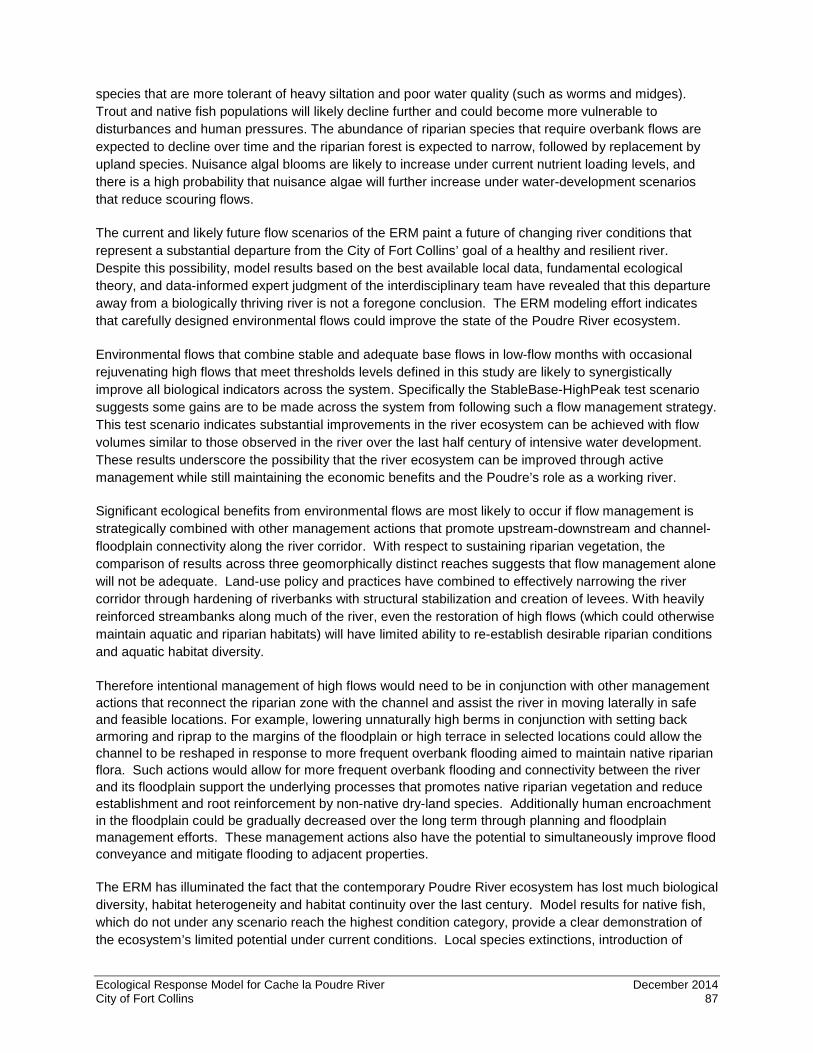
species that are more tolerant of heavy siltation and poor water quality (such as worms and midges). Trout and native fish populations will likely decline further and could become more vulnerable to disturbances and human pressures. The abundance of riparian species that require overbank flows are expected to decline over time and the riparian forest is expected to narrow, followed by replacement by upland species. Nuisance algal blooms are likely to increase under current nutrient loading levels, and there is a high probability that nuisance algae will further increase under water-development scenarios that reduce scouring flows.
The current and likely future flow scenarios of the ERM paint a future of changing river conditions that represent a substantial departure from the City of Fort Collins’ goal of a healthy and resilient river. Despite this possibility, model results based on the best available local data, fundamental ecological theory, and data-informed expert judgment of the interdisciplinary team have revealed that this departure away from a biologically thriving river is not a foregone conclusion. The ERM modeling effort indicates that carefully designed environmental flows could improve the state of the Poudre River ecosystem.
Environmental flows that combine stable and adequate base flows in low-flow months with occasional rejuvenating high flows that meet thresholds levels defined in this study are likely to synergistically improve all biological indicators across the system. Specifically the StableBase-HighPeak test scenario suggests some gains are to be made across the system from following such a flow management strategy. This test scenario indicates substantial improvements in the river ecosystem can be achieved with flow volumes similar to those observed in the river over the last half century of intensive water development. These results underscore the possibility that the river ecosystem can be improved through active management while still maintaining the economic benefits and the Poudre’s role as a working river.
Significant ecological benefits from environmental flows are most likely to occur if flow management is strategically combined with other management actions that promote upstream-downstream and channel-floodplain connectivity along the river corridor. With respect to sustaining riparian vegetation, the comparison of results across three geomorphically distinct reaches suggests that flow management alone will not be adequate. Land-use policy and practices have combined to effectively narrowing the river corridor through hardening of riverbanks with structural stabilization and creation of levees. With heavily reinforced streambanks along much of the river, even the restoration of high flows (which could otherwise maintain aquatic and riparian habitats) will have limited ability to re-establish desirable riparian conditions and aquatic habitat diversity. Therefore intentional management of high flows would need to be in conjunction with other management actions that reconnect the riparian zone with the channel and assist the river in moving laterally in safe and feasible locations. For example, lowering unnaturally high berms in conjunction with setting back armoring and riprap to the margins of the floodplain or high terrace in selected locations could allow the channel to be reshaped in response to more frequent overbank flooding aimed to maintain native riparian flora. Such actions would allow for more frequent overbank flooding and connectivity between the river and its floodplain support the underlying processes that promotes native riparian vegetation and reduce establishment and root reinforcement by non-native dry-land species. Additionally human encroachment in the floodplain could be gradually decreased over the long term through planning and floodplain management efforts. These management actions also have the potential to simultaneously improve flood conveyance and mitigate flooding to adjacent properties.
The ERM has illuminated the fact that the contemporary Poudre River ecosystem has lost much biological diversity, habitat heterogeneity and habitat continuity over the last century. Model results for native fish, which do not under any scenario reach the highest condition category, provide a clear demonstration of the ecosystem’s limited potential under current conditions. Local species extinctions, introduction of
Ecological Response Model for Cache la Poudre River December 2014 City of Fort Collins 87

predacious trout and carp, and the fragmentation by small dams that prevent upstream-downstream movement of aquatic species were all important considerations in the model construct for native fish.
Similarly, as development of the ERM included an in-depth exploration of available data and extensive discussions on relationships and interactions required to build this integrated ecosystem model, the team repeatedly encountered concepts and issues that are unique to this system, thus underscoring the notion that the Poudre is a novel ecosystem. Such a system is not characterized simply through common river theory, relationships, and native species compositions. Instead, this contemporary ecosystem is characterized by a patchwork-like set of physical conditions and an evolving biological makeup. Furthermore, it is likely to have a reduced ecological resilience to both human and natural stressors. Fundamental elements of the novel ecosystem, while not directly drawn from the predictive domain of the model, but that were considered important during model development and interpretation of the results include:
• The river’s altered geomorphic and physical environment (including the river bed, banks and floodplain topography) cannot respond naturally to flows that shape the river and its potential for habitat. The discontinuous patchwork of bank stabilization and associated river bed armoring, pinch points (bridges), and truncated sediment flux have largely eliminated the river’s capacity to self-adjust, and create and maintain a time varying diversity of habitats. A consequence is that maintenance of instream and riparian habitats will likely require mechanical manipulation by river managers as human alterations have largely rendered the river incapable of performing these functions itself as it did in the past.
• Low-flow rates vary along the river profile and riverbed dry-ups occur during extreme periods of low flow. For example, in reaches 3a and 3b more than 12% of days in the Recent Past scenario, constructed from gage data, are estimated to have zero flow. Periods of no flow are detrimental to aquatic species.
• The presence of non-native species throughout the system adds degrees of complexity in the form of additional feedback loops. For example, non-native trout are highly desirable for recreation, but as predators they have an adverse impact on native fish species. This adds a layer of complexity when trying to manage for healthy populations of both native and sport fishes.
• The ERM results suggest the riparian forest has undergone a fundamental shift that has rendered the system unable to self-sustain populations of plains cottonwood – its flagship species. In this void it appears that green ash will likely become an important component of the future forest. However, the recent arrival of the exotic emerald-ash borer (which is likely to decimate green ash populations) makes the future forest composition uncertain. Without a healthy forest canopy along the river’s fringe, normal riparian functions and amenities like nutrient filtration, wildlife habitat, and even shade for recreation will be altered.
• Insofar as future river conditions comprise extended periods of low water, elevated temperatures, greater nutrient concentrations, and reduced frequency of scouring flows, a proliferation of nuisance algae is likely in the coming decades. This makes it difficult to provide a clean riverbed with an aesthetically pleasing water column.
Ecological Response Model for Cache la Poudre River December 2014 City of Fort Collins 88
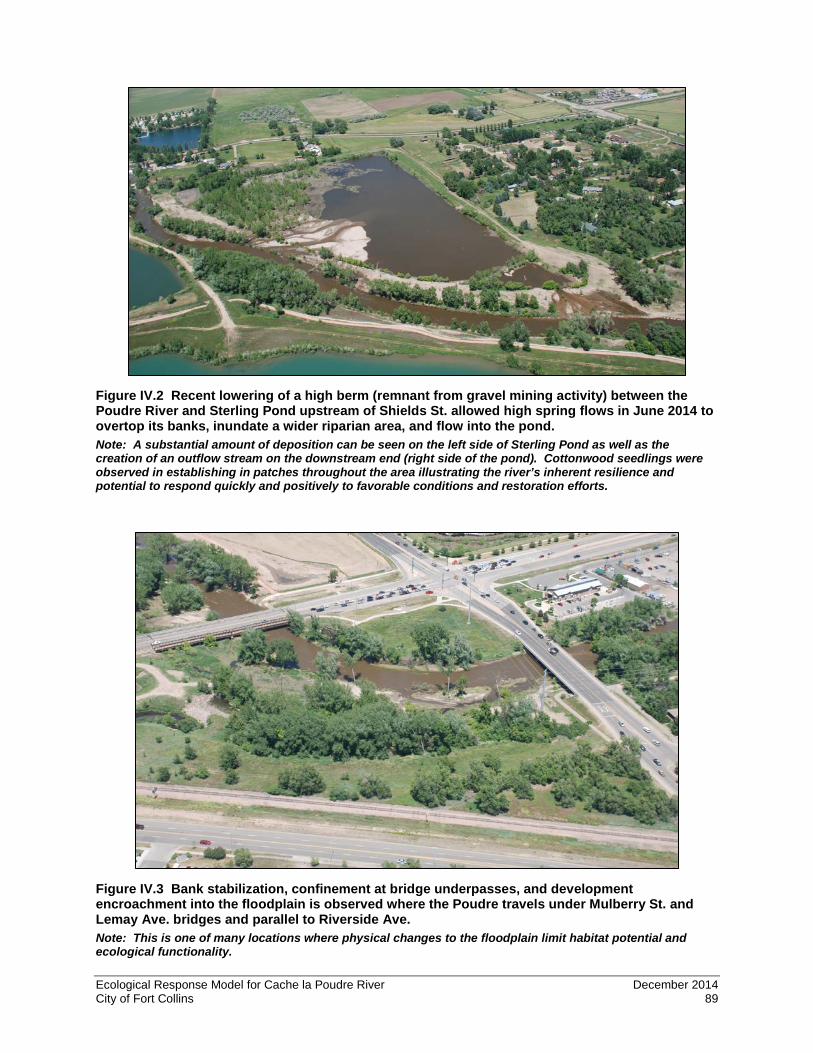
Figure IV.2 Recent lowering of a high berm (remnant from gravel mining activity) between the Poudre River and Sterling Pond upstream of Shields St. allowed high spring flows in June 2014 to overtop its banks, inundate a wider riparian area, and flow into the pond. Note: A substantial amount of deposition can be seen on the left side of Sterling Pond as well as the creation of an outflow stream on the downstream end (right side of the pond). Cottonwood seedlings were observed in establishing in patches throughout the area illustrating the river’s inherent resilience and potential to respond quickly and positively to favorable conditions and restoration efforts.
Figure IV.3 Bank stabilization, confinement at bridge underpasses, and development encroachment into the floodplain is observed where the Poudre travels under Mulberry St. and Lemay Ave. bridges and parallel to Riverside Ave. Note: This is one of many locations where physical changes to the floodplain limit habitat potential and ecological functionality. Ecological Response Model for Cache la Poudre River December 2014 City of Fort Collins 89

The ERM assists managers in identifying specific and potentially obtainable goals and in linking management actions to the attainment of those goals for specific indicators of river health. The findings of this project are not recommendations for water resource and operations managers. The findings do, however, provide a scientific foundation to identify flow targets needed to achieve desired ecosystem functions and biological outcomes.
The purpose of the model was to consider likely biophysical and ecological responses to the range of possible futures, with little restraint as to what is likely, affordable, or administratively possible. Accordingly, the ERM team recognizes the challenge of integrating the ERM with legal, jurisdictional, fiscal, and managerial constraints. Decision makers must ultimately weigh a variety of stakeholder interests and the ecological, economic, and societal consequences associated with all policy options in an atmosphere of some uncertainty, whether acknowledged or otherwise. Probabilistic scientific assessments like those provided in this study can provide a rational, science-based and transparent basis for prediction and decision making by explicitly recognizing uncertainty and helping clarify the likely consequences of policy choices.
POSSIBLE NEXT STEPS The ERM is a flexible tool that allows the incorporation of new information over time. The model’s design team recommends consideration of the following steps.
• Input new hydrologic data and scenarios as they become available from the EIS or other studies to the ERM to refine results and improve prediction confidence.
• Review system understanding and consider possible adjustment of baseline conditions and thresholds in light of recent fires and flooding.
• Develop long-term monitoring and reporting protocol of key indicators to enable the community to track trends in river health and update knowledge underpinning the ERM. Consider additional data collection, analysis, and incorporation as described in Section III to fill important gaps in the understanding of the river system.
• Share these results beyond the scientific and management communities.
Ecological Response Model for Cache la Poudre River December 2014 City of Fort Collins 90
LITERATURE CITED Allan, J. D., and M. M. Castillo (2007). Stream Ecology – Structure and Function of Running Waters.
Springer-Verlag.
American Society of Civil Engineering (ASCE) (1992). Sediment and aquatic habitat in river systems. Journal of Hydraulic Engineering 118(5):669–687.
Andrews, E. D. (1980). Effective and bankfull discharges of streams in the Yampa River Basin, Colorado and Wyoming. Journal of Hydrology 46:311–330.
Ayres Associates (2001). Cache la Poudre River Master Drainageway Plan.
Bartholow, J. M. (2010). Constructing an interdisciplinary flow regime recommendation. Journal of the
American Water Resources Association 46(5):892–906.
Bestgen, K. R., and K. D. Fausch (1993). Status and trends of the fish community at 10 sites in the Cache la Poudre River, from Fort Collins to Greeley, Colorado, 1970-1992. Final Report Eastman Kodak Company and City of Fort Collins, 107 pp.
Biggs, B. J. (1996). Patterns in benthic algae of streams. In: R. J. Stevenson, M. L. Bothwell, and R. L. Lowe (Eds.), Algal Ecology: Freshwater Benthic Ecosystems, Academic Press, San Diego, CA, pp. 31–56.
Biedenharn, D. S., R. R. Copeland, C. R., Thorne, P. J. Soar, R. D. Hey, and C. C. Watson (2000). Effective discharge calculation: A practical guide. Technical Report No. ERDC/CHL TR-00-15, U. S. Army Corps of Engineers, Engineer Research and Development Center, Vicksburg, MS.
Borsuk, M. E., C. A. Stow, and K. H. Reckhow (2004). A Bayesian network of eutrophication models for synthesis, prediction, and uncertainty analysis. Ecological Modelling 173:219–239.
Box, G. E. P. 1976. Science and Statistics. Journal of the American Statistical Association 71:791-799
Bureau of Reclamation (BOR) (2011). West-wide climate risk assessments: Bias-corrected and spatially downscaled surface water projections. Technical Memorandum No. 86-68210-2011-01, U. S. Department of the Interior, BOR, Technical Services Center, Denver, CO, 138 pp.
Colorado Department of Public Health and Environment (CDPHE) (2012). Regulation No. 31: The basic standards and methodologies for surface water. 5 CCR 1002-31, CDPHE, Water Quality Control Commission.
Cohn, T. A., L. L. DeLong, E. J. Gilroy, R. M. Hirsch, and D. K. Wells (1989). Estimating constituent loads. Water Resources Research 22(5):937–942; URL: http://www.timcohn.com/Publications/CohnDelong1989.pdf
City of Fort Collins (2011). City Plan: Cache la Poudre River Natural Areas Management Plan Update. Principles ENV 24 (The City will support a healthy and resilient Cache la Poudre ecosystem and protect, enhance and restore the ecological values of the River), ENV 24.4 (Restore and enhance), and ENV 24.5 (Coordinate to provide adequate instream flows), City of Fort Collins, Natural Areas Program, February 15, pp. 42.
Colorado State University (2013). The Poudre Runs Through It Progress Report. URL: http://cwi.colostate.edu/ThePoudreRunsThroughIt/files/PoudreRunsThruItProgressReport (accessed 2013).
Ecological Response Model for Cache la Poudre River December 2014 City of Fort Collins 91

Decision Systems Laboratory, (2014). GeNIe (Graphical Network Interface) & SMILE (Structural Modeling, Inference, and Learning Engine). Vers. 2.0. Computer Software. University of Pittsburgh, School of Information Sciences, Pittsburgh, PA. URL: http://genie.sis.pitt.edu/
Diansky, N.A., and E.M. Volodin, 2002. “Simulation of Present-Day Climate with a Coupled Atmosphere-Ocean General Circulation Model,” Izvestiya, Atmospheric and Oceanic Physics. (Engl Transl), 38(6):732-747.
Dodds, W. K., V. H. Smith, and B. Zander (1997). Developing nutrient targets to control benthic chlorophyll levels in streams: A case study of the Clark Fork River. Water Research 31:1738–1750.
Dodds, W. K., V. H. Smith, and K. Lohman (2002). Nitrogen and phosphorus relationships to benthic algal biomass in temperate streams. Canadian Journal of Fisheries and Aquatic Sciences 59:865–874; DOI: 10.1139/F02-063.
Elmund, K., S. Strong, and B. Hamdan (2011). 2010 City of Fort Collins Lower Cache la Poudre River & Urban Creek Water Quality Report. City of Fort Collins Utilities, Fort Collins, CO.
Emmett, W. W., and M. G. Wolman (2001). Effective discharge and gravel-bed rivers. Earth Surface Processes and Landforms 26:1369–1380.
Environmental Laboratory (1987). "Corps of Engineers Wetlands Delineation Manual," Technical Report Y-87-1, U.S. Army Engineer Waterways Experiment Station, Vicksburg, Miss. (online edition) URL: http://el.erdc.usace.army.mil/wetlands/pdfs/wlman87.pdf (accessed 9/25/2012).
Etchells, T., K. S. Tan, and D. Fox (2005). Quantifying the uncertainty of nutrient load estimates in the Shepparton Irrigation Region. In: A. Zerger and R. M. Argent (Eds.), Proc. MODSIM 2005 International Congress on Modelling and Simulation, Modelling and Simulation Society of Australia and New Zealand, 0-9758400-0-2, December, pp. 2665–2671; URL: <http://www.mssanz.org.au/modsim05/papers/etchells_2.pdf>
Fausch, K. D., and K. R. Bestgen (1997). Ecology of fishes indigenous to the central and southwestern Great Plains. In: F. L. Knopf and F. B. Samson (Eds.), Ecology and Conservation of Great Plains Vertebrates, Ecological Studies 125, Springer-Verlag, New York, NY, pp. 131–166.
Friedman, J. M., G. T. Auble, P. B. Shafroth, M. L. Scott, M. F. Merigliano, M. D. Freehling, and E. R. Griffin (2005). Dominance of non-native riparian trees in western USA. Biological Invasions 7:747–751.
Grant, G. E., F. Swanson and M. G. Wolman (1990) Pattern and origin of stepped-bed morphology in high-gradient streams, Western Cascades, Oregon. Geological Society of America Bulletin, 102, 340-52 pp.
Grotheer, S. A., N. J. Voelz, S. H. Shieh, J. V. Ward, and J. M. Chudd (1994). Developing a biotic index for Colorado stream quality. Completion Report 187, Colorado Water Resources Research Institute, 170 pp.
Hauer, F. R. and G. A. Lamberti (Eds.) (2006). Methods in Stream Ecology. Second Edition, Elsevier, San Diego, CA, 87 pp.
Hickenlooper, John W. (2013), Executive Order D 2013-005 May 14, 2013.
Hilsenhoff, W. L. (1987). An improved biotic index of organic stream pollution. Great Lakes Entomologist 20: 31–39.
Jackson, D. and M. L. Spence (Eds.) (1970). The expeditions of John Charles Frémont – Vol. 1: Travels from 1838 to 1844. University of Illinois Press, Urbana, IL.
Ecological Response Model for Cache la Poudre River December 2014 City of Fort Collins 92
Lytle D. A., and N. L. Poff (2004). Adaptation to natural flow regimes. Trends Ecology and Evolution 19:94–100.
Mahoney, J. M., and S. B. Rood (1998). Streamflow requirements for cottonwood seedling recruitment – An integrative model. Wetlands 18:634–645.
Marcot, B. G., R. S. Holthausen, M. G. Raphael, M. M. Rowland, and M. J. Wisdom (2001). Using Bayesian belief networks to evaluate fish and wildlife population viability under land management alternatives from an environmental impact statement. Forest Ecology and Management 153:29–42.
Merritt, R. W, K. W. Cummins, V. H. Resh, and D. P. Batzer (2008). Sampling aquatic insects: collection devices, statistical considerations, and rearing procedures. In: R. W. Merritt, K. W. Cummins, and M. B. Berg (Eds.), An Introduction to the Aquatic Insects of North America, Fourth Edition, Kendall/Hunt Publishing Company, Dubuque, IA, pp. 15-37.
Merritt, D. M., M. L. Scott, N. L. Poff, G. T. Auble, and D. A. Lytle (2010). Theory, methods and tools for determining environmental flows for riparian vegetation: riparian vegetation-flow response guilds. Freshwater Biology 55:206–225.
Milhous, R. T. (2000). Numerical modeling of flushing flows in gravel-bed rivers. In: P. C. Klingeman, R. L. Beschta, P. D. Komar, and J. B. Bradley (Eds.), Gravel-bed Rivers in the Environment, Water Resources Publications, Littleton, CO, pp. 579–608.
Milhous, R.T. (2003). Reconnaissance-level application of physical habitat simulation in the evaluation of physical habitat limits in the Animas Basin, Colorado. U. S. Geological Survey Open-File Report 03-222, Fort Collins Science Center, Fort Collins, CO, 16 pp.
Milhous, R. T. (2007). An adaptive assessment of the flushing flow needs of the lower Poudre River, Colorado: First evaluation. Paper presented at the Annual Rocky Mountain Hydrologic Research Center Conference, Wild Basin Lodge, Allenspark, CO, September 28.
Milhous, R. T. (2009). An adaptive assessment of the flushing flow needs of the lower Poudre River, Colorado: First evaluation. In: J. A. Ramirez (Ed.), Proc. Hydrology Days 2009, Colorado State University, Fort Collins, CO, pp. 46–56.
National Research Council (NRC) (1995). Wetlands: Characteristics and Boundaries. National Academy Press, Washington, DC.
Nehring, R. B., B. Heinold and J. Pomeranz (2011). Colorado River Aquatic Resources Investigations General Professional V Co-Authors. Federal Aid Project F-237R-18, Colorado Division of Wildlife, Aquatic Wildlife Research Section, Fort Collins, CO.
Otway, H. and D. Winterfeldt (1992). Expert judgment in risk analysis and management: Process, context, and pitfalls. Risk Analysis 12:83–93.
Parker, G., P. C. Klingeman, and D. G. McLean (1982). Bedload and size distribution in paved gravel-bed streams. Journal of the Hydraulics Division 108:544–571.
Pickup, G. and R. F. Warner (1976). Effects of hydrologic regime on magnitude and frequency of dominant discharge. Journal of Hydrology 29:51–75.
Plafkin, J. L., M. T. Barbour, K. D. Porter, S. K. Gross, and R. M. Hughes (1989). Rapid bioassessment protocols for use in streams and rivers: Benthic macroinvertebrates and fish. EPA/444/4-89-001, U. S. Environmental Protection Agency, Washington, DC.
Platts, W. S., W. F. Megahan, and G. W. Minshall (1983). Methods for evaluating stream, riparian, and biotic conditions. General Technical Report INT-138, U. S. Department of Agriculture, Forest Service, Intermountain Forest and Range Experiment Station, Ogden, UT, 70 pp.
Ecological Response Model for Cache la Poudre River December 2014 City of Fort Collins 93

Preston, S. D., V. J. Bierman Jr., and S. E. Silliman (1989). An evaluation of methods for the estimation of tributary mass loads. Water Resources Research 25:1379–1389; URL: http://www.agu.org/pubs/crossref/1989/WR025i006p01379.shtml
Rice, D. A. and K. R. Bestgen (2006). Cache la Poudre River water quality study – Yearly summary 2005. Report to Eastman Kodak Company, Colorado Division, Colorado State University, Fort Collins, CO.
Rood, S. B., L. A. Goater, J. M. Mahoney, C. M. Pearce, and D. G. Smith (2007). Floods, fire, and ice: Disturbance ecology of riparian cottonwoods. Canadian Journal of Botany 85:1019–1032.
Rosenberg D. M, V. H. Resh, and R. S. King (2008). Use of aquatic insects in biomonitoring. In: R. W. Merritt, K. W. Cummins, and M. B. Berg (Eds.), Introduction to the Aquatic Insects of North America, Kendall/Hunt, Dubuque, IA, pp. 123–138.
Rosenberg, D. M. and V. H. Resh (1993). Freshwater biomonitoring and benthic macroinvertebrates. Chapman and Hall, New York, NY, 488 pp.
Schultz, M. T., T. D. Borrowman, and M. J. Small (2011). Bayesian networks for modeling dredging decisions. Report ERDC/EL TR-11-14, U. S. Army Corps of Engineers, Engineer Research and Development Center, Environmental Laboratory, Vicksburg, MS, October, 74 pp.
Scott, M. L., and G. T. Auble (2002). Conservation and restoration of semi-arid riparian forests: A case study from the upper Missouri River, Montana, USA. In: B. Middleton (Ed.), Flood Pulsing and Wetland Restoration in North America, John Wiley and Sons, Inc., pp. 145-190.
Shanahan, J. O. (2009). Characterization of Woody Vegetation of the Cache la Poudre River Riparian Corridor in Fort Collins. City of Fort Collins, Natural Areas Department.
Shieh, S. H., B. C. Kondratieff, J. V. Ward, and D. A. Rice (1999). The relationship of macroinvertebrate assemblages to water chemistry in a polluted Colorado plains stream. Archives Hydrobiologica 145:405–432.
Shieh, S. H., J. V. Ward, and B. C. Kondratieff (2002). Energy flow through macroinvertebrates in a polluted plains stream. Journal of North American Benthological Society 21:660–675.
Soar, P. J., and C. R. Thorne (2001). Channel restoration design for meandering rivers. Report No. ERDC/CHL CR-01-1, U. S. Army Corps of Engineers, Engineer Research and Development Center, Vicksburg, MS, 454 pp.
Stewart-Koster, B., S. E. Bunn, S. J. Mackay, N. L. Poff, R. J. Naiman, and P. S. Lake (2010). The use of Bayesian networks to guide investments in flow and catchment restoration for impaired river ecosystems. Freshwater Biology 55(1):243–260.
Uusitalo, L. (2007). Advantages and challenges of Bayesian networks in environmental modelling. Ecological Modelling 203(3–4):312–318.
U. S. Army Corps of Engineers (USACE) (2008). Draft Environmental Impact Statement: Northern Integrated Supply Project. USACE, Omaha District, Omaha, NE.
U.S. Environmental Protection Agency (2012). Clean Water Act. Section 404, EPA; URL: http://water.epa.gov/lawsregs/guidance/wetlands/sec404.cfm (accessed 2012).
U. S. Geological Survey (USGS) (2003). National Water-Quality Assessment (NAWQA) Program web site. USGS, URL: http://www.water.gov/nawqa.
Voelz, N. J., S. H. Shieh, and J. V. Ward (2000). Long-term monitoring of benthic macroinvertebrate community structure: A perspective from a Colorado river. Aquatic Ecology 34:261–278.
Ecological Response Model for Cache la Poudre River December 2014 City of Fort Collins 94
Voelz, N. J., R. E. Zuellig, S.-H. Shieh, and J. V. Ward (2005). The effects of urban areas on benthic macroinvertebrates in two Colorado plains rivers. Environmental Monitoring and Assessment 101:175–202.
von Winterfeldt, D. and W. Edwards (1986). Decision analysis and behavioral research. Cambridge University Press, Cambridge, UK.
Wallace, J. B., J. W. Grubaugh, and M. R. Whiles (1996). Biotic indices and stream ecosystem processes: Results from an experimental study. Ecological Applications 6:140-151.
Waters, T. F. (1995). Sediment in streams – sources, biological effects, and control. American Fisheries Society Monograph 7:251.
Whiting, P. J. (2002). Streamflow necessary for environmental maintenance. Annual Review of Earth and Planetary Sciences 30:181–206.
Wilcock, P. R., and J. C. Crowe (2003). Surface-based transport model for mixed-size sediment. Journal of Hydraulic Engineering 129(2):120–128.
Wohl, E. E. (2001). Virtual Rivers: Lessons from the Mountain Rivers of the Colorado Front Range. Yale University Press, New Haven, CT, 210 pp.
Wohl, E. (2010). Mountain rivers revisited. Vol 19 American Geophysical Union. ISBN: 0875903231
Zuellig, R. E., B. D. Heinold, B. C. Kondratieff, and D. E. Ruiter (2011). Diversity and distribution of mayflies (Ephemeroptera), stoneflies (Plecoptera), and caddisflies (Trichoptera) of the South Platte River Basin, Colorado, Nebraska, and Wyoming, 1873-2010. U. S. Geological Survey Data Series 606, 257 pp.
Ecological Response Model for Cache la Poudre River December 2014 City of Fort Collins 95