An automatic method for burn scar mapping using support ...lewang/pdf/lewang_sample20.pdf · data...
18
An automatic method for burn scar mapping using support vector machines X. CAO{{, J. CHEN*{, B. MATSUSHITA§, H. IMURA" and L. WANG{{ {Key Laboratory of Environment Change and Natural Disaster, Ministry of Education of China, College of Resource Science and Technology, Beijing Normal University, Beijing, 100875, China {Graduate School of Engineering, Nagoya University, Nagoya 464-8603, Japan §Graduate School of Life and Environmental Sciences, University of Tsukuba, Tsukuba 305-8572, Japan "Graduate School of Environmental Studies, Nagoya University, Nagoya 464-8603, Japan {{Department of Geography, 601 University Drive, ELA #139, Texas State University, San Marcos, TX 78666, USA (Received 27 March 2007; in final form 29 April 2008 ) Wildfires release large amounts of carbon, smoke and aerosols that strongly impact the global climatic system. Burn scar is an important parameter when modelling the impact of wildfires on the ecosystem and the climatic system. We have developed an automatic burn scar mapping method using daily Moderate Resolution Imaging Spectroradiometer (MODIS) data, in which the Global Environment Monitoring Index (GEMI), a vegetation index VI3T and a new index, GEMI-Burn scar (GEMI-B), were used together to enhance the differences between burned and unburned pixels related to vegetation photo- synthesis, surface temperature and vegetation water content, respectively, and an automatic region growing method based on Support Vector Machines (SVMs) was used to classify burn scars without any predefined threshold. A case study was carried out to validate the new method at the border area between Mongolia and China, where a wildfire took place in May 2003. The results show that the burn scar area extracted by the new method is consistent with that from Landsat Thematic Mapper (TM) data with high accuracy. The sound performance of the new technique is due to the following reasons: (1) multiple features of burn scar spectra were combined and used, (2) a reasonable assumption was made stating that the neighbourhoods of active fires (hotspots) are most likely to be burn scars, (3) an SVM classifier was adopted that works well with a small number of training samples, and (4) an iterative classification procedure was developed that is capable of running continuous training for the SVM classifier to deal with the transitionary features of burn scar pixels. The results suggest that the new index GEMI-B and automatic mapping method based on SVMs have the potential to be applied to near real-time burn scar mapping in grassland areas. *Corresponding author. Email: [email protected] International Journal of Remote Sensing Vol. 30, No. 3, 10 February 2009, 577–594 International Journal of Remote Sensing ISSN 0143-1161 print/ISSN 1366-5901 online # 2009 Taylor & Francis http://www.tandf.co.uk/journals DOI: 10.1080/01431160802220219 Downloaded By: [University at Buffalo, the State University of New York (SUNY)] At: 20:59 15 September 2009
Transcript of An automatic method for burn scar mapping using support ...lewang/pdf/lewang_sample20.pdf · data...

An automatic method for burn scar mapping using support vectormachines
X. CAO{{, J. CHEN*{, B. MATSUSHITA§, H. IMURA" and L. WANG{{
{Key Laboratory of Environment Change and Natural Disaster, Ministry of Education
of China, College of Resource Science and Technology, Beijing Normal University,
Beijing, 100875, China
{Graduate School of Engineering, Nagoya University, Nagoya 464-8603, Japan
§Graduate School of Life and Environmental Sciences, University of Tsukuba, Tsukuba
305-8572, Japan
"Graduate School of Environmental Studies, Nagoya University, Nagoya 464-8603,
Japan
{{Department of Geography, 601 University Drive, ELA #139, Texas State University,
San Marcos, TX 78666, USA
(Received 27 March 2007; in final form 29 April 2008 )
Wildfires release large amounts of carbon, smoke and aerosols that strongly
impact the global climatic system. Burn scar is an important parameter when
modelling the impact of wildfires on the ecosystem and the climatic system. We
have developed an automatic burn scar mapping method using daily Moderate
Resolution Imaging Spectroradiometer (MODIS) data, in which the Global
Environment Monitoring Index (GEMI), a vegetation index VI3T and a new
index, GEMI-Burn scar (GEMI-B), were used together to enhance the
differences between burned and unburned pixels related to vegetation photo-
synthesis, surface temperature and vegetation water content, respectively, and an
automatic region growing method based on Support Vector Machines (SVMs)
was used to classify burn scars without any predefined threshold. A case study
was carried out to validate the new method at the border area between Mongolia
and China, where a wildfire took place in May 2003. The results show that the
burn scar area extracted by the new method is consistent with that from Landsat
Thematic Mapper (TM) data with high accuracy. The sound performance of the
new technique is due to the following reasons: (1) multiple features of burn scar
spectra were combined and used, (2) a reasonable assumption was made stating
that the neighbourhoods of active fires (hotspots) are most likely to be burn
scars, (3) an SVM classifier was adopted that works well with a small number of
training samples, and (4) an iterative classification procedure was developed that
is capable of running continuous training for the SVM classifier to deal with the
transitionary features of burn scar pixels. The results suggest that the new index
GEMI-B and automatic mapping method based on SVMs have the potential to
be applied to near real-time burn scar mapping in grassland areas.
*Corresponding author. Email: [email protected]
International Journal of Remote Sensing
Vol. 30, No. 3, 10 February 2009, 577–594
International Journal of Remote SensingISSN 0143-1161 print/ISSN 1366-5901 online # 2009 Taylor & Francis
http://www.tandf.co.uk/journalsDOI: 10.1080/01431160802220219
Downloaded By: [University at Buffalo, the State University of New York (SUNY)] At: 20:59 15 September 2009

1. Introduction
Wildfire is a natural process that disturbs ecosystem succession. Biomass burning
emits large amounts of trace gasses (CO2, CO, CH4 and NOx) and aerosols that not
only modify the chemical composition in the atmosphere but also directly impact the
radiation budget and global climate system (Crutzen and Andreae 1990). Moreover,
wildfire circumvents the proper functioning of the regional ecosystem, deteriorates
habitat and diminishes biodiversity (Lovejoy 1991), changes continuous patterns of
vegetation (Christensen 1993) and alters nutrient cycling (Menaut et al. 1993). In
recent decades, a higher frequency of wildfire (Weber and Stocks 1998) in mid- and
high latitudes has been observed, partly as a result of climate warming (Hansen et al.
1996). To assess and estimate the impact of wildfire on ecosystems, the area of the
burn scars, as the most vital parameter for running various models, has to be
acquired (Vafeidis and Drake 2005).
At this stage, the task of burn scar detection is undertaken mainly through
analysis of remotely sensed data. Satellite remote sensing provides a unique
opportunity to observe active fire and burn scars at global and regional scales with
high temporal frequency. As of today, various remotely sensed data have been used
in fire detection or burn scar mapping. Among them, the National Oceanic and
Atmospheric Administration Advanced Very High Resolution Radiometer (NOAA/
AVHRR) data are the most widely used coarse-resolution data in active fire
detection (Kaufman et al. 1990, Justice et al. 1996, Li et al. 2000a,b, 2001) and burn
scar mapping (Fernandez et al. 1997, Pereira 1999, Fraser et al. 2000a, Li et al.
2000b). SPOT VEGETATION (VGT; Fraser et al. 2000b, Stroppiana et al. 2002,
2003a,b) and Along-Track Scanning Radiometer (ATSR; Eva and Lambin 1998,
Simon et al. 2004) data have also been used to extract burn scars at a regional scale.
Recently, Moderate Resolution Imaging Spectroradiometer (MODIS) data have
become more popular (Kaufman et al. 1998, Justice et al. 2002, Li et al. 2004, Roy et
al. 2005, 2006) because of their higher spatial resolution and refined band design
compared with NOAA/AVHRR and SPOT VGT. When a local scale is needed,
Landsat Thematic Mapper (TM) and Enhanced TM plus (EMT + ) are the major
data vehicles in burn scar mapping (Key and Benson 1999, Garcıa-Haro et al. 2001).
Multitemporal composite data are often used in burn scar mapping to reduce cloud
contamination (Barbosa et al. 1998, Chuvieco et al. 2005). For example, in the
techniques introduced by Fernandez et al. (1997) and Fraser et al. (2000a) for
hotspot and Normalized Difference Vegetation Index (NDVI) differencing synergy
(HANDS), multitemporal NDVIs are first derived from the maximum value
composite (MVC) in 10 days. The burned area product MCD45A1 of MODIS
adopted change detection methods that are designed based on the Bidirectional
Reflectance Distribution Function (BRDF) model (Roy et al. 2006). To be exempt
from cloud contamination, a minimum of 16-day continuous MODIS data have to
be used (Roy et al. 2005). However, single-day MODIS data have been used for real-
time burn scar mapping; for example, Li et al. (2004) identified burn scars using
daily MODIS data.
Regardless of the quality of the data, the method to be adopted is most important
for the success of burn scar mapping. Among various methods that have been
reported, vegetation indices (VIs) have demonstrated superb advantages for
enhancing the discrepancies between burned and unburned pixels. Specifically,
there are predominantly three types of VIs for the purpose of mapping burn scars.
The first type was applied to search for the cessation of photosynthesis for burned
578 X. Cao et al.
Downloaded By: [University at Buffalo, the State University of New York (SUNY)] At: 20:59 15 September 2009

green vegetation. These VIs include the NDVI, the Global Environment Monitoring
Index (GEMI; Pinty and Verstraete 1992) and the Soil-Adjusted Vegetation Index
(SAVI; Huete 1988). The latter two indices, in particular, are more suitable for
sparse vegetation areas (Stroppiana et al. 2002, Lasaponara 2006). The second type
of VI indicates the amount of water loss after the vegetation was burned. These
indices include the Normalized Difference Infrared Index (NDII; Garcia and
Chuvieco 2004), the Short Wave Vegetation Index (SWVI; Fraser et al. 2000b), the
Normalized Difference Water Index (NDWI; Gao 1996) and the Normalized Burn
Ratio (NBR; Key and Benson 2006). The third type of VI is aimed at detecting the
higher surface temperature of burned vegetation due to a decrease in evapotran-
spiration (Goward et al. 1985) and an increase in surface absorption (Barbosa et al.
1998). VI3, GEMI3 (Pereira 1999) and also VI3T (Barbosa et al. 1999), in which a
red band is replaced by a thermal band, are three examples of this category. The
underlying problem for most of the burn scar mapping methods is that each of them
can only capture limited aspects of burned vegetation, but very few of the methods
can comprehensively examine as many aspects as possible, through which a more
reliable result should be achieved.
Another problem with the existing burn scar mapping method is the difficulty in
choosing an optimal threshold. A number of studies have used a fixed threshold for
global or regional burn scar mapping. For example, the GLOBSCAR products of
ATSR (Simon et al. 2004) used fixed thresholds in both K1 and E1 algorithms, in
which K1 was calculated at local scale (50630 km) by ATSR near-infrared (NIR)
and thermal infrared (TIR) bands. In addition, Stroppiana et al. (2003b) defined
seven rules for burned pixel judgement, in which each rule was a combination of a
set of fixed thresholds. The MODIS burned area product MCD45A1 (Roy et al.
2006) defined a fixed and wavelength-independent Z-score threshold to distinguish
the difference of burned pixel reflectances between BRDF inversed and observed.
However, it has been noted that fixed threshold methods performed poorly for
varying atmospheric effects and different land covers (Barbosa et al. 1999). To
overcome the limitations of fixed thresholds, automatic and varying threshold
methods were developed by calculating the mean and standard deviation (SD) in a
small neighbourhood. Fernandez et al. (1997) proposed two automatically derived
thresholds, one of which was defined as mean + 26SD from an NDVI differencing
image within a 1006100 window. Roy et al.’s (1999) threshold was defined as mean
+ 46SD on a VI3 change image. The HANDS technique (Fraser et al. 2000a)
produced thresholds by mean + SD at a 2006200 block. Other than the local
window, the Burn Area Algorithm (BAA; Barbosa et al. 1999) came up with an
automatic VI3T threshold as the mean – SD for each pixel with a long temporal
series (52 weeks). However, Vafeidis and Darke (2005) also noted that the automatic
thresholds simply based on the mean and standard deviation would not work well
for different sources of data, vegetation types or VIs. Regardless of these studies, it
remains a challenge to determine an optimal threshold in an automatic fashion in
burn scar mapping.
The northeastern and central Asian grassland is an area that is under heavy threat
of wildfire because of abundant litter, severe drought in spring and autumn, strong
winds and a flat elevation (Liu et al. 1999). In addition, as arid and semi-arid
grassland presents a landscape with a low fraction of vegetation and a strong soil
background, previous burn scar mapping methods may not operate well in this
region. This study therefore aimed to develop an automatic burn scar mapping
Burn scar mapping using SVMs 579
Downloaded By: [University at Buffalo, the State University of New York (SUNY)] At: 20:59 15 September 2009

method that would be applicable to the region. Since grassland fires occurred most
often in spring or autumn as a result of low NDVI and low moisture within the
grassland, we focused on solving two major problems in this research. First, we
concentrated on ways to select and combine VIs that can take into account
photosynthesis, water content and surface temperature features so that the
discrepancy between burned and unburned pixels in lower vegetated areas could
be maximized. Second, we determined how to automatically detect burn scars using
daily MODIS data without predefined thresholds.
2. Study area and data
We selected the grassland located in the boundary between Mongolia and China as
the study area (figure 1) because a wildfire took place in this area on 21 May 2003.
The wildfire began in Mongolia and then spread to China. It was extinguished in
China on 23 May but continued to burn in Mongolia until 26 May.
MODIS bands 1–7 (with a spatial resolution of 500 m) and bands 21, 22 and 31
(with a spatial resolution of 1 km) from 21 to 30 May 2003 from the Terra satellite
were collected and used in the study (figure 2). The properties of these bands are
listed in table 1. The original MODIS Level 1B data were geometrically rectified and
radiometrically calibrated to produce apparent reflectance data (bands 1–7) and
brightness temperature data (bands 21, 22 and 31). Two Landsat TM images
covering the study area (path/row codes 123/27 and 123/28) were used as validation
data with a spatial resolution of 30 m. The acquisition date of the TM images was 2
June 2003. The International Geosphere Biosphere Programme (IGBP) global land
cover map was also used to mask grassland from forests, urban areas, bare land and
water (Loveland et al. 2000).
Figure 1. Study area on the border of China and Mongolia.
580 X. Cao et al.
Downloaded By: [University at Buffalo, the State University of New York (SUNY)] At: 20:59 15 September 2009

3. Methodology
Near real-time and dynamic burn scar mapping requires daily MODIS data. It is
difficult to define fixed thresholds or automatic thresholds on all the single daily
data, given the daily variation of atmosphere conditions, aerosols, clouds, and the
solar zenith angle. Even on the same scene, the sensor zenith angle varies from 0u to
approximately 60u because of the 703 km orbit height of Terra/Aqua with a 2330 km
swath. Therefore, there is a crucial need to have an alternative classification method
other than the fixed thresholds methods. The new technique proposed by this study
Figure 2. MODIS data for grassland fire and burn scar expansion (bands 7, 6, 5 as RGB),21–30 May 2003 (brown coloured regions are burn scars).
Table 1. Properties of the MODIS bands used.
Band Wavelength*Spatial
resolution (m)Signal tonoise ratio Main use
1 620–670 250{ 128 Land/cloudboundary2 841–876 250{ 201
3 459–479 500 243 Land/cloudproperties4 545–565 500 228
5 1230–1250 500 746 1628–1652 500 2757 2105–2155 500 110
21 3.929–3.989 1000{ 2.00{ Land surface/cloud temperature22 3.929–3.989 1000{ 0.07{
31 10.780–11.280 1000{ 0.05{
*Bands 1–7 in nm; bands 21, 22 and 31 in mm.{The 500 m resolution was used in this study.{NEDT: noise-equivalent temperature difference.
Burn scar mapping using SVMs 581
Downloaded By: [University at Buffalo, the State University of New York (SUNY)] At: 20:59 15 September 2009

is based on the region-growing method using Support Vector Machines (SVMs). It
can be divided into three steps, as shown in the flowchart in figure 3: (1) selection ofburn scar indices to enhance the difference between burned and unburned pixels; (2)
detection of active fire (hotspots) for automatically choosing training samples; and
(3) classification using SVMs. A detailed description of the method is given in the
following sections.
3.1 Selection of VIs for burn scar mapping
Three VIs (GEMI, VI3T and a new index GEMI-B) were selected based on a
discrimination analysis of the difference in the cessation of photosynthesis, the
increase in surface temperature, and the water content loss between burned pixels
and non-burned pixels. In the following, detailed definitions of the three VIs are
provided, and then an evaluation of the discrimination capability of the three VIs in
comparison to other VIs is addressed.
3.1.1 GEMI. The GEMI proposed by Pinty and Verstraete (1992) reflects the
photosynthesis capability of green vegetation. It is insensitive to soil background and
is suitable for monitoring vegetation activity and detecting burn scars in sparsely
vegetated areas (Stroppiana et al. 2002, Lasaponara 2006). The index is defined as:
GEMI~g 1{0:25gð Þ{ rRED{0:125ð Þ= 1{rREDð Þ ð1Þ
where g~ 2 r2NIR{r2
RED
� �z1:5rNIRz0:5rRED
� ��rNIRzrREDz0:5ð Þ, and rNIR and
rRED are reflectances in the red and near-infrared (NIR) bands, respectively.
Figure 3. Flowchart of the automatic burn scar mapping method based on SVMs.
582 X. Cao et al.
Downloaded By: [University at Buffalo, the State University of New York (SUNY)] At: 20:59 15 September 2009

3.1.2 VI3T. The VI3T proposed by Barbosa et al. (1999) was used to reveal the
high surface temperature of burned vegetation due to a decrease in evapotranspira-
tion and an increase in surface absorption. It is defined as:
VI3T~ rNIR{BT3=1000ð Þ= rNIRzBT3=1000ð Þ ð2Þ
where BT3 is the brightness temperature of the mid-infrared (MIR) band.
3.1.3 GEMI-B. As the overall water content of vegetation is low in arid and semi-
arid grassland areas, the frequently used VIs built upon vegetation water content,
such as the NDII, are not capable of discerning the difference between burned and
unburned pixels. Therefore, a new water content-related index was developed based
on the spectral characteristics of the burn scars in this study.
According to the IGBP land cover map, we separated pixels from daily MODIS
images by land cover types, including burn scars, non-burnt forest and steppes,
bodies of water, clouds, and burn scars covered by thin clouds. Figure 4 shows the
mean reflectance of each selected class. The spectral characteristics of the burn scar
pixels compared with the other types of pixels were concluded to be as follows: (1)
reflectances of both burn scars and water are low and flat, and that of the burn scar
is slightly higher than that of water in the near-infrared (NIR) and shortwave
infrared (SWIR) bands; (2) reflectances of vegetation and clouds are much higher
than the burn scar and vary in magnitude; (3) the burn scar, non-burnt forest and
steppe are very similar in the visible region but are distinctively different in the NIR
and SWIR regions because combustion absorbs the reflected energy in these
wavelength regions; and (4) burn scars covered with thin clouds have a similar
spectral pattern but higher reflectance than burn scars that are not covered with thin
cloud.
Based on the spectral characteristics of burn scars, Pereira (1999) suggested using
the NIR-MIR region to identify burn scars because this region overlaps with the water
absorption band and is less affected by atmospheric conditions and aerosols. Li et al.
Figure 4. Mean reflectance for different land cover types on MODIS bands 1–7.
Burn scar mapping using SVMs 583
Downloaded By: [University at Buffalo, the State University of New York (SUNY)] At: 20:59 15 September 2009
(2004) measured the spectra of burned areas by airborne visible/infrared imaging
spectrometer (AVIRIS) and empirically distinguished burned pixels from unburned
using MODIS bands 5 (centred at 1.24 mm) and 7 (centred at 2.13mm) because these
two longer wavelength bands are not only sensitive to the water content of vegetation
but are also less affected by smoke, aerosols and thin clouds compared with visible
and NIR bands. According to the spectral characteristics of the burn scars on
northeastern Asian grassland and the works of Li, Pereira and co-workers, a new
index, known as the Global Environment Monitoring Index-Burn scar (GEMI-B),
was developed with MODIS bands 5 and 7 as surrogates of the red and NIR bands in
the original GEMI equation:
GEMI-B~g 1{0:25gð Þ{ r5{0:125ð Þ= 1{r5ð Þ ð3Þ
where g~ 2 r27{r2
5
� �z1:5r7z0:5r5
� ��r7zr5z0:5ð Þ, r5 and r7 are reflectances of
MODIS bands 5 and 7, respectively. Figure 5 shows a scatter plot in the MODIS band
5 and band 7 space using a total of 800 pixels with different classes from the MODIS
data acquired on 24 May 2003. The isolines of GEMI-B are also plotted in figure 5. It is
clear that the pixels of the burn scars, forest, grassland, water and clouds are clustered,
with large distances between these classes. Burn scars have the highest GEMI-B values
and can be identified by a threshold around 0.25 (solid black line in figure 5). Water
pixels have GEMI-B values between 0.1 and 0.2. Grassland pixels have a higher
reflectance than forest in band 7, and their GEMI-B values are between 20.2 and 0.2.
Cloud pixels have the lowest GEMI-B values, below 20.3. Figure 5 suggests that
GEMI-B is an effective index for distinguishing burn scars from other land cover types.
Table 2 lists the GEMI-B values (scaled by 100) of burn scars, water, grassland,
forest and clouds from 21 to 30 May, in which pixels belonging to different classes
Figure 5. GEMI-B isolines and scatter plot.
584 X. Cao et al.
Downloaded By: [University at Buffalo, the State University of New York (SUNY)] At: 20:59 15 September 2009

were acquired through visual interpretation. The GEMI-B values for the burn scars
are higher than those of the other classes, as indicated by their mean GEMI-B
values: 34.61, 16.26, 12.19, 0.64 and 239.13 for burn scars, water, grassland, forest
and clouds, respectively. We also noted that the daily mean and standard deviationvalues for all classes varied considerably, implying that they are affected by different
atmospheric and sun-sensor geometric conditions. Therefore, a fixed threshold
hardly existed for the daily remotely sensed data.
3.2 Evaluation of VIs
A simple normalized distance (Kaufman et al. 1994, Garcia and Chuvieco 2004) was
used to evaluate the discrimination power of the VIs, including the NDVI, GEMI,
NDII, VI3T, Burn Area Index (BAI) and GEMI-B. The definitions of NDII and
BAI are:
NDII~ rNIR{rSWIRð Þ= rNIRzrSWIRð Þ ð4Þ
where rSWIR is reflectance at the SWIR band (1.0–3.0 mm), and
BAI~1.
PcRED{rREDð Þ2z PcNIR{rNIRð Þ2� �
ð5Þ
where PcRED and PcNIR are the convergence points of the red and NIR bands
(defined as 0.1 and 0.06 (Chuvieco et al. 2002).
Based on Landsat TM images and land cover maps, the values of the aboveindices for burned and unburned pixels were extracted from each index image that
was calculated from the MODIS data. Then the normalized distances (D) were
calculated from the mean and standard deviation of burned and unburned pixels
with the following equation:
D~ mB{mUj j= sBzsUð Þ ð6Þ
where mB and mU are the mean values of burned and unburned pixels, and sB and sU
are the standard deviation of burned and unburned pixels, respectively. A larger
normalized distance indicates better discriminability.
The normalized distances calculated from the BAI, NDII, VI3T, NDVI, GEMI and
GEMI-B index images of 22, 24, 26, 28 and 30 May are shown in table 3. GEMI-B
achieved the best discriminability (mean normalized distance of 2.234, in bold) among
all the indices according to the daily and mean normalized distance values, implying
that GEMI-B is the optimal index to identify burn scars in a grassland environment.VI3T and GEMI also performed well in discriminating the burned area from the
unburned area with mean normalized distances of 2.053 and 1.932 (in bold),
Table 2. GEMI-B values for all classes from 21 to 30 May.
Burn scar Water Grassland Forest Cloud
Mean SD Mean SD Mean SD Mean SD Mean SD
21 May 38.31 11.62 18.00 0.65 16.02 3.52 6.88 3.76 248.29 12.1322 May 27.97 4.32 14.77 0.53 9.99 3.78 0.22 3.01 221.78 9.7324 May 35.15 2.40 13.95 0.34 10.01 3.53 0.57 2.81 212.41 7.1726 May 35.57 9.35 18.26 1.16 8.33 3.26 24.58 3.78 247.75 10.4128 May 35.53 3.50 14.61 2.87 13.52 4.61 1.32 6.36 295.21 36.7530 May 35.12 6.90 17.99 1.00 15.24 4.26 20.60 3.12 29.34 21.00
Burn scar mapping using SVMs 585
Downloaded By: [University at Buffalo, the State University of New York (SUNY)] At: 20:59 15 September 2009
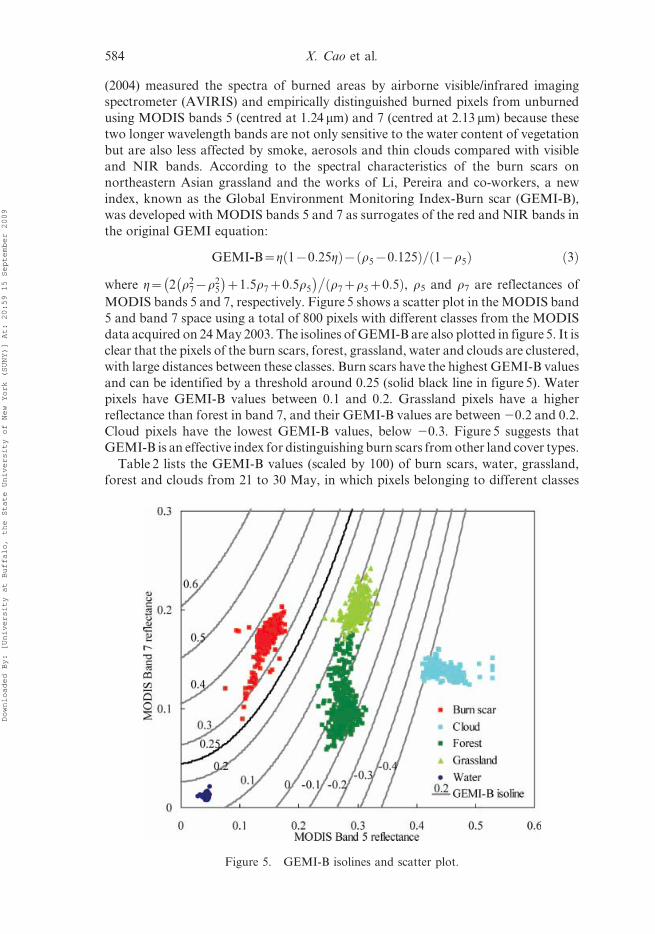
respectively. Based on the above evaluation, GEMI-B, VI3T and GEMI were selected
as the inputs for automatic detection methods for burn scar mapping in northeastern
Asian grassland. As mentioned earlier, GEMI-B describes the water loss character-
istics of the burned areas, VI3T is related to the higher temperature of the burned
vegetation due to a decrease in evapotranspiration and an increase in surface
absorption and GEMI enhances the reflectance feature of green vegetation and is
insensitive to atmospheric noise and soil background. Figure 6 shows the three-
dimensional (3D) scattered GEMI-B, VI3T and GEMI plots of selected burn scars,
water, forest and grassland pixels on 26 May (all the values have been scaled by 100.0).
The 3D scatter plot indicates that the burn scars, water and clouds are easily separable
while only the forest and grassland overlap to a great extent.
3.3 Detection of MODIS active fires
Neighbourhoods of active fires (hotspots) are likely to be burned as well. This
motivated us to use hotspots as starting points for choosing the training samples of
burn scars automatically. The method used for generating the MODIS fire product
(Justice et al. 2002) was adopted in this study. The MODIS fire product provides an
integrated method of multiband fixed (absolute) thresholds and a contexture
Figure 6. 3D scatter plot for GEMI-B, VI3T and GEMI.
Table 3. Normalized distances of the six vegetation indices.
BAI NDII VI3T NDVI GEMI GEMI-B
22 May 0.142 0.745 1.644 1.598 2.121 1.84524 May 0.16 1.951 2.646 1.369 2.901 2.63926 May 0.035 1.718 2.21 1.296 1.757 2.52228 May 0.625 1.579 2.046 1.034 1.876 2.41330 May 0.534 1.633 1.718 1.127 1.007 1.751Mean 0.299 1.525 2.053 1.285 1.932 2.234
Mean values for indices that performed well in discriminating burned from unburned areasare shown in bold.
586 X. Cao et al.
Downloaded By: [University at Buffalo, the State University of New York (SUNY)] At: 20:59 15 September 2009
(relative) threshold method. In the method, the brightness temperatures at the 4 mm
and 11 mm wavelengths, denoted as T4 and T11, were used to detect hotspots. There
are two MODIS bands (bands 21 and 22) at the 4 mm wavelength: band 21 saturates
at 500 K and band 22 saturates at 331 K. As a lower saturation band has less noise
(see table 1) and a smaller quantization error, T4 is derived from band 22 whenever
possible. Otherwise, it is replaced by band 21 to compute T4. T11 is derived from
band 31, which saturates at 400 K. For daytime MODIS data, the fire pixels were
identified by satisfying one of the following criteria:
að Þ T4w360 K or
bð Þ T4wmT4z3sT4 or T4w330 Kf g and
T4{T11whT4{T11z3sT4{T11 or T4{T11w25 Kf g
ð7Þ
where m, s and h represent mean, standard deviation and median, respectively.
In our study, all daily fire maps were derived by this method, and then the
accumulated fire maps for the days between 21 and 30 May were produced by
overlaying daily fire maps that were extended from 21 May to the study day. For
example, the accumulated fire map for 26 May was produced by overlaying the daily
fire maps from 21 to 26 May. Therefore, the accumulated fire map for 26 May
encompassed all hotspots occurring during the period from 21 to 26 May. These
composed hotspots were used as seeds in the following computation.
3.4 SVM training, classification and region growing
SVM is a learning system based on statistical learning theory (Vapnik 1995). Unlike the
maximum likelihood classification, the SVM-based classifier is a non-parametric
method that does not need to hold the normal distribution assumption in the input
data. The advantage of the SVM-based classifier over traditional classifiers is that it
solves learning problems better when only a small number of training samples are
available. It has been used successfully in remotely sensed image classification (Keuchel
et al. 2003, Mantero et al. 2005), computer-aided diagnosis (El-Naqa et al. 2002), real-
time image segmentation (Mitrean et al. 2003) and region growing (Hu et al. 2005).
The basic idea of SVM is to classify the input vectors into two classes using a
hyperplane with the maximal margin, which is derived by solving the following
constrained quadratic programming problem:
Maximize W að Þ,
where W að Þ~Xn
i~1
ai{1
2
Xn
i~1
Xn
j~1
aiajyiyjK xi,xj
� � ð8Þ
with the constraints:
Xn
i~1
aiyi~0 and 0ƒaiƒT for i~1,2, . . . n ð9Þ
where xigR are the training sample vectors, yig{21, + 1} are the corresponding
class labels, ai is the Lagrange multiplier, T is a constant needed for non-separable
classes, and K(u, v) is the kernel function. Vapnik (1995) described three types of
SVMs (more detailed information can be found in Vapnik 1995). In this study, the
radial basis function (RBF) was selected as the kernel function, and the only
Burn scar mapping using SVMs 587
Downloaded By: [University at Buffalo, the State University of New York (SUNY)] At: 20:59 15 September 2009
parameter, the width s in equation (10), was set as 1.0.
K x,yð Þ~e { x{yj j2=2s2ð Þ ð10Þ
Based on the SVM classifier, pixels were classified into two classes: burned and
unburned pixels. As shown in figure 3, the IGBP land cover map, hotspot composite
map, and daily MODIS GEMI, VI3T and GEMI-B images were gathered as input,
and then two training sets were extracted automatically. Here the training pixels for
the burn scars were selected by the neighbourhood of the active fires from the
hotspot map because these neighbourhoods are most likely to be burned. The
neighbourhood is defined as the region of a 363 window for every hotspot pixel. To
eliminate false active fires and non-burned pixels near hotspots, only the pixels
within the highest 70% GEMI-B values were assigned to burn scars. Meanwhile, two
clusters of unburned areas were also selected as an SVM training set. One cluster
was the water body from the land cover map because the water will not be burned,
and the other consisted of unburned green vegetation pixels with a GEMI value
.0.55. A careful validation showed that the GEMI value of the burned area would
never go beyond 0.3. Based on the aforementioned training data for burned and
unburned classes, the SVM-based classifier was applied to classify the unknown
pixels. It should be noted that we did not classify all unknown pixels at one time, but
instead used the classifier in an iterative procedure to classify the pixels near the seed
pixels step by step. As the first step of the loop procedure, the input active fire
(hotspot) pixels were assigned as seeds, and then the pixels within a 363 window of
each seed were classified by the SVM-based classifier at one time. After the
classification was completed, the pixels classified as burn scars in the previous step
were assigned as new seed pixels and used to train the classifier again. The iterative
procedure was carried out many times until the number of newly identified burn scar
pixels equalled 0. In this way, a burn scar map was eventually produced. When
running the iterative procedure, the burn scar pixels were identified step by step.
This is similar to a region-growing process, and is shown in figure 7.
4. Results
Burn scar maps of daily images were extracted automatically based on the GEMI-B,
VI3T and GEMI images and hotspot maps (figure 8), using the SVM-based region-
growing technique. Table 4 shows the numbers of pixels in the training sets at the
beginning of the iterative procedure, when there were far less burned pixels than
unburned pixels. In the burn scars results, the number of burn scar pixels in figure 8,
from 21 to 30 May, were 257, 11 048, 18 481, 32 167, 10 232 and 32 426, respectively.
All burn scars were extracted accurately except for 28 May, because clouds covered
the burned area and the expansion of seeds could not go through the clouds. The
daily burn scar mapping indicates the rapid expansion of wildfire in grassland areas.
When the fire spread from Mongolia to China, it was stopped by fireproofing
ditches along the border between Mongolia and China, which was confirmed by our
field survey.
The validation of our proposed technique was carried out using two cloud-free
Landsat TM images, and the accuracy of the extracted burn scars was assessed.
Before classification, the Landsat TM images were radiometrically calibrated, and
atmospherically corrected using the 6S code (Vermote et al. 1997). Burn scars were
extracted using supervised classification by manually selected training pixels of burn
588 X. Cao et al.
Downloaded By: [University at Buffalo, the State University of New York (SUNY)] At: 20:59 15 September 2009

Figure 7. Steps of the region-growing approach based on SVMs (an example from 26 May2003).
Figure 8. The results of daily burn scars extracted from MODIS data by the SVM-basedregion-growing technique (21–30 May).
Burn scar mapping using SVMs 589
Downloaded By: [University at Buffalo, the State University of New York (SUNY)] At: 20:59 15 September 2009

scars and those of other classes such as water, grassland, forest and bare land.
Finally, the burn scar map that resulted from the TM data was resampled to 500 m.
The single daily result of the latest date of 30 May was selected for assessment
purposes. The temporal difference between the results from the MODIS and
Landsat TM data was so marginal that it could be neglected. Table 5 shows the error
matrix. If the TM classification is deemed to be ‘ground truth’, then the overall
accuracy of MODIS is 96.8%, while the kappa coefficient is 0.933, indicating that
the daily MODIS burn scars extraction by the SVM-based region-growing
technique are consistent with the results from the TM data.
5. Discussion and conclusion
In this study a new index, the GEMI-B, was constructed based on the spectral
features of burned pixels on grassland with MODIS bands 5 and 7. The evaluation
of VIs GEMI-B, BAI, NDII, VI3T, GEMI and NDVI showed that GEMI-B, VI3T
and GEMI presented the largest discrimination in grassland areas. Different
features of the burn scars were enhanced by these three indices. GEMI-B described
the water loss characteristics of the burned area by using MODIS bands 5 and 7,
VI3T was related to the high temperature of the burned vegetation, and GEMI
improved the spectral features of green vegetation and was less sensitive to
atmospheric noise and soil background, which is important in grassland areas with
low vegetation coverage. Although the NDII and BAI were described as the best VIs
for burn scar mapping by Lasaponara (2006) and Garcia and Chuvieco (2004),
respectively, their performance in grassland was not comparable with the GEMI-B,
VI3T and GEMI.
For near real-time burn scar mapping, a new automatic burn scar mapping
technique, region growing based on SVMs, was developed by using daily MODIS
data. Daily burn scar maps from 21 to 30 May 2003 were produced with the new
technique without any predefined threshold. The results proved to be accurate by
using Landsat TM data as the ground truth, indicating that the new technique has
the potential to be applied to burn scar mapping on grasslands. The sound
performance of the new technique was due to the following reasons: (1) multiple
Table 4. Numbers of pixels in training sets at the beginning of the iterative procedure.
21 May 22 May 24 May 26 May 28 May 30 May
Burned 32 177 266 308 308 308Unburned water 3250 3250 3250 3250 3250 3250Unburned green vegetation 6591 7922 8465 7715 8409 7658
Table 5. Error matrix of burn scar detected by MODIS daily data and Landsat TM data (30May 2003).
TM
MODIS
Burned Unburned Total
Burned 31 636 1869 33 505Unburned 790 48 827 49 617Total 32 426 50 696 83 122
590 X. Cao et al.
Downloaded By: [University at Buffalo, the State University of New York (SUNY)] At: 20:59 15 September 2009

features of burn scars spectra were combined and used, and (2) a reasonable
assumption was made stating that the neighbourhoods of active fires (hotspots) are
most likely to be burn scars. Based on this assumption, automatic selection of
training data was facilitated. (3) An SVM classifier was adopted that works well
with a small number of training samples, and (4) an iterative classification procedure
was developed that is capable of running continuous training for the SVM classifier
to deal with the transitionary features of burn scar pixels.
It is worth noting that our proposed technique is to a large extent dependent on
hotspot detection. The technique not only uses the hotspots to select training sets
but also assigns them as initial seeds of burn scars. Improvement of hotspot
detection will largely benefit the proposed technique. However, the proposed
technique was shown to be ineffective for data acquired on cloudy days. To
overcome this problem, an alternative solution is to use multitemporal composite
data to remove most of the cloud effects, although this was not investigated in the
current study. Another problem was that there was a limited amount of
experimental data, and limited data on the types of vegetation present in the
grassland. For mapping burn scars at a global or regional scale, the proposed
technique needs to be tested on other types of vegetation besides grassland in a semi-
arid region, such as shrub, forest and savanna.
ReferencesBARBOSA, P.M., GREGOIRE, J.M. and PEREIRA, J.M.C., 1999, An algorithm for extracting
burned areas from time series of AVHRR GAC data applied at a continental scale.
Remote Sensing of Environment, 69, pp. 253–263.
BARBOSA, P.M., PEREIRA, J.M.C. and GREGOIRE, J.M., 1998, Compositing criteria for burned
area assessment using multispectral low resolution satellite data. Remote Sensing of
Environment, 65, pp. 38–49.
CHRISTENSEN, N.L., 1993, Fire regimes and ecosystem dynamics. In Fire in the
Environment, P.J. Crutzen and J.G. Goldammer (Eds), pp. 233–244 (New York:
Wiley).
CHUVIECO, E., MARTIN, M.P. and PALACIOS, A., 2002, Assessment of different spectral
indices in the red–near-infrared spectral domain for burned land discrimination.
International Journal of Remote Sensing, 23, pp. 5103–5110.
CHUVIECO, E., VENTURA, G., MARTIN, M.P. and GOMEZ, I., 2005, Assessment of
multitemporal compositing techniques of MODIS and AVHRR images for burned
land mapping. Remote Sensing of Environment, 94, pp. 450–462.
CRUTZEN, P.J. and ANDREAE, M.O., 1990, Biomass burning in the tropics: impact on
atmospheric chemistry and biogeochemical cycles. Science, 250, pp. 1669–1678.
EL-NAQA, I., YANG, Y., WERNICK, M.N., GALATSANOS, N.P. and NISHIKAWA, R.M., 2002, A
support vector machine approach for detection of microcalcifications. IEEE
Transactions on Medical Imaging, 21, pp. 1552–1563.
EVA, H. and LAMBIN, E.F., 1998, Burnt area mapping in Central Africa using ATSR data.
International Journal of Remote Sensing, 19, pp. 3473–3497.
FERNANDEZ, A., ILLERA, P. and CASANOVA, J.L., 1997, Automatic mapping of surfaces
affected by forest fires in Spain using AVHRR NDVI composite image data. Remote
Sensing of Environment, 60, pp. 153–162.
FRASER, R.H., LI, Z. and CIHLAR, J., 2000a, Hotspot and NDVI differencing synergy
(HANDS): a new technique for burned area mapping over boreal forest. Remote
Sensing of Environment, 74, pp. 362–376.
FRASER, R.H., LI, Z. and LANDRY, R., 2000b, SPOT vegetation for characterizing boreal
forest fires. International Journal of Remote Sensing, 21, pp. 3525–3532.
Burn scar mapping using SVMs 591
Downloaded By: [University at Buffalo, the State University of New York (SUNY)] At: 20:59 15 September 2009

GAO, B.C., 1996, NDWI: a normalized difference water index for remote sensing of
vegetation liquid water from space. Remote Sensing of Environment, 58, pp. 257–266.
GARCIA, M. and CHUVIECO, E., 2004, Assessment of potential of SAC-C/MMRS imagery for
mapping burned areas in Spain. Remote Sensing of Environment, 92, pp. 414–423.
GARCIA-HARO, F.J., GILABERT, M.A. and MELIA, J., 2001, Monitoring fire-affected areas
using Thematic Mapper data. International Journal of Remote Sensing, 22, pp.
533–549.
GOWARD, S.N., CRUICKSHANKS, G.D. and HOPE, A.S., 1985, Observed relation between
thermal emission and reflected spectral radiance of a complex vegetated landscape.
Remote Sensing of Environment, 18, pp. 137–146.
HANSEN, J., RUEDY, R., SATO, M. and REYNOLDS, R., 1996, Global surface temperature in
1995: return to pre-Pinatubo level. Geophysical Research Letters, 23, pp. 1665–1668.
HU, Z.P., WU, Y. and ZHANG, Y., 2005, Multiple object parallel region growing for image
segmentation based on support vector machines [in Chinese with English abstract].
Journal of System Simulation, 17, pp. 2610–2612.
HUETE, A.R., 1988, A soil adjusted vegetation index (SAVI). International Journal of Remote
Sensing, 9, pp. 295–309.
JUSTICE, C.O., GIGLIO, L., KORONTZI, S., OWENS, J., MORISETTE, J.T., ROY, D.,
DESCLOITRES, J., ALLEAUME, S., PETITCOLIN, F. and KAUFMAN, Y., 2002, The
MODIS fire products. Remote Sensing of Environment, 83, pp. 244–262.
JUSTICE, C.O., KENDALL, J.D., DOWTY, P.R. and SCHOLES, R.J., 1996, Satellite remote
sensing of fires during the SAFARI campaign using NOAA advanced very high
resolution radiometer data. Journal of Geophysical Research, 101, pp. 23851–23863.
KAUFMAN, Y.J., KLEIDMAN, R. and KING, M.D., 1998, SCAR-B fires in the tropics:
properties and remote sensing from EOS-MODIS. Journal of Geophysical Research,
103, pp. 893–902.
KAUFMAN, Y.J. and REMER, L.A., 1994, Detection of forests using mid-IR reflectance: an
application for aerosol studies. IEEE Transactions on Geoscience and Remote Sensing,
32, pp. 672–683.
KAUFMAN, Y.J., TUCKER, C. and FUNG, I., 1990, Remote sensing of biomass burning in the
tropics. Journal of Geophysical Research, 95, pp. 9927–9939.
KEUCHEL, J., NAUMANN, S., HEILER, M. and SIEGMUND, A., 2003, Automatic land cover
analysis for Tenerife by supervised classification using remotely sensed data. Remote
Sensing of Environment, 86, pp. 530–541.
KEY, C.H. and BENSON, N.C., 2006, Landscape assessment (LA): sampling analysis methods.
In FIREMON: five effects monitoring and inventory system, D.C. Lutes, R.E.
Keane, J.F. Caratti, C.H. Key, N.C. Benson, S. Sutherland and L.J. Gangi (Eds).
Gen. Tech. Pep. RMRS-GTR-164-CD. Fort Colleris, CO: US Department of
Agriculture, Forest Service, Rocky Mountain Research Station.
LASAPONARA, R., 2006, Estimating spectral separability of satellite derived parameters for
burned areas mapping in the Calabria region by using SPOT-Vegetation data.
Ecological Modelling, 196, pp. 265–270.
LI, R.R., KAUFMAN, Y.J., HAO, W.M., SALMON, J.M. and GAO, B.C., 2004, A technique for
detecting burn scar using MODIS data. IEEE Transactions on Geoscience and Remote
Sensing, 42, pp. 1300–1308.
LI, Z., KAUFMAN, Y.J., ICHOKU, C., FRASER, R., TRISHCHENKO, A., GIGLIO, L., JIN, J. and
YU, X., 2001, A review of AVHRR-based active fire detection algorithms: principles,
limitations, and recommendations. In Global and Regional Vegetation Fire Monitoring
from Space: Planning a Coordinated International Effort, F.J. Ahern, J.G. Goldammer
and C.O. Justice (Eds), pp. 199–225 (Hague: SPB Academic Publishing).
LI, Z., NADON, S. and CIHLAR, J., 2000a, Satellite-based detection of Canadian boreal forest
fires: development and application of the algorithm. International Journal of Remote
Sensing, 20, pp. 3057–3069.
592 X. Cao et al.
Downloaded By: [University at Buffalo, the State University of New York (SUNY)] At: 20:59 15 September 2009

LI, Z., NADON, S., CIHLAR, J. and STOCKS, B., 2000b, Satellite-based mapping of Canadian
boreal forest fires: evaluation and comparison of algorithms. International Journal of
Remote Sensing, 20, pp. 3071–3082.
LIU, G.X., SU, H. and LI, S.L., 1999, The summarization on the fire accident of grassland in
Inner Mongolia [in Chinese]. Grassland of China, 4, pp. 76–78.
LOVEJOY, T.E., 1991, Biomass burning and the disappearing tropical rainforest. In Global
Biomass Burning, J.S. Levine (Ed.), pp. 77–82 (Cambridge: MIT Press).
LOVELAND, T.R., REED, B.C., BROWN, J.F., OHLEN, D.O., ZHU, Z., YANG, L. and
MERCHANT, J.W., 2000, Development of a global land cover characteristics database
and IGBP DISCover from 1 km AVHRR data. International Journal of Remote
Sensing, 21, pp. 1303–1330.
MANTERO, P., MOSER, G. and SERPICO, S.B., 2005, Partially supervised classification of
remote sensing images through SVM-based probability density estimation. IEEE
Transactions on Geoscience and Remote Sensing, 43, pp. 559–570.
MENAUT, J.C., ABBADIE, L. and VITOUSEK, P.M., 1993, Nutrient and organic matter
dynamics in tropical ecosystems. In Fire in the Environment, P.J. Crutzen and J.G.
Goldammer (Eds), pp. 215–230 (New York: Wiley).
MITREAN, J., BOUILLANT, S. and BOURENNANE, E., 2003, SVM approximation for real-time
image segmentation by using an improved hyperrectangles-based method. Real-Time
Imaging, 9, pp. 179–188.
PEREIRA, J.M.C., 1999, A comparative evaluation of NOAA/AVHRR vegetation indexes for
burned surface detection and mapping. IEEE Transactions on Geoscience and Remote
Sensing, 37, pp. 217–225.
PINTY, B. and VERSTRAETE, M.M., 1992, GEMI: a non-linear index to monitor global
vegetation from satellites. Vegetatio, 101, pp. 15–20.
ROY, D.P., BOSCHETTI, L. and O’NEAL, K., 2006, MODIS Collection 5 Burned Area Product
MCD45 User’s Guide, Version 1.0. Available online at: http://modis-fire.umd.edu/
documents/MODIS_Burned_Area_Users_Guide_1.0.pdf.
ROY, D.P., GIGLIO, L., KENDALL, J.D. and JUSTICE, C.O., 1999, Multi-temporal active-fire
based burn scar detection algorithm. International Journal of Remote Sensing, 20, pp.
1031–1038.
ROY, D.P., JIN, Y., LEWIS, P.E. and JUSTICE, C.O., 2005, Prototyping a global algorithm for
systematic fire-affected area mapping using MODIS time series data. Remote Sensing
of Environment, 97, pp. 137–162.
SIMON, M., PLUMMER, S., FIERENS, F., HOELZEMANN, J.J. and ARINO, O., 2004, Burnt area
detection at global scale using ATSR-2: the GLOBSCAR products and their
qualification. Journal of Geophysical Research, 109, D14S02, doi:10.1029/2003JD003622.
STROPPIANA, D., GREGOIRE, J.-M. and PEREIRA, J.M.C., 2003a, The use of SPOT
VEGETATION data in a classification tree approach for burnt area mapping in
Australian savanna. International Journal of Remote Sensing, 24, pp. 2131–2151.
STROPPIANA, D., PINNOCK, S., PEREIRA, J.M.C. and GREGOIRE, J.-M., 2002, Radiometric
analysis of SPOT-VEGETATION images for burnt area detection in Northern
Australia. Remote Sensing of Environment, 81, pp. 21–37.
STROPPIANA, D., TANSEY, K., GREGOIRE, J.-M. and PEREIRA, J.M.C., 2003b, An algorithm
for mapping burnt areas in Australia using SPOT-VEGETATION data. IEEE
Transactions on Geoscience and Remotes Sensing, 41, pp. 907–909.
VAFEIDIS, A.T. and DRAKE, N.A., 2005, A two-step method for estimating the extent of burnt
areas with the use of coarse-resolution data. International Journal of Remote Sensing,
26, pp. 2441–2459.
VAPNIK, V., 1995, The Nature of Statistical Learning Theory (New York: Springer-Verlag).
VERMOTE, E.F., TANRE, D., DEUZE, J.L., HERMAN, M. and MORCRETTE, J.J., 1997, Second
Simulation of the Satellite Signal in the Solar Spectrum (6S), 6S User’s Guide Version 2
(Greenbelt, MD: NSAS Goddard Space Flight Center, Code 923).
Burn scar mapping using SVMs 593
Downloaded By: [University at Buffalo, the State University of New York (SUNY)] At: 20:59 15 September 2009

WEBER, G. and STOCKS, B., 1998, Forest fires and sustainability in the boreal forest of
Canada. Ambio, 27, pp. 545–550.
594 Burn scar mapping using SVMs
Downloaded By: [University at Buffalo, the State University of New York (SUNY)] At: 20:59 15 September 2009


![[XLS]pwuindianoilunit.compwuindianoilunit.com/panel/upload/ACTIVE EMPLOYEE AS ON... · Web viewDUKHI MASIH KISMAT . SCAR IN FRONT OF LEFT LEG IN UPPER PART RESHMA . DEVI BURN SCAR](https://static.fdocuments.in/doc/165x107/5aaf260c7f8b9a25088d27fb/xls-employee-as-onweb-viewdukhi-masih-kismat-scar-in-front-of-left-leg-in.jpg)


![Randomized controlled trial of the immediate and long-term ...website60s.com/upload/files/randomized-controlled... · most commonly used burn scar outcome measure [28], issues associatedwithitsreliability[23,24,27]mayrenderittoo](https://static.fdocuments.in/doc/165x107/5f53c16467997a52ae270d6f/randomized-controlled-trial-of-the-immediate-and-long-term-most-commonly-used.jpg)