Basic Non-Destructive Testing and Destructive Testing Sample Questions
An Automated System for Rapid Non-DestructiveEnumeration of Growing MicrobesRoanna London1, Julie Schwedock1, Andrew Sage1, Heather Valley1, Jamie Meadows1, Michael
Waddington2, Don Straus1¤*
1 Rapid Micro Biosystems, Inc., Bedford, Massachusetts, United States of America, 2 Accugenix, Inc., Newark, Delaware, United States of America
Abstract
Background: The power and simplicity of visual colony counting have made it the mainstay of microbiological analysis for morethan 130 years. A disadvantage of the method is the long time required to generate visible colonies from cells in a sample. Newrapid testing technologies generally have failed to maintain one or more of the major advantages of culture-based methods.
Principal Findings: We present a new technology and platform that uses digital imaging of cellular autofluorescence to detectand enumerate growing microcolonies many generations before they become visible to the eye. The data presenteddemonstrate that the method preserves the viability of the microcolonies it detects, thus enabling generation of pure culturesfor microbial identification. While visual colony counting detects Escherichia coli colonies containing about 56106 cells, thenew imaging method detects E. coli microcolonies when they contain about 120 cells and microcolonies of the yeast Candidaalbicans when they contain only about 12 cells. We demonstrate that digital imaging of microcolony autofluorescence detectsa broad spectrum of prokaryotic and eukaryotic microbes and present a model for predicting the time to detection forindividual strains. Results from the analysis of environmental samples from pharmaceutical manufacturing plants containing amixture of unidentified microbes demonstrate the method’s improved test turnaround times.
Conclusion: This work demonstrates a new technology and automated platform that substantially shortens test times whilemaintaining key advantages of the current methods.
Citation: London R, Schwedock J, Sage A, Valley H, Meadows J, et al. (2010) An Automated System for Rapid Non-Destructive Enumeration of GrowingMicrobes. PLoS ONE 5(1): e8609. doi:10.1371/journal.pone.0008609
Editor: Frederick M. Ausubel, Massachusetts General Hospital, United States of America
Received December 24, 2008; Accepted July 8, 2009; Published January 7, 2010
Copyright: � 2010 London et al. This is an open-access article distributed under the terms of the Creative Commons Attribution License, which permitsunrestricted use, distribution, and reproduction in any medium, provided the original author and source are credited.
Funding: The work was funded by Rapid Micro Biosystems which is a privately financed company. All of the authors (except for Michael Waddington ofAccugenix) are employees of Rapid Micro Biosystems. The project concept, study design, data collection, data analysis, interpretation of the data, manuscriptwriting, and decision to submit took place at Rapid Micro Biosystems. The one exception is the 16S rDNA sequencing work which was carried out at Accugenix.
Competing Interests: DS is a board member, shareholder, and inventor on the patents of Rapid Micro Biosystems, the company that funded the work reportedhere. RL, JS, AS, JM, and HV conducted the work as paid employees of the same company.
* E-mail: [email protected]
¤ Current address: First Light Biosciences, Inc., Bedford, Massachusetts, United States of America
Introduction
Since the 19th century, counting the visible microbial colonies
grown on semi-solid agar-based growth medium has been the
dominant method for quantitative microbiological analysis. A key
advantage of visual plate counting is its sensitivity for detecting
growing cells; a visible colony will develop even when there is only
a single culturable cell in a sample. The method detects a broad
spectrum of prokaryotic and eukaryotic microbes and can
simultaneously detect diverse species in a single sample. Plate
counting methods can accommodate large volume liquid samples
when combined with liquid filtration through membranes. The
recovered microbial colonies are themselves essential for subse-
quent analyses since they contain populations of identical cells
which are required as input for microbial identification, antibiotic
susceptibility testing, biochemical analysis, and genetic character-
ization. Finally, visual plate counting owes its 130 years of
dominance in large part to cost effectiveness and ease of use.
A major drawback of microbial culture methods is the length of
time required for microbes to generate enough daughter cells to
give rise to visible colonies. Testing times are particularly lengthy
for slow-growing strains. While it is well known that in clinical
applications long testing times can delay initiation of appropriate
antimicrobial medical therapy, slow testing also has a high cost in
pharmaceutical and personal care product manufacturing.
The need for faster microbial enumeration results has spurred
technology development for almost a century. For example, as early
as 1920, Frost developed a method for rapidly detecting microbial
growth by microscopic detection of nascent microcolonies [1]. In
contrast to visual plate counting, microscopic examination is
impractical when the microbial count is low. New technologies for
rapid microbial detection – including nucleic acid, bioluminescent,
and immunoassay-based methods – have had a substantial impact in
clinical diagnostics and food pathogen testing. The new methods
have had less impact in pharmaceutical and personal care product
manufacturing which are more closely tethered to culture methods
because of regulatory requirements.
Several factors have stymied extensive implementation of new
technologies in the pharmaceutical and personal care product
industries. Regulations require that manufacturers must validate
the new method by demonstrating its equivalence to the gold
standard culture method [2,3]. However, demonstrating equiv-
PLoS ONE | www.plosone.org 1 January 2010 | Volume 5 | Issue 1 | e8609
alence is difficult for new technologies that use principles
distinct from the culture method. For example, it is difficult to
compare the microbial colony count from a water sample that
harbors a complex microbial population to the results of an
ATP-bioluminescence technology that delivers results in relative
light units. Furthermore, most new methods kill the microbes
precluding growth of the pure cultures that are required as input
for today’s microbial identification methods. Identifying mi-
crobes is an essential tool for investigating the source of
contamination events and for maintaining control of the
manufacturing environment [4]. Some methods can only
address a small range of microbiological quality control
applications. For example, flow cytometric methods [5] only
operate on small liquid samples (generally less than about
0.5 ml), and cannot test air, surface, or large volume liquid
samples which are critical in manufacturing quality control.
Methods that do not rely on cell replication, such as solid phase
cytometry [6], complicate demonstration of equivalence to the
current method due to the preponderance of viable but non-
culturable microorganisms in the environment [7]. Hence these
methods can deliver enumeration results that are substantially
higher than the standard plate counting methods. Finally, some
methods for rapid microbial enumeration require more hands-
on labor than does the plate count method.
Our goal in developing the technology described here is to
provide a microbial enumeration test that is faster than visual plate
counting, but maintains the advantages of the traditional method.
We reasoned that a method based on the same principles as
traditional plate counting would facilitate regulatory validation,
give equivalent counts, address the same broad spectrum of
applications as traditional plate counting, and be compatible with
microbial identification technology.
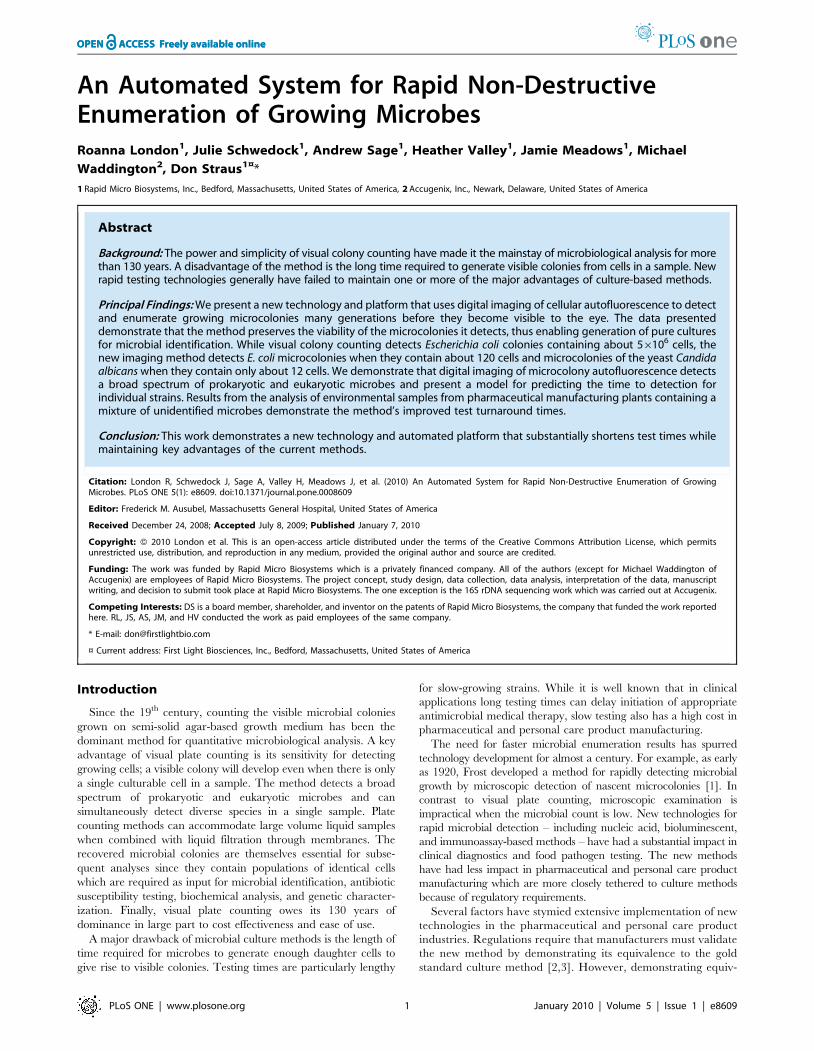
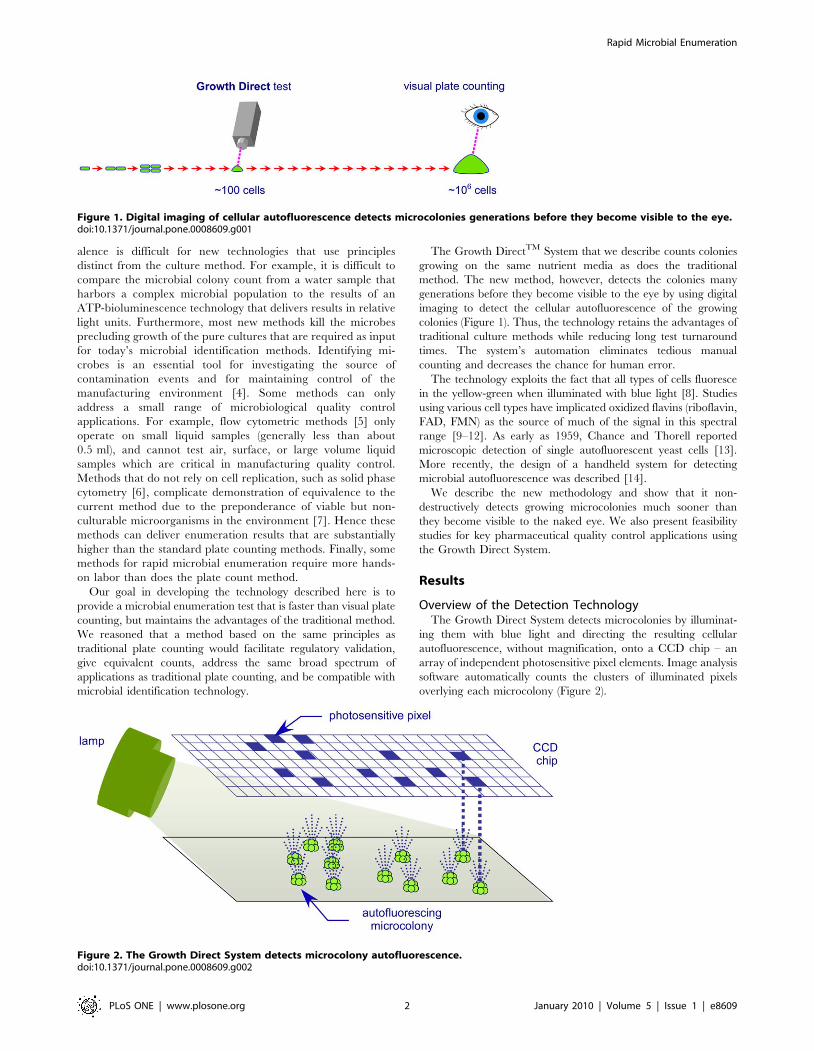
The Growth DirectTM System that we describe counts colonies
growing on the same nutrient media as does the traditional
method. The new method, however, detects the colonies many
generations before they become visible to the eye by using digital
imaging to detect the cellular autofluorescence of the growing
colonies (Figure 1). Thus, the technology retains the advantages of
traditional culture methods while reducing long test turnaround
times. The system’s automation eliminates tedious manual
counting and decreases the chance for human error.
The technology exploits the fact that all types of cells fluoresce
in the yellow-green when illuminated with blue light [8]. Studies
using various cell types have implicated oxidized flavins (riboflavin,
FAD, FMN) as the source of much of the signal in this spectral
range [9–12]. As early as 1959, Chance and Thorell reported
microscopic detection of single autofluorescent yeast cells [13].
More recently, the design of a handheld system for detecting
microbial autofluorescence was described [14].
We describe the new methodology and show that it non-
destructively detects growing microcolonies much sooner than
they become visible to the naked eye. We also present feasibility
studies for key pharmaceutical quality control applications using
the Growth Direct System.
Results
Overview of the Detection TechnologyThe Growth Direct System detects microcolonies by illuminat-
ing them with blue light and directing the resulting cellular
autofluorescence, without magnification, onto a CCD chip – an
array of independent photosensitive pixel elements. Image analysis
software automatically counts the clusters of illuminated pixels
overlying each microcolony (Figure 2).
Figure 1. Digital imaging of cellular autofluorescence detects microcolonies generations before they become visible to the eye.doi:10.1371/journal.pone.0008609.g001
Figure 2. The Growth Direct System detects microcolony autofluorescence.doi:10.1371/journal.pone.0008609.g002
Rapid Microbial Enumeration
PLoS ONE | www.plosone.org 2 January 2010 | Volume 5 | Issue 1 | e8609
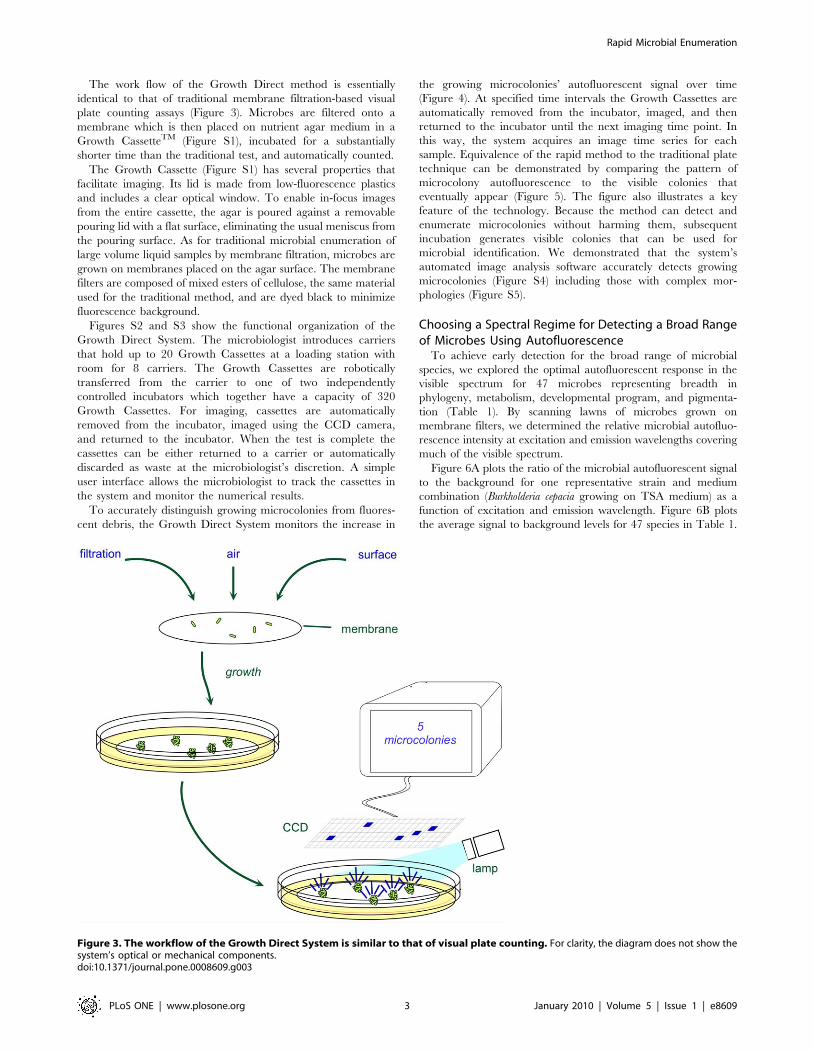
The work flow of the Growth Direct method is essentially
identical to that of traditional membrane filtration-based visual
plate counting assays (Figure 3). Microbes are filtered onto a
membrane which is then placed on nutrient agar medium in a
Growth CassetteTM (Figure S1), incubated for a substantially
shorter time than the traditional test, and automatically counted.
The Growth Cassette (Figure S1) has several properties that
facilitate imaging. Its lid is made from low-fluorescence plastics
and includes a clear optical window. To enable in-focus images
from the entire cassette, the agar is poured against a removable
pouring lid with a flat surface, eliminating the usual meniscus from
the pouring surface. As for traditional microbial enumeration of
large volume liquid samples by membrane filtration, microbes are
grown on membranes placed on the agar surface. The membrane
filters are composed of mixed esters of cellulose, the same material
used for the traditional method, and are dyed black to minimize
fluorescence background.
Figures S2 and S3 show the functional organization of the
Growth Direct System. The microbiologist introduces carriers
that hold up to 20 Growth Cassettes at a loading station with
room for 8 carriers. The Growth Cassettes are robotically
transferred from the carrier to one of two independently
controlled incubators which together have a capacity of 320
Growth Cassettes. For imaging, cassettes are automatically
removed from the incubator, imaged using the CCD camera,
and returned to the incubator. When the test is complete the
cassettes can be either returned to a carrier or automatically
discarded as waste at the microbiologist’s discretion. A simple
user interface allows the microbiologist to track the cassettes in
the system and monitor the numerical results.
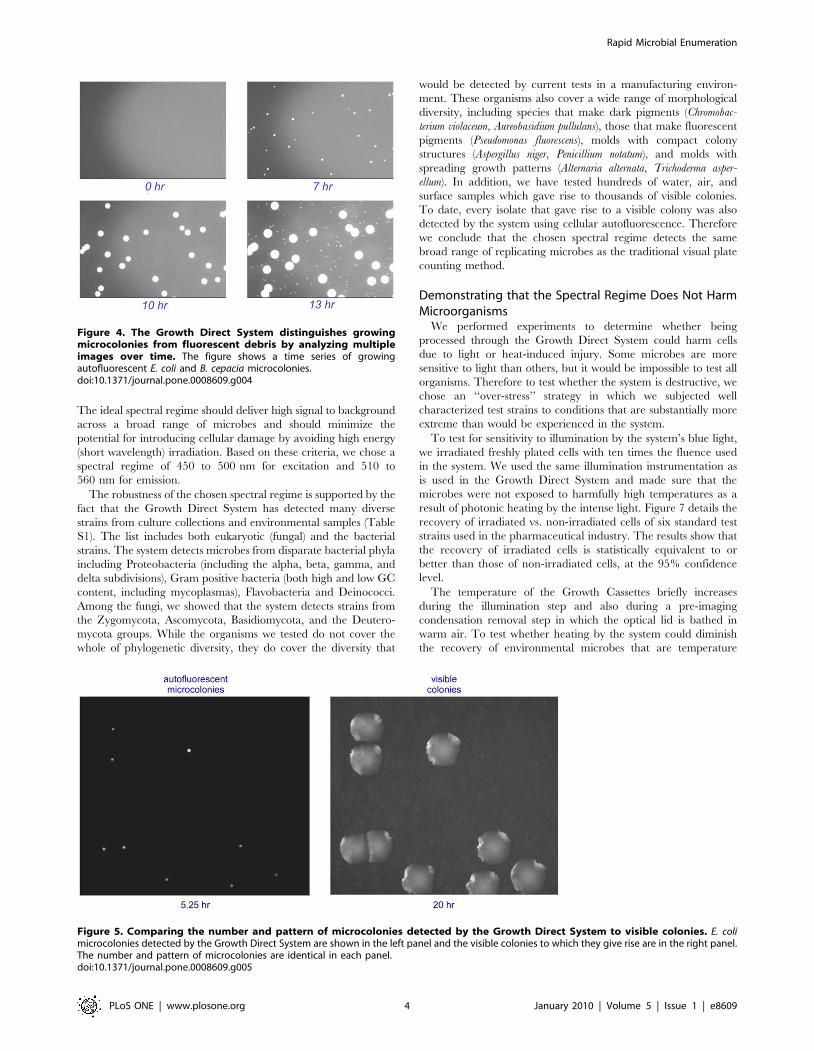
To accurately distinguish growing microcolonies from fluores-
cent debris, the Growth Direct System monitors the increase in
the growing microcolonies’ autofluorescent signal over time
(Figure 4). At specified time intervals the Growth Cassettes are
automatically removed from the incubator, imaged, and then
returned to the incubator until the next imaging time point. In
this way, the system acquires an image time series for each
sample. Equivalence of the rapid method to the traditional plate
technique can be demonstrated by comparing the pattern of
microcolony autofluorescence to the visible colonies that
eventually appear (Figure 5). The figure also illustrates a key
feature of the technology. Because the method can detect and
enumerate microcolonies without harming them, subsequent
incubation generates visible colonies that can be used for
microbial identification. We demonstrated that the system’s
automated image analysis software accurately detects growing
microcolonies (Figure S4) including those with complex mor-
phologies (Figure S5).
Choosing a Spectral Regime for Detecting a Broad Rangeof Microbes Using Autofluorescence
To achieve early detection for the broad range of microbial
species, we explored the optimal autofluorescent response in the
visible spectrum for 47 microbes representing breadth in
phylogeny, metabolism, developmental program, and pigmenta-
tion (Table 1). By scanning lawns of microbes grown on
membrane filters, we determined the relative microbial autofluo-
rescence intensity at excitation and emission wavelengths covering
much of the visible spectrum.
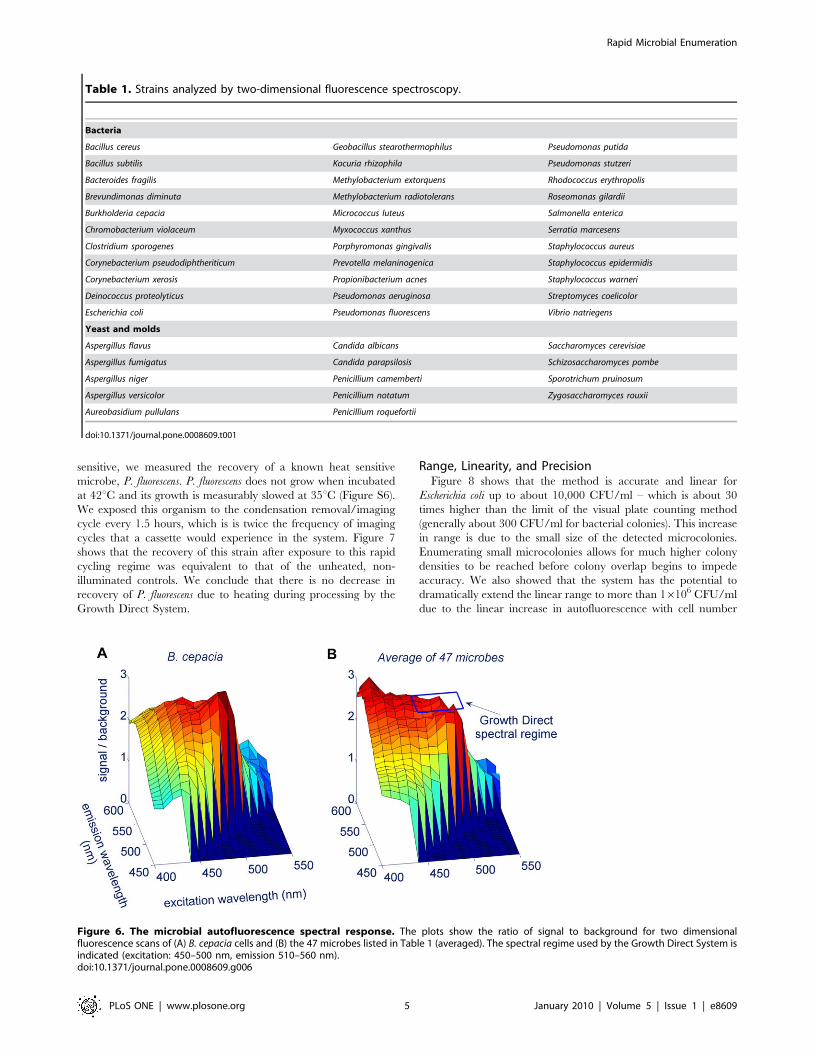
Figure 6A plots the ratio of the microbial autofluorescent signal
to the background for one representative strain and medium
combination (Burkholderia cepacia growing on TSA medium) as a
function of excitation and emission wavelength. Figure 6B plots
the average signal to background levels for 47 species in Table 1.
Figure 3. The workflow of the Growth Direct System is similar to that of visual plate counting. For clarity, the diagram does not show thesystem’s optical or mechanical components.doi:10.1371/journal.pone.0008609.g003
Rapid Microbial Enumeration
PLoS ONE | www.plosone.org 3 January 2010 | Volume 5 | Issue 1 | e8609
The ideal spectral regime should deliver high signal to background
across a broad range of microbes and should minimize the
potential for introducing cellular damage by avoiding high energy
(short wavelength) irradiation. Based on these criteria, we chose a
spectral regime of 450 to 500 nm for excitation and 510 to
560 nm for emission.
The robustness of the chosen spectral regime is supported by the
fact that the Growth Direct System has detected many diverse
strains from culture collections and environmental samples (Table
S1). The list includes both eukaryotic (fungal) and the bacterial
strains. The system detects microbes from disparate bacterial phyla
including Proteobacteria (including the alpha, beta, gamma, and
delta subdivisions), Gram positive bacteria (both high and low GC
content, including mycoplasmas), Flavobacteria and Deinococci.
Among the fungi, we showed that the system detects strains from
the Zygomycota, Ascomycota, Basidiomycota, and the Deutero-
mycota groups. While the organisms we tested do not cover the
whole of phylogenetic diversity, they do cover the diversity that
would be detected by current tests in a manufacturing environ-
ment. These organisms also cover a wide range of morphological
diversity, including species that make dark pigments (Chromobac-
terium violaceum, Aureobasidium pullulans), those that make fluorescent
pigments (Pseudomonas fluorescens), molds with compact colony
structures (Aspergillus niger, Penicillium notatum), and molds with
spreading growth patterns (Alternaria alternata, Trichoderma asper-
ellum). In addition, we have tested hundreds of water, air, and
surface samples which gave rise to thousands of visible colonies.
To date, every isolate that gave rise to a visible colony was also
detected by the system using cellular autofluorescence. Therefore
we conclude that the chosen spectral regime detects the same
broad range of replicating microbes as the traditional visual plate
counting method.
Demonstrating that the Spectral Regime Does Not HarmMicroorganisms
We performed experiments to determine whether being
processed through the Growth Direct System could harm cells
due to light or heat-induced injury. Some microbes are more
sensitive to light than others, but it would be impossible to test all
organisms. Therefore to test whether the system is destructive, we
chose an ‘‘over-stress’’ strategy in which we subjected well
characterized test strains to conditions that are substantially more
extreme than would be experienced in the system.
To test for sensitivity to illumination by the system’s blue light,
we irradiated freshly plated cells with ten times the fluence used
in the system. We used the same illumination instrumentation as
is used in the Growth Direct System and made sure that the
microbes were not exposed to harmfully high temperatures as a
result of photonic heating by the intense light. Figure 7 details the
recovery of irradiated vs. non-irradiated cells of six standard test
strains used in the pharmaceutical industry. The results show that
the recovery of irradiated cells is statistically equivalent to or
better than those of non-irradiated cells, at the 95% confidence
level.
The temperature of the Growth Cassettes briefly increases
during the illumination step and also during a pre-imaging
condensation removal step in which the optical lid is bathed in
warm air. To test whether heating by the system could diminish
the recovery of environmental microbes that are temperature
Figure 4. The Growth Direct System distinguishes growingmicrocolonies from fluorescent debris by analyzing multipleimages over time. The figure shows a time series of growingautofluorescent E. coli and B. cepacia microcolonies.doi:10.1371/journal.pone.0008609.g004
Figure 5. Comparing the number and pattern of microcolonies detected by the Growth Direct System to visible colonies. E. colimicrocolonies detected by the Growth Direct System are shown in the left panel and the visible colonies to which they give rise are in the right panel.The number and pattern of microcolonies are identical in each panel.doi:10.1371/journal.pone.0008609.g005
Rapid Microbial Enumeration
PLoS ONE | www.plosone.org 4 January 2010 | Volume 5 | Issue 1 | e8609
sensitive, we measured the recovery of a known heat sensitive
microbe, P. fluorescens. P. fluorescens does not grow when incubated
at 42uC and its growth is measurably slowed at 35uC (Figure S6).
We exposed this organism to the condensation removal/imaging
cycle every 1.5 hours, which is is twice the frequency of imaging
cycles that a cassette would experience in the system. Figure 7
shows that the recovery of this strain after exposure to this rapid
cycling regime was equivalent to that of the unheated, non-
illuminated controls. We conclude that there is no decrease in
recovery of P. fluorescens due to heating during processing by the
Growth Direct System.
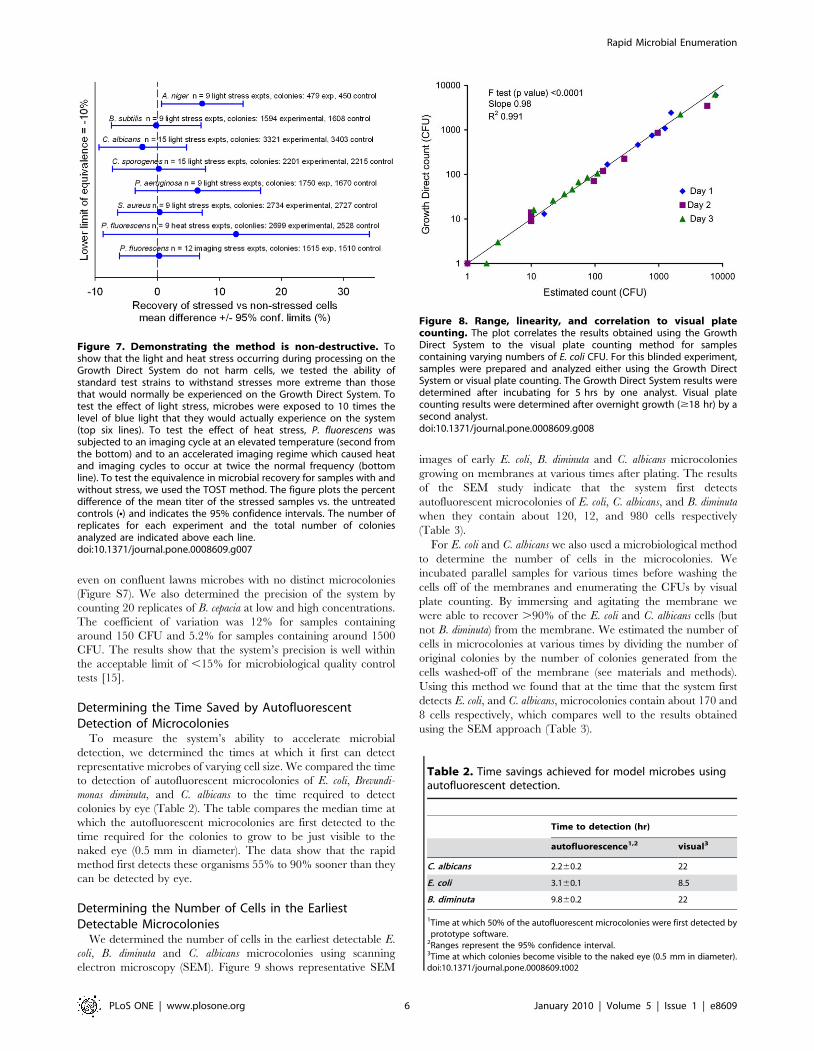
Range, Linearity, and PrecisionFigure 8 shows that the method is accurate and linear for
Escherichia coli up to about 10,000 CFU/ml – which is about 30
times higher than the limit of the visual plate counting method
(generally about 300 CFU/ml for bacterial colonies). This increase
in range is due to the small size of the detected microcolonies.
Enumerating small microcolonies allows for much higher colony
densities to be reached before colony overlap begins to impede
accuracy. We also showed that the system has the potential to
dramatically extend the linear range to more than 16106 CFU/ml
due to the linear increase in autofluorescence with cell number
Table 1. Strains analyzed by two-dimensional fluorescence spectroscopy.
Bacteria
Bacillus cereus Geobacillus stearothermophilus Pseudomonas putida
Bacillus subtilis Kocuria rhizophila Pseudomonas stutzeri
Bacteroides fragilis Methylobacterium extorquens Rhodococcus erythropolis
Brevundimonas diminuta Methylobacterium radiotolerans Roseomonas gilardii
Burkholderia cepacia Micrococcus luteus Salmonella enterica
Chromobacterium violaceum Myxococcus xanthus Serratia marcesens
Clostridium sporogenes Porphyromonas gingivalis Staphylococcus aureus
Corynebacterium pseudodiphtheriticum Prevotella melaninogenica Staphylococcus epidermidis
Corynebacterium xerosis Propionibacterium acnes Staphylococcus warneri
Deinococcus proteolyticus Pseudomonas aeruginosa Streptomyces coelicolor
Escherichia coli Pseudomonas fluorescens Vibrio natriegens
Yeast and molds
Aspergillus flavus Candida albicans Saccharomyces cerevisiae
Aspergillus fumigatus Candida parapsilosis Schizosaccharomyces pombe
Aspergillus niger Penicillium camemberti Sporotrichum pruinosum
Aspergillus versicolor Penicillium notatum Zygosaccharomyces rouxii
Aureobasidium pullulans Penicillium roquefortii
doi:10.1371/journal.pone.0008609.t001
Figure 6. The microbial autofluorescence spectral response. The plots show the ratio of signal to background for two dimensionalfluorescence scans of (A) B. cepacia cells and (B) the 47 microbes listed in Table 1 (averaged). The spectral regime used by the Growth Direct System isindicated (excitation: 450–500 nm, emission 510–560 nm).doi:10.1371/journal.pone.0008609.g006
Rapid Microbial Enumeration
PLoS ONE | www.plosone.org 5 January 2010 | Volume 5 | Issue 1 | e8609
even on confluent lawns microbes with no distinct microcolonies
(Figure S7). We also determined the precision of the system by
counting 20 replicates of B. cepacia at low and high concentrations.
The coefficient of variation was 12% for samples containing
around 150 CFU and 5.2% for samples containing around 1500
CFU. The results show that the system’s precision is well within
the acceptable limit of ,15% for microbiological quality control
tests [15].
Determining the Time Saved by AutofluorescentDetection of Microcolonies
To measure the system’s ability to accelerate microbial
detection, we determined the times at which it first can detect
representative microbes of varying cell size. We compared the time
to detection of autofluorescent microcolonies of E. coli, Brevundi-
monas diminuta, and C. albicans to the time required to detect
colonies by eye (Table 2). The table compares the median time at
which the autofluorescent microcolonies are first detected to the
time required for the colonies to grow to be just visible to the
naked eye (0.5 mm in diameter). The data show that the rapid
method first detects these organisms 55% to 90% sooner than they
can be detected by eye.
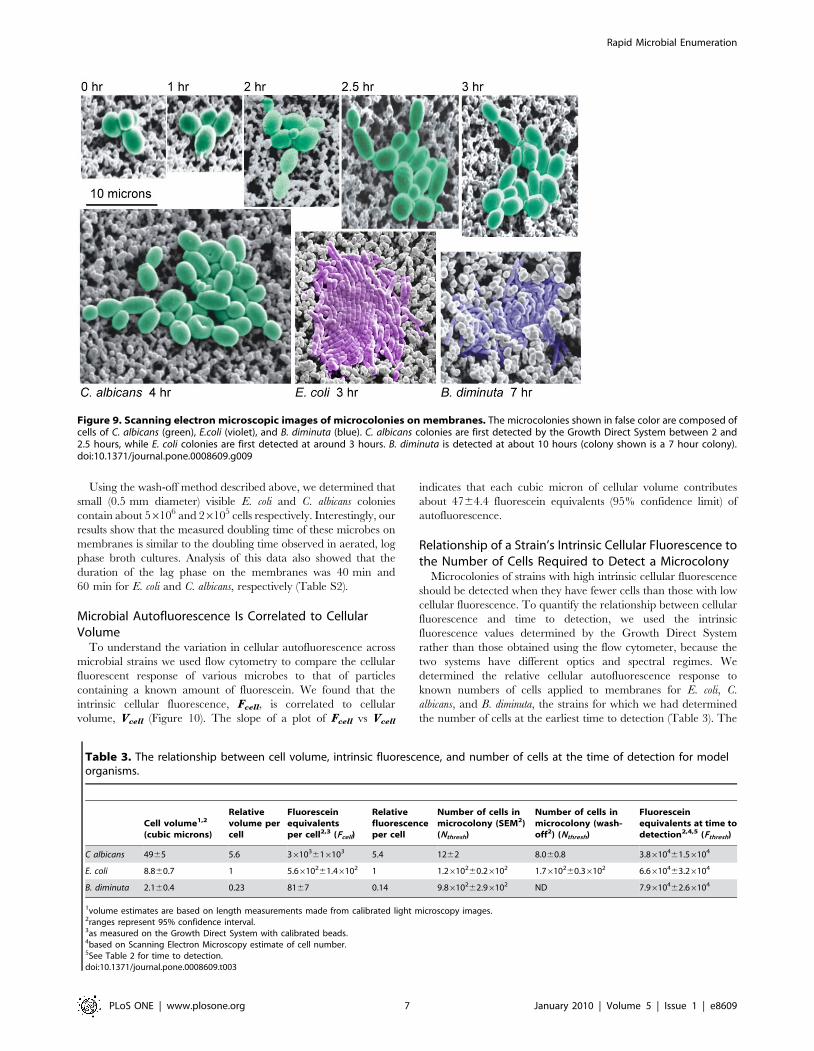
Determining the Number of Cells in the EarliestDetectable Microcolonies
We determined the number of cells in the earliest detectable E.
coli, B. diminuta and C. albicans microcolonies using scanning
electron microscopy (SEM). Figure 9 shows representative SEM
images of early E. coli, B. diminuta and C. albicans microcolonies
growing on membranes at various times after plating. The results
of the SEM study indicate that the system first detects
autofluorescent microcolonies of E. coli, C. albicans, and B. diminuta
when they contain about 120, 12, and 980 cells respectively
(Table 3).
For E. coli and C. albicans we also used a microbiological method
to determine the number of cells in the microcolonies. We
incubated parallel samples for various times before washing the
cells off of the membranes and enumerating the CFUs by visual
plate counting. By immersing and agitating the membrane we
were able to recover .90% of the E. coli and C. albicans cells (but
not B. diminuta) from the membrane. We estimated the number of
cells in microcolonies at various times by dividing the number of
original colonies by the number of colonies generated from the
cells washed-off of the membrane (see materials and methods).
Using this method we found that at the time that the system first
detects E. coli, and C. albicans, microcolonies contain about 170 and
8 cells respectively, which compares well to the results obtained
using the SEM approach (Table 3).
Figure 7. Demonstrating the method is non-destructive. Toshow that the light and heat stress occurring during processing on theGrowth Direct System do not harm cells, we tested the ability ofstandard test strains to withstand stresses more extreme than thosethat would normally be experienced on the Growth Direct System. Totest the effect of light stress, microbes were exposed to 10 times thelevel of blue light that they would actually experience on the system(top six lines). To test the effect of heat stress, P. fluorescens wassubjected to an imaging cycle at an elevated temperature (second fromthe bottom) and to an accelerated imaging regime which caused heatand imaging cycles to occur at twice the normal frequency (bottomline). To test the equivalence in microbial recovery for samples with andwithout stress, we used the TOST method. The figure plots the percentdifference of the mean titer of the stressed samples vs. the untreatedcontrols (N) and indicates the 95% confidence intervals. The number ofreplicates for each experiment and the total number of coloniesanalyzed are indicated above each line.doi:10.1371/journal.pone.0008609.g007
Figure 8. Range, linearity, and correlation to visual platecounting. The plot correlates the results obtained using the GrowthDirect System to the visual plate counting method for samplescontaining varying numbers of E. coli CFU. For this blinded experiment,samples were prepared and analyzed either using the Growth DirectSystem or visual plate counting. The Growth Direct System results weredetermined after incubating for 5 hrs by one analyst. Visual platecounting results were determined after overnight growth ($18 hr) by asecond analyst.doi:10.1371/journal.pone.0008609.g008
Table 2. Time savings achieved for model microbes usingautofluorescent detection.
Time to detection (hr)
autofluorescence1,2 visual3
C. albicans 2.260.2 22
E. coli 3.160.1 8.5
B. diminuta 9.860.2 22
1Time at which 50% of the autofluorescent microcolonies were first detected byprototype software.
2Ranges represent the 95% confidence interval.3Time at which colonies become visible to the naked eye (0.5 mm in diameter).doi:10.1371/journal.pone.0008609.t002
Rapid Microbial Enumeration
PLoS ONE | www.plosone.org 6 January 2010 | Volume 5 | Issue 1 | e8609
Using the wash-off method described above, we determined that
small (0.5 mm diameter) visible E. coli and C. albicans colonies
contain about 56106 and 26105 cells respectively. Interestingly, our
results show that the measured doubling time of these microbes on
membranes is similar to the doubling time observed in aerated, log
phase broth cultures. Analysis of this data also showed that the
duration of the lag phase on the membranes was 40 min and
60 min for E. coli and C. albicans, respectively (Table S2).
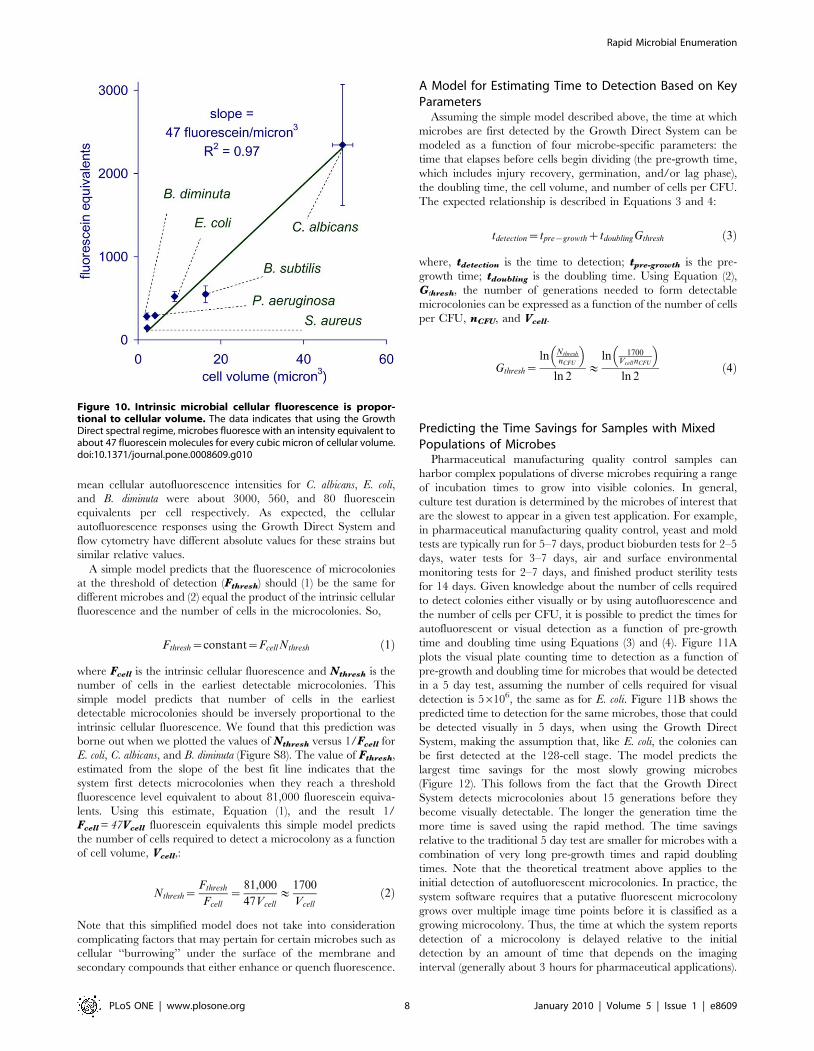
Microbial Autofluorescence Is Correlated to CellularVolume
To understand the variation in cellular autofluorescence across
microbial strains we used flow cytometry to compare the cellular
fluorescent response of various microbes to that of particles
containing a known amount of fluorescein. We found that the
intrinsic cellular fluorescence, Fcell, is correlated to cellular
volume, Vcell (Figure 10). The slope of a plot of Fcell vs Vcell
indicates that each cubic micron of cellular volume contributes
about 4764.4 fluorescein equivalents (95% confidence limit) of
autofluorescence.
Relationship of a Strain’s Intrinsic Cellular Fluorescence tothe Number of Cells Required to Detect a Microcolony
Microcolonies of strains with high intrinsic cellular fluorescence
should be detected when they have fewer cells than those with low
cellular fluorescence. To quantify the relationship between cellular
fluorescence and time to detection, we used the intrinsic
fluorescence values determined by the Growth Direct System
rather than those obtained using the flow cytometer, because the
two systems have different optics and spectral regimes. We
determined the relative cellular autofluorescence response to
known numbers of cells applied to membranes for E. coli, C.
albicans, and B. diminuta, the strains for which we had determined
the number of cells at the earliest time to detection (Table 3). The
Figure 9. Scanning electron microscopic images of microcolonies on membranes. The microcolonies shown in false color are composed ofcells of C. albicans (green), E.coli (violet), and B. diminuta (blue). C. albicans colonies are first detected by the Growth Direct System between 2 and2.5 hours, while E. coli colonies are first detected at around 3 hours. B. diminuta is detected at about 10 hours (colony shown is a 7 hour colony).doi:10.1371/journal.pone.0008609.g009
Table 3. The relationship between cell volume, intrinsic fluorescence, and number of cells at the time of detection for modelorganisms.
Cell volume1,2
(cubic microns)
Relativevolume percell
Fluoresceinequivalentsper cell2,3 (Fcell)
Relativefluorescenceper cell
Number of cells inmicrocolony (SEM2)(Nthresh)
Number of cells inmicrocolony (wash-off2) (Nthresh)
Fluoresceinequivalents at time todetection2,4,5 (Fthresh)
C albicans 4965 5.6 36103616103 5.4 1262 8.060.8 3.8610461.56104
E. coli 8.860.7 1 5.6610261.46102 1 1.2610260.26102 1.7610260.36102 6.6610463.26104
B. diminuta 2.160.4 0.23 8167 0.14 9.8610262.96102 ND 7.9610462.66104
1volume estimates are based on length measurements made from calibrated light microscopy images.2ranges represent 95% confidence interval.3as measured on the Growth Direct System with calibrated beads.4based on Scanning Electron Microscopy estimate of cell number.5See Table 2 for time to detection.doi:10.1371/journal.pone.0008609.t003
Rapid Microbial Enumeration
PLoS ONE | www.plosone.org 7 January 2010 | Volume 5 | Issue 1 | e8609
mean cellular autofluorescence intensities for C. albicans, E. coli,
and B. diminuta were about 3000, 560, and 80 fluorescein
equivalents per cell respectively. As expected, the cellular
autofluorescence responses using the Growth Direct System and
flow cytometry have different absolute values for these strains but
similar relative values.
A simple model predicts that the fluorescence of microcolonies
at the threshold of detection (Fthresh) should (1) be the same for
different microbes and (2) equal the product of the intrinsic cellular
fluorescence and the number of cells in the microcolonies. So,
Fthresh~constant~FcellNthresh ð1Þ
where Fcell is the intrinsic cellular fluorescence and Nthresh is the
number of cells in the earliest detectable microcolonies. This
simple model predicts that number of cells in the earliest
detectable microcolonies should be inversely proportional to the
intrinsic cellular fluorescence. We found that this prediction was
borne out when we plotted the values of Nthresh versus 1/Fcell for
E. coli, C. albicans, and B. diminuta (Figure S8). The value of Fthresh,
estimated from the slope of the best fit line indicates that the
system first detects microcolonies when they reach a threshold
fluorescence level equivalent to about 81,000 fluorescein equiva-
lents. Using this estimate, Equation (1), and the result 1/
Fcell = 47Vcell fluorescein equivalents this simple model predicts
the number of cells required to detect a microcolony as a function
of cell volume, Vcell,:
Nthresh~Fthresh
Fcell
~81,000
47Vcell
&1700
Vcell
ð2Þ
Note that this simplified model does not take into consideration
complicating factors that may pertain for certain microbes such as
cellular ‘‘burrowing’’ under the surface of the membrane and
secondary compounds that either enhance or quench fluorescence.
A Model for Estimating Time to Detection Based on KeyParameters
Assuming the simple model described above, the time at which
microbes are first detected by the Growth Direct System can be
modeled as a function of four microbe-specific parameters: the
time that elapses before cells begin dividing (the pre-growth time,
which includes injury recovery, germination, and/or lag phase),
the doubling time, the cell volume, and number of cells per CFU.
The expected relationship is described in Equations 3 and 4:
tdetection~tpre{growthztdoublingGthresh ð3Þ
where, tdetection is the time to detection; tpre-growth is the pre-
growth time; tdoubling is the doubling time. Using Equation (2),
Gthresh, the number of generations needed to form detectable
microcolonies can be expressed as a function of the number of cells
per CFU, nCFU, and Vcell.
Gthresh~ln Nthresh
nCFU
� �
ln 2&
ln 1700Vcell nCFU
� �
ln 2ð4Þ
Predicting the Time Savings for Samples with MixedPopulations of Microbes
Pharmaceutical manufacturing quality control samples can
harbor complex populations of diverse microbes requiring a range
of incubation times to grow into visible colonies. In general,
culture test duration is determined by the microbes of interest that
are the slowest to appear in a given test application. For example,
in pharmaceutical manufacturing quality control, yeast and mold
tests are typically run for 5–7 days, product bioburden tests for 2–5
days, water tests for 3–7 days, air and surface environmental
monitoring tests for 2–7 days, and finished product sterility tests
for 14 days. Given knowledge about the number of cells required
to detect colonies either visually or by using autofluorescence and
the number of cells per CFU, it is possible to predict the times for
autofluorescent or visual detection as a function of pre-growth
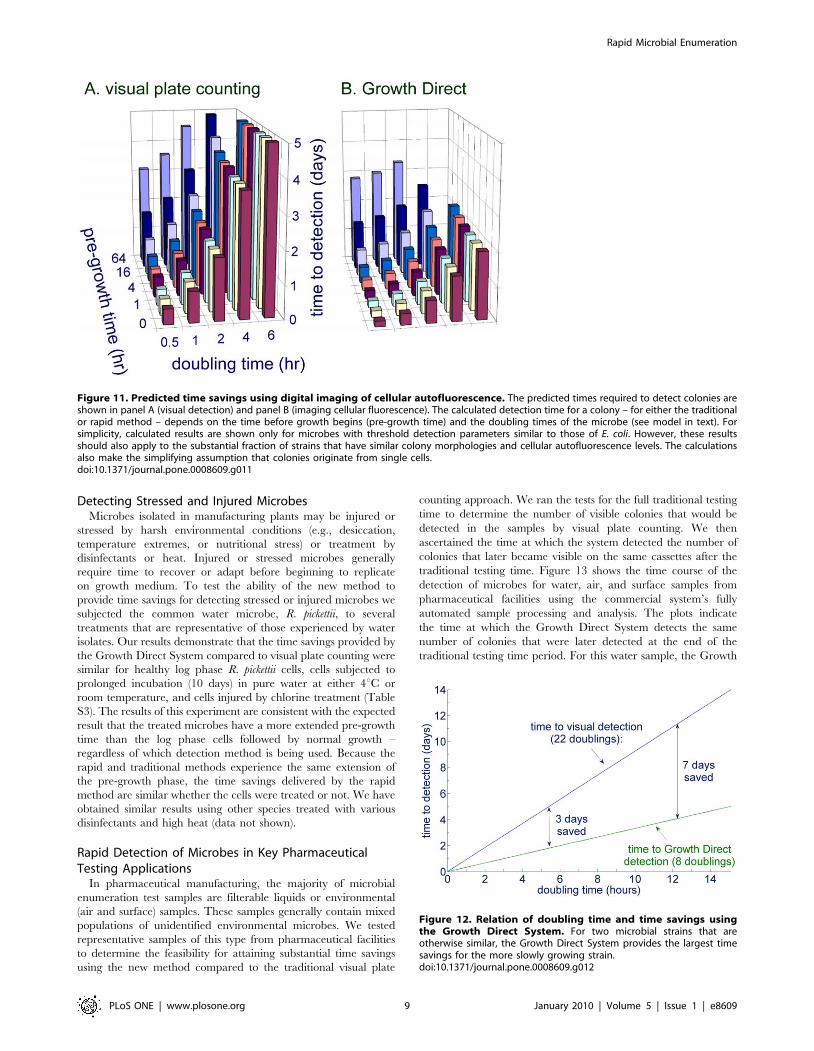
time and doubling time using Equations (3) and (4). Figure 11A
plots the visual plate counting time to detection as a function of
pre-growth and doubling time for microbes that would be detected
in a 5 day test, assuming the number of cells required for visual
detection is 56106, the same as for E. coli. Figure 11B shows the
predicted time to detection for the same microbes, those that could
be detected visually in 5 days, when using the Growth Direct
System, making the assumption that, like E. coli, the colonies can
be first detected at the 128-cell stage. The model predicts the
largest time savings for the most slowly growing microbes
(Figure 12). This follows from the fact that the Growth Direct
System detects microcolonies about 15 generations before they
become visually detectable. The longer the generation time the
more time is saved using the rapid method. The time savings
relative to the traditional 5 day test are smaller for microbes with a
combination of very long pre-growth times and rapid doubling
times. Note that the theoretical treatment above applies to the
initial detection of autofluorescent microcolonies. In practice, the
system software requires that a putative fluorescent microcolony
grows over multiple image time points before it is classified as a
growing microcolony. Thus, the time at which the system reports
detection of a microcolony is delayed relative to the initial
detection by an amount of time that depends on the imaging
interval (generally about 3 hours for pharmaceutical applications).
Figure 10. Intrinsic microbial cellular fluorescence is propor-tional to cellular volume. The data indicates that using the GrowthDirect spectral regime, microbes fluoresce with an intensity equivalent toabout 47 fluorescein molecules for every cubic micron of cellular volume.doi:10.1371/journal.pone.0008609.g010
Rapid Microbial Enumeration
PLoS ONE | www.plosone.org 8 January 2010 | Volume 5 | Issue 1 | e8609
Detecting Stressed and Injured MicrobesMicrobes isolated in manufacturing plants may be injured or
stressed by harsh environmental conditions (e.g., desiccation,
temperature extremes, or nutritional stress) or treatment by
disinfectants or heat. Injured or stressed microbes generally
require time to recover or adapt before beginning to replicate
on growth medium. To test the ability of the new method to
provide time savings for detecting stressed or injured microbes we
subjected the common water microbe, R. pickettii, to several
treatments that are representative of those experienced by water
isolates. Our results demonstrate that the time savings provided by
the Growth Direct System compared to visual plate counting were
similar for healthy log phase R. pickettii cells, cells subjected to
prolonged incubation (10 days) in pure water at either 4uC or
room temperature, and cells injured by chlorine treatment (Table
S3). The results of this experiment are consistent with the expected
result that the treated microbes have a more extended pre-growth
time than the log phase cells followed by normal growth –
regardless of which detection method is being used. Because the
rapid and traditional methods experience the same extension of
the pre-growth phase, the time savings delivered by the rapid
method are similar whether the cells were treated or not. We have
obtained similar results using other species treated with various
disinfectants and high heat (data not shown).
Rapid Detection of Microbes in Key PharmaceuticalTesting Applications
In pharmaceutical manufacturing, the majority of microbial
enumeration test samples are filterable liquids or environmental
(air and surface) samples. These samples generally contain mixed
populations of unidentified environmental microbes. We tested
representative samples of this type from pharmaceutical facilities
to determine the feasibility for attaining substantial time savings
using the new method compared to the traditional visual plate
counting approach. We ran the tests for the full traditional testing
time to determine the number of visible colonies that would be
detected in the samples by visual plate counting. We then
ascertained the time at which the system detected the number of
colonies that later became visible on the same cassettes after the
traditional testing time. Figure 13 shows the time course of the
detection of microbes for water, air, and surface samples from
pharmaceutical facilities using the commercial system’s fully
automated sample processing and analysis. The plots indicate
the time at which the Growth Direct System detects the same
number of colonies that were later detected at the end of the
traditional testing time period. For this water sample, the Growth
Figure 11. Predicted time savings using digital imaging of cellular autofluorescence. The predicted times required to detect colonies areshown in panel A (visual detection) and panel B (imaging cellular fluorescence). The calculated detection time for a colony – for either the traditionalor rapid method – depends on the time before growth begins (pre-growth time) and the doubling times of the microbe (see model in text). Forsimplicity, calculated results are shown only for microbes with threshold detection parameters similar to those of E. coli. However, these resultsshould also apply to the substantial fraction of strains that have similar colony morphologies and cellular autofluorescence levels. The calculationsalso make the simplifying assumption that colonies originate from single cells.doi:10.1371/journal.pone.0008609.g011
Figure 12. Relation of doubling time and time savings usingthe Growth Direct System. For two microbial strains that areotherwise similar, the Growth Direct System provides the largest timesavings for the more slowly growing strain.doi:10.1371/journal.pone.0008609.g012
Rapid Microbial Enumeration
PLoS ONE | www.plosone.org 9 January 2010 | Volume 5 | Issue 1 | e8609
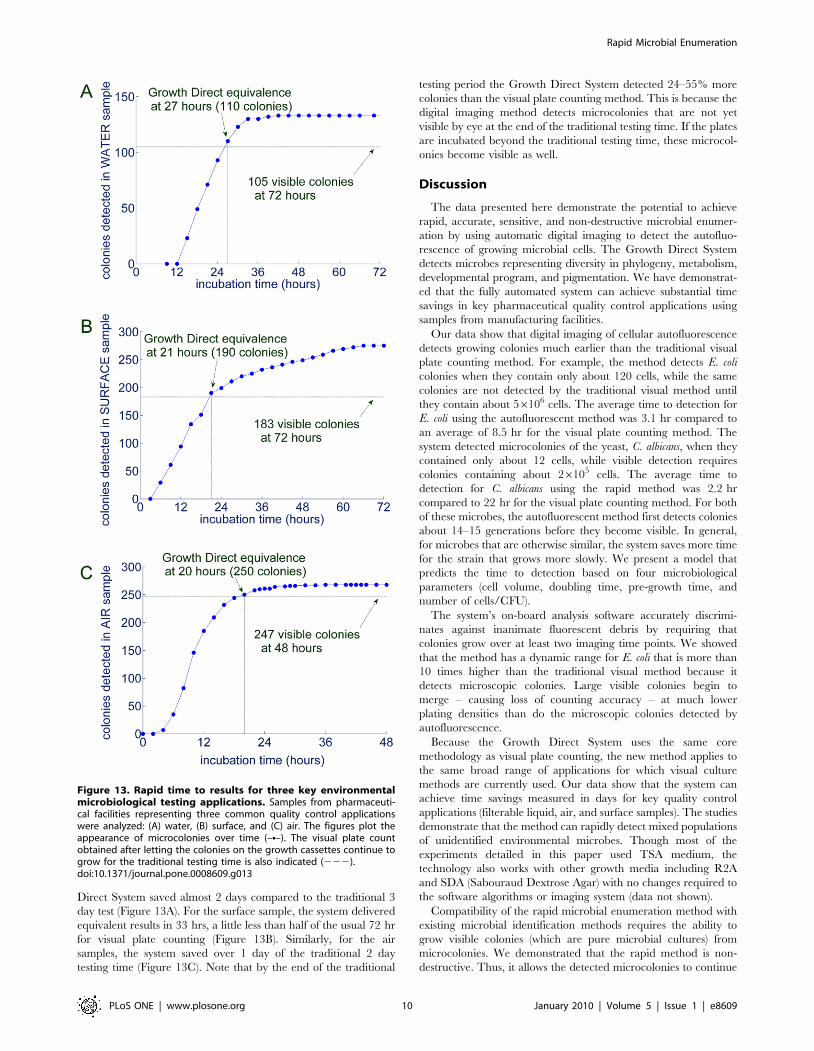
Direct System saved almost 2 days compared to the traditional 3
day test (Figure 13A). For the surface sample, the system delivered
equivalent results in 33 hrs, a little less than half of the usual 72 hr
for visual plate counting (Figure 13B). Similarly, for the air
samples, the system saved over 1 day of the traditional 2 day
testing time (Figure 13C). Note that by the end of the traditional
testing period the Growth Direct System detected 24–55% more
colonies than the visual plate counting method. This is because the
digital imaging method detects microcolonies that are not yet
visible by eye at the end of the traditional testing time. If the plates
are incubated beyond the traditional testing time, these microcol-
onies become visible as well.
Discussion
The data presented here demonstrate the potential to achieve
rapid, accurate, sensitive, and non-destructive microbial enumer-
ation by using automatic digital imaging to detect the autofluo-
rescence of growing microbial cells. The Growth Direct System
detects microbes representing diversity in phylogeny, metabolism,
developmental program, and pigmentation. We have demonstrat-
ed that the fully automated system can achieve substantial time
savings in key pharmaceutical quality control applications using
samples from manufacturing facilities.
Our data show that digital imaging of cellular autofluorescence
detects growing colonies much earlier than the traditional visual
plate counting method. For example, the method detects E. coli
colonies when they contain only about 120 cells, while the same
colonies are not detected by the traditional visual method until
they contain about 56106 cells. The average time to detection for
E. coli using the autofluorescent method was 3.1 hr compared to
an average of 8.5 hr for the visual plate counting method. The
system detected microcolonies of the yeast, C. albicans, when they
contained only about 12 cells, while visible detection requires
colonies containing about 26105 cells. The average time to
detection for C. albicans using the rapid method was 2.2 hr
compared to 22 hr for the visual plate counting method. For both
of these microbes, the autofluorescent method first detects colonies
about 14–15 generations before they become visible. In general,
for microbes that are otherwise similar, the system saves more time
for the strain that grows more slowly. We present a model that
predicts the time to detection based on four microbiological
parameters (cell volume, doubling time, pre-growth time, and
number of cells/CFU).
The system’s on-board analysis software accurately discrimi-
nates against inanimate fluorescent debris by requiring that
colonies grow over at least two imaging time points. We showed
that the method has a dynamic range for E. coli that is more than
10 times higher than the traditional visual method because it
detects microscopic colonies. Large visible colonies begin to
merge – causing loss of counting accuracy – at much lower
plating densities than do the microscopic colonies detected by
autofluorescence.
Because the Growth Direct System uses the same core
methodology as visual plate counting, the new method applies to
the same broad range of applications for which visual culture
methods are currently used. Our data show that the system can
achieve time savings measured in days for key quality control
applications (filterable liquid, air, and surface samples). The studies
demonstrate that the method can rapidly detect mixed populations
of unidentified environmental microbes. Though most of the
experiments detailed in this paper used TSA medium, the
technology also works with other growth media including R2A
and SDA (Sabouraud Dextrose Agar) with no changes required to
the software algorithms or imaging system (data not shown).
Compatibility of the rapid microbial enumeration method with
existing microbial identification methods requires the ability to
grow visible colonies (which are pure microbial cultures) from
microcolonies. We demonstrated that the rapid method is non-
destructive. Thus, it allows the detected microcolonies to continue
Figure 13. Rapid time to results for three key environmentalmicrobiological testing applications. Samples from pharmaceuti-cal facilities representing three common quality control applicationswere analyzed: (A) water, (B) surface, and (C) air. The figures plot theappearance of microcolonies over time (–N–). The visual plate countobtained after letting the colonies on the growth cassettes continue togrow for the traditional testing time is also indicated (222).doi:10.1371/journal.pone.0008609.g013
Rapid Microbial Enumeration
PLoS ONE | www.plosone.org 10 January 2010 | Volume 5 | Issue 1 | e8609
to grow into visible colonies which can be subsequently used for
identification. Our data show that cells from representative
microbial groups are not killed even when exposed to much more
blue light than is actually used in the system. The ability of the cells
to survive exposure that is 10 times the level delivered by the
system provides confidence that the method is unlikely to kill
environmental microbes. We also showed that heating by the
system does not significantly affect recovery of a heat-sensitive
microbe, P. fluorescens. Thus, we have demonstrated that
illumination and processing by the Growth Direct System is
non-destructive to microbes. Some other devices and methods for
high intensity illumination have, in contrast, caused a decrease in
microbial recovery [16,17]. Besides the differences in instrumen-
tation and spectral regime, the lowered microbial recovery in some
studies may be an artifact of photonic heating of the growth
surface – an effect that we were careful to control for in our work.
New rapid methods for microbial enumeration have been
widely implemented in the healthcare and food industries. In
contrast, rapid testing has yet to gain a substantial foothold in
pharmaceutical and personal care product industries. In these
industries visual plate counting is used to detect microbial
contamination in raw materials, in-process and finished products,
and the manufacturing environment. Faster detection of contam-
ination would enable manufacturers to more quickly release
finished product, recognize that a contamination problem exists,
and minimize the amount of discarded product. For these reasons
regulators, manufacturers, trade groups, and quality assurance
professionals in the pharmaceutical manufacturing industry have
developed initiatives and guidelines to facilitate adoption of rapid
microbial testing [15,18,19].
However, despite the high costs incurred by slow microbial
testing and the availability of methods for faster testing [20], no
rapid microbial enumeration technology has displaced a signifi-
cant fraction of the more than 350 million traditional culture tests
that are carried out by manufacturers of pharmaceuticals and
personal care products each year [21]. Penetration of new rapid
testing technologies in these industries has been impeded in part
by failure to maintain some essential benefits of the current
culture-based methods. Furthermore, demonstrating equivalence
to regulatory reference tests can be problematic as most new
methods are based on different principles and measure different
quantities than the culture test gold standard.
Besides maintaining the key benefits of culture tests, the rapid
method presented here should streamline regulatory validation
since it is based on the same underlying principles and procedures
as the regulatory gold standard. Manufacturers’ validation effort
should in large part be limited to the new automated aspects of the
system. Demonstrating equivalence to the traditional method
during validation is simplified because the new technology
provides numerically equivalent results in the same units (CFU).
In contrast, validation and demonstration of equivalence is
expected to be more arduous for alternative rapid enumeration
methods that are technically distinct from the current standard
method and that deliver results using a different metric (for
example, relative light units or number of cells with enzymatic
activity).
We have shown that automated digital imaging of microcolony
autofluorescence has the potential to address slow test turnaround
and manual analysis, two of the major limitations of the visual
plate counting method as practiced in industrial microbiology
quality control. The system described here also offers advantages
derived from its similarity to the current method such as
compatibility with microbial identification, numerical equivalence,
and congruence with the regulations. Compared to rapid methods
that differ greatly from the traditional method, regulatory
validation for the new method should be substantially streamlined.
Manufacturers’ validation efforts can focus simply on demonstrat-
ing that counting autofluorescent colonies using digital imaging is
equivalent to visual colony counting.
Future publications will demonstrate the efficacy of the method
in the context of a variety of key microbiological quality control
applications.
Materials and Methods
Strains and Media and MembranesAll purchased strains were from the American Type Culture
Collection (Manassas, VA), and include E. coli 8739, B. diminuta
11568, C. albicans 10231, and P. fluorescens 17397. Environmental
isolates were identified by 16S ribosomal DNA sequencing [22].
Trypticase Soy Broth (TSB), TrypticaseTM Soy Agar (TSA), and
Standard Methods Agar were purchased from VWR International
(West Chester, PA) or Northeast Laboratories (Winslow, ME).
Phosphate buffered saline (PBS, 10 mM sodium phosphate
pH 7.4, 140 mM NaCl, 3 mM KCl) was purchased from VWR.
Membranes were 0.45 micron black mixed cellulose esters (MCE)
membranes (Millipore Corp., Billerica, MA).
Overview of the Instrumentation FunctionalityThe Growth Direct System (Rapid Micro Biosystems, Bedford
MA) is an automated rapid microbial enumeration platform that
integrates digital imaging, robotic handling, incubation, and
software control. Bar coded Growth Cassettes are introduced to
the system in a carrier. After being picked up by the robotic arm,
the bar code is read and the cassette is imaged and then loaded
into a built-in automated incubator. To build up an image time
series, Growth Cassettes are periodically removed from the
incubator, imaged, and returned to the incubator by the robotic
system. Before imaging, a low-powered heater removes any
condensation that may have formed on the optical cassette lid.
Optical SystemFor imaging the cassette is held on a computer controlled stage
with X, Y, and Z motion. Focusing is achieved using a non-contact
laser distance sensor. The membrane in a Growth Cassette is
illuminated with optically filtered columnated blue light (450–
500 nm) from multiple light emitting diodes (LEDs). Incident light
induces fluorescence in the target microcolonies which is collected
by a high-collection efficiency, non-magnifying lens system. The
emitted fluorescent light is transmitted through a green emission
filter (510–560 nm) and collected by a charged-coupled device
(CCD) digital camera. To analyze the entire working area of the
membrane, the imager acquires nine contiguous image tiles. In
early experiments, including the fluorescent images in figures 4
and 5, measurements of time-to-detection (Table 2), linearity
(Figure 8) and precision, we used a prototype imager. The
prototype had essentially the same functionality as the commercial
system described above but was not fully automated and used an
arc lamp rather than LEDs.
Image AnalysisOnboard automated image analysis by custom software
incorporates functions for background smoothing, object finding,
and enumerating fluorescent objects that grow in size and intensity
over time. Because the membrane and media display high-spatial-
frequency optical noise which can vary with time, the software
applies a background correction algorithm to smooth out the noise
and separate signal from background. Clusters of neighboring
Rapid Microbial Enumeration
PLoS ONE | www.plosone.org 11 January 2010 | Volume 5 | Issue 1 | e8609
pixels whose intensity significantly exceeds the local background
are classified as objects. The software monitors key morphological
parameters of the objects including their position, intensity, size,
and other characteristics. Algorithms assess changes in these
characteristics over time to identify the objects as either growing
microcolonies or non-growing debris. Figure S4 demonstrates the
accuracy of the automated image analysis software by comparing
its detection of growing colonies to detection by visual inspection
of images on a computer monitor. In the early experiments
described in the previous section, we used prototype image
analysis software and checked and edited the results by visual
inspection of the images on a computer monitor.
Growth Cassettes and Filtration UnitsThe body of the Growth Cassette (Rapid Micro Biosystems,
Bedford MA) is custom made of injection molded styrenic plastics.
The cassette incorporates a pouring lid that creates a flat agar
surface, and a side-fill port for adding the agar (Figure S1). Just
before use, the user removes the pouring lid, places a membrane
on the agar surface, and then covers the cassette body with a
sterile, clear lid that enables imaging. Filtration units (Rapid Micro
Biosystems, Bedford MA) comprising plastic funnels and mixed
cellulose ester membranes were used to filter liquid samples. To
maintain membrane flatness during filtration, the membrane is
supported by a porous plastic disk (Porex Corporation, Fairburn,
GA). Units are sterilized by ethylene oxide treatment. In early
experiments using the prototype imaging system, we used
prototype cassettes and funnels which had essentially the same
functionality as those described above.
Determining the Time-to-DetectionFor time to detection experiments using model organisms, log
phase cells were serially diluted into PBS so that the final dilution
(20 ml) contained approximately 100 CFU. E. coli, B. diminuta, and
C. albicans were imaged at regular intervals (20 minutes for E. coli
and 1 hour for C. albicans and B. diminuta). The first time point at
which a colony can be found above the background of the image is
its Growth Direct time to detection. We defined the time to
detection for visible plate counting as the first time point at which
a colony reaches a diameter of $0.5 mm. The median time to
detection was calculated using a Probit analysis [23] of the
proportion of colonies detected vs. time (See Figure S9). Doubling
times were calculated using total pixel intensity of an imaged
microcolony over time.
Spectral Analysis of Microbial AutofluorescenceCells from the species listed in Table 1 were grown in a thin
confluent layer on membranes placed on TSA. Uninoculated
controls were prepared and incubated in parallel for background
measurements. The cassettes were mounted in a custom solid
sample holder in a Fluorolog 3–22 spectrofluorometer (Horiba
Jobin Yvon, Edison, NJ). The collection mirrors were set to the
front facing setting, and the samples were scanned at 450 to
600 nm for emission (3 nm slit widths, integration times of
0.2 seconds at 5 nm increments) and from 400 to 550 nm for
excitation (3 nm slit width, 10 nm increments). Data was collected
in triplicate for each species.
Data from the three replicates were averaged. A plot combining
the signal to background information for all the species was
created by normalizing the values for each individual species to the
median fluorescence value and then averaging the normalized
values. See supplementary information for further explanation
(Figure S10).
Assessing Non-Destructive DetectionTo test whether illumination by blue light is non-destructive to
microbes, we exposed test strains to levels of light equivalent to 10
times that which they would be exposed to during normal
operation. About 200 CFU were placed on TSA Growth Cassettes
(without lids), inserted into an imager and exposed to light (1 W/
cm2, maximum intensity) for 25 sec. The number of cells per CFU
was determined by microscopic examination of at least 100 CFU
prior to filtration. To isolate the effect of high light intensity from
thermal effects, we took the following precautions to eliminate
excessive heating due to the long exposures. Samples were
illuminated in two consecutive 12.5 sec cycles and, for each cycle,
the membranes were placed on a fresh pre-cooled (4uC) Growth
Cassette. The maximum temperature reached transiently by the
membranes was about 45uC, as measured in parallel experiments
using a digital thermal probe (VWR). A set of control membranes
was prepared at the same time and treated the same way except
that the control membranes were not exposed to blue light. The
Growth Cassettes were incubated overnight at 32.5uC.
Two approaches were used to demonstrate that system heating,
which is a consequence of the imaging and condensation removal
processes, does not kill P. fluorescens, a thermally sensitive microbe
that does not grow at 42uC. Figure S6 demonstrates the heat
sensitivity of P. fluorescens. Membranes containing P. fluorescens were
placed on cassettes pre-warmed to 42uC – which is 9.5uC warmer
than the cassettes in normal operation – and exposed to light
equivalent to that in the normal imaging cycle. Plates were then
incubated at 32.5uC alongside controls that did not experience
temperatures above 32.5uC. For the second method we tested the
survival of the same heat sensitive strain when cycled through the
Growth Direct System at twice the frequency of imaging cycles
compared to normal operation. For these experiments cassettes
were incubated at 32.5uC and processed by the system (including
condensation removal and imaging) every 1.5 hr. Control plates
were incubated in parallel without processing.
Determining Statistical Equivalence of MicrobialRecovery with and without Stress
Our criteria for statistical equivalence in the heat and light stress
experiments required that the test values be statistically equal to or
greater than the control values. We assessed the equivalence using
the Two One Sided t-test (TOST; [24]). To be judged as
statistically equivalent to the control, the 95% confidence range of
the test value must fall between two predetermined limits, called
theta values. Theta values represent the cut-offs at which the two
values are considered functionally equivalent. In practice, in
pharmaceutical manufacturing, the test method must generally
recover at least 70% of the control method. For the recovery of
organisms in the stress experiments, we applied a stricter standard
of ‘‘at least 90%’’, hence we chose the theta value of 210% as our
lower limit. We did not impose an upper limit for equivalency
since higher recovery using the test method would be acceptable.
Determining the Autofluorescent Intensity of CellsIntrinsic microbial cellular fluorescence was determined using two
methods: first using lawns of cells filtered onto membranes and
measured with the Growth Direct System and second using flow
cytometry [25]. For the lawn method, cells were grown to early log
phase (,107 CFU/ml) and washed in cold PBS. In triplicate, log
phase cells were filtered such that approximately 36107 (C. albicans),
86108 (E. coli), or 76109 (B. diminuta) CFU were filtered onto a
membrane. The membranes were rinsed twice (PBS, 50ml) and then
mounted on Growth Cassettes (TSA) and imaged in the Growth
Rapid Microbial Enumeration
PLoS ONE | www.plosone.org 12 January 2010 | Volume 5 | Issue 1 | e8609
Direct System. Cell concentrations were determined by plate counting
(E. coli, B. cepacia) or using a hemocytometer (C. albicans). Negative
control membranes were prepared using uninoculated TSB. To
standardize fluorescence, a known quantity of beads calibrated in
fluorescein equivalents (Bangs Laboratories, Fishers, IN) were filtered
in lieu of bacteria. The autofluorescence was proportional to the
number of cells on the membrane and that there was no ‘‘shadowing’’
effect from piling of microbial cells (data not shown).
For flow cytometry, cells were grown to early log phase (,107
CFU/ml) and washed in cold PBS. Intrinsic fluorescence of
individual cells was measured in a flow cytometer (CyFlow space,
Partec, Mt. Laurel, NJ) with the adjustable laser set at 120 mW.
Custom-labeled 1.8 mm fluorescent beads from Bangs Laborato-
ries (Fishers, IN) were used to create a standard curve ranging
from 198 to 1965 fluorescein equivalents for most species or 908 to
3642 for C. albicans [26,27]. The cells were also examined
microscopically after the wash steps to determine the distribution
of cells/CFU.
Determining the Number of Cells in ColoniesThe number of cells in microcolonies as a function of incubation
time was determined using two methods: scanning electron
microscopy (SEM) and microbiological determination of the
number of cells washed off of membranes containing known
numbers of microcolonies. We used SEM to count the cells in
microcolonies at various incubation times following the plating of
log phase cells. We then used the measured doubling time to
calculate, by extrapolation, the number of cells in microcolonies at
the time-to-detection. Microcolonies were prepared for scanning
electron microscopy (SEM) as follows. Log phase cells (.5000
CFU) were filtered and transferred to pre-warmed TSA plates. E.
coli and B. diminuta were incubated at 35uC, while C. albicans was
incubated at 25uC. At regular intervals (30 min for E. coli, 1 hour
for C. albicans and B. diminuta) the membranes were transferred to
filter paper (#3, Whatman International, Piscataway, NJ) soaked
in a fixative (4% formaldehyde/2.5% glutaraldehyde/0.56PBS at
4uC) and incubated overnight at 4uC. The membranes were then
taken through an ethanol dehydration series (once each on 30%
and 50% ethanol followed by twice on 70% ethanol) by serial
transfer to filter paper soaked in the solvents followed by a final
transfer to chloroform. The chloroform was evaporated and the
membranes were prepared for SEM by coating with a 2 nm
carbon film in a vacuum evaporator, followed by sputter coating
with palladium and gold (10 nm) [28]. The membranes were then
scanned in the SEM at about 20006 magnification to locate
colonies, and counted at about 50006magnification. To minimize
undercounting of cells due to piling into layers, we only analyzed
time points at which microcolonies averaged fewer than 15 cells.
This corresponds to incubation times of 2 h for E. coli, 2 h for C.
albicans, and 4 h for B. diminuta.
For analysis of the number of cells in microcolonies that had
been washed off of membranes we prepared membranes with
,5000 CFU. At various time points membranes were removed
from the petri dishes and placed into 50 ml centrifuge tubes
containing PBS (25 ml). Samples were agitated (Vortex Genie;
Fisher Scientific, Waltham, MA; setting 8, 2 min) to remove cells
from the membrane. Serial dilutions were prepared to determine
the number of cells washed off at each time point, by either
filtration or spread plate (in triplicate). We corrected for the
efficiency with which cells were washed off of membranes (90% for
E. coli and 98% for C. albicans, data not shown). We also corrected
for the number of cells per CFU in the washed off material, which
we determined by microscopic examination (average of 1.9 cells/
CFU for C. albicans; ,1 cell/CFU for E. coli).
We used essentially the same wash-off procedures for analyzing
the number of cells in visible colonies, but with the following
modifications. About 50 cells were filtered per membrane and
incubated on TSA plates until the colonies were about 0.5 mm in
diameter. To estimate the number of cells that remained on the
membrane following washing, we stained the membranes with
propidium iodide and examined them by fluorescence microscopy.
The number of remaining cells did not exceed 6% of the cells for
any of the species.
Determining Cellular VolumeCell volume estimates were made from shaken suspension-
culture-grown log-phase cells in TSB. A drop of fresh cells was
mounted on a microscope slide and covered with a standard cover
slip. Light microscope images (4006, phase contrast) were
captured by a CCD camera. The images were calibrated by
imaging a 1 mm ruler (10 microns per tick mark) using the same
microscope optics and camera. Images of the ruler and the cells
were measured using ImagePro Plus software (Media Cybernetics,
Bethesda, MD). The volume calculations for E. coli and B. diminuta
were modeled after cylinders (hpr2). C. albicans was modeled as an
ellipsoid with two distinct radii (43
pr1r22). At least 50 cells were
measured from each species.
Testing Air, Surface, and Water SamplesAll samples were collected in pharmaceutical manufacturing
facilities. Air samples (500 liters) were taken using an Air IdealTM
sampler (bioMerieux SA, Marcy l’Etoile, France). Membranes
were placed on the center of 55 mm contact plates (TSA) and
placed in the air sampler. Following sampling, the membranes
were transferred to a Growth Cassette and introduced to the
Growth Direct System. For surface sampling, membranes were
placed on the center of 55 mm contact plates (TSA) and the
membrane edges were covered with polyfoil (Bel Art Products,
Pequannock, NJ) to retain the membrane on the contact plate
surface. Membranes were contacted with surfaces, the polyfoil was
discarded, and the membranes were transferred to Growth
Cassettes. Air samples were incubated at 32.5uC and imaged
every 3 hours for 72 hrs. Surface samples were incubated at
32.5uC and imaged every 3 hours for 48 hrs. Water samples were
inoculated into PBS, filtered onto membranes, and transferred to
Growth Cassettes containing Standard Methods agar. Water
samples were incubated at 32.5uC, and imaged every 3 hours for
72 hrs. Colonies were counted by eye at the end of the testing
period.
Supporting Information
Table S1 List of representative microbes that have been
detected by the Growth Direct System. The Growth Direct
System detects autofluorescent microcolonies from a broad range
of strains as demonstrated by the breadth of the representative
microbes listed in the table. All strains listed were identified by 16S
ribosomal DNA sequencing or were purchased from a culture
collection such as the ATCC. The Growth Direct System has also
detected autofluorescent microcolonies corresponding to each of
the many thousands of unidentified visible colonies isolated from
environmental samples.
Found at: doi:10.1371/journal.pone.0008609.s001 (0.02 MB
PDF)
Table S2 Doubling times and lag phase of model organisms.
Growth of cells in liquid media was monitored by titering samples
of the growing cultures (in triplicate) at specific time intervals
(20 minutes for E. coli and 1 hour for C. albicans and B. diminuta).
Rapid Microbial Enumeration
PLoS ONE | www.plosone.org 13 January 2010 | Volume 5 | Issue 1 | e8609
For cells on membranes, the doubling time was determined based
on the increase in microcolony fluorescence intensity over time. At
least 10 colonies were analyzed for each species. The lag phase on
membranes was determined from the wash-off experiment
described in the ‘‘Determining the number of cells in colonies’’
section of the Materials and Methods.
Found at: doi:10.1371/journal.pone.0008609.s002 (0.01 MB
PDF)
Table S3 Rapid detection of bacteria that have been subjected to
stress and injury. Stressed and injured microbes are commonplace in
manufacturing environments. The table shows the results of
experiments in which we determined how stress and injury typical
of those that might be experienced by environmental water microbes
affected the time to results for the common water-borne microbe
Ralstonia pickettii. We compared the time to results for digital detection
of autofluorescent microcolonies and for traditional visual plate
counting. In other related work we have demonstrated the ability of
the automated method to deliver rapid detection of cells that have
been injured by heat and disinfectant treatment (data not shown).
Note that in all such experiments, all microcolonies detected by the
Growth Direct System gave rise to visible colonies upon further
incubation. To simulate the nutritional stresses that might be
experienced by water microbes, we subjected a strain of R. pickettii
(that was isolated at a medical device company) to prolonged
incubation (10 days) in pure water (water for injection) at 4uC or at
room temperature (about 22uC). We also tested the injured R. pickettii
cells that survived treatment with chlorinated city water (0.57 mg/L
total chlorine; 1 hr, about 22uC) which killed 98.6% of the input
microbes. After treatment with chlorinated water samples were
neutralized using sodium thiosulfate (Standard methods for the
examination of water and wastewater. 1998, Clesceri et al eds.,
Washington DC, Amer. Pub. Health Assoc.). As a non-stressed
control sample we also tested log phase R. pickettii cells (TSB medium,
37uC, shaking). After plating, samples were analyzed using the
Growth Direct System over the course of incubation (3 days; 35uC;
R2A media; images taken at two hour intervals). For the rapid
method colonies were counted at each interval using the system
software. Colonies were scored as visually detectable when they
reached 0.5 mm diameter. Table S3 compares the mean time to
detection for R. pickettii cells for the rapid and traditional visual
methods. The results show that, relative to the untreated log phase
cells, prolonged growth in pure water and chlorine treatment increase
the time to results either when detecting colonies by autofluorescence
imaging or visually. The amount of delay in time to detection relative
to the untreated log phase sample (Dtreated2logW) is greatest for sub-
lethal injury by chlorine treatment followed by 10 day incubation in
pure water at room temperature and 4uC. The table shows that the
delay in the time to results (Dtreated2logW) is about the same for the rapid
and traditional testing methods when cells were injured by chlorine
(,5 h) and cells incubated for 10 days in water at room temperature
(,4 h). When cells were incubated in water at 4uC for 10 days, the
delay was slightly longer for detection by the rapid method (,2 h
compared to ,1 h). As a consequence of the similarity in the
treatment-induced delay for the two methods, the absolute time
savings obtained using the rapid method are about the same whether
the microbes are injured or not. This observation is consistent with
the results of experiments on other strains that we injured using
disinfectants and heat (data not shown). The results can be explained
by the accepted model in which a period of physiologic adaptation
and/or injury recovery is required before normal growth can occur
following stress, change in chemical environment, or injury.
According to this model and the one presented in the text, one
would expect that stress and injury would extend the pre-growth
period equivalently for both the rapid and traditional detection
methods. In the absence of mutations that affect growth rate, the
growth rates of cells should be the same once they adapt or recover
and begin to grow. Thus, this model predicts that the time savings of
the new method - which speeds detection by decreasing the number
of generations of growth required - should be similar for samples with
injured or healthy microbes.
Found at: doi:10.1371/journal.pone.0008609.s003 (0.09 MB
PDF)
Figure S1 The growth cassette design enables efficient optical
imaging of microcolonies.
Found at: doi:10.1371/journal.pone.0008609.s004 (0.05 MB
PDF)
Figure S2 The Growth Direct System.
Found at: doi:10.1371/journal.pone.0008609.s005 (0.06 MB
PDF)
Figure S3 Key components of the Growth Direct System.
Found at: doi:10.1371/journal.pone.0008609.s006 (0.09 MB
PDF)
Figure S4 Accuracy of the Growth Direct System software. For
water samples from a pharmaceutical plant, we compared the
results obtained using the Growth Direct System image analysis
software to analysis of the images by human visual inspection. The
results plotted in the figure demonstrate that the automated image
analysis software is comparable to human visual analysis. Note
that human visual analysis is often considered the gold standard
for this type of complex pattern recognition. For human visual
analysis, the analyst found all of the objects in each image of the
time series. Then, by comparing the objects on the various images
in the time series, they determined which were growing objects
and which were debris. Most of the microcolonies (607) became
large enough to be visible to the human eye on the growth cassette
by 48 hours. Some microcolonies (12) that can be detected in the
Growth Direct System images do not become visible on the
growth cassette by 48 hours. We detected visible colonies
corresponding to each of the 12 microcolonies by examining the
growth cassettes after further incubation Thus, all of the growing
autofluorescent microcolonies that were detected by the Growth
Direct System correspond to colonies that are detected by
traditional visual inspection in this experiment.
Found at: doi:10.1371/journal.pone.0008609.s007 (0.08 MB
PDF)
Figure S5 The Growth Direct System software accurately detects
colonies with diverse morphologies. Panel A shows the rapid detection
of microcolonies of varying morphologies from a pharmaceutical plant
environmental air sample. A photograph of the visible colonies seen at
72 hr (center) is surrounded by images of the corresponding
microcolonies detected much earlier by the Growth Direct System.
Panel B shows a mold microcolony as detected by the Growth Direct
System image analysis software (red outline).
Found at: doi:10.1371/journal.pone.0008609.s008 (0.08 MB
PDF)
Figure S6 Temperature sensitivity of P. fluorescens. We chose P.
fluorescens, a heat sensitive microbe, as a model to demonstrate that
heating during processing by the Growth Direct System would not
kill heat-sensitive environmental microbes. The ideal heat-sensitive
test strain should be able to grow at 35uC (the standard ‘‘high’’
temperature for industrial microbiological work) but should grow
poorly at higher temperatures. To show that P. fluorescens fits this
profile, we tested its ability to grow at various temperatures. P.
fluorescens was grown on Growth Direct System membranes
mounted on Petri dishes (TSA) at a variety of temperatures
Rapid Microbial Enumeration
PLoS ONE | www.plosone.org 14 January 2010 | Volume 5 | Issue 1 | e8609

ranging from 25uC to 42uC. The figure plots the two methods we
used to assess temperature sensitivity. The bars show the number
of colonies recovered after two days’ growth at each temperature.
These results demonstrate that there is no statistically significant
difference in colony recovery for samples grown at temperatures
from 25uC to 37uC (3 replicates, error bars indicate Standard
Deviation). However, we recovered no colonies when samples
were incubated at 42uC. We also measured the temperature
dependence of colony size by analyzing digital images of the
macroscopic (visible) colonies on the plates. The plot shows that
there is no significant difference in the colony size for samples
incubated at temperatures ranging from 25uC to 32.5uC.
However, the colonies are significantly smaller when grown at
35uC and smaller yet when grown at 37uC. These data indicate
that the growth of P. fluorescens slows significantly at temperatures
above 32.5uC, and that it is incapable of growth at 42uC.
Found at: doi:10.1371/journal.pone.0008609.s009 (0.07 MB
PDF)
Figure S7 Extending dynamic range by measuring total fluores-
cence intensity of confluent microbial lawns. The plot demonstrates
that the Growth Direct System has the potential to accurately
enumerate sample microbial loads over a range of more than 6
orders of magnitude. This capability comes from combining two
enumeration methods: one that is accurate in samples that give rise
to distinct microcolonies (,7,800 CFU) and one that enumerates the
total autofluorescence intensity in samples that give rise to confluent
lawns of microbes. For samples with distinct microcolonies - those
with less than 7,800 CFU - we used the prototype Growth Direct
System image analysis software (Materials and Methods) to
enumerate the microbes. For samples with more than 7,800 CFU,
we compared the total image intensity to a standard curve developed
in a separate experiment as described below. A standard curve for E.
coli was created by measuring the total fluorescence intensity of
standard samples containing large and defined numbers of bacteria.
We measured the fluorescence intensity of the bacterial lawns that
formed after growth for 4 hours. Log phase E. coli cells suspended in
PBS (approximately 16104 to 16108 CFU) were filtered onto
membranes and placed on pre-warmed Growth Cassettes (TSA).
The concentration of bacteria in the standard samples was
determined by plate counting analysis of 10 replicate dilutions in
the countable range (30–300 CFU). The signal for each point on the
standard curve was determined by subtracting the fluorescence
intensity at the start of incubation from the intensity after incubation
for 4 hrs. The figure shows the results of a blinded study comparing
the Growth Direct System results to the results of the traditional plate
counting method. One scientist generated a series of samples
containing a range of bacteria starting with an E. coli culture in log
phase. A second scientist, with no knowledge of the bacterial load in
the various samples, prepared and analyzed the samples using the
Growth Direct System and image analysis software. The second
scientist examined the images taken after incubating for 4 hr, and
those that appeared confluent or near confluent were analyzed by
the total intensity of the filterable area as described above, and
estimates for the count were derived from the standard curve. The
remaining images were analyzed by the prototype enumeration
software. In an automated implementation an algorithm could
trigger the use of the high-level bioburden method based on a
threshold of fluorescence intensity at a given time point.
Found at: doi:10.1371/journal.pone.0008609.s010 (0.10 MB
PDF)
Figure S8 The threshold number of cells required to first detect
microcolonies is inversely proportional to the intrinsic cellular
fluorescence. The data plots the number of cells required to first
detect autofluorescent microcolonies (Nthresh) vs the intrinsic
cellular fluorescence (Fcell) for E. coli, B. diminuta, and C. albicans.
The slope of the best-fit line estimates (Fthresh), the threshold level
of fluorescence required to detect microcolonies using the Growth
Direct System (Equation 1 in text) is inversely proportional to their
intrinsic cellular fluorescence.
Found at: doi:10.1371/journal.pone.0008609.s011 (0.07 MB
PDF)
Figure S9 Determining the time to detection for model
organisms. The plots show analysis of the time to detection for
A) C. albicans, B) E. coli, and C) B. diminuta. Freshly grown cultures
were filtered onto Growth Direct membranes, and then mounted
onto growth cassettes. They were then imaged in the Growth
Direct System over a number of closely spaced time intervals (see
materials and methods for details). For each cassette, a different
symbol was used to plot the percent of the total number of colonies
vs. time. Using a Probit analysis on the combined data, the time to
50% detection was determined for each species.
Found at: doi:10.1371/journal.pone.0008609.s012 (0.08 MB
PDF)
Figure S10 The spectral dependence of the microbiological
autofluorescence signal relative to the background signal from
membranes saturated with growth medium. The figure uses a
single microbial strain to illustrate the method we used to plot
fluorescence signal to background for a large range of microbial
strains. The fluorescent scans were performed on the surface of
thin lawns of bacteria grown on filtration membranes mounted on
media. An example of the raw data for a B. cepacia scan is shown in
panel A. This plot should represent the signal from the B. cepacia
cells plus the fluorescent background from the membrane. To
measure the background, the same scan was performed on an un-
inoculated membrane mounted on the same media, in this case
TSA (panel B). To determine the signal-to-background ratio, we
subtracted the values in panel B from those in panel A (whose
results are shown in panel C) and then divided this difference by
the values in panel B.
Found at: doi:10.1371/journal.pone.0008609.s013 (0.07 MB
PDF)
Acknowledgments
We thank David Jones and Lisa Shinefeld for critical review of the
manuscript, Tom Murphy for advice on statistics, the Rapid Micro
Biosystems team for developing the Growth Direct System; and Steve
Auger for engineering work on the prototype platform.
Author Contributions
Conceived and designed the experiments: DS. Performed the experiments:
RL JS AS JM HV. Analyzed the data: RL JS AS JM DS. Wrote the paper:
RL JS DS. Supervised 16S rDNA sequencing of microbial strains: MW.
References
1. Frost WD (1920) Improved technic for the micro or little plate method of
counting bacteria in milk. In: From the Agricultural Bacteriology Laboratories,
University of Wisconsin. pp 176–184.
2. United States Pharmacopeia TNF (2008) USP 31 - The National Formulary 26.
2008. In: PDA Journal of Pharmaceutical Science and Technology: The United
States Pharmacopeial Convention, Rockville MD.
Rapid Microbial Enumeration
PLoS ONE | www.plosone.org 15 January 2010 | Volume 5 | Issue 1 | e8609
3. European Directorate for the Quality of Medicines (2006) European
Pharmacopoeia 5th Edition - Supplement 5.5: Council of Europe.4. FDA (2004) Guidance for industry: sterile drug products produced by aseptic
processing - current good manufacturing practice. U.S. Department of Health
and Human Services Center for Drug Evaluation and Research (CDER), Centerfor Biologics Evaluation and Research (CBER), Office of Regulatory Affairs
(ORA). 59 p.5. Steger A (2005) Rapid enumeration of Microorganisms using Advanced
Analytical’s RBD 3000. Miller MJ, ed. In: Encyclopedia of Rapid Microbio-
logical Methods. River GroveIL, , USA: DHI Publishing. pp 379–396.6. Jones DL, Brailsford MA, Drocourt J-L (1999) Solid-phase, laser-Scanning
Cytometry: A New Two-Hour Method for the Enumeration of Microorganismsin Pharmaceutical Water. Pharmacopeial Forum. pp 7626–7645.
7. Oliver JD (2005) The viable but nonculturable state in bacteria. J Microbiol 43:93–100.
8. Billinton N, Knight AW (2001) Seeing the wood through the trees: A review of
techniques for distinguishing green fluorescent protein from endogenousautofluorescence. Anal Biochem. pp 175–197.
9. Aubin JE (1979) Autofluorescence of viable cultured mammalian cells.J Histochem Cytochem 27: 36–43.
10. Benson RC, Meyer RA, Zaruba ME, McKhann GM (1979) Cellular
autofluorescence - is it due to flavins? J Histochem Cytochem 27: 44–48.11. Dalterio RA, Nelson WH, Britt D, Sperry JF, Tanguay JF, et al. (1987) The
steady-state and decay characteristics of primary fluorescence from live bacteria.Appl Spectrosc 41: 234–241.
12. Metcalf RL (1943) The storage and interaction of water soluble vitamins in theMalpighian system of Periplaneta americana L. Arch Biochem 2: 55–62.
13. Chance B, Thorell B (1959) Localization and kinetics of reduced pyridine
nucleotide in living cells by microfluorometry. J Biol Chem 234: 3044–3050.14. Estes C, Duncan A, Wade B, Lloyd C, Ellis W Jr, et al. (2003) Reagentless
detection of microorganisms by intrinsic fluorescence. Biosens Bioelectron 18:511–519.
15. United States Pharmacopeial Convention (2008) Validation of alternative
microbiological methods, Chapter ,1223.. In: The United States Pharmaco-peia 31st edition; National Formulary 26th edition. RockvilleMD: USP. pp
681–683.
16. Enwemeka CS, Williams D, Enwemeka SK, Hollosi S, Yens D (2009) Blue 470-
nm Light kills methicillin-Resistant Staphylococcus aureus (MRSA) in Vitro.
Photomedicine and Laser Surgery. pp 1–6.
17. Kielbassa C, Epe B (2000) DNA damage induced by ultraviolet and visible light
and its wavelength dependence. Methods Enzymol 319: 436–445.
18. FDA (2004) Pharmaceutical cGMPs for the 21st century - A risk based
approach. Dept of Health and Human Services, FDA. pp 32.
19. Parenteral Drug Association (2000) Evaluation, validation and implementation
of new microbiological testing methods; technical report no. 33. J Pharm Sci
Technol supplement. pp 1–41.
20. Miller MJ, ed (2006) Encyclopedia of rapid microbiological methods. Vol 3. 1st
ed. BaltimoreMD: PDA. pp 480.
21. Weschler T (2004) Industrial microbiology market review - 2nd Edition.
WoodstockVT: Strategic Consulting Inc.
22. Waddington MG, Bartell JG, Montgomery SO (2003) Identification of Bacteria
Using MicroSeq 16S rRNA Gene Sequencing Kits and Software. Olson W, ed.
In: Rapid Analytical Microbiology: The Chemistry and Physics of Microbial
Identification. BethesdaMD: PDA/Davis Horwood International Publishing,
Ltd. pp 59–79.
23. Finney DJ (1971) Probit Analysis. Cambridge UK: Cambridge University Press.
333 p.
24. Limentani GB, Ringo MC, Ye F, Bergquist ML, McSorley EO, et al. (2005)
Beyond the t-test: statistical equivalence testing. Anal Chem. pp 221A–226A.
25. Shapiro HM (2003) Practical Flow Cytometry. Hoboken: John Wiley & Sons. pp
681.
26. Vogt RF Jr, Cross GD, Henderson LO, Phillips DL (1989) Model system
evaluating fluorescein-labeled microbeads as internal standards to calibrate
fluorescence intensity on flow cytometers. Cytometry 10: 294–302.
27. Wang L, Gaigalas A, Abbasi F, Marti G, Vogt R, et al. (2002) Quantitating
fluorescence intensity from fluorophores: practical use of MESF values. J Res
Natl Inst Stand Tech. pp 339–353.
28. Dawes CJ (1979) Preparative techniques for scanning electron microscopy. In:
Biological Techniques for Transmission and Scanning Electron Microscopy.
Burlington VT: Ladd Research Industries, Inc. pp 241–251.
Rapid Microbial Enumeration
PLoS ONE | www.plosone.org 16 January 2010 | Volume 5 | Issue 1 | e8609
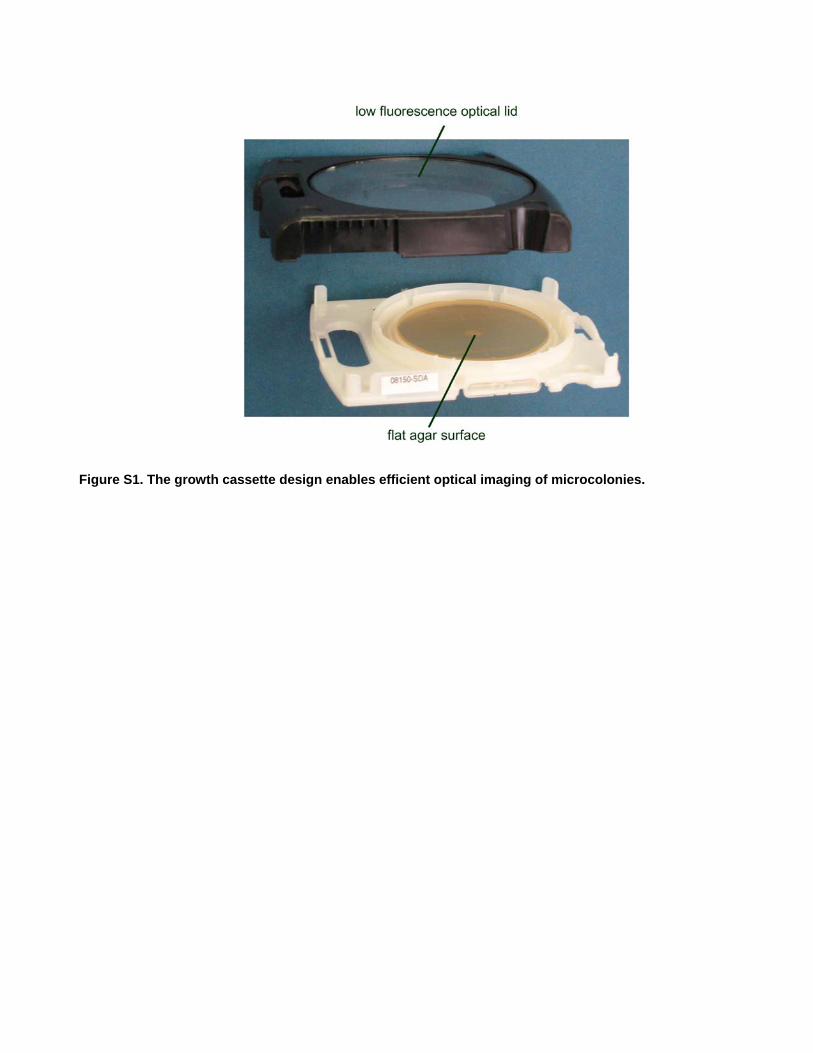
Figure S1. The growth cassette design enables efficient optical imaging of microcolonies.
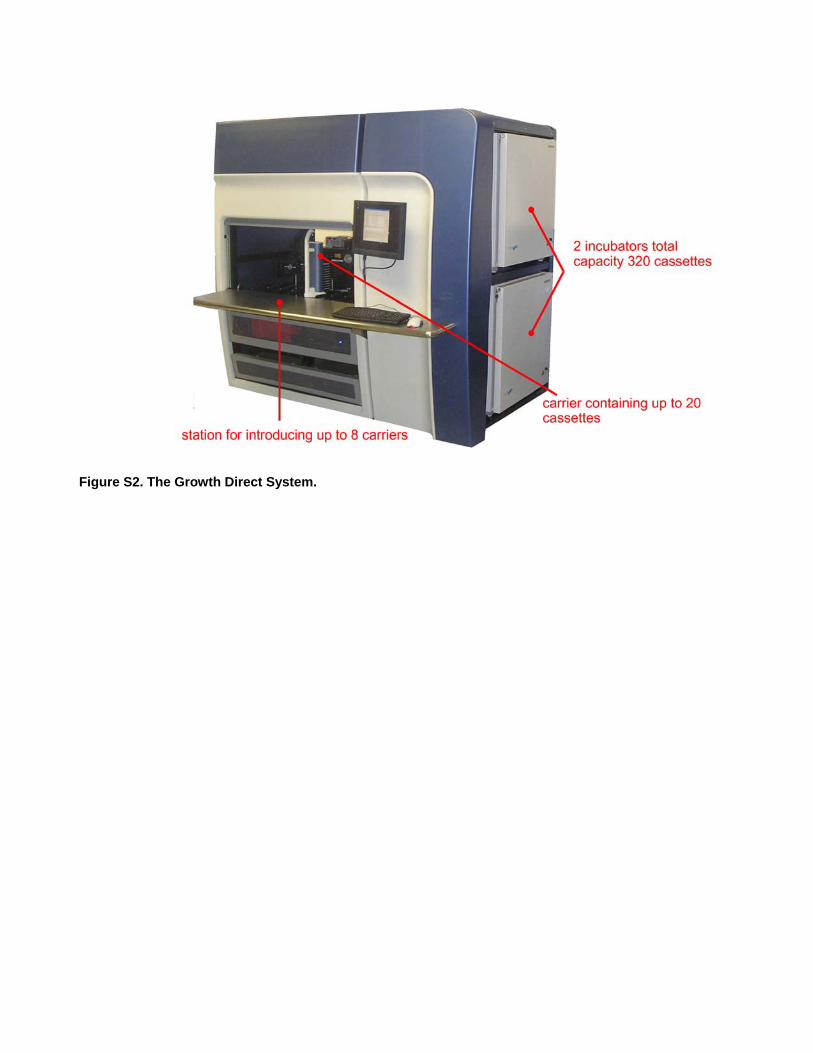
Figure S2. The Growth Direct System.

Figure S3. Key components of the Growth Direct System.
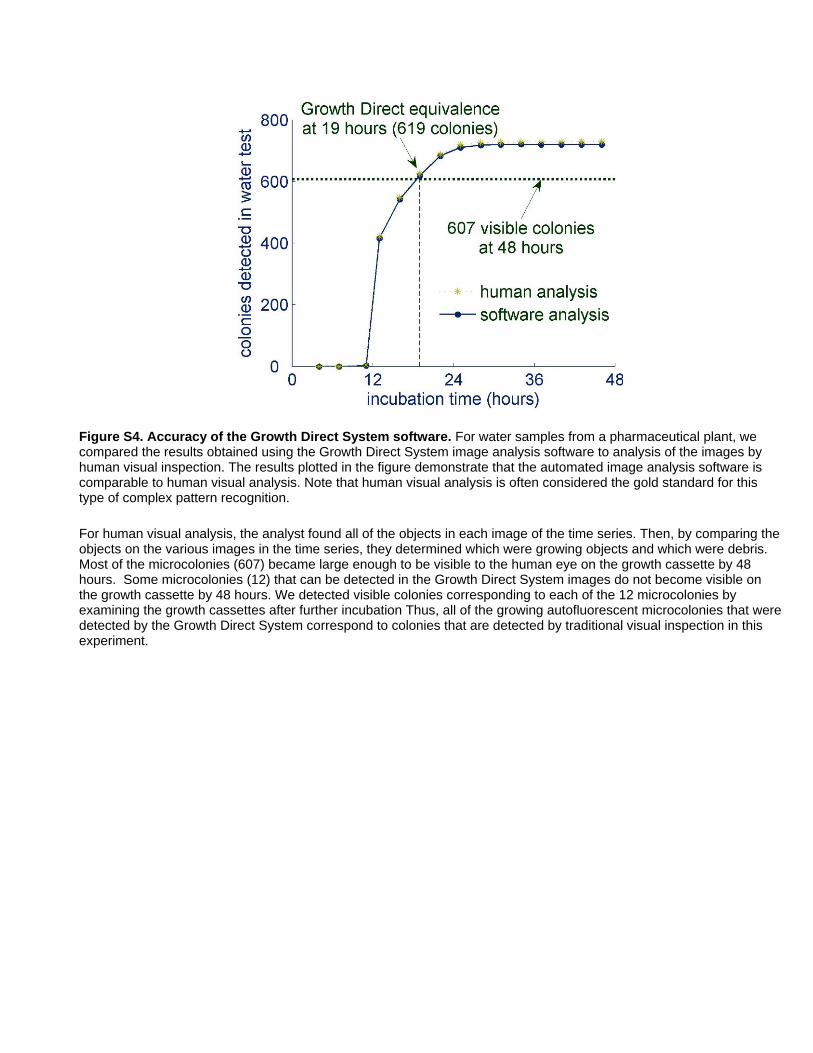
Figure S4. Accuracy of the Growth Direct System software. For water samples from a pharmaceutical plant, we compared the results obtained using the Growth Direct System image analysis software to analysis of the images by human visual inspection. The results plotted in the figure demonstrate that the automated image analysis software is comparable to human visual analysis. Note that human visual analysis is often considered the gold standard for this type of complex pattern recognition. For human visual analysis, the analyst found all of the objects in each image of the time series. Then, by comparing the objects on the various images in the time series, they determined which were growing objects and which were debris. Most of the microcolonies (607) became large enough to be visible to the human eye on the growth cassette by 48 hours. Some microcolonies (12) that can be detected in the Growth Direct System images do not become visible on the growth cassette by 48 hours. We detected visible colonies corresponding to each of the 12 microcolonies by examining the growth cassettes after further incubation Thus, all of the growing autofluorescent microcolonies that were detected by the Growth Direct System correspond to colonies that are detected by traditional visual inspection in this experiment.
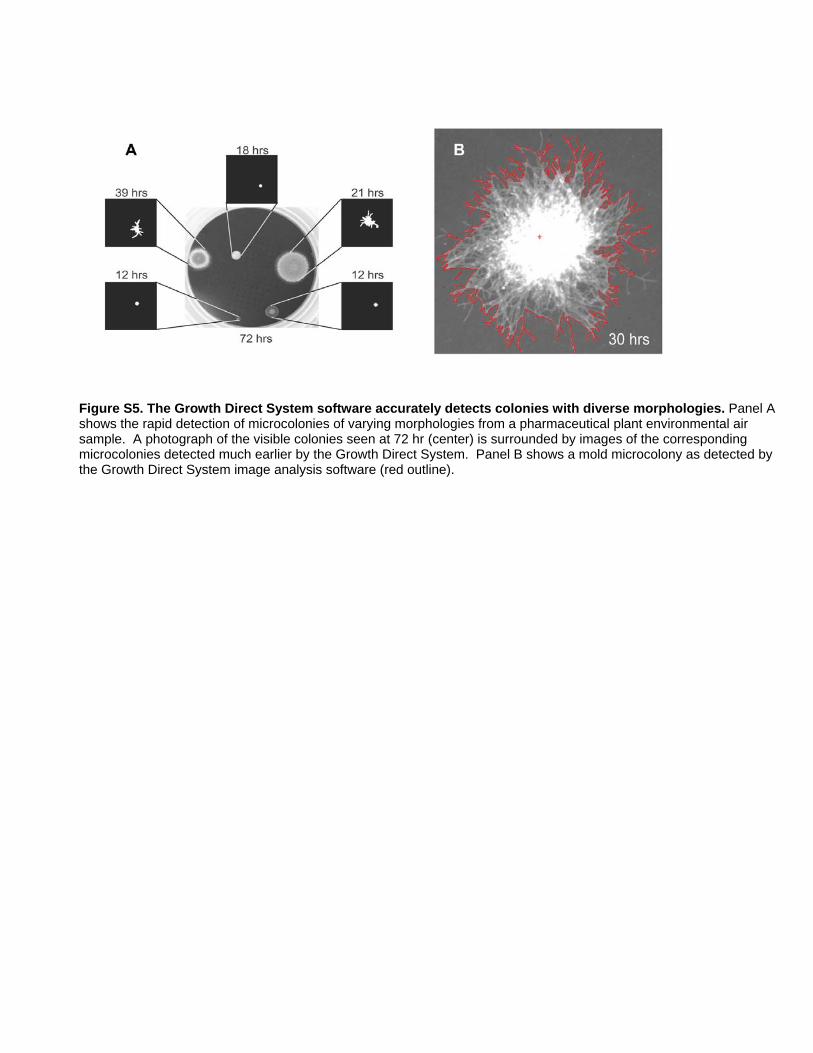
Figure S5. The Growth Direct System software accurately detects colonies with diverse morphologies. Panel A shows the rapid detection of microcolonies of varying morphologies from a pharmaceutical plant environmental air sample. A photograph of the visible colonies seen at 72 hr (center) is surrounded by images of the corresponding microcolonies detected much earlier by the Growth Direct System. Panel B shows a mold microcolony as detected by the Growth Direct System image analysis software (red outline).
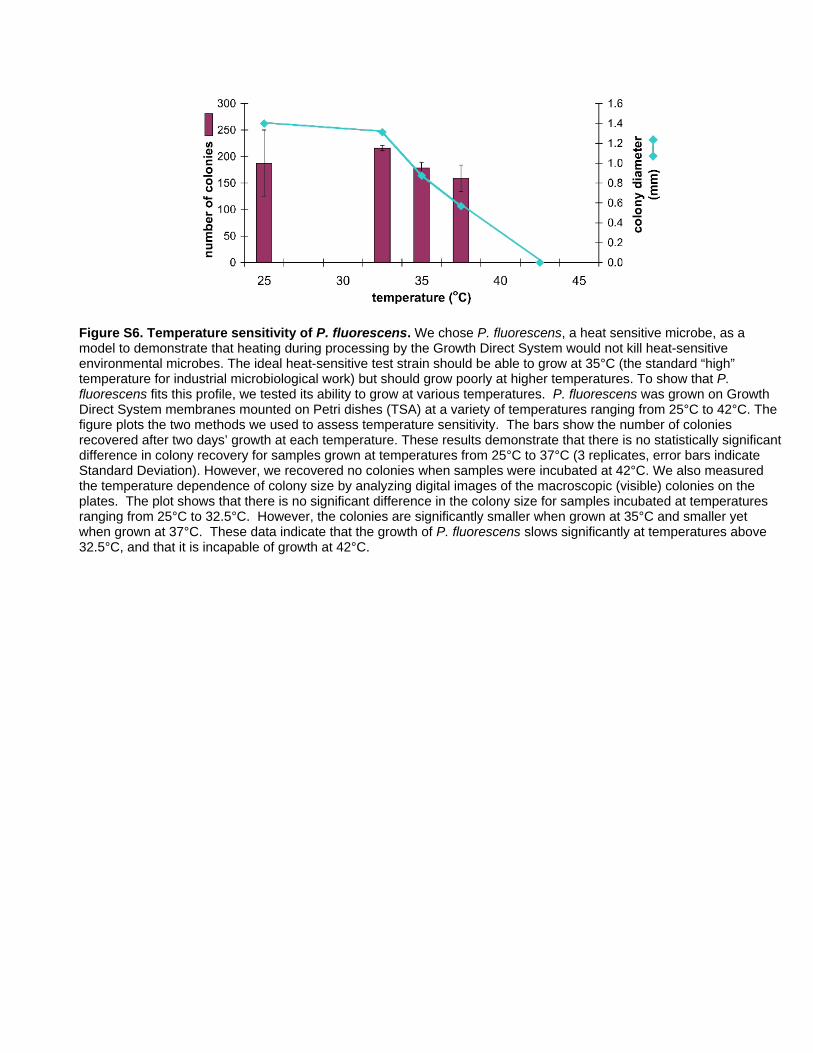
Figure S6. Temperature sensitivity of P. fluorescens. We chose P. fluorescens, a heat sensitive microbe, as a model to demonstrate that heating during processing by the Growth Direct System would not kill heat-sensitive environmental microbes. The ideal heat-sensitive test strain should be able to grow at 35°C (the standard “high” temperature for industrial microbiological work) but should grow poorly at higher temperatures. To show that P. fluorescens fits this profile, we tested its ability to grow at various temperatures. P. fluorescens was grown on Growth Direct System membranes mounted on Petri dishes (TSA) at a variety of temperatures ranging from 25°C to 42°C. The figure plots the two methods we used to assess temperature sensitivity. The bars show the number of colonies recovered after two days’ growth at each temperature. These results demonstrate that there is no statistically significant difference in colony recovery for samples grown at temperatures from 25°C to 37°C (3 replicates, error bars indicate Standard Deviation). However, we recovered no colonies when samples were incubated at 42°C. We also measured the temperature dependence of colony size by analyzing digital images of the macroscopic (visible) colonies on the plates. The plot shows that there is no significant difference in the colony size for samples incubated at temperatures ranging from 25°C to 32.5°C. However, the colonies are significantly smaller when grown at 35°C and smaller yet when grown at 37°C. These data indicate that the growth of P. fluorescens slows significantly at temperatures above 32.5°C, and that it is incapable of growth at 42°C.
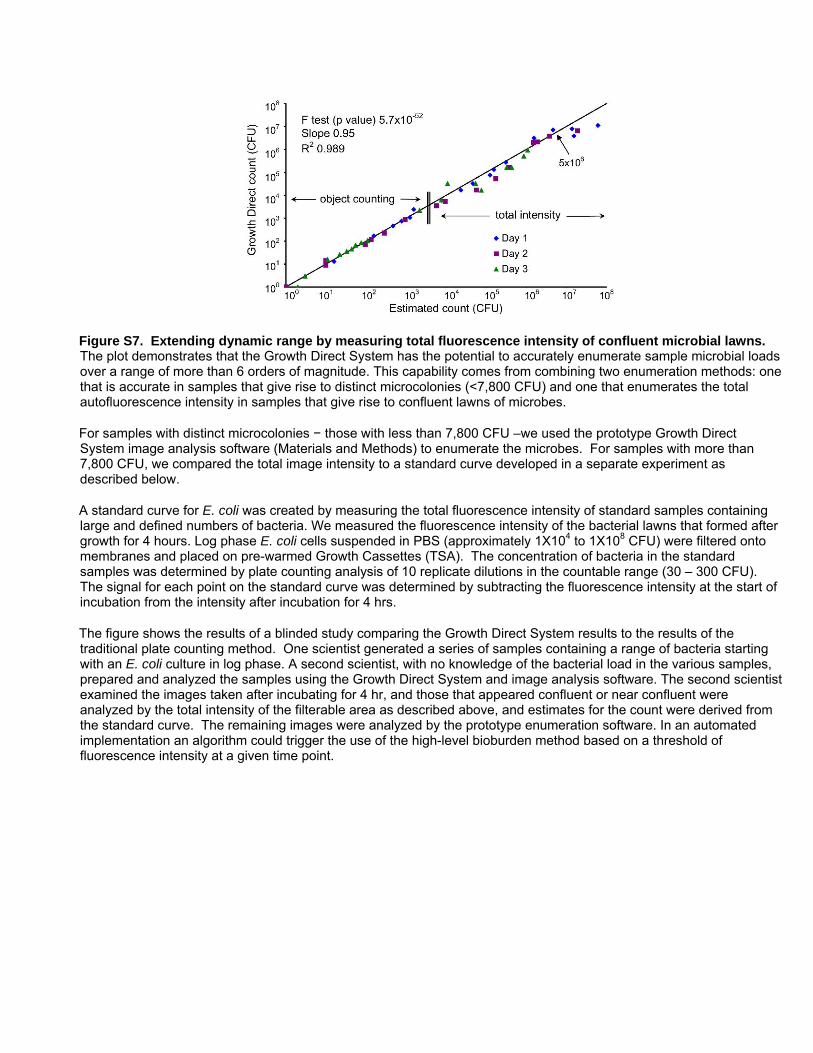
Figure S7. Extending dynamic range by measuring total fluorescence intensity of confluent microbial lawns. The plot demonstrates that the Growth Direct System has the potential to accurately enumerate sample microbial loads over a range of more than 6 orders of magnitude. This capability comes from combining two enumeration methods: one that is accurate in samples that give rise to distinct microcolonies (<7,800 CFU) and one that enumerates the total autofluorescence intensity in samples that give rise to confluent lawns of microbes.
For samples with distinct microcolonies − those with less than 7,800 CFU –we used the prototype Growth Direct System image analysis software (Materials and Methods) to enumerate the microbes. For samples with more than 7,800 CFU, we compared the total image intensity to a standard curve developed in a separate experiment as described below.
A standard curve for E. coli was created by measuring the total fluorescence intensity of standard samples containing large and defined numbers of bacteria. We measured the fluorescence intensity of the bacterial lawns that formed after growth for 4 hours. Log phase E. coli cells suspended in PBS (approximately 1X10⁴ to 1X10⁸ CFU) were filtered onto membranes and placed on pre-warmed Growth Cassettes (TSA). The concentration of bacteria in the standard samples was determined by plate counting analysis of 10 replicate dilutions in the countable range (30 – 300 CFU). The signal for each point on the standard curve was determined by subtracting the fluorescence intensity at the start of incubation from the intensity after incubation for 4 hrs.
The figure shows the results of a blinded study comparing the Growth Direct System results to the results of the traditional plate counting method. One scientist generated a series of samples containing a range of bacteria starting with an E. coli culture in log phase. A second scientist, with no knowledge of the bacterial load in the various samples, prepared and analyzed the samples using the Growth Direct System and image analysis software. The second scientist examined the images taken after incubating for 4 hr, and those that appeared confluent or near confluent were analyzed by the total intensity of the filterable area as described above, and estimates for the count were derived from the standard curve. The remaining images were analyzed by the prototype enumeration software. In an automated implementation an algorithm could trigger the use of the high-level bioburden method based on a threshold of fluorescence intensity at a given time point.
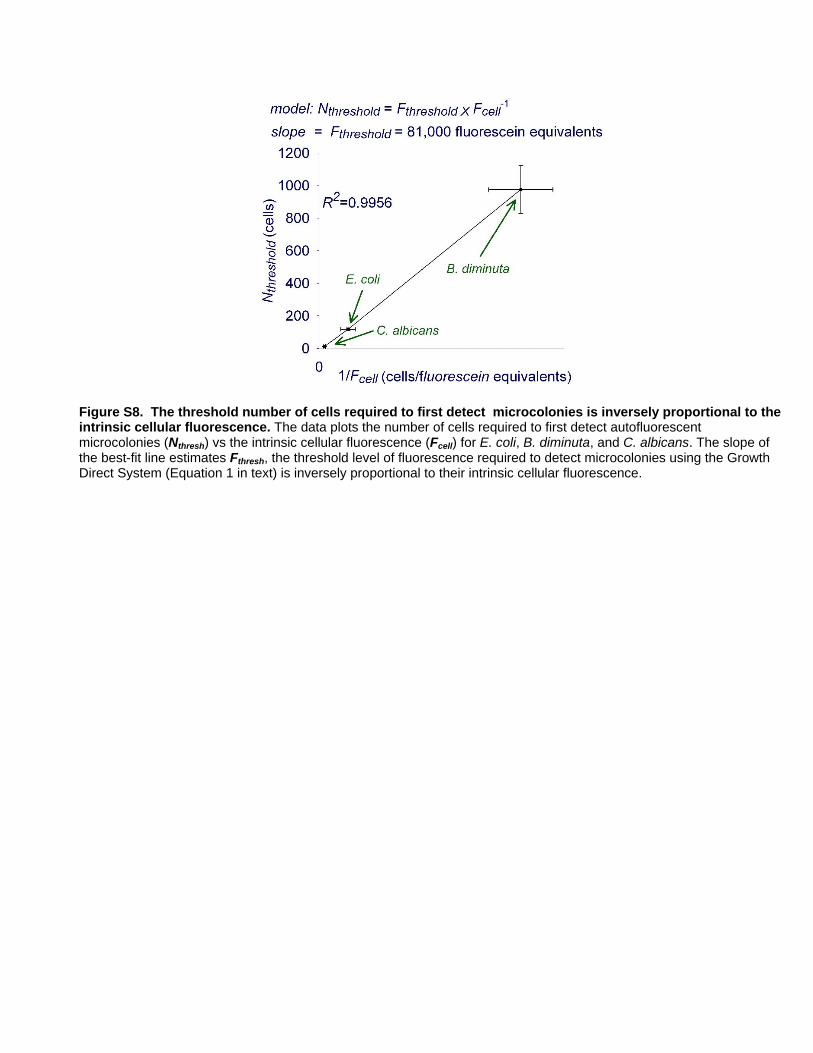
Figure S8. The threshold number of cells required to first detect microcolonies is inversely proportional to the intrinsic cellular fluorescence. The data plots the number of cells required to first detect autofluorescent microcolonies (Nthresh) vs the intrinsic cellular fluorescence (Fcell) for E. coli, B. diminuta, and C. albicans. The slope of the best-fit line estimates Fthresh, the threshold level of fluorescence required to detect microcolonies using the Growth Direct System (Equation 1 in text) is inversely proportional to their intrinsic cellular fluorescence.
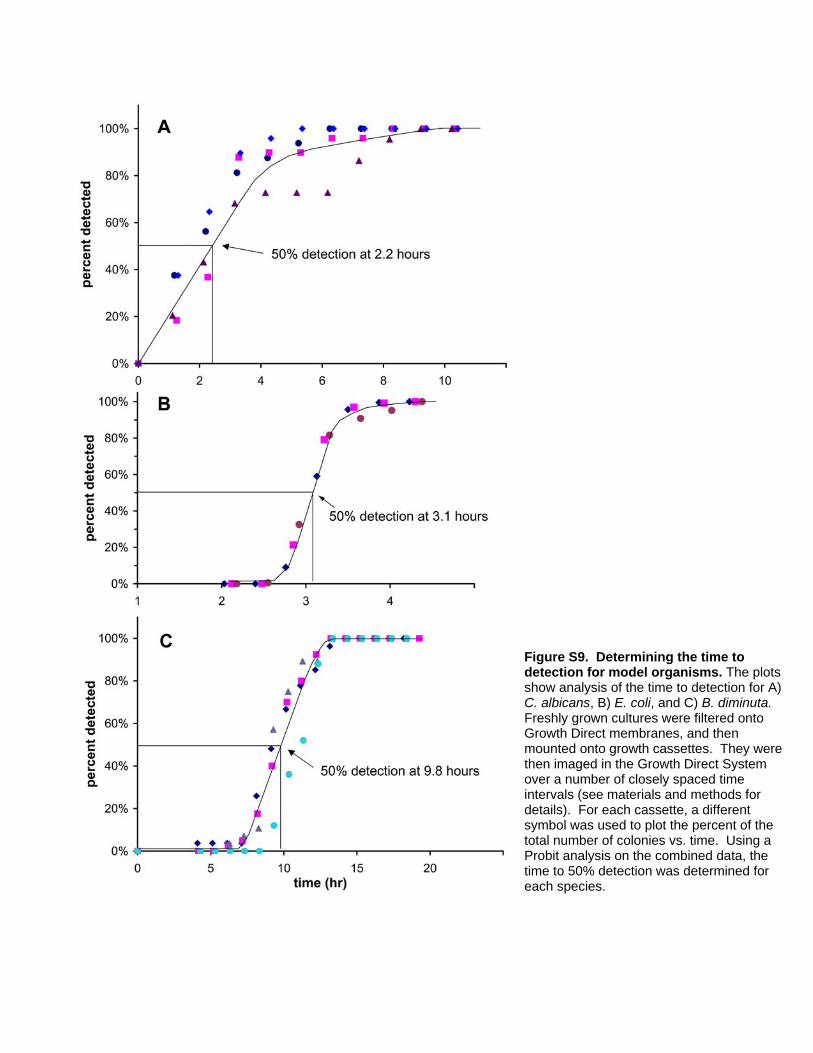
Figure S9. Determining the time to detection for model organisms. The plots show analysis of the time to detection for A) C. albicans, B) E. coli, and C) B. diminuta. Freshly grown cultures were filtered onto Growth Direct membranes, and then mounted onto growth cassettes. They were then imaged in the Growth Direct System over a number of closely spaced time intervals (see materials and methods for details). For each cassette, a different symbol was used to plot the percent of the total number of colonies vs. time. Using a Probit analysis on the combined data, the time to 50% detection was determined for each species.
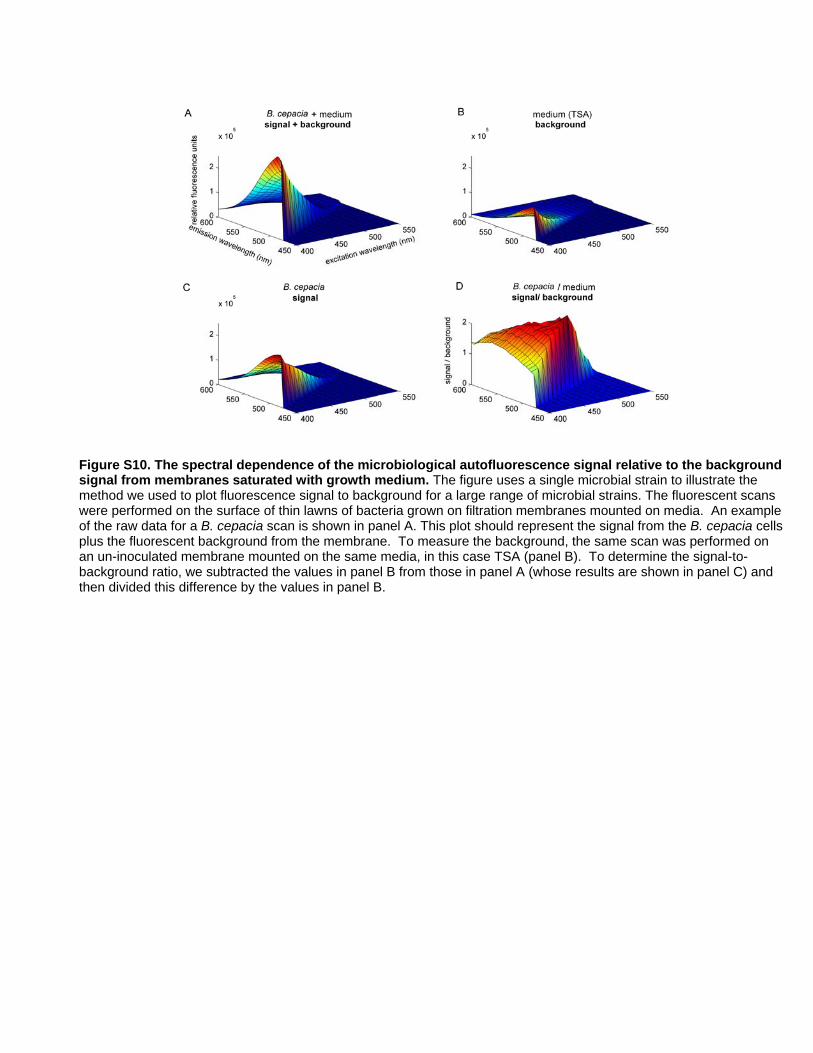
Figure S10. The spectral dependence of the microbiological autofluorescence signal relative to the background signal from membranes saturated with growth medium. The figure uses a single microbial strain to illustrate the method we used to plot fluorescence signal to background for a large range of microbial strains. The fluorescent scans were performed on the surface of thin lawns of bacteria grown on filtration membranes mounted on media. An example of the raw data for a B. cepacia scan is shown in panel A. This plot should represent the signal from the B. cepacia cells plus the fluorescent background from the membrane. To measure the background, the same scan was performed on an un-inoculated membrane mounted on the same media, in this case TSA (panel B). To determine the signal-to-background ratio, we subtracted the values in panel B from those in panel A (whose results are shown in panel C) and then divided this difference by the values in panel B.
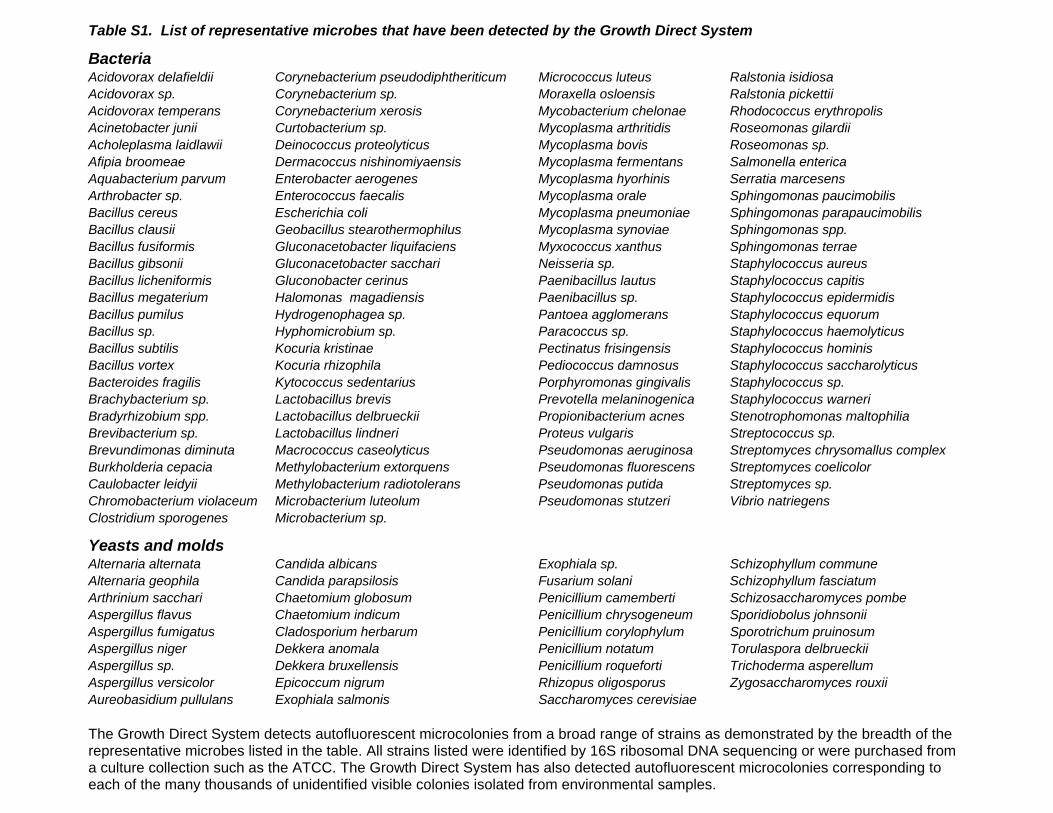
Table S1. List of representative microbes that have been detected by the Growth Direct System
Bacteria Acidovorax delafieldii Corynebacterium pseudodiphtheriticum Micrococcus luteus Ralstonia isidiosa Acidovorax sp. Corynebacterium sp. Moraxella osloensis Ralstonia pickettii Acidovorax temperans Corynebacterium xerosis Mycobacterium chelonae Rhodococcus erythropolis Acinetobacter junii Curtobacterium sp. Mycoplasma arthritidis Roseomonas gilardii Acholeplasma laidlawii Deinococcus proteolyticus Mycoplasma bovis Roseomonas sp. Afipia broomeae Dermacoccus nishinomiyaensis Mycoplasma fermentans Salmonella enterica Aquabacterium parvum Enterobacter aerogenes Mycoplasma hyorhinis Serratia marcesens Arthrobacter sp. Enterococcus faecalis Mycoplasma orale Sphingomonas paucimobilis Bacillus cereus Escherichia coli Mycoplasma pneumoniae Sphingomonas parapaucimobilis Bacillus clausii Geobacillus stearothermophilus Mycoplasma synoviae Sphingomonas spp. Bacillus fusiformis Gluconacetobacter liquifaciens Myxococcus xanthus Sphingomonas terrae Bacillus gibsonii Gluconacetobacter sacchari Neisseria sp. Staphylococcus aureus Bacillus licheniformis Gluconobacter cerinus Paenibacillus lautus Staphylococcus capitis Bacillus megaterium Halomonas magadiensis Paenibacillus sp. Staphylococcus epidermidis Bacillus pumilus Hydrogenophagea sp. Pantoea agglomerans Staphylococcus equorum Bacillus sp. Hyphomicrobium sp. Paracoccus sp. Staphylococcus haemolyticus Bacillus subtilis Kocuria kristinae Pectinatus frisingensis Staphylococcus hominis Bacillus vortex Kocuria rhizophila Pediococcus damnosus Staphylococcus saccharolyticus Bacteroides fragilis Kytococcus sedentarius Porphyromonas gingivalis Staphylococcus sp. Brachybacterium sp. Lactobacillus brevis Prevotella melaninogenica Staphylococcus warneri Bradyrhizobium spp. Lactobacillus delbrueckii Propionibacterium acnes Stenotrophomonas maltophilia Brevibacterium sp. Lactobacillus lindneri Proteus vulgaris Streptococcus sp. Brevundimonas diminuta Macrococcus caseolyticus Pseudomonas aeruginosa Streptomyces chrysomallus complex Burkholderia cepacia Methylobacterium extorquens Pseudomonas fluorescens Streptomyces coelicolor Caulobacter leidyii Methylobacterium radiotolerans Pseudomonas putida Streptomyces sp. Chromobacterium violaceum Microbacterium luteolum Pseudomonas stutzeri Vibrio natriegens Clostridium sporogenes Microbacterium sp.
Yeasts and molds Alternaria alternata Candida albicans Exophiala sp. Schizophyllum commune Alternaria geophila Candida parapsilosis Fusarium solani Schizophyllum fasciatum Arthrinium sacchari Chaetomium globosum Penicillium camemberti Schizosaccharomyces pombe Aspergillus flavus Chaetomium indicum Penicillium chrysogeneum Sporidiobolus johnsonii Aspergillus fumigatus Cladosporium herbarum Penicillium corylophylum Sporotrichum pruinosum Aspergillus niger Dekkera anomala Penicillium notatum Torulaspora delbrueckii Aspergillus sp. Dekkera bruxellensis Penicillium roqueforti Trichoderma asperellum Aspergillus versicolor Epicoccum nigrum Rhizopus oligosporus Zygosaccharomyces rouxii Aureobasidium pullulans Exophiala salmonis Saccharomyces cerevisiae The Growth Direct System detects autofluorescent microcolonies from a broad range of strains as demonstrated by the breadth of the representative microbes listed in the table. All strains listed were identified by 16S ribosomal DNA sequencing or were purchased from a culture collection such as the ATCC. The Growth Direct System has also detected autofluorescent microcolonies corresponding to each of the many thousands of unidentified visible colonies isolated from environmental samples.
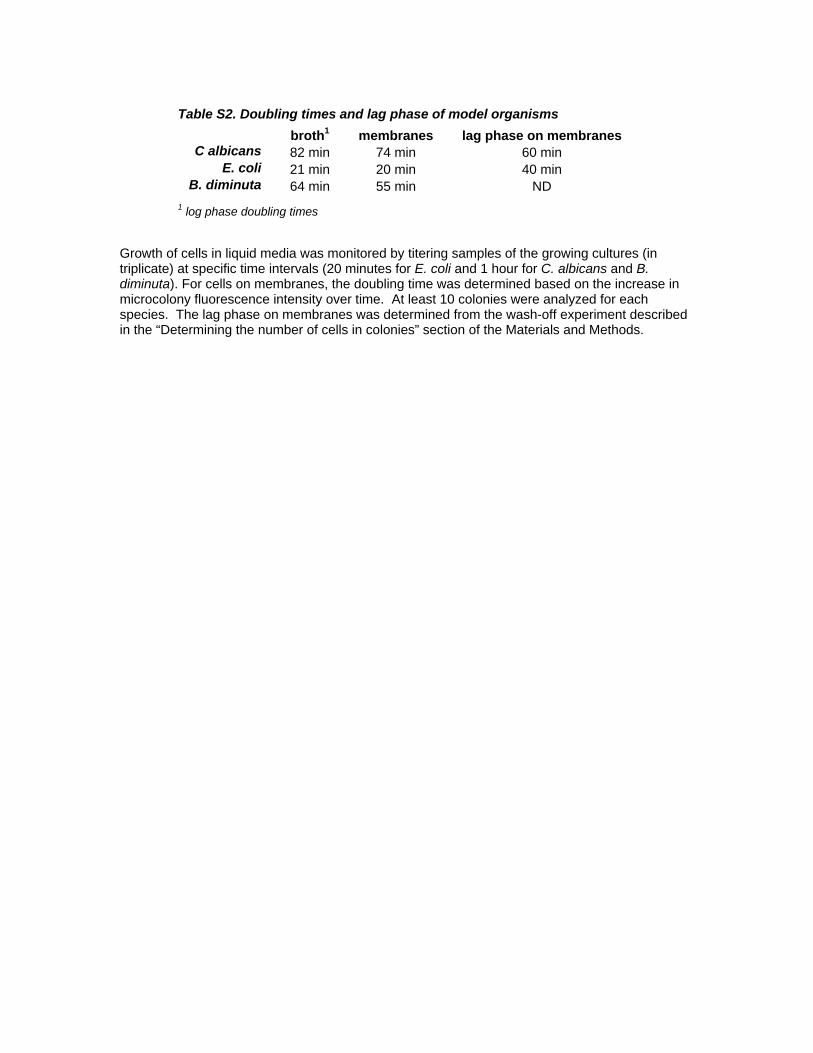
Table S2. Doubling times and lag phase of model organisms broth1 membranes lag phase on membranes
C albicans 82 min 74 min 60 min E. coli 21 min 20 min 40 min
B. diminuta 64 min 55 min ND 1 log phase doubling times
Growth of cells in liquid media was monitored by titering samples of the growing cultures (in triplicate) at specific time intervals (20 minutes for E. coli and 1 hour for C. albicans and B. diminuta). For cells on membranes, the doubling time was determined based on the increase in microcolony fluorescence intensity over time. At least 10 colonies were analyzed for each species. The lag phase on membranes was determined from the wash-off experiment described in the “Determining the number of cells in colonies” section of the Materials and Methods.
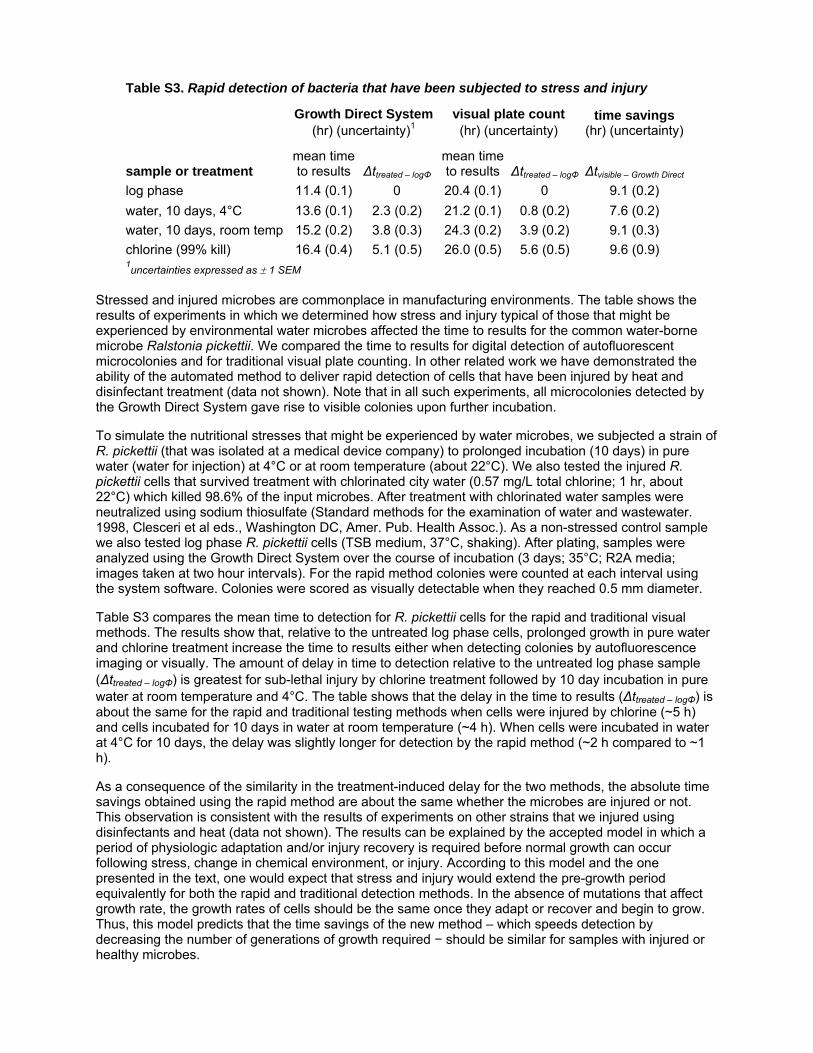
Table S3. Rapid detection of bacteria that have been subjected to stress and injury
Growth Direct System
(hr) (uncertainty)1 visual plate count (hr) (uncertainty)
time savings (hr) (uncertainty)
sample or treatment mean time to results Δttreated – logΦ
mean time to results Δttreated – logΦ Δtvisible – Growth Direct
log phase 11.4 (0.1) 0 20.4 (0.1) 0 9.1 (0.2) water, 10 days, 4°C 13.6 (0.1) 2.3 (0.2) 21.2 (0.1) 0.8 (0.2) 7.6 (0.2) water, 10 days, room temp 15.2 (0.2) 3.8 (0.3) 24.3 (0.2) 3.9 (0.2) 9.1 (0.3) chlorine (99% kill) 16.4 (0.4) 5.1 (0.5) 26.0 (0.5) 5.6 (0.5) 9.6 (0.9) 1uncertainties expressed as ± 1 SEM
Stressed and injured microbes are commonplace in manufacturing environments. The table shows the results of experiments in which we determined how stress and injury typical of those that might be experienced by environmental water microbes affected the time to results for the common water-borne microbe Ralstonia pickettii. We compared the time to results for digital detection of autofluorescent microcolonies and for traditional visual plate counting. In other related work we have demonstrated the ability of the automated method to deliver rapid detection of cells that have been injured by heat and disinfectant treatment (data not shown). Note that in all such experiments, all microcolonies detected by the Growth Direct System gave rise to visible colonies upon further incubation.
To simulate the nutritional stresses that might be experienced by water microbes, we subjected a strain of R. pickettii (that was isolated at a medical device company) to prolonged incubation (10 days) in pure water (water for injection) at 4°C or at room temperature (about 22°C). We also tested the injured R. pickettii cells that survived treatment with chlorinated city water (0.57 mg/L total chlorine; 1 hr, about 22°C) which killed 98.6% of the input microbes. After treatment with chlorinated water samples were neutralized using sodium thiosulfate (Standard methods for the examination of water and wastewater. 1998, Clesceri et al eds., Washington DC, Amer. Pub. Health Assoc.). As a non-stressed control sample we also tested log phase R. pickettii cells (TSB medium, 37°C, shaking). After plating, samples were analyzed using the Growth Direct System over the course of incubation (3 days; 35°C; R2A media; images taken at two hour intervals). For the rapid method colonies were counted at each interval using the system software. Colonies were scored as visually detectable when they reached 0.5 mm diameter.
Table S3 compares the mean time to detection for R. pickettii cells for the rapid and traditional visual methods. The results show that, relative to the untreated log phase cells, prolonged growth in pure water and chlorine treatment increase the time to results either when detecting colonies by autofluorescence imaging or visually. The amount of delay in time to detection relative to the untreated log phase sample (Δttreated – logΦ) is greatest for sub-lethal injury by chlorine treatment followed by 10 day incubation in pure water at room temperature and 4°C. The table shows that the delay in the time to results (Δttreated – logΦ) is about the same for the rapid and traditional testing methods when cells were injured by chlorine (~5 h) and cells incubated for 10 days in water at room temperature (~4 h). When cells were incubated in water at 4°C for 10 days, the delay was slightly longer for detection by the rapid method (~2 h compared to ~1 h).
As a consequence of the similarity in the treatment-induced delay for the two methods, the absolute time savings obtained using the rapid method are about the same whether the microbes are injured or not. This observation is consistent with the results of experiments on other strains that we injured using disinfectants and heat (data not shown). The results can be explained by the accepted model in which a period of physiologic adaptation and/or injury recovery is required before normal growth can occur following stress, change in chemical environment, or injury. According to this model and the one presented in the text, one would expect that stress and injury would extend the pre-growth period equivalently for both the rapid and traditional detection methods. In the absence of mutations that affect growth rate, the growth rates of cells should be the same once they adapt or recover and begin to grow. Thus, this model predicts that the time savings of the new method – which speeds detection by decreasing the number of generations of growth required − should be similar for samples with injured or healthy microbes.