An automated processing system for cloud-top...
9
An automated processing system for cloud-top height and amount from ATSR(2) stereo Muller, J.-P., Dundas, R., Bower, D. Department of Geomatic Engineering, University College London Gower Street, London WC1E 6BT, UK Email: [email protected] Web: www.ge.ucl.ac.uk/research/CLOUDMAP.html ABSTRACT: A pre-operational algorithm and associated IDL processing chain for fully automated retrieval of cloud-top height and amount from dual view ATSR(2) has been developed. This processing chain includes ingest of SADIST formatted data especially all orbital position and camera viewing angles, automated stereo matching and transformation into ground co-ordinates above the WGS84 ellipsoid. Five different stereo matchers are currently included for testing: M2 (mean of the normalised differences within a patch), M3 (median of the normalised differences within a patch), 2D Nested Maximum ( a peak-valley correlation algorithm) P-Gotcha (a Pyramidal version of an in-house Adaptive Least Squares Correlation routine using sheet- growing) and CDWT (a Complex Discrete Wavelet Transform). An assessment of these different stereo matchers is presented which indicates that M2 satisfies the requirement for high throughput (<1 minute/ATSR scene) and pixel-level accuracy with an acceptable blunder-rate (c.1-5%). Examples will be shown of the application of this processing scheme to a wide variety of different ATSR(2) images. The scheme has been applied to the retrieval of cloud amount through the use of a ground Digital Elevation Model and initial results indicate better cloud masking than existing schemes based on radiometry. A companion paper (Muller, Dundas, Vogt, Clothiaux, 1999) describes the quality assessment procedure in more detail. This work is supported by the EU under the Fourth Framework Programme CLOUDMAP Project (Contract No. ENV4 CT97- 0399) and by ESA under data grant AO3-422. Introduction One of the greatest current uncertainties in Global Climate Models is the role of clouds, particularly Cirrus and Marine StCu, in the Earth’s radiation balance to determine whether clouds will enhance or decrease the effects of global warming. This study mainly focuses on natural Cirrus clouds and artificial Cirrus clouds (condensation trails of air planes) given the fact that these kind of clouds play a crucial role in a (local) increase of the so-called ‘greenhouse’ according to the current state of knowledge. Existing cloud climatologies, such as ISCCP [Rossow and Schiffer, 1991] or the HIRS/TOVS CO 2 split window [Wylie and Menzel, 1991] do not provide the necessary accuracy either - to test the effects of clouds, particularly broken clouds, on GCM forecasts or
Transcript of An automated processing system for cloud-top...

An automated processing system for cloud-top heightand amount from ATSR(2) stereo
Muller, J.-P., Dundas, R., Bower, D.Department of Geomatic Engineering, University College London
Gower Street, London WC1E 6BT, UKEmail: [email protected] Web: www.ge.ucl.ac.uk/research/CLOUDMAP.html
ABSTRACT: A pre-operationalalgorithm and associated IDL processingchain for fully automated retrieval ofcloud-top height and amount from dualview ATSR(2) has been developed. Thisprocessing chain includes ingest ofSADIST formatted data especially allorbital position and camera viewingangles, automated stereo matching andtransformation into ground co-ordinatesabove the WGS84 ellipsoid. Fivedifferent stereo matchers are currentlyincluded for testing: M2 (mean of thenormalised differences within a patch),M3 (median of the normaliseddifferences within a patch), 2D NestedMaximum ( a peak-valley correlationalgorithm) P-Gotcha (a Pyramidalversion of an in-house Adaptive LeastSquares Correlation routine using sheet-growing) and CDWT (a ComplexDiscrete Wavelet Transform). Anassessment of these different stereomatchers is presented which indicatesthat M2 satisfies the requirement forhigh throughput (<1 minute/ATSRscene) and pixel-level accuracy with anacceptable blunder-rate (c.1-5%).Examples will be shown of theapplication of this processing scheme toa wide variety of different ATSR(2)images. The scheme has been applied tothe retrieval of cloud amount through theuse of a ground Digital Elevation Modeland initial results indicate better cloud
masking than existing schemes based onradiometry. A companion paper (Muller,Dundas, Vogt, Clothiaux, 1999)describes the quality assessmentprocedure in more detail. This work issupported by the EU under the FourthFramework Programme CLOUDMAPProject (Contract No. ENV4 CT97-0399) and by ESA under data grantAO3-422.
IntroductionOne of the greatest current uncertaintiesin Global Climate Models is the role ofclouds, particularly Cirrus and MarineStCu, in the Earth’s radiation balance todetermine whether clouds will enhanceor decrease the effects of globalwarming. This study mainly focuses onnatural Cirrus clouds and artificial Cirrusclouds (condensation trails of air planes)given the fact that these kind of cloudsplay a crucial role in a (local) increase ofthe so-called ‘greenhouse’ according tothe current state of knowledge.
Existing cloud climatologies, such asISCCP [Rossow and Schiffer, 1991] orthe HIRS/TOVS CO2 split window[Wylie and Menzel, 1991] do not providethe necessary accuracy either
- to test the effects of clouds,particularly broken clouds, onGCM forecasts or
- to assess the consequences of“global warming” on changingCi & MrStCu cloud amounts
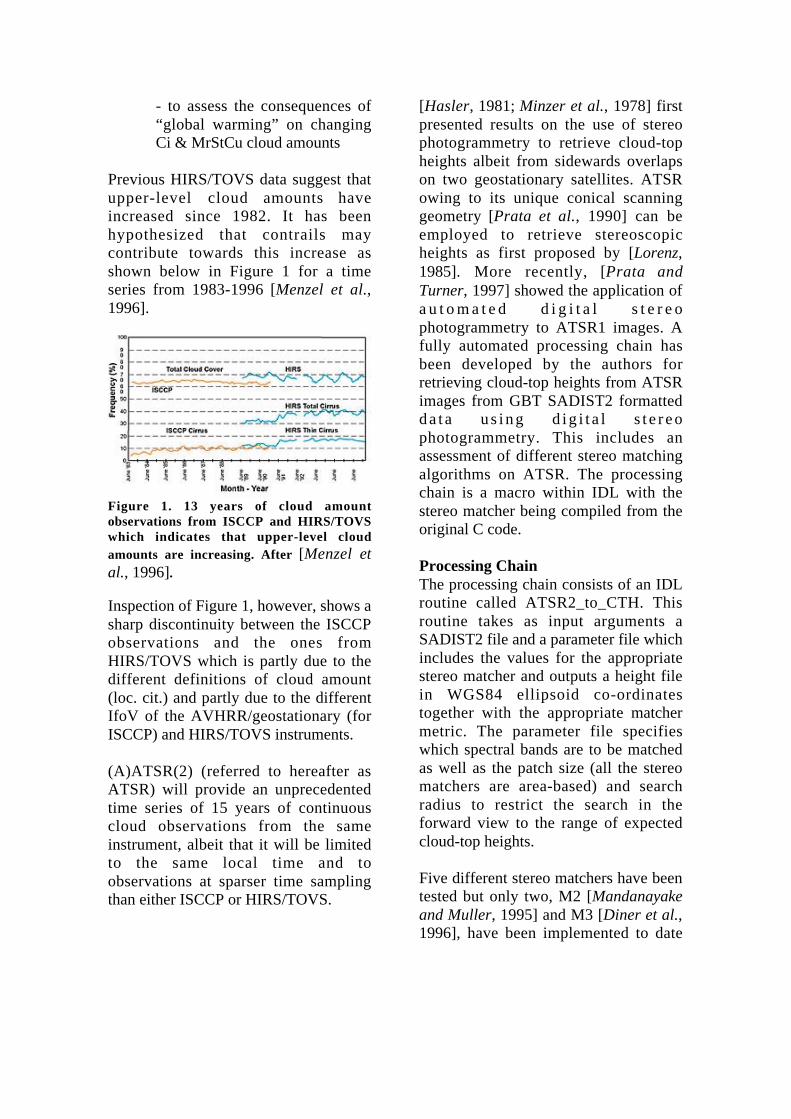
Previous HIRS/TOVS data suggest thatupper-level cloud amounts haveincreased since 1982. It has beenhypothesized that contrails maycontribute towards this increase asshown below in Figure 1 for a timeseries from 1983-1996 [Menzel et al.,1996].
Figure 1. 13 years of cloud amountobservations from ISCCP and HIRS/TOVSwhich indicates that upper-level cloudamounts are increasing. After [Menzel etal., 1996].
Inspection of Figure 1, however, shows asharp discontinuity between the ISCCPobservations and the ones fromHIRS/TOVS which is partly due to thedifferent definitions of cloud amount(loc. cit.) and partly due to the differentIfoV of the AVHRR/geostationary (forISCCP) and HIRS/TOVS instruments.
(A)ATSR(2) (referred to hereafter asATSR) will provide an unprecedentedtime series of 15 years of continuouscloud observations from the sameinstrument, albeit that it will be limitedto the same local time and toobservations at sparser time samplingthan either ISCCP or HIRS/TOVS.
[Hasler, 1981; Minzer et al., 1978] firstpresented results on the use of stereophotogrammetry to retrieve cloud-topheights albeit from sidewards overlapson two geostationary satellites. ATSRowing to its unique conical scanninggeometry [Prata et al., 1990] can beemployed to retrieve stereoscopicheights as first proposed by [Lorenz,1985]. More recently, [Prata andTurner, 1997] showed the application ofa u t o m a t e d d i g i t a l s t e r e ophotogrammetry to ATSR1 images. Afully automated processing chain hasbeen developed by the authors forretrieving cloud-top heights from ATSRimages from GBT SADIST2 formattedda ta us ing d ig i ta l s te reophotogrammetry. This includes anassessment of different stereo matchingalgorithms on ATSR. The processingchain is a macro within IDL with thestereo matcher being compiled from theoriginal C code.
Processing ChainThe processing chain consists of an IDLroutine called ATSR2_to_CTH. Thisroutine takes as input arguments aSADIST2 file and a parameter file whichincludes the values for the appropriatestereo matcher and outputs a height filein WGS84 ellipsoid co-ordinatestogether with the appropriate matchermetric. The parameter file specifieswhich spectral bands are to be matchedas well as the patch size (all the stereomatchers are area-based) and searchradius to restrict the search in theforward view to the range of expectedcloud-top heights.
Five different stereo matchers have beentested but only two, M2 [Mandanayakeand Muller, 1995] and M3 [Diner et al.,1996], have been implemented to date

within the processing chain. Workcontinues on implementing the otherthree: 2D Nested Maximum (loc. cit.), P-Gotcha [Day et al., 1992] and CDWT[Magarey, 1997].
M2 (multi-point matcher) is an area-based stereo matcher. It works bydesignating the imagery from onecamera as the reference image and theother as the comparison image. Aregion, the patch size, is chosen in thereference image and a set of comparisonpatches within a search window isestablished in the comparison image.The matching metric is then computedby taking all the values in each patchand subtracting the mean values withinthe patch from each pixel to yield anormalised brightness. Then the absolutedifference in the reference normalisedpatch minus the normalised values in thecomparison patch averaged over thenumber of points being matched is testedagainst a threshold. The M2 metric is
SM2= 1/Npts |(R(xi,yj) -<R>)-(C(xi,yj) -<C>) | |(Rmax -Rmin]*[Cmax –Cmin]) |
SIGMAm2(equation 1)
whereR(xi,yj) is the reference pixel values at (i,j)
C(xi,yj) is the corresponding value in thecomparison image
Rmax, Rmin are the maximum and minimumvalues within the reference image respectively
Cmax, Cmin are the maximum and minimumvalues within the comparison patch respectively
Npts is the number of points begin matched
<R> is the average value within thereference patch
<C> is the average value within thecomparison patch
i,j are the relative indices within the patchesfor summation and
SIGMAm2 = 1/Npts | [R((xi,yj)- <R>] | | [ Rmax - Rmin ] |
(equation 2)
The quantity SIGMAm2 is an estimate ifthe average uncertainty in the numeratorof equation 1. For a reference patch thex and y values of disparity are those forwhich SM2 is smaller than or equal tothreshold TM2. If SM2 > TM2 thedisparity is discarded. If multiplematches from M2 satisfies the thresholdcriterion, the best match for a patch isdefined as the one that minimises SM2.This is done by setting a secondarythreshold AM2 where AM2=f.SM2minwhere f > 1. If the best match is the onlyone for which SM2 < AM2 it is classedas a successful match.
M3 is similar to M2 except mediansrather than then means are used. SM3 ≤TM3 are regarded as a successful match.TM3 and TM2 maybe different.
The reader is referred to the referencesquoted for details of the other matchers.
For ideal stereoscopic pairs, the twoimages should be taken at the same time.The time difference between theacquisition of the forward and the nadiris swaths 120 seconds. Equation 3[Prata and Turner, 1997] is used forcalculating the heights, where height, His given by
H = YDIS/(tan(ANGLEf)-tan(ANGLEn))(equation 3)
whereYDIS is the disparityANGLEf is the forward zenith angleANGLEn is the nadir zenith angle

It has been assumed that all themovement in the y direction is due toheight. Also the increase in the size ofthe field of view from the forward viewis not taken into consideration. Thestereo matching schemes will fail if theareas to be matched are featureless ordevoid of spatial contrasts. The zenithangles are calculated from informationcontained in the GBT header.
The entire operation from ingestion ofraw image to the production of three-dimensional CTHs takes around 25minutes on a Silicon Graphicsworkstation of relatively lowspecification. Code optimisation hasbeen performed of the stereo matcherand it is the only compiled element asIDL is too slow at looping arrays. Theremainder of the chain is written in IDL.
Comparison of stereo matchersTests performed on the five stereomatchers indicate that M2 produces thebest results with regard to (1) speedtraded against (2) accuracy; (3)reliability (i.e. blunder rate). P-Gotchaproduces the highest accuracy but at theexpense of the slowest speed. CDWTproduces the worst results. Figure 2shows a comparison of four of thematchers using the height-temperaturerelationship as a surrogate for a qualitymeasure. Inspection of Figure 2 showsthat M2, M3 and P-Gotcha had areasonable relationship between CTHand brightness temperature for a scenecontaining thin high-level cirrus overlower level cloud. Although thisrelationship is not as “clean” as thoseshown by [Watts and Baran, 1997] itshould be noted that no attempt has beenmade to pre-screen the CTHs using anoptical depth threshold as performed bythe aforementioned authors. In a
separate paper presented here (Muller etal., 1999), a quantitative validation hasbeen performed using ground-basedradar+lidar measurements of CTH.
Figure 3 shows an early attempt tovalidate the performance of differentstereo matchers using a comparison ofnon-cloud heights against a globalterrain model. Clouds are first definedusing the supplied RAL cloud mask[Simpson et al., 1998]
For heights defined as “ground” by theRAL cloud mask difference statistics inelevations were performed. For Gotcha,the height differences had a mean of0.09±1.38km wheras for M2 heights themean was 0.22±1.81km. An alternativeapproach used the heights derived fromM2 to define a cloud-mask when theheights were ≥1km above GTOPO30.When this new cloud mask was used, themean difference for M2 reduced to0.14±1.03km which is much closer tothe theoretical value of ±0.75kmoriginally proposed by [Lorenz, 1985].These results also suggest that stereo-derived cloud masks may be much morereliable than equivalent radiometricones. This hypothesis has been tested by[Cawkwell et al., 1999] over theGreenland ice-sheet where significantlybetter results for cloud masks have beenobtained than using conventionalradiometric cloud masks.
Example applicationA very wide range of ATSR2 imageshave been processed using the schemedescribed above. Owing to the lack ofspace, only one further example will beshown here. Figure 4 shows an areacontaining a large number of contrailsover the Channel. Note that the matcher

Figure 2. Comparison of stereo matcher output for four of the stereo matchers tested. Upper panel –CTH fields. Middle panel : Height vs 11µm brightness temperature. Lowest panel: CTHs over landand sea separately.

Figure 3. Comparison of stereo matcher output for two of the matchers tested. Upper left – groundDEM from GTOPO30. Lower left : Stereo matched heights blended into GTOPO30. Note whiteareas are RAL cloud mask . Upper right: Histogram of heights showing the pixel quantisation of M2.Middle right panel: Gotcha heights for areas masked out by RAL cloud mask. vs GTOPO30 DEM.Lower right panel: M2 heights for areas masked out by RAL cloud mask. vs GTOPO30 DEM.

Figure 3. Results of M2 stereo matcher over the Channel. Upper right, Forward-Nadir 11µmtemperature difference. Lower left: 11µm nadir image. Lower right: M2 CTH fields. Middle Rightpanel: Height vs temperature plot for all heights including the ground.

picks up the upper level cloud layer wellas well as the semi-transparent hazelayer at the altitude of the contrails.Automated detection of contrails relieson the 11-12µm temperature difference[Lee, 1989; Meyer and Mannstein, 1998]and can be significantly improved whenaltitude is added to the discrimination.These initial results suggest that stereo-matched heights can greatly assist withthe detection of contrails. If informationon ice crystal size can be added through,for instance the approach described by[Baran et al., 1998] then ageing contrailsmay be able to be detected as their icecrystal size distribution is likely to besmaller than naturally occurring cirrus[Sassen, 1997].
Conclusions and Further workThe IDL processing system is beingtested by other members of the EU-CLOUDMAP project including forfuture operational application innowcasting and climate modelling byKNMI. A new version is currently alsobeing developed for application to MISRdata [Diner et al., 1998]. It is plannedthat colleagues at the DLR Institüt fürPhysik der Atmosphäre will add theprocessing chain to their contrailstatistics system to allow a betterdetermination of CTHs over a five yeartime period. [Meyer and Mannstein,1998]
AcknowledgementsThe authors would like to thank A.Mandanayake for the originalimplementation of the M2 algorithm, R.Davies (University of Arizona) for M3,C. Moroney (University of Arizona) forthe 2D-NM, T. Day for Gotcha, J.Holdback for P-Gotcha and G.Castellano (KCL) and J. Magarey(CSSIP) for CDWT.
ReferencesBaran, A. J., P. D. Watts, and P. N. Francis,Retrieval of cirrus microphysical and bulkproperties using radiance data from the ASlongTrack Scanning Radiometer (ATSR-2), in 9thAMS Conference on Satellite Meteorology andOceanography, vol. 1, pp. 218-221, AmericanMeteorological Society, Paris, France, 25-29May 1998, 1998.
Cawkwell, F. G. L., J.-P. A. L. Muller, R. M.Dundas, and J. B. Bamber, Cloud detection overhigh latitude snow and ice by thesholding stereophotogrammetric measurements of elevationsfrom ATSR with a topographic ground model.,Int. J. Rem. Sens., in preparation, 1999.
Day, T., A. C. Cook, and J.-P. Muller,Automated Digital Topographic MappingTechniques for Mars, in International Archivesof Photogrammetry and Remote Sensing, vol.29(B4), edited by L. W. Fritz and J. R. Lucas,pp. 801-808, American Society ofPhotogrammetry & Remote Sensing,Washington D.C., 1992.
Diner, D. J., J. C. Beckert, T. H. Reilly, T. P.Ackerman, C. J. Bruegge, J. E. Conel, R. Davies,S. A. W. Gerstl, H. R. \Gordon, R. A. Kahn, J.V. Martonchik, J.-P. Muller, R. Myneni, B.Pinty, P. J. Sellers, and M. M. Verstraete, Multi-angle Imaging SpectroRadiometer (MISR):instrument description and experimentoverview., IEEE Trans. Geosci. Rem. Sens.,36(4), 1072-1087, 1998.
Diner, D. J., R. Davies, L. Di Girolamo, C.Moroney, J.-P. Muller, S. R. Paradise, D.Wenkert, and J. Zong, MISR Level 2 Clouddetection and classification AlgorithmTheoretical Basis., pp. 92pp, Jet PropulsionLaboratory, Pasadena, 1996.
Hasler, A. F., Stereographic observations fromsatellites: An important new tool for theatmospheric sciences., Bull. Amer. Meteor. Soc.,62, 194-212, 1981.
Lee, T. F., Jet contrail indentification using theAVHRR Infrared split window., J. Appl.Meteor., 28, 993-995, 1989.

Lorenz, D., On the feasibility of cloudstereoscopy and wind determination with theAlong-Track Scanning Radiometer, Int. J. Rem.Sens., 6(8), 1445-1461, 1985.
Magarey, J. F. A., Motion estimation usingcomplex wavelets., in Engineering, University ofCambridge, Cambridge, 1997.
Mandanayake, A., and J.-P. Muller, Automatedstereo cloud-top retrieval using ATSR andATSR2: An assessment of wind-field effects., inProceedings of the 21st Annual Conference ofthe Remote Sensing Society, RSS'95, pp. 891-892, Nottingham: Remote Sensing Society, 11-14 September 1995, Southampton, 1995.
Menzel, W. P., D. P. Wylie, and K. I. Strabala,Seven years of Global Cirrus cloud statisticsusing HIRS., in Int. Radiation Symposium, pp.8pp, IAMAP, Fairbanks, AL, 20-24 August1996, 1996.
Meyer, R., and H. Mannstein, Contrail coverageover Western Europe derived from 2 years ofNOAA-AVHRR data., in 9th AMS Conferenceon Satellite Meteorology and Oceanography,vol. 1, pp. 266-269, American MeteorologicalSociety, Paris, France, 25-29 May 1998, 1998.
Minzer, R. A., W. E. Shenk, R. D. Teagle, and J.Steranka, Stereographic cloud heights fromimagery of SMS/GOES satellites, Geophys. Res.Lett., 5(1), 21-24, 1978.
Prata, A. J., and P. J. Turner, Cloud-top heightdetermination using ATSR data, Rem. Sens.Env., 59(1), 1-13, 1997.
Prata, A. J. F., R. P. Cechet, I. J. Barton, and D.T. Llewellyn-Jones, The Along-Track ScanningRadiometer (ATSR) for ERS-1 : Scan Geometryand Data Simulation, IEEE Trans. Geosci. &Rem. Sens., 28(1), 3-13, 1990.
Rossow, W. B., and R. A. Schiffer, ISCCP clouddata products., Bull. Amer. Meteor. Soc., 72, 2-20, 1991.
Sassen, K., Contrail-Cirrus and their potential forregional climate change., Bull. Am. Met. Soc.,78(9), 1885-1903, 1997.
Simpson, J. J., A. Schmidt, and A. Harris,Improved cloud detection in Along TrackScanning Radiometer (ATSR) data over the
ocean, Remote Sensing of Environment, 65(1), 1-24, 1998.
Watts, P. D., and A. J. Baran, A survey oftropical cirrus particle size and shape usingATSR-2 visible/Near-IR data., in ERS DataUsers Conference, vol. 1, pp. 6pp, ESA,Florence, March 1997, 1997.
Wylie, D., and W. P. Menzel, A Cirrus cloudclimatology from NOAA/HIRS, Palaeography,Palaeoclaimtology, Palaeoecology (Global andPlanetary Change Section), 90, 49-53, 1991.