An Automated Mechanism for Early ... - Journal Repository · Alharthi and Emamian; BJAST, 12(1):...
15
_____________________________________________________________________________________________________ *Corresponding author: E-mail: [email protected]; British Journal of Applied Science & Technology 12(1): 1-15, 2016, Article no.BJAST.20702 ISSN: 2231-0843, NLM ID: 101664541 SCIENCEDOMAIN international www.sciencedomain.org An Automated Mechanism for Early Screening and Diagnosis of Diabetic Retinopathy in Human Retinal Images Abdullah Saeed A. Alharthi 1* and Vahid Emamian 1 1 Department of Electrical Engineering, St Mary’s University, 1 Camino Santa Maria, San Antonio, Texas 78023, USA. Authors’ contributions This work was carried out in collaboration between both authors. Author ASAA designed the study, performed the statistical analysis, wrote the protocol and wrote the first draft of the manuscript and managed literature searches. Authors ASAA and VE managed the analyses of the study and literature searches. Both authors read and approved the final manuscript. Article Information DOI: 10.9734/BJAST/2016/20702 Editor(s): (1) Samir Kumar Bandyopadhyay, Department of Computer Science and Engineering, University of Calcutta, India. Reviewers: (1) Neelapala Anil kumar, Alliance University, India. (2) Asaad Ahmed Ghanem, Mansoura University, Egypt. Complete Peer review History: http://sciencedomain.org/review-history/11462 Received 5 th August 2015 Accepted 4 th September 2015 Published 19 th September 2015 ABSTRACT Diabetic retinopathy is a disease that is a primary cause of blindness among diabetes patients. A regular screening of patients with diabetes is important to enable early intervention. The focus of this paper is on designing a robust and computationally efficient automated system to assist in the early screening and diagnosis of diabetic retinopathy for early treatment. Digital analysis and mathematical morphology operations are implemented appropriately to detect and locate different features and lesions in fundus retinal images. One of our goals here is to detect bright lesions and dark retinal feature. Bright lesions consist of exudates and optic disc, dark retinal features consist of hemorrhages, blood vessels, and microaneurysms in retinal images of the human retina. The system algorithm was extensively evaluated on a database of 89 images with the corresponding experts (ophthalmologists) manually highlighted ground truth images. An image by image visual evaluation yields 84% success rate for exudates detection with a sensitivity of 86% and specificity of 80%. For hemorrhages detection the success rate is 81% with a sensitivity of 83% and specificity Method Article
Transcript of An Automated Mechanism for Early ... - Journal Repository · Alharthi and Emamian; BJAST, 12(1):...
_____________________________________________________________________________________________________ *Corresponding author: E-mail: [email protected];
British Journal of Applied Science & Technology 12(1): 1-15, 2016, Article no.BJAST.20702
ISSN: 2231-0843, NLM ID: 101664541
SCIENCEDOMAIN international www.sciencedomain.org
An Automated Mechanism for Early Screening and Diagnosis of Diabetic Retinopathy in
Human Retinal Images
Abdullah Saeed A. Alharthi 1* and Vahid Emamian 1
1Department of Electrical Engineering, St Mary’s University, 1 Camino Santa Maria, San Antonio, Texas 78023, USA.
Authors’ contributions
This work was carried out in collaboration between both authors. Author ASAA designed the study, performed the statistical analysis, wrote the protocol and wrote the first draft of the manuscript and
managed literature searches. Authors ASAA and VE managed the analyses of the study and literature searches. Both authors read and approved the final manuscript.
Article Information
DOI: 10.9734/BJAST/2016/20702
Editor(s): (1) Samir Kumar Bandyopadhyay, Department of Computer Science and Engineering, University of Calcutta,
India. Reviewers:
(1) Neelapala Anil kumar, Alliance University, India. (2) Asaad Ahmed Ghanem, Mansoura University, Egypt.
Complete Peer review History: http://sciencedomain.org/review-history/11462
Received 5 th August 2015 Accepted 4 th September 2015
Published 19 th September 2015
ABSTRACT
Diabetic retinopathy is a disease that is a primary cause of blindness among diabetes patients. A regular screening of patients with diabetes is important to enable early intervention. The focus of this paper is on designing a robust and computationally efficient automated system to assist in the early screening and diagnosis of diabetic retinopathy for early treatment. Digital analysis and mathematical morphology operations are implemented appropriately to detect and locate different features and lesions in fundus retinal images. One of our goals here is to detect bright lesions and dark retinal feature. Bright lesions consist of exudates and optic disc, dark retinal features consist of hemorrhages, blood vessels, and microaneurysms in retinal images of the human retina. The system algorithm was extensively evaluated on a database of 89 images with the corresponding experts (ophthalmologists) manually highlighted ground truth images. An image by image visual evaluation yields 84% success rate for exudates detection with a sensitivity of 86% and specificity of 80%. For hemorrhages detection the success rate is 81% with a sensitivity of 83% and specificity
Method Article

Alharthi and Emamian; BJAST, 12(1): 1-15, 2016; Article no.BJAST.20702
2
of 71%. The success rate for microaneurysms detection is 89.1% with a sensitivity of 90% and specificity of 20%.
Keywords: Diabetic retinopathy; graphical user interfaces model; Image processing; mathematical
morphology. 1. INTRODUCTION Diabetes mellitus is a global disease with significant morbidity. Diabetic Retinopathy (DR) is the specific micro vascular complication of diabetes and affects 1 in 3 persons with diabetes mellitus. DR remains a leading cause of blindness in adult populations. DR advanced stage patients are suffering from poor quality of life and suffering physical, socially and emotional, and they intend to require more healthcare resources. 80 percent of patients who have diabetes for decade or more are affected with DR. Medical research states that at least 90% of these patients could be treated if DR detected in early stage. DR evolves with time, and it is linked to high levels of blood pressure, blood lipids, or blood sugar. If someone has diabetes mellitus with poor control, then they are in high risk of developing DR [1-2]. DR is a complication of diabetes mellitus in the human retinal, the innermost light-sensitive membrane covering the inside of the eye. It is a result of damaged vessels in the retina. In DR, blood vessels might leak fluid and swells, which lead to abnormal new blood vessels growing on the retinal surface. Micro-aneurysms, hemorrhages, hard exudates and soft exudates are early changes whereas the new blood vessels with vitreous hemorrhages are late
stages of the DR and need emergency treatment to prevent blindness for diabetic patients [3]. Fig. (1) shows retinal fundus images, an abnormal retina on the left and normal retina on the right. In most developed countries, due to insufficient number of ophthalmologists, there is not enough support the diabetic population. A Computer aided diagnostic system can assist the physicians in detecting DR. For instance, the Aravind Eye Hospital in South India is currently leading a massive initiative to detect DR in early stage by scanning every patient for DR. The hospital sends physicians daily to rural areas to take retinal images of the patients and send the images to the hospital to detect DR. This task is labor intensive and there are few ophthalmologists to inspect approximately 2 million retinal images per year. Over 95% of the diabetes patients do not have DR symptoms; therefore, it is indeed, time consuming and considered wasteful since time spent screening healthy patients could be spent helping patients already diagnosed with DR. In addition, in a country like India the number of ophthalmologists is insufficient to support the growing diabetic population. South Indian rural regions do not have local ophthalmologists and rural populations do not typically travel to a hospital for DR screening [4].
Fig. 1. Database DIARETDB1 pictures of DR retina (l eft) non-DR retina (right)

Alharthi and Emamian; BJAST, 12(1): 1-15, 2016; Article no.BJAST.20702
3
This work focuses on automatic feature extraction of areas with DR in retinal fundus images. Automation is intended to eliminate the inter-operator variability in extracting features and removing subjectivity in the decision. DR can be comparatively well detected by extracting features from fundus images. Features extraction and analysis using morphological operations forms the basis of this work. Also, a number of images with DR marked by medical experts are used to train and test this system. In this project, a Graphical User Interfaces model (GUI) was implemented in MATLAB to automatically diagnose retinal images and detect DR areas in fundus images using digital image analysis methods [5]. Mathematical morphology operations were applied on retinal images to detect blood vessels and optic discs, exudates, microaneurysms and hemorrhages. Functions were implemented in GUI model to detect these features. Blood vessels network is extracted by using a morphology dilation and erosion operations [6]. Microaneurysms are detected using extended minimum transforms and morphology filling to exploit their local dark patch property [7]. Hemorrhages are detected using morphology closing and filling to find their reddish lesions [7]. Exudates detected using morphology dilation, erosion, as well as filling operations to detect their bright patches in rental images. The optic disc is detected using Hue transformers and morphology dilation [8]. 2. PREVIOUS WORKS Different approaches have been used to solve this problem for early detection of DR; however, these approaches were limited by the data and the methods used to solve this problem. Most of the approaches are splitting the problem into two ways; first detect and remove blood vessels and optic discs. Second, localize of the exudates and hemorrhages. The challenge is distinguishing the blood vessels from the hemorrhages and the optic disc from the exudates due to the similarity in the color. In this work, the simplicity of the algorithm and screening all DR symptoms is taken in consideration while implementing the system algorithm. An extensive review of the previous works resulting that authors either they diagnosing one of DR symptoms or proposed complicated methods. The proposed methods in this work is targeting rural areas to detect the disease rapidly with low computing time, and it
doesn't require high performance computer such as the ones in low income countries. The mathematical morphology operations perform simple operations on an image regions and the use of subtraction of images is resulting accurate detection with low computing time and power. The primary work done was to attempt locating the optic disc through simple intensity variations in image patches and find the fovea through matched filters. In [9] authors used the standard deviation of Gabor filters to trace and patch together the blood vessels. In [10], an area threshold is used to locate the optic disc; the contours are detected by Hough transform. The best fitting circle is determined by calculating the gradient of the image. This approach is considered wasteful because the shape is sometimes far from being a circle. In [11], authors used matched-filter responses, confidence measures and vessel boundary measures to obtain blood vessels. However, this work was not extended to detect DR in images. Sinthaniyothin used maximum variance to acquire the center of optic disc and a region growing segmentation to acquire the exudates. In [12], multistate amplitude-modulation frequency modulation (AM-FM) methods for discriminating between normal and pathological retinal images have been proposed to detect DR. The cumulative distribution functions of the instantaneous amplitude, the instantaneous frequency magnitude, and the relative instantaneous frequency angle from multiple scales are used as texture feature vectors. In [13], authors track the optic disc through a pyramidal decomposition and obtain disc localization from a template-based matching that uses the Hausdorff distance measure on the binary edge image; however, this method will fail if exudates have the same brightness and size of the optic disc. 3. MATERIALS AND METHODS 3.1 Image Database The implemented algorithms in this paper were performed in MATLAB. The accuracy of the implemented algorithms were trained and tested in the public database of fundus images DIARETDB1 [14]. This database has a variety of lesions that characterize the DR; it is also one of the most used databases in DR detection publications. A group of researchers published DIARETDB1; their motivation is reducing

Alharthi and Emamian; BJAST, 12(1): 1-15, 2016; Article no.BJAST.20702
4
healthcare costs by creating this product to assist medical industry. The database is available to evaluate the DR screening algorithms and proving the accuracy and reliability of each algorithm. The DIARETDB1 database has a total number of 89 fundus images (RGB) of size 1152x1500x3 pixels. 84 images have the signs of DR and 5 images of normal retinas. DR characterized by four specialists in ophthalmology, DR symptoms was highlighted manually to form the ground-truth of each image, which is also available in the DIARETDB1 as ground-truth images as: Hard exudates, hemorrhages, red small dots, and soft exudates. 3.2 Model for Graphical User Interfaces A graphical user interfaces (GUI) model was implemented as a graphical display in one window containing push buttons and data display using GUIDE (GUI development environment) tools [5]. The model enables user to perform interactive detection of DR. Four functions were created such as: Blood vessel extraction, microaneurysms detection, hemorrhages detection, and exudates detection. These functions are being called back when the user selects the push button that calls the function to display the output images. Other callback functions are implemented such as: Loading retinal image, closing all processing Figures, closing the GUI model, clearing the work space, and calling all the DR detection functions to display their outputs. The colored retinal images are chosen as an input from the dataset by the user to the GUI model. The input image initially resized while maintaining the original ratio from 1152x1500x3 pixels to a typical size of 513x668 pixels. The new resized image is processed for all operations. Fig. (2) shows the GUI model window without running the detection. Fig. (3) shows the fully operated system and the DR detection. 3.3 Blood Vessel Extraction In this approach, the green channel extraction was performed on the resized RGB image for blood vessel extraction because retinal images are red in color and red component does not give details of the retinal features. Blue component has a very low illumination and insufficient to support processing requirement. Also, the blood vessel has a high illumination in the green component. In order to enhance the contrast of the retinal image, a contrast-limited adaptive histogram equalization (CLAHE) was performed
on the green channel image [15]. CLAHE performs operations on small regions in the image. Each small region contrast is enhanced with histogram equalization. Bilinear interpolation is used to combine neighboring small regions. A morphological operation performed on the (CLAHE) using dilation and erosion with two different size structuring elements. [16] The morphology dilation and erosion operations formula are:
Dilation: G ⊕ D = G₁ (z, w) = sub m, n∈b (G(z − m, w − n) + D (m, n)) (1)
Erosion: G ⊖ D = G₂ (z, w) = inf m, n∈b₁ (G(z − m, w − n) + D₁ (m, n)) (2)
D and D1 are structuring elements used for morphology dilation and morphology erosion respectively while image G is the resulting image from operation CLAHE. Structuring elements values are defined as d and d1 grids. Dilation closes small dark areas by adding pixels to the boundaries of an object and enlarges brighter areas by removing pixels from objects boundaries. The erosion shrinks the objects to their original size and aspect after performing dilation. The dilated dark areas do not change to its original size and aspect due to erosion. However the blood vessels region is visible on a brighter background is closed. A subtraction operation preformed on the closed images with two various structuring elements will consequently give the blood vessel map of the CLAHE result. The blood vessel morphology operations are as follows:
Q′ = (G ⊕ D2) ⊖ D2 − (G ⊕ D1) ⊖ G1 (3)
A disk mask structuring element was used for the morphology operations. The larger disk structuring element is fixed at five pixels, obtained by training, (D2). As a result, the entire vessels network is dilated. The range of the disc size of the structuring element is chosen at 1-6 pixels [17]. The smaller disk is fixed at radius of one pixel, obtained by training, (D1). The above performed operations are shown in Fig. (5). The subtraction of the closed images (Q′) is subject to threshold at grey level 0.04 (obtained by training) using Otsu's thresholding technique and 2 × 2 median filter was preformed [18]. The result is binary image BW of the blood vessel segment. The skeleton of the blood vessel obtained using morphological thinning on image BW. The skeletonization implemented as SK= BW − (BW ⊖ B1 − BWC ⊖ B2), where BWC is the

Alharthi and Emamian; BJAST, 12(1): 1-15, 2016; Article no.BJAST.20702
5
complement of image BW and (B1, B2) are flat disk shaped structuring element. The disk is fixed at four and two radius respectively. A 2 × 2 median filter was applied to the subtraction of the eroded images (SK) to eliminate noise. An
additional source of noise in the image can be extracted using Criterion-1. The blood vessel network (BW2) obtained by subtracting the noise (extracted by Criterion-1) from the blood vessel network (SK).
Fig. 2. GUI model starting screen
Fig. 3. GUI model while detecting DR

Alharthi and Emamian; BJAST, 12(1): 1-15, 2016; Article no.BJAST.20702
6
3.3.1 Criterion-1 The 4-connected components (CC) found in the binary image (SK) is extracted. Then the area of each component in (CC) is computed using the measured properties of image regions (S) which are returned as an array of structs or a table. Also, a label matrix from the connected components structure (L) was created. The values of L are numbers equal to or greater than 0. The pixels with 0 value is a background pixel. The pixels 1 value makes a one area; the pixels 2 value makes a second area; and so on. Finally, the unwanted regions (BW1) are computed as follows: it registers 1 (true) if the data in the label matrix (L) from the connected components structure (CC) is found in (J). Elsewhere, it returns 0 (false). Where J is the pixels that satisfy the condition that specifies the actual number of pixels in the region (S) is less or equal to 50 pixels. In other words, if the pixel is less or equal to 50 pixels found in the measurement values table (S), it will be considered as J pixels. The
blood vessel map is not affected by this operating because the connectivity structures. The previous performed operations are shown in Fig. (6). Fig. (4) shows the block diagram of blood vessel algorithm. Fig. (7) shows blood vessel network of different retinal images.
3.4 Microaneurysm Detection Microaneurysms (MA) are the earliest signs of the characteristic of DR. It can be found in the retinal images as small blood dots which occurred due to canicular blast [19]. Automatic MA detection on retinal images is investigated in this paper with the aim of providing decision support using morphological operations which can be operated by any general purpose computer. MA is a reddish, small dots that can be found as a circle in diabetic retinal images with a diameter λ < 125 µm [20]. MA is small isolated dots about 9 pixels in an image of 513x668 pixels which is equals 125µm or less.
Fig. 4. Blood vessel extraction block diagram of the algorithm
Load image
Resize image
Green channel
CLAHE
Dilation Erosion
Erosion Dilation
Subtraction
Binary image Complement Meden filter
Erosion Erosion
Subtraction
Subtraction Blood vessel
Criterion -1

Alharthi and Emamian; BJAST, 12(1): 1-15, 2016; Article no.BJAST.20702
7
Fig. 5. Various stages of blood vessel extraction algorithm
Fig. 6. Various stages of blood vessel extraction algorithm
The system aims to identify it by its circular shape and its red pixels connectivity. The resized image is processed to improve the quality of the image before applying morphology operation. Therefore, the green panel of the resized image found to be useful for the MA detection due to the red lesions has a high illumination with the retinal background in this color component. A filtering operation was performed using median filter on the extracted green channel to reduce noise before CLAHE for contrast enhancement. A log transform was appalled on the CLAHE to improve the intensity values of the pixels.
The processed CLAHE image was preparatory image to detect MA. Extended minima transform was applied on the enhanced CLAHE image. This transforms computes the regional minima of the H-minima transform. Regional minima are number of pixels with certain connectivity with a constant illumination, and the external boundary of this connected components pixels all have a high quantity [21]. It is accounted as a thresholding technique. The threshold value obtained by training is 0.04 will consequent a binary image with MA and other noises.

Alharthi and Emamian; BJAST, 12(1): 1-15, 2016; Article no.BJAST.20702
8
Fig. 7. Various retinas blood vessel extraction of retinal images
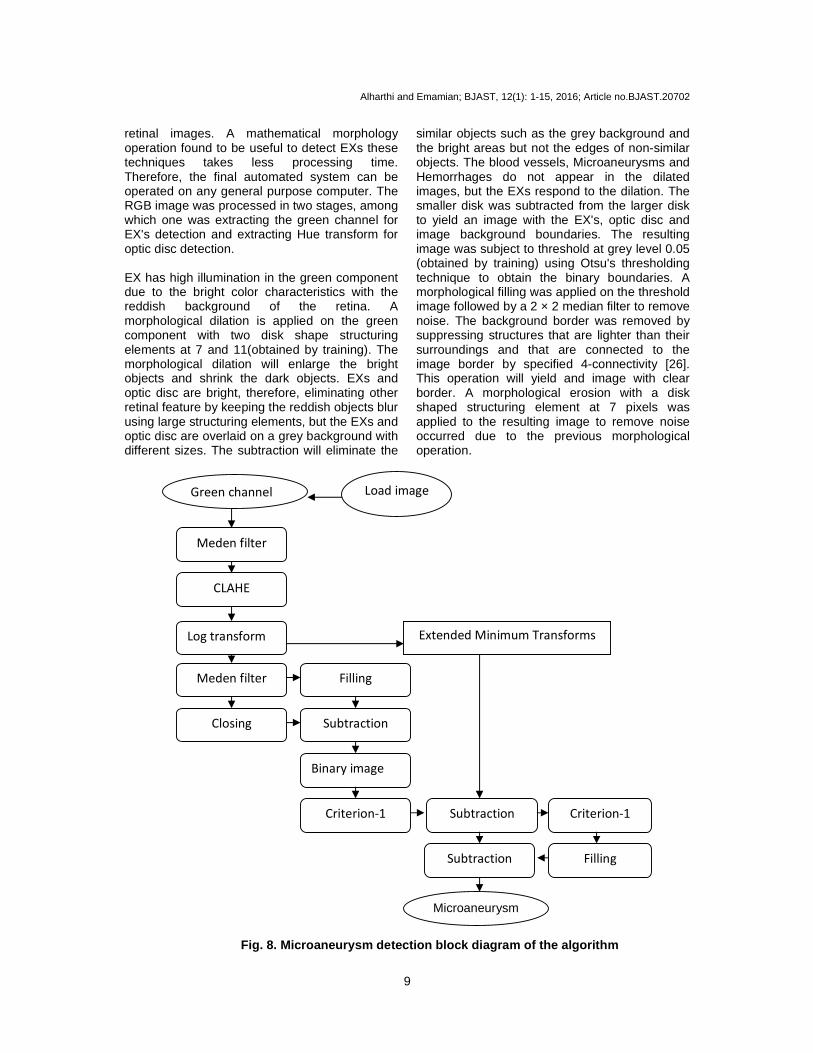
The blood vessel segment obtained previously is removed from the resulting image. Criterion-1 from the blood vessel extraction was performed on the resulting image to detect objects with a size smaller or equal to 10 pixels, but the value of J is chosen as greater or equal 10 pixels to select and classify MAs. Morphological filling was applied on the resulting image and subtracted from the previous step image. The result is Microaneurysms are overlaid on the original image after subtracting the extended-minima transform from Criterion-1 image. Fig. (8) shows the block diagram of Microaneurysm Detection algorithm. Fig. (9) shows Microaneurysm Detection stages. Fig. (10) shows Microaneurysm Detection for different retinal images. 3.5 Hemorrhages Detection Hemorrhages detection is important in the early screening of DR disease. Microaneurysms are commonly present in the early stages of this disease and the hemorrhages are conspicuous in a later stage [22]. Hemorrhages are a leakage of blood in the retina, which blurs vision. In some cases, a patient can only distinguish light from dark in the DR eye [23]. According to the world health organization (WHO) [24], Hemorrhages is a red lesion patches. The system aims to segment Hemorrhages using morphological operation and its isolated connected red pixels. The resized image is processed to improve the quality of the image before applying morphology operation. Therefore, the green panel of the
resized image found to be useful for hemorrhages detection due to the red lesions has a high illumination with the background in this color component. Hemorrhages can be accurately identified by performing mathematical morphology filling on the green component and subtract it from the original green component image. A thresholded at gray level of 0.02 was applied, obtained by training, to yield binary image of hemorrhages. Blood vessel can occur as noise, the blood vessel extraction was removed from the resulting image. A 2 × 2 median filter was applied to yield an image with hemorrhages and other noise. Criterion-1 from the blood vessel extraction was performed on the resulting image to detect objects with a size smaller or equal to 5 pixels. The result is overlaid on the original image after subtracting the unwanted regions from criterion-1. Fig. (11) shows the Hemorrhages detection algorithms flow chart. In Fig. (12) stages of Hemorrhages detection are shown. Fig. (13) shows Hemorrhages detection for different retinal images. 3.6 Exudates Detection Exudates (EX) are yellowish or white in color with different sizes, shapes and locations. They occur due to lipid residues of serous leakage from damaged capillaries or fat leaks from abnormal blood vessel or aneurysms [25]. From visual inspection, EXs often found as yellow or white patches in different sizes with sharp edges in
Alharthi and Emamian; BJAST, 12(1): 1-15, 2016; Article no.BJAST.20702
9
retinal images. A mathematical morphology operation found to be useful to detect EXs these techniques takes less processing time. Therefore, the final automated system can be operated on any general purpose computer. The RGB image was processed in two stages, among which one was extracting the green channel for EX's detection and extracting Hue transform for optic disc detection. EX has high illumination in the green component due to the bright color characteristics with the reddish background of the retina. A morphological dilation is applied on the green component with two disk shape structuring elements at 7 and 11(obtained by training). The morphological dilation will enlarge the bright objects and shrink the dark objects. EXs and optic disc are bright, therefore, eliminating other retinal feature by keeping the reddish objects blur using large structuring elements, but the EXs and optic disc are overlaid on a grey background with different sizes. The subtraction will eliminate the
similar objects such as the grey background and the bright areas but not the edges of non-similar objects. The blood vessels, Microaneurysms and Hemorrhages do not appear in the dilated images, but the EXs respond to the dilation. The smaller disk was subtracted from the larger disk to yield an image with the EX's, optic disc and image background boundaries. The resulting image was subject to threshold at grey level 0.05 (obtained by training) using Otsu's thresholding technique to obtain the binary boundaries. A morphological filling was applied on the threshold image followed by a 2 × 2 median filter to remove noise. The background border was removed by suppressing structures that are lighter than their surroundings and that are connected to the image border by specified 4-connectivity [26]. This operation will yield and image with clear border. A morphological erosion with a disk shaped structuring element at 7 pixels was applied to the resulting image to remove noise occurred due to the previous morphological operation.
Fig. 8. Microaneurysm detection block diagram of th e algorithm
Load image
Meden filter
CLAHE
Meden filter
Closing Subtraction
Filling
Subtraction
Binary image
Criterion-1 Criterion-1
Subtraction
Microaneurysm
Extended Minimum Transforms
Green channel
Filling
Log transform

Alharthi and Emamian; BJAST, 12(1): 1-15, 2016; Article no.BJAST.20702
10
Fig. 9. Various stages of microaneurysm detection algorithm
Fig. 10. Various retinas with microaneurysm detecti on of retinal images
Optic disc removal is the final step because it appears in EXs detection with similar color and contrast as the Exudates. The RGB input image was transformed to HSI color space. A separation of the red component, green component and blue component of the resized RGB image was performed. Then the sum of the colors images were divided by three to yield an intensity component image. A 2×2 median filter was applied on Hue image followed by CLAHE to remove noise and enhancing the illumination respectively. A morphological dilation was performed on the enhanced image to add pixels to the boundaries of the bright objects with a flat disk shaped structuring element at 8 radiuses. A thresholding at grey level 0.0610 followed by morphological dilation with the same previous structuring element will result a binary image with the optic disc and EXs. Criterion-1 was applied to
resulting image to detect the optic disc the value of J was chosen at less or equal 4000 pixels. Finally, the optic disc was subtracted from the EXEs image and overlaid on the original image. Fig. (14 above) shows the block diagram of Exudates detection algorithms. Fig. (15) shows the stages of optic disc detection. Fig. (16) shows the stages of Exudates detection. Fig. (17) shows Exudates detection for different retinal images. 4. RESULTS The system algorithms were evaluated on 89 images DIARETDB1 [10]. The database images have different variations in color, quality and illumination. The DIARETDB1 database contains 47 Exudates retinal images, 52 Hemorrhages retinal images, 78 Microaneurysms retinal

Alharthi and Emamian; BJAST, 12(1): 1-15, 2016; Article no.BJAST.20702
11
images and 5 normal retinal images. The MATLAB GUI model takes 2 seconds per lesion classification per image or using detect diabetic retinopathy detection button, it will take 5 seconds to run all the lesions detection. An
extensive visual evaluation of DR lesions was evaluated on a database of 89 images with the corresponding experts (ophthalmologists) manually highlighted ground truth images using specificity and sensitivity at image level [27].
Fig. 11. Hemorrhages Detection block diagram of the algorithm
Fig. 12. Various stages of hemorrhages detection al gorithm
Load Image
Blood vessel
Hemorrhages
Green channel
Filling
Subtraction
Binary image
Subtraction
Subtraction
Criterion-1

Alharthi and Emamian; BJAST, 12(1): 1-15, 2016; Article no.BJAST.20702
12
Fig. 13. Various retinas with hemorrhages detection of retinal images
Fig. 14. Exudates detection block diagram of the sy stem algorithm
The parameters of the images evolutions are as: true positive (Tp), a number of DR images were correctly detected, false positive (Fp), a number of non DR images were detected wrongly as DR, false negative (Fn), a number of DR that were not detected and true negative (Tn), a number of none DR which were correctly identified as non DR. From the above values, the sensitivity (1), specificity (2), misclassified proportion (3) and accuracy (4) were calculated.
4.1 Analysis of Performance
Sensitivity = ��
��� (4)
Specificity = �
��� (5)
Misclassified Proportion = �
������� (6)
Accuracy=����
������� (7)

Alharthi and Emamian; BJAST, 12(1): 1-15, 2016; Article no.BJAST.20702
13
Fig. 15. Various stages of optic disc detection’s a lgorithm
Fig. 16. Various stages of exudates detection’s alg orithm
Table 1. Measurements for system accuracy
Lesion DR images
Non DR images
Tp Fp Fn Tn Sensitivity (%)
Specificity (%)
Misclassified proportion (%)
Accuracy (%)
EX 47 42 39 8 6 38 86% 80% 8.7% 84.6% HEM 52 46 49 11 8 33 83% 71% 11.8% 81% MA 78 11 72 9 0 2 90% 20% 9.27% 89.1%

Fig. 17. Various retinas with
5. DISCUSSION AND CONCLUSION An automated system to detect diabetic retinopathy has been presented which is able to locate diabetic retinopathy lesions on retinal images. The visual evaluation is comparing the DR system detection with the highlighted ground truth images. It isuccessful detection using the measurement: sensitivity, specificity, misclassified proportion, and accuracy to evaluate the algorithm successThe weakness of the system’s arising from retinal optic disc detection, and retinal vessel detection. A future work will address optic disc and blood vessel detection using neural networks to improve the algorithm’s accuracy for better detection of these features and removing them. The main challenge was applying the algorithm on images with dcontrast and illumination to detect DR symptoms. Neural networks with training will accurately identify the areas of blood vessels and optic discs of various retinal images with different contrast and illumination. This automated system designed to help in DR screening to detect the disease rapidly with low computing time. This system is not final decision system; however, it can be a decision support for ophthalmologists or a fast screening of DR in areas where the number of ophthalmologists is insufficient. The fully automated diabetic retinopathy detection system presented in this project leads towards the health care costs reduction, reducing the uncertainty in decision and at the same time eliminates the chance of subjectivity in opinion amongst experts.
COMPETING INTERESTS Authors have declared that no competing interests exist.
Alharthi and Emamian; BJAST, 12(1): 1-15, 2016; Article no.
14
17. Various retinas with exudates detection of retinal images
DISCUSSION AND CONCLUSION
An automated system to detect diabetic retinopathy has been presented which is able to locate diabetic retinopathy lesions on retinal images. The visual evaluation is comparing the DR system detection with the manually
images. It indicates a measurement:
misclassified proportion, and accuracy to evaluate the algorithm success. The weakness of the system’s accuracy is arising from retinal optic disc detection, and
l detection. A future work will address optic disc and blood vessel detection using neural networks to improve the algorithm’s accuracy for better detection of these features and removing them. The main challenge was applying the algorithm on images with different contrast and illumination to detect DR symptoms. Neural networks with training will accurately identify the areas of blood vessels and optic discs of various retinal images with different
to help in DR screening to detect the disease rapidly with low computing time. This system is not final decision system; however, it can be a decision support for ophthalmologists or a fast screening of DR in areas where the number of ophthalmologists is
The fully automated diabetic retinopathy detection system presented in this project leads towards the health care costs
reducing the uncertainty in decision and at the same time eliminates the chance of
st experts.
Authors have declared that no competing
REFERENCES 1. International Council of Ophthalmology
Taskforce-documents; 2015. Available:http://www.icoph.org/taskforcedocuments/diabetic-retinopathyguidelines.html (Accessed: 25
2. Tapp RJ, Shaw JE, Harper CAprevalence of and factors associated with diabetic retinopathy in the Australian population. Diabetes Care1731–7. DOI:10.2337/diacare.26.6.1731 (inactive 2015-01-12). PMID
3. WHO. Priority eye diseases; Available:http://www.who.int/blindness/causes/priority/en/index5.html (Accessed: 25- Aug- 2015)
4. Silberman Nathan, Ahrlich Kristy, Fergus Rob, Subramanian Lakshminarayanan. Case for automated detection retinopathy. AAAI Spring Symposium Series; 2010. (n. pag. Web. 27 Jan. 2015
5. Mathworks.com. Matlab GUI 2015. (Online). Available:http://www.mathworks.com/discovery/matlab-gui.html (Accessed: 25- Aug- 2015)
6. Sinthanayothin C. et al. localisation of the optic discretinal blood vessels from fundus images. The British Journal of Ophthalmology. 1999;83(8):902
7. Kande Giri Babu, Satya SavithriVenkata Subbaiah P. Automatic of microaneurysms and hemorrhages digital fundus images. Journal of Digital Imaging. 2010;23(4):430-437. (PMC. Web. 12 July 2015)
8. Sopharak Akara, Bunyarit Uyyanonvara, Sarah Barman. Automatic
; Article no.BJAST.20702
International Council of Ophthalmology. 2015.
http://www.icoph.org/taskforce-retinopathy-
(Accessed: 25- Aug- 2015) Harper CA, et al. The
prevalence of and factors associated with diabetic retinopathy in the Australian
Diabetes Care. 2003;26(6):
:10.2337/diacare.26.6.1731 12766102. 2015.
http://www.who.int/blindness/cau
Silberman Nathan, Ahrlich Kristy, Fergus Lakshminarayanan.
automated detection of diabetic AAAI Spring Symposium
Web. 27 Jan. 2015) . Matlab GUI – Matlab;
http://www.mathworks.com/disco
C. et al. Automated optic disc, fovea, and
from digital colour . The British Journal of
902–910. Satya Savithri T,
. Automatic detection hemorrhages in
Journal of Digital 437.
Sopharak Akara, Bunyarit Uyyanonvara, Sarah Barman. Automatic exudate
Alharthi and Emamian; BJAST, 12(1): 1-15, 2016; Article no.BJAST.20702
15
detection from non-dilated diabetic retinopathy retinal images using fuzzy C-means clustering. Sensors (Basel, Switzerland). 2009;9(3):2148–2161. (PMC. Web. 12 July 2015)
9. Di Wu, Ming Zhang, J-CL, Bauman W. On the adaptive detection of blood vessels in retinal images. In IEEE Transactions on Biomedical Engineering. 2006;53.
10. Tamura S, Okamoto Y. Zero-crossing interval correction in tracing eye fundus blood vessels. Pattern Recogn. 1988; 21(3):227–233.
11. Hoover A, GoldBaum M. Locating the optic nerve in a retinal image using the fuzzy convergence of the blood vessels. IEEE Trans. on Medical Imaging. 2003;22(8): 951-8.
12. Carla Agurto, Victor Murray, Eduardo Barriga, Sergio Murillo, Marios Pattichis, Herbert Davis, Stephen Russell, Michael Abràmoff, Peter Soli. Multi-scale AM-FM methods for diabetic retinopathy lesion detection. IEEE Trans Med Imaging. 2010; 29(2):502-12.
13. Gagnon L, Lalonde M, Beaulieu M, Boucher MC. Procedure to detect anatomical structures in optical fundus images. In Proc. SPIE Medical Imaging: Image Processing. 2001;1218–1225.
14. Kauppi T, Kalesnykiene V, Kamarainen JK, Lensu L, Sorri I, Raninen A, Voutilainen R, Uusitalo H, Kalviainen H, Pietila J. DIARETDB1: Diabetic retinopathy database and evaluation protocol. Technical Report, Faculty of Medicine, University of Kuopio, Finland; 2007.
15. Zuiderveld Karel. Contrast limited Adaptive histograph equalization. Graphic Gems IV. San Diego: Academic Press Professional. 1994;474-485.
16. Wikipedia. Mathematical morphology; 2015. Available:https://en.wikipedia.org/wiki/Mathematical_morphology (Accessed: 25- Aug- 2015)
17. Goldbaum M, Moezzi S, Taylor A, Chatterjee S, Boyd J, Hunter E, Jain R.
Automated diagnosis and image understanding with object extraction, object classification and inferencing in retinal images. International Conference on Image Processing. 1996;3:695–698.
18. Otsu N. A threshold selection method from gray-level histograms. IEEE Transactions on Systems, Man and Cybernetics. 1979; 9(1):62-66.
19. Massin P, Erginay A, Gaudric A. Retinopathie diabetique. Elsevier, Editions Scientifiques of Medicales, Elsevier, SAS, Paris; 2000.
20. Júnior S, Welfer D. Automatic detection of microaneurysms and hemorrhages in color eye fundus images. International Journal of Computer Science and Information Technology. 2013;5(5):21-37.
21. Soille P. Morphological image analysis: Principles and applications. Springer-Verlag. 1999;170-171.
22. Ciulla TA, Amador AG, Zinman B. Diabetic retinopathy and diabetic macular edema: Pathophysiology, screening and novel therapies. Diabetes Care. 2003; 26(9):2653-2664.
23. World Health Organization. Definition, diagnosis and classification of diabetes mellitus and its complications. Part 1: Diagnosis and classification of diabetes mellitus. Geneva; 1999; (WHO/NCD/NCS/99.2).
24. Boyd K. What is diabetic retinopathy? - Eye MD - Approved information from EyeSmart; 2015. Available:http://www.geteyesmart.org/eyesmart/diseases/diabetic-retinopathy/ (Accessed: 25- Aug- 2015)
25. Kanski J. Diabetic retinopathy, clinical ophthalmology. Oxford: Butterworth Heimann; 1997.
26. Soille P. Morphological image analysis: Principles and applications. Springer. 1999;164-165.
27. Wikipedia. Sensitivity and specificity; 2015. Available:https://en.wikipedia.org/wiki/Sensitivity_and_specificity (Accessed: 25- Aug- 2015)
_________________________________________________________________________________ © 2016 Alharthi and Emamian; This is an Open Access article distributed under the terms of the Creative Commons Attribution License (http://creativecommons.org/licenses/by/4.0), which permits unrestricted use, distribution, and reproduction in any medium, provided the original work is properly cited.
Peer-review history: The peer review history for this paper can be accessed here:
http://sciencedomain.org/review-history/11462


![Neuroinflammatory responses in diabetic retinopathy...retina including the areas without clinically apparent ret-inopathy [7]. Microaneurysms, acellular capillary, and pericyte ghosts](https://static.fdocuments.in/doc/165x107/613ce6144c23507cb635ad35/neuroinflammatory-responses-in-diabetic-retinopathy-retina-including-the-areas.jpg)