Quantitative lung morphology: semi-automated measurement ...
Upload
trinhduongCategory
view
219download
1
An automated lung segmentation approach using bidirectional chaincodes to improve nodule detection accuracy
Shiwen Shen a,b,n, Alex A.T. Bui b, Jason Cong c, William Hsu b
a Department of Bioengineering, University of California, Los Angeles, CA, USAb Medical Imaging Informatics (MII) Group, Department of Radiological Sciences, University of California, Los Angeles, CA, USAc Department of Computer Science, University of California, Los Angeles, CA, USA
a r t i c l e i n f o
Article history:Received 16 September 2014Accepted 10 December 2014
Keywords:Lung segmentationJuxtapleural noduleChain codeSupport vector machineComputer aided diagnosis
a b s t r a c t
Computer-aided detection and diagnosis (CAD) has been widely investigated to improve radiologists'diagnostic accuracy in detecting and characterizing lung disease, as well as to assist with the processingof increasingly sizable volumes of imaging. Lung segmentation is a requisite preprocessing step for mostCAD schemes. This paper proposes a parameter-free lung segmentation algorithm with the aim ofimproving lung nodule detection accuracy, focusing on juxtapleural nodules. A bidirectional chaincoding method combined with a support vector machine (SVM) classifier is used to selectively smooththe lung border while minimizing the over-segmentation of adjacent regions. This automated methodwas tested on 233 computed tomography (CT) studies from the lung imaging database consortium(LIDC), representing 403 juxtapleural nodules. The approach obtained a 92.6% re-inclusion rate.Segmentation accuracy was further validated on 10 randomly selected CT series, finding a 0.3% averageover-segmentation ratio and 2.4% under-segmentation rate when compared to manually segmentedreference standards done by an expert.
& 2014 Elsevier Ltd. All rights reserved.
1. Introduction
Computed tomography (CT) is the de facto imaging modality usedto diagnose and characterize pulmonary nodules. Compared to con-ventional chest radiography, CT generates high resolution, volumetricdatasets that are able to resolve small and/or low-contrast nodules [1].However, reading CT images can require the review of a large, oftencomplex volumetric dataset, with the potential to overlook somenodules [4]. In addition, less experienced radiologists may haveincreased variability in detecting (subtle) lung cancers, as interpreta-tion heavily relies on past experience. In response, computer-aideddiagnosis (CAD) [25,30–35] systems have been explored, establishingthe potential to improve diagnostic accuracy. Previous studies haveshown that CAD increases lung nodule detection rates [44]; decreasesfalse-positive rates [13]; and compensates for deficient reader perfor-mance in the detection of the smallest lesions and of nodules withoutvascular attachment [5]. Indeed, over the past two decades, the abilityto accurately and consistently detect lung nodules has been an activearea of research in medical image analysis [5,6,15,30–37,46]. Thedevelopment of automated CAD for lung nodules is now further
motivated by the imminent launch of lung cancer screening programsgiven the findings of the landmark national lung screening trial(NLST), which demonstrated a 20% mortality reduction for individualswith lung cancer who underwent screening using low-dose CT relativeto plain chest radiography [2]. Based on this evidence, the UnitedStates preventive services task force (USPSTF) recently gave a Grade Brecommendation that annual screening for lung cancer with low-doseCT be performed in adults aged 55–80 who have a 30 pack-year(number of packs of cigarettes smoked per day multiplied by thenumber of years an individual has smoked) smoking history andcurrently smoke or have quit within the past 15 years [11]. TheAmerican Society of Clinical Oncologists (ASCO) suggests similarguidelines [3].
Lung segmentation is an important preprocessing step occurringbefore nodule detection and the generation of a region of interest(ROI) for subsequent analysis (i.e., the lung field). Pulmonary nodulescan be grouped into three categories (Fig. 1): isolated, juxtapleural, andjuxtavascular. Isolated and juxtavascular nodules lie within the centerof the ROI and are typically segmented without issue. But when lungsegmentation fails to correctly define the lung boundaries, juxtapleural(or pleura-connected) nodules can be missed, and normal chest tissueoutside of the lung can be included incorrectly as part of the ROI. Inpoint of fact, recent evaluation of a CAD system found that 17% of alltrue nodules are missed due to poor lung segmentation [7]. Accuratelung segmentation is thus imperative in ensuring accurate CAD system
Contents lists available at ScienceDirect
journal homepage: www.elsevier.com/locate/cbm
Computers in Biology and Medicine
http://dx.doi.org/10.1016/j.compbiomed.2014.12.0080010-4825/& 2014 Elsevier Ltd. All rights reserved.
n Correspondence to: 924 Westwood Boulevard, Suite 420, Los Angeles,CA 90024, USA. Tel.: þ1 310 8197562.
E-mail address: [email protected] (S. Shen).
Computers in Biology and Medicine 57 (2015) 139–149

performance: the ability to identify true nodules ultimately sets theupper bound on CAD performance [6].
In this paper, a novel method is proposed for delineating the lungfield ROI by automatically segmenting the lung lobe, correcting theborder to avoid excluding nodules close to the lung boundary whileminimizing possible over-segmentation. The focus of this algorithmis to address issues related to juxtapleural nodules. A bidirectionalchain encoding method is used to detect both vertical and horizontalcritical point pairs. A support vector machine is then employed topredict whether the concave region formed by a point pair should becorrected based on positional information, concavity rate, and dis-tance information. To test the proposed method, 233 CT scans fromthe Lung Imaging Database Consortium (LIDC) dataset were used.This paper is divided as follows. Section 2 reviews previous relatedworks, comparing and contrasting our proposed approach withearlier research. In Section 3, the methodology is presented in threesteps: image preprocessing, inflection point detection, and bordercorrection. Results of the evaluation are presented in Section 4.Finally, we conclude in Section 5 with a comparison to other works,discussion of the limitations of our method, and future work.
2. Related work
While many algorithms [7–10,18–20,23,24,26–29,47] performautomatic lung segmentation of thoracic CT images, only a fewexplicitly handle juxtapleural nodules; however, evaluation is oftenlacking [8] or employs a small test set not fully representative of therange of appearance of such nodules (e.g., variations in size, shape).Semi-automated segmentation methods [12] have been previouslyemployed to overcome under-segmentation problems caused byjuxtapleural nodules, but the process of having an individual revieweach study is time consuming and arguably not scalable.
Hu et al. [14] present a fully automated lung segmentationmethod using combinations of morphological operations to ensure
the inclusion of juxtapleural nodules. The effectiveness of themorphological operations is dependent on the shape and the sizeof the selected structuring element. As juxtapleural nodules vary insize and shape, selecting an optimal size and shape that works well inall cases is difficult. For instance, a smaller sized structuring elementwill fail to capture larger-sized juxtapleural nodules; conversely, alarge structuring element will cause over-segmentation and distor-tion of the local region. Similarly, a “rolling ball” method has alsobeen used [6,7,15–17], comprising a morphological close operatorwith a round-shape structuring element. Likewise, the size of the ballis hard to optimize across the variation observed in juxtapleuralnodules, as noted in [8,21].
Pu et al. [8] propose a point-wise lung segmentation algorithm,called adaptive border marching (ABM), designed to addressjuxtapleural nodules. An inclusion criterion is defined based onthe ratio between the Euclidean distance of two points on theboundary and the maximum height perpendicular to their connect-ing line segment. This ratio is used to adaptively adjust the size of asearch step for choosing point pairs by comparing itself to a fixedthreshold. For all point pair candidates inside one concave region,only the outermost one (which forms the biggest convex hull) isconnected (this process is equivalent to the gift-wrapping algorithm[45]). Selecting a threshold parameter to control over-segmentationacross all cases is problematic. Varshini et al. [42] extends ABM bymerging two lung segmentations obtained using a small thresholdand a large threshold separately, but provide no evaluation.
Kim et al. [21] also present a contour-marching method to avoidperipheral nodule exclusion near the lung boundary. This methodtracks the lobe boundary to detect suspicious areas with texturefeatures similar to a true nodule. A region growing method isapplied to each identified area to re-include it as part of the lungregion. Markedly, texture features alone are unable to detect alljuxtapleural nodule regions along a boundary. Defining the searchwindow and threshold for region growing method are also inherentchallenges to this approach.
Fig. 1. Three pulmonary nodule types: isolated, juxtapleural, and juxtavascular nodules: (a) CT slice with isolated nodule A; (b) CT slice with juxtapleural nodule B;(c) CT slice with juxtavascular nodule C; (d) magnified view of isolated nodule A; (e) magnified view of juxtapleural nodule B; and (f) magnified view of juxtavascular nodule C.
S. Shen et al. / Computers in Biology and Medicine 57 (2015) 139–149140

Ye et al. [37] use a Freeman chain code to correct the contour of alung lobe. For all pixels along the boundary, chain codes are used todetect critical points by examining the transition between concaveand convex points, determined by a predefined threshold value. Allcritical point pairs are then connected to form a revised border.Using a preset threshold to define concave/convex regions may notbe effective across the natural variation seen in imaging studies andanatomy; and connecting all detected critical point pairs may leadto over-segmentation. Choi et al. [36] detail a similar chain codemethod, but rather than detecting transitions to find critical points,gradient information is extracted from the chain code and onlyconnecting point pairs whose change in gradient value is below agiven threshold value are considered. Both methods detect con-vexity changes in only the horizontal (or vertical) direction, which isin general not sufficiently robust to correct under-segmentation (asillustrated in Section 3.2). Ko et al. [22] use a curvature-basedmethod to correct the initial lung mask. The curvature for eachpoint on the boundary is calculated to detect a rapid change and asegment is inserted to correct such regions.
As can be seen from the above methods, all rely upon one (ormore) predefined parameters (which may vary between CT scans),making algorithm performance sensitive to the normally observeddistribution in lung nodule shape and size. Moreover, littlevalidation is given on the effectiveness of the proposed bordercorrection methods on clinical data. Our proposed method, pre-sented subsequently and assessed over a large dataset, eliminatesthe need for predefined parameters (i.e., it is parameter-free) inorder to operate on the full spectrum of nodule sizes/shapes.
3. Method
The proposed method mainly consists of three steps (Fig. 2):(1) preprocessing to generate an initial lung lobe mask usingadaptive thresholding (Fig. 2d, e); (2) detecting inflection points(both horizontally and vertically) to obtain all major concave andconvex points along the lung lobe boundary (Fig. 2f, g); and(3) correcting the lung boundary border using a support vectormachine (SVM) to identify relevant pairwise connections (Fig. 2h)based on extracted features. The details for each step are describedas follows.
3.1. Preprocessing
Preprocessing uses Otsu's adaptive thresholding [39] method toautomatically obtain an initial lung mask based on the pixel intensitydistribution of the input CT image. This method uses discriminateanalysis to exhaustively search for a threshold value that minimizesthe intra-class variance between two regions of an image. For a givenimage, let L represent the grey level of all the pixels [1, 2, …, L]. Bychoosing a threshold at grey level k, the pixels are divided into objectclass C0 and background class C1. Let w0 and w1 be the probabilitiesof C0 and C1 separated by a defined threshold and let σ2
0 and σ21 be
the variances of these two classes. The intra-class variance is definedas the weighted sum of these two variances:
σ2Intra kð Þ ¼ω0 kð Þnσ2
0 kð Þþω1 kð Þnσ21 kð Þ ð1Þ
The optimal threshold T is calculated as the value minimizingσ2IntraðkÞ:
T ¼ arg minkA ½1; L�
σ2Intra kð Þ ð2Þ
After thresholding, a flood filling method combined with 3Dlabeling is adopted to produce an initial lung lobe mask (Fig. 3b–e).During initial segmentation testing, the CT imaging studies werefound to have extremely low background pixel values (Fig. 3a) that
formed a peak pattern (Fig. 3b) influencing the optimal thresholdcalculation. The calculated optimal threshold will not be able todifferentiate the lung region from the background due to theinfluence of this peak pattern, leading to segmentation failure.Therefore, background pixel values are removed before calculatingthe intra-class variance.
3.2. Inflection point detection
Preprocessing generates a binary mask of the lung lobe region.To selectively revise the initial lung segmentation to re-includejuxtapleural nodules, the boundary is first characterized using abidirectional differential chain (BDC) encoding method to helpidentify inflection points. Inflection points are defined as the pointswhere the convexity of the boundary changes. Concavities are thendetected based on these inflection points. This step maximizes thesensitivity in detecting areas with juxtapleural nodules. A processfor selecting critical point pairs is then followed to reduce the falsepositives and minimize over-segmentation.
The original application of chain codes was for lossless com-pression of grey-scale images [40]. The basic principle is toseparately encode the boundary coordinates (chains of pixels) foreach connected component in an image. The chain is a sequence ofdirection codes from one pixel to the adjacent one. There are eightpossible directions between two adjacent pixels. The code word c(i) for a BDC is the number corresponding to the direction fromone pixel (i) to the next (iþ1) in a chain, c(i)A{0, 1, �1}, where irepresents the index value for the pixel. The assigned code wordfor each direction is based on the encoding coordinate system(Fig. 4). To detect both horizontal and vertical inflection points,this method uses two different coordinate systems for horizontaland vertical encoding. The detection of the inflection points fromthe BDC encoding proceeds based on the following steps:
1. Initial boundary generation. The lung lobe boundary pixels areextracted from the binary mask for the left and right lobes,separately.
2. Boundary encoding. Per lobe, both vertical and horizontal codewords are obtained using the corresponding encoding coordi-nate systems. The encoder moves along the boundary followinga (counter)clockwise path, and at each step the direction of thismovement is transformed into a code word. The encodingprocess is illustrated in Fig. 4:a. Horizontal code word generation. Fig. 4b–d depicts the
process of generating horizontal code words. In Fig. 4b,the blue boxes represent pixels along the lung lobe bound-ary. If A is the starting point, the encoder moves along theboundary in a clockwise way.
b. Arrow map generation. An arrow map is generated to repre-sent the direction that the encoder moves. For instance, inFig. 4c the encoder moves in the northwest direction whentraversing from point A to B.
c. Code word assignment. A code word is assigned to eacharrow according to the encoding coordinate system given inFig. 4a. As shown in Fig. 4d, the arrow that points in thenorthwesterly direction from A to B is assigned a code wordof ‘1’ based on the encoding coordinate system.
d. Vertical code word generation. The vertical code word isgenerated in a similar manner, but using a vertical encodingcoordinate system (Fig. 4f). Fig. 4g–i depicts the process ofgenerating vertical code words.
3. Inflection point calculation. A differential operation is used togenerate the horizontal and vertical differential chain codes,separately. Non-zero points in the differential chain are identifiedas inflection points. As presented in Fig. 4e and j, the differentialcode is calculated using a clockwise differential operation based
S. Shen et al. / Computers in Biology and Medicine 57 (2015) 139–149 141

on the generated code words (i.e., from Steps 2a, 2d). For instance,the differential code at point A is 0; the differential code at D is�2. As can be seen, pixels D and E are the only points with non-zero differential codes; therefore, D is detected as a horizontalinflection point and E is detected as a vertical inflection point.
To overcome the influence of the small perturbations in the lobeboundary, a seven-tap Gaussian low-pass filter [40] is applied tosmooth code words prior to the inflection point calculations in Step3. An operator is then applied to round the smoothed code word tothe nearest integer (0, 1, or �1). Fig. 5 gives an example of thedetected inflection points for a right lung lobe using the proposedmethod with and without the low-pass filter. Fig. 5b shows thedetected inflection points on the right lung lobe boundary withoutapplying a low-pass filter. The white circles on the boundary
represent the vertical inflection points, and the yellow squaresrepresent the horizontal inflection points. Fig. 5b has many moreinflection points that add unnecessary noise to the inflection detec-tion process. After applying the Gaussian low-pass filter (Fig. 5c), onlythe remaining points are deemed inflection points.
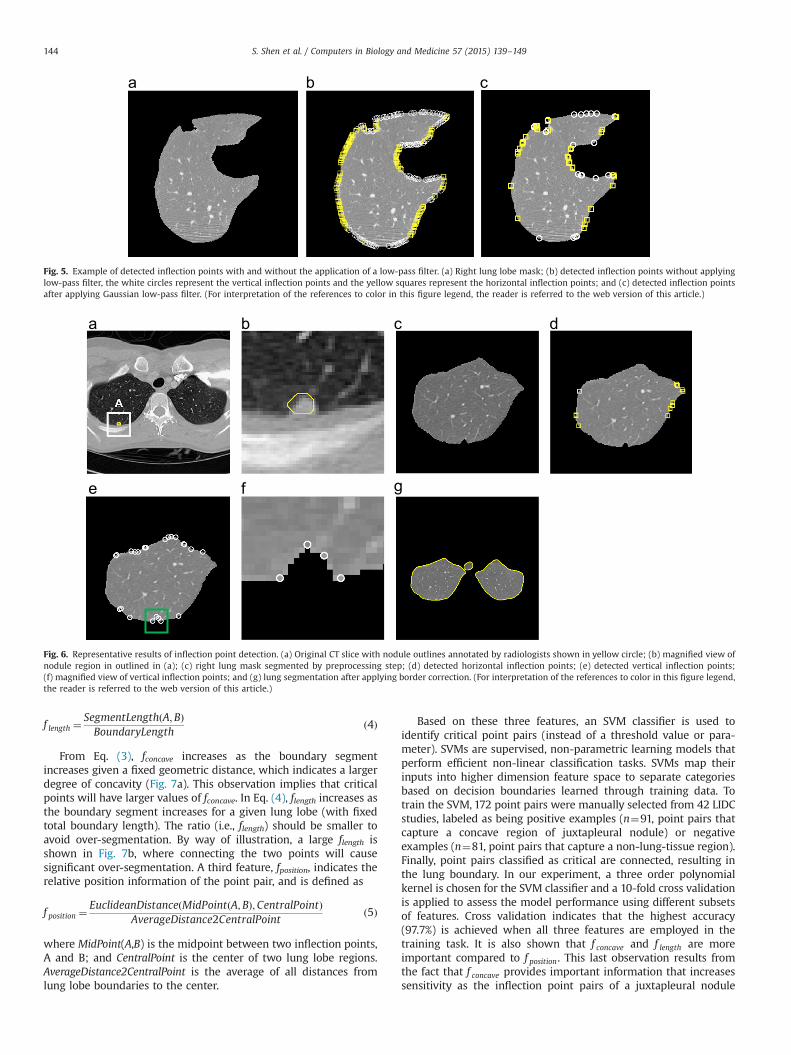
Fig. 6 illustrates the effectiveness of the vertical and horizontalinflection point detection process. Fig. 6a shows an original CT slice,and the yellow contour in Fig. 6a, b indicates the nodule in the rightlung that has been manually outlined by one radiologist. Afterpreprocessing, the segmented right lung lobe ROI does not includethis nodule region; Fig. 6c illustrates the under-segmentation problem,from which it can be observed that the convexity changes in thenodule region along the boundary are vertical. Using our approach, thedetected critical horizontal and vertical inflection points are shown inFig. 6d–f using yellow squares and white circles, respectively. By
Image Pre-processing
Adaptive Thresholding
Flood Filling
Inflection Point Detection
Initial Boundary Generation
Arrow Map Generation
Vertical Differential Code Word Generation
Low-Pass Filtering
Inflection Point Calculation
Horizontal Differential Code Word Generation
Binary Mask of Lung Lobes
Border Correction
Feature Extraction
SVM Classification
Inflection Points
Fig. 2. Diagrams depicting the proposed method and its outputs for a representative case. (a) Flow diagram of the proposed method; (b) original image; (c) original imagewith juxtapleural nodule outlined in white; (d) lung boundaries obtained after preprocessing; (e) lung lobe mask obtained after preprocessing; (f) detected inflection pointsshown in yellow-squares/white-circles; (g) magnified view of inflection points; and (h) results after border correction. (For interpretation of the references to color in thisfigure legend, the reader is referred to the web version of this article.)
S. Shen et al. / Computers in Biology and Medicine 57 (2015) 139–149142

comparing Fig. 6d–f, the nodule region is only captured by verticalinflection points, corresponding to the earlier observation. This obser-vation suggests that detecting both vertical and horizontal changessimultaneously are necessary to robustly correct for under-segmentation. The final segmentation result (after border correctiondescribed in the next section) is shown in Fig. 6g.
3.3. Border correction
Rather than connect all inflection point pairs, only critical pointpairs are connected to correct the boundary, thereby minimizingover-segmentation. Three features are used to select critical point
pairs: boundary segment concave degree, relative boundary dis-tance, and relative position information.
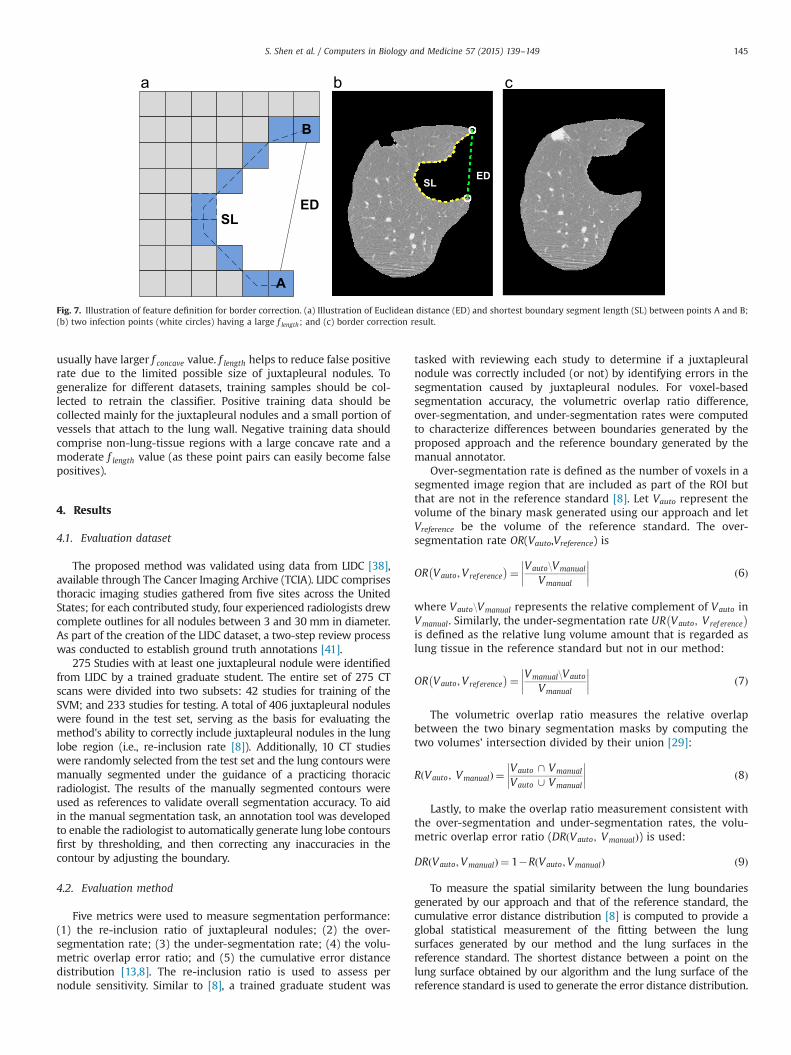
Let EuclideanDistance(A,B) represent the Euclidean distancebetween two inflection points, A and B. Let SegmentLength(A,B)represent the shortest boundary segment length between thesetwo points. As shown in Fig. 7a, ED represents EuclideanDistance(A,B) and SL the Segment length (A,B). Let BoundaryLength be thetotal length of the lung lobe under consideration. The concavefeature, f concave, and the length feature, f length, are defined as
f concave ¼SegmentLengthðA;BÞ
EuclideanDistanceðA;BÞ ð3Þ
Fig. 3. Basic steps for preprocessing. (a) Original image; (b) histogram generation of pixel value intensities; (c) adaptive thresholding to get initial segmentation result;(d) hole filling to obtain the lung lobe mask; and (e) corresponding segmented lung lobe region.
Fig. 4. Process of encoding the bi-directional differential chain code. (a)–(e) illustrates the process of horizontal differential chain code generation, while (f)–(j) illustrates theprocess of vertical chain code generation. (a) Horizontal encoding coordinate system; (b) initial boundary generation; (c) arrow map generation; (d) horizontal code wordassignment; (e) horizontal differential chain code generation to detect horizontal inflection points; (f) vertical encoding coordinate system; (g) initial boundary generation;(h) arrow map generation; (i) vertical code word assignment; and (j) vertical differential chain code generation to detect vertical inflection points. (For interpretation of thereferences to color in this figure, the reader is referred to the web version of this article.)
S. Shen et al. / Computers in Biology and Medicine 57 (2015) 139–149 143
f length ¼SegmentLengthðA;BÞBoundaryLength
ð4Þ
From Eq. (3), fconcave increases as the boundary segmentincreases given a fixed geometric distance, which indicates a largerdegree of concavity (Fig. 7a). This observation implies that criticalpoints will have larger values of fconcave. In Eq. (4), flength increases asthe boundary segment increases for a given lung lobe (with fixedtotal boundary length). The ratio (i.e., flength) should be smaller toavoid over-segmentation. By way of illustration, a large flength isshown in Fig. 7b, where connecting the two points will causesignificant over-segmentation. A third feature, fposition, indicates therelative position information of the point pair, and is defined as
f position ¼EuclideanDistanceðMidPoint A;Bð Þ;CentralPointÞ
AverageDistance2CentralPointð5Þ
where MidPoint(A,B) is the midpoint between two inflection points,A and B; and CentralPoint is the center of two lung lobe regions.AverageDistance2CentralPoint is the average of all distances fromlung lobe boundaries to the center.
Based on these three features, an SVM classifier is used toidentify critical point pairs (instead of a threshold value or para-meter). SVMs are supervised, non-parametric learning models thatperform efficient non-linear classification tasks. SVMs map theirinputs into higher dimension feature space to separate categoriesbased on decision boundaries learned through training data. Totrain the SVM, 172 point pairs were manually selected from 42 LIDCstudies, labeled as being positive examples (n¼91, point pairs thatcapture a concave region of juxtapleural nodule) or negativeexamples (n¼81, point pairs that capture a non-lung-tissue region).Finally, point pairs classified as critical are connected, resulting inthe lung boundary. In our experiment, a three order polynomialkernel is chosen for the SVM classifier and a 10-fold cross validationis applied to assess the model performance using different subsetsof features. Cross validation indicates that the highest accuracy(97.7%) is achieved when all three features are employed in thetraining task. It is also shown that f concave and f length are moreimportant compared to f position. This last observation results fromthe fact that f concave provides important information that increasessensitivity as the inflection point pairs of a juxtapleural nodule
Fig. 5. Example of detected inflection points with and without the application of a low-pass filter. (a) Right lung lobe mask; (b) detected inflection points without applyinglow-pass filter, the white circles represent the vertical inflection points and the yellow squares represent the horizontal inflection points; and (c) detected inflection pointsafter applying Gaussian low-pass filter. (For interpretation of the references to color in this figure legend, the reader is referred to the web version of this article.)
Fig. 6. Representative results of inflection point detection. (a) Original CT slice with nodule outlines annotated by radiologists shown in yellow circle; (b) magnified view ofnodule region in outlined in (a); (c) right lung mask segmented by preprocessing step; (d) detected horizontal inflection points; (e) detected vertical inflection points;(f) magnified view of vertical inflection points; and (g) lung segmentation after applying border correction. (For interpretation of the references to color in this figure legend,the reader is referred to the web version of this article.)
S. Shen et al. / Computers in Biology and Medicine 57 (2015) 139–149144
usually have larger f concave value. f length helps to reduce false positiverate due to the limited possible size of juxtapleural nodules. Togeneralize for different datasets, training samples should be col-lected to retrain the classifier. Positive training data should becollected mainly for the juxtapleural nodules and a small portion ofvessels that attach to the lung wall. Negative training data shouldcomprise non-lung-tissue regions with a large concave rate and amoderate f length value (as these point pairs can easily become falsepositives).
4. Results
4.1. Evaluation dataset
The proposed method was validated using data from LIDC [38],available through The Cancer Imaging Archive (TCIA). LIDC comprisesthoracic imaging studies gathered from five sites across the UnitedStates; for each contributed study, four experienced radiologists drewcomplete outlines for all nodules between 3 and 30 mm in diameter.As part of the creation of the LIDC dataset, a two-step review processwas conducted to establish ground truth annotations [41].
275 Studies with at least one juxtapleural nodule were identifiedfrom LIDC by a trained graduate student. The entire set of 275 CTscans were divided into two subsets: 42 studies for training of theSVM; and 233 studies for testing. A total of 406 juxtapleural noduleswere found in the test set, serving as the basis for evaluating themethod's ability to correctly include juxtapleural nodules in the lunglobe region (i.e., re-inclusion rate [8]). Additionally, 10 CT studieswere randomly selected from the test set and the lung contours weremanually segmented under the guidance of a practicing thoracicradiologist. The results of the manually segmented contours wereused as references to validate overall segmentation accuracy. To aidin the manual segmentation task, an annotation tool was developedto enable the radiologist to automatically generate lung lobe contoursfirst by thresholding, and then correcting any inaccuracies in thecontour by adjusting the boundary.
4.2. Evaluation method
Five metrics were used to measure segmentation performance:(1) the re-inclusion ratio of juxtapleural nodules; (2) the over-segmentation rate; (3) the under-segmentation rate; (4) the volu-metric overlap error ratio; and (5) the cumulative error distancedistribution [13,8]. The re-inclusion ratio is used to assess pernodule sensitivity. Similar to [8], a trained graduate student was
tasked with reviewing each study to determine if a juxtapleuralnodule was correctly included (or not) by identifying errors in thesegmentation caused by juxtapleural nodules. For voxel-basedsegmentation accuracy, the volumetric overlap ratio difference,over-segmentation, and under-segmentation rates were computedto characterize differences between boundaries generated by theproposed approach and the reference boundary generated by themanual annotator.
Over-segmentation rate is defined as the number of voxels in asegmented image region that are included as part of the ROI butthat are not in the reference standard [8]. Let Vauto represent thevolume of the binary mask generated using our approach and letVreference be the volume of the reference standard. The over-segmentation rate OR(Vauto,Vreference) is
OR Vauto;Vref erence� �¼ Vauto\Vmanual
Vmanual
����
���� ð6Þ
where Vauto\Vmanual represents the relative complement of Vauto inVmanual. Similarly, the under-segmentation rate UR Vauto; Vref erence
� �
is defined as the relative lung volume amount that is regarded aslung tissue in the reference standard but not in our method:
OR Vauto;Vref erence� �¼ Vmanual\Vauto
Vmanual
����
���� ð7Þ
The volumetric overlap ratio measures the relative overlapbetween the two binary segmentation masks by computing thetwo volumes' intersection divided by their union [29]:
R Vauto; Vmanualð Þ ¼ Vauto \ Vmanual
Vauto [ Vmanual
����
���� ð8Þ
Lastly, to make the overlap ratio measurement consistent withthe over-segmentation and under-segmentation rates, the volu-metric overlap error ratio (DR Vauto; Vmanualð Þ) is used:
DR Vauto;Vmanualð Þ ¼ 1�R Vauto;Vmanualð Þ ð9Þ
To measure the spatial similarity between the lung boundariesgenerated by our approach and that of the reference standard, thecumulative error distance distribution [8] is computed to provide aglobal statistical measurement of the fitting between the lungsurfaces generated by our method and the lung surfaces in thereference standard. The shortest distance between a point on thelung surface obtained by our algorithm and the lung surface of thereference standard is used to generate the error distance distribution.
SLED
Fig. 7. Illustration of feature definition for border correction. (a) Illustration of Euclidean distance (ED) and shortest boundary segment length (SL) between points A and B;(b) two infection points (white circles) having a large f length; and (c) border correction result.
S. Shen et al. / Computers in Biology and Medicine 57 (2015) 139–149 145

4.3. Results
Using the 233 test studies from LIDC dataset, our experimentshows that 373 juxtapleural nodules out of total 406 juxtapleuralnodules were correctly included as part of the ROI, achieving a92.6% inclusion rate. After an error analysis, 83.3% of the missingjuxtapleural nodules were found sitting in between segments oflung tissues, as shown in Fig. 8. In this situation, the proposedmethod fails because each segment is processed separately.
Fig. 9 shows the volume-based segmentation error as assessedby over-segmentation ratio, under-segmentation ratio, and overlapratio difference. The average over-segmentation rate is 0.3%, whilethe average under-segmentation ratio is 2.4% and the averageoverlap ratio difference is 2.7%. Fig. 10 shows the cumulative errordistance distribution to assess the border positioning accuracy.The error bars in Fig. 10 represent the standard deviation corre-sponding to each distance. 93% and 96% lung surfaces obtained bythe proposed method are within 2–3 mm of the reference stan-dard, respectively. The largest error distance is 22.5 mm. Relativelylarger under-segmentation and error distances are mainly due tothe presence of atelectasis (Fig. 11a, b) or consolidation (Fig. 11c, d).
5. Discussion
5.1. Comparison with other works
Although many methods have been developed to performautomatic lung segmentation, only a few explicitly handle juxta-pleural nodules and evaluate the method on actual patient data.Table 1 compares the proposed method to other lung segmenta-tion algorithms that handle juxtapleural nodules. Our methodachieves better average overlap ratio compared to Wei's [47]method. This difference is attributed to the fact that our approach
Fig. 8. Representative case where the proposed method failed to re-include the juxtapleural nodule. (a) Original CT slice with a nodule attached to diaphragm and pleura;(b) CT slice with nodule outlines annotated by a radiologist shown in yellow circle; (c) magnified view of nodule outline annotation; (d) lung segmentation obtained by ourmethod; and (e) reference standard lung segmentation. (For interpretation of the references to color in this figure legend, the reader is referred to the web version of thisarticle.)
0.0%
0.5%
1.0%
1.5%
2.0%
2.5%
3.0%
3.5%
4.0%
1 2 3 4 5 6 7 8 9 10
Volu
me
Erro
r Per
cent
age
CT Studies
over-segmentation rate under-segmentation rate overlap ratio difference
Fig. 9. The segmentation error computed based on a comparison of lung volume:over-segmentation rate, under-segmentation rate and overlap ratio difference fromEqs. (6), (7) and (9). Mean errors are 0.3%, 2.4% and 2.7% respectively.
70%72%74%76%78%80%82%84%86%88%90%92%94%96%98%
100%
0 1 2 3 4 5 6 7 8 9 10 11 12 13 14 15 16 17 18 19 20 21 22 23
Cum
ulat
ive
Perc
enta
ge
Distance from Reference Standard (mm)
Fig. 10. Cumulative point-wise error distance distribution of the shortest distancefrom proposed lung segmentation surface to lung surface of the reference standard.
S. Shen et al. / Computers in Biology and Medicine 57 (2015) 139–149146

implements a point pairs selection technique, which reduces therisk of over-segmentation. Our method has similar average over-segmentation ratio and average under-segmentation ratio com-pared to Pu's [8] method. Although both Pu [8] and Wei [47] reporta 100% re-inclusion rate, their test sets contain a limited set ofjuxtapleural nodules, 67 and 32 respectively, compared to our setof 406 nodules. Similar to the limitation of our approach indetecting missing nodules that are between lung segments, Pu'sand Wei's methods also process each isolated lung region sepa-rately and thus will likely fail in similar situations. One should notethat the performance of the oft-cited rolling ball method is highlydependent on the specified parameters, which are not consistentlyincluded in publications [8]. For example, Kim [21] highlights thedifficulty in selecting the appropriate fixed ball radius because ofthe large variance in juxtapleural nodule sizes. Therefore, acomparison of our method against algorithms that utilize therolling-ball method would be inconclusive, given that the originalimplementation cannot be replicated effectively. Also, Stelmo et al.[43] point out that a fair comparison between two methods wouldonly be possible if the works use the same images and acquisitionstandards (resolution, bits per pixel, etc.); given the unavailabilityof others' test data, such a formal comparison is not possible. Butin general, and as compared to these other methods, our describedmethod can accurately segment the lung tissues while robustlyand correctly including the juxtapleural nodules.
5.2. Effects of the chain code smoothing step
A seven-tap Gaussian low-pass filter is employed to smooth thechain code to overcome the influence of the small perturbations inthe lobe boundary as described in Section 3.2. This step is used toreduce computational complexity as fewer inflection point pairs areinputted to the SVM classifier afterwards. Removing this step will not
reduce the re-inclusion rate of the juxtapleural nodules as theclassifier would still identify the same points for re-inclusion butwould need to consider more points. In our experiment, a Gaussiankernel with variance equal to two is employed to perform thesmoothing task and a 92.6% re-inclusion rate is achieved. Byexamining the failure cases in our experiment, we found out thatnone of the failure cases were caused due to inflection pointdetection failure. As such, we believe the adoption of this Gaussianlow-pass filter did not include additional errors. However, to adaptthis approach to perform on other datasets, the degree of smoothingstrength may be adjusted based on preference and dataset standards.
6. Conclusion
Lung segmentation is an important precursor to many quantita-tive analysis applications for pulmonary disease. While a largenumber of lung segmentation methods have been proposed in thepast few years, we present a novel approach to segment the lungusing a bidirectional differential chain code combined with amachine learning framework. An evaluation involving 233 CT studiescontaining 403 juxtapleural nodules and manual annotations of asample of 10 cases by a radiologist has been conducted to demon-strate the effectiveness of our method. The results show that ourmethod is able to correctly include the juxtapleural nodules into thelung tissue while minimizing over and under-segmentation.
The average computation time of the proposed method is 0.53 sper CT slice tested on MATLAB implemented software using alaptop with Intel Core i7 3 GHz and 8 GB RAM. One limitation ofthe proposed method is that it sometimes fails to re-include thejuxtapleural nodules sitting in consolidation regions (betweenlung tissue segments); to overcome this problem, future work willintegrate some region connection techniques as a precursor step
Fig. 11. Comparison between lung segmentation obtained by our method and reference standards in cases with atelectasis or consolidation. (a) Lung segmentation obtainedby our method in an atelectasis case; (b) reference standard in an atelectasis case; (c) lung segmentation obtained by our method in a consolidation case; (d) referencestandard in a consolidation case.
Table 1Comparison of the performance of lung segmentation methods that handling juxtapleural nodules.
Works Test datasets Average of overlap (%) Average of over-segmentation(%)
Average of Under-segmentation(%)
Re-inclusion rate(%)
Pu et al. [8] Pulmonary nodules dataset[44]
_ 0.43% 1.63% 100%
20 Exams67 Juxtapleural nodules
Wei et al [47] Lung nodule database 95.24% _ _ 100%97 ExamsJuxtapleural nodule database _ _25 Exams32 Juxtapleural nodules
Proposedmethod
LIDC dataset 97.3% 0.3% 2.4% 92.6%233 Exams406 Juxtapleural nodules
S. Shen et al. / Computers in Biology and Medicine 57 (2015) 139–149 147

for detected consolidation regions before border correction. Theproposed lung segmentation approach is being explored as part ofa novel computer-aided lung nodule detection pipeline for lungcancer screening. The screening context presents additional chal-lenges such as the presence of smaller nodules and reduced imagequality (grainier appearance of images due to the low-dose natureof image acquisitions). Preliminary exploration of low-dose studieshave shown that our proposed approach is capable of handlingthese issues. In addition, the method is generalizable to any tasksthat involve concave/convex detection. For example, in magneticresonance angiography, detection of concave/convex regions maybe able to identify and accurately segment incidental aneurysms toassess their risk of rupture.
7. Summary
Computer-aided detection and diagnosis (CAD) has been widelyinvestigated to improve radiologists' diagnostic accuracy in detect-ing and characterizing lung disease, as well as to assist with theprocessing of increasingly sizable volumes of imaging. Lung seg-mentation is a requisite preprocessing step for most CAD schemes.This paper proposes a parameter-free lung segmentation algorithmwith the aim of improving lung nodule detection accuracy, focusingon juxtapleural nodules. A bidirectional chain coding methodcombined with a support vector machine (SVM) classifier is usedto selectively smooth the lung border while minimizing the over-segmentation of adjacent regions. This automated method wastested on 233 computed tomography (CT) studies from the lungimaging database consortium (LIDC), representing 403 juxtapleuralnodules. The approach obtained a 92.6% re-inclusion rate. Segmen-tation accuracy was further validated on 10 randomly selected CTseries, finding a 0.3% average over-segmentation ratio and 2.4%under-segmentation rate when compared to manually segmentedreference standards done by an expert.
Acknowledgements
The authors would like to acknowledge Dr. Sutida Singharuksafor her assistance in the evaluation of the proposed method. Thisresearch is supported in part by the Center for Domain-SpecificComputing (CDSC) funded by the NSF Expedition in ComputingAward CCF-0926127.
References
[1] Shu Ling Alycia Lee, Abbas Z. Kouzani, J. Hu. Eric, Automated detection of lungnodules in computed tomography images: a review, Mach. Vis. Appl. 23 (1)(2012) 151–163.
[2] Denise R. Aberle, et al., Reduced lung-cancer mortality with low-dosecomputed tomographic screening, N. Engl. J. Med. 365 (5) (2011) 395–409.
[3] Screening for lung cancer. ⟨http://www.lungcancer.org/find_information/publications/163-lung_cancer_101/274-screening⟩.
[4] Qiang Li, Recent progress in computer-aided diagnosis of lung nodules onthin-section CT, Comput. Med. Imag. Graph. 31 (4) (2007) 248–257.
[5] K. Marten, et al., Computer-aided detection of pulmonary nodules: influenceof nodule characteristics on detection performance, Clin. Radiol. 60 (2) (2005)196–206.
[6] Alessandra Retico, et al., Lung nodule detection in low-dose and thin-slicecomputed tomography, Comput. Biol. Med. 38 (2008) 525–534.
[7] Samuel G. Armato III, William F. Sensakovic, Automated lung segmentation forthoracic CT: impact on computer-aided diagnosis1, Acad. Radiol. 11 (9) (2004)1011–1021.
[8] Jiantao Pu, et al., Adaptive border marching algorithm: automatic lungsegmentation on chest CT images, Comput. Med. Imag. Graph. 32 (6) (2008)452–462.
[9] Ali Asem M., Ayman S. El-Baz, Farag Aly A. A novel framework for accuratelung segmentation using graph cuts, in: 4th IEEE International Symposium onBiomedical Imaging: From Nano to Macro, 2007. ISBI 2007. IEEE, 2007.
[10] Asem M. Ali, A. Aly Farag, Automatic lung segmentation of volumetric low-dose CT scans using graph cuts, Advances in Visual Computing, Springer,Berlin Heidelberg (2008) 258–267.
[11] Screening for Lung Cancer, Topic Page. U.S. Preventive Services Task Force.⟨http://www.uspreventiveservi-cestaskforce.org/uspstf/uspslung.htm⟩.
[12] L.W. Hedlund, et al., Two methods for isolating the lung area of a CT scan fordensity information, Radiology 144 (2) (1982) 353–357.
[13] Marco Das, et al., Small pulmonary nodules: effect of two computer-aideddetection systems on radiologist performance, Radiology 241 (2) (2006) 564–571.
[14] Shiying Hu, Eric A. Hoffman, Joseph M. Reinhardt, Automatic lung segmenta-tion for accurate quantitation of volumetric X-ray CT images, IEEE Trans. Med.Imag. 20 (6) (2001) 490–498.
[15] Kyongtae T. Bae, et al., Pulmonary nodules: automated detection on CT imageswith morphologic matching algorithm—preliminary results, Radiology 236 (1)(2005) 286–293.
[16] Xuejun Sun, Haibo Zhang, Huichuan Duan, 3D computerized segmentation oflung volume with computed tomography, Acad. Radiol. 13 (6) (2006) 670–677.
[17] Samuel G. Armato III, Maryellen L. Giger, Heber MacMahon, Automated lungsegmentation in digitized posteroanterior chest radiographs, Acad. Radiol. 5(4) (1998) 245–255.
[18] Matthew S. Brown, et al., Method for segmenting chest CT image data using ananatomical model: preliminary results, IEEE Trans. Med. Imag. 16 (6) (1997)828–839.
[19] Matthew S. Brown, et al., Knowledge-based segmentation of thoracic com-puted tomography images for assessment of split lung function, Med. Phys. 27(2000) 592.
[20] Jiahui Wang, Feng Li, Qiang Li, Automated segmentation of lungs with severeinterstitial lung disease in CT, Med. Phys. 36 (2009) 4592.
[21] D.-Y. Kim, et al., Pulmonary nodule detection using chest CT images, ActaRadiol. 44 (3) (2003) 252–257.
[22] Jane P. Ko, Margrit Betke, Chest CT: automated nodule detection and assess-ment of change over time—preliminary experience, Radiology 218 (1) (2001)267–273.
[23] Panayiotis Korfiatis, et al., Texture classification-based segmentation of lungaffected by interstitial pneumonia in high-resolution CT, Med. Phys. 35 (2008)5290.
[24] Mithun N. Prasad, et al., Automatic segmentation of lung parenchyma in thepresence of diseases based on curvature of ribs, Acad. Radiol. 15 (9) (2008)1173–1180.
[25] Jiantao Pu, et al., An automated CT based lung nodule detection scheme usinggeometric analysis of signed distance field, Med. Phys. 35 (2008) 3453.
[26] Sluimer Ingrid, Mathias Prokop, Bram van Ginneken, Toward automatedsegmentation of the pathological lung in CT, IEEE Trans. Med. Imag. 24 (8)(2005) 1025–1038.
[27] Hua, Panfang, et al., Segmentation of pathological and diseased lung tissue inCT images using a graph-search algorithm, in: IEEE International Symposiumon Biomedical Imaging: from Nano to Macro, 2011.
[28] Shanhui Sun, Christian Bauer, Reinhard Beichel, Automated 3-D segmentationof lungs with lung cancer in CT data using a novel robust active shape modelapproach, IEEE Trans. Med. Imag. 31 (2) (2012) 449–460.
[29] Eva M. van Rikxoort, et al., Automatic lung segmentation from thoraciccomputed tomography scans using a hybrid approach with error detection,Med. Phys. 36 (2009) 2934.
[30] Colin Jacobs, et al., Computer-aided detection of ground glass nodules inthoracic CT images using shape, intensity and context features (Medical ImageComputing and Computer-Assisted Intervention–MICCAI 2011), Springer,Berlin Heidelberg (2011) 207–214.
[31] Tan Maxine, et al., A novel computer-aided lung nodule detection system forCT images, Med. Phys. 38 (10) (2011) 5630–5645.
[32] Temesguen Messay, Russell C. Hardie, K. Rogers Steven, A new computation-ally efficient CAD system for pulmonary nodule detection in CT imagery, Med.Image. Anal. 14 (3) (2010) 390–406.
[33] Keelin Murphy, et al., A large-scale evaluation of automatic pulmonary noduledetection in chest CT using local image features and k-nearest-neighbourclassification, Med. Image. Anal. 13 (5) (2009) 757–770.
[34] Alessandra Retico, et al., Lung nodule detection in low-dose and thin-slicecomputed tomography, Comput. Biol. Med. 38 (4) (2008) 525–534.
[35] Alessandro Riccardi, et al., Computer-aided detection of lung nodules via 3Dfast radial transform, scale space representation, and Zernike MIP classifica-tion, Med. Phys. 38 (4) (2011) 1962–1971.
[36] Wook-Jin Choi, Tae-Sun Choi, Genetic programming-based feature transformand classification for the automatic detection of pulmonary nodules oncomputed tomography images, Inf. Sci. 212 (2012) 57–78.
[37] Xujiong Ye, et al., Shape-based computer-aided detection of lung nodules inthoracic CT images, IEEE Trans. Biomed. Eng. 56 (7) (2009) 1810–1820.
[38] National Cancer Institute, Lung Image Database Consortium ⟨http://imaging.cancer.gov/programsandresources/-InformationSystems/LIDC/page2⟩.
[39] Nobuyuki Otsu, A threshold selection method from gray-level histograms,Automatica 11 (285–296) (1975) 23–27.
[40] Rafael C. Gonzalez, E. Woods Richard, Digital Image Processing, second ed.,Publishing House of Electronics Industry, Beijing, 2002.
[41] Michael F. McNitt-Gray, et al., The Lung Image Database Consortium (LIDC)data collection process for nodule detection and annotation, Acad. Radiol. 14(12) (2007) 1464–1474.
[42] P.R. Varshini, S. Baskar, S. Alagappan, An improved adaptive border marchingalgorithm for inclusion of juxtapleural nodule in lung segmentation of CT-
S. Shen et al. / Computers in Biology and Medicine 57 (2015) 139–149148

images, Wireless Networks and Computational Intelligence, Springer, BerlinHeidelberg (2012) 230–235.
[43] Magalhães Barros Netto, Stelmo, et al., Automatic segmentation of lungnodules with growing neural gas and support vector machine, Comput. Biol.Med. 42 (11) (2012) 1110–1121.
[44] Geoffrey D. Rubin, et al., Pulmonary nodules on multi-detector row CT scans:performance comparison of radiologists and computer-aided detection, Radi-ology 234 (1) (2005) 274–283.
[45] Ray A. Jarvis, On the identification of the convex hull of a finite set of points inthe plane, Inf. Process. Lett. 2.1 (1973) 18–21.
[46] Wook-Jin Choi, Tae-Sun Choi, Automated pulmonary nodule detection systemin computed tomography images: a hierarchical block classification approach,Entropy 15 (2) (2013) 507–523.
[47] Ying Wei, Guo Shen, Juan-Juan Li, A fully automatic method for lungparenchyma segmentation and repairing, J. Dig. Imag. 26 (3) (2013) 483–495.
S. Shen et al. / Computers in Biology and Medicine 57 (2015) 139–149 149