An Automated Indications and Warning System for Enhanced ...
14
An Automated Indications and Warning System for Enhanced Space Domain Awareness Navraj Singh * , Jacob Brannum, Alex Ferris, Joshua Horwood, Holly Borowski, Jeff Aristoff Numerica Corporation, 5042 Technology Parkway, Suite 100, Fort Collins, CO 80528 ABSTRACT Automated indications and warning (I&W) regarding abnormal events in space are needed help ensure the safety of all orbiting spacecraft. Such events may include maneuvers, attitude changes, breakups, conjunctions, and proximity operations. In this paper, we demonstrate an I&W capability using recent real-world events in which the Numerica Telescope Network (NTN) I&W analytics pipeline generated such automated alerts. 1. INTRODUCTION The critical space domain awareness (SDA) mission involves the detection, tracking, identification and characterization of all Earth-orbiting objects and the prediction of events, threats, and activities in space. With the increase in new foreign launches, satellite constellations, and the number of agile or potentially separable satellites being placed in near-Earth space, it is critical that space operations analysts and satellite operators not only maintain custody of these satellites, but also quickly identify and interpret changes in their behavior. Thus, a key need for SDA is the capability to provide automated indications and warning (I&W) regarding abnormal events in space. The increasing number of satellites in space, and the many small or maneuverable objects that are difficult to track, are leading to a more congested and contested space environment, which further complicates the problem of detecting and identifying abnormal events of interest that might require follow-up courses of action. To buck this trend, Numerica has taken an active role in recent years in providing alternative solutions that free-up government resources and improve our situational awareness of the evolving space environment. In particular, for the past decade, Numerica has been developing algorithms and software to support improved SDA which involves the detection, tracking, identification, and characterization of all resident space objects. More recently, to help address the need for real-time actionable I&Ws, Numerica has developed and combined a novel set of advanced algorithms, high performance software, and a globally-distributed network of small telescopes to demonstrate a responsive deep-space tracking and I&W alerting system. As discussed in [1], data from the Numerica Telescope Network (NTN) is collected and processed in real-time via an integrated tasking, collection, processing, dissemination, and exploitation (TCPED) pipeline, in order to create and maintain an independent catalog of objects in multiple deep-space orbital regimes (e.g., GEO, GTO, MEO, and HEO). With support provided by Air Force Research Laboratory Information Directorate (AFRL/RI), Numerica has augmented this TCPED pipeline with additional analytics tools and architectural improvements in order to produce real-time I&W alerts regarding events of interest. These I&Ws currently include maneuver detection, no-show, con- junction, and photometric change detection alerts. In addition, a multi-source event correlation layer automatically determines certain types of relationships (e.g., co-occurrences) between events detected across multi-source data, which can aid in mitigating false alarms generated by a single data source. The alerts are disseminated in real-time to end users via the NTN application programming interface (API) and user interface (UI). This NTN I&W alerts service is enabled by several software components, including the Multiple Frame Assign- ment Space Tracker (MFAST) [1, 2], Athena [5], and the Kollision Risk Assessment Tool in Orbital Element Spaces (KRATOS) [3] components of the NTN pipeline. In recent years, Numerica has enhanced MFAST to produce ma- neuver alerts when a change is detected in an object’s orbital state that is inconsistent with natural orbital dynamics. These alerts contain an estimated time and delta-V associated with the maneuver. No-show alerts are produced when an object’s orbital state should have been updated using a sensor observation, but was not. A no-show alert may indi- cate an abnormal maneuver or an anomalous event, and can be used to cue sensors to search for that object. Athena * Email: [email protected], Phone: 970-207-2200 (Presenting Author) Please cite this paper as: N. Singh, J. Brannum, A. Ferris, J. Horwood, H. Borowski, and J. Aristoff, "An automated indications and warning system for enhanced space domain awareness," in Proceedings of the 2020 Advanced Maui Optical and Space Surveillance Technologies Conference, (Wailea, HI), September 2020.
Transcript of An Automated Indications and Warning System for Enhanced ...

An Automated Indications and Warning System for Enhanced Space Domain Awareness
Navraj Singh*, Jacob Brannum, Alex Ferris, Joshua Horwood, Holly Borowski, Jeff AristoffNumerica Corporation, 5042 Technology Parkway, Suite 100, Fort Collins, CO 80528
ABSTRACT
Automated indications and warning (I&W) regarding abnormal events in space are needed help ensure the safety ofall orbiting spacecraft. Such events may include maneuvers, attitude changes, breakups, conjunctions, and proximityoperations. In this paper, we demonstrate an I&W capability using recent real-world events in which the NumericaTelescope Network (NTN) I&W analytics pipeline generated such automated alerts.
1. INTRODUCTION
The critical space domain awareness (SDA) mission involves the detection, tracking, identification and characterizationof all Earth-orbiting objects and the prediction of events, threats, and activities in space. With the increase in newforeign launches, satellite constellations, and the number of agile or potentially separable satellites being placed innear-Earth space, it is critical that space operations analysts and satellite operators not only maintain custody of thesesatellites, but also quickly identify and interpret changes in their behavior. Thus, a key need for SDA is the capabilityto provide automated indications and warning (I&W) regarding abnormal events in space.
The increasing number of satellites in space, and the many small or maneuverable objects that are difficult to track, areleading to a more congested and contested space environment, which further complicates the problem of detecting andidentifying abnormal events of interest that might require follow-up courses of action. To buck this trend, Numerica hastaken an active role in recent years in providing alternative solutions that free-up government resources and improveour situational awareness of the evolving space environment. In particular, for the past decade, Numerica has beendeveloping algorithms and software to support improved SDA which involves the detection, tracking, identification,and characterization of all resident space objects. More recently, to help address the need for real-time actionableI&Ws, Numerica has developed and combined a novel set of advanced algorithms, high performance software, anda globally-distributed network of small telescopes to demonstrate a responsive deep-space tracking and I&W alertingsystem.
As discussed in [1], data from the Numerica Telescope Network (NTN) is collected and processed in real-time viaan integrated tasking, collection, processing, dissemination, and exploitation (TCPED) pipeline, in order to createand maintain an independent catalog of objects in multiple deep-space orbital regimes (e.g., GEO, GTO, MEO, andHEO). With support provided by Air Force Research Laboratory Information Directorate (AFRL/RI), Numerica hasaugmented this TCPED pipeline with additional analytics tools and architectural improvements in order to producereal-time I&W alerts regarding events of interest. These I&Ws currently include maneuver detection, no-show, con-junction, and photometric change detection alerts. In addition, a multi-source event correlation layer automaticallydetermines certain types of relationships (e.g., co-occurrences) between events detected across multi-source data,which can aid in mitigating false alarms generated by a single data source. The alerts are disseminated in real-time toend users via the NTN application programming interface (API) and user interface (UI).
This NTN I&W alerts service is enabled by several software components, including the Multiple Frame Assign-ment Space Tracker (MFAST) [1, 2], Athena [5], and the Kollision Risk Assessment Tool in Orbital Element Spaces(KRATOS) [3] components of the NTN pipeline. In recent years, Numerica has enhanced MFAST to produce ma-neuver alerts when a change is detected in an object’s orbital state that is inconsistent with natural orbital dynamics.These alerts contain an estimated time and delta-V associated with the maneuver. No-show alerts are produced whenan object’s orbital state should have been updated using a sensor observation, but was not. A no-show alert may indi-cate an abnormal maneuver or an anomalous event, and can be used to cue sensors to search for that object. Athena
*Email: [email protected], Phone: 970-207-2200 (Presenting Author)
Please cite this paper as: N. Singh, J. Brannum, A. Ferris, J. Horwood, H. Borowski, and J. Aristoff, "An automated indications and warning system for enhanced space domain awareness," in Proceedings of the 2020 Advanced Maui Optical and Space Surveillance Technologies Conference, (Wailea, HI), September 2020.

produces photometric change alerts, which can indicate a change in an object’s stabilization state, attitude, or orbitalstate. Finally, KRATOS computes miss distances and produces probabilities of collision for potential conjunctionevents, and can also be used for detecting close proximity operations.
In this paper, we demonstrate automated I&W capabilities using recent real-world data in which the NTN I&W an-alytics suite generated examples of the aforementioned alerts. Examples of scenarios discussed include detection ofabnormal maneuvers, changes in satellite stabilization mode, loss of control due to on-orbit anomalies, detection ofphotometric changes from stereo observations, and detection of correlations between multiple types of events. Thelayout of the paper is as follows. In Section 2, we provide an overview of the NTN and our I&W software compo-nents and technical approaches. In Section 3, we provide brief case studies on some recent real-world space events.Conclusions are made in Section 4.
2. TECHNICAL APPROACH
The NTN and its associated TCPED pipeline form the backbone data collection and processing infrastructure thatenables our I&W alert generation components. In this section, we begin by describing the NTN and TCPED pipeline,then provide details about each type of alert generated by the pipeline. Alert types discussed include maneuverdetection alerts, photometric change alerts, and conjunction alerts.
2.1 NTN Overview
The NTN currently spans 18 sites across 5 continents, as depicted in Fig. 1. Sites within the United States are located inCalifornia, Arizona, Colorado (two sites), New Mexico, Texas, and Hawaii. Sites outside the United States are locatedin Chile, Morocco, Spain, France, South Africa, Crete, Western Australia, South Australia (two sites), and New SouthWales Australia (two sites). Together, this layout provides 100% coverage of all deep space orbital regimes, includinggeostationary orbit (GEO), with robustness to both regional and seasonal weather. For example, each GEO satellitewill be visible from several geographically-diverse sites and by multiple co-located sensors.
The NTN consists of (i) small aperture, wide field-of-view sensors arrays, known as Argus sensors, that providepersistent coverage of a large swath of the night sky and (ii) medium aperture, fully-robotic and taskable telescopesthat provide increased detectability and resolution with a smaller field of view. In particular, the Argus sensors’persistent coverage of GEO enables change detection to generate meaningful and consistent I&Ws, which can inturn provide tipping and cueing for larger-aperture telescopes. Further, the NTN contains two daytime systems (andcounting) capable of detecting satellites in GEO during broad daylight [4]. The locations of these systems are shownin Fig. 1. Global daytime coverage by the NTN is anticipated by the end of 2021.
2.2 Indications and Warning (I&W) Analytics Pipeline Overview
The NTN I&W analytics pipeline is enabled via the integration of several components providing the following func-tions: (i) sensor tasking (NITRO); (ii) orbit determination and data association (MFAST); (iii) multi-source changedetection (Athena); (iv) pattern-of-life learning (APOLLO); and (v) conjunction assessment (KRATOS). This inte-grated pipeline is enabled by real-time feeds from a robust set of data sources, including the NTN itself, as well asthird-party data. Fig. 2 shows the high-level architecture of this I&W pipeline. Next, we describe these components.
NITRO (Numerica Intelligent Tasking and Resource Optimizer): NITRO enables maximum productivity fromsensor networks based on mission objectives. It allows operators to view more objects at the right times with theright sensors by enabling cooperative tasking and effective task prioritization. NITRO guarantees rapid revisit rates onspecified objects while still maintaining a high-quality satellite catalog. For more info on NITRO see [1].
Multiple Frame Assignment Space Tracker (MFAST): MFAST fuses astrometric data into high-quality orbits withrealistic covariances through joint orbit initiation and determination. MFAST leads the market in deep-space (optical)UCT processing in terms of the number of high-quality orbits it is able to establish, and the software has helpedthe 18th Space Control Squadron (18 SPCS) personnel recover over 1000 objects on the Lost List. MFAST alsoperforms maneuver detection, ballistic coefficient estimation (for drag and solar radiation pressure), and duplicateorbit resolution. MFAST-Maneuver-Detection (MFAST-MD) is a specific mode of MFAST that provides the maneuverdetection service, and is discussed in further detail in Section 2.3. A general discussion of MFAST is given in [2].
Athena: Athena is a suite of multi-source, multi-INT change detection tools that constitute the NTN’s change detec-tion back-end. Athena exploits multi-source, multi-INT data in order to automatically detect, correlate, and recognize

Fig. 1: Locations of Numerica Telescope Network Sensors
changes and abnormalities in multi-domain data to provide I&Ws regarding anomalies and potential threats to spaceassets. Some of Athena’s key benefits to the warfighter include (i) cross-domain I&W analytics, (ii) improved prob-abilities of detecting changes, (iii) reduced false alarm rates, and (iv) timely change detection and threat notificationand prediction. We discuss Athena in more detail in Section 2.4. For more info on Athena see [5].
Adaptive Pattern-of-Life Learning Operations (APOLLO): The APOLLO tool enables the learning of baselinepatterns-of-life of deep space satellites in an adaptive manner, leading to the generation of I&W alerts, event pre-dictions, and associated confidence measures. While Athena performs low-level change detection, APOLLO takesAthena outputs as inputs and attempts to determine if the events detected via Athena and MFAST-MD form a pat-tern, in order to ultimately detect mission-abnormal (i.e., out-of-family) behavior within appropriate contexts. Somespecific use cases of interest to the space community which are addressed by APOLLO, are: (i) adaptively learningan object’s pattern-of-life from multi-INT data, and detecting abnormalities (i.e., events inconsistent with an object’smission pattern-of-life), along with associated levels of confidence for the generated I&Ws; (ii) predicting eventsconsistent with an object’s behavior, along with associated levels of confidence; (iii) characterizing an unknown ornewly-discovered object’s behavior; and (v) performing forensic analysis on data corresponding to a detected abnor-mal event in a timely manner.
Kollision Risk Assessment Tool in Orbital Element Spaces (KRATOS): KRATOS [3] is the NTN’s primary con-junction assessment tool, which provides I&W alerts regarding potential conjunctions or close proximity operations.More details about KRATOS are provided in Section 2.5.
We now describe in more detail the three of the most mature I&W functions within the NTN analytics pipeline:MFAST-MD, Athena, and KRATOS.
2.3 MFAST-Maneuver-Detection (MFAST-MD) Overview
MFAST is Numerica’s main data fusion software product [2] that provides an autonomous multi-sensor, multi-targettracking system for space surveillance in support of uncorrelated track (UCT) resolution, breakup processing, attention-and lost-list processing, and catalog maintenance. MFAST fuses astrometric data into high-quality orbits with realisticcovariances through joint orbit initiation and orbit determination. MFAST uses Numerica’s special optimization-based formulation of the data association problem, namely the multi-frame assignment (MFA) formulation, that, whencombined with efficient complexity reduction algorithms, is well-suited for large-scale tracking problems. MFASTincludes customized algorithms for non-linear filtering, orbit determination, orbit and uncertainty propagation (includ-ing Numerica’s implicit Runge-Kutta orbital and uncertainty propagator), and advanced physics-based complexityreduction (or hypothesis gating) techniques that are used to control runtime with little loss in accuracy. Such methods
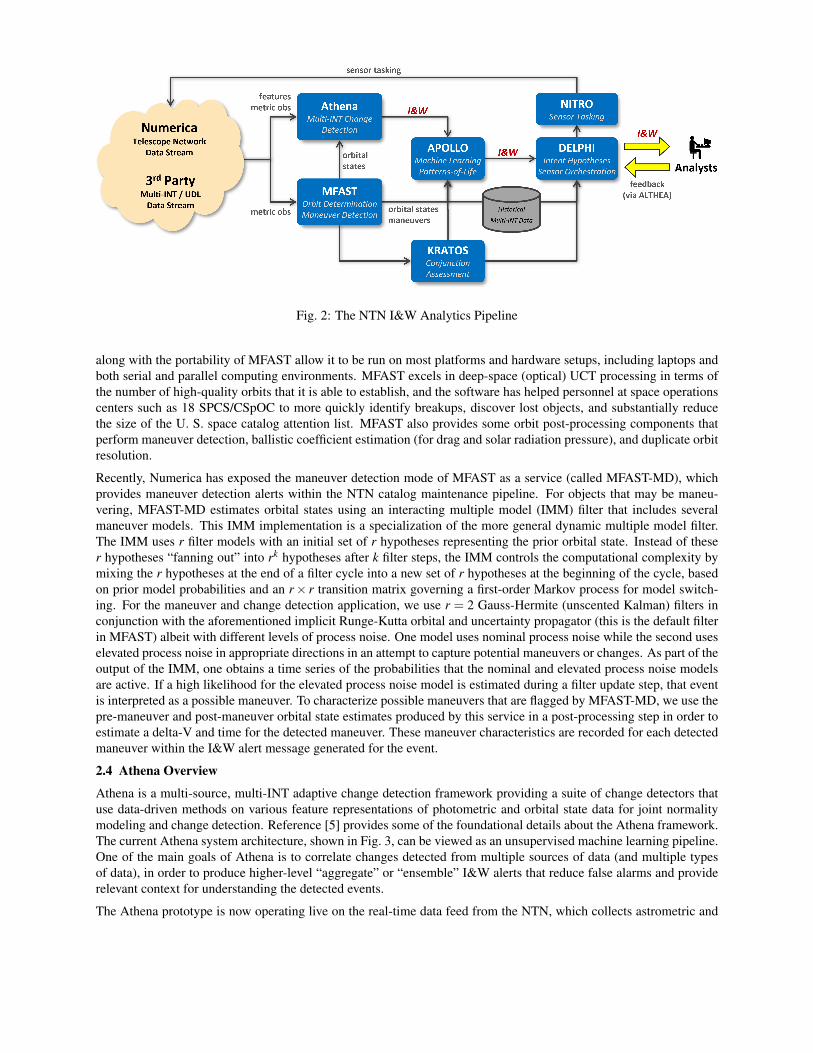
Fig. 2: The NTN I&W Analytics Pipeline
along with the portability of MFAST allow it to be run on most platforms and hardware setups, including laptops andboth serial and parallel computing environments. MFAST excels in deep-space (optical) UCT processing in terms ofthe number of high-quality orbits that it is able to establish, and the software has helped personnel at space operationscenters such as 18 SPCS/CSpOC to more quickly identify breakups, discover lost objects, and substantially reducethe size of the U. S. space catalog attention list. MFAST also provides some orbit post-processing components thatperform maneuver detection, ballistic coefficient estimation (for drag and solar radiation pressure), and duplicate orbitresolution.
Recently, Numerica has exposed the maneuver detection mode of MFAST as a service (called MFAST-MD), whichprovides maneuver detection alerts within the NTN catalog maintenance pipeline. For objects that may be maneu-vering, MFAST-MD estimates orbital states using an interacting multiple model (IMM) filter that includes severalmaneuver models. This IMM implementation is a specialization of the more general dynamic multiple model filter.The IMM uses r filter models with an initial set of r hypotheses representing the prior orbital state. Instead of theser hypotheses “fanning out” into rk hypotheses after k filter steps, the IMM controls the computational complexity bymixing the r hypotheses at the end of a filter cycle into a new set of r hypotheses at the beginning of the cycle, basedon prior model probabilities and an r× r transition matrix governing a first-order Markov process for model switch-ing. For the maneuver and change detection application, we use r = 2 Gauss-Hermite (unscented Kalman) filters inconjunction with the aforementioned implicit Runge-Kutta orbital and uncertainty propagator (this is the default filterin MFAST) albeit with different levels of process noise. One model uses nominal process noise while the second useselevated process noise in appropriate directions in an attempt to capture potential maneuvers or changes. As part of theoutput of the IMM, one obtains a time series of the probabilities that the nominal and elevated process noise modelsare active. If a high likelihood for the elevated process noise model is estimated during a filter update step, that eventis interpreted as a possible maneuver. To characterize possible maneuvers that are flagged by MFAST-MD, we use thepre-maneuver and post-maneuver orbital state estimates produced by this service in a post-processing step in order toestimate a delta-V and time for the detected maneuver. These maneuver characteristics are recorded for each detectedmaneuver within the I&W alert message generated for the event.
2.4 Athena Overview
Athena is a multi-source, multi-INT adaptive change detection framework providing a suite of change detectors thatuse data-driven methods on various feature representations of photometric and orbital state data for joint normalitymodeling and change detection. Reference [5] provides some of the foundational details about the Athena framework.The current Athena system architecture, shown in Fig. 3, can be viewed as an unsupervised machine learning pipeline.One of the main goals of Athena is to correlate changes detected from multiple sources of data (and multiple typesof data), in order to produce higher-level “aggregate” or “ensemble” I&W alerts that reduce false alarms and providerelevant context for understanding the detected events.
The Athena prototype is now operating live on the real-time data feed from the NTN, which collects astrometric and
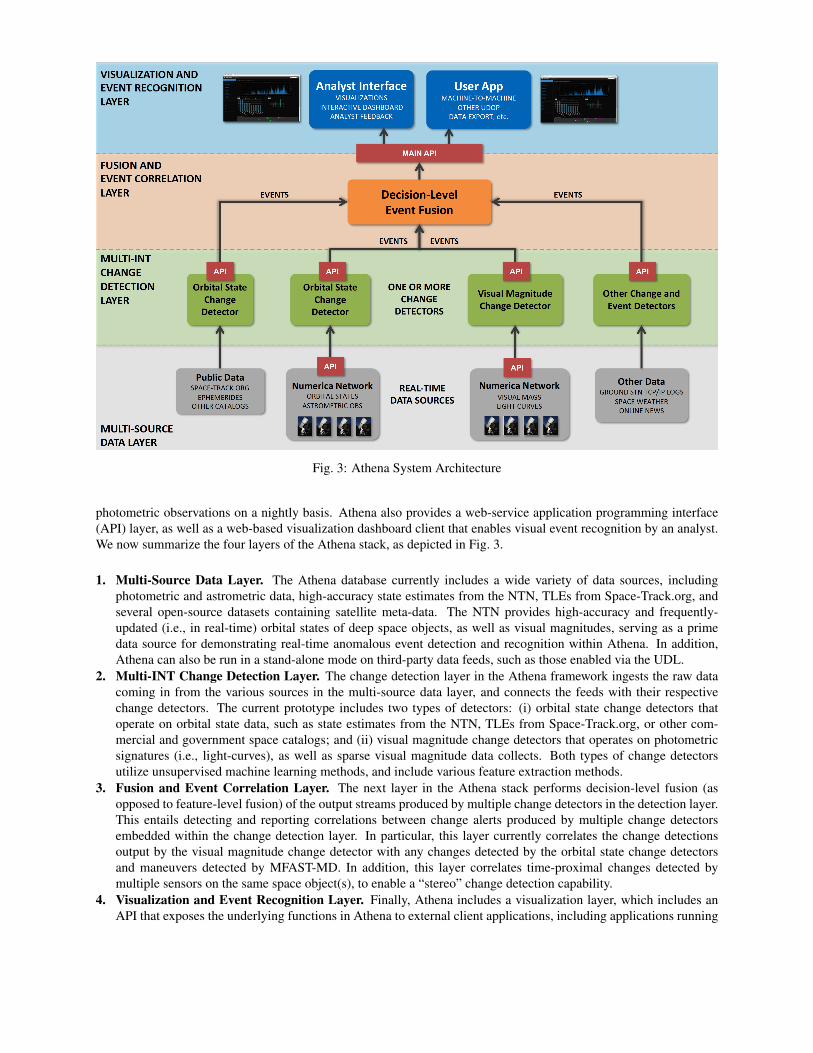
Fig. 3: Athena System Architecture
photometric observations on a nightly basis. Athena also provides a web-service application programming interface(API) layer, as well as a web-based visualization dashboard client that enables visual event recognition by an analyst.We now summarize the four layers of the Athena stack, as depicted in Fig. 3.
1. Multi-Source Data Layer. The Athena database currently includes a wide variety of data sources, includingphotometric and astrometric data, high-accuracy state estimates from the NTN, TLEs from Space-Track.org, andseveral open-source datasets containing satellite meta-data. The NTN provides high-accuracy and frequently-updated (i.e., in real-time) orbital states of deep space objects, as well as visual magnitudes, serving as a primedata source for demonstrating real-time anomalous event detection and recognition within Athena. In addition,Athena can also be run in a stand-alone mode on third-party data feeds, such as those enabled via the UDL.
2. Multi-INT Change Detection Layer. The change detection layer in the Athena framework ingests the raw datacoming in from the various sources in the multi-source data layer, and connects the feeds with their respectivechange detectors. The current prototype includes two types of detectors: (i) orbital state change detectors thatoperate on orbital state data, such as state estimates from the NTN, TLEs from Space-Track.org, or other com-mercial and government space catalogs; and (ii) visual magnitude change detectors that operates on photometricsignatures (i.e., light-curves), as well as sparse visual magnitude data collects. Both types of change detectorsutilize unsupervised machine learning methods, and include various feature extraction methods.
3. Fusion and Event Correlation Layer. The next layer in the Athena stack performs decision-level fusion (asopposed to feature-level fusion) of the output streams produced by multiple change detectors in the detection layer.This entails detecting and reporting correlations between change alerts produced by multiple change detectorsembedded within the change detection layer. In particular, this layer currently correlates the change detectionsoutput by the visual magnitude change detector with any changes detected by the orbital state change detectorsand maneuvers detected by MFAST-MD. In addition, this layer correlates time-proximal changes detected bymultiple sensors on the same space object(s), to enable a “stereo” change detection capability.
4. Visualization and Event Recognition Layer. Finally, Athena includes a visualization layer, which includes anAPI that exposes the underlying functions in Athena to external client applications, including applications running
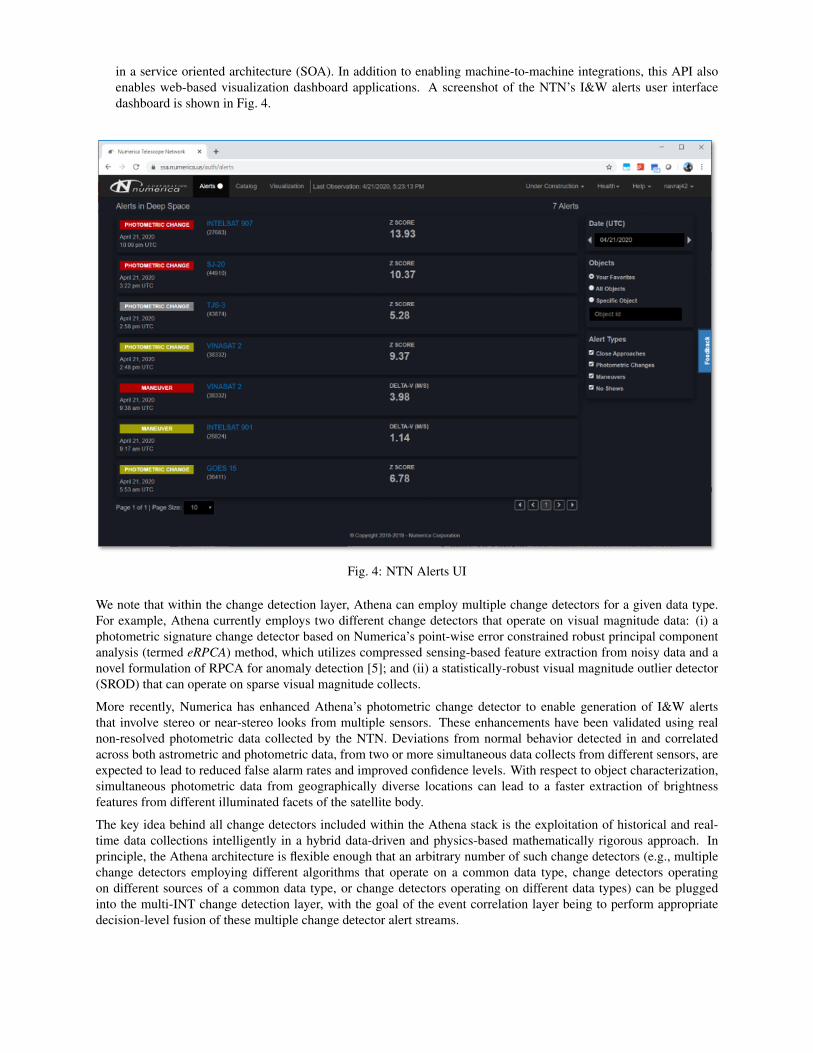
in a service oriented architecture (SOA). In addition to enabling machine-to-machine integrations, this API alsoenables web-based visualization dashboard applications. A screenshot of the NTN’s I&W alerts user interfacedashboard is shown in Fig. 4.
Fig. 4: NTN Alerts UI
We note that within the change detection layer, Athena can employ multiple change detectors for a given data type.For example, Athena currently employs two different change detectors that operate on visual magnitude data: (i) aphotometric signature change detector based on Numerica’s point-wise error constrained robust principal componentanalysis (termed eRPCA) method, which utilizes compressed sensing-based feature extraction from noisy data and anovel formulation of RPCA for anomaly detection [5]; and (ii) a statistically-robust visual magnitude outlier detector(SROD) that can operate on sparse visual magnitude collects.
More recently, Numerica has enhanced Athena’s photometric change detector to enable generation of I&W alertsthat involve stereo or near-stereo looks from multiple sensors. These enhancements have been validated using realnon-resolved photometric data collected by the NTN. Deviations from normal behavior detected in and correlatedacross both astrometric and photometric data, from two or more simultaneous data collects from different sensors, areexpected to lead to reduced false alarm rates and improved confidence levels. With respect to object characterization,simultaneous photometric data from geographically diverse locations can lead to a faster extraction of brightnessfeatures from different illuminated facets of the satellite body.
The key idea behind all change detectors included within the Athena stack is the exploitation of historical and real-time data collections intelligently in a hybrid data-driven and physics-based mathematically rigorous approach. Inprinciple, the Athena architecture is flexible enough that an arbitrary number of such change detectors (e.g., multiplechange detectors employing different algorithms that operate on a common data type, change detectors operatingon different sources of a common data type, or change detectors operating on different data types) can be pluggedinto the multi-INT change detection layer, with the goal of the event correlation layer being to perform appropriatedecision-level fusion of these multiple change detector alert streams.

Reference [5] provides a detailed description of the eRPCA approach for change detection that exploits photometricsignature (i.e., light curves). For sparse visual magnitude collects, Athena employs the SROD method, which wediscuss in more detail below.
2.4.1 Statistically-Robust Outlier Detector (SROD) for Visual Magnitude Change Detection
As mentioned above, for photometric change detection, Athena currently provides two different change detectorsthat utilize very different methodologies. The first change detector, described in [5], utilizes a Numerica-developedenhanced robust principal component analysis (eRPCA) method which utilizes compressed sensing-based feature ex-traction methods coupled with a novel formulation of RPCA for change detection. This detector is currently restrictedto operate on full light-curve datasets only. The second change detector utilizes robust outlier detection techniques tobuild a historical baseline model of photometric behavior and detects changes from new data, in a manner that doesnot require full light-curves to be collected night after night. Thus, this statistically-robust outlier detector (SROD)component of Athena can operate on sparse visual magnitude collects.
The SROD algorithmic approach is illustrated visually in Fig. 5. The top-left subplot in Fig. 5 shows visual magnitudesobserved over a span of ten days on GOES-13 (NORAD ID 29155), as a function of the signed longitudinal phaseangle. The top-right subplot shows the result of building a robust baseline model of the photometric signature fromsuch historical data. This baseline model is shown as red triangle markers in the top-right subplot of Fig. 5. Next,suppose we receive a set of new visual magnitude observations as shown in the bottom-right subplot, which overlaysthe new sequence (blue) over the baseline model (red). Visually, it is clear how the behavior of the light curve haschanged. The bottom left subplot shows an ‘anomaly score’ (specifically a modified Z-score) for each observationwithin the newly-acquired light curve. The horizontal line marks the threshold γ (in this case, γ = 4), against whichthe modified Z-scores are compared. All new observations for which the corresponding modified Z-score is greaterthan γ , are declared as outliers.
Query Recent Historical Visual Mag Data Build a Robust Baseline Model
Process Most Recent Visual Mag Data Compute Modified Z-Scores to Detect Changes
SROD Algorithm Flow
Fig. 5: Statically-Robust Outlier Detection (SROD) Method for Photometric Change Detection
2.5 KRATOS Overview
Finally, we provide a brief description of KRATOS [3], the NTN’s main conjunction assessment (CA) and probabilityof collision (PC) tool that enables rapid CA screening further into the future while reducing misdetection and false

alarm rates. Although applicable to all regimes of space, KRATOS is designed to treat objects in the challenging non-linear and non-Gaussian regimes, including situations where the velocity uncertainty is large or the encounter durationis long. Its implementation uses an adaptive framework that automatically selects the PC algorithm (e.g., Foster,Coppola, Gaussian sums) based on what assumptions are met, so that more computationally expensive techniques(i.e., Gaussian sums) are used only when needed. In short, KRATOS rivals the accuracy of Monte-Carlo methods butwith little added computational cost relative to the traditional (Foster) method.
Within the NTN, KRATOS operates as follows. Beginning with a snapshot of a NTN-generated space catalog, pre-liminary CA filtering is performed in KRATOS to determine feasible conjunctions. Next, the KRATOS PC algorithmprocesses these conjunctions, and any conjunctions involving active satellites with high PCs are flagged and alertnotification messages are produced. To substantiate the risk, the NTN can be dynamically tasked to collect new ob-servations on the flagged satellites, and the overall revisit rates can be increased. Updated orbits are produced, andKRATOS publishes updates on the time-of-closest approach, miss distance, and PC. This cycle repeats itself therebykeeping interested parties “in the loop” on the evolving conjunctions, with regular updates and supporting bodies ofevidence that can inform courses of action.
3. CASE STUDIES
We now provide some results obtained via the NTN I&W pipeline on recent real-world scenarios and events. Examplesof events described in this section include maneuvers, attitude changes, stabilization mode changes, and loss of controlevents.
3.1 Detection of Normal and Abnormal ManeuversCommon maneuvers for satellites in GEO include North-South and East-West station keeping maneuvers, and start-drift or stop-drift maneuvers used to change the satellite’s longitude station within the GEO belt. Of these three typesof maneuvers, North-South station keeping maneuvers are most commonly identified automatically using MFAST-MD, because their delta-V is sufficiently large that the satellite’s trajectory does not match natural dynamics well.Satellites in GEO orbits tend to drift in inclination unless routine inclination change maneuvers are conducted. Anexample of such a North-South station keeping maneuver detected by MFAST-MD is shown in Fig. 6. The plot showsevolution of the inclination of object 39122, clearly indicating an inclination change maneuver conducted to bring theinclination closer to zero degrees. MFAST-MD also estimates the maneuver time (shown as a vertical line in Fig. 6)and a maneuver delta-V (estimated to be 4.2 m/s in the direction normal to the orbital plane for this maneuver).
The NTN pipeline routinely detects such station-keeping maneuvers. Although currently the I&W pipeline producesalert notifications for all such maneuvers detected, a nominal maneuver characterization is included in the alert mes-sage which allows end-users and analysts to potentially ignore events which are characterized as routine events.
Start- and stop-drift maneuvers in GEO often require a large delta-V in the in-track direction. Allowing maneuvers thislarge directly within nominal MFAST-MD processing could lead to unwanted cross-tagging; hence, start- and stop-drift maneuvers are treated during automated post-processing via subsequent MAST-MD runs with alternate maneuvermodels. In this post-processing step, maneuver details are estimated and maneuver alerts are automatically produced.Fig. 7 shows an example of maneuver alerts generated for object 40258, an object that performs frequent GEO slotchange maneuvers. Fig. 7 shows the times for all maneuvers whose estimated delta-V is greater than 2 m/s. Thesemaneuver estimates were automatically generated in MFAST-MD. The majority of detected maneuvers align with astart-drift or stop-drift maneuver, as indicated by the changes occurring in the object’s longitude position within theGEO belt around the times of the detected maneuvers.
3.2 Detection of a Stabilization Mode ChangePhotometric changes can be used to identify a number of different types of events, including breakup events, changesto satellites’ stabilization states, and some types of maneuvers.
The first case we consider is the detection of a stabilization mode change, taking GOES-13 (29155) as a case to study.The reader was presented a first glimpse of a change detection result for this object in Fig. 5, where we used this testcase to illustrate the SROD algorithm description. Fig. 8 shows the performance of SROD on visual magnitude datacollected by the NTN on GOES-13 during the night of 3/21/18. The top subplot of Fig. 8 shows light curves beforeand after the mode change event. The bottom subplot shows modified Z-scores obtained for each track of observationsseen on the night of 3/21/18.

Property of Numerica
Fig. 6: EUTE 117 WEST (39122) Inclination vs. Time with an Automatically Generated Maneuver Alert
Property of Numerica
Fig. 7: Longitude vs. Time for Object 40258 Shown Along with Detected Maneuver Events
Any track for which the modified Z-score is higher than a threshold (four in this case) is highlighted in the topsubplot (as the circular markers with a black boundary). Fig. 8 shows that the algorithm successfully identifies visualmagnitude measurements that stray from the baseline model. The SROD component generates alert messages fortracks whose visual magnitudes exhibit a modified Z-score value that is higher than 4, when compared to the localphase angle bin. These results indicate successful identification of a photometric change.
A Lomb-Scargle periodogram analysis for light curves obtained before and after the detected change, shown in Fig. 9,confirms the nature of the change in the spin mode for GOES-13. Numerica independently confirmed that this modechange into a spin state was an intentional action carried out by GOES-13 owners/operators during the process ofretiring the satellite. Note that the periodogram analysis was not performed as part of the SROD change detectionalgorithm, illustrating the possibility of performing robust change detection without needing to fully characterize anobject’s behavior, which may not be possible to derive from sparse visual magnitude collections.
3.3 Detection of an On-Orbit Loss of Control
Another type of event that could potentially be detected via changes seen in photometry is a loss of control of a GEOdue to an anomaly. For example on 4/8/2019, the propulsion system of INTELSAT 29E (NORAD ID 41308) suffereda fuel leak which caused the satellite to start drifting. The results of running Athena’s photometric change detectors onobservations surrounding this event are shown in Fig. 10. The figure shows a baseline set of observations seen prior tothe event, as well as the post-event tracks of observations that triggered I&W alerts to be generated. As can be seen,significant change in the photometry is detected in the post-event data. The first change detections are generated at

Fig. 8: SROD Photometric Change Detector Results on GOES-13 After Stabilization Mode Change
Fig. 9: Lomb-Scargle Periodograms for GOES-13 Light Curves Before and After Stabilization Mode Change
approximately 0608 UTC on 4/8/19. Each dot represents an individual observation, whereas the asterisks representtracks (short sequences of observations) for which an alert was triggered. Fig. 11 confirms the change by showing amore complete light curve obtained on the object after the event, on 4/11/2019.
3.4 Detection of Stereo Photometric Changes
In addition to identifying outlying visual magnitudes collected from a specific sensor, the SROD alerting tool comparesthe geographic locations of sensors producing time-proximal change detections on an RSO. Change detection alertsproduced with tracks from multiple locations are flagged as stereo alerts. To motivate the need for stereo photometryanalysis, Fig. 12 shows three GOES-16 light curves collected on the night of 12/10/17 from three different NTN sites:Colorado, New Mexico, and Chile. GOES-16 conducted a relocation campaign in GEO during a time period spanning

Property of Numerica
Baseline observations, before event (May 25 – April 8)
Observations during/after event (April 8 – 22)
Alert-triggering tracks (April 8)
Fig. 10: Detection of INTELSAT-29E Fuel Leak and Subsequent Loss of Control
Property of Numerica
Fig. 11: INTELSAT-29E Light Curves Obtained via the NTN Before/After the Fuel Leak Event
November 2017 to January 2018. All three sites indicate a change in the photometric signature (due to a knownstop-drift maneuver), significantly reducing the possibility of a false alarm due to site-specific data integrity issues. Inaddition, the differences in certain light curve features seen from the three sites as a function of the signed longitudinalphase angle are also evident. Thus, we obtain more information more quickly from the simultaneous looks comparedto a single source light curve alone. With a single source, one would have to depend on either an attitude change ora change in the viewing angle due to seasonal variation in the solar declination angle, in order to capture a similaramount of information.
Fig. 13 presents photometric data tagged in a stereo photometric change alert for GOES-16 during the stop-driftmaneuver. With information contained in an NTN alert message, we are able to differentiate between stereo andnon-stereo alerts, provide context for the alert, and analyze the circumstances leading to the alert. This allows us to

Fig. 12: GOES-16 Light Curves Collected by the Numerica Telescope Network During a Stop-Drift Maneuver
Fig. 13: SROD Results with Stereo Photometric Data on GOES-16 During the Stop-Drift Maneuver
determine under what conditions the change detector performs well and correctly identifies photometric changes, aswell as under what conditions it struggles such as when false alarms are generated or true photometric changes are notdetected.
3.5 Detection of Correlated Maneuver and Attitude Change
Often an abnormal maneuver conducted by a satellite may be accompanied by an attitude change just prior to themaneuver. Thus, correlating photometric and maneuver alerts can increase confidence that a maneuver really occurred,and can even provide an early signal that a satellite is about to maneuver. As an example, consider the GOES-16

Property of Numerica
Fig. 14: Maneuver and Attitude Change Correlation Detection: (left) GOES-16 Longitude vs. Time Before/After StartDrift Maneuver, and (right) GOES-16 Light Curves Before/After Start Drift Maneuver
relocation campaign described in the previous case study for stereo change detection. On 12/1/2017, the GOES-16satellite initiated an eastward drift (via a start-drift maneuver) with respect to its original longitude of 89.3 degreesWest. Fig. 14 shows the maneuver along with the satellite’s longitude vs. time. The maneuver time shown in thelongitude plot (left subplot) corresponds to the estimated maneuver time in an alert generated in post-processing. Ifmaneuver alerts had been live in the NTN pipeline at the time of this maneuver, this alert would have been generated viaMFAST-MD as soon as the state estimate was produced. Just prior to this maneuver, significant photometric changeswere also observed as GOES-16 changed its attitude to prepare for the maneuver. Athena’s photometric changedetection was run on observations surrounding this slot change maneuver. The photometric changes shown hereoccurred prior to the maneuver, and would have been generated immediately within the NTN pipeline if photometricalerts had been live at the time. Importantly, during such an event, the NTN pipeline (in particular, the decision-level fusion layer of Athena) also automatically correlates such low-level alerts in order to produce a higher-levelaggregate/ensemble alert that combines the low-level maneuver detection and photometric change detection alerts.Such alert correlation typically reduces false alarms and provides additional context around the events being alertedon, in order to aid follow-up courses of action.
4. CONCLUSIONS
A key need for responsive SDA is the capability to provide automated I&Ws regarding abnormal events in space. Inorder to meet this need, Numerica has augmented its NTN TCPED pipeline with additional analytics tools and archi-tectural improvements in order to produce real-time I&W alerts regarding events of interest. These I&Ws currentlyinclude maneuver detection, no-show, conjunction, and photometric change detection alerts. In addition, a multi-source event correlation layer automatically determines certain types of relationships (e.g., co-occurrences) betweenevents detected across multi-source data, which can aid in mitigating false alarms generated by a single data source. Inthis paper, we provided an overview of the technical approaches employed within this I&W pipeline and demonstratedthese I&W capabilities using recent real-world data. Examples of scenarios discussed included detection of abnormalmaneuvers, changes in satellite stabilization mode, loss of control due to on-orbit anomalies, detection of photometricchanges from stereo observations, and detection of correlations between multiple types of events.
ACKNOWLEDGEMENTS
This work was funded, in part, by two Phase II SBIRs from the Air Force Research Laboratory Information Directorate(FA8750-18-C-0028 and FA8750-19-C-0516). We also thank Carolyn Sheaff of AFRL/RI and her team for theirscientific inputs and support for this work.

REFERENCES
[1] J. Aristoff, A. Ferris, A. Larson, A. Hariri, N. Singh, J. Horwood, J. Shaddix, K. Wilson, T. Lyons, and N. Dhingra.Non-traditional data collection and exploitation for improved GEO SSA via a global network of heterogeneoussensors. In Proceedings of the 2018 Advanced Maui Optical and Space Surveillance Technologies Conference,Wailea, HI, September 2018.
[2] J. M. Aristoff, D. J. C. Beach, P. A. Ferris, J. T. Horwood, A. D. Mont, N. Singh, and A. B. Poore. MultipleFrame Assignment Space Tracker (MFAST): results on UCT processing. In Proceedings of the 2015 AIAA/AASAstrodynamics Specialist Conference, Vail, CO, August 2015. Paper AAS 15-675.
[3] J. T. Horwood, N. Singh, J. M. Aristoff, and A. Bhopale. KRATOS: Kollision Risk Assessment Tool in Or-bital Element Spaces. In Proceedings of the 2016 Advanced Maui Optical and Space Surveillance TechnologiesConference, Wailea, HI, September 2016.
[4] J. Shaddix, J. Brannum, A. Ferris, A. Hariri, A. Larson, T. Mancini, and J. Aristoff. Daytime GEO tracking with“Aquila”: Approach and results from a new ground-based SWIR small telescope system. In Proceedings of the2019 Advanced Maui Optical and Space Surveillance Technologies Conference, Wailea, HI, September 2019.
[5] N. Singh, J. T. Horwood, J. M. Aristoff, and J. Murray-Krezan. Athena: a data-driven anomaly detection andspace object classification tool for SSA. In Proceedings of the 26th AAS/AIAA Space Flight Mechanics Meeting,Napa, CA, February 2016. Paper AAS-16-447.