An Audio-Driven System For Real-Time Music Visualisation
8
An Audio-Driven System For Real-Time Music Visualisation Max Graf, Harold Chijioke Opara, Mathieu Barthet Centre for Digital Music, Queen Mary University of London Correspondence should be addressed to Max Graf ([email protected]) Disclaimer: this paper is an Author’s Accepted Manuscript, the published version is available at https://www.aes.org/e-lib/browse.cfm?elib=21091 Main reference: M. Graf, H. Chijioke Opara, and M. Barthet, ”An Audio-Driven System for Real-Time Music Visualisation,” Paper 10498, (2021 May.). © CC-BY 4.0 Abstract—Computer-generated visualisations can accom- pany recorded or live music to create novel audiovisual experiences for audiences. We present a system to streamline the creation of audio-driven visualisations based on audio feature extraction and mapping interfaces. Its architecture is based on three modular software components: backend (audio plugin), frontend (3D game-like environment), and middleware (visual mapping interface). We conducted a user evaluation comprising two stages. Results from the first stage (34 participants) indicate that music visualisations generated with the system were significantly better at complementing the music than a baseline visualisation. Nine participants took part in the second stage involving interactive tasks. Overall, the system yielded a Creativity Support Index above average (68.1) and a System Usability Scale index (58.6) suggesting that ease of use can be improved. Thematic analysis revealed that participants enjoyed the system’s synchronicity and expressive capabilities, but found technical problems and difficulties understanding the audio feature terminology. I. I NTRODUCTION Although the primary mode of consumption of music is auditory, efforts have been made to translate musical expression to other domains [1]. For people with normal or corrected-to-normal vision, visual representations can lead to deeper insights about musical expression. This work is concerned with computer-generated vi- sualisation of audio signals in a 3D visual environment. Current tools to produce music visualisations do not explicitly leverage advances made in the music infor- mation retrieval (MIR) field. We investigate methods for interactively mapping audio features (numerical data representing signal and perceptual attributes of sound/music obtained computationally) to visual objects to facilitate music visualisation. The main contributions of this work are as follows: First, we propose a method to enable users to create visualisations from audio signals routed to a digital audio workstation (DAW), and a modular software system called “Interstell.AR”, which is versatile and flexible and can be used with many game engines. Embedded in a DAW, a source can be, for example, an instrument, a singer’s voice, or a complete recording. Second, we provide design insights based on a user evaluation conducted with 34 participants that can inform the design of multimedia systems combining audio and visual modalities. As a tool to facilitate the creation of new audiovisual media, the proposed system could be of interest to musical artists, graphic designers, and VJs (visual jockeys). Applica- tions range from the production of live video-based music streaming, visuals for live music, augmented/virtual/mixed reality experiences, games, etc. Other applications include music education, e.g., to learn about musical attributes or a performer’s musical expression using visual correlates. Understanding the role of music visuals has been the object of studies in performance reception and experience and new interfaces for musical expression, some of which specifically focus on electronic music [2]. In live electronic music performance, often the gestures of performers do not provide explicit connections to the sound production mech- anisms due to the virtualisation of musical instruments (use of synthesis and digital music interfaces); accompanying visuals may be used to compensate for the lack of visible efforts from performers [3], so as to enrich the audience experience. The wide variety of timbres in recorded electronic music makes it difficult, if not impossible, for listeners to relate to existing musical instruments; by establishing connections between the auditory and visual domains, music visuals experienced while listening to an (electronic) music recording may help listeners to develop their internal imagery and associations with sounds. Compared to previous works, the proposed system uses a wide range of audio features and leverages audio engineering techniques to increase creative possibilities. Whereas related systems rely on relatively simple audio representations to create visualisations, our system supports a wide range of audio features (cf. section III-B1). Although this broad palette of audio features might be overwhelming for some novice users (as reflected in the user evaluation), the results discussed in the paper suggest that it can support creativity favourably for users, especially if they have some prior experience with audio processing. While feature-based music visualisation tools exist, they require explicit knowledge about coding (e.g. feature extraction and visualisation with Max/MSP and Jitter, Processing, etc.), whereas our system can be used by people with no coding experience. The insights from our study may thus be useful for future research in this domain. The results from the user evaluation conducted for a specific song indicate that user-generated mappings yielded a significantly higher measure of complementarity between arXiv:2106.10134v1 [cs.MM] 18 Jun 2021
Transcript of An Audio-Driven System For Real-Time Music Visualisation

An Audio-Driven System For Real-Time MusicVisualisation
Max Graf, Harold Chijioke Opara, Mathieu BarthetCentre for Digital Music, Queen Mary University of London
Correspondence should be addressed to Max Graf ([email protected])
Disclaimer: this paper is an Author’s AcceptedManuscript, the published version is available athttps://www.aes.org/e-lib/browse.cfm?elib=21091Main reference: M. Graf, H. Chijioke Opara, and M.Barthet, ”An Audio-Driven System for Real-Time MusicVisualisation,” Paper 10498, (2021 May.).© CC-BY 4.0
Abstract—Computer-generated visualisations can accom-pany recorded or live music to create novel audiovisualexperiences for audiences. We present a system to streamlinethe creation of audio-driven visualisations based on audiofeature extraction and mapping interfaces. Its architectureis based on three modular software components: backend(audio plugin), frontend (3D game-like environment), andmiddleware (visual mapping interface). We conducted a userevaluation comprising two stages. Results from the first stage(34 participants) indicate that music visualisations generatedwith the system were significantly better at complementingthe music than a baseline visualisation. Nine participants tookpart in the second stage involving interactive tasks. Overall,the system yielded a Creativity Support Index above average(68.1) and a System Usability Scale index (58.6) suggestingthat ease of use can be improved. Thematic analysis revealedthat participants enjoyed the system’s synchronicity andexpressive capabilities, but found technical problems anddifficulties understanding the audio feature terminology.
I. INTRODUCTION
Although the primary mode of consumption of musicis auditory, efforts have been made to translate musicalexpression to other domains [1]. For people with normalor corrected-to-normal vision, visual representations canlead to deeper insights about musical expression.
This work is concerned with computer-generated vi-sualisation of audio signals in a 3D visual environment.Current tools to produce music visualisations do notexplicitly leverage advances made in the music infor-mation retrieval (MIR) field. We investigate methodsfor interactively mapping audio features (numerical datarepresenting signal and perceptual attributes of sound/musicobtained computationally) to visual objects to facilitatemusic visualisation. The main contributions of this workare as follows: First, we propose a method to enable usersto create visualisations from audio signals routed to adigital audio workstation (DAW), and a modular softwaresystem called “Interstell.AR”, which is versatile and flexibleand can be used with many game engines. Embedded ina DAW, a source can be, for example, an instrument, asinger’s voice, or a complete recording. Second, we providedesign insights based on a user evaluation conducted with
34 participants that can inform the design of multimediasystems combining audio and visual modalities.
As a tool to facilitate the creation of new audiovisualmedia, the proposed system could be of interest to musicalartists, graphic designers, and VJs (visual jockeys). Applica-tions range from the production of live video-based musicstreaming, visuals for live music, augmented/virtual/mixedreality experiences, games, etc. Other applications includemusic education, e.g., to learn about musical attributes ora performer’s musical expression using visual correlates.
Understanding the role of music visuals has been theobject of studies in performance reception and experienceand new interfaces for musical expression, some of whichspecifically focus on electronic music [2]. In live electronicmusic performance, often the gestures of performers do notprovide explicit connections to the sound production mech-anisms due to the virtualisation of musical instruments (useof synthesis and digital music interfaces); accompanyingvisuals may be used to compensate for the lack of visibleefforts from performers [3], so as to enrich the audienceexperience. The wide variety of timbres in recordedelectronic music makes it difficult, if not impossible, forlisteners to relate to existing musical instruments; byestablishing connections between the auditory and visualdomains, music visuals experienced while listening to an(electronic) music recording may help listeners to developtheir internal imagery and associations with sounds.
Compared to previous works, the proposed systemuses a wide range of audio features and leverages audioengineering techniques to increase creative possibilities.Whereas related systems rely on relatively simple audiorepresentations to create visualisations, our system supportsa wide range of audio features (cf. section III-B1). Althoughthis broad palette of audio features might be overwhelmingfor some novice users (as reflected in the user evaluation),the results discussed in the paper suggest that it cansupport creativity favourably for users, especially if theyhave some prior experience with audio processing. Whilefeature-based music visualisation tools exist, they requireexplicit knowledge about coding (e.g. feature extractionand visualisation with Max/MSP and Jitter, Processing,etc.), whereas our system can be used by people with nocoding experience. The insights from our study may thusbe useful for future research in this domain.
The results from the user evaluation conducted for aspecific song indicate that user-generated mappings yieldeda significantly higher measure of complementarity between
1
arX
iv:2
106.
1013
4v1
[cs
.MM
] 1
8 Ju
n 20
21
Graf, Opara and Barthet An Audio-Driven System For Real-Time Music Visualisation
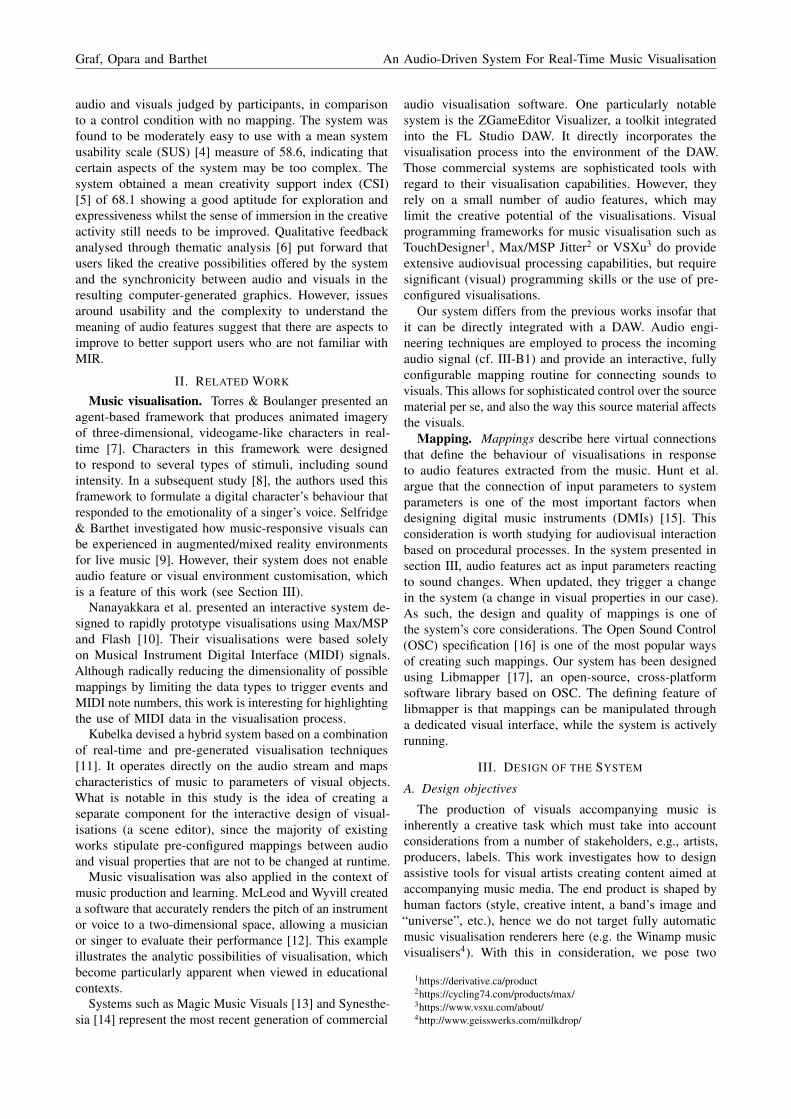
audio and visuals judged by participants, in comparisonto a control condition with no mapping. The system wasfound to be moderately easy to use with a mean systemusability scale (SUS) [4] measure of 58.6, indicating thatcertain aspects of the system may be too complex. Thesystem obtained a mean creativity support index (CSI)[5] of 68.1 showing a good aptitude for exploration andexpressiveness whilst the sense of immersion in the creativeactivity still needs to be improved. Qualitative feedbackanalysed through thematic analysis [6] put forward thatusers liked the creative possibilities offered by the systemand the synchronicity between audio and visuals in theresulting computer-generated graphics. However, issuesaround usability and the complexity to understand themeaning of audio features suggest that there are aspects toimprove to better support users who are not familiar withMIR.
II. RELATED WORK
Music visualisation. Torres & Boulanger presented anagent-based framework that produces animated imageryof three-dimensional, videogame-like characters in real-time [7]. Characters in this framework were designedto respond to several types of stimuli, including soundintensity. In a subsequent study [8], the authors used thisframework to formulate a digital character’s behaviour thatresponded to the emotionality of a singer’s voice. Selfridge& Barthet investigated how music-responsive visuals canbe experienced in augmented/mixed reality environmentsfor live music [9]. However, their system does not enableaudio feature or visual environment customisation, whichis a feature of this work (see Section III).
Nanayakkara et al. presented an interactive system de-signed to rapidly prototype visualisations using Max/MSPand Flash [10]. Their visualisations were based solelyon Musical Instrument Digital Interface (MIDI) signals.Although radically reducing the dimensionality of possiblemappings by limiting the data types to trigger events andMIDI note numbers, this work is interesting for highlightingthe use of MIDI data in the visualisation process.
Kubelka devised a hybrid system based on a combinationof real-time and pre-generated visualisation techniques[11]. It operates directly on the audio stream and mapscharacteristics of music to parameters of visual objects.What is notable in this study is the idea of creating aseparate component for the interactive design of visual-isations (a scene editor), since the majority of existingworks stipulate pre-configured mappings between audioand visual properties that are not to be changed at runtime.
Music visualisation was also applied in the context ofmusic production and learning. McLeod and Wyvill createda software that accurately renders the pitch of an instrumentor voice to a two-dimensional space, allowing a musicianor singer to evaluate their performance [12]. This exampleillustrates the analytic possibilities of visualisation, whichbecome particularly apparent when viewed in educationalcontexts.
Systems such as Magic Music Visuals [13] and Synesthe-sia [14] represent the most recent generation of commercial
audio visualisation software. One particularly notablesystem is the ZGameEditor Visualizer, a toolkit integratedinto the FL Studio DAW. It directly incorporates thevisualisation process into the environment of the DAW.Those commercial systems are sophisticated tools withregard to their visualisation capabilities. However, theyrely on a small number of audio features, which maylimit the creative potential of the visualisations. Visualprogramming frameworks for music visualisation such asTouchDesigner1, Max/MSP Jitter2 or VSXu3 do provideextensive audiovisual processing capabilities, but requiresignificant (visual) programming skills or the use of pre-configured visualisations.
Our system differs from the previous works insofar thatit can be directly integrated with a DAW. Audio engi-neering techniques are employed to process the incomingaudio signal (cf. III-B1) and provide an interactive, fullyconfigurable mapping routine for connecting sounds tovisuals. This allows for sophisticated control over the sourcematerial per se, and also the way this source material affectsthe visuals.
Mapping. Mappings describe here virtual connectionsthat define the behaviour of visualisations in responseto audio features extracted from the music. Hunt et al.argue that the connection of input parameters to systemparameters is one of the most important factors whendesigning digital music instruments (DMIs) [15]. Thisconsideration is worth studying for audiovisual interactionbased on procedural processes. In the system presented insection III, audio features act as input parameters reactingto sound changes. When updated, they trigger a changein the system (a change in visual properties in our case).As such, the design and quality of mappings is one ofthe system’s core considerations. The Open Sound Control(OSC) specification [16] is one of the most popular waysof creating such mappings. Our system has been designedusing Libmapper [17], an open-source, cross-platformsoftware library based on OSC. The defining feature oflibmapper is that mappings can be manipulated througha dedicated visual interface, while the system is activelyrunning.
III. DESIGN OF THE SYSTEM
A. Design objectives
The production of visuals accompanying music isinherently a creative task which must take into accountconsiderations from a number of stakeholders, e.g., artists,producers, labels. This work investigates how to designassistive tools for visual artists creating content aimed ataccompanying music media. The end product is shaped byhuman factors (style, creative intent, a band’s image and“universe”, etc.), hence we do not target fully automaticmusic visualisation renderers here (e.g. the Winamp musicvisualisers4). With this in consideration, we pose two
1https://derivative.ca/product2https://cycling74.com/products/max/3https://www.vsxu.com/about/4http://www.geisswerks.com/milkdrop/
2

Graf, Opara and Barthet An Audio-Driven System For Real-Time Music Visualisation
design objectives (DO); DO1: The system should allowmusic producers and visual artists to create responsivevisualisations based on the sonic and musical attributesfrom individual musical instruments, groups of instruments,or the mix as a whole. DO2: The system should be intuitive- the process of creating mappings should be mainly visual,without extensive need of coding.
B. Implementation
1) Backend - audio plugin: The backend is a DAW audioplugin implemented in C++ using the JUCE framework[18]. Its central task is audio feature extraction. Basedfeature extraction review by Moffat et al. [19], we used theEssentia software library [20], as it can run in real-timeand offers a large number of audio features, giving usersa broad palette of possible starting points for their desiredvisualisations with the system. By applying the pluginto one or more tracks, an arbitrary number of backendinstances can be connected to the mapping space. Thisprovides the flexibility required by DO1. In the following,we give a detailed explanation of the different aspects ofthe backend component.
Feature extraction: Feature extraction is at the core ofthe plugin. Several audio features are computed globally,i.e. for whole, unfiltered chunks of incoming audio signals:
Loudness is an important aspect of musical expression.It provides an empirical estimate for the perceived intensityof a sound. Given that rhythmic elements can be containedin the source material, it can be employed to translate thepulse of a musical piece to periodic movements in thevisualisations, for example.
Pitch is computed using the YIN algorithm [21]. It isone of the central features that allow listeners to distinguishbetween different components in music. In certain contextsit implicitly conveys aspects of emotionality [22]. Thisfeature is most useful when the plugin is applied to isolatedsource material, such as an instrument or a vocal part.
The spectral centroid, a signal descriptor modeling thebrightness perceptual attribute of a sound. It represents thefrequency spectrum barycenter and has been shown to bean important correlate of timbral variations used to conveymusical expression [23].
A simple onset detection system, based on the high-frequency content algorithm [24] is included. Its purposeis to recognise rapid changes in the music to identify theonset of notes or percussive instruments, which can bemapped to visual attributes.
Lastly, the sensory dissonance of the signal is includedin the global calculations. It measures the tension resultingfrom instrumental tones at a given point in time, based onthe spectral peaks of the audio signal.
Sub-bands: In order to support DO1, the systemprovides an option to split the incoming audio signal intoup to three frequency sub-bands. These are created usingsecond-order low- and high-pass filters respectively. Eachsub-band provides a number of feature slots, which allowsfor the injection of feature-computing algorithms into thegiven band. This is useful when the audio is a mix ofseveral elements, e.g., a complete song. sub-bands allow
Fig. 1. Screenshot of the backend GUI
the user to isolate certain parts of the signal, for examplethe bass on one end of the frequency spectrum and drumcymbals on the other end.
Automatables: To extend the range of possible map-pings, we also incorporate user-controllable metadata intothe data stream. They allow users to create mappingscontrolling visualisations independently of the audio fea-ture data. By utilising a feature provided by libmapper,automatables can be combined with other mappings. Thisgives users fine-grained control over the way a given audiosignal affects a visual property.
Graphical user interface: A GUI was created to visu-alise audio feature numerical data computed by the pluginand provide control over the sub-bands and automatables.Figure 1 shows a screenshot of the backend GUI.
2) Frontend - visualisations: The Unity5 platform wasselected to create the frontend due to its accessibility,extensibility as well as its potential to function on virtualand mixed reality devices. The frontend is designed so thatthe visualisation engine is not bound to a specific platform.A software interface was created to integrate libmapper intothe Unity platform. This template serves as the base classfor all visual components that send or receive libmappersignals.
3) Middleware - libmapper: The third cornerstone ofthe system is the mapping framework. Mappings betweenaudio features and visual objects can be pre-configured,but also changed at runtime. This facilitates the creation ofnew roles in the context of audiovisual performances, asimagined by Bain [25]. Libmapper offers a visual interfacewith detailed views of signals and their connections. Tosupport DO2, we employ this browser-based GUI to makedesigning dataflows from the frontend to the backenda fully visual experience that does not require codingskills. For users with basic coding skills, it offers thepossibility to apply mathematical operations to signals. For
5https://unity.com/
3

Graf, Opara and Barthet An Audio-Driven System For Real-Time Music Visualisation
the majority of audio features extracted by the backendengine, different characteristics of instruments, performers’musical expression and mix audio qualities will createdifferences in the numerical values output by the system.By applying operations to the data passing through theconnections, signals can be tailored to an intended rangeor subjected to linear or non-linear transformations, forexample.
IV. EVALUATION
A. Procedure
We conducted an online study to evaluate the prototype.It was structured into two tasks. Task 1 involved theobservation and commentary of music videos showingvisualisations produced by the system. Participants wereasked to rate how well the visuals complemented the musicin the videos by rating their agreement level to a 10-point Likert item (from “not well at all” to “extremelywell”). They were also asked to verbally describe positiveand negative aspects of the visualisations. Task 1 had asuggested time limit of 15 minutes.
Task 2 of the study was an interactive user test.Participants were instructed to install the software ontheir own devices and completed a series of subtaskswith the system, using a provided electronic music track.Subtasks included connecting certain audio features fromthe backend to certain visual properties of the frontend, aswell as experimenting with the system on their own. Fortask 2, we suggested a time limit of 45 minutes. Pleaserefer to section VIII-B for a full list of the survey questions.
B. Methods
To assess the visualisation capabilities of the system,we tested the following hypothesis: “Visuals based onaudio-driven mappings generated by users complement themusic better than visuals that do not react to the music.”.We designed a three-dimensional scene for the frontendthat served as the foundation of mappings for the userevaluation. Figure 2 shows a screenshot of this scene. Alink to music videos generated with the system is includedin section VIII-A. We recorded three music videos withvisualisations produced by the system for a one-minutelong song. The song consists of a hip-hop style drumbeat, as well as several synthesizer elements for bass andlead sounds. Baseline automated graphic animations areincorporated into the visualisations for all three videos (e.g.slight movements of the stars). A music video only showingbaseline animations with no audio-reactive mapping wasused as control condition (M0). Two of the authors createdmappings for the song independently. The mappings wereadded to the baseline animations provided in the controlcondition (M0) and yielded the two audio-driven mappingconditions, M1 and M2. The order of the three videos wasrandomised across participants.
We conducted a Friedman test [26] with the audiovisualcomplementarity as dependent variable and the mappingtype as independent variable (three levels: M0, M1, M2).A post-hoc analysis accounting for multiple comparisons
Fig. 2. A screenshot of a dynamic music visulisation generated with thefrontend by combining several AV mappings
was necessary; we used the Wilcoxon signed-rank test [27]to test differences between mapping conditions (M0-M1,M0-M2, M1-M2) by using the Bonferroni correction (thep-value significance level was 0.017 = α based on a TypeI error α = 0.05).
We also analysed participant feedback in task 1 by meansof inductive thematic analysis based on the framework byBraun and Clarke [6]. The goal was to identify commonthemes regarding positive and negative factors consideringthe three videos created for task 1 of the user study.
We conducted a separate thematic analysis for the userstudy task 2, with the goal of finding common themes andidiosyncrasies in how users interacted with the system. Weassessed the usability of the software components using theSUS [4]. It consists of a 10-item questionnaire, regardingtopics such as complexity and ease of use. Finally, weintegrated the CSI [5] into the study to assess the value ofour system as a creativity support tool. It provides questionsto measure aspects such as exploration, engagement andeffort/reward trade-off.
C. Participants
34 participants took part in the study in total. Noprerequisite skills were required for task 1. For task 2,we recruited participants who fulfilled certain softwarerequirements to be able to install the software and had basicDAW skills. Participants were recruited using departmentalmailing lists at our institution as well as through the Prolificplatform. We applied a custom prescreening while selectingparticipants, with regard to their interests (music) as well astheir academic/professional backgrounds (computer science,computing, engineering or music). However, subjects werenot prescreened in terms of their familiarity with musicvisualisation/multimedia systems specifically. Their meanage was 24.2 years (SD=5.1). 70% were male, 30% female,two did not disclose their gender. The majority of themwere from Europe or the United States. 22 of them werestudents. Task 1 was completed by all participants andTask 2 by nine participants.
V. RESULTS
A. Quantitative Evaluation
The results of the Friedman test showed a significantdifference in the audiovisual complementarity ratings of
4
Graf, Opara and Barthet An Audio-Driven System For Real-Time Music Visualisation
TABLE ISTATISTICS OF THE WILCOXON TEST FOR TASK 1
M0 - M1 M0 - M2 M1 - M2Z −3.563a −2.974a −0.705b
p (2-tailed) < 0.001 0.003 0.481aBased on negative ranks.bBased on positive ranks.
videos based on the underlying mappings, χ2(2, N =34) = 15.6, p < 0.001.
The results of the Wilcoxon signed-rank tests are listedin Table I. The results indicated significant differencesbetween M1 and M0, M2 and M0, but not between M1 andM2. Mean and interquartile range values are 4.5 (2.0−7.0)for M0, 7.1 (5.8−8.3) for M1, 6.8 (6.0−8.3) for M2. Thisshows that visuals produced with audio-driven mappingswere found to better complement the music than visualswith no audio-reactive mappings.
B. Qualitative Evaluation
1) Thematic Analysis: Thematic analysis was conductedby two coders and the results were integrated. For task1, 82 codes were extracted in total. The prevalent themesof answers obtained in task 1 were centred around theaesthetic quality of the visualisations (38 codes) and theconnections between music and visualisations (28 codes).An in-depth analysis of the themes is omitted here for spacereasons. For details, please refer to section VIII-C. Thethematic analysis for user study task 2 is concerned withparticipants’ experiences while actively using the system.The codes gathered from the answers were compiled intothe following themes (code occurence numbers are reportedin brackets):
Synchronicity (6): Overall, participants were satisfiedwith the system’s synchronicity, both in terms of latencyand mappings. One participant felt that they experiencedlow latency when attempting one of the subtasks. Partici-pants stated that “It followed the beat of the song well”,
“i could obtain a music visualization that fit the audio” and“the light object in the middle of the visualisation lightsup according to the music”. One participant experienceddelays between sound and visualisations (“Connectionissues. its a bit laggy too”).
Expressiveness (6): The majority could express theircreative intent with the system (“The loudness and onsetdetection were my most favourite features since i wasdealing with rhythmic music to test the system”). The optionto apply transformations to signals was well received. Oneparticipant stated: “Really liked the section to add equationsto the effect response”. Several participants described theiruse of mathematical operations to transform mappings(“[...] the camera movement was quite rapid but lookedwonderful after diluting doing a y = 0.5*x”, “[...] result ispretty extreme, changing the mapping function to y=0.01*xworks better.”).
Technical Issues (5): Four out of nine participantsreported technical difficulties at some point during the
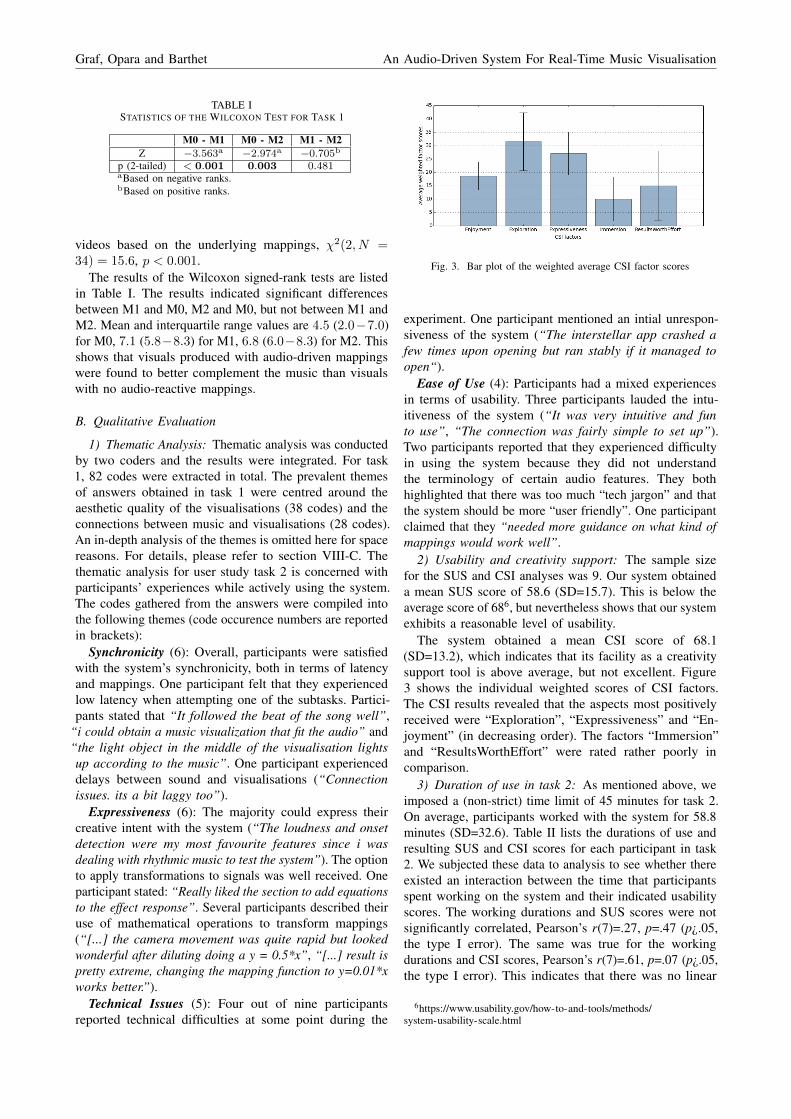
Fig. 3. Bar plot of the weighted average CSI factor scores
experiment. One participant mentioned an intial unrespon-siveness of the system (“The interstellar app crashed afew times upon opening but ran stably if it managed toopen“).
Ease of Use (4): Participants had a mixed experiencesin terms of usability. Three participants lauded the intu-itiveness of the system (“It was very intuitive and funto use”, “The connection was fairly simple to set up”).Two participants reported that they experienced difficultyin using the system because they did not understandthe terminology of certain audio features. They bothhighlighted that there was too much “tech jargon” and thatthe system should be more “user friendly”. One participantclaimed that they “needed more guidance on what kind ofmappings would work well”.
2) Usability and creativity support: The sample sizefor the SUS and CSI analyses was 9. Our system obtaineda mean SUS score of 58.6 (SD=15.7). This is below theaverage score of 686, but nevertheless shows that our systemexhibits a reasonable level of usability.
The system obtained a mean CSI score of 68.1(SD=13.2), which indicates that its facility as a creativitysupport tool is above average, but not excellent. Figure3 shows the individual weighted scores of CSI factors.The CSI results revealed that the aspects most positivelyreceived were “Exploration”, “Expressiveness” and “En-joyment” (in decreasing order). The factors “Immersion”and “ResultsWorthEffort” were rated rather poorly incomparison.
3) Duration of use in task 2: As mentioned above, weimposed a (non-strict) time limit of 45 minutes for task 2.On average, participants worked with the system for 58.8minutes (SD=32.6). Table II lists the durations of use andresulting SUS and CSI scores for each participant in task2. We subjected these data to analysis to see whether thereexisted an interaction between the time that participantsspent working on the system and their indicated usabilityscores. The working durations and SUS scores were notsignificantly correlated, Pearson’s r(7)=.27, p=.47 (p¿.05,the type I error). The same was true for the workingdurations and CSI scores, Pearson’s r(7)=.61, p=.07 (p¿.05,the type I error). This indicates that there was no linear
6https://www.usability.gov/how-to-and-tools/methods/system-usability-scale.html
5

Graf, Opara and Barthet An Audio-Driven System For Real-Time Music Visualisation
TABLE IIWORKING DURATIONS IN MINUTES (M), SUS SCORES AND CSI
SCORES FOR EACH PARTICIPANT IN TASK 2
Duration (m) SUS score CSI score PID31 30.0 52.3 934 50.0 80.0 540 60 46.0 142 67.5 76.0 845 72.5 65.6 350 62.5 67.0 260 50.0 58.3 4
105 87.5 81.0 6123 47.5 87.0 7
correlation between the time that users spent with thesystem and their given usability ratings.
C. Discussion and limitations
The results presented for task 1 of the study are limitedby the fact that only one song was used. Although theresults evidence a significant improvement compared toa baseline, future work should be conducted to assesswhether the results generalise to other songs and othergenres of music. It would also be worth comparing theproposed system against existing commercial and open-source software that can be used for computational musicvisualisation generation.
In order to improve usability, information and tutorialson audio features could be provided since most users wouldnot be familiar with MIR, psychoacoustics and musicperception (e.g., links to online support material couldbe provided in the plugin menu). Ways to simplify theaudio-visual mapping process should be investigated e.g.,by using abstractions hiding the complexity in the namingand potentially large number of audio and visual attributes,and/or interactive machine learning.
VI. CONCLUSION
We have presented a novel framework for interactivelyvisualising sound and music. To our knowledge, this isthe first system operating on the demonstrated level ofinteractivity. By enabling users to map every implementedaudio feature to every exposed visual property, a broadrange of possible visualisations is supported. We explainedthe system’s design and implementation and discussed itsapplication in various settings. The results of the quan-titative and thematic analyses showed that music videosproduced with audio-driven mappings were perceived tohave a higher audio-visual complementarity than videosshowing non audio-reactive visualisations. Future workcould address the limitation of one song for task 1 of theuser study. Analysing the audio-visual complementarityusing songs from different musical genres may increasethe explanatory power of the evaluation. The results ofthe usability and creativity support analyses showed thatthere is still room for improvement to integrate helpon technical audio features and to make the applicationless computationally expensive to reduce audiovisual lagsduring production.
VII. ACKNOWLEDGEMENTS
This work has been partly funded by the UKRI EPSRCCentre for Doctoral Training in Artificial Intelligence andMusic (AIM), under grant EP/S022694/1.
REFERENCES
[1] Olowe, I., Barthet, M., Grierson, M., and Bryan-Kinns, N., “FEATUR.UX: An approach to leveragingmultitrack information for artistic music visualization,”in Proc. Int. Conf. on Technologies for Music Notationand Representation, 2016.
[2] Correia, N. N., Castro, D., and Tanaka, A., “The roleof live visuals in audience understanding of electronicmusic performances,” in Proceedings of the 12thInternational Audio Mostly Conference on Augmentedand Participatory Sound and Music Experiences, pp.1–8, 2017.
[3] Schloss, W. A., “Using contemporary technology inlive performance: The dilemma of the performer,”Journal of New Music Research, 32(3), pp. 239–242,2003.
[4] Brooke, J., ”SUS-A quick and dirty usability scale.”Usability evaluation in industry, CRC Press, 1996,iSBN: 9780748404605.
[5] Carroll, E. A. and Latulipe, C., “The CreativitySupport Index,” in CHI ’09 Extended Abstracts onHuman Factors in Computing Systems, CHI EA ’09,p. 4009–4014, Association for Computing Machinery,New York, NY, USA, 2009, ISBN 9781605582474,doi:10.1145/1520340.1520609.
[6] Braun, V. and Clarke, V., “Using thematic anal-ysis in psychology,” Qualitative Research in Psy-chology, 3(2), pp. 77–101, 2006, doi:10.1191/1478088706qp063oa.
[7] Torres, D. and Boulanger, P., “The ANIMUS Project:A Framework for the Creation of Interactive Creaturesin Immersed Environments,” in Proceedings of theACM Symposium on Virtual Reality Software andTechnology, VRST ’03, p. 91–99, Association forComputing Machinery, New York, NY, USA, 2003,ISBN 1581135696, doi:10.1145/1008653.1008671.
[8] Taylor, R., Boulanger, P., and Torres, D., “Real-Time Music Visualization Using Responsive Imagery,”2006.
[9] Selfridge, R. and Barthet, M., “Augmented LiveMusic Performance using Mixed Reality and EmotionFeedback,” in 14th Int. Symposium on ComputerMusic Multidisciplinary Research, p. 210, 2019.
[10] Suranga Chandima Nanayakkara, Taylor, E., LonceWyse, and Ong, S. H., “Towards building an expe-riential music visualizer,” in 2007 6th Int. Conf. onInformation, Communications Signal Processing, pp.1–5, 2007, doi:10.1109/ICICS.2007.4449609.
[11] Kubelka, O., “Interactive music visualization,” Cen-tral European Seminar on Computer Graphics, 2000.
[12] Mcleod, P. and Wyvill, G., “Visualization of musicalpitch,” in In Proc. of the Computer Graphics Int., pp.300 – 303, 2003.
6

Graf, Opara and Barthet An Audio-Driven System For Real-Time Music Visualisation
[13] Color & Music LLC, “Magic Music Visuals,” 2012,https://magicmusicvisuals.com/.
[14] Gravity Current, “Synesthesia,” 2018,http://synesthesia.live/.
[15] Hunt, A., Dd, Y., Wanderley, M., and Paradis, M.,“The Importance of Parameter Mapping in ElectronicInstrument Design,” J. ofNew Music Research, 32,2002, doi:10.1076/jnmr.32.4.429.18853.
[16] Wright, M., “The Open Sound Control 1.0 Specifica-tion,” Specification, OSC, 2002.
[17] Malloch, J., Sinclair, S., and Wanderley, M. M.,“Libmapper: (A Library for Connecting Things),”in CHI ’13 Extended Abstracts on Human Fac-tors in Computing Systems, CHI EA ’13, p.3087–3090, ACM, New York, NY, USA, 2013, ISBN9781450319522, doi:10.1145/2468356.2479617.
[18] Storer, J., “JUCE: Jules’ Utility Class Extensions,”2020, https://github.com/juce-framework/JUCE.
[19] Moffat, D., Ronan, D., and Reiss, J., “An Evaluationof Audio Feature Extraction Toolboxes,” in DAFX,2015, doi:10.13140/RG.2.1.1471.4640.
[20] Bogdanov, D., Wack, N., Gomez, E., Gulati, S., Her-rera, P., Mayor, O., Roma, G., Salamon, J., Zapata, J.,and Serra, X., “ESSENTIA: An Open-Source Libraryfor Sound and Music Analysis,” in Proceedings ofthe 21st ACM Int. Conf. on Multimedia, MM ’13,p. 855–858, Association for Computing Machinery,New York, NY, USA, 2013, ISBN 9781450324045,doi:10.1145/2502081.2502229.
[21] Cheveigne, A. and Kawahara, H., “YIN, A funda-mental frequency estimator for speech and music,”The J. ofthe Acoustical Society of America, 111, pp.1917–30, 2002, doi:10.1121/1.1458024.
[22] Jaquet, L., Danuser, B., and Gomez, P., “Music andfelt emotions: How systematic pitch level variationsaffect the experience of pleasantness and arousal,”Psychology of Music, 42, pp. 51–70, 2014, doi:10.1177/0305735612456583.
[23] Barthet, M., Depalle, P., Kronland-Martinet, R., andYstad, S., “Acoustical correlates of timbre and expres-siveness in clarinet performance,” Music Perception,28(2), pp. 135–154, 2010.
[24] Masri, P. and Bateman, A., “Improved Modelling ofAttack Transients in Music Analysis-Resynthesis,” inICMC, 1996.
[25] Bain, M. N., Real Time Music Visualization: A Studyin the Visual Extension of Music, Ph.D. thesis, TheOhio State University, 2008.
[26] Friedman, M., “The Use of Ranks to Avoid theAssumption of Normality Implicit in the Analysis ofVariance,” J. ofthe American Statistical Association,32(200), pp. 675–701, 1937, doi:10.1080/01621459.1937.10503522.
[27] Wilcoxon, F., “Individual Comparisons by RankingMethods,” Biometrics Bulletin, 1(6), pp. 80–83, 1945,ISSN 00994987.
TABLE IIIQUESTIONS FOR TASK 1 OF THE SURVEY
Visualiser 1, 2 and 3 (separately for each video)What did you enjoy about the viewing experience?What did you dislike about the viewing experience?How well do you think the visualisation complemented theaudio?What are the reasons for your answer to the question above?General QuestionsWould you use a system such as Interstell.AR to producemusic visualisations and if so, in which context(s)?We want to improve Interstell.AR! Please report any ideasor recommendations you may have on how to improve theexperience and/or what you would be interested in doing withthe system.Which headphones/earphones did you use?Demographics and Personal QuestionsGender?Age?Please indicate your occupation:Please indicate your nationality:Do you have any hearing impairment? If so, please specifywhich, if you wish.Do you have any visual impairment? If so, please specifywhich, if you wish.How would you describe your experience as a musician?How would you describe your experience as an audiovisualartist?
VIII. APPENDIX
A. Links to the videos created with the system
Videos of the three conditions created for task 1 of theuser study were recorded and are available at the followinglink: https://gofile.io/d/C1kxhI.
B. Survey Questions
Tables III and IV list the survey questions for tasks 1and 2, respectively, excluding the questions of the CSI andSUS analyses.
C. Thematic analysis for task 1 of the user study
For task one, the most striking positive theme regardingthe two mapping conditions was the connection betweenmusic and visual elements. Approximately half of theoverall answers mentioned this connection (“Consistencybetween audio and visuals”, “I really enjoy the way the thevisuals represent the sounds during certain sequences”, “Ienjoyed the virtual symbiosis between the effects and music[...]”). The particle systems in the visualisation seemed tocatch participants’ interest the most. Six out of 34 answersstated their positive effect on the viewing experience (“Thetimings of the particles with the beat were perfect”, “Thefloating particles in the background, i love how they reactto the music”).
The main negative themes of the two mapping conditionswas the lack of connections between audio and visualisa-tions. More specifically, it appears that participants expectedevery visual object in the scene to be mapped to an audiofeature (“Some elements weren’t obviously mapping to asingle feature of the audio”, “I don’t each 3d object was
7

Graf, Opara and Barthet An Audio-Driven System For Real-Time Music Visualisation
TABLE IVQUESTIONS FOR TASK 2 OF THE SURVEY
SubtasksSubtask 1: Connect the overall loudness of the signal to thesize of the particles in the centre of the scene. Please commenton the audiovisual mapping process conducted with the systemand the music visualisation you obtained.Subtask 2: In this task, you will be asked to control the cameraview used in the Interstell.AR visualiser based on audio onsetfeatures. Please comment on the audiovisual mapping processconducted with the system and the music visualisation youobtained.Subtask 3: Use the system to create your own mappingby experimenting with different audio features and visualelements. Please comment on the audiovisual mapping processconducted with the system and the music visualisation youobtained. Briefly describe what audio features you chose andhow they manifested in the visual domain.General QuestionsPlease describe your experience with the audio featuresavailable in the system. What additional audio features wouldyou like to see included in the application?Do you have any other suggestions on how to further improvethe system?Did you encounter any bugs or issues while working with thesystem?
mapped to a single musical object [sic]”, “[...] I didn’tunderstand how the foggy texture related with thee [sic]music”).
Thematic analysis of the control condition led to in-teresting insights about the system in its default state,without any mappings applied. The most prevalent positivetheme was the aesthetics of the visual scene itself (“Looksvery clean”, “The mid of the picture was nice to lookat”, “Just how HD it looks”, “The imagery is calming”).These answers suggest that participants perceived the visualelements differently from the scenarios where they reactedto music, focusing more on the general appearances ofobjects.
The prevailing negative theme was the disjuncture be-tween sound and visual objects. 21 participants commentedon the stasis of the scene (“Nothing was happening in it,just repetitive”, “Didn’t feel like it reacted to the music atall”, “It seemed way too static. No movement exept forthe middle of the picture”).
8