An assessment of the freshwater environments at the ... environments at the Longbush ... while the...
45
0 An assessment of the freshwater environments at the Longbush Eco-sanctuary Prepared for the Longbush Ecological Trust, March 2015 Nga Mahi Te Taiao
Transcript of An assessment of the freshwater environments at the ... environments at the Longbush ... while the...

0
An assessment of the
freshwater environments
at the Longbush
Eco-sanctuary
Prepared for the Longbush Ecological
Trust, March 2015
Nga Mahi Te Taiao

1
Contents
Section Page Summary and discussion 3 Recommendations 4 Background History Geophysical landscape of the Waimata Valley Longbush freshwater project
5 5 6 6
Freshwater environments of Longbush ecosanctuary 8 Survey methodology Objectives Methodology background Physico-chemical water characteristics Macroinvertebrates Periphyton Macrophytes Stream habitat
10 10 10 11 11 12 15 18
March/April and August 2014 survey results Background: recent weather and water levels Survey results: physical habitat Survey results: periphyton Survey results: macrophyte growth Survey results: macroinvertebrates Survey results: physic-chemical parameters
18 18 19 23 26 27 32
References 39 Appendices 1 Longbush field reporting sheet 40 2 Macroinvertebrate species Longbush streams 42 3 Medium cf low flow conditions (Tairawhiti survey detail) 44 Figures 1 Longbush streams and wetlands 8 2 Ecosystem health as measured by periphyton (mg/m2)
(NPSFM 2014)
14 3 Indications of effects of macrophytes on periphyton and
macroinvertebrates (Matheson et al, 2012).
16 4 Provisional macrophyte abundance guidelines (Matheson et
al, 2012).
16 5 Existing and new instream plant abundance guidelines to
protect river values (Matheson et al, 2012).
17 6 Longbush streams riparian vegetation 20 7 Longbush stream form 21 8 Longbush stream substrate 22 9 Longbush stream recent sediment deposits 22 10 Longbush streams shade and streambank erosion 22 11 Longbush Streams Periphyton Enrichment Score 24 12 Visual assessment of algal biomass 24 13 Macrophyte cover Longbush upper wetland 26 14 Macroinvertebrate community indices Longbush eco-
sanctuary
28

2
15 EPT taxa and EPT animals Longbush streams 28 16 Waikereru macroinvertebrate survey results by season 30 17 Waikereru and Waitui streams MCI October 2012 to August
2014
30 18 Macroinvertebrate diversity and density in Longbush
wetlands
32 Tables 1 Periphyton assessment categories and scores (Kilroy, 2011;
Storey, 2014)
14 2 Assessment grade PES and visual Chl-a (mg/m2) 24 3 Ecosystem health as measured by periphyton (mg chl-a/m2)
(NPSFM 2014)
25 4 Interpretation of MCI scores 29 5 Overall macroinvertebrate indices 2014/15 survey period 31 6 Dominant invertebrate taxa for Longbush wetlands 32 7 Nitrate (mg N03-N/L) assessment guidelines (proposed MfE,
2013)
34 8 Physico-chemical characteristics of Longbush streams 37 9 Physico-chemical characteristics of Longbush wetlands 38
This report was produced by Murray Palmer and Amy-Rose Hardy of Nga Mahi Te
Taiao consultants for the Longbush Ecological Trust. Field work was conducted by
Murray, Claire Herbert, Vanessa Awatere Tuterangiwhaitiri, Mihi Hannah, Grant
Vincent, Cherie Te Rore and Amy-Rose Hardy. The report was reviewed by Dame
Anne Salmond.
79 Paraone Rd Gisborne Te Turanganui a Kiwa
Phone 068687133
Email [email protected]
Web www.nmtt.co.nz

3
Summary and Discussion
Surveys conducted over a period from October 2012 to January 2015, of both the
Waikereru and Waituhi streams at Longbush Eco-sanctuary, exhibit high levels of
biological value, as determined by macroinvertebrate, periphyton and physical
habitat evaluations. Similarly, physic-chemical attributes generally provide
confidence of very good water quality. Four years after removing stock access to the
Waikereru hills, and with some planting and indigenous regeneration, these streams
are now providing increasing confidence of being of a sufficiently high standard to be
utilised as ‘Reference’ sites, particularly the Waikereru stream, against which
environmental stressors may be evaluated in the wider regional riverscape context.
An example of the value of the Longbush stream sites, for instance, involved a
comparison of turbidity in the downstream Waimata River (measured at Goodwins
Rd bridge), which reached very high levels after a week of rain, while the
contribution of sediment from the Longbush catchments was hardly any greater than
the small amount transported by the streams during stable low flows. Similarly, the
stream banks beneath the restored indigenous vegetation remained intact with little
sign of erosion from the recent flood.
Relatively elevated levels of nitrates present in the regenerating bush streams at
Longbush, and their dilution during subsequent rainfall events, appear to indicate a
different process than that in pastoral farming landscapes, where rainfall is typically
associated with increased nitrate levels. The presence of large beds of periphyton
available to fix nitrogen compounds in the open farm streams, and their subsequent
removal during high flows, may at least partly explain this difference (pers com Dr
Mike Joy 2014). Similarly elevated levels of dissolved reactive phosphorous (DRP)
were also recorded at the stream sites during August 2014 and January 2015.
Further research should enhance an understanding of wider landscape
interrelationships at Longbush (soil, water, air, anthropogenic and other animal
impacts) and in similar regenerating indigenous forest settings elsewhere in the
region.
There is a concern about the perched culverts just below the stream survey sites,
which present a barrier to fish passage. Over time, the drop-offs below the culvert
outlets should be mitigated with a build-up of boulders and the creation of small
‘resting pools’ and sheltered passage, using, for instance, recycled mussel lines. In
the short term, however, there would be merit in leaving the upper streams blocked
in this way to facilitate in-situ breeding of threatened invertebrate species (e.g.
Parenthrops, koura, kerewai) and growing to maturity of threatened fish species.
This question is discussed further in the recommendations below.
Like the streams, the constructed wetlands at Longbush (two farm ponds which have
had their margins planted) do not initially appear impacted by current or historical
land use patterns. Early macroinvertebrate surveys, for example, indicated a rich
taxa diversity and trophic patterning at both sites. There is, however, current sign of
elevated phosphorous levels in the upper wetland, possibly because of the low water
level at the site over summer 2014. The wetlands are fed by an irrigation pipe from
the Waikereru stream, which in spring 2013 was turned off by the farmer who grazes

4
the site, allowing the wetland to almost dry up over the summer, and the clay base
to develop a leak (pers com Anne Salmond). Recent low water levels also appear to
be reflected in reduced macroinvertebrate taxa diversity here, and at the time of our
summer surveys (February 2014 and January 2015) there was insufficient water
present to enable water quality and biodiversity sampling to take place. Further
research will be able to identify whether this situation can be addressed by sealing
the clay base with Gisborne bentonite, and ensuring consistently higher wetland
water levels into the future.
Recommendations 1. A logical expansion of the Longbush freshwater survey program would be to
include other waterways in the Waimata catchment representative of differing
land-use environments, such as: pastoral farming, in-growth and harvested
plantation forestry, intensive mixed farming, urban and peri-urban settings, etc.
This could commence in the spring 2015 survey period if suitable sites and
funding resources are available.
2. As part of such an expanding program, the overall monitoring and survey
methodology should be reviewed in the context of ongoing regional and national
developments. This might involve collaboration with external parties, such as
NIWA, other CRI’s and universities, in particular the Te Awaroa group, and local
authorities.
3. Consider retaining the perched culverts as barriers to eel upstream migration to
the stream headwaters while the wetlands are being developed for koura and
native fish breeding (e.g. Galaxias argenteus, Giant kokopu). This would provide
an environment relatively free of predatory species and could potentially
enhance survival of these animals for breeding.
4. Review the integrity of the lining at both wetland sites, and the feasibility of
maintaining high water levels across seasons, providing optimum conditions for
threatened species habitat establishment.
5. Identify a group of sites throughout the wider catchment where remnant
populations of threatened species might be at risk of land use change (e.g.
deforestation), and thus provide candidates for breeding within the Longbush
Eco-sanctuary. Retaining genetic integrity within the Waimata river catchment is
an important consideration, particularly for the freshwater koura (Parenthrops
sp.), while the diadromous fish might be sourced from east coast sites as close as
possible to the Waimata.
6. Consider further freshwater research initiatives at Longbush, for instance:
a. Investigate the processes associated with nitrogen compounds and
particularly the presence and source of elevated nitrate levels at certain
times in indigenous forest streams.
b. Identify potential sources of Total Phosphorous (upper wetland) and
Dissolved Reactive Phosphorous (stream sites) and the potential for
ecosystem impacts and the implementation of mitigation measures.
c. Study the ecology of hill country springs at Longbush.
d. Compare high conductivity and pH levels and biological stream health
indices across the Tairawhiti Gisborne region with those elsewhere.

5
e. Quantify levels of sediment and nutrients from indigenous forest streams
compared with those from other land use settings in the Waimata River
catchment.
Background History
When the first Europeans arrived in Te Turanganui a Kiwa, the flats and foothills in
the Waimata valley were covered with managed fernlands or gardens, and with
dense lowland bush and trees in the high valleys and inland. Settlements were
located throughout the landscape, and the remains of a small unfortified village
stands on a low hill at Longbush (Pa Hill), looking up and down the Waimata River
valley.
In the mid-1860s Raharuhi Rukupo, one of the leading rangatira (chiefs) in the
district, set aside the Whataupoko block (which included Longbush) and sent men to
fetch European settlers from Hawkes Bay to establish a sheep farm on the property.
Henry Parker took up the offer and began farming sheep on the block, followed by
his brother William Parker. In 1885 the ownership of the Whataupoko No.9 block
passed to the New Zealand Native Land Settlement Company, which subdivided the
land and sold part of it to John Dunlop. From that time, the Longbush Station (3300
acres) was worked as a pastoral farm, with two families, the Donners and the
Hegartys, running the farm from 1895 to 1990.
The Hegartys created a pond below Pa Hill, and planted a stand of Italian poplars. By
1989 the surrounding hills had been cleared, leaving only a strip of lowland bush
alongside the Waimata River. This was known as Longbush, a favourite picnic spot
for local families. After the trees on the land had been felled, the slopes of the
Waimata Valley, including Longbush, became highly vulnerable to erosion. During
Cyclone Bola in 1988, there was severe slumping in the foothills, and large quantities
of sediment migrated into the Waimata River.
In 2000 when Anne and Jeremy Salmond purchased the farm, the site which has
become the Longbush Ecosanctuary was under severe ecological threat. Cattle
grazed the hills and the riverside bush, and the forest floor was barren. Garden
rubbish and other refuse
including cars were
dumped in the gullies or
beside the river.
Goodwin’s Rd Bridge GDC
monitoring site 3km
downstream of Longbush after
66.mm of rain had fallen in the
previous week. Photo M.
Palmer September 2014.
6
Over the last 14 years, however, the removal of grazing stock from the majority of
the Longbush Ecosanctuary catchments and the restoration of indigenous forest
species has transformed the nature of the landscape and the waterways flowing
through the Longbush stream catchments.
Geophysical landscape of the Waimata Valley
The underlying geology of the Waimata Valley is largely comprised of Neogene
sedimentary sandstones and siltstones, including the highly erodible mudstone
referred to locally as Papa. This type of mudstone weathers easily when exposed to
successive wetting and desiccation, a characteristic enhanced in the Gisborne
Tairawhiti region by fracturing of the rock associated with the regions position above
the confluence of the Pacific and Indo-Australian tectonic plates. Overlain on this
young substrate is a soil derived from pumice ash (referred to as Gisborne ash, or
Taupo Gravelly Ash) deposited in three showers commencing c. 1700 years ago.
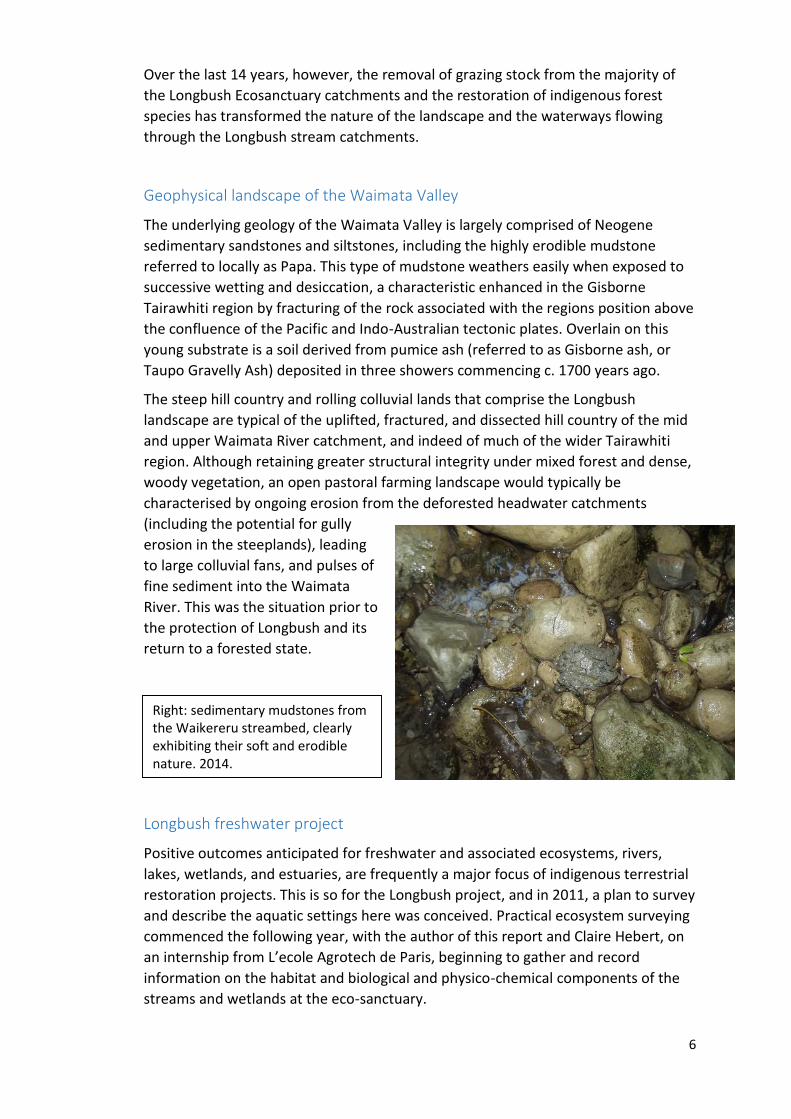
The steep hill country and rolling colluvial lands that comprise the Longbush
landscape are typical of the uplifted, fractured, and dissected hill country of the mid
and upper Waimata River catchment, and indeed of much of the wider Tairawhiti
region. Although retaining greater structural integrity under mixed forest and dense,
woody vegetation, an open pastoral farming landscape would typically be
characterised by ongoing erosion from the deforested headwater catchments
(including the potential for gully
erosion in the steeplands), leading
to large colluvial fans, and pulses of
fine sediment into the Waimata
River. This was the situation prior to
the protection of Longbush and its
return to a forested state.
Longbush freshwater project
Positive outcomes anticipated for freshwater and associated ecosystems, rivers,
lakes, wetlands, and estuaries, are frequently a major focus of indigenous terrestrial
restoration projects. This is so for the Longbush project, and in 2011, a plan to survey
and describe the aquatic settings here was conceived. Practical ecosystem surveying
commenced the following year, with the author of this report and Claire Hebert, on
an internship from L’ecole Agrotech de Paris, beginning to gather and record
information on the habitat and biological and physico-chemical components of the
streams and wetlands at the eco-sanctuary.
Right: sedimentary mudstones from the Waikereru streambed, clearly exhibiting their soft and erodible nature. 2014.

7
This program was further developed in 2013 with the assistance of funding from the
J.D. Stout Trust. The overall focus on aquatic restoration at Longbush has now
crystallised into three key components:
1. Measuring ecosystem processes and change over an extended time frame at
the Longbush streams and wetlands (initially a year, and with plans for an
ongoing program). This will provide information for the eco-sanctuary itself
and its wider terrestrial initiatives, and highlight anticipated outcomes, and
potential management and monitoring tools, for restoration projects
elsewhere.
2. Incorporating into the survey waterways from neighbouring production
landscapes, making comparisons between the impacts of varying land use
practices on aquatic health and water quality, and assessing the potential for
ecosystem improvement (National Policy Statement for Freshwater
Management 2014, NPSFM 2014).
3. Laying the ground work (water quality and habitat assessment) for
establishing Longbush as a sanctuary and nursery for threatened and
declining aquatic species, initially within the Waimata catchment, and
potentially as a regional centre. Initial species targeted include freshwater
crayfish (Koura, Paranephrops planifrons), freshwater mussels (Kakahi,
Echyridella menziesi), the Giant Kokopu (Galaxias argenteus) and, later,
Hochstetter frogs (Leiopelma hochstetteri).
To the north of the Waimata River, the steeper slopes are frequently covered in a mix
of indigenous restoration or exotic plantation forest (above left). Adjacent to the river
and to the south, the colluvial slopes and river terraces are the venue for a blend of
production activities, including pastoral farming, annual cropping, perennial
horticulture and exotic forestry (above right). Photo M. Palmer 2013.

8
Freshwater Environments of Longbush Ecosanctuary
Two first order streams on the property, Waikereru to the south and Waitui to the
north, carry water from a 54 ha catchment and a 32 ha catchment respectively. Both
of these catchments have slope gradients from Steep to Moderate (the latter at the
point of our monitoring stations, which occur near the middle of a combined
colluvial fan). A third, smaller and unvisited stream, Waihuna, traverses the
southernmost boundary of Longbush. There are also two constructed wetlands on
the property providing still water habitat: a 1600 sq metre open pond, adjacent to
the Pa site and Italian poplar plantation (the Upper Wetland), with a maximum
depth of approximately 2 metres; and a small pond of 80 sq m (Lower Wetland),
around 1.6m deep and surrounded by kanuka bush.
Figure 1 Longbush stream and wetland survey sites
Te Waikereru
Te Waitui
Upper wetland
Lower wetland

9
Above left: Waitui at the entrance to the monitoring site.
Above right: Waitui looking north from the mid-point of the monitoring site.
Above right: Waikereru looking southeast from the mid-point of our monitoring site.
Above left: Waikereru looking northwest from the mid-point.

10
Survey Methodology Objectives
The current year-long survey of the Longbush freshwater landscape is designed to:
Provide an initial assessment of the hydrology and freshwater ecology of the
Longbush Ecosanctuary as restoration initiatives here progress (including
reforestation and native bird, reptile and invertebrate breeding programs),
measuring incremental change in the context of such initiatives alongside
ecosystem responses to climatic variation;
Initiate an ongoing assessment of the state of waterways under differing land
use scenarios in the Waimata and wider Te Tairawhiti river catchments;
Help inform the management of upland waterways in production landscapes,
particularly in the Waimata River catchment;
Integrate with a wider Waimata River catchment planning and restoration
process, supported by the work of Te Awaroa and Gisborne District Council.
Background
The surveys of the Longbush streams and wetlands include water chemistry and
physical habitat assesments alongside detailed biological monitoring (periphyton,
macroinvertebrates, macrophytes and fish). The physico-chemical and biological
assessments will be conducted seasonally to assess any ongoing micro-effects of the
ecological restoration programs (particularly indigenous revegetation), and also any
weather and climate related changes affecting the Longbush waterbodies. Habitat
characteristics and fish species will be surveyed annually. Other sampling times may
be included to ‘pick up’ on specific climatic or land use variables.
Integrated with this survey work, a koura (Parenthrops, freshwater crayfish)
breeding and restoration project is to be established utilising the Longbush
waterways.
The protocols utilised for physic-chemical and biological sampling and assessment
derive from Ministry for the Environment Monitoring Protocols and Quality
Assurance Guidelines (Part 2) for regional freshwater reporting (Davies-Colley et al,
2012); Categories of periphyton for visual assessment, Kilroy 2011; A User Guide for
the Macroinvertebrate Community Index, Stark and Maxted, 2007; Review of the
New Zealand instream plant and nutrient guidelines and development of an extended
decision making framework: Phases 1 and 2 final report, Matheson, F., Quinn, J. and
Hickey, C. 2012; and those of the GLOBE program, an international standard
consistent with field-based freshwater monitoring, such as is in use by educational
and community groups www.globe.gov The survey also incorporates the Attribute
assessment methodology of the National Policy Statement for Freshwater
Management 2014, and the Australian and New Zealand Guidelines for Fresh and
Marine Water Quality (ANZECC2000).

11
Physic-chemical water characteristics
The physical and chemical characteristics of the streams and wetlands are assessed
using the following: recent rain (during the previous week and previous four weeks);
flow velocity and volume (where possible); air temp, water temp, dissolved oxygen,
water clarity, Ammoniacal N, Nitrate N, TKN, Total P, Dissolved reactive phosphorous
(DRP), pH, Conductivity and Salinity.
The program of physico-chemical attributes was amended from the original March
25th survey period to take into account the National Policy Statement for Freshwater
Management (NPSFM 2014), which provides a statutory framework within which to
assess river and lake water quality. Since that time, the author of this report has also
conducted assessments of sixteen stream sites within the Waipaoa and associated
catchments. In the process of this work, a monitoring and assessment methodology
has been established that attempts to bring together the most current thinking and
suite of evaluation tools. This suite has been applied to the Longbush survey to allow
the direct comparison of the sites at the eco-sanctuary with others in the Waimata
catchment and wider region.
Macroinvertebrates
Aquatic macroinvertebrates play a crucial role in water quality and aquatic
ecosystem assessments. At Longbush, they are gathered from a stream reach of up
to 50 metres in length that is indicative of the wider stream environment. The
method of surveying the site is ‘Riffle only’, aiming to gather samples from the riffle
areas, where these are present. This is the current preferred method amongst
regional councils, and its use facilitates the comparison of Longbush data with that
from other survey work.
Gathering of invertebrates is from five replicates (a total area of approximately 0.6
to 0.8sqm). For sampling, a 0.5mm mesh D net with an approximately 400mm
bottom dimension is employed. Where this involves substrate disturbance, an area
approximately 400mm by 400mm upstream of the net is disturbed, and the
dislodged invertebrates gathered.
In addition, if other habitat types are present (e.g. macrophyte beds, undercut
banks, woody debris) two further replicates from these sites may be gathered. This
provides an ‘All Habitat’ assessment, gathering samples primarily from the substrate,
but also from differing habitats present within the site that are representative of the
overall stream habitat. Scores from all-habitat sampling are retained separately from
those of the riffle-only method. The reasons for including the all-habitat method as
an additional component is:
It can be applied with a high level of consistency across a wide range of
freshwater settings, including hard substrate (upland) and soft substrate
(lowland) environments;
Sampling from undercut banks, woody debris, macrophyte beds, pool
environments and vegetated littoral margins, provides a better picture of the
food webs and trophic structures in a given setting, and hence the potential

12
resources for native fish and other taxa (e.g. koura). This is a particularly
valuable consideration given the strong tangata whenua and wider
community interest in the protection and restoration of he taonga tuku iho
(treasures of the natural world) and mahinga kai (food gathering sites and
activities) in our region.
Individual taxa are identified and their Macroinvertebrate Community Index (MCI)
and Quantified Macroinvertebrate Community Index (where an average sensitivity
score per animal is then allotted to the site, QMCI) are recorded (Stark and Maxted,
2007, Appendix 1). Further assessments of the invertebrate data are also performed,
including total taxa and animal abundance, the percentage of the Ephemeroptera,
Plecoptera and Trichoptera (EPT) taxa, the aquatic invertebrate families most
sensitive to impacts of contaminants and degraded aquatic environments, and the
relative abundance of EPT animals present at the site.
The MCI is calculated from presence-absence data as follows.
Where S = the total number of taxa in the sample, and ai is the tolerance value for
the ith taxon (see Table 1).
The QMCI is calculated from count data as follows.
where S = the total number of taxa in the sample, ni is the abundance for the ith
scoring taxon, ai is the tolerance value for the ith taxon (see Table 1) and N is the
total of the coded abundances for the entire sample.
10% or an indicative number of survey samples will be conveyed to an appropriate
university or Crown Research Institute for auditing.
Periphyton
Periphyton is the slimy organic layer attached to submerged surfaces such as stones
and wood, and is comprised mainly of microorganisms (e.g. algae, bacteria,
microscopic animals) and the materials they secrete. Periphyton can take two
general forms:
Microscopic, single-celled algae forming thin layers (films) on stream bed
materials;
Algal colonies, growing in the water as filaments or mats.
Periphyton is a foundation of many stream food webs, in particular for stream
macro-invertebrates which in turn provide food for fish and birds. Excess growths of
periphyton, however, can make the stream habitat unsuitable for many invertebrate
species. This reduces the ecological health of the stream, and can make the stream

13
unattractive for swimming and other recreation (Biggs and Kilroy, 2000; Storey,
2014).
Periphyton is also an important indicator of water quality, and responses of these
biological communities to contaminants can be measured at a variety of scales from
the physiological to community. In general, periphyton is utilised as an indicator of
water quality because:
It has a naturally high number of species;
It has a fast response to environmental change;
It is relatively easy to sample;
The threshold for tolerance or sensitivity to change (in particular the
presence of nutrients e.g. nitrogen and phosphate) is reasonably well
documented.
Since the ecological tolerances for many species are known, changes in community
composition can be used to diagnose the environmental stressors affecting
ecological health, as well as to assess biotic integrity. Along with Ammoniacal
Nitrogen, periphyton is a key attribute that must be monitored by local authorities
for river Ecosystem Health (NPSFM 2014).
Periphyton assemblages have traditionally been visually assessed using the SHMAK
Rapid Assessment Method (RAM1 or RAM2), the RAM2 method identifying 12
periphyton categories which are then recorded and interpreted utilising the SHMAK
Stream Periphyton Monitoring Assessment Matrix.
Such analyses, if combined with some physical measurements (e.g. shading,
water velocities, depths and/or substrate composition), can provide useful
insights into the primary factors controlling the local development of different
periphyton communities and assessment of causes of stream habitat
degradation (Biggs and Kilroy, 2000, p42).
The RAM2 allows for a good level of precision for activities such as State of the
Environment reporting and detailed regional water quality assessments (ibid). During
the period of lowered (summer) flows, it is anticipated that the visual assessments
may be complemented by a quantitative laboratory assessment of Chl-a.
Currently, however, a visual assessment method is recommended that is an adaption
of the RAM2 and that may also provide an accurate indication of levels of Chl-a
without laboratory analysis (Kilroy et al 2011, 2013). For this, a minimum for four
transects are employed, with five sampling points on each. Each sampling point
comprises a 50cm diameter view, and is assessed for the percentage cover for each
periphyton category and multiplied (i.e. weighted) by a pollution score to give a
general assessment of water quality conditions (Periphyton weighted composite
cover, PeriWCC; Periphyton Enrichment Score, PES) and visual levels of algal biomass
(equivalent to mg/m2 Chl a). This method has been recommended by Richard Storey
of NIWA for use in the Gisborne region (Storey, 2012) and will be employed at
Longbush also.

14
Table 1 Periphyton assessment categories and scores (Kilroy, 2011; Storey,
2014)
Observations Score
Didymo -
Cyanobacteria mats 1
Green filaments 2
Other filaments 1
Other Mats > 2mm thick (excluding Didymo & Cyano)
7
Sludge 8
Thin Films 9
Bare Area 10
Typical periphyton assemblages from cobble streams with sufficient light and nutrients:
displaying levels of filamentous, mats >2mm thick, fine films and bare area. Photo: M. Palmer.
Waitui, March 25 2014.

15
Figure 2 Ecosystem health as measured by periphyton (mg chl-a/m2) (NPSFM
2014)
Macrophytes
Macrophytes are conspicuous aquatic plants from a diverse assemblage of
taxonomic groups frequently separated into four categories based on their habit of
growth: e.g. floating unattached, floating attached, submersed, and emergent.
Macrophytes are an important component of wetland, lake and river ecosystems,
contributing to services such as carbon fixation, nutrient cycling and sequestration,
and providing food and habitat for invertebrate, fish, and bird populations.
Overabundance of macrophytic growth can, however, impact on aquatic and human
values, such as:
Hindering recreational use;
Reducing aesthetic quality;
Restricting land drainage;
Clogging water intakes;
Reducing ecological habitat quality (e.g. through dramatically fluctuating DO
levels and/or altering pH, smothering substrate and increasing deposited
sediment).
Although macrophytes have been a part of state of environment reporting for some
time, due to insufficient data no macrophyte abundance or nutrient guidelines for
macrophytes have been identified for NZ rivers and streams. Despite a continuing
paucity of empirical data, however, collation of current information has recently
made possible the application of provisional guidelines for the protection of in-
stream ecological condition, flow conveyance, recreation and aesthetics. These are:

16
50% or less of channel cross section area or volume (CAV); or 50% or less of the
water surface area (SA) (Figure 4 below).
Figure 3 Indications of effects of macrophytes on periphyton and
macroinvertebrates (Matheson et al, 2012).
These guidelines have provided the basis for our assessment categories for the
Waipaoa catchment. As with other monitoring indices and stream characteristics and
parameters measured, the raw figures are included in the Longbush site summary
data sheets, should the guidelines need to be revisited and a re-assessment of the
categories made. Figure 5 below identifies the range of assessment criteria currently
available for periphyton and macrophyte assemblages.
Figure 4 Provisional macrophyte abundance guidelines (Matheson et al, 2012)

17
Figure 5 Existing and new instream plant abundance guidelines to protect river
values (Matheson et al, 2012)

18
Stream habitat
Stream physical habitat is assessed utilising the following characteristics, informed
by the Stream habitat assessment protocols for wadeable rivers and streams in New
Zealand (Matheson, et al, 2009):
Riparian and littoral margins
Shade
Erosion
Stream type
Adjacent land use
Upper catchment land use
Stream substrate
Stream form
Stream embeddedness (solidity of the substrate)
Recent (sediment) deposits
Recent weather
Stream width and depth
Stream velocity and volume
These details are recorded on an Excel spreadsheet. The results are assessed on site
through the Rapid Habitat Assessment matrix (RHA, Storey, 2014), although the
original data remains available for recording fine grained changes in habitat and for
testing against other matrices. This provides one or more quantified metrics that can
complement those of the invertebrate, periphyton and macrophyte surveys,
identifying a wider background to current ecological status and the level of
ecosystem health of the Longbush streams, and others that may be included in the
program, and any changes to these that may occur over time.
March/April and August 2014, January 2015 Survey Results
Background: recent weather and water levels
The two stream and two wetland monitoring sites are identified in Figure 1 above.
To initiate the project, the stream sites were surveyed on the 25th March 2014, just
at the end of the summer dry spell, when 23.6mm of rain had fallen in the previous
week and 71mm over the previous four weeks. In order to check some of the sample
results, and compare the impacts of subsequent significant rain on these streams
and on the main river stem at Goodwin’s Road Bridge, a further sampling visit was
undertaken on April 10th utilising only physico-chemical water quality parameters.
June proved to be almost twice as wet as the historical average, and precluded
accurate biological assessment of stream health (macroinvertebrates and
periphyton) during the winter season. Further, intermittent winter rainfall made
access to the sites difficult until August 30th. The stream sites, surveyed on that date,
had experienced 7mm and 143.4mm of rainfall for the respective week and 28 day
periods.

19
Our next survey period was on the 23rd January 2015. The Gisborne Tairawhiti region
had experienced a dry, warm spring with 66mm of rain falling during October and
November, and in the 54 days prior to our January survey visit only a further 100mm
had fallen. Consequently, the streams were at a very low level, still flowing, but with
most of the water contained in small pools to the side of the riffles.
The wetlands were almost dry at our Longbush visit on 25th March, making water
quality surveying unreliable and were revisited on May 21st. While the upper
wetland appeared to be about one third to a half full at this time, enabling sampling
to be undertaken, there was still virtually no water in the lower wetland.
We revisited the Longbush wetland sites on August 28th 2014, after there had been
11mm rain in the preceding week, and 147.4mm in the preceding 28 days, and
conducted a complete survey of the upper wetland. The lower pond still had
insufficient water to provide a realistic assessment of the water quality and biotic
potential of the setting. At our visit to Longbush on 23rd January 2015 there was
insufficient water in either wetland to enable biological or water quality samples to
be satisfactorily gathered. It is our understanding that water feeding the wetlands
may have been diverted for stock use, or that there may be damage to the integrity
of the wetland base due to drying of the clay liner (pers com Dr Anne Salmond).
Water quality samples for lab analysis were taken from the upper wetland and the
Waikereru and Waitui streams and provided to Hydro Technology Ltd for laboratory
analysis.
Survey results: Habitat evaluation
Upper catchment land use
The upper catchment environment of the Longbush streams is largely comprised of
regenerating native forest with some remnant grassland. This includes existing old
trees scattered amongst the previous pastoral landscape, naturally emerging
successional species, and areas specifically planted with restoration species. Special
attention has been provided to the riparian areas, and these have been fully planted,
commencing in 2001 and completed in the winter season of 2014.
Riparian and littoral environment
At our initial habitat survey (March 25th 2014) both streams exhibited good stands of
woody indigenous vegetation (tall shrub and tree species) and levels of indigenous
low vegetation (e.g. ferns, tall sedges) comprising 90% of Waikereru and 68% of
Waitui stream riparians. Remnant grassland species occupied the remaining 10% and
32% respectively of the two site margins. The more open aspects with grassland
present reflects the situation of the survey sites adjacent to the access track.
Nevertheless, both sites exhibited good shade, 90% (Waikereru) and 65% (Waitui),
and there was no bank erosion at either.
After the August and January survey periods, further growth of the indigenous tree
species were noted, and it is expected that this will be reflected in the ensuing
habitat assessment detail (spring 2015).

20
Figure 6 Longbush streams riparian vegetation
In-stream habitat
Stream form at both sites was dominated by riffles, with pools, runs, and undercut
banks present at each also. There was a bed of macrophytes, largely watercress, at
Waitui, reflecting the more open aspect near the track. Stream substrates at both
sites were comprised largely of gravels (2-58mm), with a good percentage of mixed
size cobbles (25%), and evenly
distributed amounts of boulders, sand
and fine silt.
Embeddedness was good overall at both
sites, with stable cobbles and gravel infill.
Recent sediment deposits were only
evident at Waikereru, however they
were insufficient to affect the overall
quality or habitat available at the site,
and may reflect the combination of a
small erosion lens upstream and the
absence of a ‘flushing’ flow prior to
March 25 2014.
0
10
20
30
40
50
60
70
indigenous woody indigenous low exotic grasses
% C
ove
r
Vegetation types present
RIPARIAN VEGETATION
Waikereru (March 2014) Waitui (March 2014)
Macrophyte beds adjacent to the
access track, Waitui stream.

21
Figure 7 Longbush streams form
0
10
20
30
40
50
60
70
% F
orm
Stream form type
LONGBUSH STREAM FORM
WAIKERERU WAITUI
Stream settings
Above: Waikereru (March 25, 2014)
Left: Waitui (March 25, 2014)

22
Figure 8 Longbush stream substrate
Figure 9 Longbush stream recent sediment deposits
Figure 10 Longbush streams shade and streambank erosion
0
50
100
% S
had
e an
d S
trea
mb
ank
ero
sio
n
WAIKERERU WAITUI
LONGBUSH STREAMS SHADE AND STREAMBANK EROSION
SHADE BANK EROSION
0
10
20
30
40
50
60
70
Bedrock Boulders> 250mm
Lgcobbles120-249
Smcobbles60-119
Gravel2-59
Sand0.1-1.9
Mud/siltfine &sm-not gritty
Organicmud
Wood
% S
ub
stra
te
Substrate type
LONGBUSH STREAM SUBSTRATE
WAIKERERU WAITUI

23
When assessed against the Rapid Habitat Assessment matrix (currently being
considered, pers comm Joanne Clapcott), the physical habitat characteristics of both
streams were extremely high, Waikereru at 87% and Waitui 93%, placing them in the
highest habitat grouping as currently assessed for our region1. From indications at
our August survey period (increased riparian vegetation growth, changes to stream
morphology), it is anticipated that this assessment value may be maintained or
enhanced at the next habitat survey period.
Survey results: periphyton
Periphyton were surveyed at Longbush by a selection of 10 cobbles within the site
reach (50m), complemented by a full-site visual assessment. The small size of the
streams and the opportunity for survey participants to closely observe and identify
the whole of the stream beds, make a combined use of a full visual survey alongside
a selection of quadrats or stones the anticipated monitoring method.
Results were assessed using the Periphyton Weighted Composite Cover (PeriWCC)
(Matheson et al, 2012); Chl-a equivalent visual assessments (Kilroy, 2011; Kilroy et al
2013) and the currently trialled Periphyton Enrichment Score system (PES) (Storey
2014), each of which allow for a qualitative assessment of periphyton biomass and
potentially of stream enrichment and eutrophication.
Despite the warm weather and low flows at March 2014 and January 2015, the
absence of significant levels of filamentous algae and sludge, and the presence of
thin films and mats <2mm, provided for periphyton enrichment scores (PES) in the
Excellent category (Storey, 2014) at both Waikereru and at Waitui at all survey
periods, except for Waitui at January 2015 when the Waitui site slipped into the
upper Good category. Similarly, visually assessed levels of Chl-a measured as mg/m2
were also measured as Excellent, each sample being below the monthly mean
required of 15 mg/m3 (Matheson et al, 2012).
Overall, assessed against the existing and new instream plant abundance guidelines,
except for a slight exceedance of filamentous algae in January 2015 at the Waitui
site, both streams can also be considered Excellent for the values of 1) benthic
biodiversity, stream health and life supporting capacity; 2) trout fishery and angling;
3) aesthetic 4) contact recreation; 5) flow conveyance and 6) water supply values
(Matheson et al, 2012, Figure 5 above). The PES and Chl-a assessment grades are
outlined in Table 2 (Storey, 2014) and Table 3 (MfE, 2014) below.
1 This is based on an experimental grading system trialled by the author after discussions with NIWA’s Dr Richard Storey (Winter biomonitoring survey for the Waipaoa River and associated catchments Gisborne District Te Turanganui a Kiwa, Palmer 2014).

24
Figure 11 Longbush Streams Periphyton Enrichment Score
Figure 12 Visual assessment of algal biomass
Table 2 Assessment grade PES and visual Chl-a (mg/m2) (Storey, 2014)
0123456789
10
25.03.2014 30.08.2014 23.01.2015 25.3.2014 30.08.2014 23.01.2015
Waikereru Waitui
PERIPHYTON ENRICHMENT SCORE
Periphyton Enrichment Score <2 = Poor
2-4 = Somewhat Poor 4-6 = Fair
6-8 = Good, 8-10 = Excellent
0
10
20
30
40
50
60
25.03.2014 30.08.2014 23.01.2015 25.3.2014 30.08.2014 23.01.2015
Waikereru Waitui
ALGAL BIOMASS (equivalent to mg/m2 Chl-a)
Algal Biomass (mg/m2 Chl-a) <50 mg/m2 max. = Good
<16 mg/m2 Mean Monthly = Good
Measure Assessment grade
Excellent Good Fair Somewhat poor Poor
PeriWCC
(stream health)
% cover
<20
PES >8 6-8 4-6 2-4 <2
Chl-a (mg/m2)
(see Table 4
below)
<50 50-120 120-200 >200

25
Table 3 Ecosystem health (Rivers) mg chl-a/m2

26
Figures 11 and 12 above do, however, reflect the presence of stream shade and the
effect of winter rainfall on flushing any build-up of periphyton, particularly in the
more open aspects of Waitui. This flushing effect was also evident in the alteration
to stream form and substrate particularly evident at Waitui, with a larger percentage
of bedrock, boulders and large cobbles exposed, and the deeper pools replaced with
more riffle/run sequences.
The role of high flows in removing periphyton and macrophyte build-up and
deposited sediment and facilitating stream habitat recovery is a focus of research
regionally (Palmer, 2014).
Survey results: macrophyte growth
Stream sites
No noticeable quantities of macrophyte growth were present at any of our survey
periods, although a small clump of watercress was visible at the open southern and
northern limits of the Waitui site in march 2014 and January 2015.
Wetland sites
By the 28th August, however, the Upper Wetland was 70% covered with a dense mat
of Spirodela punctata (duckweed), a free-floating exotic macrophyte. Macrophyte
cover records for the Upper Wetland are outlined in Figure 13 below.
Figure 13 Macrophyte cover Longbush Upper Wetland
18.7
11.5 9.8
0
5
10
15
20
0
10
20
30
40
50
60
70
80
14/02/2013 21/05/2014 28/08/2014
Wat
er T
emp
erat
ure
% c
ove
r
MACROPHYTE COVER UPPER WETLAND
Macrophytes (% Cover) <50 % = Acceptable
Water Temperature

27
Macrophyte blooming at the
Longbush Upper Wetland does
not appear to be associated
with water conductivity or
levels of nitrate or ammonia.
Nor was temperature an
apparent factor. Total
Phosphorous at the August
2014 sampling period was,
however, extremely high at
66mg/m3, the threshold for
unacceptable (Degraded)
status for lowland lakes being
an annual median of 50mg/m3
(NPSFM 2014) or lowland rivers the low risk trigger threshold of 33mg/m3 (ANZECC
Guidelines 2000). Shallowing of the wetland from av. 1.6m deep to av. 1m appears
to be a possible contributing element, potentially concentrating the P levels present.
When the wetland levels are replenished, a further set of physic-chemical tests will
be undertaken.
Survey results: macroinvertebrates
Stream sites
Macroinvertebrate animals were collected from a 50 metre reach indicative of the
wider stream environments. Because of the relatively low flows at both streams, and
the embedded and diverse character of the substrate, samples were largely gathered
from individual stones along with some collected from the disturbance of adjacent
gravel and cobble substrates. At each site, a total of 5 replicate samples were taken
from the riffle areas and combined for identification and counting.
As outlined at Figure 14 below, apart from the result for January 2015 at Waikereru,
the macroinvertebrate taxa recovered from the Longbush streams provide evidence
for waterways in the upper Good to Excellent categories for biological condition
when assessed by the presence or absence of specific indicator taxa:
Macroinvertebrate Index (MCI). When assessed against the abundance of each taxa
present (QMCI), Te Waikereru scored well into the Excellent category at each
monitoring period, as did Te Waitui during the winter/early spring survey, while the
latter also scored in the upper Good (autumn 2014) and upper Fair (summer 2015)
categories (Stark and Maxted, 2007).

28
Figure 14 Macroinvertebrate community indices Longbush ecosanctuary
Similarly, the presence of the most sensitive indicator taxa (Ephemeroptera,
Plecoptera, Trichoptera sp., EPT) and their relative abundance, indicate similar high
levels of ecosystem well-being at Longbush, with five of the six site samples having
50% or more of the total animals from EPT taxa groups, the remaining sample
20.79%. EPT taxa varied from a minimum of 20% at Waikereru on 23rd January 2015
to a maximum at the same stream on 25th March 2014 of 80%.
Figure 15 EPT taxa and EPT animals Longbush streams
0
1
2
3
4
5
6
7
8
0
20
40
60
80
100
120
140
160
25.03.2014 25.03.2014 30.08.2014 30.08.2014 23.01.2015 23.01.2015
WAIKERERU WAITUI WAIKERERU WAITUI WAIKERERU WAITUI
QM
CI
MC
I
MCI AND QMCI BY SURVEY PERIOD
MCI <4 = Poor
4-4.99 = Fair 5-5.99 = Good, >5.99 = Excellent
QMCI
0
10
20
30
40
50
60
70
80
90
100
25.03.2014 25.03.2014 30.08.2014 30.08.2014 23.01.2015 23.01.2015
WAIKERERU WAITUI WAIKERERU WAITUI WAIKERERU WAITUI
EPT % TAXA AND % TOTAL ANIMALS
EPT TAXA % EPT ANIMALS
<1 = Poor 1-14 = Fair
15-49 = Good, >50 = Excellent

29
Table 4 Interpretation of macroinvertebrate index scores
Since freshwater surveys have commenced at Longbush Eco-sanctuary in October
2012, Waikereru has been situated in the Excellent category for MCI for three of the
five sampling periods, slipping into the upper Good in mid-February 2013 and
declining to the lower Fair category in late January 2015. When abundance values
were estimated for these 2013 and 2015 sample periods, however, Waikereru
scored 6.88 (Semi-quantified macroinvertebrate community index, SQMCI, Excellent)
and 6.61 (QMCI, Excellent).
Previously conducted regional surveys providing comparisons of medium (stable)
with low flow conditions, indicate a tendency for lowered MCI and QMCI or SQMCI
scores with reduced flow conditions and stream levels (Appendix 3 below).
Interpretation of MCI scores (Stark and Maxted, 2004, 2007; Storey, 2014)
Index Excellent Good Fair Poor
Narrative description
Clean water
Doubtful quality or possible mild pollution
Probable moderate pollution
Probable severe pollution
Taxa total TBE TBE TBE TBE
Macroinvertebrate community index (MCI) >119 100-119 80-99 <80
Quantitative macroinvertebrate community index (QMCI) >5.99 5-5.99 4-4.99 <4
Semi-quantified macroinvertebrate community index (SQMCI) >5.99 5-5.99 4-4.99 <4
EPT Taxa % TBE TBE TBE TBE
EPT animals % >50 15-49 1 to 14 <1

30
Figure 16 Waikereru macroinvertebrate survey results by season
Figure 17 Waikereru and Waitui streams MCI Oct 2012 to January 2015
0
1
2
3
4
5
6
7
8
0
20
40
60
80
100
120
140
160
16.10.2012 14.02.2013 25.03.2014 30.08.2014 23.01.15
QM
CI
MC
I
WAIKERERU STREAM MCI AND QMCI OCT 2012 TO JAN 2015
MCI <4 = Poor
4-4.99 = Fair 5-5.99 = Good, >5.99 = Excellent
QMCI
0
20
40
60
80
100
120
140
160
16.10.2012 14.02.2013 25.03.2014 30.08.2014 23.01.15
MC
I
Survey Dates
MCI SURVEY RESULTS OCT 2012 TO JAN 2015
Waikereru Waitui
<80 = Poor 80-99 = Fair
100-119 = Good, >120 = Excellent

31
Table 5 Overall macroinvertebrate indices 2014/15 survey period
SITE Waikereru Waitui
Date 25.03.14 30.08.14 23.01.15 25.03.14 30.08.14 23.01.15
TOTAL ANIMALS 129 136 100 139 76
101
TOTAL TAXA 5 5 5 12 10 10
MCI 152 148 84 113.4 118 106
QMCI 7.84 7.99 6.61 5.53 7 4.85
EPT TAXA % 80 60 20 42 50 33.33
EPT ANIMALS % 98 98.9 74 50 96.6
20.79
One unexpected outcome of our survey was the presence of significant numbers of
leeches (Hirudinea sp.) attached to the cobble undersides at Waitui, and to a lesser
extent at Waikereru, during our survey periods. Although common in good quality as
well as degraded streams, the presence of these predatory animals in the numbers
evident has not been observed by the author previously in indigenous forest or
restoration landscapes.
Wetland sites
Although invertebrate taxa and community assemblages are not assessed via the
MCI and QMCI, % EPT animals, etc. for lakes and wetlands as they are for flowing
waters, nevertheless such assemblages do provide an important component in any
reporting on wetland ecology. At Longbush, overall taxa diversity was greatest when
the wetlands were full of water, despite the season when the sampling took place.
In mid-October 2012, 16 different invertebrate taxa were found in the lower
wetland, and on February 14th 2013, 19 taxa in the upper, including two EPT taxa in
each. Water levels at both venues were high (c.2m and c.1.6m average respectively).
Sampling from the upper wetland in late-May and late-August when water levels
were moderately low (average depth estimated < 1.2m) yielded only five and four
different taxa respectively. Water levels at both periods were too low to allow for
sampling from the lower wetland. Low water levels also precluded sampling at our
January 2015 period.

32
Figure 18 Macroinvertebrate diversity and density in Longbush wetlands
Dominant invertebrate taxa in the wetlands were as follows:
Table 6 Dominant invertebrate taxa Longbush wetlands
Site Upper Wetland Lower
Date 14.02.2013 21.05.2014 28.08.2014 10.10.2012
Dominant taxa Potamopyrgus Oligachaete Copepoda Potamopyrgus
Taxa mci score (sb) 2.1 3.8 2.4 2.1
Total animals (appr.) 500 250 300 100
Dominant taxa %
total 63.3 89.6 98
52.1
Survey results: physic-chemical assessment
Background
As referred to earlier, we have recently instituted a physic-chemical survey regime
for the Longbush streams and wetlands that is designed to provide a robust level of
information and consistency relating to key water quality parameters as identified at
a national level through the monitoring protocols provided by the MfE (Davies-Colley
et al, 2012) and the attribute values established by the NPSFM 2014. The
development of such a regime for Longbush in the context of the current survey
occurred at a time when there was significant flux and re-evaluation occurring
nationally and regionally around the use of specific parameters, however the current
suite of monitoring parameters we believe will be of value in developing consistency
in the current foreseeable future.
33
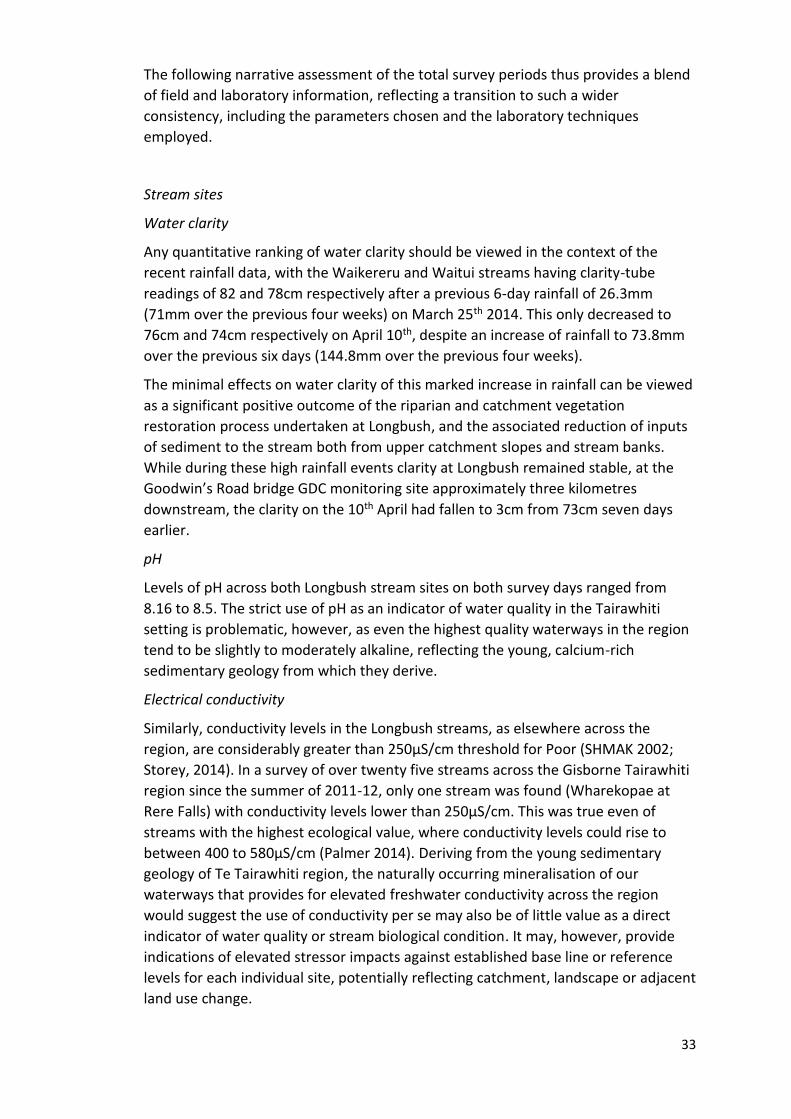
The following narrative assessment of the total survey periods thus provides a blend
of field and laboratory information, reflecting a transition to such a wider
consistency, including the parameters chosen and the laboratory techniques
employed.
Stream sites
Water clarity
Any quantitative ranking of water clarity should be viewed in the context of the
recent rainfall data, with the Waikereru and Waitui streams having clarity-tube
readings of 82 and 78cm respectively after a previous 6-day rainfall of 26.3mm
(71mm over the previous four weeks) on March 25th 2014. This only decreased to
76cm and 74cm respectively on April 10th, despite an increase of rainfall to 73.8mm
over the previous six days (144.8mm over the previous four weeks).
The minimal effects on water clarity of this marked increase in rainfall can be viewed
as a significant positive outcome of the riparian and catchment vegetation
restoration process undertaken at Longbush, and the associated reduction of inputs
of sediment to the stream both from upper catchment slopes and stream banks.
While during these high rainfall events clarity at Longbush remained stable, at the
Goodwin’s Road bridge GDC monitoring site approximately three kilometres
downstream, the clarity on the 10th April had fallen to 3cm from 73cm seven days
earlier.
pH
Levels of pH across both Longbush stream sites on both survey days ranged from
8.16 to 8.5. The strict use of pH as an indicator of water quality in the Tairawhiti
setting is problematic, however, as even the highest quality waterways in the region
tend to be slightly to moderately alkaline, reflecting the young, calcium-rich
sedimentary geology from which they derive.
Electrical conductivity
Similarly, conductivity levels in the Longbush streams, as elsewhere across the
region, are considerably greater than 250µS/cm threshold for Poor (SHMAK 2002;
Storey, 2014). In a survey of over twenty five streams across the Gisborne Tairawhiti
region since the summer of 2011-12, only one stream was found (Wharekopae at
Rere Falls) with conductivity levels lower than 250µS/cm. This was true even of
streams with the highest ecological value, where conductivity levels could rise to
between 400 to 580µS/cm (Palmer 2014). Deriving from the young sedimentary
geology of Te Tairawhiti region, the naturally occurring mineralisation of our
waterways that provides for elevated freshwater conductivity across the region
would suggest the use of conductivity per se may also be of little value as a direct
indicator of water quality or stream biological condition. It may, however, provide
indications of elevated stressor impacts against established base line or reference
levels for each individual site, potentially reflecting catchment, landscape or adjacent
land use change.

34
Nutrients
Stream nitrate levels provided a more unexpected result for the survey assessment.
At the March 25th survey period nitrate levels at Waikereru and Waitui were 1.78
mg/L and 1.33 mg/L respectively. These were significantly elevated against the
impacted pastoral farm sites surveyed by Nga Mahi Te Taiao around this period. At
Goodwin’s Rd bridge site, for instance, on April 3rd nitrate levels were 0.22mg/L, the
lowest level measurable with our field equipment2. This was also the case at the
Hamanatua Stream that drains a largely pastoral farming and peri-urban catchment,
and whose outlet is adjacent to the Wainui Beach surf-lifesaving club.
In order to gain a better understanding of these findings, we returned to the
Waimata Valley and Longbush 10 days later after the significant rainfall at the
beginning of April. After 73.8mm of rain had fallen, nitrate levels had dropped here
to 0.89mg/L (Waikereru) and 0.443mg/L (Waitui). This compared to increases in
nitrate levels to 0.44 and >3.54mg/L at the Goodwin’s Road and Hamanatua sites
respectively. Thus, unlike the impacted sites where nitrate levels markedly increased
with moderate rainfall and the associated farm run-off and removal of nitrate-fixing
periphyton beds, at the regenerating Longbush sites, nitrate levels were reduced. At
our August survey period, nitrate levels were well below the NPSFM 2014 median for
A status both at Waikereru (0.3mg/L) and at Waitui (0.29mg/L). These had further
reduced by January 23rd 2015 to <0.002 and 0.067mg/L respectively.
Because of the potential significance of these and similar findings to water quality
assessments in the context of land use patterning and associated freshwater
ecosystem management, particularly the use of threshold values for specific
chemical parameters, and to ensure consistency with other regional monitoring
programs, a large part of the physic-chemical analysis of the Longbush waterways is
being provided by Hydro-Technologies Laboratory (Gisborne) and Hills Laboratories
(Hamilton).
Table 7 Nitrate (mg N03-N/L) assessment guidelines (proposed MfE, 2013)
Level Band p/a (med; 95th)
Narrative values
A
<1 <1.5
A: 99% species protection level: No observed effect on any species tested
B
1–2.4 1.5-3.5
B: 95% species protection level: Starts impacting occasionally on the 5% most sensitive species
C
2.4-6.9 3.5-9.8
C: 80% species protection level: Starts impacting regularly on the 20% most sensitive species (12% reduction in growth)
D
>6.9 >9.8
D: Impacts on growth of multiple species, and starts approaching acute impact level (ie risk of death) for sensitive species at higher concentrations (>20 mg/L)

35
Levels of Ammoniacal N at both streams were at or below the level of detection
(<0.01mg/L) at our August and January survey periods, well within the NPSFM
median for A status. Levels of Dissolved Reactive Phosphorous (DRP) levels were
relatively high (at Waikereru in August 2014 and January 2015 5.6 and 6.5 times the
ANZECC Guidelines low risk trigger threshold of 10 mg/m3, and at Waitui 1.8 and 1.3
times this threshold level at these survey dates) compared with the medians for the
two GDC monitoring sites on the Waimata River at Monowai (4 mg/m3) and
Goodwin’s Road (6.5mg/m3) bridges (LAWA, 2015).
Dissolved Oxygen (DO), a critical indicator of the life supporting capacity and well-
being of ecosystems, at the March and August 2014 periods was high for both
streams and when considered against climatic variables, similarly so for our January
survey period (within the NPSFM 2014 thresholds for A status, although our surveys
represent only an initial level of reporting). Escherichia coli levels measured on 30th
August 2014 were extremely low at 5MPN/100ml (Waikereru) and 2MPN/100ml
(Waitui).
More empirical data needs to be assembled, however, before conclusions can be
drawn around the overall physic-chemical characteristics and ecological resilience of
these first-order waterways, and those similar, in the context of the multiple
stressors of nutrients, temperature, reduced flows, pH and dissolved solids
(sediment and entrained nutrients) and diurnally fluctuating levels of DO.
Background levels of nutrients from soils under regenerating vegetation, such as
those present at Longbush, and their level of fixation by in-stream plants also require
attention.
Wetlands
Clarity in still waters such as lakes and wetlands is frequently indicative of levels of
micro-algal and planktonic biomass. Despite differences in temperature and rainfall
levels prior to our sampling periods, water clarity remained consistent, suggesting a
level of stability in micro-algal growth. At our August sampling period, Chl-a levels in
the upper wetland were measured at 18mg/m3, suggesting that elevated nutrient
levels may be slightly impacting on ecological communities in the wetland (NPSFM
2014). This appears consistent with our laboratory assay for Total Phosphorous,
which, at 66mg/m3 would fall into an unacceptable category if it were to reflect the
median value for the site (ibid), and indeed could be a partial driver for the
heightened Chl-a count.
In terms of nitrogenous compounds, both Ammoniacal-N and Nitrate-N at the upper
wetland at this time were at, or below, the level of detection.
More empirical data will be required to assess this initial sampling result, however in
the interim, there would appear to be value in developing an assessment of the
potential sources of P to the wetland, including levels in the wetland sediments
themselves, and methods of reducing this in order to facilitate good habitat for
indigenous species introduction.

36
At 240MPN/100ml, the Upper Wetland on August 28th exhibited moderate to low E
coli levels. An annual median of <260MPN/100ml is considered to provide for a very
low (<0.1%) risk of infection from secondary contact activities (e.g. boating, wading)
(NPSFM 2014). The most likely source of the bacteria in the upper wetland, however,
would be avian from waterfowl, and possibly ruminant derived faecal run-off from
the gazed areas nearby.
Details of monitored physic-chemical parameters are outlined in Tables 8 and 9
below.

37
Table 8 Physico-chemical characteristics of Longbush Waikereru and Waitui Streams
3 Gisborne airport 4 Gisborne airport
Site Waikereru Waitui
Date 25.3.14 10.4.14 30.8.14 23.1.15 25.3.14 10.4.14 30.8.14 23.1.15
Time started 10.15am 11am 11.45am 2pm 12.30pm 1pm
Weather conditions today Fine Showery Overcast Fine Showery Fine
Rainfall (mm) in previous week3 23.6 73.8 7 23.6 73.8 7
Rainfall (mm) in previous month4 71 147.4 71 147.4
Flow (high/med/low) Low Med Med V low Low Med Med V low
Air temperature °c 16.9 19.2 13.5 23.1 20 15
Water temperature °c 14.2 16.3 9.8 16 15.8 10.7
Water clarity (clarity tube) cm 82 78 82 76 74.3 86
pH 8.38 8.5 8.16 8.38 8.15
Dissolved oxygen (mg/L) n/a 9.1 11.7 7.8 n/a 7.6 11.5 7.9
Conductivity (micro-S/cm) 680 580 550 540 500 540
Ammoniacal Nitrogen (mg/L) <0.01 <0.010 <0.01 0.011
Nitrate (mg/L NO3-N) 1.78 0.443 0.3 <0.002 1.33 0.89 0.29 0.067
Dissolved reactive phosphorous (DRP) g/m3
0.056
0.065
0.018
0.013
Salinity 0.3 0.3
E coli (MPN/100ml) 5 2
NMTT field equipment Hydro Technologies/Hills Laboratories

38
Table 9 Physico-chemical characteristics of Longbush Wetlands
5 Gisborne airport 6 Gisborne airport
Site Upper Lower
Date 14.02.13 21.05.14 28.08.14 10.10.12
Time started 10.10am 10.15am 9.45am 12.55am
Weather conditions today
Rainfall (mm) in previous week5 9.2
Rainfall (mm) in previous 28 days6 15.2
Water level (high/med/low) High Low Low High
Air temperature °c 25 19.1 19
Water temperature °c 18.7 11.5 9.8 14.5
Water clarity (clarity tube) cm 57 46 62 55
pH 6.75 7.52 7.98
Dissolved oxygen (mg/L) 9.4
Conductivity (micro-S/cm) 500 310 210 250
Ammonia Nitrogen (mg/L) <0.01
Nitrate (mg/L NO3-N) <0.22 <0.002
Phosphate 0.007
Total Phosphorous 0.066
Chlorophyll A (mg/m3) 18
Salinity 0.3 0.13
E coli (MPN/100ml) 240

39
References Biggs and Kilroy, 2000. Stream periphyton monitoring manual. Ministry for the Environment.
Davies-Colley, R.J., Hughes, A.O., Verburd, P. and Storey, R. 2012. Monitoring Protocols and
Quality Assurance Guidelines (Part 2). Ministry for the Environment.
Kilroy, C. 2011. Categories of periphyton for visual assessment. For ECan periphyton
monitoring program.
C Kilroy, DJ Booker, L Drummond, JA Wech & TH Snelder. 2013 ‘Estimating periphyton
standing crop in streams: a comparison of chlorophyll a sampling and visual
Assessments’. New Zealand Journal of Marine and Freshwater Research, 47:2, 208-
224, DOI:10.1080/00288330.2013.772526
Land Air Water Aotearoa. 2015. http://www.lawa.org.nz/explore-data/gisborne-
region/freshwater/
Matheson, F., Quinn, J. and Hickey, C. 2012. Review of the New Zealand instream plant and
nutrient guidelines and development of an extended decision making framework:
Phases 1 and 2 final report. Ministry of Science and Innovation.
New Zealand Government. National Policy Statement for Freshwater Management 2014.
Palmer, M.J. 2014. Winter biomonitoring survey for the Waipaoa River and associated
catchments: Gisborne District Te Turanganui a Kiwa. Gisborne District Council.
Stark, J.D. and Maxted, J.R. 2007. A User Guide for the Macroinvertebrate Community Index.
Ministry for the Environment. Cawthron Report No.1166.
Storey, R. 2012. Biological monitoring of rivers in Gisborne District: Benefits, costs and
recommendations. Prepared for Gisborne District Council.
Storey, R. 2014. Guidelines for Stream monitoring in NIWA’s community monitoring study.
NIWA.

40
Appendix 1 Longbush field reporting sheet
SITE RECORD
SHEET
CATCHMENT/RIVER:
Site name STREAM FORM % PHYSICO-CHEMICAL
Site # Pool Air temp ©
Date Run Water temp ©
Time Undercut Clarity (cm)
Altitude (m.asl) Riffle Conductivity (µS)
Easting Rapid pH
Northing Debris jam Salinity (ppt)
Tide (high) Macrophytes Ammoniacal N
RECENT RAIN (week) Slumped bank Nitrate
RECENT RAIN (4 weeks) Other Phosphate
RIPARIAN & LITTORAL MARGINS (%)
EMBEDDEDNESS % DO
Taha matau Tight Other
indigenous woody Good
indigenous low Moderate
indigenous wetland Loose
pasture grasses RECENT DEPOSITS % COVER
exotic woody RECENT DEPOSITS THICKNESS MCI SAMPLING METHOD
exotic low STREAM SUBSTRATE (mm) % cover
riverbed Bedrock Total animals
man made Boulders > 250 Total taxa
Taha maui Lg cobbles 120-249 Total EPT taxa
indigenous woody Sm cobbles 60-119 Total % EPT animals
indigenous low Gravel 2-59 Total %EPT taxa
indigenous wetland Sand 0.1-1.9 MCI score
pasture grasses Mud/silt (not gritty) QMCI score
exotic woody Organic mud SQMCI score
exotic low Woody debris
riverbed Other
manmade STREAM WETTED WIDTH (Av)
SHADE % STREAM DEPTH (Av)
BANK EROSION % STREAM CHANNEL WIDTH(Av)
Taha matau VELOCITY (m/sec)
Taha maui FLOW (cum/sec)
STREAM TYPE (hb/sb) PERIPHYTON % COVER
ADJACENT LAND USE CE, DE or BG0*
Didymo
UPPER CATCHMENT LAND USES Cyanobacteria mats
Green filaments
MACROPHYTES % cover Other filaments

41
Emergent plants Other Mats > 2mm thick
(excluding Didymo & Cyano)
Surface-reaching plants
Below-surface plants Sludge
Av height below-surface plants
as % channel depth
Thin Films
Bare Area
Total plants

42
Appendix 2 Macroinvertebrate taxa Longbush Eco-sanctuary 2014-15
SITE Waikereru Waitui Substrate derived
sensitivity scores
(hard bottom; soft
bottom) Date 25.03.2014 30.08.2014
23.01.2015 25.03.2014 30.08.2014
23.01.2015
Sample protocol
rock/kick net/riffle
rock/riffle hb sb
Invertebrate taxa
Plecoptera/Stoneflies
Acroperla 1 5 5.1
Ephemeroptera/May.F
Coloboriscus 2 32 4 3 9 8.1
Deleatidium 120 78 74 60 52 18 8 5.6
Nesameletus 1 2 9 8.6
Trichoptera/Caddis.F
Aoteapsyche 1 1 1 4 6.0
Costachorema 2 1 7 7.2
Hydrobiosis 1 1 5 6.7
Olinga 1 9 7.9
Orthopsyche 6 1 9 7.5
Pycnocentrodes 1 5 3.8
Megaloptera/Dobson.F
Archicauliodes 1 14 2 1 2 7 7.3
Coleoptera/Beetles
Elmidae 3 4 6 7.2
Odonata/Dragonflies
and Damselflies
Diptera/True flies
Chironimidae 13 1 5 2 3.8
Stratiomyidae 1 5 4.2

43
Hemiptera/Bugs
Microvelia 2 5 4.6
Crustacea
Arachnida
Dolomedes 1 2 5 6.2
Acarina
Mollusca
Potamopyrgus 2 40 6 61 4 2.1
Nematoda
Nematomorpha
Platyhelminthes
Cura 20 2 4 3 0.9
Oligachaete 1
Hirudinea 5 9 2 9 3 1.2
TOTAL ANIMALS 129 136 100 139 76 101
TOTAL TAXA 5 5 5 12 10 10
MCI 152 148 84 113.4 118 106
QMCI 7.84 7.99 6.61 5.53 7 4.85
EPT TAXA % 80 60 20 42 50 33.33
EPT ANIMALS 98 98.9 74 50 96.6 20.79

44
Appendix 3 Medium cf low flow conditions (Tairawhiti survey detail)
In the graph above, the higher sets of scores were during periods of moderate flows,
even though the periods were spread across late autumn and spring, while the lower
scores from each site reflect low flow conditions (despite the season). In May 2012,
for instance, water levels at Kopuaroa (Te Penu Marae Ruatorea) were very low, and
periphyton levels and surface sediment deposits elevated, the associated
macroinvertebrate communities tending to reflect a lowering in habitat quality.
Although these monitoring periods were at random times across two years, the
streams themselves had changed little in form or adjacent and upper catchment land
use. Despite the impacts of such climatic variables, however, the Waikereru and
Waihirere streams remained in the ‘Excellent’ category for biological value as
assessed by the Semi Quantified MCI (SQMCI).
KopuaroaDownstream -
May 2012
KopuaroaDownstream -
May 2013Waimata 2 - Oct
2012Waimata 2 - Feb
2012Waihirere bush -
Oct 2011Waihirere bush -
Mar 2013
0
20
40
60
80
100
120
140
160
180
0
1
2
3
4
5
6
7
8
9
MC
I
SQM
CI
MCI SQMCI<4/80 - Poor 5/99-6/120 - Good4/80-5/99 - Fair >6/120 - Excellent