AN ASSESSMENT OF THE EFFECTS OF NAIROBI …ijecm.co.uk/wp-content/uploads/2017/10/51011.pdf ·...
31
International Journal of Economics, Commerce and Management United Kingdom Vol. V, Issue 10, October 2017 Licensed under Creative Common Page 161 http://ijecm.co.uk/ ISSN 2348 0386 AN ASSESSMENT OF THE EFFECTS OF NAIROBI SECURITIES EXCHANGE (NSE) 20 SHARE INDEX REVIEW ON MARKET SHARE PERFORMANCE OF DELETED STOCKS IN KENYA Charles Otieno Ndede MBA (Finance), Kisii University Kenya [email protected] Andrew Nyang’au Kisii University, Kenya Yobes Benjamin Nyaboga Kisii University, Kenya Abstract The NSE 20 share index is reviewed periodically to ensure that it reflects an accurate picture of market performance. The aim of the study was to assess the effects of NSE 20 share index review on Market Share Performance of Deleted Stocks in Kenya. The specific objectives that guided the study were to: determine the effects Announcement Review on market share performance of deleted stocks in Kenya, establish the effects of Action Review on market share performance of deleted stocks in Kenya and evaluate the effects of review information contents on market share performance of deleted stocks in Kenya. The target population of was 18 stocks deleted from NSE20 share index from 1994 to 2014. The study used census sampling. Secondary data were obtained from NSE for the entire event analysis period and analyzed with the aid of SPSS. Study used Pearson correlation, Ordinary Least Square Regression (OLS) and market model to estimate the abnormal returns. Test for hypothesis was done using t-test statistic. The study found that, on average, within the review period, the mean market return performance was positive 0.20% compared to AAR for deleted stock of negative 0.58%, indicating that, in the short run, investors of deleted stock recorded a total reduction in return of 0.78%; during review action window, AAR were positive but declining before action but reverted
Transcript of AN ASSESSMENT OF THE EFFECTS OF NAIROBI …ijecm.co.uk/wp-content/uploads/2017/10/51011.pdf ·...

International Journal of Economics, Commerce and Management United Kingdom Vol. V, Issue 10, October 2017
Licensed under Creative Common Page 161
http://ijecm.co.uk/ ISSN 2348 0386
AN ASSESSMENT OF THE EFFECTS OF NAIROBI
SECURITIES EXCHANGE (NSE) 20 SHARE INDEX
REVIEW ON MARKET SHARE PERFORMANCE
OF DELETED STOCKS IN KENYA
Charles Otieno Ndede
MBA (Finance), Kisii University Kenya
Andrew Nyang’au
Kisii University, Kenya
Yobes Benjamin Nyaboga
Kisii University, Kenya
Abstract
The NSE 20 share index is reviewed periodically to ensure that it reflects an accurate picture of
market performance. The aim of the study was to assess the effects of NSE 20 share index
review on Market Share Performance of Deleted Stocks in Kenya. The specific objectives that
guided the study were to: determine the effects Announcement Review on market share
performance of deleted stocks in Kenya, establish the effects of Action Review on market share
performance of deleted stocks in Kenya and evaluate the effects of review information contents
on market share performance of deleted stocks in Kenya. The target population of was 18
stocks deleted from NSE20 share index from 1994 to 2014. The study used census sampling.
Secondary data were obtained from NSE for the entire event analysis period and analyzed with
the aid of SPSS. Study used Pearson correlation, Ordinary Least Square Regression (OLS) and
market model to estimate the abnormal returns. Test for hypothesis was done using t-test
statistic. The study found that, on average, within the review period, the mean market return
performance was positive 0.20% compared to AAR for deleted stock of negative 0.58%,
indicating that, in the short run, investors of deleted stock recorded a total reduction in return of
0.78%; during review action window, AAR were positive but declining before action but reverted

© Authors
Licensed under Creative Common Page 162
on third day (t=3) and turns positive on t=5 which continues to rise 1.10%. On average, the
deleted stock performance within the review action period was negative 0.59% compared to
market return of positive 0.13%; study further found that review announcement transmits new
information into the market while review action has no information. Study concluded that in the
short run, investors of deleted stock could lose a total of 0.78% of the returns, a significance
effects on market stock performance, and index review announcement transmit new information
to the market. The study recommends further research in the area using economic model and
other market indices (All Share Index).
Keywords: NSE 20 Share Index, Market Share Performance, Deleted Stock, Index Review
INTRODUCTION
Stock indexes are designed not only to gauge market performance, but also to guide investors
in making investment decisions especially stock portfolio mix. Several studies documents that
changes in stock market composition or index reconstruction have impact on different stock
characteristics such as price returns, trading volume, bid-ask spread or volatility (Duque &
Madeira, 2010). As stated by He1 and Wang (2015) index review effect is an anomaly of stock
market when the shares are added to or deleted from the index, stock prices and trading volume
tend to rise or fall sharply in the short term, and this may form an arbitrage opportunity for
investors. In addition, Duque and Madeira (2010) observed that effects of stock index review
can be observed when they are announced or when they become effective.
Effects of index review or reconstruction on stock performance is an important category
of behavioral finance research that is beneficial for learning the operation of the security market
and the investors’ behavior. As observed by scholars, addition of a stock to major stock indices
leads to an increase return and trading, mainly witnessed in developed markets (Shleifer, 2005,
Noronha and Singal, 2004), and local NSE market (Opiyo and Kubasu, 2014). On the other
hand, stock deletions have exhibited mixed results based on time horizon and reasons for
deletion. Therefore, it’s not imperative to claim that stocks which exhibit declining return or
projected poor performance are the one deleted from index or index deletion leads to decline in
stock return. To clear this phenomenon, there is a need to analyse effect of stock deleted from
index in emerging market. The following section reviewed index review from global, regional to
local perspective.
The S&P 500 (Standard & Poor's 500) is the world renowned stock index which is an
American stock market index based on the market capitalizations of 500 large companies
International Journal of Economics, Commerce and Management, United Kingdom
Licensed under Creative Common Page 163
having common stock listed on the NASDAQ. S&P 500 index components and their weightings
are determined by S&P Dow Jones Indices (S&P, 2014). It is different from other U.S. stock
market indices, such as the Dow Jones Industrial Average or the NASDAQ Composite index,
because of its diverse constituency and weighting methodology. S&P 500 is one of the majorly
followed equity indices, and many consider it as one of the best representations of the U.S.
stock market, and a leading indicator of business cycles (US National Bureau of Economic
Research 2010).
The components of the S&P 500 are selected by committee. This is similar to the Dow
Jones Industrial Average, but different from others such as the Russell 1000, which are strictly
rule-based (S&P 500 Ground Rules, 2014). When considering the eligibility of a new addition,
the committee assesses the company's merit using eight primary criteria: market capitalization,
liquidity, domicile, public float, sector classification, financial viability, length of time publicly
traded and listing exchange. In order to be added to the index, a company must satisfy these
liquidity-based size requirements: market capitalization is greater than or equal to US$5.3
billion, annual dollar value traded to float-adjusted market capitalization is greater than 1.0 and
minimum monthly trading volume of 250,000 shares in each of the six months leading up to the
evaluation date (Kaul, Mehrotra and Morck, 2000).
The constituent member securities must be publicly listed on either the New York
Security Exchange (including NYSE Arca or NYSE MKT) or NASDAQ (NASDAQ Global Select
Market, NASDAQ Select Market or the NASDAQ Capital Market). Securities that are ineligible
for inclusion in the index are limited partnerships, master limited partnerships, OTC bulletin
board issues, closed-end funds, ETFs, ETNs, royalty trusts, tracking stocks, preferred stock,
unit trusts, equity warrants, convertible bonds, investment trusts units (Madhavan, 2002;
Bankovica and Praņevics, 2007). The index is reviewed annually. According to Madhavan
(2002), constituent stock that do not meet the addition criteria are dropped or deleted while the
non-members who meet the criteria are added. The review effect have become a phenomena
that have attracted many scholarly work with varied results regarding stock performance
(Madhavan, 2002)
African capital market is characterised by emerging and frontiers stock exchanges which
are less efficient as compared to the developed market exchanges. Some of the most vibrant
bourse are Johannesburg Securities Exchange (JSE), Nigeria Securities Exchange (NSE),
Ghana Securities Exchange (GSE), Malawi Security Exchange (MSE) and Nairobi Security
Exchanges (NSE), among other exchanges. All these exchanges have varies stock indices
which are used to assess market performance. For the purpose of regional views of index
review, the study will review Johannesburg Securities Exchange.

© Authors
Licensed under Creative Common Page 164
The Johannesburg Stock Exchange offers secure, efficient secondary and primary capital
markets across a diverse range of securities, supported by our post-trade and regulatory
services. JSE is the preferred market for local and international investors looking to gain
exposure to the leading capital markets in South Africa and the broader African continent.
Currently the JSE is ranked the 19th largest stock exchange in the world by market
capitalisation and in African continent as the largest exchange. The bourse has several indices
which are used to measure performance of the market, market segment/sector or an economy
industry (Exchange Journal 2013).
The major stock indices managed by JSE are FTSE/JSE All-Share Index which
represent 99% of the full market capital value; FTSE/JSE Top 40. Index which consists of the
largest 40 companies ranked by full market value; The FTSE/JSE Top 40 Index - USD which
mirror the FTSE/JSE Top 40 Index but calculated in USD; The FTSE/JSE Mid-Capitalisation
Index which consist of the next 60 companies ranked by full market value; The FTSE/JSE Small
Capitalisation Index which consists of shares that are in the FTSE/JSE All-Share Index, but are
not large enough to qualify for the FTSE/JSE Top 40 Index or the FTSE/JSE Mid-Capitalisation
Index. Other indices are The FTSE/JSE Fledgling Index which consist of all ordinary securities
listed on the JSE which qualify or are eligible for inclusion in an index, but are too small to be
included in the FTSE/JSE All-Share Index; The FTSE/JSE Industrial 25 Index which track the 25
largest companies ranked by full market value (FTSE/JSE, 2015)
The most vibrant index which also doubles as the market performance gauge is the
FTSE/JSE Top 40 Index which consists of the largest 40 companies ranked by full market
value. All quarterly review of the JSE/ FTSE Africa Index Series constituents takes place in
March, June, September and December. The review meeting of the constituents is held on the
Wednesday before the first Friday of March, June, September and December using data to
determine full market cap as at the close of business on the Monday 4 weeks prior to the review
effective date. Any constituent changes will be implemented after the close of business on the
third Friday of the month under review (FTSE/JSE, 2015).
Details of the outcome of the review and the dates, on which any changes are to be
implemented, are published as soon as possible after the FTSE/JSE Advisory Committee
meeting is concluded. Just like well-established exchange, the reviews of the constituents
companies have attracted many scholars. The results of the deletion studies have remained a
puzzle.
Kenya is an emerging capital market with semi-strong market efficiency and one capital
market, the Nairobi Securities Exchange (Opiyo, 2014). The NSE has five indexes with the most
robust index being NSE 20 share index, which also acts as the market barometer. Index was

International Journal of Economics, Commerce and Management, United Kingdom
Licensed under Creative Common Page 165
established in 1966 as Nairobi Securities Exchange Ltd (initially Nairobi Stock Exchange) which
reflects daily prices of the 20 blue-chips companies (NSE, 2010). These companies are
extracted from three sectors of market which includes the Main Investments Market Segment
(MIMS), Alternative Investments Market Segment (AIMS) and Fixed Income Securities Market
Segment (FISMS) and consist of 70% of the capitalization of the Nairobi Securities Exchange.
The slot is allocated to markets/sectors as follows; Agricultural sector 1, Finance 6, Commerce
4, Industries 4 and AIMS 5 totalling to 20 companies (NSE, 2014).
Since the NSE 20 share index inception, the index have been reorganised severally with
stock either being deleted or included. Within the study analysis period, 1994 – 2014, the index
has been reviewed 13 times as follows: 1995, 1996, 2000, 2001, 2002, 2003, 2006, 2007, 2008,
2009, 2010, 2011 and 2014. This reviews, according to bourse authority, it is to enhance the
efficiency of the stock and to reflect the true market position (NSE, 2014). Considering that the
effect of the index reorganisation is a matter that influence firm management, investors and
market operators at large, capital market should as efficient as possible to eliminate market
abnormalities. However in most cases this has not been as observed that index reorganisation
results into market in-equilibrium (Opiyo, 2014) and redistributed assets return allocation.
Therefore, study will analyse the deletion effect of NSE 20 share index on stock market
performance in Kenya. The study will focus on index deletion effect on variables such as price
return, trading volume and volatility in order to determine the magnitude of the event and timing
during which these effects seem noticed.
The Index Management Sub-Committee does a quarterly periodic review of constituents
companies of the NSE 20 share index. These reviews are based on collection of data for a
period of one year as at the end of each quarter, and details of the outcome of the review are
published as soon as possible after the recommendations of the Index Management Sub-
Committee have been endorsed by the Trading Committee and ratified by the Board. However,
the change for the constituent companies are initiated and then adopted as soon there is any
need (NSE, 2012). The publication of details of index review marks the announcement of index
review. After announcement, review action or change of constituent company takes place
shortly after i.e. mostly the week following announcement week or when need arise.
Statement of the Problem
Scholarly review from mainstream indices in well established markets both globally, regionally
and locally have shown that stock addition to market index exhibit an abnormal return due to
price increase and trade liquidity. This is because index review transmit new information in the
market which may cause investors to rebalancing their portfolios leading market adjustment.

© Authors
Licensed under Creative Common Page 166
Although stock inclusion into index has shown positive effect, however with deletion has
exhibited mixed results with scholars reporting ‘no effect’ to ‘temporal price reduction effect’
mainly from developed markets. For example, Shankar and Randhawa (2006) examined the
effects of index changes in the Hong Kong and Singapore stock markets indicated that stocks
deleted from the HSI experience the opposite effect, that is, a significant decline in prices on the
announcement day (within ten days of the effective day) however the cumulative returns are not
statistically significant. A study by Chakrabarti (2000) on price and volume effects of changes in
MSCI Indices revealed that deleted stocks witness a steady and marked decline in their prices
and volumes traded goes up significantly.
Kenya being an emerging market, stock reaction to arrival of information has little study.
Though many proxies (earnings and dividends, IPOs and Right Issues) have been used to
assess the reaction of stock market to the arrival of new information (Opiyo, 2014), index
reconstruction as a proxy and especially the deletion effect has not been analysed. For
instance, Opiyo (2014) studied the effects of NSE 20 share index inclusion and reported
abnormal return following stock inclusion however the study did not analyse stock deletion.
Given the possible implication that stock deletion from index would have on its market share
performance, it’s important that this deletion puzzle is resolved, and especially from emerging
markets, like Kenya, which is characterized by information asymmetry. Therefore, the study
bridged this vital academic gap by assessing the effects of NSE 20 share index review on
market share performance of deleted stocks in Kenya.
Purpose of the Study
To assess the effects of NSE 20 share index review on market share performance of deleted
stocks in Kenya.
Specific Objectives
i. To determine the effects Announcement Review on Market Share Performance of deleted
stocks in Kenya.
ii. To establish the effects of Action Review on Market Share Performance of deleted stocks in
Kenya.
iii. To evaluate the effects of Information Contents Review on Market Share Performance of
deleted stocks in Kenya.

International Journal of Economics, Commerce and Management, United Kingdom
Licensed under Creative Common Page 167
THEORETICAL REVIEW
It commence with theoretical review which discusses various theories that explain stock market
operation mechanism.
Theories of Stock Price and Volume Movement
Several hypotheses have been proposed to explain the securities exchange market operation.
These theories in most cases concentrate on how arrival of corporate information or
announcements (e.g. index reorganisation/review, dividend pay-out e.t.c.) affects stock price
and volume. A greater percentage of these theories have been suggested in the context of
changes to the indexes in the US market, and have almost exclusively examined changes in the
S&P 500 index. Under this section, the study will review only three theories namely downward
sloping curve or price pressure, certification or information theory and investor recognition
theory.
Certification / Information Hypothesis
The most relevant theory that explains triggers of securities exchange market reaction is the
certification theory advanced by Jain in 1987. Index review, as an event, has positive or
negative information for stocks being added or deleted from index which leads to a revaluation
of the stock price. According to this hypothesis, an index inclusion would convey positive
information about the stocks while index deletion would convey negative information. This being
private information not known in the market, it triggers investors to balance their portfolios
according to the arrived information causing readjustment in stock equilibrium prices and trade
volumes i.e. positive effect for added stock and negative effect for deleted stock. This theory
also assumes reaction of prices to be symmetric for additions and deletions (Cai, J., 2007). The
readjustment also results in increase in expected future cash flows, thus affecting stock pricing.
The hypothesis is supported by the standard valuation model (SVM) developed by
Gordon in 1962. The new information content results to price change (increase for added stock,
fall for deleted stock) within the standard valuation model shows that stock current average
returns or present price is equivalent to the discounted future cash flows. The stock price
revaluation then stems either on the change in expected cash flows or on a change in the
required rate of return such as the discount rate (Kaul, Mehrotra and Morck, 2000). In support of
this postulate, Chen, Norohna and Singal (2004) observed that increases in expected future
cash flows can at least take place because of the following 3 reasons: certification, enhanced
investor awareness resulting in higher expected future cash flows, and enhanced investor
awareness resulting in better monitoring and more successful investment decisions. Also,
© Authors
Licensed under Creative Common Page 168
decrease in required return can accompany an index addition for several reasons: higher
liquidity due to higher trading volume, greater interest in the added stocks as a result of reduced
info asymmetry, and increased investors awareness due to decrease in shadow cost. This
hypothesis argues that S&P 500 Index additions involve information on an added firm’s future
operating performance, potential longevity, or representativeness in that firm’s industry (Denis,
McConnell, Ovtchinnikov, and Yu, 2003).
Downward Sloping Demand Curve (DSDC) Hypothesis and
Price Pressure Hypothesis (PPH)
The second hypothesis that explain the market reaction to corporate information is downward
sloping demand curve or price pressure hypothesis developed by Shleifer in 1986. This theory
based on investor’s preference for local or rated stocks to foreign or unrated stocks. The theory
holds that corporate announcement are information free events and stock market are efficient
(Hegde and McDermott, 2003). In reference to index review, downward sloping demand curve
and the price-pressure hypothesis assumes that any inclusion of a share into an index is an
‘information free’ situation since deletion (or addition) of stock into an index does not show any
reflection on the firm’s future earnings. Researchers have suggested several hypotheses from
the first documentation of price effects of Standard and Poor’s (S&P) index revision which was
more than two decades ago. These hypotheses have tried to elaborate on the stock price
changes with respect to deletion from (addition to) the S & P 500: the stock price effects to
these announcements should be either information free, as a result of the downward-sloping
curves for index stocks; or should consist of information relevant in pricing the newly included or
deleted stocks carried in the revision decision by S&P (Lindsay Baran, Chang Liu, Zilong Liu
and XiaolingPu, 2015).
Investor Recognition Hypothesis (IRH)
This hypothesis was suggested 1987 by Merton. The theory holds that positive corporate
announcement increases awareness of investor’s and hence decreasing show cost for
corporate activities monitoring. Investor recognition (IR) is a key determinant of expected
returns. It is also an important determinant of corporate financial policy and changes in investor
recognition are strongly related to contemporaneous and future corporate financing and
investing activities. IRH can be interpreted as following; when a stock is included to the index,
more investors become aware and hold it for its diversification benefits. As a result, the shadow
cost reduces and there is a permanent reduction in the stock price. This theory does not require
the price effects to be symmetric, since the deletion of an index would not necessarily mean

International Journal of Economics, Commerce and Management, United Kingdom
Licensed under Creative Common Page 169
investors becoming unaware of the stock (Reuven L, and Richard G, 2008). The investor
recognition hypothesis also explains that expected return news is relatively more important in
small firms. The variance of cash flow news is greater in small firms, causing them to have
increased idiosyncratic risk (Vuolteenaho’s 2002).
Conceptual Framework
According to Kothari (2004), conceptual framework provides clear concepts of the areas in
which meaningful relationships are of variables are likely to exist. This study developed a
conceptual framework (figure 1) where independent variable was the arrival of stock deletion
announcement in the market. This, according to the study, is information with a potential to
evoke price and liquidity changes. Change, that is, stock performance is the dependent variable
and was assessed on market price and trade volume adjustment.
Figure 1. Conceptual Framework
RESEARCH METHODOLOGY
The study adopted an event study research design. This design provides a better way of
evaluating the magnitude of a movement over time (Fama, 1991) and measure the impact of a
specific event, for instance index review, on the value of a firm with the use of financial market
data. Event study design method also give a clear picture of the speed of adjustments of prices
to information in the context of the stock exchange (MacKinlay, 1997; Kothari and Warner,
1997; Terry, 2009). Thus, the design was suitable for the study.
Announcement Review
% Change in Stock returns
A ctual Review
% Change in Stock returns
Information C ontent Review
Temporal/permanency of change effect
Stock Market P erformance
%Stock returns

© Authors
Licensed under Creative Common Page 170
The target population of the study comprise all companies that were deleted from the NSE 20
share index from 1994 to 2014. According to NSE 20 share index review press release
information, the index has been reviewed nine times, with a total of 18 stocks being deleted
from the index within the analysis period. Therefore, the study targeted a population of 18
stocks as shown in Table 1.
Table 1: Target population
S/no Review Year Deleted stocks Totals
1. 1995 CMC Holdings 1
2. 1996 Lonrho Motors 1
3. 2000 African Lakers Corp
K. National MIlls 2
4. 2002 E A Packaging 1
5. 2006
Uniliver Tea
Williamson Tea
Kakuzi
Uchumi
NIC Bank
BOC Gases
6
6. 2007
TPS Eastern
Diamond Trust
Sammer Africa
Total Kenya
4
7. 2008 Centum Investment 1
8. 2010 East Africa Cables Ltd 1
9. 2014 Mumias sugar co. ltd 1
Grand Totals 18
Source: Nairobi Securities Exchange (2016)
The study gathered only secondary data from NSE daily trading results for the entire study
period. These data included; NSE 20 share index reviews announcement and inclusion dates,
daily closing prices and trade volumes for deleted stocks, NSE 20 share index daily closing
basis points. All these data covered the event window (14 days) and market return analysis
window (90 days). Where necessary, closing prices were adjusted for dividend and changes in
capital structure (i.e. stock splits or stock consolidation).

International Journal of Economics, Commerce and Management, United Kingdom
Licensed under Creative Common Page 171
The study employed Ordinary Least Square (OLS) Regression method to estimate the market
model parameters (to be used in determining residual effect). Pearson correlation analysis was
done to establish the relationship between pre and post inclusion stock movement. Significance
effects were tested using parametric test statistics t-test statistics. Study findings are presented
in the form of frequency tables, percentages, pie charts and graphs, followed with detailed
discussion of the finding, summary of findings, conclusions and recommendations.
Model Specification
The chronological order of the time variable in the study event for the purposes of analysis was
computed as shown in Figure 2.
Figure 2: Chronology of Event Analysis
Review period (14 days)
Analysis period (90 days)
Source: Adopted and modified from MacKinlay (2007)
According to figure 2, T0 will represent the stock deletion day. T-6 and T+6 show the review/event
period (announcement and action dates), and T-44 and T+44 marks the study analysis period. The
study chose analysis period of 90 days with an event window of 14 days, pre and post event
windows of 44 days. The researcher chose 14days event/review window as, in most cases,
NSE 20 share index review announcement and action normally occurred within two successive
weeks. In addition, NSE market was less efficient and thus would respond to index changes
Pre - review period (44 days) Post - review period (44 days)

© Authors
Licensed under Creative Common Page 172
more slowly. In support of this, Kiete and Uloza (2005) used 14 days event window and showed
that in was ideal for an emerging market. However, Peterson (1989) argued that 21day event
period is more ideal, whereas Dhillon and Johnson (1991) extended their event window period
to 61 days.
The estimation period of 90 days was chosen based on a research done by Kothari and
Warner (2004), who found this the most widely used length of estimation period in event
studies. In addition, 90 days period is sufficient to capture and iron out any possible seasonality
effects on stock prices thus could give more accurate estimation of model parameters.
ANALYSIS AND DISCUSSION OF FINDING
Estimated Parameters of OLS Regression Model
The study used the weighted price method to compute NSE 20 share index return for the
estimation of market model parameter. According to MacKinlay (1997), under general conditions
Ordinary Least Squares (OLS) is a consistent estimation procedure for the Market model
parameters.
For the ith firm in event time, the OLS estimators of the market model parameters for an
estimation window of observations are;
Where μi and μm are the mean return for both security i and market return during period T.
The results of estimated Ordinary Least Square (OLS) regression parameters yielded a beta (β)
of 0.516034729 and alpha (α) of -0.001306774. The computed individual stock ARi, Market
Returns (Rm), Average Abnormal Returns (AARi) and Cumulative Return (CARi) are attached as
appendixes.

International Journal of Economics, Commerce and Management, United Kingdom
Licensed under Creative Common Page 173
Announcement review effects
The specific objective one sought to establish the effects of index review announcement on
deleted stock performance. The study used the Market model (Brown and Warner, 1985) to
estimate normal return around the event window. The Market model assumed that asset returns
are normally distributed. According to MacKinlay (1997) for any stock i the normal returns can
be expressed as:
Rit=̂α+β̂Rmt+εit ~ (iv)
Where Rit and Rmt are period t returns of stock i and market portfolio respectively. ɛit is the zero
mean residual. α̂,β̂ and εit are parameters of the model that have to be estimated.
Using the computed standard OLS regressions results, the abnormal returns of a stock and the
cumulative abnormal returns were computed as follows;
~ N(0, σ2) (v)
(vi)
Analysis finding within the event window was presented in table 2 and figure 3. Findings
indicated that MR, AAR and CAR were all positive before the review announcement however the
AAR and CAR curves turned negative a day (T=-1) before the announcement day (T=0). The
AAR was relatively stable up to time T=-3 from where it recorded a consecutive decline from
0.18% (t=-3) to – 0.56% (t=0) and with the lowest pre announcement return being on the
announcement day (T=0). After the review announcement, deleted stocks AAR continued to
record a relatively declining returns up to time t= 6. The similar trend was also confirmed by the
CAR. This finding implied that prior to review announcement, the to be deleted stock
performance were average however, three days to deletion announcement, already a decline in
return was exhibited. This could be attributed to market active participants or analysis who could
have predicted with some degree of accuracy stocks to be deleted.
These findings were supported by Sandra and Janis (2007) who showed that significant
abnormal returns were present on the announcement day, and investments in these stocks
would earn on average 5.1% over the subsequent month. However the study did not make any
clear conclusions regarding existence of abnormal returns on the inclusion day. In addition, the
© Authors
Licensed under Creative Common Page 174
findings also showed that both events (the announcement of inclusion and the actual inclusion
itself) contained new information, which was observable through significant increase in
volatilities of the stocks.
In addition, it could also be due to possibility of trading on inside information. The further
sharp drop in abnormal return after review announcement could be attributed to fund manager’s
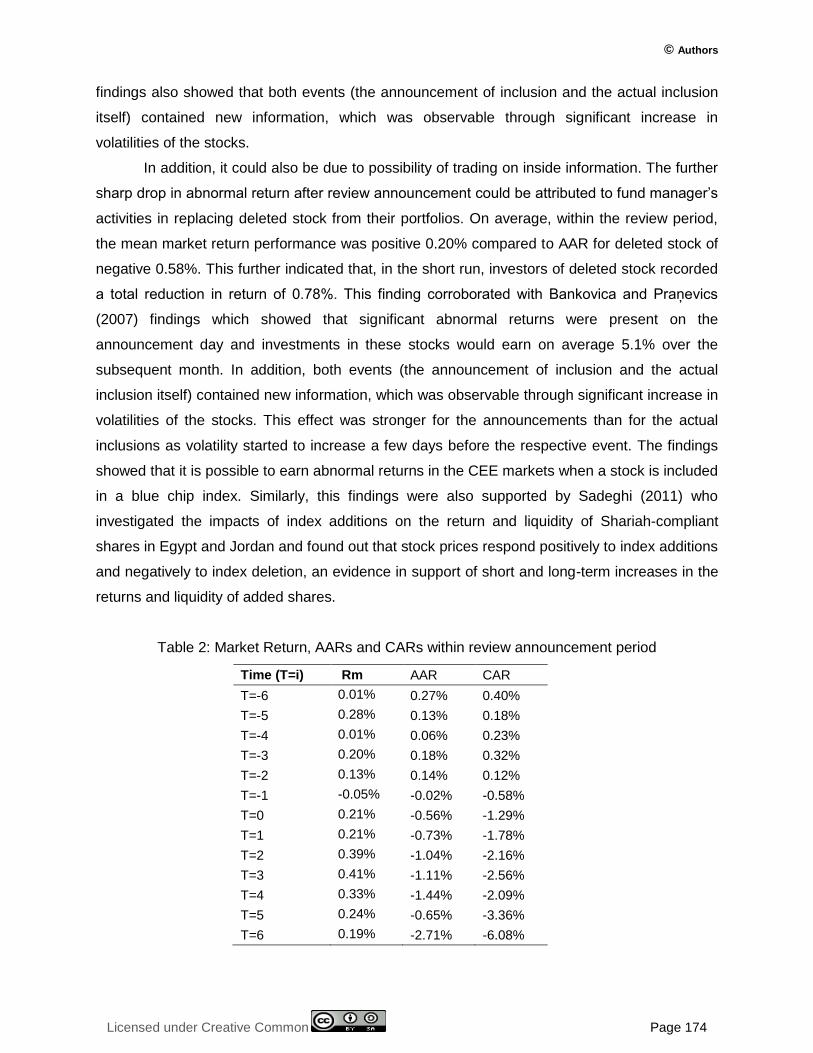
activities in replacing deleted stock from their portfolios. On average, within the review period,
the mean market return performance was positive 0.20% compared to AAR for deleted stock of
negative 0.58%. This further indicated that, in the short run, investors of deleted stock recorded
a total reduction in return of 0.78%. This finding corroborated with Bankovica and Praņevics
(2007) findings which showed that significant abnormal returns were present on the
announcement day and investments in these stocks would earn on average 5.1% over the
subsequent month. In addition, both events (the announcement of inclusion and the actual
inclusion itself) contained new information, which was observable through significant increase in
volatilities of the stocks. This effect was stronger for the announcements than for the actual
inclusions as volatility started to increase a few days before the respective event. The findings
showed that it is possible to earn abnormal returns in the CEE markets when a stock is included
in a blue chip index. Similarly, this findings were also supported by Sadeghi (2011) who
investigated the impacts of index additions on the return and liquidity of Shariah-compliant
shares in Egypt and Jordan and found out that stock prices respond positively to index additions
and negatively to index deletion, an evidence in support of short and long-term increases in the
returns and liquidity of added shares.
Table 2: Market Return, AARs and CARs within review announcement period
Time (T=i) Rm AAR CAR
T=-6 0.01% 0.27% 0.40%
T=-5 0.28% 0.13% 0.18%
T=-4 0.01% 0.06% 0.23%
T=-3 0.20% 0.18% 0.32%
T=-2 0.13% 0.14% 0.12%
T=-1 -0.05% -0.02% -0.58%
T=0 0.21% -0.56% -1.29%
T=1 0.21% -0.73% -1.78%
T=2 0.39% -1.04% -2.16%
T=3 0.41% -1.11% -2.56%
T=4 0.33% -1.44% -2.09%
T=5 0.24% -0.65% -3.36%
T=6 0.19% -2.71% -6.08%

International Journal of Economics, Commerce and Management, United Kingdom
Licensed under Creative Common Page 175
Figure 3: Market Return, AARs and CARs within review announcement period
Action review effects
Findings for study objective two, which was crafted to assess the effect of index review action
on share price performance is illustrated in Table 3 and Figure 4. The finding revealed that AAR
and CAR were relatively negative and below the MR however at t=-6 and t=-5 AAR were positive
but declining. Compared to post review announcement findings (sharp decline in AAR), the
reported positive AAR could have resulted from decline in activities of speculators and fund
managers who were cautious of return and would prefer future capital gain instead. As a result,
the market reacted to the anomaly and tried to correct itself. Another reason for the reported
decline in AAR after review announcement and before review action would be due to change of
investor’s mind, especially, institutional fund managers who faults the NSE decision after their
own investigation and could see future growth prospects in deleted stock. These investors
created demand for deleted stock stabilizing stock prices and returns. These finding
corroborated finding by Madhavan (2002) who suggested that a significant portion of excess
returns due to price pressure were realised during index announcement period. In addition,
reported permanent changes in liquidity also corroborates with the study finding implying to
investors would experience lower net returns where implicit transaction costs associated with
demanding liquidity at specific points in time are captured.
On the review action date (t=0), AAR reported negative returns which continued to time
t=2 and the highest negative return of -3.08% on time t=3. This reversed AAR following review
action could be attributed to activities of fund managers whose investment policies do not allow
them to keep non index stocks in their portfolio. Therefore they only act after deletion action and
% -7.00
-6.00 %
% -5.00
-4.00 %
-3.00 %
-2.00 %
% -1.00
0.00 %
1.00 %
T=-6 T=-5 T=-4 T=-3 T=-2 T=-1 T=0 T=1 T=2 T=3 T=4 T=5 T=6
MKT
AAR
CAR

© Authors
Licensed under Creative Common Page 176
not on announcement. Furthermore, the reported three consecutive declines in AAR could also
be due to prudent investor (non-speculative) who made decision on actions and not
announcement or follows what the majority does. After the third day (t=3) of review action, a
decline in AAR was witnessed which turned to positive on t=5 and continued to rise the
following day (t=6) to 1.10%. On average, the deleted stock performance within the review
action period was negative 0.59% compared to market return of positive 0.13%. This implied
that during index review action, deleted stock recorded a total decline in return of 0.72% (a
reduction in negative AAR compared to review announcement window [0.78%]). In addition,
market return also declined from 0.20% (review announcement window) to 0.13% (review action
window), implying that deleted stock were among the major determinants of market
performance or index deletion has negative effects on the overall market performance. The
study finding of reversal of significance return after review action was supported by Shankar and
Randhawa (2006) study which reported that stocks deleted from HSI show significantly negative
returns at announcement but these returns were subsequently reversed within 10 days after the
effective day. In addition, these findings was also confirmed by the trends in the abnormal
trading volume which showed a spike around the announcement and effective days, but
reverted to normal in the post-effective day period.
The study further collaborated with Hacibedel and Bommel (2006) who found convincing
evidence of positive (negative) permanent price impacted upon index inclusion (exclusion).
Furthermore, the analyzed returns over an event window from before announcement to after
inclusion, the study found evidence of a pronounced short term drift which is partially reversed
at the inclusion date. The study concluded that in the short term phenomenon there was limited
arbitrage on the predictable portfolio rebalancing behavior of tracker funds and index changes
were not information free events.
Table 3: Market Return, AARs and CARs within review action period
T=-6 0.01% 0.07% 0.07%
T=-5 0.28% 0.03% 0.10%
T=-4 0.01% -1.06% -0.96%
T=-3 0.20% -0.18% -1.14%
T=-2 0.13% -0.94% -2.08%
T=-1 -0.05% -0.02% -2.10%
T=0 0.11% -1.16% -3.26%
Ti R m AAR CAR

International Journal of Economics, Commerce and Management, United Kingdom
Licensed under Creative Common Page 177
T=1 0.11% -2.13% -5.39%
T=2 0.19% -3.08% -8.47%
T=3 0.21% -0.26% -8.73%
T=4 0.13% -0.21% -8.94%
T=5 0.14% 0.19% -8.75%
T=6 0.19% 1.10% -7.65%
Figure 4: Market Return, AARs and CARs within review action period
Review information content
Specific objective three aimed to assess the information content of index review. This was
important to determine whether index review transmitted new information that would influence
pricing of securities. The study analysed the average return performance for deleted stocks
within 16 days window divided into 10 days pre announcement period and six days post
announcement period. Study findings was shown in figure 5, and illustrates that the AARs for
deleted stocks were relatively higher that the Rm. After the review announcement, a change in
performance was exhibited as deleted stock AARs declines and below the Rm. This finding on
changes and positions of Rm and AARs before and after review announcement implied that
indeed, index review transmitted information into the market. Study of the CARs curve also
pointed to the same as it showed a rise, reached maximum at announcement and turned to
decline cumulative returns after announcement. This finding collaborated with Shankar and

© Authors
Licensed under Creative Common Page 178
Randhawa (2006) finding that showed index review announcement signified a new information
in the market, which was observable through significant increase in volatilities of the stocks. The
study finding on information content also agreed with Howard and Chan (2002) finding which
reported that deleted stocks realized a decline in return of up to 3% on the first trading day after
the change denoting present of new information in the market. Furthermore, the finding were
also supported by Brealey and Richard (2000) study titled ‘Stock prices, stock indexes and
index funds’ whose findings showed that present significant abnormal returns at the
announcement day compared to action date indicated present of information content.
Figure 5: Market Return, AARs and CARs movement within review announcement period
to test for information content
Market Share Performance
Market return declined from 0.20% (review announcement window) to 0.13% (review action
window), implying that deleted stock were among the major determinants of market
performance or index deletion has negative effects on the overall market performance. These
were clearly illustrated in both Figure 4 and 5.This was a clear indication that deleted stock were
among the major determinants of market performance or index deletion has negative effects on
the overall market performance
Inferential statistics – Test of hypothesis
The study employed parametric tests, which assumed that individual firm’s abnormal returns
were normally distributed (Pattel, 1978). Using the AR, the study computed the Average
Abnormal Return (AAR) for stock i for days T (event day being t = 0) as well as variance of
MKT -0.50 %
0.00 %
0.50 %
% 1.00
% 1.50
% 2.00
MKT
AAR
CAR

International Journal of Economics, Commerce and Management, United Kingdom
Licensed under Creative Common Page 179
abnormal returns (var(ARi)) to test for the significance of ARs in the sub-event windows (i.e.
estimation period and event period).
~ N(0, var(ARi)) (vii)
(viii)
The AR were then standardized to ensure that each have the same variance by dividing each
residual by the standard deviation (obtained over the estimation period) as follows;
~ N(0,1) (ix)
Therefore, in a particular event window, the test statistics of the hypothesis that the average
standardized residual across firm was equal to zero, it was computed and tested with t-test
statistics, which assumed that average standardized residual (AARs) across firm was equal to
zero, that is, individual firm’s abnormal returns were normally distributed within the event
window as shown.
Significance of review announcement effect
The first study hypothesis stated that ‘announcement review had no significant effects on
market share performance of deleted stocks’ was analysed by comparing mean differential
between pre and post announcement means. The results were illustrated in table 4. From the
results of these findings, there was a decrease in AARs means from positive 0.001263 to
negative 0.01283 (for pre and post review announcement respectively) and increase in stock
variances from 9.90981E-07 to 5.72643E-05 (for pre and post review announcement
respectively). There was strong positive Pearson correlation of 0.724 denoting that both pre and
post review announcement returns were moving in the expected direction. The test for the
significance of mean differential, at 95% level of confidence, gives t-stat of 5.01638 against t
critical one-tail 2.015 (p=0.002) and t critical two tail ±2.5706 (p=0.004). Both t critical values (t
one-tail and t two-tail) failed to accept the null hypothesis as there was significance differences
between pre and post deletion review announcement AARs in the short run following index
reviews. These findings were confirmed by Bildik and Gulay (2001), Chen et al (2004), Denis et
al (2003) and Howard and Chan (2002), all who reported significance effects on index review
announcement.

© Authors
Licensed under Creative Common Page 180
Table 4: t-Test: Paired Two Sample for Means during review announcement period
Pre-announcement Post-announcement
Mean 0.001263009 -0.012829072
Variance 9.90981E-07 5.72643E-05
Observations 6 6
Pearson Correlation
Hypothesized Mean
0.723827383
Difference 0
Df 5
t Stat 5.016388963
P(T<=t) one-tail 0.00202379
t Critical one-tail 2.015048373
P(T<=t) two-tail 0.00404758
t Critical two-tail 2.570581836
Significance of review action effect
The second study hypothesis - ‘action review had no significant effects on market share
performance of deleted stocks’ - was also analysed by comparing mean differential. The result
were shown in table 5 and illustrates that there was an increase in negative AARs means from
negative 0.0035 to negative 0.00732 (for pre and post review action respectively) and decrease
in stock variances from 2.6216E-05 to 2.43382E-04 (for pre and post review action
respectively). In addition, there was a weak negative Pearson correlation of -0.4169 denoting
that as pre review action returns were falling, post action results were rising. The test for the
significance of mean differential, at 95% level of confidence, gives t-stat of 0.50987 against t
critical one-tail 2.015 (p=0.316) and t critical two-tail ±2.5706 (p=0.6314). Both t critical values (t
one-tail and t two-tail are greater than t stat, p>0.05) failed to reject the null hypothesis as there
was no significance differences between pre and post deletion review action AARs in the short
run following index reviews. This finding was corroborated by Chen et al (2004) and Denis et al
(2003) who reported that review action experienced insignificance effects on deleted stock
performance.

International Journal of Economics, Commerce and Management, United Kingdom
Licensed under Creative Common Page 181
Table 5: t-Test: Paired Two Sample for Means during review action period
Pre-action Post-action
Mean -0.0035 -0.007316667
Variance 0.000026216 0.000243382
Observations 6 6
Pearson Correlation
Hypothesized Mean
-0.416935863
Difference 0
Df 5
t Stat 0.509867515
P(T<=t) one-tail 0.315922854
t Critical one-tail 2.015048373
P(T<=t) two-tail 0.631845708
t Critical two-tail 2.570581836
Significance of review information effect
The third and last hypothesis - ‘review information contents had insignificant effects on market
share performance of deleted stocks’ - was also assessed by further analysis of results obtained
from hypothesis one and two. For objective one, results for test for the significance of mean
differential, at 95% level of confidence yielded t-stat of 5.01638 against t critical one-tail 2.015
(p=0.002) and t critical two-tail ±2.5706 (p=0.004), of which both t critical values failed to accept
the null hypothesis as there was significance differences between pre and post deletion review
announcement AARs in the short run following index reviews. This affirms that index review
announcement had significance information that affects market share performance. This finding
corroborates with Howard and Chan (2002) all who reported that review announcement has
significance effects denoting new information.
Furthermore for hypothesis two, the test for the significance of mean differential, at 95%
level of confidence gave t-stat of 0.50987 against t critical one-tail 2.015 (p=0.316) and t critical
two-tail ±2.5706 (p=0.6314), both failed to reject the null hypothesis as there was no
significance differences between pre and post deletion review action AARs in the short run
following index reviews. Thus this finding also affirmed that index review action had no
significance information that affected market share performance. These findings were supported
by Bildik and Gulay (2001) and Howard and Chan (2002), who reported insignificance effect on
review action denoting no new information for security pricing. Furthermore, the finding were

© Authors
Licensed under Creative Common Page 182
also supported by Brealey and Richard (2000) study titled ‘Stock prices, stock indexes and
index funds’ whose findings showed that present significant abnormal returns at the
announcement day compared to action date indicated present of information content.
SUMMARY OF FINDINGS
Announcement review effects
During announcement review period, Rm, AAR and CAR were all positive before the review
announcement however the AAR and CAR curves turned negative a day to announcement day
(T=0). The AAR was relatively stable up to time T=-3 from where it recorded a consecutive
decline from 0.18% (t=-3) to – 0.56% (t=0) and with the lowest pre announcement return being
on the announcement day (T=0). After the review announcement, deleted stocks AAR continue
to record a relatively declining returns up to time t= 6. On average, within the review period, the
mean market return performance was positive 0.20% compared to AAR for deleted stock of
negative 0.58%, indicating that, in the short run, investors of deleted stock recorded a total
reduction in return of 0.78%.
Action review effects
Summary of index review action effects revealed that AAR and CAR were relatively negative
and below the RM during action window, however at t=-6 and t=-5 AAR were positive but
declining. On the review action date (t=0), AAR reported negative returns which continues to
time t=2 and the highest negative return of -3.08% on time t=3. After the third day (t=3) of
review action, a decline in AAR is witnessed which turns to positive on t=5 and continue to rise
the following day (t=6) to 1.10%. On average, the deleted stock performance within the review
action period was negative 0.59% compared to market return of positive 0.13%.
Review information content
Summary for review of information content illustrated that the AARs for deleted stocks were
relatively higher that the RM. After the review announcement. A change in performance was
exhibited as deleted stock AARs declines and below the level of Rm after index review
announcement implying that index review transmitted information into the market.
CONCLUSIONS
The study concluded that there exists a strong positive relationship between pre and post
review announcement returns as both moved in the expected direction. In the short run,
investors of deleted stock could lose a total of 0.78% of the returns. Furthermore, study

International Journal of Economics, Commerce and Management, United Kingdom
Licensed under Creative Common Page 183
concluded that there was a significance differences between pre and post deletion review
announcement AARs in the short run following index reviews. Thus, index review
announcement had negative significance effects on deleted stocks.
The study also concluded there was is a weak negative Pearson correlation between pre
and post review action returns (as pre review returns falls, post action results were rise). The
study further concluded that within the review action period investors could record a reduction of
0.72% return on stock following index review action. Finally, study concluded that there was no
significance effect of index review action on performance of deleted stock.
The study concluded that index review announcement had significance information that
affected market share performance, while index review action had no significance information
that affected market share performance.
RECOMMENDATIONS
Review announcement
The study recommended that, for fund managers or investors with ability to analyse stock
returns, the predicted stocks to be deleted should be replaced before the review announcement
date to avoid loss of value. The study also recommended that following the significance of
review announcement effects, investors should dispose deleted stock a day after
announcement otherwise after the third day, massive reduction in return would results to great
loss.
Review action
The study recommended that deleted stock should not be disposed-off after review action as in
most cases, the market tend to revert the NSE decision. If done, then this could results into
massive return loss following the continued decline in return from announcement to action time.
Indeed, study recommended that for investors who were interested in long-term return should
purchase deleted stocks, as exhibited by rise in AAR after deletion action. Last but not least, the
study recommended that index review action should not be used as information to guide in
stock portfolio readjustment.
Review information effect
The study recommended that index review announcement could be used as new information to
be incorporated in making stock investment decision or stock portfolio rebalance

© Authors
Licensed under Creative Common Page 184
SUGGESTION FOR FURTHER STUDIES
The study suggested the following further studies: The effects of firm’s market share
performance on both inclusion and deletion from other market indices apart from blue chip
index. Additionally, estimations of normal returns could be recalculated using economic models
instead of statistical model used by the study, for example, using the model by Fama and
French (1993).
REFERENCES
Bankoviča, S., Praņevičs J., (2007), How does Inclusion in an Index Affect Stock Prices? SEE Evidence, Stockholm School of Economics in Rige.
Bildik and Gulay (2001), The effects of changes in index composition on stock prices and volume
Brealey, Richard (2000), Stock prices, stock indexes and index funds, Bank of England Quarterly Bulletin 40: 61-69.
Cai, J., (2007), What’s in the news? Information content of S&P 500 additions. Financial Management 36, 113–124.
Capital Markets Authority (2009) Capital Markets Authority Handbook. Retrieved from http//cma.or.ke on September 14, 2014
Capital Markets Authority (2014). What is the role of capital markets in an economy? Retrieved from http//cma.or.ke on September 14, 2014
Chakrabarti (2000), Price and Volume Effects of Changes in MSCI Indices
Chen, H., Noronha G. and Sigal V., (2004), The Price Response to S&P 500 Index Additions and Deletions: Evidence of Asymmetry and a New Explanation. Journal of Finance 59: 1901-1930.
Denis D, McConnell J, Ovtchinnikov A, Yu Y,.(2003), S&P 500 Index additions and earnings expectations. Journal of Finance, 58: 1821-1840.
Duque and Madeira (2010) Effects of stock index review.
Fama, E. F. (1991). Efficient capital markets: A review of theory and empirical work. The Journal of Finance, 25(2), 383-417.
Fama, E., Fisher L., Jensen M. and Roll R. (1970), The adjustment of stock prices to new information, International Economic Review 10: 1-21.
Gordon, M.., (1962), Optimal Investment and Financing Policy, The Journal of Finance, 18(2):264 – 272.
Hacibedel, B. and Bommel, J. V., (2006), Do frontier markets benefit from index inclusion? Money Macro and Finance (MMF) Research Group Conference (2006)
Hegde, S., and J. McDermott (2003), The Liquidity Effects of Revisions to the S&P 500 Index. Working paper, University of Connecticut.
Howard and Chan,. (2002), Additions to and Deletions from an Open-Ended Market Index: Evidence from the Australian All Ordinaries Index: Australian Journal of Management 27: 45-74.
Jain, P. (1987), The Effect on Stock Price of Inclusion or Exclusion from the S&P 500, Financial Analysts Journal, Vol. 43, no. 1 (January/February):58-65.
Jegadeesh, N. & Titman, S. (2012). Returns to buying winners and selling losers: Implications for stock market efficiency. Journal of Finance, 48(1), 65-91.
Jones, C. P. (2014). Investments: Analysis and management. New York: John Wiley and sons. Kang'aru (2008, September 16). NSE meets over share price rules. Daily Nation: Smart Company, pp 1A,5C.

International Journal of Economics, Commerce and Management, United Kingdom
Licensed under Creative Common Page 185
Kaul, Mehrotra and Morck (2000),assessed the effects of changes in the weights of stocks included in the Toronto Stock Exchange index from market-cap based to free-float
Kiete K. and Gediminas U., (2005), The Information Efficiency of the Stock Markets in Lithuania and Latvia., SSE Riga Working Papers 7.
Kothari S.P. and Jerold B. Warner (2007), Econometrics of event studies: Handbook of Corporate Finance: Empirical Corporate Finance. NorthHolland: Elsevier.
Kothari, S. and Warner J., (1997), Measuring long-horizon security price performance, Journal of Financial Economics 43: 301-339.
Lindsay, B., Chang, L., Zilong, L., and Xiaoling, P., (2015), The Impact of S&P 500 Index Revisions on Credit Default Swap Market
MacKinlay, A. Craig, (1997), Event Studies in Economics and Finance, Journal of Economic Literature 35(1), 13-39
Madhavan, A., (2002). Index reconstruction and Equity Return, In Brian Bruce (editor), Institutional Investor Inc., Investment Guide: Transaction Costs, 12-19.
McLaney, E. (2005). Business finance: Theory and practice. Essex: Prentice Hall.
Merton, Robert C., (1987), A Simple Model of Capital Market Equilibrium with Incomplete Information, The Journal of Finance 42(3), 483-510
Nairobi Stock Exchange (2014). Retrieved from http//nse.co.ke on October 15, 2014.
NSE (2009).NSE Press Release: Review of NSE 20 Share Index Constituent Companies. Nairobi. NSE
NSE (2010), Nairobi Security Exchange 20 Share Index Listing Manual, NSE, Nairobi-Kenya.
NSE (2010).Revised NSEListing Manual. Nairobi: NSE.
NSE (2010b), Revised NSE 20 Share Index Constituent Company Manual. Nairobi: NSE.
NSE (2011), Rules and regulation manual. Nairobi: NSE.
NSE (2012), Nairobi Security Exchange Monthly Trading Highlights, NSE, Nairobi-Kenya.
NSE (2012).Ground Rules for the Management of the NSE 20 Share Index. Nairobi: NSE
NSE (2013).NSE Press Release: NSE Launches of the Growth Enterprise Market Segment (GEMS). Nairobi: NSE (www.nse.co.ke).
NSE (2013b).NSE Press Release: Listing of HomeAfrika Limited . Nairobi: NSE. (www.nse.co.ke)
Opiyo and Kubasu, (2014),The effects of firm’s Market Share performance on inclusion in NSE 20 Share Index.
Sadeghi M., (2011), Shariah-compliant Investment and Shareholders’ Value: An Empirical Investigation, Global Economy and Finance Journal, Vol. 4. No. 1. March 2011 Pp. 44-61
Shankar, S., G., and Randhawa, D. S., (2006), The effects of Index changes in the Hong Kong and Singapore stock markets, Saw Centre for Financial Studies, Working Paper: 06-01
Shleifer, Andrei (2005), Do Demand Curves for Stocks Slope Down? The Journal of Finance 41 (3), 579590
Vuolteenaho, T. (2002). What drives firm-level stock returns? The Journal of Finance, 57, 233–265

© Authors
Licensed under Creative Common Page 186
APPENDICES
Appendix I: RM, AARs and CARs for deleted stocks within announcement window

International Journal of Economics, Commerce and Management, United Kingdom
Licensed under Creative Common Page 187
KEY: MKT – Market (NSE 20 Share Index), CMC - CMC Holdings, LM - Lonrho Motors, ALC - African Lakers Corp, KNM - K. National Mills, EAP - E A Packaging, UT - Uniliver Tea, WT - Williamson Tea, KL – Kakuzi, UL – Uchumi, NIC - NIC Bank, BOC - BOC Gases, PTS - TPS Eastern, DT - Diamond Trust, SA - Sammer Africa, TK - Total Kenya, CI - Centum Investment, EAC - East Africa Cables Ltd, MS - Mumias sugar co. ltd.
Appendix II: RM, AARs and CARs for deleted stocks within action window
Mills, EAP - E A Packaging, UT - Uniliver Tea, WT - Williamson Tea, KL – Kakuzi, UL – Uchumi, NIC - NIC Bank, BOC - BOC Gases, PTS - TPS Eastern, DT - Diamond Trust, SA - Sammer Africa, TK - Total Kenya, CI - Centum Investment, EAC - East Africa Cables Ltd, MS - Mumias sugar co. ltd.
Ti MKT CMC LM ALC KNM EAP UT WT KL UL NIC BOC TPS DT SA TK CI EAC
T=- 6 0.01% 0.02% 0.02% 0.25% 0.30% 0.18% 0.20% 0.02% 0.02% 3.49%
- 0.21%
- 0.20% 0.18% 0.25% 0.02% 0.25% 0.30%
- 0.21
T=- 5 0.28%
- 0.06%
- 0.01% 1.42% 0.10% 0.01%
- 1.19%
- 0.06%
- 0.01%
- 1.52%
- 0.49% 0.10% 0.01% 1.42%
- 0.06% 1.42% 1.70%
- 0.49
T=- 4 0.01% 0.18% 0.18% 0.28% 0.02%
- 0.20%
- 0.23% 0.18% 0.18%
- 1.18% 0.25% 0.02%
- 0.20% 0.28% 0.18% 0.28% 0.34% 0.25
T=- 3 0.20%
- 0.08% 0.01% 0.23% 0.25%
- 0.13%
- 0.19%
- 0.08% 0.01%
- 0.06% 1.42%
- 0.10%
- 0.13% 0.23%
- 0.08% 0.23% 0.28% 1.42
T=- 2 0.13%
- 0.20%
- 0.20% 0.36% 1.42%
- 0.05% 0.40%
- 0.20%
- 0.20% 0.02% 0.28%
- 0.10%
- 0.05% 0.36%
- 0.20% 0.36% 0.43% 0.28
T=- 1
- 0.05% 0.10%
- 0.13%
- 0.19% 0.28%
- 0.11%
- 0.05% 0.10%
- 0.13%
- 0.06% 0.23%
- 0.20%
- 0.11%
- 0.06% 0.10%
- 0.06%
- 0.07% 0.23
T=0 0.11% 0.02% - 0.05%
- 1.91% 0.23%
- 0.21%
- 0.21%
- 1.73%
- 0.05%
- 1.73% 0.36%
- 1.19%
- 0.21%
- 1.73%
- 1.73%
- 0.05%
- 0.21% 0.36
T=1 0.11% - 0.10%
- 0.11%
- 1.73%
- 0.23%
- 0.49%
- 0.49%
- 1.68%
- 0.11%
- 1.68%
- 0.06%
- 0.23%
- 0.49%
- 1.68%
- 1.68%
- 0.11%
- 0.49%
- 1.73

© Authors
Licensed under Creative Common Page 188
Appendix III: RM, AARs and CARs for deleted stocks to signify information content
Mills, EAP - E A Packaging, UT - Uniliver Tea, WT - Williamson Tea, KL – Kakuzi, UL – Uchumi, NIC - NIC Bank, BOC - BOC Gases, PTS - TPS Eastern, DT - Diamond Trust, SA - Sammer Africa, TK - Total Kenya, CI - Centum Investment, EAC - East Africa Cables Ltd, MS - Mumias sugar co. ltd.
MKT CMC LM ALC KNM EAP UT WT KL UL NIC BOC TPS DT SA TK CI EAC
T=-
10 0.01% 0.02% 0.02% 0.25% 0.30% 0.18% 0.20% 0.02% 0.02% 3.49%
- 0.21%
- 0.20% 0.18% 0.25% 0.02% 0.25% 0.30%
- 0.21
T=- 9 0.28%
- 0.06%
- 0.01% 1.42% 0.10% 0.01%
- 1.19%
- 0.06%
- 0.01%
- 1.52%
- 0.49% 0.10% 0.01% 1.42%
- 0.06% 1.42% 1.70%
- 0.49
T=-
8 0.01% 0.18% 0.18% 0.28% 0.02%
- 0.20%
- 0.23% 0.18% 0.18%
- 1.18% 0.25% 0.02%
- 0.20% 0.28% 0.18% 0.28% 0.34% 0.25
T=- 7 0.20%
- 0.08% 0.01% 0.23% 0.25%
- 0.13%
- 0.19%
- 0.08% 0.01%
- 0.06% 1.42%
- 0.10%
- 0.13% 0.23%
- 0.08% 0.23% 0.28% 1.42
T=-
6 0.01% 0.02% 0.02% 0.25% 0.30% 0.18% 0.20% 0.02% 0.02% 3.49%
- 0.21%
- 0.20% 0.18% 0.25% 0.02% 0.25% 0.30%
- 0.21
T=- 5 0.28%
- 0.06%
- 0.01% 1.42% 0.10% 0.01%
- 1.19%
- 0.06%
- 0.01%
- 1.52%
- 0.49% 0.10% 0.01% 1.42%
- 0.06% 1.42% 1.70%
- 0.49
T=- 4 0.01% 0.18% 0.18% 0.28% 0.02%
- 0.20%
- 0.23% 0.18% 0.18%
- 1.18% 0.25% 0.02%
- 0.20% 0.28% 0.18% 0.28% 0.34% 0.25

International Journal of Economics, Commerce and Management, United Kingdom
Licensed under Creative Common Page 189
Appendix IV: Composition Changes in NSE 20 Share Index from 2000 to 2010 S/N. 2000 2001 2002 Mar-03
1 Unilever Tea Unilever Tea Unilever Tea Unilever Tea
2 Williamson Tea Williamson Tea Williamson Tea Williamson Tea
3 Kakuzi Kakuzi Kakuzi Kakuzi
4 Sasini Sasini Sasini Sasini
5 African Lakes IN African Lakes OUT TPS Ltd IN TPS Ltd
6 Kenya Airways Kenya Airways Kenya Airways Kenya Airways
7 Nation Media Nation Media Nation Media Nation Media
8 Uchumi Uchumi Uchumi Uchumi
9 Barclays Kenya Barclays Kenya Barclays Kenya Barclays Kenya
10 Diamond Trust Diamond Trust Diamond Trust Diamond Trust
11 NIC Bank EA Packaging EA Packaging OUT NIC Bank IN
12 KCB KCB KCB KCB
13 Standard Chart Standard Chart Standard Chart Standard Chart
14 Bamburi Cement Bamburi Cement
Bamburi Cement
Bamburi Cement
15 BOC Gases BOC Gases BOC Gases BOC Gases
16 BAT (K) Ltd BAT (K) Ltd BAT (K) Ltd BAT (K) Ltd
17 EABL EABL EABL EABL

© Authors
Licensed under Creative Common Page 190
13
Standard Chart
Standard Chart
Standard Chart Standard Chart

International Journal of Economics, Commerce and Management, United Kingdom
Licensed under Creative Common Page 191
14
Bamburi Cement
Bamburi Cement
Bamburi Cement Bamburi Cement
15 BOC Gases OUT Kengen IN Kengen Kengen
16 BAT (K) Ltd BAT (K) Ltd BAT (K) Ltd BAT (K) Ltd
17 EABL EABL EABL EABL
18 KPLC KPLC KPLC KPLC
19 Firestone EA Sameer Africa OUT
East African Cables
IN
East African Cables
20 Total Kenya Total Kenya OUT Athi River Mining IN Athi River Mining
Source: Nairobi Security Exchange