An Assessment of the consumer ethnocentric scale (CETSCALE ...
24
v.9, n.4 Vitória-ES, Oct.-Dec 2012 p. 103-126 ISSN 1808-2386 DOI:http://dx.doi.org/10.15728/bbr.2012.9.4.5 An Assessment of the consumer ethnocentric scale (CETSCALE): evidences from Brazil Vivian Iara Strehlau † Superior School of Advertising and Marketing Mateus Canniatti Ponchio Ω Superior School of Advertising and Marketing Eduardo Loebel ¥ Getulio Vargas Foundation ABSTRACT The primary objective of this work is to identify if consumers in São Paulo have ethnocentric tendencies. Secondly, the CETSCALE within the Brazilian context is analyzed. The work presents a literature review of the concept of ethnocentrism. A descriptive quantitative methodology was employed and two databases were obtained, one comprised of 275 and another of 200 respondents from the city of São Paulo. The instrument used for data collection was a structured questionnaire with closed questions. The main findings refer to moderately ethnocentric samples – when compared with studies carried out in other countries – in all of the related demographic variables. Analyses indicated that there are differences between the level of consumers’ ethnocentrism when they are segregated into groups by age and different economic classes. The lowest socio-economic classes are significantly more ethnocentric than the upper socio-economic class. Among the lower classes the older people have the highest scores for ethnocentrism. Concluding remarks are presented, with some implications and recommendations for future research. Key words: Ethnocentrism; consumer behavior; CETSCALE; marketing. Received 10/18/2010; revised 08/09/2011; accepted 10/10/2011; published 11/16/2012. *Corresponding authors: † . Doctor at Getulio Vargas Foundation Affiliation: Professora at Superior School of Advertising and Marketing Address: Rua Alvaro Alvin, 123, Sala C402. São Paulo – SP – Brazil E-mail: [email protected] Telephone: (11) 5085 6674 Doctor at Getulio Vargas Foundation Affiliation: Professor at Superior School of Advertising and Marketing Address: Rua Alvaro Alvin, 123, Sala C402, São Paulo – SP – Brazil E-mail: [email protected] Telephone: (11) 5085 6674 ¥ Doctor in Sociology at Pontifical Catholic University of São Paulo. Affiliation: Professor at Getulio Vargas Foundation Address: Rua Itapeva, 474 11º. Andar. São Paulo – SP – Brazil E-mail: [email protected] Telephone: (11) 3799-7740 Publisher's Note: This article was accepted by Bruno Funchal This work was licensed with a Creative Commons License - Attribution 3.0 Not adapted 103
Transcript of An Assessment of the consumer ethnocentric scale (CETSCALE ...
v.9, n.4 Vitória-ES, Oct.-Dec 2012 p. 103-126 ISSN 1808-2386 DOI:http://dx.doi.org/10.15728/bbr.2012.9.4.5
An Assessment of the consumer ethnocentric scale (CETSCALE):
evidences from Brazil
Vivian Iara Strehlau†
Superior School of Advertising and Marketing
Mateus Canniatti PonchioΩ
Superior School of Advertising and Marketing
Eduardo Loebel¥
Getulio Vargas Foundation
ABSTRACT The primary objective of this work is to identify if consumers in São Paulo have ethnocentric
tendencies. Secondly, the CETSCALE within the Brazilian context is analyzed. The work presents
a literature review of the concept of ethnocentrism. A descriptive quantitative methodology was
employed and two databases were obtained, one comprised of 275 and another of 200 respondents
from the city of São Paulo. The instrument used for data collection was a structured questionnaire
with closed questions. The main findings refer to moderately ethnocentric samples – when
compared with studies carried out in other countries – in all of the related demographic variables.
Analyses indicated that there are differences between the level of consumers’ ethnocentrism when
they are segregated into groups by age and different economic classes. The lowest socio-economic
classes are significantly more ethnocentric than the upper socio-economic class. Among the lower
classes the older people have the highest scores for ethnocentrism. Concluding remarks are
presented, with some implications and recommendations for future research.
Key words: Ethnocentrism; consumer behavior; CETSCALE; marketing.
Received 10/18/2010; revised 08/09/2011; accepted 10/10/2011; published 11/16/2012.
*Corresponding authors: †. Doctor at Getulio Vargas Foundation
Affiliation: Professora at Superior School
of Advertising and Marketing
Address: Rua Alvaro Alvin, 123, Sala
C402. São Paulo – SP – Brazil
E-mail: [email protected]
Telephone: (11) 5085 6674
Doctor at Getulio Vargas Foundation
Affiliation: Professor at Superior School
of Advertising and Marketing
Address: Rua Alvaro Alvin, 123, Sala
C402, São Paulo – SP – Brazil
E-mail: [email protected]
Telephone: (11) 5085 6674
¥ Doctor in Sociology at Pontifical
Catholic University of São Paulo.
Affiliation: Professor at Getulio Vargas
Foundation
Address: Rua Itapeva, 474 11º. Andar.
São Paulo – SP – Brazil
E-mail: [email protected]
Telephone: (11) 3799-7740
Publisher's Note: This article was accepted by Bruno Funchal
This work was licensed with a Creative Commons License - Attribution 3.0 Not adapted
103
104 Strehlau, Ponchio, Loebel
BBR, Braz. Bus. Rev. (Engl. ed., Online), Vitória, v. 9, n. 4, Art. 5, p. 103 - 126, oct. – dec. 2012 www.bbronline.com.br
1. INTRODUCTION
lobalization seems to bear all the promise of a democratic and
united world, but on the other hand this scenario can be
credited with an irrecoverable loss of identity. Cultural
circulation on a global scale ended up coining a term – the
globalization of culture – which triggers contrasting reactions
(WARNIER, 2003). Since the 1970s, global reach and
integration have increased, leading to an acceleration in the flows between nations and the
ties that exist between them. As a result this has led to at least three possible consequences:
1) the disintegration of national identities as a result of cultural homogenization; 2) the
reinforcing of national and local identities as a result of resistance and globalization, and
finally, 3) the decline in national identities and the emergence of new hybrid identities
(HALL, 2005).
In such context, the concept of ethnocentrism has gained attention. According to
Cuche (2002), the term is associated with prejudice and often as condemned as racism. The
same author says that ethnocentrism is a normal sociological phenomenon, the function of
which is to protect the existence of collectivity, and can be seen as a form of group
defense. However, it may assume extreme forms of cultural, religious and political
intolerance, or assume subtle and rational forms (CUCHE, 2002). In an attempt to protect
its own identity the ethnocentric attitude aims to keep things as they are. Beliefs and
practices tend to persist not because they are good, but merely because they tend to
function well and so do not arouse the need for change (EDGERTON, 2002). Bizumic and
Duckitt (2008, p. 438) identify six different expressions of this sense of group: intergroups
expressions (group preference, superiority, purity and exploitativeness) and intragroups
expressions (cohesion and devotion).
Consumer ethnocentrism is a very traditional theme in literature dealing with
international management, especially in the marketing area, and is an application of the
ethnocentric construct to the economic sphere (SHIMP; SHARMA, 1987), inheriting
assumptions and properties from the original construct (BALABANIS; MUELLER;
BELEWAR, 2002). This work has two objectives: its first and main one is to observe if
there is any ethnocentric tendency in the various social and economic layers, age and
genders in São Paulo, since literature indicates that the demographic variables of the
consumer have an influence on a person’s degree of ethnocentrism (SHARMA; SHIMP;
An Assessment of the consumer ethnocentric scale (CETSCALE): evidences from Brazil 105
BBR, Braz. Bus. Rev. (Engl. ed., Online), Vitória, v. 9, n. 4, Art. 5, p. 103 - 126, oct. – dec. 2012 www.bbronline.com.br
SHIN, 1995). The second objective is to analyze the Cetscale in a Brazilian context, via a
research that was carried out in São Paulo. Despite being a scale that has been widely used
for more than 20 years we found only one article published in peer reviewed academic
journals using the scale (STREHLAU, PONCHIO; RIEGEL, 2010).
2. THEORETICAL REFERENCES
There seems to be consensus that the term ethnocentrism first appeared in 1906
when Sumner (1906) observed that people have a tendency to like their own group (the
endogroup) and not competitor or opponent groups (the exogroup). He called this tendency
to consider one’s own group as being at the center of everything and superior to other
groups as ethnocentrism (MICHENER; DELAMATER; MYERS, 2005).
But culture diversity, the result of relations between societies, rarely seemed to be
an acceptable phenomenon to man; on the contrary, when man faces an unexpected
situation he summarily repudiates “any cultural, moral, social or esthetic forms that are
divorced from those with which we identify” (LEVI-STRAUSS, 1996, p. 17). A counter-
position to ethnocentrism is the idea of cultural relativism, which means “not transforming
difference into hierarchy, into superior and inferior or good and evil, but seeing it as a
dimension of richness precisely because it is different” (ROCHA, 2000, p. 20, our
translation). The concern of the anthropologist, therefore, is to reduce this effect in his
observations and work. But for people in general this may not be a central concern, which
is why there is an interest in understanding one consumer relative to another, translated in
the shape of the artifacts and brands of other cultures.
Ethnocentrism has its equivalent at the psychological level – authoritarianism, in
which the focus of analysis is the individual and not the group (LEITE, 2002, p. 26) and
where the authoritarian personality is characterized by the negative judgment of the foreign
group, attributing to it all the bad qualities and all the good ones to his own group. For
Rocha (2000, p. 75, our translation), ethnocentrism is based on “strong feelings, such as
reinforcing the identity of the ‘ego’”. The author continues by arguing that this “fits in with
the logic of progress, with the ideology of conquest, with the desire for riches and with a
belief in a lifestyle that excludes difference”.
The ethnocentrism concept can be seen as a general view of social differences, but
it is different from other types of animosity because of its general nature. This being so,
ethnocentrism includes both cognition as well as affection; it is not just a question of
106 Strehlau, Ponchio, Loebel
BBR, Braz. Bus. Rev. (Engl. ed., Online), Vitória, v. 9, n. 4, Art. 5, p. 103 - 126, oct. – dec. 2012 www.bbronline.com.br
judgment or intellectual reasoning because it involves both positive and negative emotions
(KAM; KINDER, 2007).
When dealing with consumer behavior, Mooij (2004, p. 120) defines ethnocentrism
as a preference for products and brands from ones own country to the products and brands
of other countries. Matsumoto (1996, p. 146) defines the term as being the “tendency to see
the world through ones own cultural filters”. Shimp and Sharma (1987) defined
ethnocentrism as an individual tendency to see products manufactured domestically as
being superior and as the belief that it is not very patriotic and even immoral to buy foreign
products because of the consequences that this generates for the economy and
employment.
In the field of strategy, ethnocentrism appears as an explicit variable in studies on
cultural diversity, as an element of strategic change (FRENCH, 2005) in the relationship
between institutions, ethnocentrism and national choices (KYRIACOU, 2005), as a
variable in the spreading of knowledge from the perspective of institutional theory
(KAMOCHE; HARVEY, 2006), in the relationship between the performance of
multinational corporations and people (RICHARDS, 2001) and in cultural resistance when
dealing with strategic alliances (MARREWIJK, 2004).
In the field of consumption, historically the first article found that uses the concept
of ethnocentrism was written by Li and Liu in 1975. The authors compared the
ethnocentric attitudes of young Americans and Chinese based on a research carried out
with students in the two countries. In the United States the aim was to understand how
North Americans stereotyped the Chinese and themselves and in China vice versa. Over
the last ten years 48 articles using this concept have been identified in international
journals (taken from the EBSCO and Emerald databases); they have been fairly regular in
their distribution at four articles a year, on average.
In Brazil, only one article has been found that used ethnocentrism in the
management area in peer reviewed journals (STREHLAU, PONCHIO; RIEGEL, 2010).
Besides this paper there have also been five references in national journals, but all related
to themes in the areas of education (GONÇALVES; SILVA, 2003; OLIVEIRA;
MIRANDA, 2004; DUARTE, 2006), social sciences with a focus on racial studies
(HANCHARD, 2002; OLIVEIRA; MIRANDA, 2004), or psychology with a focus on the
family (SARTI, 2004).
The influence of ethnocentrism in the preference for products and brands was
studied by Nguyen, Nguyen and Barret (2008), Upadhyay and Singh (2006), Supphellen
An Assessment of the consumer ethnocentric scale (CETSCALE): evidences from Brazil 107
BBR, Braz. Bus. Rev. (Engl. ed., Online), Vitória, v. 9, n. 4, Art. 5, p. 103 - 126, oct. – dec. 2012 www.bbronline.com.br
and Gronhaug (2003), Acharya and Elliott (2003), O’Cass and Lim (2002), Watson and
Wright (2000), Kaynak and Kara (2001), Pecotich and Rosenthal (2001), Supphellen and
Rittenburg (2001), and by Huddleston et al. (2001). The preference for imported brands
was the focus of the study by Klein, Ettenson and Krishnan (2006). The “country brand”
and the “country of origin effect” were the subject of studies by Bawa (2004), Mittelstaedt
et al. (2004), Kaynak and Kara (2002), Pecotich and Rosenthal (2001), Yagci (2001),
Ueltschy (1998), Wong, Polonsky and Garma (2008), and Chryssochoidis et al. (2007).
Recently there has been an increasing number of papers using this concept to analyse
different groups within a country, such as different regional groups (HSU; HAN-PENG,
2008), bicultural consumers (ZOLFAGHARIAN; SUN, 2010) or immigrants and natives
(POON; EVANGELISTA; ALBAUM, 2010).
In the sphere of consumer behavior, “information processing” was the focus of
studies by Moon and Jain (2001) and Orth and Firbasova (2002). Other individual
variables relating to ethnocentrism have been studied, such as intention to buy (YELKUR;
CHAKRABARTY; BANDYOPADHYAY, 2006), materialism and cosmopolitanism
(CLEVELAND; LAROCHE; PAPADOPOULOS, 2009), patriotism and nationalism
(BALABANIS et al., 2002; LEE; HONG; LEE, 2003; BAWA, 2004; TOHARUDIN;
OUD; BILLIET, 2008), lifestyle (KAYNAK; KARA, 2001; SPILLAN et al., 2007), ethnic
affiliation (VIDA; DMITROVIC; OBADIA, 2008), group perception (RADEN, 2003) and
cultural orientation (YOO; DONTHU, 2005).
Various papers have been dedicated to understand ethnocentrism in different
countries. The United States is the most studied country, but there are also studies relating
to Spain (LUQUE-MARTINEZ; IBANEZ-ZAPATA; BARRIO-GARCIA, 2000),
Germany (EVANSCHITZKY et al., 2008), Poland (HUDDLESTON; GOOD; STOEL,
2001; SIEMIENIAKO et al., 2011), Slovakia (SAFFU; WALKER; MAZUREK, 2010),
Russia (HUDDLESTON; GOODSTOEL, 2002; SAFFU; WALKER, 2005), and other
countries of the former Soviet Union, like Azerbaijan and Kirgizstan (KAYNAK; KARA,
2001). In the Far East there have been studies on Vietnam (NGUYEN; NGUYEN;
BARRET, 2008), China, India and Taiwan (PEREIRA; HSU; KUNDU, 2002), South
Korea (LEE; SIRGY, 2000), New Zealand and Singapore (DURVASULA; LYSONSKI,
2006), Indonesia (HAMIN; ELLIOTT, 2006) and Australia (POON; EVANGELISTA;
ALBAUM, 2010). We also found studies referring to Canada (SAFFU; WALKER, 2005),
Israel (SHOHAM; BRENCIC, 2003), Turkey (ALTINTAS; TOKOL, 2007; ERDOGAN;
108 Strehlau, Ponchio, Loebel
BBR, Braz. Bus. Rev. (Engl. ed., Online), Vitória, v. 9, n. 4, Art. 5, p. 103 - 126, oct. – dec. 2012 www.bbronline.com.br
TURKEY; UZKUR, 2010) and Iran (BAHAEE; PISANI, 2009). In South America we
only found information about Peru (SPILLAN et al., 2007).
Sharma, Shimp and Shin (1995) discussed the antecedents and conditions under
which consumer ethnocentrism operates. Previous studies indicate that both antecedents
and results differ as a function of different national contexts and also between developed
and developing economies (WANG; CHEN, 2004; REARDON et al., 2005). In a recent
theoretical survey of the area, Shankarmahesh (2006) identified four major factor
categories that underlie ethnocentrism: social-psychological, political, economic and
demographic. As a result he developed an explanatory scheme and discriminated the
various antecedents underlying the ethnocentric tendency. Other antecedents found include
patriotism, openness to foreign cultures, collectivism/individualism and conservatism.
Other possible antecedents have also received attention; according to Kam and Kinder
(2007), ethnocentrism varies in accordance with circumstances; for example the behavior
of Americans before and after the terrorist attacks. Durvasula and Lysonski (2006) also
highlight the importance of the economic threat in the decision to buy imported products.
3. METHODOLOGICAL PROCEDURES
This work includes two quantitative survey-type data collections. The first data set
was obtained by means of a structured questionnaire with closed questions. It was applied
personally in August, September and October, 2008 in public environments, such as
companies, stores and schools in the city of Sao Paulo. Respondents were chosen on a
basis of their willingness to participate in the study; the non-probabilistic sample was
comprised of 275 individuals. The second data set was obtained in February and March,
2010 in public environments such as universities, schools and stores in the same city and
was comprised of 200 individuals.
The questionnaire of the first data set included questions of a demographic nature,
such as gender, age and socio-economic class. The latter was measured using the Brazil
Economic Classification Criteria (CCEB), which divides the population into five socio-
economic classes (A, B, C, D and E) according to the points awarded for the possession of
certain goods and the level of education of the head of the family as a proxy to access
income. To measure the ethnocentric tendencies of the consumer we used the Cetscale,
developed by Shimp and Sharma (1987). The scale consists of 17 items, evaluated on the 7
point Likert scale, where 1 represents “I totally disagree” and 7 represents “I totally agree”.
The results were presented using the summed scale, which is fairly usual in papers that use
An Assessment of the consumer ethnocentric scale (CETSCALE): evidences from Brazil 109
BBR, Braz. Bus. Rev. (Engl. ed., Online), Vitória, v. 9, n. 4, Art. 5, p. 103 - 126, oct. – dec. 2012 www.bbronline.com.br
the Cetscale. The scale was originally developed for use with North American consumers,
but Netemayer, Durvasula and Lichtenstein (1991), in a subsequent study, validated the
scale in the United States, Germany, France and Japan, with Cronbach’s alpha varying
between 0.91 and 0.95, and suggesting the nomological validity of the scale.
The original questionnaire in English was translated into Portuguese. In line with
other studies that used the scale and as indicated in a study carried out by Luthy (2007),
who assessed the role of language when applying the scale, respondents found no difficulty
in understanding it. Reverse translation procedures returned the translated scale to its
original version.
Exploratory data analysis (such as exploratory factor analysis, ANOVA and
decision tree) was conducted in the first data set. The relationships among variables
identified could be tested to see whether they hold true using the second data set. Both
procedures are described in the next section.
4. THE RESEARCH
In the first section, the exploratory results obtained from the first data set are
presented. In section 4.2 the second data set is analysed in order to check the consistency
of the results found in the exploratory analyses conducted.
4.1 EXPLORATORY ANALYSES – FIRST DATA SET
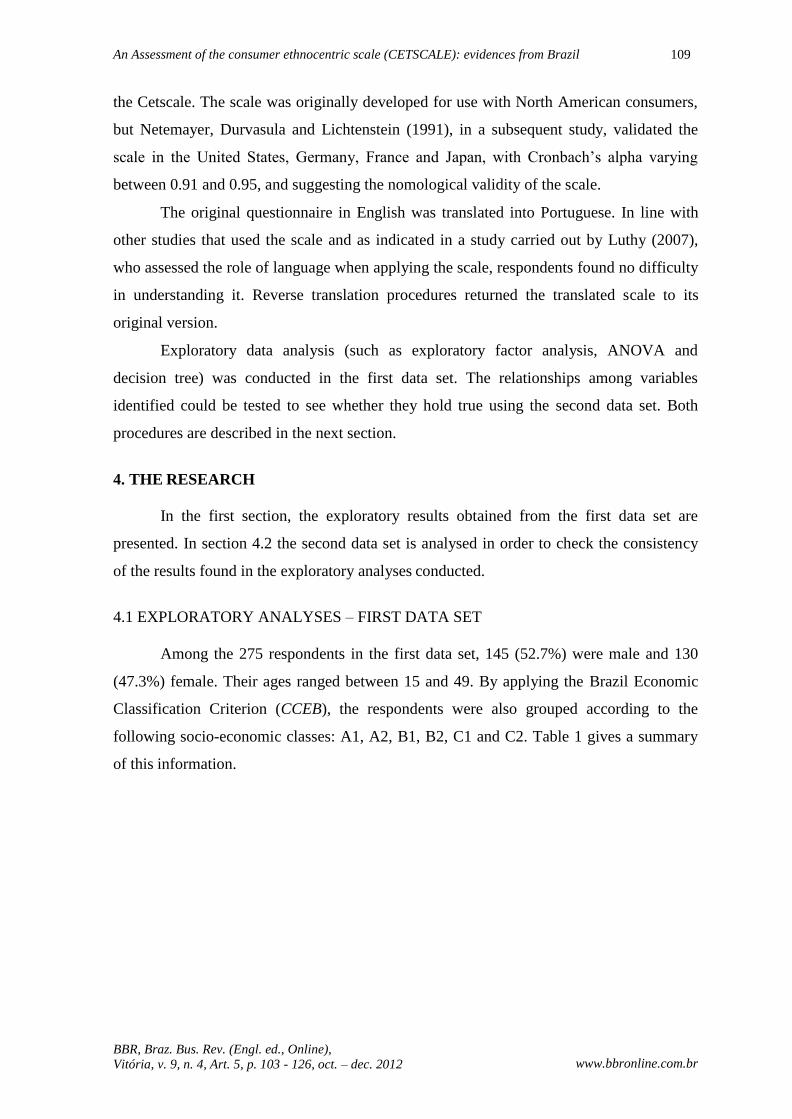
Among the 275 respondents in the first data set, 145 (52.7%) were male and 130
(47.3%) female. Their ages ranged between 15 and 49. By applying the Brazil Economic
Classification Criterion (CCEB), the respondents were also grouped according to the
following socio-economic classes: A1, A2, B1, B2, C1 and C2. Table 1 gives a summary
of this information.
110 Strehlau, Ponchio, Loebel
BBR, Braz. Bus. Rev. (Engl. ed., Online), Vitória, v. 9, n. 4, Art. 5, p. 103 - 126, oct. – dec. 2012 www.bbronline.com.br
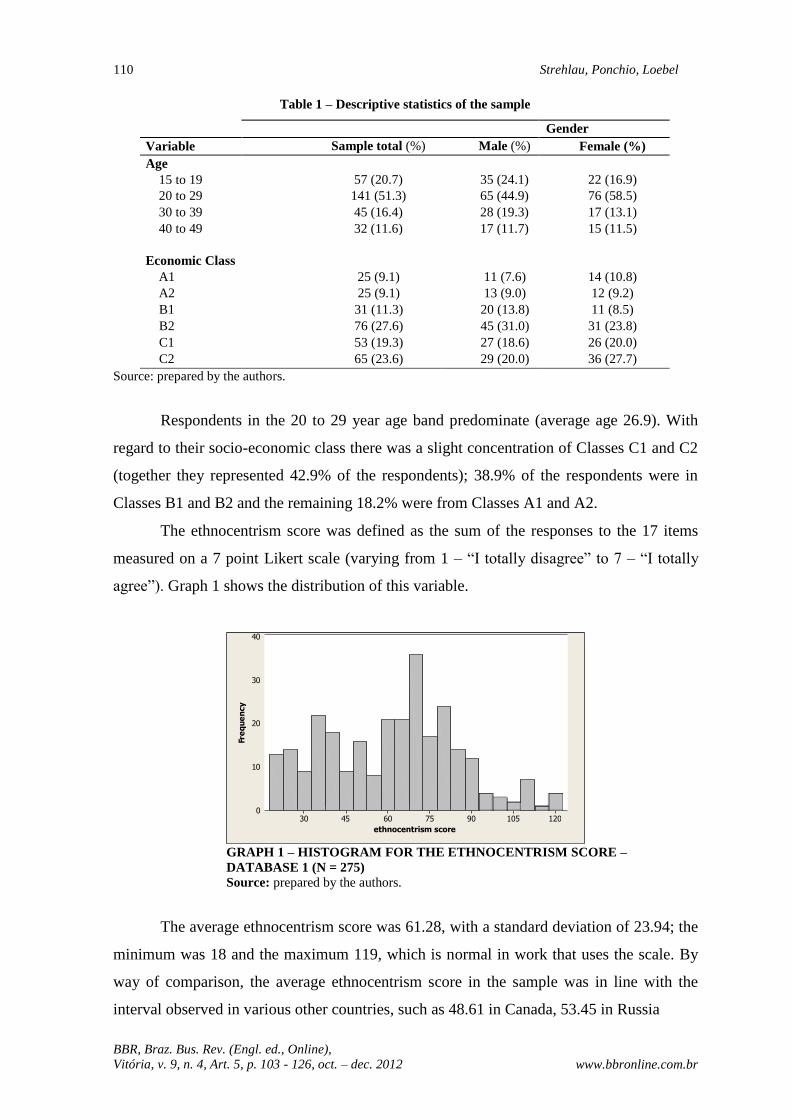
Table 1 – Descriptive statistics of the sample
Gender
Variable Sample total (%) Male (%) Female (%)
Age
15 to 19
57 (20.7) 35 (24.1)
22 (16.9)
20 to 29 141 (51.3) 65 (44.9) 76 (58.5)
30 to 39 45 (16.4) 28 (19.3) 17 (13.1)
40 to 49 32 (11.6) 17 (11.7) 15 (11.5)
Economic Class
A1 25 (9.1) 11 (7.6) 14 (10.8)
A2 25 (9.1) 13 (9.0) 12 (9.2)
B1 31 (11.3) 20 (13.8) 11 (8.5)
B2 76 (27.6) 45 (31.0) 31 (23.8)
C1 53 (19.3) 27 (18.6) 26 (20.0)
C2 65 (23.6) 29 (20.0) 36 (27.7)
Source: prepared by the authors.
Respondents in the 20 to 29 year age band predominate (average age 26.9). With
regard to their socio-economic class there was a slight concentration of Classes C1 and C2
(together they represented 42.9% of the respondents); 38.9% of the respondents were in
Classes B1 and B2 and the remaining 18.2% were from Classes A1 and A2.
The ethnocentrism score was defined as the sum of the responses to the 17 items
measured on a 7 point Likert scale (varying from 1 – “I totally disagree” to 7 – “I totally
agree”). Graph 1 shows the distribution of this variable.
GRAPH 1 – HISTOGRAM FOR THE ETHNOCENTRISM SCORE –
DATABASE 1 (N = 275)
Source: prepared by the authors.
The average ethnocentrism score was 61.28, with a standard deviation of 23.94; the
minimum was 18 and the maximum 119, which is normal in work that uses the scale. By
way of comparison, the average ethnocentrism score in the sample was in line with the
interval observed in various other countries, such as 48.61 in Canada, 53.45 in Russia
40
30
20
10
30 45 60 75 90 105 120
ethnocentrism score
Fre
qu
en
cy

An Assessment of the consumer ethnocentric scale (CETSCALE): evidences from Brazil 111
BBR, Braz. Bus. Rev. (Engl. ed., Online), Vitória, v. 9, n. 4, Art. 5, p. 103 - 126, oct. – dec. 2012 www.bbronline.com.br
(SAFFU; WALKER, 2005) and 85.07 in South Korea (SHARMA; SHIMP; SHIN, 1995).
In the United States the Shimp and Sharma (1987) study came up with a variation between
56.63 in Los Angeles and 68.58 in Detroit.
Shankarmahesh (2006) points out that the demographic characteristics of the
respondents comprise a separate group in the study of antecedents. Even though Balabanis,
Mueller and Belewar (2002) indicate that most of the antecedents of consumer
ethnocentrism have focused on demographic differences, no research with this particular
focus was found in Brazil. With regard to gender, we expected to find some difference,
because previous studies have shown that women tend to be more ethnocentric than men
(SHARMA; SHIMP; SHIN, 1995; BRUNING, 1997). But in this study we saw no
difference in the distribution of this variable as a function of gender, which is in line with
what Hopkins and Powers (2007), Caruana and Magri (1996) and Nielsen and Spence
(1997) found.
Sharma, Shimp and Shin (1995) and Bruning (1997) indicated a negative
correlation between income and ethnocentrism, because as income increases the
possibilities of traveling and developing a greater degree of cosmopolitanism also increase,
which leads to a reduction in ethnocentric tendencies. In this study we found relationships
between consumer ethnocentrism and socio-economic class (see Table 2 and Graph 2).
Although the ‘Brazil criterion’ does not specifically measure income it was considered a
suitable substitute.
Table 2 – ANOVA – ethnocentrism score compared with socio-economic class
Group Count Mean Standard-deviation A1 25 28.64 6.76
A2 25 48.24 20.22
B1 31 57.52 26.84
B2 76 66.50 19.65
C1 53 69.21 20.19
C2 65 68.09 23.25
ANOVA
Source of variance SS df MS F Sig.
Between groups 39,742.65 5 7,948.53 18.23 0.000
Within groups 117,261.23 269 435.92
Total 157,003.88 274
Source: prepared by the authors.
112 Strehlau, Ponchio, Loebel
BBR, Braz. Bus. Rev. (Engl. ed., Online), Vitória, v. 9, n. 4, Art. 5, p. 103 - 126, oct. – dec. 2012 www.bbronline.com.br
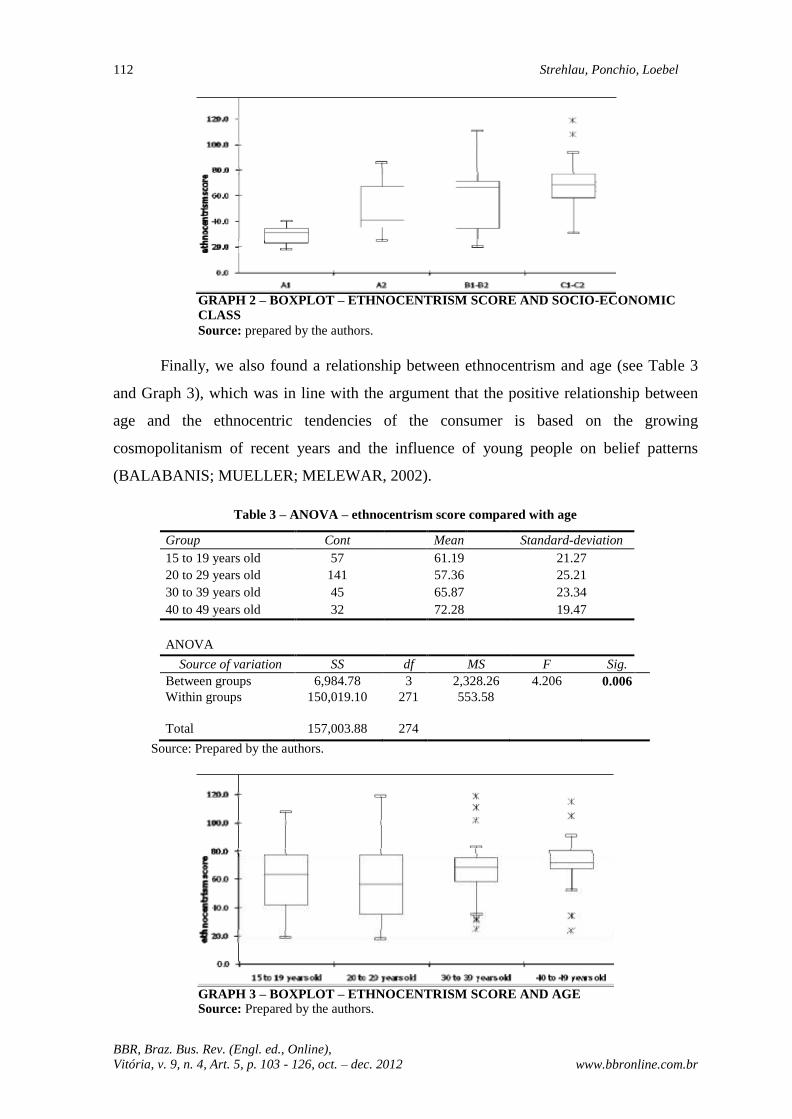
GRAPH 2 – BOXPLOT – ETHNOCENTRISM SCORE AND SOCIO-ECONOMIC
CLASS
Source: prepared by the authors.
Finally, we also found a relationship between ethnocentrism and age (see Table 3
and Graph 3), which was in line with the argument that the positive relationship between
age and the ethnocentric tendencies of the consumer is based on the growing
cosmopolitanism of recent years and the influence of young people on belief patterns
(BALABANIS; MUELLER; MELEWAR, 2002).
Table 3 – ANOVA – ethnocentrism score compared with age
Group Cont Mean Standard-deviation 15 to 19 years old 57 61.19 21.27
20 to 29 years old 141 57.36 25.21
30 to 39 years old 45 65.87 23.34
40 to 49 years old 32 72.28 19.47
ANOVA
Source of variation SS df MS F Sig.
Between groups 6,984.78 3 2,328.26 4.206 0.006
Within groups 150,019.10 271 553.58
Total 157,003.88 274
Source: Prepared by the authors.
GRAPH 3 – BOXPLOT – ETHNOCENTRISM SCORE AND AGE Source: Prepared by the authors.

An Assessment of the consumer ethnocentric scale (CETSCALE): evidences from Brazil 113
BBR, Braz. Bus. Rev. (Engl. ed., Online), Vitória, v. 9, n. 4, Art. 5, p. 103 - 126, oct. – dec. 2012 www.bbronline.com.br
In trying to classify the respondents in terms of their ethnocentrism score, the
decision tree method was used. The tree was constituted using the CHAID (Chi-squared
Automatic Interaction Detector) algorithm, with a significance level in splitting nodes of
0.05 and merging categories of 0.05, also. The decision tree method divides a set of
explanatory independent variables into mutually exclusive subsets, in order to find the best
way of describing the behavior of the dependent variable (HILL; LEWICKI, 2006). The
sub-groups are once more tested relative to other explanatory variables until they become
small or the tests are no longer significant. The dependent variable selected for the analysis
was the ethnocentrism score. Figure 1 shows the results.
FIGURE 1 – CLASSIFICATION TREE – ETHNOCENTRISM SCORE AS THE DEPENDEND
VARIABLE
Source: Prepared by the authors with use of SPSS 17.0
The first node includes 25 respondents, the second includes a little over 20% of the
sample (56 respondents) and finally the largest node is the third with 194 respondents,
divided into two sub-groups: one with the people over 29 who represent the greatest
ethnocentric tendency and includes 59 respondents, and the second group with respondents
of 29 or less, with 135 people.
Analysis of Figure 1 allows us to make the following statements:
a) The socio-economic class variable is useful for differentiating the respondents
based on their ethnocentrism score: respondents from socio-economic Class A1 have an

114 Strehlau, Ponchio, Loebel
BBR, Braz. Bus. Rev. (Engl. ed., Online), Vitória, v. 9, n. 4, Art. 5, p. 103 - 126, oct. – dec. 2012 www.bbronline.com.br
average ethnocentrism of 28.64, with a standard deviation of 6.76; respondents from socio-
economic Classes A2 and B1 have an average ethnocentrism of 53.38, with standard
deviation of 24.35 and finally respondents from Classes B2, C1 and C2 have an average
ethnocentrism of 67.77, with a standard deviation of 20.98. The lowest socio-economic
classes, therefore, have the highest ethnocentrism score.
b) Among the respondents belonging to the lowest socio-economic classes – B2, C1
and C2 (node 3), older people have a higher score in ethnocentrism (nodes 4 and 5). The
sub-group of those over 29 belonging to socio-economic Classes B2, C1 and C2 is,
therefore, the one that has the highest level of ethnocentrism – average of 74.36, with a
standard deviation of 16.58.
Several studies assume that all 17 items used are measuring the same construct and a
summative measure may be used to represent the ethnocentrism score of the respondents,
such as Kaynak and Kara (2001; 2002), Huddleston, Good and Stoel (2000; 2001), Moon
and Janin (2001), Yoo and Donthu (2005), Wang and Chen (2004), Lee and Sirgy (2003),
Shoham and Brencic (2003), Hamin and Elliot (2006), Wong, Polonski and Garma (2008),
Luthy (2007), and Spillan et al. (2007). Table 4 shows a comparison of variance explained
and the dimensionability of the Cetscale.
An Assessment of the consumer ethnocentric scale (CETSCALE): evidences from Brazil 115
BBR, Braz. Bus. Rev. (Engl. ed., Online), Vitória, v. 9, n. 4, Art. 5, p. 103 - 126, oct. – dec. 2012 www.bbronline.com.br
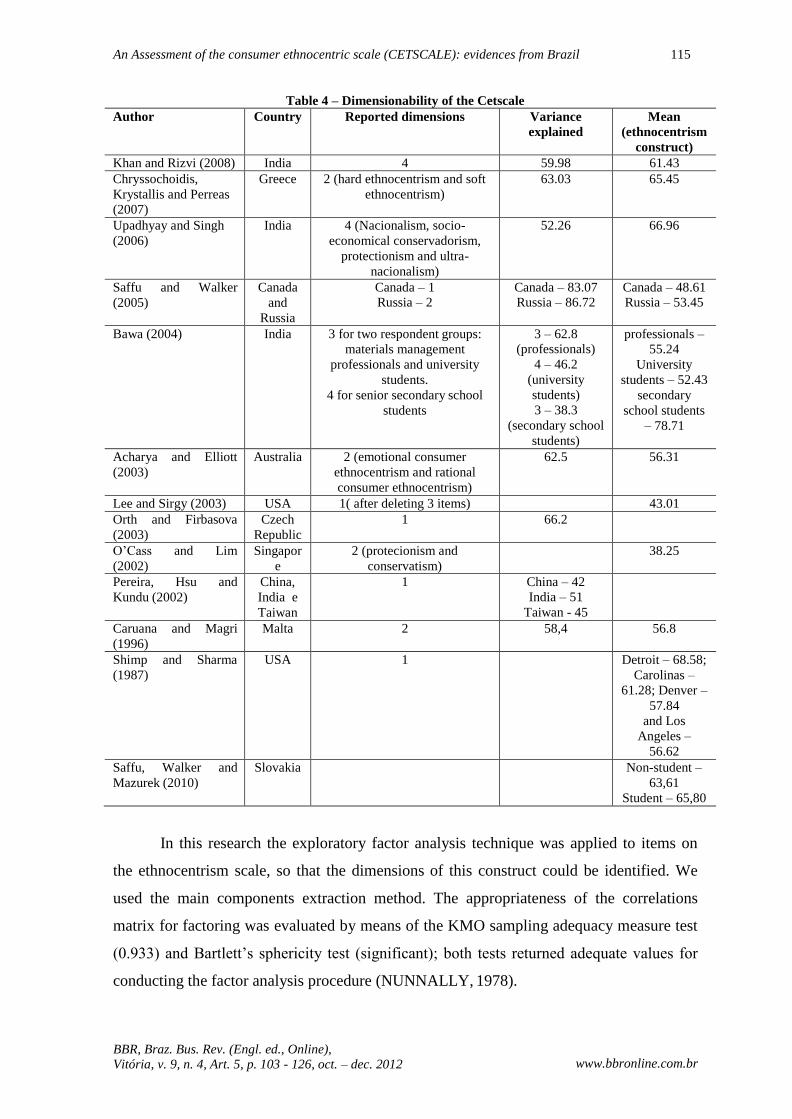
Table 4 – Dimensionability of the Cetscale
Author Country Reported dimensions Variance
explained
Mean
(ethnocentrism
construct)
Khan and Rizvi (2008) India 4 59.98 61.43
Chryssochoidis,
Krystallis and Perreas
(2007)
Greece 2 (hard ethnocentrism and soft
ethnocentrism)
63.03 65.45
Upadhyay and Singh
(2006)
India 4 (Nacionalism, socio-
economical conservadorism,
protectionism and ultra-
nacionalism)
52.26 66.96
Saffu and Walker
(2005)
Canada
and
Russia
Canada – 1 Russia – 2
Canada – 83.07 Russia – 86.72
Canada – 48.61 Russia – 53.45
Bawa (2004) India 3 for two respondent groups:
materials management
professionals and university
students.
4 for senior secondary school
students
3 – 62.8 (professionals)
4 – 46.2
(university
students)
3 – 38.3
(secondary school
students)
professionals –
55.24
University
students – 52.43
secondary
school students
– 78.71
Acharya and Elliott
(2003)
Australia 2 (emotional consumer
ethnocentrism and rational
consumer ethnocentrism)
62.5 56.31
Lee and Sirgy (2003) USA 1( after deleting 3 items) 43.01
Orth and Firbasova
(2003)
Czech
Republic
1 66.2
O’Cass and Lim
(2002)
Singapor
e
2 (protecionism and
conservatism) 38.25
Pereira, Hsu and
Kundu (2002)
China,
India e
Taiwan
1 China – 42
India – 51
Taiwan - 45
Caruana and Magri
(1996)
Malta 2 58,4 56.8
Shimp and Sharma
(1987)
USA 1 Detroit – 68.58;
Carolinas –
61.28; Denver –
57.84
and Los
Angeles –
56.62
Saffu, Walker and
Mazurek (2010)
Slovakia Non-student –
63,61
Student – 65,80
In this research the exploratory factor analysis technique was applied to items on
the ethnocentrism scale, so that the dimensions of this construct could be identified. We
used the main components extraction method. The appropriateness of the correlations
matrix for factoring was evaluated by means of the KMO sampling adequacy measure test
(0.933) and Bartlett’s sphericity test (significant); both tests returned adequate values for
conducting the factor analysis procedure (NUNNALLY, 1978).

116 Strehlau, Ponchio, Loebel
BBR, Braz. Bus. Rev. (Engl. ed., Online), Vitória, v. 9, n. 4, Art. 5, p. 103 - 126, oct. – dec. 2012 www.bbronline.com.br
Three factors were extracted that explain 75.43% of the accumulated variance. By
applying the varimax rotation we were able to interpret the three orthogonal factors we
called: 1) Trade; 2) Country preference; 3) Employment. Table 5 shows the factor loadings
for each of the items.
Table 5 – Factor matrix - Ethnocentrism
Factor 1:
Trade
Factor 2:
Country
preference
Factor 3:
Employmen
t
Foreigners should not be allowed to put their products on our
markets. 0.809
Foreign products should be taxed heavily to reduce their entry
into Brazil. 0.784
There should be very little trading or purchasing of goods from
other countries unless out of necessity
0.772
Only those products that are unavailable in Brazil should be
imported. 0.765
Curbs should be put on all imports. 0.756
Brazilian people should always buy Brazilian-made products
instead of imports. 0.704
lt is always best to purchase Brazilian products. 0.800
We should purchase products manufactured in Brazil instead of
letting other countries get rich off us.
0.793
Buy Brazilian-made products. Keep Brazil working.
0.781
It may cost me in the long-run but I prefer to support Brazilian
products.
0.734
Brazilian products first, last, and foremost. 0.706
A real Brazilian should always buy Brazilian-made products.
0.689
Brazilian consumers who purchase products made in other
countries are responsible for putting their fellow Brazilians out of
work.
0.840
Purchasing foreign-made products is un-Brazilian. 0.791
It is not right to purchase foreign products, because it puts
Brazilians out of jobs.
0.748
Brazilians should not buy foreign products, because this hurts
Brazilian business and causes unemployment.
0.697
We should buy from foreign countries only those products that
we cannot obtain within our own country.
0.627
Source: prepared by the authors with use of SPSS 17.0.
Only factor loadings greater than 0.500 were included in the table. The first factor
grouped the assertions that were fundamentally related to trade, such as trade restrictions
and the barriers the country should impose on foreign products. The second factor
represents statements relating to country preference – in short, Brazilians should buy from
Brazilians. Finally, the third and final factor represents the employment dimension, in
An Assessment of the consumer ethnocentric scale (CETSCALE): evidences from Brazil 117
BBR, Braz. Bus. Rev. (Engl. ed., Online), Vitória, v. 9, n. 4, Art. 5, p. 103 - 126, oct. – dec. 2012 www.bbronline.com.br
other words, buying foreign products would be reflected in a reduction in employment
levels in the country.
4.2 VALIDATING ANALYSES – SECOND DATA SET
The version of the Cetscale used in the second database obtained (n = 200) was
comprised of only 10 itens instead of 17 (BRUNNER II; HENSEL, 1992). This is
recommended when the questionnaire is long (as was the case) and / or data collection is
expensive, if there is a short version of the scale available (for a detailed example of this
procedure see Richins, 2004 and Ponchio and Aranha, 2008, papers that have addressed the
measurement of the materialism construct with a full 15-item scale and a short 9-item
scale).
The second data set served as a validating data set for this study. As pointed out by
Pedhazur and Schmelkin (1991), external validating procedures should be persued,
especially in social sciences studies that have employed scales to measure underlying
constructs such as ethnocentrism. Although both data sets are non probabilistic samples,
we still consider this procedure will enrich the conclusions drawn by the study.
Among the 200 respondents, 95 (47.5%) were male and 105 (52.5%) female. Their
ages ranged between 15 and 25. Due to the sampling procedure that was adopted, no
variance was identified in the income variable – all respondents belong to high income
families (A1, A2 or B1 socio-economic classes).
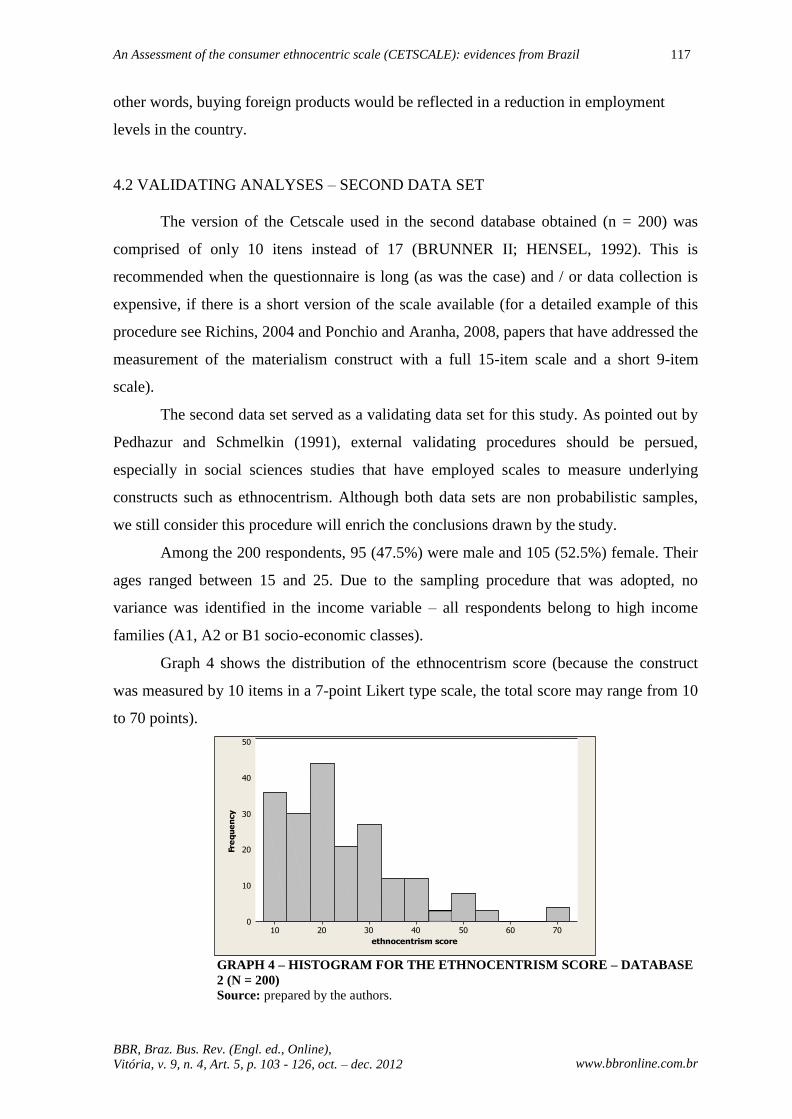
Graph 4 shows the distribution of the ethnocentrism score (because the construct
was measured by 10 items in a 7-point Likert type scale, the total score may range from 10
to 70 points).
GRAPH 4 – HISTOGRAM FOR THE ETHNOCENTRISM SCORE – DATABASE
2 (N = 200)
Source: prepared by the authors.
Fre
qu
en
cy
118 Strehlau, Ponchio, Loebel
BBR, Braz. Bus. Rev. (Engl. ed., Online), Vitória, v. 9, n. 4, Art. 5, p. 103 - 126, oct. – dec. 2012 www.bbronline.com.br
The average ethnocentrism score was 24.45, with a standard deviation of 12.83; the
minimum was 10 and the maximum, 70. This is a non-ethnocentric group. The results are
consistent to what was identified earlier being that the least ethnocentric group is the one
comprised of higher income and younger individuals.
Given that the ethnocentrism score could range from 10 to 70, the mean score of
24.45 corresponds to (24.45 – 10) / (70 – 10) = 24.08% of how much ethnocentric the
individual could indicate to be. When the same methodology is applied to the individuals
from database I, it can be seen that the 72 (out of the 275) respondents aged between 15
and 25 and from the socio-economic classes A1, A2 and B1 have an average ethnocentrism
score of 43.43 (out of 119). So, relatively speaking, respondents are (43.43 – 17) / (119 –
17) = 25.9% ‘ethnocentric’. At the 0.01 level, no statistical difference exists between both
groups (sample 1 X sample 2) relative to the ethnocentrism score, which indicates
consistency between field results.
It is important to highlight that no difference was found for the ethnocentrism score
when gender was considered: among men, the average score was 24.71 and, among
women, the average score was 24.15.
Nevertheless, new data collections, especially among different age and socio-
economic groups, are recommended so that more evidence of consumer ethnocentrism can
be gained.
5. FINAL CONSIDERATIONS
The intention of this work was to discuss the ethnocentric tendencies of consumers.
A review of literature shows that women, older people and those with lower levels of
income tend to give the highest scores when it comes to ethnocentrism. However, in this
study this relation did not prove to be significant for the gender variable, although it was
for the socio-economic class and age variables.
With regard to the ethnocentrism score the decision tree was responsible for
classifying individuals from sample 1 according to socio-demographic variables. The
differences between the averages of the three groups we identified are significant (A1:
28.64; A2 and B1: 53.38; and B2, C1 and C2: 67.77). The lower socio-economic classes
have, therefore, a higher ethnocentrism score. A sub-group emerges from this group -
individuals over 29; they have the highest level of ethnocentrism, an average of 74.36.
Application of the Cetscale in São Paulo revealed good internal consistency of the scale
and three dimensions for the ethnocentrism construct.
An Assessment of the consumer ethnocentric scale (CETSCALE): evidences from Brazil 119
BBR, Braz. Bus. Rev. (Engl. ed., Online), Vitória, v. 9, n. 4, Art. 5, p. 103 - 126, oct. – dec. 2012 www.bbronline.com.br
The second database analyzed (n = 200) helped strengthen what had already been
shown in database 1: young and whealthy individuals from the city of Sao Paulo tend to be
very little ethnocentric.
Future work on ethnocentrism may also explore intersections with strategy. Among
the strategic implications are those where there is a strong interaction between people, such
as in knowledge transfer, the management of diversity, the development of alliances and
those that involve the strategist himself. Another possible application would be in
differentiation strategies; working to increase the perceived value of Brazilian products and
brands. In marketing it could be used in market segmentation exercises, according to how
disposed (or otherwise) the market is to foreign products. However, for such purposes this
study, with its focus on gender, age and economic class, is only an introduction to a much
wider discussion; other demographic variables, such as race, income and education could
also lead to meaningful results. Perhaps there is a curious lack of interest in seeing
ourselves as extremely ethnocentric in some aspects, or the opposite, in seeing ourselves as
not very ethnocentric at all in the normal sense of the word, believing that what is imported
is almost always better, or what comes from outside Brazil, from other people, is better
than what we produce here. The research indicates a moderately ethnocentric sample;
studies should be continued in order to understand in what aspects this tendency manifests
itself with greater or lesser intensity.
One important limitation is the fact that the research is based on samples obtained
by convenience, thereby compromising generalizations. There is also the limitation that it
was applied in just one city. For future studies we suggest that the scale be applied in other
cities and regions in Brazil, because it is possible that differences exist, as they do in the
United States, where the full Cetscale varies between 56.62 in Los Angeles and 68.58 in
Detroit (SHIMP and SHARMA 1987). There are possibly also differences with regard to
other demographic aspects, the antecedents of ethnocentrism or its consequences.
REFERENCES
ACHARYA, C.; ELLIOTT, G. Consumer ethnocentrism, perceived product quality and
choice: an empirical investigation. Journal of International Consumer Marketing, v. 15,
n. 4, p. 87-115, 2003.
ALTINTAS, M. H.; TOKOL, T. Cultural openness and consumer ethnocentrism: an
empirical analysis of Turkish consumers. Marketing Intelligence & Planning, v. 25, n. 4,
p. 308-325, 2007.
120 Strehlau, Ponchio, Loebel
BBR, Braz. Bus. Rev. (Engl. ed., Online), Vitória, v. 9, n. 4, Art. 5, p. 103 - 126, oct. – dec. 2012 www.bbronline.com.br
BAHAEE, M.; PISANI, M. J. The use of the consumer ethnocentrism and consumer
animosity scales in Iran: a research note. Thunderbird International Business Review, v.
51, n. 2, p. 143-150, mar./abr. 2009.
BALABANIS, G. et al. The impact of nationalism, patriotism and internationalism on
consumer ethnocentric tendencies. Journal of International Business Studies, v. 32, n. 1,
p. 157-175, 2001.
BALABANIS, G.; MUELLER, R.; MELEWAR, T.C. The relationship between consumer
ethnocentrism and human values. Journal of Global Marketing, v. 15, n. 3/4, p. 7-38,
2002.
BAWA, A. Consumer ethnocentrism: CETSCALE validation and measurement of extent.
Vikalpa: The Journal for Decision Makers, v. 29, n. 3, p. 43-57, jul./set. 2004.
BIZUMIC, B.; DUCKITT, J. “My group is not worthy of me”: narcissism and
ethnocentrism. Political Psychology. v. 29, n. 3, p.437-453, jun. 2008.
BRUNING, E.R. Country of origin, national loyalty and product choice: the case of
international air travel. International Marketing Review, v. 14, n. 1, p. 59-74, 1997.
BRUNNER II, Gordon C.; HENSEL, Paul J. Marketing scales handbook: a compilation
of multi-item measures. Chicago: American Marketing Association, 1992.
BUSH, A. J.; HAIR JR, J. F. An assessment of the mall intercept as a data collection
method. Journal of Marketing Research, v. 22, n. 2, p. 158-167, maio 1985.
CARUANA, A. MAGRI, E. The effects of dogmatism and social class variables on
consumer ethnocentrism in Malta. Marketing Intelligence & Planning, v. 14, n. 4, p. 39-
44, 1996.
CARUANA, A.; CHIRCOP, S. The dark side of globalization and liberalization:
helplessness, alienation and ethnocentrism among small business owners and managers.
Journal of Nonprofit & Public Sector Marketing, v. 9, n. 4, p. 63-74, 2002.
CHOI, Y.; CAMERON, G. T. Overcoming ethnocentrism: the role of identity in
contingent practice of international public relations. Journal of Public Relations
Research, v. 17, n. 2, p. 171-189, abr. 2005.
CHRYSSOCHOIDIS, G; KRYSTALLIS, A., PANAGIOTIS P. Ethnocentric beliefs and
country-of-origin (COO) effect: impact of country, product and product attributes on Greek
consumers' evaluation of food products. European Journal of Marketing, v. 41, n. 11-12,
p. 1518-1544, 2007.
CLEVELAND, M.; LAROCHE, M.; PAPADOPOULOS, N. Cosmopolitanism, consumer
ethnocentrism, and materialism: an eight-country study of antecedents and outcomes.
Journal of International Marketing, v. 17, n. 1, p. 116-146, 2009.
CUCHE, D. A noção de cultura nas ciências sociais. Bauru: EDUSC, 2002.
DOUGLAS, S. P.; CRAIG, C. S. International marketing research. Englewood Cliffs:
Prentice Hall, 1983.
An Assessment of the consumer ethnocentric scale (CETSCALE): evidences from Brazil 121
BBR, Braz. Bus. Rev. (Engl. ed., Online), Vitória, v. 9, n. 4, Art. 5, p. 103 - 126, oct. – dec. 2012 www.bbronline.com.br
DUARTE, N. A contradição entre universalidade da cultura humana e o esvaziamento das
relações sociais: por uma educação que supere a falsa escolha entre etnocentrismo ou
relativismo cultural. Educação e Pesquisa, v. 32, n. 3, p. 607-618, dez. 2006.
DURVASULA, S.; LYSONSKI, S. Impedance to globalization: the impact of economic
threat and ethnocentrism. Journal of Global Marketing, v. 19, n. 3-4, p. 9-32, 2006.
EDGERTON, R.B. Crenças e práticas tradicionais: algumas são melhores do que outras?
In: HARRISON, L. E.; HUNTINGTON, S. P. (Org.). A cultura importa. Rio de Janeiro:
Record, 2002. cap. 10, p. 191-208.
ERDOGAN, B. Z.; TURKEY , B.; UZKUR, C. Effects of ethnocentric tendency on
consumers’ perception of product attitudes for foreign and domestic products. Cross
Cultural Management: An International Journal, v. 17, n. 4, p. 393-406, 2010.
EVANSCHITZKY, H. et al. Consumer ethnocentrism in the German market.
International Marketing Review, v. 25, n. 1, p. 7-32, 2008.
FRENCH, E. The importance of strategic change in achieving equity in diversity.
Strategic Change, v. 14, n. 1, p. 35-44, jan./fev. 2005.
GONÇALVES, L. A. O.; SILVA, P. B. G. Multiculturalismo e educação: do protesto de
rua a propostas e políticas. Educação e Pesquisa, v. 29, n. 1, p. 109-123, jun. 2003.
HAIR, J. F. et al. Análise multivariada de dados. Porto Alegre: Bookman, 2005.
HALL, Stuart. A identidade cultural na pós-modernidade. Rio de Janeiro: DP&A, 2005.
HAMIN; ELLIOTT, Greg. A less-developed country perspective of consumer
ethnocentrism and “country of origin” effects: Indonesian evidence. Asia Pacific Journal
of Marketing and Logistics, v. 18, n. 2, p. 79-92, 2006.
HAMMOND, R. A.; AXELROD, R. The evolution of ethnocentrism. The Journal of
Conflict Resolution, v. 50, n. 6, p. 926-936, dez. 2006.
HANCHARD, M. Política transnacional negra, anti-imperialismo e etnocentrismo para
Pierre Bourdieu e Loïc Wacquant: exemplos de interpretação equivocada. Estudos Afro-
Asiáticos, v. 24, n. 1, p. 63-96, 2002.
HILL, T.; LEWICKI, P. Statistics methods and applications: a comprehensive reference
for science, industry, and data mining. Tulsa: StatSoft, 2006.
HOPKINS, R. A.; POWERS, T. L. "Buy national" and altruistic market segments. Journal
of Global Marketing, v. 20, n. 4, p. 73-87, 2007.
HSU, J. L.; HAN-PENG, N. Who are ethnocentric? Examining consumer ethnocentrism in
Chinese societies. Journal of Consumer Behaviour, v. 7, n. 6, p. 436-447, 2008.
HUDDLESTON, P.; GOOD, L. K.; STOEL, L. Consumer ethnocentrism, product
necessity and Polish consumers’ perceptions of quality. International Journal of Retail
& Distribution Management, v. 29, n. 5, p. 236-246, 2001.
122 Strehlau, Ponchio, Loebel
BBR, Braz. Bus. Rev. (Engl. ed., Online), Vitória, v. 9, n. 4, Art. 5, p. 103 - 126, oct. – dec. 2012 www.bbronline.com.br
HUDDLESTON, P.; GOOD, L. K.; STOEL, L. Consumer ethnocentrism, product
necessity and quality perceptions of Russian consumers. International Review of Retail,
Distribution & Consumer Research, v. 10, n. 2, p. 167-181, abr. 2000.
KAM, C. D.; KINDER, D. R. Terror and ethnocentrism: foundations of American support
for the war on terrorism. Journal of Politics, v. 69, n. 2, p. 320-338, maio 2007.
KAMOCHE, K; HARVEY, M. Knowledge diffusion in the African context: an
institutional theory perspective. Thunderbird International Business Review, v. 48, n. 2,
p. 157–181, mar./abr. 2006.
KAYNAK, E.; KARA, A. An examination of the relationship among consumer lifestyles,
ethnocentrism, knowledge structures, attitudes and behavioral tendencies: a comparative
study in two CIS states. International Journal of Advertising, v. 20, n. 4, p. 455-482,
2001.
KAYNAK, E.; KARA, A. Consumer perceptions of foreign products: an analysis of
product-country images and ethnocentrism. European Journal of Marketing, v. 36, n. 7-
8, p. 928-949, 2002
KLEIN, J. G.; ETTENSON, R.; KRISHNAN, B. C. Extending the construct of consumer
ethnocentrism: when foreign products are preferred. International Marketing Review, v.
23, n. 3, p. 304-321, 2006.
KYRIACOU, A. P. Rationality, ethnicity and institutions: a survey of issues and results.
Journal of Economic Surveys, v. 19, n. 1, p. 23-42, fev. 2005.
LEE, Dong-Jin; SIRGY, M. J. The effect of moral philosophy and ethnocentrism on
quality-of-life orientation in international marketing: a cross-cultural comparison. Journal
of Business Ethics, v. 18, n. 1, p. 73-89, jan. 1999.
LEE, Wei-Na; HONG, Ji-Young; LEE, Se-Jin. Communicating with American consumers
in the post 9/11 climate: an empirical investigation of consumer ethnocentrism in the
United States. International Journal of Advertising, v. 22, n. 4, p. 487-510, 2003.
LEITE, Dante Moreira. O caráter nacional brasileiro. São Paulo: Unesp, 2002.
LEVI-STRAUSS, Claude. Raça e história. 5. ed. Lisboa: Editorial Presença, 1996.
LI, W. L.; LIU, S. S. Ethnocentrism among American and Chinese youth. The Journal of
Social Psychology. v. 95, n. 2, p. 277-278, 1975.
LUQUE-MARTINEZ, T.; IBANEZ-ZAPATA, Jose-Angel; BARRIO-GARCIA, S. D.
Consumer ethnocentrism measurement: an assessment of the reliability and validity of the
CETSCALE in Spain. European Journal of Marketing, v. 34, n. 11-12, p. 1353-1373,
2000.
LUTHY, M. R. Conducting international consumer ethnocentrism surveys. Journal of
International Business Research, v. 6, n. 2, p. 33-42, jun. 2007.
An Assessment of the consumer ethnocentric scale (CETSCALE): evidences from Brazil 123
BBR, Braz. Bus. Rev. (Engl. ed., Online), Vitória, v. 9, n. 4, Art. 5, p. 103 - 126, oct. – dec. 2012 www.bbronline.com.br
MAGERMAN, D. M. Statistical decision-tree models for parsing. In: Annual Meeting of
the Association for Computational Linguistics, 33., 1995, Massachusetts. Proceedings…
Massachusetts: Association for Computational Linguistics, 1995. p. 276-283.
VAN MARREWIJK, A. The management of strategic alliances: cultural resistance.
Comparing the cases of a Dutch telecom operator in the Netherlands, Antilles and
Indonesia. Culture and Organization, v. 10, n. 4, p. 303-314, dez. 2004.
MATSUMOTO, D. Culture and psychology. Pacific Grove: Brooks Cole, 1996.
MICHENER, H. A.; DELAMATER, J. D.; MYERS, D. J. Psicologia social. São Paulo:
Thomson, 2005.
MITTEISTAEDT, J. D. et al. Perceived differences among countries: understanding
relative perceptions. Journal of International Consumer Marketing, v. 17, n. 1, p. 7-31,
2004.
MOOIJ, M. K. de. Consumer behavior and culture: consequences for global marketing
and advertising. Thousand Oaks: Sage, 2004.
MOON, Byeong- Jon.; JAIN, S. C. Consumer processing of international advertising: the
roles of country of origin and consumer ethnocentrism. Journal of International
Consumer Marketing, v. 14, n. 1, p. 89-109, jan. 2001.
MORGAN, G. A.; GRIEGO, O. V. Easy use and interpretation of SPSS for windows:
answering research questions with statistics. Mahwah, NJ: Lawrence Erlbaum, 1998.
NETEMAYER, R. G.; DURVASULA, S.; LICHTENSTEIN, D. R. A cross-national
assessment of the reliability and validity of the CETSCALE. Journal of Marketing
Research, v. 28, n. 3, p. 320-327, ago. 1991.
NGUYEN, T. D.; NGUYEN, T. T. M.; BARRETT, N. J. Consumer ethnocentrism,
cultural sensitivity, and intention to purchase local products-evidence from Vietnam.
Journal of Consumer Behaviour, v. 7, n. 1, p. 88-100, jan./fev. 2008.
NIELSEN, J. A.; SPENCE, M. T. A test of the stability of the CETSCALE, a measure of
consumers' ethnocentric tendencies. Journal of Marketing Theory & Practice, v. 5, n. 4,
p. 68-76, outono 1997.
NUNNALLY, Jum C. Psychometric theory. Nova York: McGraw-Hill, 1978.
O'CASS, A.; LIM, K.. Toward understanding the young consumer's brand associations and
ethnocentrism in the Lion's port. Psychology & Marketing, v. 19, n. 9, p. 759-775, set.
2002.
OLIVEIRA, O. V. de; MIRANDA, C. Multiculturalismo crítico, relações raciais e política
curricular: a questão do hibridismo na Escola Sarã. Revista Brasileira de Educação, n.
25, p. 67-81, jan./abr. 2004.
ORTH, U. R.; FIRBASOVÁ, Z. The role of consumer ethnocentrism in food product
evaluation. Agribusiness, v. 19, n. 2, p. 137-153, Primavera 2003.
124 Strehlau, Ponchio, Loebel
BBR, Braz. Bus. Rev. (Engl. ed., Online), Vitória, v. 9, n. 4, Art. 5, p. 103 - 126, oct. – dec. 2012 www.bbronline.com.br
PECOTICH, A.; ROSENTHAL, M. J. Country of origin, quality, brand and consumer
ethnocentrism. Journal of Global Marketing, v. 15, n. 2, p. 31-60, 2001.
PEDHAZUR, E.; SCHMELKIN, L. Measurement, design, and analysis: an integrated
approach. Hillsdale: Lawrence Erlbaum Associates, 1991.
PEREIRA, A.; CHIN-CHUN, H.; KUNDU, S. A Cross-cultural analysis of ethnocentrism
in China, India, and Taiwan. Journal of International Consumer Marketing, v. 15, n. 1,
p. 77-90, 2002.
PONCHIO, M.; ARANHA, F. Materialism as a predictor variable of low income consumer
behavior when entering into installment plan agreements. Journal of Consumer
Behaviour, v. 7, n. 1, p. 21-34, 2008.
POON, P.; EVANGELISTA, F.; ALBAUM, G. Attitudes of migrants towards foreign-
made products: an exploratory study of migrants in Australia. Journal of Consumer
Marketing, v. 27, n. 1, p. 35-42, 2010.
RADEN, D. Ingroup bias, classic ethnocentrism, and non-ethnocentrism among American
whites. Political Psychology, v. 24, n. 4, p. 803-829, dez. 2003.
REARDON, J.; MILLER, C.; VIDA, I.; KIM, I. The effects of ethnocentrism and
economic development on the formation of brand and ad attitudes in transitional
economies European. Journal of Marketing, v. 39, n. 7-8, p. 737-754, 2005.
RICHARDS, M. U.S. multinational staffing practices and implications for subsidiary
performance in the U.K. and Thailand. Thunderbird International Business Review, v.
43 n. 2, p. 225-242, mar./abr. 2001.
RICHINS, M. L. The material values scale: measurement properties and development of a
short form. Journal of Consumer Research, v. 31, n. 1, p. 209-219, jun. 2004.
ROCHA, E. O que é etnocentrismo. São Paulo: Brasiliense, 2000.
SAFFU, K.; WALKER, J. H. An assessment of the consumer ethnocentric scale
(CETSCALE) in an advanced and transitional country: the case of Canada and Russia.
International Journal of Management, v. 22, n. 4, p. 556-571, dez. 2005.
SAFFU , K.; WALKER, J. H.; MAZUREK, M. The role of consumer ethnocentrism in a
buy national campaign in a transitioning country some evidence from Slovakia.
International Journal of Emerging Markets, v. 5, n. 2, p. 203-226, 2010.
SARTI, C. A. A família como ordem simbólica. Psicologia USP, v. 15, n. 3, p. 11-28,
2004.
SHANKARMAHESH, M. N. Consumer ethnocentrism: an integrative review of its
antecedents and consequences. International Marketing Review, v. 23, n. 2, p. 146-172,
2006.
SHARMA, S., SHIMP, T.A.; SHIN, J. Consumer ethnocentrism: a test of antecedents and
moderators. Journal of the Academy of Marketing Science, v. 23, n. 1, p. 26-37, 1995.
An Assessment of the consumer ethnocentric scale (CETSCALE): evidences from Brazil 125
BBR, Braz. Bus. Rev. (Engl. ed., Online), Vitória, v. 9, n. 4, Art. 5, p. 103 - 126, oct. – dec. 2012 www.bbronline.com.br
SHIMP, T. A.; SHARMA, S. Consumer ethnocentrism: construction and validation of the
CETSCALE. Journal of Marketing Research, v. 24, n. 3, p. 280-289, ago. 1987
SHOHAM, A.; BRENCIC, M. M. Consumer ethnocentrism, attitudes, and purchase
behavior: an Israeli study. Journal of International Consumer Marketing, v. 15, n. 4, p.
67-86, 2003
SIEMIENIAKO, D. et al. National and regional ethnocentrism: a case study of beer
consumers in Poland. British Food Journal, v. 113, n. 3, p. 404-418, 2011.
SPILLAN, J. E.; KUCUKEMIROGLU, O.; DE MAYOLO, C. A. Profiling Peruvian
consumers' lifestyles, market segmentation, and ethnocentrism. Latin American Business
Review, v. 8, n. 4, p. 38-59, 2007.
STREHLAU, V. I.; PONCHIO, M. C.; RIEGEL, V. País de origem e etnocentrismo na
avaliação da imagem de marca global: um estudo sobre o McDonald's. Internext, v. 5, p.
23-45, 2010
SUMNER, W. G. Folkways: a study of the sociological importance of usages, manners,
customs, mores, and morals. Nova York: Guin, 1906. [eBook #24253] Projeto Gutenberg.
Data de liberação: 11 de janeiro de 2008.
SUPPHELLEN, M.; GRONHAUG, K. Building foreign brand personalities in Russia: the
moderating effect of consumer ethnocentrism. International Journal of Advertising, v.
22, n. 2, p. 203-226, 2003.
SUPPHELLEN, M.; RITTENBURG, T. L. Consumer ethnocentrism when foreign
products are better. Psychology & Marketing, v. 18, n. 9, p. 907-927, set. 2001.
TOHARUDIN, T.; OUD, J. H. L.; BILLIET, J. B. Assessing the relationships between
nationalism, ethnocentrism, and individualism in flanders using bergstrom's approximate
discrete model. Statistica Neerlandica, v. 62, n. 1, p. 83-103, fev. 2008.
UELTSCHY, L. C. Brand perceptions as influenced by consumer ethnocentrism and
country-of-origin effects. Journal of Marketing Management, v. 8, n. 1, p. 12-23,
primavera/verão 1998.
UPADHYAY, Y.; SINGH, S. K. Preference for domestic goods: a study of consumer
ethnocentrism. Vision, v. 10, n. 3, p. 59-68, jul./set. 2006.
VIDA, I., DMITROVIC, T. OBADIA, C. The role of ethnic affiliation in consumer
ethnocentrism. European Journal of Marketing, v. 42, n. 3-4, p. 327-343, 2008.
WANG, Cheng Lu; CHEN, Zhen Xiong. Consumer ethnocentrism and willingness to buy
domestic products in a developing country setting: testing moderating effects. Journal of
Consumer Marketing, v. 21, n. 3, p. 391-400, 2004.
WARNIER, J. P. A mundialização da cultura. Bauru: EDUSC, 2003.
WATSON, J. J.; WRIGHT, K. Consumer ethnocentrism and attitudes toward domestic and
foreign products. European Journal of Marketing, v. 34, n. 9-10, p. 1149-1166, 2000.

126 Strehlau, Ponchio, Loebel
BBR, Braz. Bus. Rev. (Engl. ed., Online), Vitória, v. 9, n. 4, Art. 5, p. 103 - 126, oct. – dec. 2012 www.bbronline.com.br
WONG, Chui Yim; POLONSKY, M. J.; GARMA, R. The impact of consumer
ethnocentrism and country of origin sub-components for high involvement products on
young Chinese consumers’ product assessments. Asia Pacific Journal of Marketing and
Logistics, v. 20, n. 4, p. 455-478, 2008.
YAGCI, M. I. Evaluating the effects of country-of-origin and consumer ethnocentrism: a
case of a transplant product. Journal of International Consumer Marketing, v. 13, n. 3,
p. 63-85, 2001.
YELKUR, R.; CHAKRABARTY, S.; BANDYOPADHYAY, S. Ethnocentrism and
buying intentions: does economic development matter? Marketing Management
Journal, v. 16, n. 2, p. 26-37, Outono 2006.
YOO, B.; DONTHU, N. The effect of personal cultural orientation on consumer
ethnocentrism: evaluations and behaviors of U.S. consumers toward Japanese products.
Journal of International Consumer Marketing, v. 18, n. 1-2, p. 7-44, 2005.
ZOLFAGHARIAN, M. A.; SUN, Q. Country of origin, ethnocentrism and bicultural
consumers: the case of Mexican Americans. Journal of Consumer Marketing, v. 27, n. 4,
p. 345–357, 2010.