Probabilistic Landslide Susceptibility Analysis and Verification Using
Nat. Hazards Earth Syst. Sci., 14, 1553–1564, 2014www.nat-hazards-earth-syst-sci.net/14/1553/2014/doi:10.5194/nhess-14-1553-2014© Author(s) 2014. CC Attribution 3.0 License.
An assessment of landslide susceptibility in the Faifa area,Saudi Arabia, using remote sensing and GIS techniques
T. Alharbi 1,2, M. Sultan1, S. Sefry3, R. ElKadiri 1, M. Ahmed1,4, R. Chase1, A. Milewski5, M. Abu Abdullah 3,M. Emil 1, and K. Chounaird1
1Geosciences, Western Michigan University, 1903 W. Michigan Avenue, Kalamazoo, MI 49008, USA2Geology and Geophysics, King Saud University, 2455, 11451 Riyadh, Saudi Arabia3Saudi Geological Survey, 21514 Jeddah, Saudi Arabia4Geology, Faculty of Science, Suez Canal University, 41522 Ismailia, Egypt5Geology, University of Georgia, Geography-Geology Building, 210 Field Street, Athens, GA 30602, USA
Correspondence to:M. Sultan ([email protected])
Received: 18 July 2013 – Published in Nat. Hazards Earth Syst. Sci. Discuss.: 25 November 2013Revised: – Accepted: 30 April 2014 – Published: 23 June 2014
Abstract. An integrated approach was adopted over FaifaMountain and its surroundings, in Saudi Arabia, to identifylandslide types, distribution, and controlling factors, and togenerate landslide susceptibility maps. Given the inacces-sibility of the area, we relied on remote sensing observa-tions and GIS-based applications to enable spatial analysisof data and extrapolation of limited field observations. Sus-ceptibility maps depicting debris flows within ephemeral val-leys (Type I) and landslides caused by failure along fractureplanes (Type II) were generated. Type I susceptibility mapswere generated applying linear relationships between nor-malized difference vegetation index (NDVI) and thresholdslope values (30◦), both of which were extracted over knowndebris flow locations. For Type II susceptibility maps, land-slides were predicted if fracture planes had strike values sim-ilar to (within 20◦) those of the slope face strike and dip an-gles exceeding the friction, but not the slope angles. Compar-isons between predicted and observed debris flows yieldedsuccess rates of 82 % (ephemeral valleys); unverified predic-tions are interpreted as future locations of debris flows. Ourapproach could serve as a replicable model for many areasworldwide, in areas where field measurements are difficultto obtain and/or are cost prohibitive.
1 Introduction
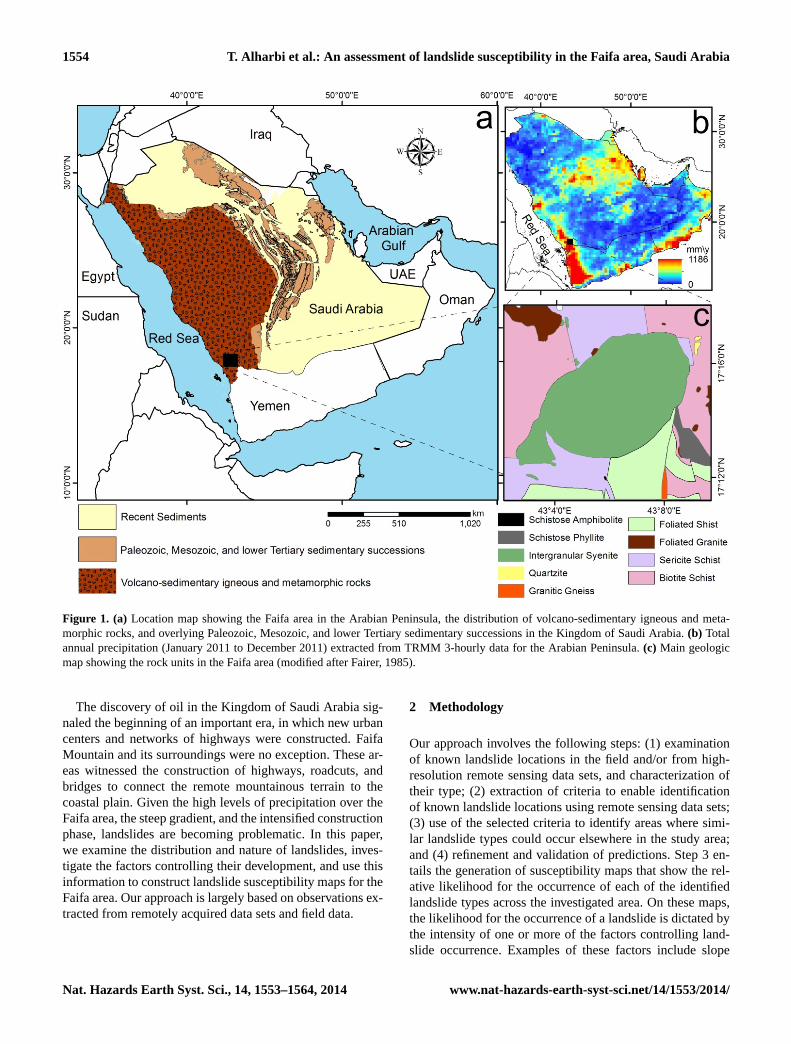
The Red Sea hills of the Arabian Peninsula consist of a com-plex of volcano-sedimentary igneous and metamorphic rocksthat were formed by the accretion of island arcs and closureof interleaving oceanic arcs 550–950 Ma (Stoeser and Camp,1985). The uplift associated with the opening of the RedSea some 30 million years ago exposed this complex alongthe length of the Red Sea on its African and Arabian sides(Wolfenden et al., 2004). The basement complex is uncon-formably overlain by Paleozoic, Mesozoic, and lower Ter-tiary sedimentary successions (Fig. 1a) (Agar, 1987). Thestudy area, Faifa Mountain and its surroundings in the Jazanregion (latitude: 16.5–17.7◦ N; longitude: 42.0–43.8◦ E), islocated within the basement complex of the Red Sea hillsto the north of the Saudi–Yemen border (Alehaideb, 1985;Abou Ouf and El Shater, 1992). In the study area, highly de-formed rocks of variable compositions (granite gneiss, am-phibolite, phyllite, quartzite, schist) are intruded by a mas-sive syenite intrusion, and the area is dissected by faultsystems that run in various directions. Elevations are high,reaching up to 1800 m a.m.s.l. (above mean sea level) at thetop of the mountains, and as low as 230 m a.m.s.l. at thefoot of the mountains (Fig. 2a). Precipitation is high (up to800 mm year−1; Fig. 1b) and slopes are steep (up to 71◦;Fig. 2b).
Published by Copernicus Publications on behalf of the European Geosciences Union.
1554 T. Alharbi et al.: An assessment of landslide susceptibility in the Faifa area, Saudi ArabiaFigure 1
Figure 1. (a) Location map showing the Faifa area in the Arabian Peninsula, the distribution of volcano-sedimentary igneous and meta-morphic rocks, and overlying Paleozoic, Mesozoic, and lower Tertiary sedimentary successions in the Kingdom of Saudi Arabia.(b) Totalannual precipitation (January 2011 to December 2011) extracted from TRMM 3-hourly data for the Arabian Peninsula.(c) Main geologicmap showing the rock units in the Faifa area (modified after Fairer, 1985).
The discovery of oil in the Kingdom of Saudi Arabia sig-naled the beginning of an important era, in which new urbancenters and networks of highways were constructed. FaifaMountain and its surroundings were no exception. These ar-eas witnessed the construction of highways, roadcuts, andbridges to connect the remote mountainous terrain to thecoastal plain. Given the high levels of precipitation over theFaifa area, the steep gradient, and the intensified constructionphase, landslides are becoming problematic. In this paper,we examine the distribution and nature of landslides, inves-tigate the factors controlling their development, and use thisinformation to construct landslide susceptibility maps for theFaifa area. Our approach is largely based on observations ex-tracted from remotely acquired data sets and field data.
2 Methodology
Our approach involves the following steps: (1) examinationof known landslide locations in the field and/or from high-resolution remote sensing data sets, and characterization oftheir type; (2) extraction of criteria to enable identificationof known landslide locations using remote sensing data sets;(3) use of the selected criteria to identify areas where simi-lar landslide types could occur elsewhere in the study area;and (4) refinement and validation of predictions. Step 3 en-tails the generation of susceptibility maps that show the rel-ative likelihood for the occurrence of each of the identifiedlandslide types across the investigated area. On these maps,the likelihood for the occurrence of a landslide is dictated bythe intensity of one or more of the factors controlling land-slide occurrence. Examples of these factors include slope
Nat. Hazards Earth Syst. Sci., 14, 1553–1564, 2014 www.nat-hazards-earth-syst-sci.net/14/1553/2014/
T. Alharbi et al.: An assessment of landslide susceptibility in the Faifa area, Saudi Arabia 1555
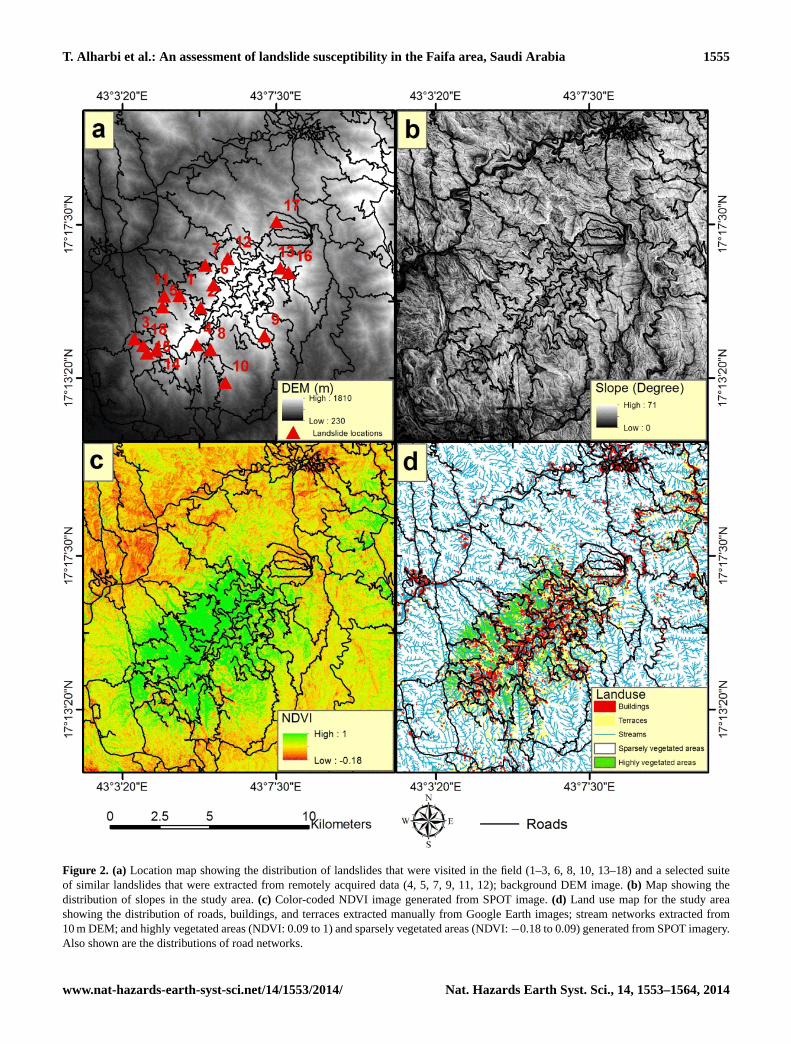
Figure 2. (a) Location map showing the distribution of landslides that were visited in the field (1–3, 6, 8, 10, 13–18) and a selected suiteof similar landslides that were extracted from remotely acquired data (4, 5, 7, 9, 11, 12); background DEM image.(b) Map showing thedistribution of slopes in the study area.(c) Color-coded NDVI image generated from SPOT image.(d) Land use map for the study areashowing the distribution of roads, buildings, and terraces extracted manually from Google Earth images; stream networks extracted from10 m DEM; and highly vegetated areas (NDVI: 0.09 to 1) and sparsely vegetated areas (NDVI:−0.18 to 0.09) generated from SPOT imagery.Also shown are the distributions of road networks.
www.nat-hazards-earth-syst-sci.net/14/1553/2014/ Nat. Hazards Earth Syst. Sci., 14, 1553–1564, 2014
1556 T. Alharbi et al.: An assessment of landslide susceptibility in the Faifa area, Saudi Arabia
angle and direction, fracture plane dip angle and dip direc-tion, vegetation intensity, and man-made structures (Crudenand Varnes, 1996).
To conduct steps 1 through 4, we had to produce manyderived image products that display important topographicand spectral characteristics of interest that could be usedto identify existing landslide locations and areas prone tolandslide development. Examples of these characteristics in-clude disruption of contoured elevations, decrease in veg-etation, and high spectral reflectance within areas affectedby landslides. Investigating the intensity of vegetation in anarea was possible as a result of examining normalized differ-ence vegetation index (NDVI) images; these were extractedfrom spectral reflectance images, which were in turn derivedfrom raw DN (digital number images) of SPOT (SystèmePour l’Observation de la Terre) multispectral images. Ad-ditional products were generated to evaluate the potentiallosses in human life and property that are associated withthe identified landslide types. Examples of these additionalproducts include maps showing the intersections of debrisflows with houses and roads. These and many other productswere generated and hosted in a web-based geographic infor-mation system (GIS) (http://www.esrs.wmich.edu/webmap).Constructing the web-based GIS made it possible to corre-late spatial and temporal coregistered data sets and the devel-opment of conceptual models to identify the conditions forlandslide development, predict the areas in which landslidescould occur, and identify locations for fieldwork to examinepredictions and refine the adopted methodologies.
2.1 Generation of a web-based GIS
The adopted approach entails (1) compilation of relevant datasets, and (2) development of a web-based GIS to organizeand manage the data sets and provide a platform for users toaccess, visualize, and analyze the accumulated data types forthe study area. The adopted system is a hybrid system thattakes advantage of the existing tools and data sets in GoogleMaps, applies Python scripts to generate custom tools, anduses the ArcGIS server to host the services.
Three types of data sets collected for the study were alsoincluded in the web-based GIS (folder name: Faifa): (1) pub-lished data sets (geologic maps, remote sensing data); (2) de-rived products (e.g., false color images, contour maps); and(3) field data (e.g., dip direction and dip amount of fractureplanes). Susceptibility maps were extracted from the analysisof the above-mentioned data sets and were also incorporatedin the web-based GIS. All of the data sets described aboveare included in seven subfolders. (1) The “Topography” sub-folder includes (a) a 10 m digital elevation model (DEM)(Fig. 2a) that was extracted from digital topographic contourmaps provided by the Saudi Geological Survey (SGS); (b) ahillshade map; and (c) a slope map (Fig. 2b). (2) The “Re-mote Sensing” subfolder includes (a) a visible Google Earthimage acquired in April 2010 (spatial resolution: 0.56 m);
(b) a false-color composite image from GeoEye images(blue: band 1; green: band 2; red: band 3) (spatial resolution:0.5 m); (c) Shuttle Imaging Radar band C (SIR-C) (spatialresolution: 50 m) data; (d) NDVI extracted from SPOT mul-tispectral images (spatial resolution: 2.5 m), which providesa measure for the intensity of vegetation (Fig. 2c) (the higherthe NDVI values for a picture element, the more extensive thevegetation, and vice versa; Rouse, 1973); (e) an AdvancedSpaceborne Thermal Emission and Reflection Radiometer(ASTER) false-color composite (blue: band 1; green: band 2;red: band 3) (spatial resolution: 15 m); (f) a Landsat The-matic Mapper (TM) false-color composite ratio image (blue:5/4; green: 5/1, red: 5/7) (spatial resolution: 30 m). (3) The“Geology” subfolder includes (a) a scanned and digitized ge-ologic map (Fairer, 1985) (scale 1 : 250 000); (b) the distribu-tion of faults/fractures extracted from geologic maps (Fairer,1985), ASTER, Landsat TM, SIR-C, and DEM; and (c) frac-ture dip aspect (direction) and amount, measured along themajor roads by SGS geologists. (4) The “Land Use” sub-folder contains digitized buildings, roads, naturally vege-tated areas, bare soils, and terraces extracted from GoogleEarth and GeoEye images (Fig. 2d). (5) The “Hydrology”subfolder includes products that were extracted from digital10 m DEM: (a) stream distribution (Fig. 2d) generated us-ing standard techniques for stream delineation, such as theTOPAZ technique (Garbrecht and Martz, 1997); and (b) flowaccumulation that provides a count for the number of pix-els that drain toward a certain pixel (Chang, 2006). (6) The“Field Data” subfolder is comprised of the types and loca-tions of the landslide sites (Fig. 2a) that were visited in thefield (January 2010 and January 2012). (7) The “Hazard”subfolder includes various susceptibility maps generated foreach of the two main types of landslides identified in thestudy area: those related to debris flows and those related tofailure on fracture planes.
2.2 Landslide types in the study area
Our observations from field trips 1 and 2 (Fig. 3) and ex-amination of remotely acquired data sets led us to identifytwo major types of landslides: those related to debris flows(Fig. 4a) and those related to failure along fracture planes(Fig. 4b). In the following sections, we discuss the criteriaby which we identify each of these landslide types from fieldand remotely acquired data and the methodology used to gen-erate susceptibility maps for each of the identified landslidetypes.
Nat. Hazards Earth Syst. Sci., 14, 1553–1564, 2014 www.nat-hazards-earth-syst-sci.net/14/1553/2014/
T. Alharbi et al.: An assessment of landslide susceptibility in the Faifa area, Saudi Arabia 1557
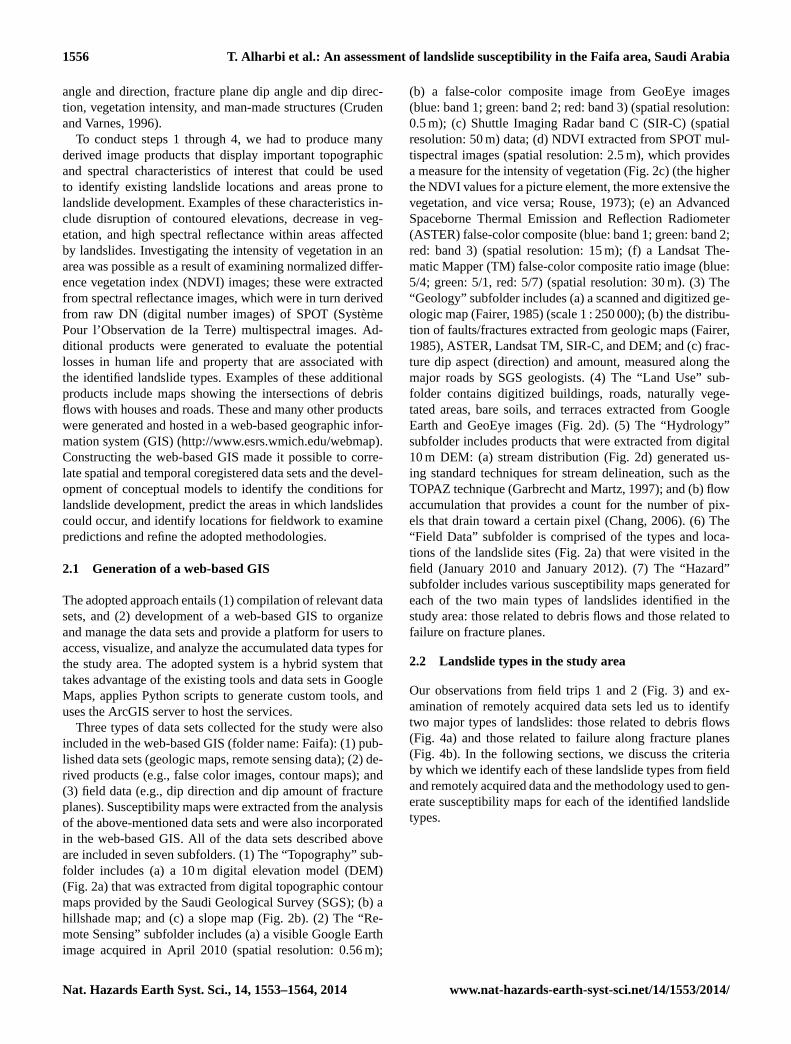
Figure 3. Location map showing the stops visited throughout fieldtrips 1 and 2.
2.2.1 Debris flows within ephemeral valleys
Debris flows often have high densities, consisting of over80 % solids by weight, and may exceed the density of wetconcrete (Hutchinson, 1988). Debris flow occurs during tor-rential runoff following exceptional rainfalls. Soils on steepslopes that are not protected by vegetation are prone to debrisflows (Cruden and Varnes, 1996).
Our observations from field trip 1 and examination of re-motely acquired data sets led us to believe that a number ofthe visited landslides were caused by debris flows that origi-nated with abrupt floods of water that undermined and incor-porated sediments. This conclusion is supported by (1) thelocalization of debris along discrete channels; (2) the fact thatthe landslides are all at high elevations (> 800 m a.m.s.l.),where the slopes are quite steep (35 to 38◦); and (3) thefact that precipitation over these steep mountains is high(up to 850 mm yr−1) (Fig. 1b) and will be channeled towardthe lowlands by the ephemeral valleys (Cruden and Varnes,1996). Given the steep surface gradient in the study area andthe high precipitation over the mountainous area, one wouldexpect a heavy sediment load to be carried to the lowlandsby the ephemeral streams crosscutting these mountains.
Figure 4. Field photographs taken throughout field trips 1 and 2:(a) landslide caused by debris flows within an ephemeral valley;(b) area prone to landslide development by failure along fractureplanes that dip towards the road; and(c) intersection of debris flowwith road.
www.nat-hazards-earth-syst-sci.net/14/1553/2014/ Nat. Hazards Earth Syst. Sci., 14, 1553–1564, 2014
1558 T. Alharbi et al.: An assessment of landslide susceptibility in the Faifa area, Saudi Arabia
One would expect that, in general, the steeper the slope isalong the identified streams, the more likely it is for a de-bris flow to occur. The mean slope in the area is 23◦ andthe standard deviation is 13◦. The steepest slopes are foundon the mountainsides surrounding the valleys. Areas overthese steep-sloped mountainsides are prone to mass move-ment (i.e., landslides) initiated by debris flow.
The less the vegetation there is, the more likely it is thatthe stream will be effective in transporting debris downslope(Horton, 1933; Scott, 1971; Wells et al., 1987; Weirich, 1989;Florsheim et al., 1991). Only barren or nearly barren slopesalong the identified stream were considered to be subject todebris flows. The NDVI values (Fig. 2c) for the study arearange from−0.18 to+1.0. Areas with NDVI values of−0.1to 0.09 are usually assumed to be barren rocks or dry soils(Jackson and Huete, 1991). Areas of high NDVI (shades ofgreen) are less prone to debris flows, whereas areas of lowNDVI values (shades of brown) are more prone to debrisflows. During field trip 2, we visited areas with NDVI valuesof 0.09 or less and found that all of these areas were barrenor had very sparse vegetation.
The third condition has to do with the presence or absenceof terraces. In some of the steeply–sloped areas, the localsmodify the slopes by building more stable structures calledterraces. These terraces are concentrated at higher elevationsin the Faifa area. They enhance infiltration and reduce runoff(Naderman et al., 1990). Debris flows are less likely to occurin areas where terraces are established. Based on our field ob-servations and analysis of Google Earth images, we reachedthe conclusion that areas covered by terraces are stable ar-eas that are not prone to debris flows. Figure 2d shows thedistribution of terraces in the study area.
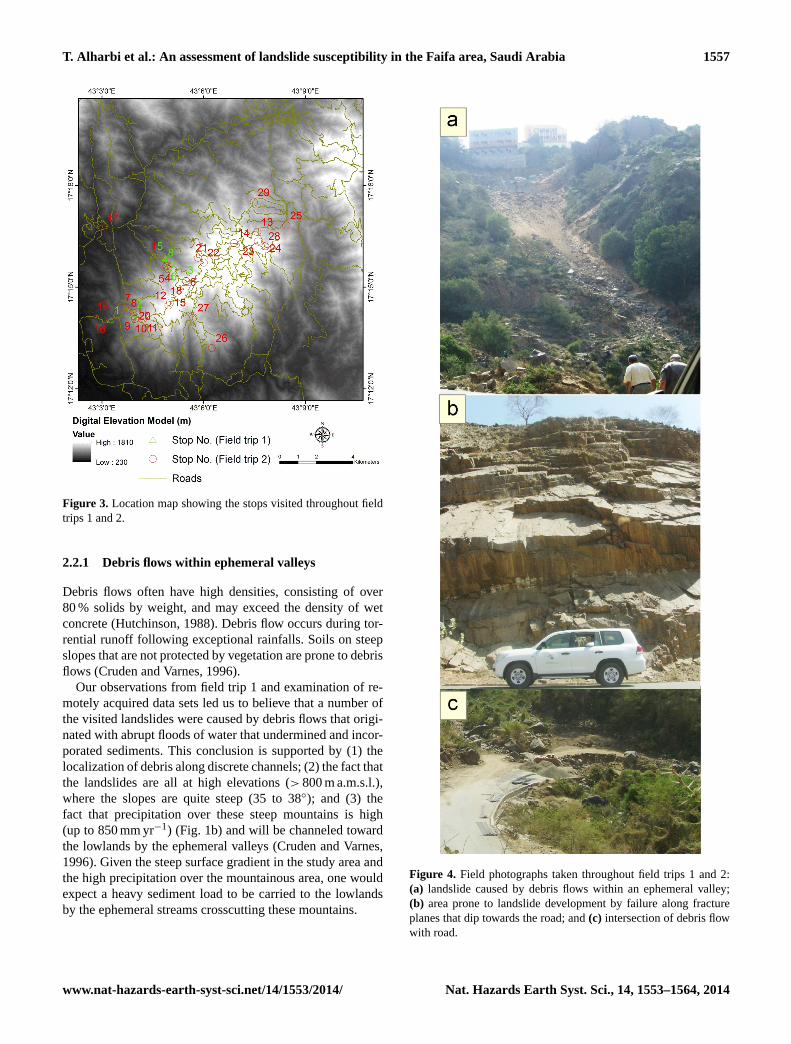
We extracted a relationship for the study area that ade-quately describes the interplay between the intensity of veg-etation and the steepness of the slope. Using known loca-tions of debris flows (from field and satellite observations),we extracted the slopes and NDVI values for picture elements(pixels) that we identified as representing the onset points foreach of these debris flows. Areas susceptible to the develop-ment of debris flow had to meet a number of conditions: lowNDVI, high slope angle, and presence along mapped streamlines and away from areas mapped as terraces. In defining thestream lines, a threshold-contributing area of 25 pixels (area:2500 m2) was required. The extracted slopes ranged from30 to 42◦ and averaged 35◦, whereas the NDVI values rangedfrom −0.04 to 0.24 and averaged 0.07. A linear regressionwas then used to identify the equation of a straight line thatbest fit the points with the steepest slope and the smallestNDVI values (Fig. 5). Knowing the equation of the straightline, we then substituted NDVI and slope values for all pix-els of all streams in the equation to test whether the examinedstream pixel is on the line (value = 0), above the line (value:negative), or below the line (value: positive). A susceptibil-ity map was then constructed from pixels that were found onor below the line; the selected points had slope values that
Figure 5
Figure 5. NDVI versus slope values for the debris flows that wereverified in the field and/or by examination of Google Earth images.Also shown is a regression line that separates points prone to land-slide (below line) from others that are not prone to debris flows(above line) and susceptibility levels expressed as a function of dis-tance from the regression line.
exceeded a threshold value of 30◦, the minimum observedslope angle for debris flows visited in the field (Fig. 6). Fig-ures 5 and 6 reflect differences in susceptibility levels as afunction of the distance from the regression line within areasidentified on Fig. 5 as being prone to debris flow. Inspectionof Fig. 5 shows that as slope values increase and/or NDVIvalues decrease, points become progressively separated fromthe regression line and more susceptible to debris flow. Theconstructed susceptibility map represents the locations alongmapped stream lines that are susceptible to the developmentof debris flow. Points that fell above the line were consideredto be unsusceptible to debris flow. An additional conditionwas enforced: the points that were found to be susceptible todebris flow had to be outside the areas mapped as terraces.
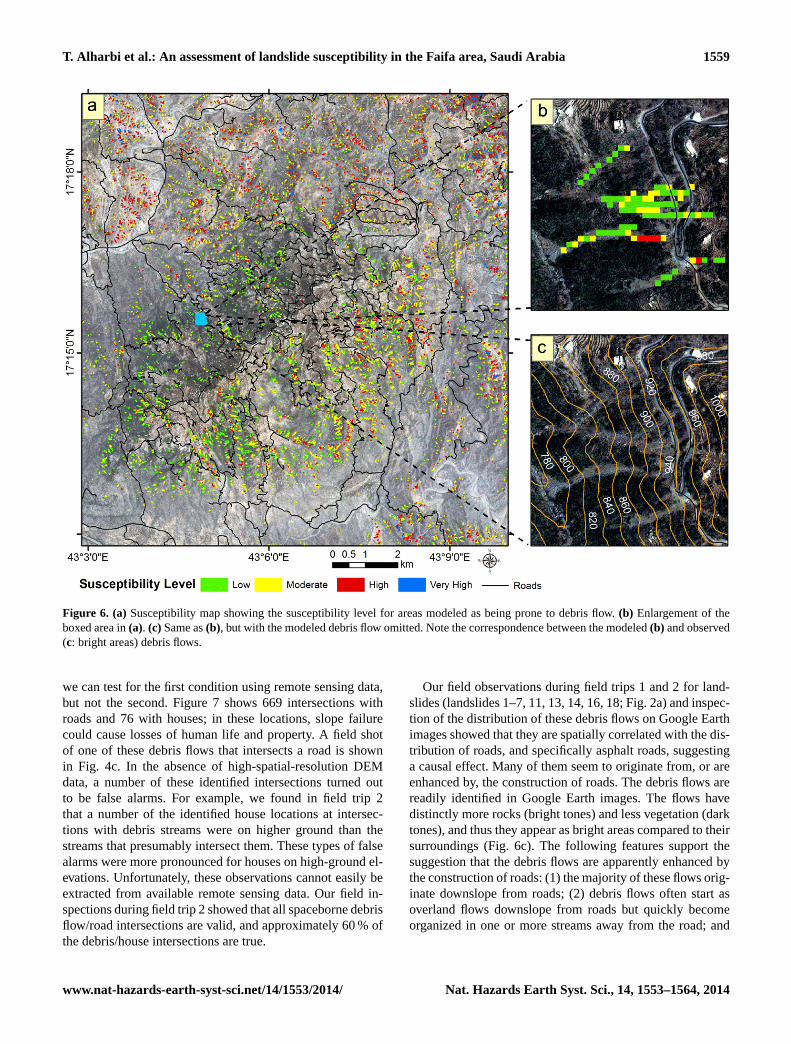
Using the criteria listed above, a susceptibility map wasconstructed showing the distribution of areas (1405 loca-tions) that are prone to debris flows (hereafter referred toas predicted debris flows) (Fig. 6a). Examination of Fig. 6band c demonstrates the correspondence between the observedand predicted debris flows. Comparisons between the distri-bution of a subset of the predicted flows (500 debris flowsextracted using a random number generator) and the debrisflows observed in the field and from Google Earth imagesshows a success rate of 82 %, where the predicted flows ex-ceed the observed flows. These additional locations probablymark potential areas where debris flows could be triggered inthe future. Similar comparisons between the distributions ofa subset of random areas identified as being non-prone to de-bris flow and the observed debris flows in the field and fromGoogle Earth images yielded a success rate of 99.2 %.
Debris flows could pose a risk to human life and prop-erty if these flows intersect roads and houses, and if therewere no or inadequate retaining walls in place. In both cases,
Nat. Hazards Earth Syst. Sci., 14, 1553–1564, 2014 www.nat-hazards-earth-syst-sci.net/14/1553/2014/
T. Alharbi et al.: An assessment of landslide susceptibility in the Faifa area, Saudi Arabia 1559
Figure 6. (a) Susceptibility map showing the susceptibility level for areas modeled as being prone to debris flow.(b) Enlargement of theboxed area in(a). (c) Same as(b), but with the modeled debris flow omitted. Note the correspondence between the modeled(b) and observed(c: bright areas) debris flows.
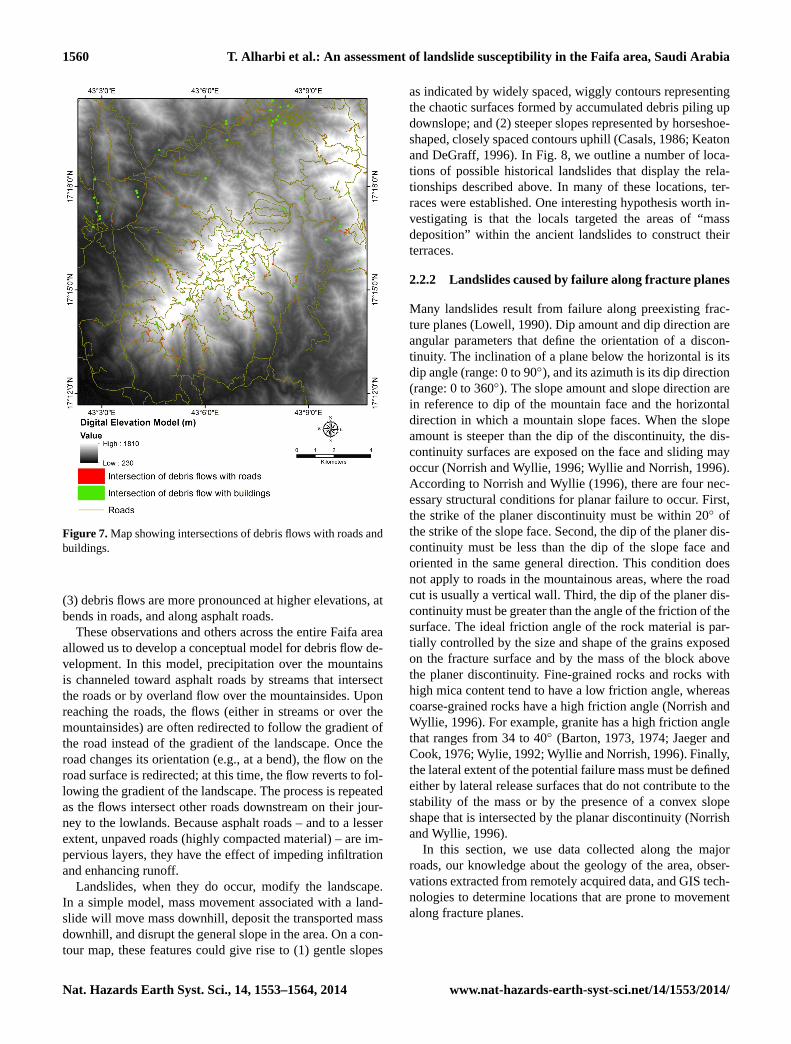
we can test for the first condition using remote sensing data,but not the second. Figure 7 shows 669 intersections withroads and 76 with houses; in these locations, slope failurecould cause losses of human life and property. A field shotof one of these debris flows that intersects a road is shownin Fig. 4c. In the absence of high-spatial-resolution DEMdata, a number of these identified intersections turned outto be false alarms. For example, we found in field trip 2that a number of the identified house locations at intersec-tions with debris streams were on higher ground than thestreams that presumably intersect them. These types of falsealarms were more pronounced for houses on high-ground el-evations. Unfortunately, these observations cannot easily beextracted from available remote sensing data. Our field in-spections during field trip 2 showed that all spaceborne debrisflow/road intersections are valid, and approximately 60 % ofthe debris/house intersections are true.
Our field observations during field trips 1 and 2 for land-slides (landslides 1–7, 11, 13, 14, 16, 18; Fig. 2a) and inspec-tion of the distribution of these debris flows on Google Earthimages showed that they are spatially correlated with the dis-tribution of roads, and specifically asphalt roads, suggestinga causal effect. Many of them seem to originate from, or areenhanced by, the construction of roads. The debris flows arereadily identified in Google Earth images. The flows havedistinctly more rocks (bright tones) and less vegetation (darktones), and thus they appear as bright areas compared to theirsurroundings (Fig. 6c). The following features support thesuggestion that the debris flows are apparently enhanced bythe construction of roads: (1) the majority of these flows orig-inate downslope from roads; (2) debris flows often start asoverland flows downslope from roads but quickly becomeorganized in one or more streams away from the road; and
www.nat-hazards-earth-syst-sci.net/14/1553/2014/ Nat. Hazards Earth Syst. Sci., 14, 1553–1564, 2014
1560 T. Alharbi et al.: An assessment of landslide susceptibility in the Faifa area, Saudi Arabia
Figure 7. Map showing intersections of debris flows with roads andbuildings.
(3) debris flows are more pronounced at higher elevations, atbends in roads, and along asphalt roads.
These observations and others across the entire Faifa areaallowed us to develop a conceptual model for debris flow de-velopment. In this model, precipitation over the mountainsis channeled toward asphalt roads by streams that intersectthe roads or by overland flow over the mountainsides. Uponreaching the roads, the flows (either in streams or over themountainsides) are often redirected to follow the gradient ofthe road instead of the gradient of the landscape. Once theroad changes its orientation (e.g., at a bend), the flow on theroad surface is redirected; at this time, the flow reverts to fol-lowing the gradient of the landscape. The process is repeatedas the flows intersect other roads downstream on their jour-ney to the lowlands. Because asphalt roads – and to a lesserextent, unpaved roads (highly compacted material) – are im-pervious layers, they have the effect of impeding infiltrationand enhancing runoff.
Landslides, when they do occur, modify the landscape.In a simple model, mass movement associated with a land-slide will move mass downhill, deposit the transported massdownhill, and disrupt the general slope in the area. On a con-tour map, these features could give rise to (1) gentle slopes
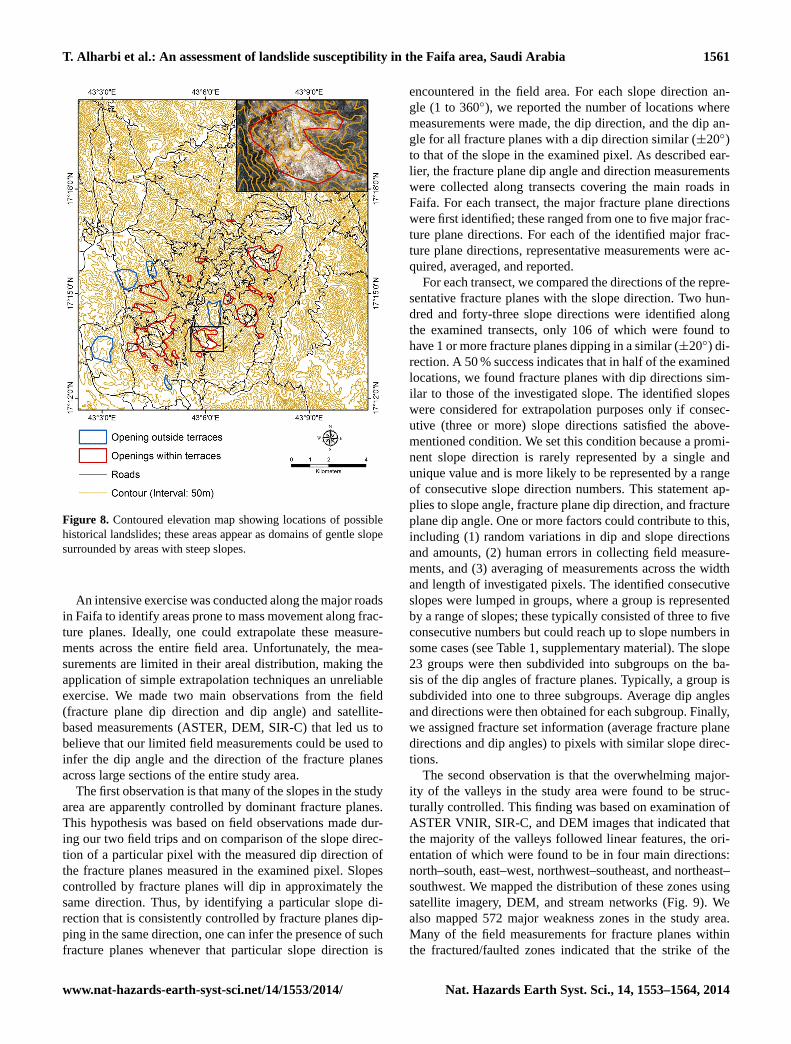
as indicated by widely spaced, wiggly contours representingthe chaotic surfaces formed by accumulated debris piling updownslope; and (2) steeper slopes represented by horseshoe-shaped, closely spaced contours uphill (Casals, 1986; Keatonand DeGraff, 1996). In Fig. 8, we outline a number of loca-tions of possible historical landslides that display the rela-tionships described above. In many of these locations, ter-races were established. One interesting hypothesis worth in-vestigating is that the locals targeted the areas of “massdeposition” within the ancient landslides to construct theirterraces.
2.2.2 Landslides caused by failure along fracture planes
Many landslides result from failure along preexisting frac-ture planes (Lowell, 1990). Dip amount and dip direction areangular parameters that define the orientation of a discon-tinuity. The inclination of a plane below the horizontal is itsdip angle (range: 0 to 90◦), and its azimuth is its dip direction(range: 0 to 360◦). The slope amount and slope direction arein reference to dip of the mountain face and the horizontaldirection in which a mountain slope faces. When the slopeamount is steeper than the dip of the discontinuity, the dis-continuity surfaces are exposed on the face and sliding mayoccur (Norrish and Wyllie, 1996; Wyllie and Norrish, 1996).According to Norrish and Wyllie (1996), there are four nec-essary structural conditions for planar failure to occur. First,the strike of the planer discontinuity must be within 20◦ ofthe strike of the slope face. Second, the dip of the planer dis-continuity must be less than the dip of the slope face andoriented in the same general direction. This condition doesnot apply to roads in the mountainous areas, where the roadcut is usually a vertical wall. Third, the dip of the planer dis-continuity must be greater than the angle of the friction of thesurface. The ideal friction angle of the rock material is par-tially controlled by the size and shape of the grains exposedon the fracture surface and by the mass of the block abovethe planer discontinuity. Fine-grained rocks and rocks withhigh mica content tend to have a low friction angle, whereascoarse-grained rocks have a high friction angle (Norrish andWyllie, 1996). For example, granite has a high friction anglethat ranges from 34 to 40◦ (Barton, 1973, 1974; Jaeger andCook, 1976; Wylie, 1992; Wyllie and Norrish, 1996). Finally,the lateral extent of the potential failure mass must be definedeither by lateral release surfaces that do not contribute to thestability of the mass or by the presence of a convex slopeshape that is intersected by the planar discontinuity (Norrishand Wyllie, 1996).
In this section, we use data collected along the majorroads, our knowledge about the geology of the area, obser-vations extracted from remotely acquired data, and GIS tech-nologies to determine locations that are prone to movementalong fracture planes.
Nat. Hazards Earth Syst. Sci., 14, 1553–1564, 2014 www.nat-hazards-earth-syst-sci.net/14/1553/2014/
T. Alharbi et al.: An assessment of landslide susceptibility in the Faifa area, Saudi Arabia 1561
Figure 8. Contoured elevation map showing locations of possiblehistorical landslides; these areas appear as domains of gentle slopesurrounded by areas with steep slopes.
An intensive exercise was conducted along the major roadsin Faifa to identify areas prone to mass movement along frac-ture planes. Ideally, one could extrapolate these measure-ments across the entire field area. Unfortunately, the mea-surements are limited in their areal distribution, making theapplication of simple extrapolation techniques an unreliableexercise. We made two main observations from the field(fracture plane dip direction and dip angle) and satellite-based measurements (ASTER, DEM, SIR-C) that led us tobelieve that our limited field measurements could be used toinfer the dip angle and the direction of the fracture planesacross large sections of the entire study area.
The first observation is that many of the slopes in the studyarea are apparently controlled by dominant fracture planes.This hypothesis was based on field observations made dur-ing our two field trips and on comparison of the slope direc-tion of a particular pixel with the measured dip direction ofthe fracture planes measured in the examined pixel. Slopescontrolled by fracture planes will dip in approximately thesame direction. Thus, by identifying a particular slope di-rection that is consistently controlled by fracture planes dip-ping in the same direction, one can infer the presence of suchfracture planes whenever that particular slope direction is
encountered in the field area. For each slope direction an-gle (1 to 360◦), we reported the number of locations wheremeasurements were made, the dip direction, and the dip an-gle for all fracture planes with a dip direction similar (±20◦)to that of the slope in the examined pixel. As described ear-lier, the fracture plane dip angle and direction measurementswere collected along transects covering the main roads inFaifa. For each transect, the major fracture plane directionswere first identified; these ranged from one to five major frac-ture plane directions. For each of the identified major frac-ture plane directions, representative measurements were ac-quired, averaged, and reported.
For each transect, we compared the directions of the repre-sentative fracture planes with the slope direction. Two hun-dred and forty-three slope directions were identified alongthe examined transects, only 106 of which were found tohave 1 or more fracture planes dipping in a similar (±20◦) di-rection. A 50 % success indicates that in half of the examinedlocations, we found fracture planes with dip directions sim-ilar to those of the investigated slope. The identified slopeswere considered for extrapolation purposes only if consec-utive (three or more) slope directions satisfied the above-mentioned condition. We set this condition because a promi-nent slope direction is rarely represented by a single andunique value and is more likely to be represented by a rangeof consecutive slope direction numbers. This statement ap-plies to slope angle, fracture plane dip direction, and fractureplane dip angle. One or more factors could contribute to this,including (1) random variations in dip and slope directionsand amounts, (2) human errors in collecting field measure-ments, and (3) averaging of measurements across the widthand length of investigated pixels. The identified consecutiveslopes were lumped in groups, where a group is representedby a range of slopes; these typically consisted of three to fiveconsecutive numbers but could reach up to slope numbers insome cases (see Table 1, supplementary material). The slope23 groups were then subdivided into subgroups on the ba-sis of the dip angles of fracture planes. Typically, a group issubdivided into one to three subgroups. Average dip anglesand directions were then obtained for each subgroup. Finally,we assigned fracture set information (average fracture planedirections and dip angles) to pixels with similar slope direc-tions.
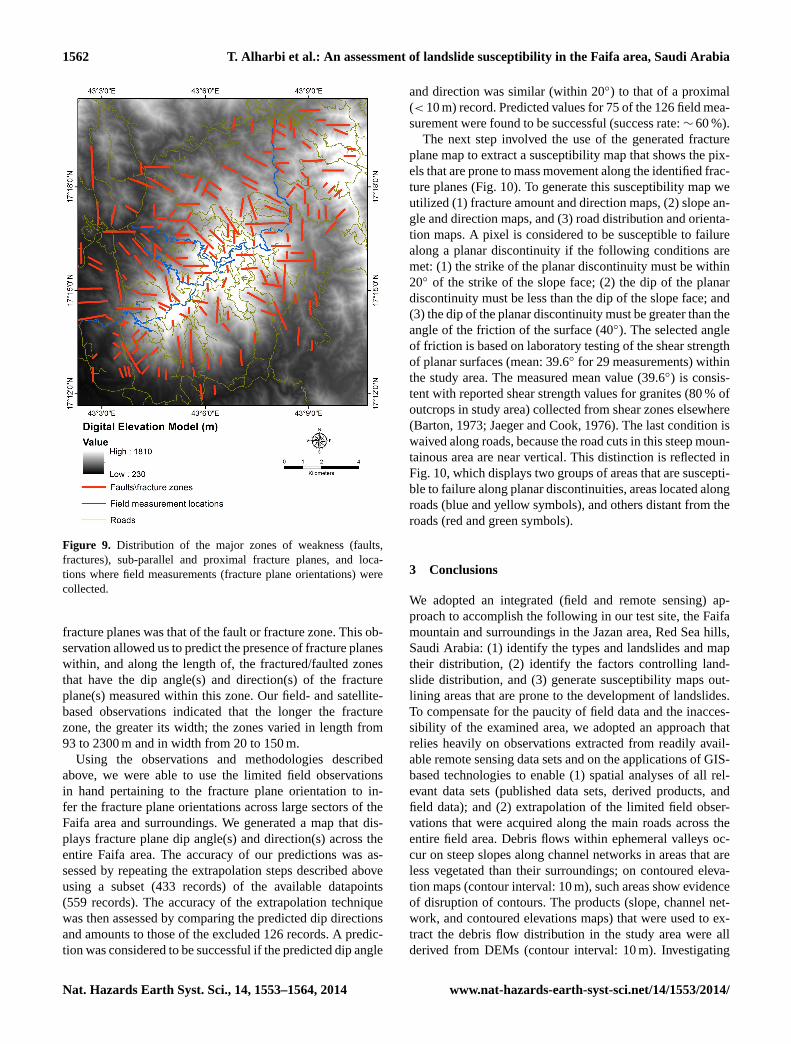
The second observation is that the overwhelming major-ity of the valleys in the study area were found to be struc-turally controlled. This finding was based on examination ofASTER VNIR, SIR-C, and DEM images that indicated thatthe majority of the valleys followed linear features, the ori-entation of which were found to be in four main directions:north–south, east–west, northwest–southeast, and northeast–southwest. We mapped the distribution of these zones usingsatellite imagery, DEM, and stream networks (Fig. 9). Wealso mapped 572 major weakness zones in the study area.Many of the field measurements for fracture planes withinthe fractured/faulted zones indicated that the strike of the
www.nat-hazards-earth-syst-sci.net/14/1553/2014/ Nat. Hazards Earth Syst. Sci., 14, 1553–1564, 2014
1562 T. Alharbi et al.: An assessment of landslide susceptibility in the Faifa area, Saudi ArabiaFigure 9
Figure 9. Distribution of the major zones of weakness (faults,fractures), sub-parallel and proximal fracture planes, and loca-tions where field measurements (fracture plane orientations) werecollected.
fracture planes was that of the fault or fracture zone. This ob-servation allowed us to predict the presence of fracture planeswithin, and along the length of, the fractured/faulted zonesthat have the dip angle(s) and direction(s) of the fractureplane(s) measured within this zone. Our field- and satellite-based observations indicated that the longer the fracturezone, the greater its width; the zones varied in length from93 to 2300 m and in width from 20 to 150 m.
Using the observations and methodologies describedabove, we were able to use the limited field observationsin hand pertaining to the fracture plane orientation to in-fer the fracture plane orientations across large sectors of theFaifa area and surroundings. We generated a map that dis-plays fracture plane dip angle(s) and direction(s) across theentire Faifa area. The accuracy of our predictions was as-sessed by repeating the extrapolation steps described aboveusing a subset (433 records) of the available datapoints(559 records). The accuracy of the extrapolation techniquewas then assessed by comparing the predicted dip directionsand amounts to those of the excluded 126 records. A predic-tion was considered to be successful if the predicted dip angle
and direction was similar (within 20◦) to that of a proximal(< 10 m) record. Predicted values for 75 of the 126 field mea-surement were found to be successful (success rate:∼ 60 %).
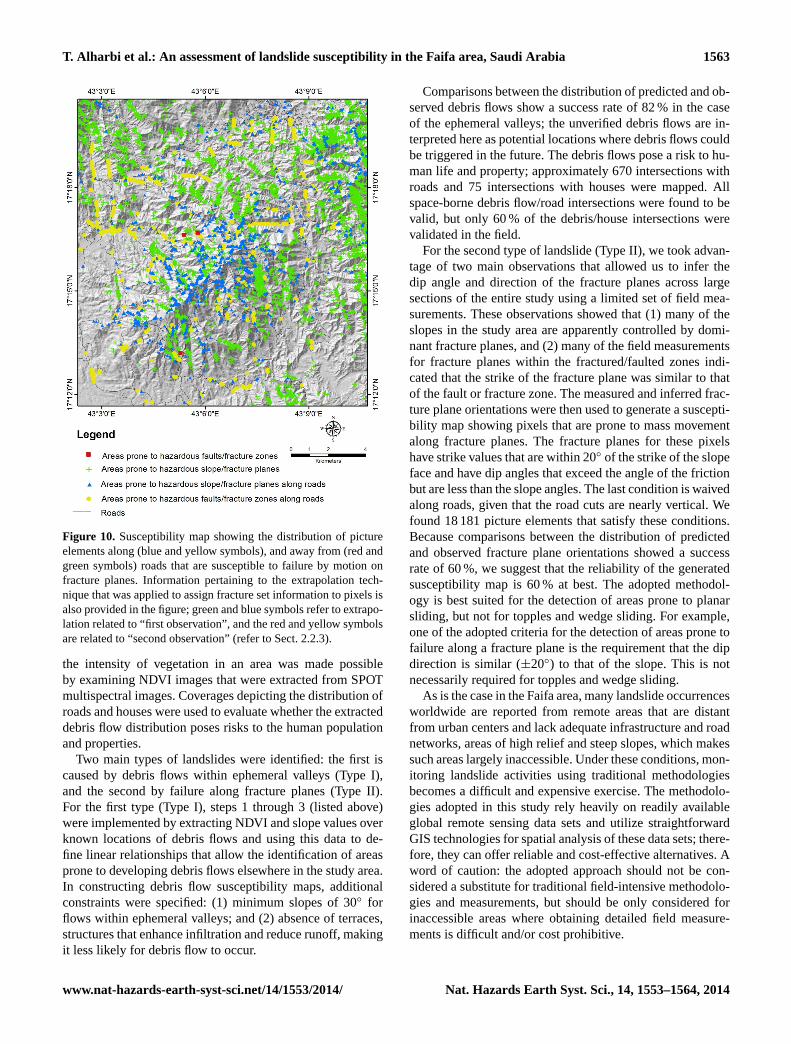
The next step involved the use of the generated fractureplane map to extract a susceptibility map that shows the pix-els that are prone to mass movement along the identified frac-ture planes (Fig. 10). To generate this susceptibility map weutilized (1) fracture amount and direction maps, (2) slope an-gle and direction maps, and (3) road distribution and orienta-tion maps. A pixel is considered to be susceptible to failurealong a planar discontinuity if the following conditions aremet: (1) the strike of the planar discontinuity must be within20◦ of the strike of the slope face; (2) the dip of the planardiscontinuity must be less than the dip of the slope face; and(3) the dip of the planar discontinuity must be greater than theangle of the friction of the surface (40◦). The selected angleof friction is based on laboratory testing of the shear strengthof planar surfaces (mean: 39.6◦ for 29 measurements) withinthe study area. The measured mean value (39.6◦) is consis-tent with reported shear strength values for granites (80 % ofoutcrops in study area) collected from shear zones elsewhere(Barton, 1973; Jaeger and Cook, 1976). The last condition iswaived along roads, because the road cuts in this steep moun-tainous area are near vertical. This distinction is reflected inFig. 10, which displays two groups of areas that are suscepti-ble to failure along planar discontinuities, areas located alongroads (blue and yellow symbols), and others distant from theroads (red and green symbols).
3 Conclusions
We adopted an integrated (field and remote sensing) ap-proach to accomplish the following in our test site, the Faifamountain and surroundings in the Jazan area, Red Sea hills,Saudi Arabia: (1) identify the types and landslides and maptheir distribution, (2) identify the factors controlling land-slide distribution, and (3) generate susceptibility maps out-lining areas that are prone to the development of landslides.To compensate for the paucity of field data and the inacces-sibility of the examined area, we adopted an approach thatrelies heavily on observations extracted from readily avail-able remote sensing data sets and on the applications of GIS-based technologies to enable (1) spatial analyses of all rel-evant data sets (published data sets, derived products, andfield data); and (2) extrapolation of the limited field obser-vations that were acquired along the main roads across theentire field area. Debris flows within ephemeral valleys oc-cur on steep slopes along channel networks in areas that areless vegetated than their surroundings; on contoured eleva-tion maps (contour interval: 10 m), such areas show evidenceof disruption of contours. The products (slope, channel net-work, and contoured elevations maps) that were used to ex-tract the debris flow distribution in the study area were allderived from DEMs (contour interval: 10 m). Investigating
Nat. Hazards Earth Syst. Sci., 14, 1553–1564, 2014 www.nat-hazards-earth-syst-sci.net/14/1553/2014/
T. Alharbi et al.: An assessment of landslide susceptibility in the Faifa area, Saudi Arabia 1563
Figure 10. Susceptibility map showing the distribution of pictureelements along (blue and yellow symbols), and away from (red andgreen symbols) roads that are susceptible to failure by motion onfracture planes. Information pertaining to the extrapolation tech-nique that was applied to assign fracture set information to pixels isalso provided in the figure; green and blue symbols refer to extrapo-lation related to “first observation”, and the red and yellow symbolsare related to “second observation” (refer to Sect. 2.2.3).
the intensity of vegetation in an area was made possibleby examining NDVI images that were extracted from SPOTmultispectral images. Coverages depicting the distribution ofroads and houses were used to evaluate whether the extracteddebris flow distribution poses risks to the human populationand properties.
Two main types of landslides were identified: the first iscaused by debris flows within ephemeral valleys (Type I),and the second by failure along fracture planes (Type II).For the first type (Type I), steps 1 through 3 (listed above)were implemented by extracting NDVI and slope values overknown locations of debris flows and using this data to de-fine linear relationships that allow the identification of areasprone to developing debris flows elsewhere in the study area.In constructing debris flow susceptibility maps, additionalconstraints were specified: (1) minimum slopes of 30◦ forflows within ephemeral valleys; and (2) absence of terraces,structures that enhance infiltration and reduce runoff, makingit less likely for debris flow to occur.
Comparisons between the distribution of predicted and ob-served debris flows show a success rate of 82 % in the caseof the ephemeral valleys; the unverified debris flows are in-terpreted here as potential locations where debris flows couldbe triggered in the future. The debris flows pose a risk to hu-man life and property; approximately 670 intersections withroads and 75 intersections with houses were mapped. Allspace-borne debris flow/road intersections were found to bevalid, but only 60 % of the debris/house intersections werevalidated in the field.
For the second type of landslide (Type II), we took advan-tage of two main observations that allowed us to infer thedip angle and direction of the fracture planes across largesections of the entire study using a limited set of field mea-surements. These observations showed that (1) many of theslopes in the study area are apparently controlled by domi-nant fracture planes, and (2) many of the field measurementsfor fracture planes within the fractured/faulted zones indi-cated that the strike of the fracture plane was similar to thatof the fault or fracture zone. The measured and inferred frac-ture plane orientations were then used to generate a suscepti-bility map showing pixels that are prone to mass movementalong fracture planes. The fracture planes for these pixelshave strike values that are within 20◦ of the strike of the slopeface and have dip angles that exceed the angle of the frictionbut are less than the slope angles. The last condition is waivedalong roads, given that the road cuts are nearly vertical. Wefound 18 181 picture elements that satisfy these conditions.Because comparisons between the distribution of predictedand observed fracture plane orientations showed a successrate of 60 %, we suggest that the reliability of the generatedsusceptibility map is 60 % at best. The adopted methodol-ogy is best suited for the detection of areas prone to planarsliding, but not for topples and wedge sliding. For example,one of the adopted criteria for the detection of areas prone tofailure along a fracture plane is the requirement that the dipdirection is similar (±20◦) to that of the slope. This is notnecessarily required for topples and wedge sliding.
As is the case in the Faifa area, many landslide occurrencesworldwide are reported from remote areas that are distantfrom urban centers and lack adequate infrastructure and roadnetworks, areas of high relief and steep slopes, which makessuch areas largely inaccessible. Under these conditions, mon-itoring landslide activities using traditional methodologiesbecomes a difficult and expensive exercise. The methodolo-gies adopted in this study rely heavily on readily availableglobal remote sensing data sets and utilize straightforwardGIS technologies for spatial analysis of these data sets; there-fore, they can offer reliable and cost-effective alternatives. Aword of caution: the adopted approach should not be con-sidered a substitute for traditional field-intensive methodolo-gies and measurements, but should be only considered forinaccessible areas where obtaining detailed field measure-ments is difficult and/or cost prohibitive.
www.nat-hazards-earth-syst-sci.net/14/1553/2014/ Nat. Hazards Earth Syst. Sci., 14, 1553–1564, 2014
1564 T. Alharbi et al.: An assessment of landslide susceptibility in the Faifa area, Saudi Arabia
The Supplement related to this article is available onlineat doi:10.5194/nhess-14-1553-2014-supplement.
Acknowledgements.Funding for this project was provided throughan award from the Saudi Geological Survey (SGS) to WesternMichigan University (award SGS5/2141). The SGS also providedlogistical support for conducting field work in the Jazan area.
Edited by: R. LasaponaraReviewed by: A. Lanorte and three anonymous referees
References
Abou Ouf, M. A. and El Shater, A.: Sedimentology and mineralogyof Jizan shelf sediments, Red Sea, Saudi Arabia, J. King Abdu-laziz University, 3, 133–141, 1992.
Agar, R. A.: The Najd fault system revisited a two-way strike-sliporogen in the Saudi Arabian Shield, J. Struct. Geol., 9, 41–48,1987.
Alehaideb, I.: Rainfall distribution in the southwest of Saudi Arabia,Ph.D. thesis, Arizona State Univ., Arizona, USA, 430 pp., 1985.
Barton, N. R.: Review of a new shear strength criterion for rockjoints, Eng. Geol., 7, 287–332, 1973.
Barton, N. R.: A review of the shear strength of filled discontinuitiesin rock, Norges Geotekniske Institutt, 105, 1–19, 1974.
Casals, J. F.: Analysis of a landslide along Interstate 70 near Vail,Master’s thesis, Colorado School of Mines, Golden, Colo., USA,121 pp., 1986.
Chang, K.: Introduction to geographic information system, 3rd edi-tion, McGraw Hill, New York, 432 pp., 2006.
Cruden, D. and Varnes, D.: Landslide types and processes, in: Land-slides: Investigation and Mitigation, Transportation ResearchBoard, Washington, D.C., 36–75, 1996.
Fairer, G. M.: Explanatory notes to the geologic map of the WadiBaysh Quadrangle, Deputy Ministry for Mineral Resources,Ministry of Petroleum and Mineral Resources, Kingdom ofSaudi Arabia, Denver, Colorado, USA, 1–23, 1985.
Florsheim, J. L., Keller, E. A., and Best, D. W.: Fluvial sedimenttransport in response to moderate storm flows following cha-parral wildfire, Geol. Soc. Am. Bull., 103, 504–511, 1991.
Garbrecht, J. and Martz, L. W.: TOPAZ Version 1.20: an auto-mated digital landscape analysis tool for topographic evalua-tion, drainage identification, watershed segmentation and sub-catchment parameterization, Grazinglands Research Laboratory,El Reno, Oklahoma, 1–21, 1997.
Horton, R. E.: The role of infiltration in the hydrologic cycle, EOST. Am. Geophys. Un., 14, 446–460, 1933.
Hutchinson, J.: Morphological and geotechnical parameters of land-slides in relation to geology and hydrogeology, Fifth Interna-tional Symposium on Landslides, 10–15 July 1988, Rotterdam,the Netherlands, 3–35, 1988.
Jackson, R. D. and Huete, A. R.: Interpreting vegetation indices,Prev. Vet. Med., 2, 185–200, 1991.
Jaeger, J. C. and Cook, N. G. W.: Fundamentals of Rock Mechanics,2nd edition, Chapman and Hall, London, UK, 593 p., 1976.
Keaton, J. R. and DeGraff, J. V.: Surface observation and geologicmapping, in: Landslides: Investigation and Mitigation, Trans-portation Research Board, Washington, D.C., 178–230, 1996.
Lowell, S.: The K M Mountain landslide near Skamokawa, Wash-ington Geologic Newsletter, 18, 3–7, 1990.
Naderman, G. C., Hansard, J. R., and Denton, H. P.: Surface watermanagement for crop production on highly erodible land, Appl.Agr. Res., 5, 243–254, 1990.
Norrish, N. I. and Wyllie, D. C.: Rock slope stability analysis,in: Landslides: Investigation and Mitigation, Transportation Re-search Board, Washington, D.C., 391–425, 1996.
Rouse, J.: Monitoring the Vernal Advancement and Retrogradation(Green Wave Effect) of Natural Vegetation, Remote Sens., 36,4–38, 1973.
Scott, K.: Origin and Sedimentology of 1969 Debris Flows NearGlendora, California, Geol. Surv. Prof. Paper 750, United StatesGovernment Printing Office, Washington, 242–247, 1971.
Stoeser, D. B. and Camp, V. E.: Pan-African microplate accretionof the Arabian Shield, Geol. Soc. Am. Bull., 96, 817–827, 1985.
Weirich, F.: The generation of turbidity currents by subaerial debrisflows, California, Geol. Soc. Am. Bull., 101, 278–291, 1989.
Wells, W., Wohlgemuth, P., Campbell, A., and Weirich, F.: Post-fire Sediment Movement by Debris Flows in the Santa YnezMountains, California, Corvallis Symposium, International As-sociation of Hydrologic Sciences Corvallis, 3–7 August 1987,Corvallis, Oregon, 275–276, 1987.
Wolfenden, E., Ebinger, C., Yirgu, G., Deino, A., and Ayele, D.:Evolution of the Northern Main Ethiopian Rift: birth of a triplejunction, Earth Planet. Sc. Lett., 224, 213–228, 2004.
Wylie, D. C.: Foundations on Rock, 1st edition, Chapman and Hall,London, UK, 331 pp., 1992.
Wyllie, D. C. and Norrish, N. I.: Rock strength properties andtheir measurement, in: Landslides: Investigation and Mitiga-tion, Transportation Research Board, Washington, D.C., 372–379, 1996.
Nat. Hazards Earth Syst. Sci., 14, 1553–1564, 2014 www.nat-hazards-earth-syst-sci.net/14/1553/2014/