
Mohan Madgulkar-Compensation Management/2006 Compensation Management Mohan Madgulkar.

AN ASSESSMENT OF COMPENSATION MANAGEMENT AND MOTIVATION ON
ORGANISATIONAL PERFORMANCE IN THE INSURANCE INDUSTRY IN
NIGERIA.
BY
ADEOYE, ABAYOMI OLAREWAJU
211556078
A dissertation/thesis submitted in partial fulfilment of the award of the degree
of
DOCTOR OF PHILOSOPHY
in
MANAGEMENT
School of Management, Information Technology and Governance
College of Law and Management
Supervisor: Professor Bonke Clayton Dumisa
Co-supervisor: Dr. Ziska Fields
Date: 2014

II
DECLARATION
I, Adeoye Abayomi Olarewaju declare that
i. The research reported in this dissertation/thesis, except where otherwise
indicated, is my original research.
ii. This dissertation/thesis has not been submitted for any degree or examination at any
other university.
iii. This dissertation/thesis does not contain other persons’ data, pictures, graphs or other
information, unless specifically acknowledged as being sourced from other persons.
iv. This dissertation/thesis does not contain other persons’ writing, unless specifically
acknowledged as being sourced from other researchers.
Where other written sources have been quoted, then:
a) their words have been re-written but the general information attributed to them
has been referenced;
b) where their exact words have been used, their writing has been placed inside
quotation marks, and referenced.
v. Where I have reproduced a publication of which I am author, co-author or editor, I
have indicated in detail which part of the publication was actually written by myself
alone and have fully referenced such publications.
vi. This dissertation/thesis does not contain text, graphics or tables copied and pasted
from the Internet, unless specifically acknowledged, and the source being detailed in
the dissertation/thesis and in the References sections.
Signature:

III
DEDICATION
This research work is mostly dedicated to God almighty the giver of wisdom, knowledge and
understanding.
Also dedicated to
My mother, Mrs. Dorcas Malomo Adenike Fanibuyan who endowed me with education
through the grace of God.
Finally to the memory of my jewel,
Mrs. Esther Olalonpe Adeoye, who encouraged me to proceed to South Africa, may your
dear soul rest in perfect peace.

IV
ACKNOWLEDGEMENTS
My unalloyed appreciation goes to the Lord God who is mighty in Glory and Strength for His
mercies, provisions, protection, steadfast love that ceaseth not and new every morning that
saw me through this programme.
I thank God for my amiable supervisors Professor Bonke Clayton Dumisa and Dr. Ziska
Fields, who took their time to peruse through and make constructive criticisms of the work
and guiding me throughout the course of writing this piece.
I equally appreciate a rear gem that give birth me and made all efforts through rain and
sunshine to give me education Mrs Dorcas Malomo Adenike Fanibuyan, may God bless you
and satisfy you with long life so that you reap the fruit of your labour.
I cannot but remember the encouragement I received from my late uncles: Professor
Olanrewaju Joseph Fapohunda and Associate Professor Meshach Alabi Fapohunda who
stimulate me toward academics.
My special appreciation also goes to Professor Banji Fajonyomi who always say “Olorun a
se” i.e. “God will do it”, thanks so much for your encouragement and admonition. My sincere
thanks and gratitude go to Professor Sunday Otokiti, Professor (Mrs) Iyabo Olojede,
Professor A.I. Oyedijo, Prof. and Prof (Mrs) Emmanuel Osakwe, Dr. O.J.K. Ogundele, Dr.
Samuel Kolawole Olowe, Dr. Adeyeye, Dr. Yunisa Dauda, Dr. Lekan Ayantunji and Dr.
(Mrs) Tinuke Fapohunda.
I also appreciate the encouragement and spirit lifting words of Drs. Olajide, Fatile,
Akewushola, Olateju, Abata, Kehinde, Durowoju, Yusuf, Onafalujo and others like Jongbo,
Alaka, Tijani, Saka, Kumolu-Johnson, Akingbade and most especially my only AY
Elegunde, may God bless you richly.
I cannot do but thank my well-wishers at Lagos State University, Ojo, Lagos, Nigeria who
stood by me through their prayers and word of encouragement, may God bless you all.

V
I also acknowledge the unquantifiable contributions of my siblings Pastor Adegboyega
Oluwasanya Adeoye, Pastor Olurotimi Adeoye, and Pastor Temitope Olorunfemi Adeoye,
thank you all for praying for me and encouraging me even when I was passing through dark
moment when I lost my precious wife Esther Olalonpe Adeoye of blessed memory. Thanks
also to my nephews, nieces, aunties and uncles for their immeasurable contributions.
I equally appreciate my fathers in the Lord, Pastors Tola Odutola, Bayo Akinjiyan, Olawale
Mohammed, Olumide Ajayi, Amos Oladimeji, Phillip Temiere, Debo Akande, CAF Obasa,
Adejimi and his wife for their prayers.
I also thank my friends in person of Bunmi Okunlola, Wole Oyenekan, Yomi Lanisa,
Solomon Adegbaju, Pastor Bode Oyadiran and others I cannot mention their names, may God
enrich you greatly. I also thank Barrister Kolawole Ibukun Olorunnisola, Atiku Olusegun
Akinyemi, for your encouragement while we were together at University of KwaZulu-Natal,
Durban, South Africa, may God crown your effort with success. I thank Drs Femi Soyeju,
Adekola Oke, Bode Olukoyeju, Olanrewaju Obayopo and host of others I cannot mention
their names here, may God reward you abundantly.
I thank the management of Lagos State University, Ojo, Lagos, Nigeria for given the ample
opportunity to pursue my Doctorate Degree in Management at University of KwaZulu-Natal,
Durban, South Africa.
I mostly appreciate my God gift wife Oluwafunmilade Ibukunoluwa Adeoye whom God used
to fill the vacuum in my life; I pray that God will make you to be a fruitful vine in every areas
of your life. I also want to appreciate Ariyo Sunday Ajibola and Andrew Young Oyieke for
their valuable assistance. Kudzanayi Mvududu is also appreciated together with Rotmi
Olobayo, Adebanjo Oladele (Santos), and Hakeem Awotungase, Sheriff Abiola,
Blessing,Giwa olayiwola olanrewaju mojeed and host of others.
Finally, I give thanks to Jehovah God for the successful completion of this work, to you God
be all the glory, adoration, magnification and exaltation.

VI
ABSTRACT Compensation management is used by human resource practitioners and is a human resource
functions that determines the decision of both job applicants, current employees’ and the
management of any firm. This study investigates the relationship between compensation
management, motivation and organisational performance in the insurance industry in Nigeria.
The basic objectives of the research were to: to examine the extent of compensation
management and its effect on the performance of insurance industry in Nigeria. Determine
whether the firm is achieving employees’ satisfaction; investigate the organisational
effectiveness in achieving its objectives and resource allocation. To ascertain the impact of
compensation management on employees’ motivation. Determine the impact of
compensation management on employees’ leadership roles; to examine the contribution of
compensation management to employees’ self-actualisation; and to determine the effects of
governmental policies on compensation management and workers motivation in insurance
industry in Nigeria.
The instruments used to collect data from study respondents were Compensation
Management Questionnaire Scale (CMQS); the Short Form of Minnesota Job Satisfaction
Questionnaire (MSQ); Motivation Questionnaire Scale (MQS); Job Performance Scale (JPS);
Multi-Factors Leadership Questionnaire-Form 5X (MLQ-Form 5X); the Reversed Brief
Index of Self-Actualisation (BISA-R); Organisational Effectiveness Assessment
Questionnaire (OEAQ) and Governmental Policy Questionnaire Scale (GPQS). The
reliability coefficients or Cronbach’s Alpha (α) of the research measures were 0.87; 0.74;
0.81; 0.83; 0.80; 0.81; 0.71 and 0.73 respectively.
250 questionnaires were distributed to employees of Alliance and General Insurance Plc., 213
returned and out of which 212 (84.8%) were found useful and normal. The data analysis was
done using Statistical Package for Social Sciences (SPSS) version 21. It was established that
a relationship exists between organisational performance and employees’ satisfaction; there is
a relationship between organisational effectiveness and objectives achievement. There is a
relationship between compensation management and employees’ performance; employees’
motivation, employees’ leadership roles; employees’ self-actualisation though all these
VII
relationship that was established were not strong. There is a very weak relationship that
existed between government policies on compensation management and employees’
motivation in insurance industry in Nigeria.
The findings of the study reflected that compensation management and motivation of
employees are factors that employers can use to boost the performance of employee’s as well
as that of organisations in the insurance industry in Nigeria. It is recommended that
compensation management and employee’s motivation should by given attention by the
management of insurance industry in Nigeria.

VIII
TABLE OF CONTENT
DECLARATION ...................................................................................................................... II
DEDICATION ......................................................................................................................... III
ACKNOWLEDGEMENTS ..................................................................................................... IV
ABSTRACT ............................................................................................................................. VI
TABLE OF CONTENT ........................................................................................................ VIII
LIST OF TABLE ............................................................................................................... XVIII
LIST OF FIGURE ................................................................................................................. XX
CHAPTER 1 .............................................................................................................................. 1
NATURE AND SCOPE OF STUDY ..................................................................................... 1 1.1 INTRODUCTION ............................................................................................................ 1 1.2 COMPENSATION MANAGEMENT AND ITS LINK TO ORGANISATIONAL
PERFORMANCE .................................................................................................................. 2 1.2.1 Need for organisational performance ........................................................................ 2 1.2.2 Role of compensation and motivation in organisational performance ...................... 3 1.2.3 Objectives of compensation management ................................................................. 3 1.2.4 Types of compensation .............................................................................................. 4
1.2.4.1 Financial Compensation...................................................................................... 4 1.2.4.2 Non-Financial Compensation ............................................................................. 4 1.2.4.3 Compensation and the individual........................................................................ 5
1.2.5 Types of motivation ................................................................................................... 5 1.2.5.1 Financial motivation ........................................................................................... 6 1.2.5.2 Non-Financial motivation ................................................................................... 6 1.2.5.3 Intrinsic motivation ............................................................................................. 6 1.2.5.4 Extrinsic motivation ............................................................................................ 6
1.2.6 Enhancing motivation through compensation ........................................................... 7 1.3 INSURANCE INDUSTRY IN NIGERIA ........................................................................ 7 1.4 PROBLEM STATEMENT AND RATIONALE OF THE STUDY ................................. 8
1.4.1 Limitations of existing research ................................................................................ 9

IX
1.4.2 Significance of the study ......................................................................................... 10 1.4.3 Research objectives ................................................................................................. 10 1.4.4 Research questions .................................................................................................. 11
1.5 ORIGINAL CONTRIBUTION ...................................................................................... 12 1.6 ORGANISATION OF THE STUDY ............................................................................. 12 1.7 CONCLUSION .............................................................................................................. 13
CHAPTER 2 ............................................................................................................................ 15
THE INSURANCE INDUSTRY IN NIGERIA ................................................................... 15 2.1 INTRODUCTION .......................................................................................................... 15 2.2 OVERVIEW OF NIGERIA ................................................................................................... 15 2.3 HISTORY AND DEVELOPMENT OF INSURANCE INDUSTRY IN NIGERIA .............................. 17
2.3.1 Nigerian Insurance Commission (NAICOM).......................................................... 18 2.3.2 Nigeria Insurers Association (NIA) ......................................................................... 19 2.3.3 Nigerian Council of Registered Insurance Brokers (NCRIB) ................................. 20
2.4 CURRENT PERFORMANCE OF INSURANCE INDUSTRY IN COMPARISON
WITH OTHER INDUSTRY ................................................................................................ 21 2.5 CURRENT AND HISTORICAL CHALLENGES OF INSURANCE INDUSTRY IN NIGERIA ............. 24
2.5.1 Unfriendly macroeconomic environment ................................................................ 25 2.5.2 Market suspicious of insurance companies/Bad image ........................................... 26 2.5.3 Poor regulatory framework ...................................................................................... 26 2.5.4 Lack of skill ............................................................................................................. 27
2.6 HISTORICAL BACKGROUND OF ALLIANCE AND GENERAL INSURANCE PLC. .................... 27 2.7 CONCLUSION ................................................................................................................... 27
CHAPTER 3 ............................................................................................................................ 29
COMPENSATION MANAGEMENT AND ORGANISATIONAL PERFORMANCE .... 29 3.1 INTRODUCTION .......................................................................................................... 29 3.2 DEFINITION OF COMPENSATION ........................................................................... 29 3.3 COMPENSATION PERSPECTIVES ........................................................................... 30
3.3.1 Society Perspective .................................................................................................. 30 3.3.2 Stockholder’s Perspective........................................................................................ 31 3.3.3 Manager’s Perspective ............................................................................................. 31 3.3.4 Employees Perspective ............................................................................................ 31
3.4 COMPENSATION MANAGEMENT ........................................................................... 32 3.5 TYPES OF COMPENSATION ..................................................................................... 37
3.5.1 Cash Compensation: Base ....................................................................................... 40 3.5.2 Cash Compensation: Merit Pay/Cost-of-Living Adjustments ................................. 41 3.5.3 Cash Compensation: Short Term Incentives ........................................................... 41 3.5.4 Cash Compensation: Long Term Incentives ........................................................... 42 3.5.5 Benefits: Income Protection .................................................................................... 42 3.5.6 Benefits: Work/Life Values ..................................................................................... 43 3.5.7 Benefits: Allowances ............................................................................................... 43

X
3.5.8 Relational Returns ................................................................................................... 43 3.5.9 Total Package .......................................................................................................... 43
3.6 CHARACTERISTICS OF COMPENSATION .............................................................. 44 3.7 COMPENSATION STRATEGY ................................................................................... 45
3.7.1 Compensation Committee ....................................................................................... 47 3.7.2 Compensation Strategy as Components of HRP ..................................................... 48
3.8 TOTAL COMPENSATION STRATEGY DEVELOPMENT ...................................... 48 3.8.1 Step 1: Assess Total Compensation Implications.................................................... 49 3.8.2 Step 2: Map a Total Compensation Strategy ........................................................... 50 3.8.3 Step 3: Implement .................................................................................................... 50 3.8.4 Step 4: Reassess ....................................................................................................... 50
3.9 DETERMINANTS OF COMPENSATION .................................................................. 51 3.9.1 Knowledge and skill ................................................................................................ 51 3.9.2 Kind of business ...................................................................................................... 52 3.9.3 Union-Non-union status .......................................................................................... 52 3.9.4 Capital intensive versus Labour intensive ............................................................... 52 3.9.5 Size of business ....................................................................................................... 52 3.9.6 Management philosophy.......................................................................................... 53 3.9.7 Total compensation package ................................................................................... 53 3.9.8 Geographic location ................................................................................................. 53 3.9.9 Supply and demand of labour .................................................................................. 53 3.9.10 Profitability of the organisation ............................................................................. 53 3.9.11 Employment stability ............................................................................................. 54 3.9.12 Gender and demographic differences .................................................................... 54 3.9.13 Employee tenure and performance ........................................................................ 54 3.9.14 Environmental determinants .................................................................................. 54 3.9.15 Firm determinants .................................................................................................. 55 3.9.16 Job and group determinants ................................................................................... 55 3.9.17 Gender and race determinants ............................................................................... 56 3.9.18 Individual determinants ......................................................................................... 56 3.9.19 Individual outcomes .............................................................................................. 56 3.9.20 Compensation psychology ..................................................................................... 57 3.9.21 Organisational justice ............................................................................................ 57 3.9.22 Firm outcomes of compensation ............................................................................ 57 3.9.23 Benefits .................................................................................................................. 58 3.9.24 International compensation .................................................................................... 58 3.9.25 Executive compensation ........................................................................................ 58
3.10 MERITS AND DEMERITS OF COMPENSATION .................................................. 59 3.10.1 Merits ..................................................................................................................... 59 3.10.2 Demerits................................................................................................................. 59
3.11 COMPENSATION THEORIES .................................................................................. 61 3.11.1 Agency theory........................................................................................................ 61 3.11.2 The Equity Theory ................................................................................................. 63

XI
3.11.3 Bargaining Theory ................................................................................................. 65 3.11.4 Behavioural Wage Theory ..................................................................................... 66 3.11.5 Expectancy Theory of Wage ................................................................................. 67
3.12 HISTORICAL ANTECEDENT OF COMPENSATION MANAGEMENT IN NIGERIA ............................................................................................................................. 68 3.13 LEGAL FRAMEWORK ON COMPENSATION MANAGEMENT IN NIGERIA (EMPLOYEE’S COMPENSATION ACT 2010) ................................................................ 72
3.13.1 Compensation for Death, Injury or Disease .......................................................... 73 3.13.2 Compensation for Occupational Disease ............................................................... 74 3.13.3 Compensation for Hearing Impairment ................................................................. 74 3.13.4 Scale of Compensation .......................................................................................... 75
3.13.4.1 Compensation in fatal cases ............................................................................ 75 3.13.4.2 Period for making payments ........................................................................... 76 3.13.4.3 Proof of existence of dependants .................................................................... 76 3.13.4.4 Permanent total disability ............................................................................... 76 3.13.4.5 Permanent partial disability or disfigurement ................................................. 76
3.14 THE ROLE OF LEADERSHIP AND MANAGEMENT IN COMPENSATION MANAGEMENT ................................................................................................................. 76 3.15 RELATIONSHIP BETWEEN COMPENSATION AND PERFORMANCE............. 77 3.16 DEFINITION OF ORGANISATIONAL PERFORMANCE ...................................... 78 3.17 ORGANISATION ........................................................................................................ 78
3.17.1 Types of organisation ............................................................................................ 79 3.17.1.1 Formal organisation ........................................................................................ 79 3.17.1.2 Informal organisation ...................................................................................... 80 3.17.1.3 Functions of informal organisation ................................................................. 80
3.17.2 Private and Public Sector Organisation ................................................................. 80 3.17.2.1 Private enterprise organisations ...................................................................... 81 3.17.2.2 Public sector organisations ............................................................................. 81
3.18 PERFORMANCE AND PERFORMANCE MANAGEMENT ................................... 81 3.19.1 Measurement of Organisational Performance ....................................................... 83 3.19.2 Financial indicators for organisational performance measurement ....................... 84 3.19.3 Non-financial indicators for organisational performance measurement called balanced scorecard ............................................................................................................ 87
3.19.3.1 Customer perspective ...................................................................................... 87 3.19.3.2 Financial perspective ...................................................................................... 88 3.19.3.3 Internal perspective ......................................................................................... 88 3.19.3.4 Learning and growth perspective .................................................................... 88
3.19.4 Reasons for organisational performance measurement ......................................... 89 3.19.5 Fundamentals of performance measurement ......................................................... 90
3.20 SUMMARY ................................................................................................................. 91 3.21 CONCLUSION ............................................................................................................ 91
CHAPTER 4 ............................................................................................................................ 92

XII
MOTIVATION AND ORGANISATIONAL PERFORMANCE ........................................ 92 4.1 INTRODUCTION .......................................................................................................... 92 4.2 UNDERSTANDING MOTIVATION ........................................................................... 92 4.3 MOTIVATIONAL THEORIES ................................................................................... 101
4.2.1 Maslow’s Hierarchy of Needs ............................................................................... 102 4.3.2 Vroom’s Expectancy Theory or VIE Theory ........................................................ 105 4.3.3 Porter and Lawler’s Extension .............................................................................. 107
4.3.3.1 Value of reward............................................................................................... 108 4.3.3.2 Perceived effort-reward probability ................................................................ 108 4.3.3.3 Effort ............................................................................................................... 108 4.3.3.4 Abilities and traits ........................................................................................... 109 4.3.3.5 Role perceptions.............................................................................................. 109 4.3.3.6 Performance .................................................................................................... 109 4.3.3.7 Rewards........................................................................................................... 109 4.3.3.8 Perceived equitable rewards ........................................................................... 109 4.3.3.9 Satisfaction ...................................................................................................... 110
4.3.4 Herzberg’s Two Factor Theory ............................................................................. 110 4.3.4.1 Motivators ....................................................................................................... 111 4.3.4.2 Hygiene ........................................................................................................... 111
4.3.5 Douglas McGregor Theory X and Theory Y ......................................................... 111 4.3.6 Quchi’s Theory Z................................................................................................... 113 4.3.7 The Reinforcement Theory .................................................................................... 114
4.4 TYPES OF MOTIVATION .......................................................................................... 115 4.4.1 Intrinsic Motivation ............................................................................................... 115 4.4.2 Extrinsic Motivation .............................................................................................. 117 4.4.3 Enhancing Intrinsic Motivation in Organisation ................................................... 118 4.4.4 What Motivates or Energies Employees ............................................................... 119 4.4.5 Employees’ Perceptions and Motivation ............................................................... 121
4.5 CHARACTERISTICS OF MOTIVATION ................................................................. 122 4.6 MERITS AND DEMERITS OF MOTIVATION ......................................................... 123
4.6.1 Merits of Motivation .............................................................................................. 123 4.6.2 Demerits of Demotivation ..................................................................................... 124
4.7 JOB SATISFACTION .................................................................................................. 124 4.7.1 Factors that influence job satisfaction ................................................................... 126
4.7.1.1 Factors related to the job ................................................................................. 126 4.7.1.1.1 Pay ............................................................................................................ 126 4.7.1.1.2 Work itself ................................................................................................ 126 4.7.1.1.3 Supervision ............................................................................................... 126 4.7.1.1.4 Promotion ................................................................................................. 126 4.7.1.1.5 Peers ......................................................................................................... 127 4.7.1.1.6 Working condition.................................................................................... 127
4.7.1.2 Factors related to the individual ...................................................................... 127 4.7.1.2.1 Loyalty of individuals .............................................................................. 127

XIII
4.7.1.2.2 Experience ................................................................................................ 127 4.7.1.2.3 Age ........................................................................................................... 128 4.7.1.2.4 Education .................................................................................................. 128 4.7.1.2.5 Age and Gender ........................................................................................ 128 4.7.1.2.6 Religion and Race .................................................................................... 129 4.7.1.2.7 Leadership ................................................................................................ 129 4.7.1.2.8 Organisational Change and Technology Innovation ................................ 129 4.7.1.2.9 Continuing Professional Development..................................................... 129 4.7.1.2.10 Recruitment, Rotation and Retention ..................................................... 130 4.7.1.2.11 Working Environment, Communication and commitment .................... 130 4.7.1.2.12 Salary ...................................................................................................... 131 4.7.1.2.13 Stress ...................................................................................................... 131 4.7.1.2.14 Work Itself.............................................................................................. 132 4.7.1.2.15 Supervision ............................................................................................. 132 4.7.1.2.16 Compensation ......................................................................................... 132
4.7.2 Consequences of job dissatisfaction ...................................................................... 133 4.7.2.1 Absenteeism .................................................................................................... 134 4.7.2.2 Turnover .......................................................................................................... 134 4.7.2.3 Low productivity ............................................................................................. 134 4.7.2.4 Early retirement .............................................................................................. 134 4.7.2.5 Low organisational commitment .................................................................... 134 4.7.2.6 Mental and physical health ............................................................................. 134 4.6.2.7 Life satisfaction ............................................................................................... 135
4.8 LEADERSHIP .............................................................................................................. 136 4.9 LEADERSHIP AND ORGANISATIONAL PERFORMANCE ................................. 137 4.10 TYPES OF LEADERSHIP STYLES ......................................................................... 139
4.10.1 Autocratic Leader ................................................................................................ 140 4.10.2 Democratic Leader .............................................................................................. 140 4.10.3 Laissez-Faire Leader............................................................................................ 140 4.10.4 Transactional Leader ........................................................................................... 141 4.10.5 Transformational Leader ..................................................................................... 141
4.11 SELF-ACTUALISATION ......................................................................................... 142 4.12 RELATIONSHIP BETWEEN MOTIVATION AND PERFORMANCE ................. 145 4.13 THE ROLE OF LEADERSHIP AND MANAGEMENT IN MOTIVATION ........... 146 4.14 RELATIONSHIP BETWEEN COMPENSATION MANAGEMENT, MOTIVATION
AND ORGANISATIONAL PERFORMANCE ................................................................ 147 4.15 CONCEPTUAL FRAMEWORK ............................................................................... 148 4.16 CONCLUSION .......................................................................................................... 149
CHAPTER 5 .......................................................................................................................... 151
RESEARCH METHODOLOGY ....................................................................................... 151 5.1 INTRODUCTION ........................................................................................................ 151 5.2 THE RESEARCH PROCESS ...................................................................................... 151

XIV
5.3 RESTATEMENT OF RESEARCH OBJECTIVES AND QUESTIONS ..................... 152 5.4 RESEACH PHILOSOPHY .......................................................................................... 153
5.4.1 Positivism .............................................................................................................. 154 5.4.2 Constructivism ....................................................................................................... 154 5.4.3 Interpretivism......................................................................................................... 154 5.4.4 Hermeneutics ......................................................................................................... 155 5.4.5 Functionalism ........................................................................................................ 155 5.4.6 Research philosophy adopted for this study .......................................................... 156
5.5 RESEARCH METHODOLOGIES .............................................................................. 156 5.5.1 Qualitative research ............................................................................................... 157 5.5.2 Quantitative research ............................................................................................. 157 5.5.3 Mixed method research ......................................................................................... 158 5.5.4 Experimental method research .............................................................................. 159 5.5.5 Research methodology adopted for this study ....................................................... 159
5.6 RESEARCH CHOICES ............................................................................................... 160 5.6.1 Observation method ............................................................................................... 160 5.6.2 Interpretive method ................................................................................................ 160 5.6.3 Experimental research and survey ......................................................................... 161 5.6.4 Qualitative methods ............................................................................................... 161 5.6.5 Quantitative methods ............................................................................................. 161 5.6.6 Content analysis ..................................................................................................... 161 5.6.7 Data collection techniques and analysis procedures adopted for the study ........... 162
5.7 POPULATION OF THE STUDY ................................................................................ 162 5.7.1 Sampling frame and sample technique .................................................................. 163 5.7.2 Importance of sampling ......................................................................................... 165 5.7.3 Types of sampling ................................................................................................. 165
5.7.3.1 Probability sampling method .......................................................................... 166 5.7.3.1.1 Random sampling ..................................................................................... 166 5.7.3.1.2 Systematic sampling ................................................................................. 166 5.7.3.1.3 Stratified sampling ................................................................................... 167 5.7.3.1.4 Area sampling .......................................................................................... 167
5.7.3.2 Non-probability sampling methods................................................................. 167 5.7.3.2.1 Accidental or Convenience sampling:...................................................... 167 5.7.3.2.2 Quota sampling ........................................................................................ 167 5.7.3.2.3 Judgment sampling ................................................................................... 167
5.7.3.3 Random sampling as a strategy adopted for the study .................................... 168 5.8 RESEARCH INSTRUMENTS .................................................................................... 169 5.9 STRENGTHS AND WEAKNESSES OF QUESTIONNAIRE ................................... 178 5.10 ADMINISTRATION OF RESEARCH INSTRUMENT ........................................... 180 5.11 PROCEDURES FOR PROCESSING DATA COLLECTED .................................... 180
5.11.1 Quantitative survey data analysis ........................................................................ 183 5.11.1.1 ANOVA ........................................................................................................ 184 5.11.1.2 Chi-Square (χ2) analysis ................................................................................ 184

XV
5.11.1.3 Regression analysis ....................................................................................... 185 5.11.1.4 Pearson product moment correlation coefficient .......................................... 186
5.11.2 Test of validity and reliability ............................................................................. 186 5.11.2.1 Validity ......................................................................................................... 187 5.11.2.2 Reliability ...................................................................................................... 187 5.11.2.3 Psychometric properties of the questionnaire ............................................... 188
5.12 INSTRUMENT MEASUREMENT ........................................................................... 188 5.12.1 The Short Form of Minnesota Job Satisfaction Questionnaire (MSQ) ............... 189 5.12.2 Motivation Questionnaire Scale (MQS) .............................................................. 190 5.12.3 Job Performance Scale (JPS) ............................................................................... 190 5.12.4 Multi-Factors Leadership Questionnaire-Form 5X (MLQ-Form 5X) ................. 191 5.12.5 The Reversed Brief Index of Self-Actualisation (BISA-R) ................................. 192
5.13 LIMITATIONS OF THE STUDY .............................................................................. 193 5.14 ETHICAL REQUIREMENTS ............................................................................................. 194 5.15 CONCLUSION .......................................................................................................... 195
CHAPTER 6 .......................................................................................................................... 196
PRESENTATION AND INTERPRETATION OF RESULTS .......................................... 196 6.1 INTRODUCTION ........................................................................................................ 196 6.2 PRESENTATION AND ANALYSIS OF DATA ........................................................ 196 6.3 DEMOGRAPHIC DATA ANALYSIS ........................................................................ 197
6.3.1 Gender ................................................................................................................... 197 6.3.2 Marital Status ......................................................................................................... 198 6.3.3 Age......................................................................................................................... 200 6.3.4. Respondents department ....................................................................................... 201 6.3.5 Respondents qualifications .................................................................................... 203 6.3.6 Working experience ............................................................................................... 204 6.3.7 Salary earned per month ........................................................................................ 206
6.4 MEASURES ................................................................................................................. 208 6.4.1 Compensation management ................................................................................... 208 6.4.2 Job performance .................................................................................................... 209 6.4.3 Job satisfaction ...................................................................................................... 209 6.4.4 Organisational effectiveness .................................................................................. 210 6.4.5 Motivation ............................................................................................................. 210 6.4.6 Leadership role ...................................................................................................... 210 6.4.7 Self-actualisation ................................................................................................... 211 6.4.8 Governmental policy ............................................................................................. 211
6.5 PRESENTATION AND ANALYSIS OF RESEARCH QUESTIONS ........................ 211 6.5.1 Research Question 1 .............................................................................................. 211 6.5.2 Research Question 2 .............................................................................................. 215 6.5.3 Research Question 3 .............................................................................................. 219 6.5.4 Research Question 4 .............................................................................................. 222 6.5.5 Research Question 5 .............................................................................................. 226

XVI
6.5.6 Research Question 6 .............................................................................................. 230 6.5.7 Research Question 7 .............................................................................................. 234
6.6 RELIABILITY TESTING ............................................................................................ 238 6.7 DISCUSSION OF FINDINGS ..................................................................................... 241
6.7.1 Research Objective and Question 1 ....................................................................... 241 6.7.2 Research objective and question 2 ......................................................................... 242 6.7.3 Research objective and question 3 ......................................................................... 244 6.7.4 Research objective and question 4 ......................................................................... 246 6.7.5 Research objective and question 5 ......................................................................... 248 6.7.6 Research objective and question 6 ......................................................................... 250 6.7.7 Research objective and question 7 ......................................................................... 251
6.8 CONCLUSION ............................................................................................................ 253
CHAPTER 7 .......................................................................................................................... 255
SUMMARY OF THE FINDINGS, CONCLUSIONS, RECOMMENDATIONS AND
SUGGESTIONS FOR FURTHER STUDY. ...................................................................... 255 7.1 INTRODUCTION ........................................................................................................ 255 7.2 SUMMARY OF FINDINGS ........................................................................................ 256
7.2.1 Employees/organisational pefromance .................................................................. 256 7.2.2 Job satisfaction ...................................................................................................... 257 7.2.3 Organisational effectiveness .................................................................................. 258 7.2.4 Motivation ............................................................................................................. 259 7.2.5 Leadership roles ..................................................................................................... 260 7.2.6 Self-actualisation ................................................................................................... 262 7.2.7 Government policy ................................................................................................ 262
7.3 CONCLUSION ............................................................................................................ 263 7.4 RECOMMENDATIONS ............................................................................................. 270 7.5 SUMMARY OF PEARSON PRODUCT MOMENT CORRELATION COEFFICIENT
(PPMCC) ............................................................................................................................ 275 7.6 GENERAL OBSERVATIONS AND RECOMMENDATIONS ................................. 277 7.7 AREAS OF FUTURE RESEARCH ............................................................................. 278 7.8 SUMMARY OF EACH CHAPTER ............................................................................. 279
7.8.1 Chapter 1: Nature and scope of study .................................................................... 279 7.8.2 Chapter 2: The insurance industry in Nigeria ........................................................ 279 7.8.3 Chapter 3: Compensation management and organisational performance ............. 279 7.8.4 Chapter 4: Motivation and organisation performance ........................................... 279 7.8.5 Chapter 5: Research methodology ......................................................................... 280 7.8.6 Chapter 6: Presenstation and interpretation of results ........................................... 280 7.8.7 Chapter 7: Summary of findings, conclusions, recommendations and suggestions for further study. ............................................................................................................. 281
7.9 SCHOLARLY CONTRIBUTION OF THIS STUDY.................................................. 281 7.10 OVERALL CONCLUSION ....................................................................................... 282

XVII
BIBLIOGRAPHY .................................................................................................................. 284
APPENDICES ....................................................................................................................... 351
APPENDIX A ........................................................................................................................ 352
APPENDIX B ........................................................................................................................ 353
APPENDIX C ........................................................................................................................ 360
APPENDIX D ........................................................................................................................ 387

XVIII
LIST OF TABLE
TABLE 2.1: CONTRIBUTION OF INSURANCE AND OTHER SECTORS TO NIGERIAN GDP FOR 2012
IN ‘NMILLION’ ................................................................................................................... 22
TABLE 2.2: CONTRIBUTION OF INSURANCE AND OTHER SECTORS TO NIGERIAN GDP FOR 2013
IN ‘NMILLION’ ................................................................................................................... 23
TABLE 4.1: THEORY X AND THEORY Y ................................................................................... 112
TABLE 5.1: A&G INSURANCE PLC. BRANCHES AND THE EMPLOYEE’S NUMBER THERE .......... 163
TABLE 5.2: DEPARTMENTS AND SAMPLE SIZE ........................................................................ 164
TABLE 5.3: LINKING THE RESEARCH OBJECTIVES, RESEARCH QUESTIONS AND QUESTIONNAIRE TOGETHER………………………………………………………… 16491
TABLE 5.4: SUMMARY OF STRENGTH AND WEAKNESSES OF QUESTIONNAIRE……………………………………………………………………….. 200
TABLE 6.1: DISTRIBUTION OF RESPONDENTS BY GENDER ...................................................... 197
TABLE 6.2: DISTRIBUTION OF RESPONDENTS BY MARITAL STATUS ....................................... 199
TABLE 6.3: DISTRIBUTION OF RESPONDENTS BY AGE ............................................................. 200
TABLE 6.4: DISTRIBUTION OF RESPONDENTS BY DEPARTMENTS ............................................ 202
TABLE 6.5: DISTRIBUTION OF RESPONDENTS ACCORDING TO QUALIFICATIONS ..................... 203
TABLE 6.6: DISTRIBUTION OF RESPONDENTS ACCORDING TO WORKING EXPERIENCE ........... 205
TABLE 6.7: DISTRIBUTION OF RESPONDENTS ACCORDING TO SALARY EARNED PER MONTH 207
TABLE 6.8: FREQUENCY, MEAN AND STANDARD DEVIATON SCORES OF THE RESPONDENTS ON
COMPENSATION MANAGEMENT AND PERFORMANCE OF THE EMPLOYEES ......................... 212
TABLE 6.9: FREQUENCY, MEAN AND STANDARD DEVIATION SCORES OF RESPONDENTS ON JOB
SATISFACTION .................................................................................................................. 216
TABLE 6.10: FREQUENCY, MEAN AND STANDARD DEVIATION SCORES OF THE RESPONDENTS ON
ORGANIZATION EFFECTIVENESS IN THE USE OF ITS RESOURCES ....................................... 219
TABLE 6.11: FREQUENCY, MEAN AND STANDARD DEVIATION SCORES OF THE RESPONDENTS ON
COMPENSATION MANAGEMENT AND EMPLOYEES MOTIVATION ........................................ 222
TABLE 6.12: FREQUENCY, MEAN AND STANDARD DEVIATION SCORES OF THE RESPONDENTS ON
COMPENSATION MANAGEMENT AND LEADERSHIP ROLE OF THE EMPLOYEES .................... 227
TABLE 6.13: FREQUENCY, MEAN AND STANDARD DEVIATION SCORES OF THE RESPONDENTS ON
COMPENSATION MANAGEMENT AND SELF-ACTUALISATION OF THE EMPLOYEES .............. 230

XIX
TABLE 6.14: FREQUENCY, MEAN AND STANDARD DEVIATION SCORES OF THE RESPONDENTS ON
GOVERNMENT POLICIES AS IT AFFECTS COMPENSATION ADMINISTRATION AND EMPLOYEES’
MOTIVATION. ................................................................................................................... 235
TABLE 6.15: DESCRIPTIVE STATISTICS AND CORRELATION COEFFICIENT AMONG VARIABLES
........................................................................................................................................ 239
TABLE 6.16 CRONBACH’S ALPHA (Α) COEFFICIENT FOR VARIABLES ....................................... 240
TABLE 6.17: PEARSON CORRELATION BETWEEN COMPENSATION MANAGEMENT AND
PERFORMANCE OF A&G INSURANCE PLC EMPLOYEES ..................................................... 242
TABLE 6.18: PEARSON CORRELATION BETWEEN COMPENSATION MANAGEMENT AND
EMPLOYEES’ SATISFACTION ............................................................................................. 244
TABLE 6.19: PEARSON CORRELATION BETWEEN ORGANISATIONAL EFFECTIVENESS AND
ACHIEVEMENT OF ITS OBJECTIVES.................................................................................... 246
TABLE 6.20: PEARSON CORRELATION BETWEEN COMPENSATION MANAGEMENT AND
EMPLOYEES’ MOTIVATION ............................................................................................... 248
TABLE 6.21: PEARSON CORRELATION BETWEEN COMPENSATION MANAGEMENT AND
LEADERSHIP ROLE OF EMPLOYEES.................................................................................... 249
TABLE 6.22: PEARSON CORRELATION BETWEEN COMPENSATION MANAGEMENT AND SELF-
ACTUALISATION OF EMPLOYEES ...................................................................................... 251
TABLE 6.23: PEARSON CORRELATION BETWEEN GOVERNMENT POLICIES ON COMPENSATION
AND WORKERS’ MOTIVATION ........................................................................................... 253

XX
LIST OF FIGURE
FIGURE 2.1: SHOWING NIGERIA WITHIN AFRICA MAP .............................................................. 16
FIGURE 2.2 NIGERIA MAP SHOWING SOME MAJOR CITIES ......................................................... 16
FIGURE 2.3: SECTORAL PERFORMANCES OF INSURANCE AND THREE MAJOR INDUSTRIES IN 2012.
.......................................................................................................................................... 23
FIGURE 2.4: SECTORAL PERFORMANCES OF INSURANCE AND THREE MAJOR INDUSTRIES IN 2013
.......................................................................................................................................... 24
FIGURE 3.1: TOTAL RETURNS FOR WORK ................................................................................. 40
FIGURE 3.2: COMPONENTS OF TOTAL PACKAGE ................. ERROR! BOOKMARK NOT DEFINED.
FIGURE 3.3: COMPENSATION STRATEGY MODEL……………………………….…..65
FIGURE 3.4: KEY STEPS IN DEVELOPING A TOTAL COMPENSATION STRATEGY ........................ 51
FIGURE 3.5: THE BALANCED SCORECARD FOR TRANSLATING A STRATEGY INTO OPERATIONAL
PROCESSES ........................................................................................................................ 89
FIGURE 4.1: MODEL OF THE DETERMINANTS OF PAY SATISFACTION ........................................ 96
FIGURE 4.2: MASLOW’S ORIGINAL HIERARCHY OF NEEDS ..................................................... 103
FIGURE 4.3: PORTER AND LAWLER’S EXPECTANCY MODEL ................................................... 108
FIGURE 4.4: CONCEPTUAL FRAMEWORK ................................................................................. 149
FIGURE 5.1: THE RESEARCH PROCESS .................................................................................... 151
FIGURE 5.2: THE METHODOLOGICAL PYRAMID 1 ..................................................................... 153
FIGURE 6.1: BAR CHART REPRESENTATION OF GENDER DISTRIBUTION OF RESPONDENTS ..... 198
FIGURE 6.2: PIE CHART REPRESENTATION OF MARITAL STATUS OF RESPONDENTS ............... 200
FIGURE 6.3: BAR CHART REPRESENTATION OF AGE OF RESPONDENTS ................................... 201
FIGURE 6.4: CONE BAR CHAT REPRESENTATION OF RESPONDENTS BY DEPARTMENTS .......... 203
FIGURE 6.5: BAR CHART DISTRIBUTION OF RESPONDENTS BY EDUCATIONAL QUALIFICATIONS
........................................................................................................................................ 204
FIGURE 6.6: BAR CHART DISTRIBUTION OF RESPONDENTS BY WORKING EXPERIENCE .......... 206
FIGURE 6.7: PIE CHART DISTRIBUTION OF RESPONDENTS ACCORDING TO SALARY EARNED PER
MONTH ............................................................................................................................ 208

1
CHAPTER 1
NATURE AND SCOPE OF STUDY
1.1 INTRODUCTION
In the global world of today, for any organisation to have competitive edge amidst her
competitors, there must be in place a formidable compensation strategy to attract, motivate
people to join the firm. This should also reduce the turnover intent from the employees. The
need for organizations to develop a programme that will facilitate a performance-enhancing
system leading to the best management and development of employees and thus increase
their competitive advantage has made the links between human resource management and
organizational performance a prominent issue in the field of human resource management
across the core functional areas of human resource practices. These practices range from
staffing, performance appraisals, training and development, manpower planning, workers
management participation and compensation management. Notably, the relationship between
compensation management and performance has been visible in the management literature. It
is generally believed that if there is proper management of compensation, individuals can be
motivated to perform and thus have a resultant positive effect on the organizational
performance (Tsai, 2005)
According to Hackett & McDermott (1999: 36) “One of the functional functions of human
resources management (HRM) is compensation management which deals with every type of
reward individuals are receiving in exchange for performing a basic organizational task.
Compensation is the major cost of doing business for many organizations at the start of the
21st century.”
Compensation management has always been a major mechanism affecting the decision of job
applicants and employees of organizations and it has encouraged organizations to execute
their strategies, which in turn secure competitive advantage against other major competing
organisations (Heneman et al, 2000, Ivancevich, 2004). Also, a huge amount of financial
resources are invested on designing, organizing and managing organizational compensational
system. Despite its prominent role to the success and development of the firm, scholars and
even practitioners have lamented that there is a slow pace in the advancement of
compensation research in the form of stagnancy and under representation (Heneman et al,
2004; Kersley & Forth, 2005). In recent times, the design, delivery and use of compensation

2
management have undergone major shifts that are dramatic in nature, and this has reflected
the motivational aspect in the employee performance that invariably lead to organizational
performance (Heneman et al, 2000; Purcell et al, 2003).
The issue of compensation management is an apparatus, which affects the decision of job
applicants and employees within the organisation. It has encouraged organisations to
implement firm’s style that enhances their aggressive gain over their main competitors in the
industry (Heneman et al., 2000; Hyondong, 2006). Furthermore, a lot of monetary resources
are invested in crafting, organising as well as administering organisational remuneration
arrangement.
This chapter will also focus on compensation management and its link to organisational
performance, insurance industry in Nigeria, problem statement and research framework. It
will also elaborate on the original contribution of study and the organisation of the study.
1.2 COMPENSATION MANAGEMENT AND ITS LINK TO ORGANISATIONAL
PERFORMANCE
Compensation management is deliberated upon to be one of the difficult processes that needs
accuracy and exactness and if not done conscientiously may lead to organisational concern. A
good and a superlative compensational policy will enhance employee’s productivity with
more determination. The link between compensation management and organisational
performance is to help the firm to set the standards that job related, reduce the labour
turnover as well as retaining the best hands that will enhance competitiveness of the firm
amongst her competitors (Groblar, Wärnich, Carrell, Ellbert and Hatfield, 2011; Khan, Aslam
and Lodhi, 2011; Mathis and Jackson, 2011).
1.2.1 Need for organisational performance
The need for organisational performance cannot be overlooked in the modern day business
world; hence one major reason for organisational performance is to target huge cost saving
opportunities (Münstermann, Eckhardt and Weitzel, 2010). Another reason for organisational
performance is to determine the level of organisation’s competitiveness between the firm’s
actual performance and the standard performance. This is really done by looking at the
standard performance in the industry (Zaheer, Rehman and Khan, 2010). Other purpose of
organisational performance is to hire, develop and retain employee’s that contributes to the
success of the firm (khan et al., 2011; Pratheepkanth, 2011).
3
1.2.2 Role of compensation and motivation in organisational performance
As regards the role of compensation in organisational performance, Khan et al., (2011)
reiterated through their study on 450 employees of Habib Bank Limited in Pakistan that
compensation management is engaged to encourage, retain and automatically aspire to
enhance the overall effectiveness and efficiency of an organisation. Similarly, Idemobi,
Onyeizugbe and Akpunonu (2011) viewed compensation management as a veritable tool for
improving and achieving organisational performance. The role of motivation in
organisational performance is to address the issue of employee’s commitment, dedication
through responsibilities, training and development, independent decision making. This is
done by allowing the employee to have measure of control of what he wants to do and how to
do it (Mathis and Jackson, 2011; Chaudhary, 2012; Inayatullah and Jehangir, 2012; Brevis
and Vrba, 2014).
1.2.3 Objectives of compensation management
The main objectives of the compensation function are to create a system of rewards that is
equitable and acceptable to both parties in employment relationship. The resultant outcome
of compensation is an employee who is attracted to the work and motivated to do a good job
for the employer. Ivancevich (2004: 298) and Nickels et al (1999: 331) highlight the
objectives of compensation as follows:
(1) Attract: Attracting the right kind of people in terms of qualification and experience as
required by the organization and in sufficient numbers.
(2) Equitable: Each person should be treated fairly as regards the amount paid in line
with his or her effort, abilities, skills and training acquired.
(3) Balanced: Pay, benefits and other rewards should provide a reasonable total reward
package.
(4) Security: Providing employees with some sense of financial security through
insurance and retirement scheme.
(5) Cost Effective: The pay should not be excessive, considering what the organization
can afford to pay.
4
(6) Incentive-Providing: The pay should provide incentives that will motivate
effectively, efficiently and productively at work.
(7) Retention: The pay should be able to keep valued employees from leaving and going
to competitors or starting competing firms.
(8) Competitive Position: The pay should maintain a competitive advantage in the market
place by keeping costs low through high productivity from a satisfied workforce.
1.2.4 Types of compensation
One of the crucial aspects in managing an organisation is the compensation management. It is
a process by which employees are being remunerated for their input at their workplace (Khan
et al., 2011). Compensation is of different types depending on their nature. Compensation has
been classified into the following types (i) financial, (ii) non-financial and (iii) compensation
and the individuals.
1.2.4.1 Financial Compensation
Financial compensation is also known as compensation that is concerned with monetary
terms which comprises financial rewards and financial incentives. According to Armstrong
(2003: 687),
“Financial rewards provide financial recognition to people for their achievements in
the shape of attaining or exceeding their performance targets or reaching certain levels of
competence or skill while financial incentives aims at motivating people in achieving their
objectives, improve their performance or enhance their competence or skills by focusing on
specific targets and priorities” (Armstrong, 2003: 687).
1.2.4.2 Non-Financial Compensation
This is a kind of compensation that does not involve money directly and this reward normally
croup-up from the work itself. These include achievement, autonomy, recognition, the scope
to use for work. Others include development of skills, training and career development
opportunities (Armstrong 2003: 626, Herzberg, 1966). This is made up of rewards that are
not costly to boost the employees morale (Danish and Usman, 2010; Resurreccion, 2012).

5
1.2.4.3 Compensation and the individual
Many researchers are of the view that any firm that desires higher performance from workers
should link remuneration and person effort together (Encinosa lll, Gaynor and Rebitzer, 2007;
Kaplan and Norton, 2007; Bartlett and Ghosal, 2013). Heneman (1992) argues that worthy
reward and personal effort bonuses are the most visible practices in person effort
acknowledgement. It is emphasised that programmes, which remunerate people’s effort,
cannot be compared with new administrative procedures based on uninterrupted progress,
joint effort and support (Demming, 1986, Snell & Dean, 1994, Lepak & Snell, 2002).
Firms are attaching greater recognition to individual pay and performance not only to
persuade their workers to increase productivity and efficiency but also to entice them with the
aim of retaining the highly valued workers so that there will be more commitment through a
more favourably attitude disposed towards the attainment of the goals of the firm (Kuvaas,
2006). Similarly, Lee and Bruvold (2003) opine that the more the employees are encouraged
by the firm, the more the workers will be ready to their commitment level to the firm. This is
also supported by (Gardner et al., 2004). Similarly, Lawler (2003) argues that when
remuneration is highly attached to the effort result, it highly promotes effectiveness of
managing performance of the firm as well as that of the workers. He suggests that matching
remunerations to the performance result give rooms for the effort management system to be
more result oriented with particular reference to motivation. It is submitted that workers put
more agility to achieve results when they are aware that their remuneration package will be
determined by the effort put in to accomplish the performance goal of the firm (Lawler,
2003).
1.2.5 Types of motivation
Motivations as a phenomenon in human resource management and contemporary
management have been widely research into (Kelly, 2009; Ahlstrom & Bruton, 2010; Seiler
et al, 2011). Motivation is that propeller that energises behaviour, gives attitudinal direction
and underlies the continuous persistence even when an individual employee faces one or
more challenges (Grobler et al., 2011; Mathis and Jackson, 2011; Brevis and Vrba, 2014).
Motivation is of various types’ namely (i) financial, (ii) non-financial, (iii) intrinsic and (iv)
extrinsic motivation.

6
1.2.5.1 Financial motivation
Financial motivation is said to be direct or indirect. Direct financial motivation comprises the
pay an employee receives in the form of wages, salaries, bonuses or commissions while
indirect financial motivation consists of all financial motivation or rewards that are not
included in direct financial motivation such as vacation, child care or elder care, and various
kinds of insurance (Invancevich, 2004: 298, Brevis & Vrba, 2014).
1.2.5.2 Non-Financial motivation
Non-financial motivation is a kind of motivation that does not involve monetary terms like
praise, responsibility, self-esteem and recognition which affects the motivation and
productivity of an employee (Ivancevich, 2004: 298). It is not enough to motivate workers
with money alone but could be combined with non-monetary incentives such as recognition
to enhance greater productivity (Willis-Shattuck, Bidwell, Thomas, Wyness, Blaauw and
Ditlopo, 2008; Mattson, Torbiöm & Hellgren, 2014). Similarly, Chandler, Chonya, Mtei,
Reyburn and Whitty (2009) opine that social status expectations, working environments and
relationships between different cadres at workplace as non-financial motivators goes a long
way to ginger workers toward higher performance.
1.2.5.3 Intrinsic motivation
This simply means doing an activity for the sake of doing that activity which denotes that the
activity is interesting, engaging and brings satisfaction. For instance, the acceptability of
internet-based learning medium by students is basically based on perceived enjoyment for
their intention to use the new learning medium (Lee, Cheung and Chen, 2005). This could
also be engaged in the Nigerian insurance industry to boost the performance of their
employees by sending them on computer training. In the same vein, intrinsic motivation
could be derived through knowledge sharing. Employees get fulfilled by enhancing their
knowledge self-efficacy or assurance in their effort by providing useful knowledge to the
firm to broaden the performance of the firm as well as their own performance (Lin, 2007;
Cruz, Pérez and Cantero, 2009).
1.2.5.4 Extrinsic motivation
Extrinsic motivation is a means to satisfy indirect needs or something given by someone else
as recognition for good work done, for example, pay increases, praise and promotion. These
are motivation that is anchored on the achievement of a desired goal or some other kind of

7
external remuneration such as money or awards (Walker, Greene and Mansell, 2006). Lin
(2007) was of the opinion that extrinsic motivation centers on the goal-driven reasons such as
recompenses or remunerations gotten when executing a duty. He submitted that the
combination of both intrinsic and extrinsic motivation affects individual intentions
concerning an activity as well as their real attitude. This view was supported by the study
done by Kim, Shim and Ahn (2011) that extrinsic motivation deals with behaviours that are
engaged in response to activities that is apart from its own sake, such as payments or
recognition or the dictates of other people. This is relevant to this study in the sense that
without team work, the expected performance may not be achieved.
1.2.6 Enhancing motivation through compensation
Compensation is a crucial instrument that firms can use for retention of talents and shape
employees passion about their responsibilities within the firm. Compensation is aimed at
backing up business goals, attracting, motivating and retaining hard working employees
(Shieh, 2008; Petera, 2011). Motivation can be enhanced through compensation by the
management using both the intrinsic and most often engaging extrinsic rewards by managers.
Such extrinsic rewards include monetary rewards, promotions, recognition, salary
adjustment, bonus, sales commission that is the most common in the insurance industry that
is the focus of this study.
1.3 INSURANCE INDUSTRY IN NIGERIA
The history of insurance industry in Nigeria dates back to 1920 which was started by Lloyd
Brothers of London. The insurance industry in Nigeria was reformed and reorganized as a
result of reformation that took place in the Nigeria Banking sector. Before the reformation,
there were 104 insurance companies in Nigeria many of which were undercapitalized.
The Nigerian Government gave all the insurance companies until 28 February, 2007 to raise
their capital base by factors of over 1000%. As a result of the recapitalization, there was a
spate of mergers and acquisitions that led to the emergence of 71 stronger insurance
companies.
Notably, Nigeria has the ability to have the biggest insurance market in Africa but the large
insurance business was underwritten by foreign companies. The domestic insurance industry
is making frantic effort not only to dominate the domestic market but also to make progress
towards expanding its horizon to other regions of the African continent.

8
The insurance industry in Nigeria is confronted with many challenges. One those challenges
are the coverage of individual and businesses alike, about 2.25million Nigerians are having
access to various insurance products and services but the patronage is very low. Another
challenge facing the industry is slow payment of premiums by state agencies. Through the
delay in the release of premiums, it means that the private policy writers would have to
struggle to meet up their payouts and also have fewer funds to reinvest into the Nigerian
economy thereby reducing the contribution to the Gross Domestic Product (GDP).
One chronic challenge facing the insurance industry in Nigeria is the issue of compensating
and motivating their workforce. The employees of insurance companies in Nigeria are not
well remunerated and basically, they are working on commission basis especially those that
are in the marketing unit. Since compensation and motivation induces performance, people
that are not well compensated become demotivated hence reduction in performance level of
the individual worker which will have an adverse effect on the organisational performance.
Other areas that are affected in compensation include allowances such as housing, health,
education, transport etc. while under motivation, leadership attitude is not positive, lack of
recognition, and poor working environment and so on has hindered the positive performance
of the insurance industry in Nigeria.
1.4 PROBLEM STATEMENT AND RATIONALE OF THE STUDY
This study emanates from the need to effectively manage the employees both at the
managerial cadre and the lower cadre of the management for an effective result through
compensation management. Compensation management has been one of the major policies
used in motivating employees in the private sector.
The Nigerian economic sector has suffered from political mistrust, inadequate policy and
non-implementation of governmental policies as regards management of compensation. In
1975, the Udoji Commission was set up to conduct a review of the salaries in the public
sector with a view to increasing effectiveness and efficiency in the public sector. The
commission recommended, among other things, thereby creating a Unified Grading and
Salary Structure (UGSS) that would embrace all positions in the Civil Service from the
lowest to the highest (Grade Levels 01 – 17) and provide equal opportunities for all the rank
and file in the sector to advance to the highest position in the service, irrespective of their
discipline, provided they possess the required experience and qualifications (Dibie, 2003:81–

9
82). The Commission identified various reasons for adequate compensation administration
and advanced various reasons for salary review. The various reasons advanced for salary
review during this period were predicated on three major factors namely; inflation, low
productivity and social influence. All these did not hold in the private sector which is the
base of insurance industry in Nigeria. Previous studies emphasized the symbolic role of
money, but had little to say about how compensation had to be administered to motivate
employees in the private sector as well as increase performance. Other related problems were
leadership and self-actualization (Maslow, 1970). More so, studies that have been done on
compensation management focused on the public sector in Nigeria like Idemobi, Onyeizugbe
and Akpunonu (2011) researched on compensation management as a tool for improving
organisational performance in the public sectors: a study of the civil service of Anambra State
of Nigeria. Also, Nweke’ (2009) study three years of visionary leadership in Anambra State
of Nigeria using the civil service as a case study which is a motivating factor for this study
that a gap is in existence to be filled by looking at compensation management from the
private sector angle with special interest in insurance industry in Nigeria.
The major problem confronting the insurance industry in Nigeria apart from capturing
individuals and businesses to subscribe to their product and services is the problem of
employee’s compensation and motivation. The study conducted by Ajemunigbohun, Tijani
and Oreshile (2013) on comparison of reward systems in selected insurance companies and
banks in Nigeria found that banking employees are well remunerated than their counterparts
in the insurance companies. The employees of insurance companies in Nigeria are poorly
motivated because of lack of encouragement from the managers, poor working environments,
and lack of training and development opportunities.
1.4.1 Limitations of existing research
Most of the existing research on compensation and motivation has been focused on public
sector, banking sector, construction sector, and educational sector and so on. For example,
Idemobi et al., (2011) researched on compensation management as a tool for improving
organisational performance in the public sectors in Nigeria. Jehanzeb, Rasheed, Rasheed and
Aamir (2012) conducted a research on the impact of rewards and motivation on job
satisfaction in banking sector of Saudi Arabia using 568 employees. Also, Khan et al., (2011)
conducted their own study on the banking sector of Pakistan. Adedokun, Ibironke and
Olanipekun (2013) research into motivation schemes in enhancing site worker’s productivity

10
in construction industry in Nigeria. Yamoah and Ocansey (2013) studied the motivational
factors of lecturers of private universities in Ghana. Ajemunigbohun et al., (2013) conducted
their study on comparison of reward systems in selected insurance companies and banks in
Nigeria. Hence, there is no focus on the insurance industry which is a motivating factor for
this study.
1.4.2 Significance of the study
The study has three major areas of significance namely; Academic, Managerial and Social.
(i) Academic Significance: It is envisaged that this study will contribute to and expand the
frontiers of knowledge in the field of study, especially studies that has been done on
compensation management, motivation, job satisfaction, self actualisation, leadership
with focus on private sector and special reference to A&G Insurance Plc. in Nigeria. It
will also launch a new area for future debate in the management of compensation and
motivation among Insurance Companies in Nigeria.
(ii) Managerial Significance: The study underscores the importance of compensation
management and motivation in achieving organizational performance in Alliance and
General Insurance Plc. The managers in the insurance industry should endeavour to
identify the areas of motivation of the employee’s they can improve upon that will
encourage the employees to work harder that will make the organisational goal
achievable.
(iii) Social Significance: It is envisaged that community will benefit by not witnessing
disruption in the economy by way of industrial action that can lead to the closure of the
business. When the employees are on strike because of inadequate compensation, the
whole community may be affected in the sense that there could be road blocks that
hinders traffic flow. Other workers may join them in sympathy strike which affects other
sectors of the economy.
1.4.3 Research objectives
The overall objective of this study was to provide insight into the dimension of and the
impact of compensation management and motivation on the performance of the Insurance
Industry in Nigeria with specific focus on the Alliance and General Insurance Plc. (A&G). It
also explored the concept of compensation management and motivation of employees, their

11
leadership role, and self-actualization and how to enhance organizational performance in the
private sector of Nigeria. Other specific objectives include the following:
1. To identify and examine the extent of compensation management and its effect on the
employee’s performance in the insurance industry in Nigeria (taking A&G Insurance
Plc., as a case study)
2. To determine whether the organisation is achieving the satisfaction of the employees by motivating them through compensation.
3. To investigate the effectiveness of the organisation in terms of resources allocation and achievements of its objectives by motivating the worker’s through modern technologies and infrastructural facilities.
4. To ascertain the impact of compensation management on employees’ motivation.
5. To investigate the impact of compensation management on employees leadership roles.
6. To examine the contribution of compensation management to self-actualisation of. employees
7. To determine the effects of government policies on compensation management and workers’ motivation in the insurance industry in Nigeria.
1.4.4 Research questions
1. To what extent does compensation management affect the performance of employees in
A&G Insurance Plc.?
2. How has the organisation achieved the satisfaction of its employees?
3. How has the organisation achieve effectiveness in the usage of its resources?
4. How Did compensation management impact on the motivation of the employees toward
greater performance?
5. To what extent does compensation management determine the leadership role of
employees?
6. How does compensation management enhance self-actualisation of employees?
7. Do government policies affect the relationship between compensation administration and
employees motivation?

12
1.5 ORIGINAL CONTRIBUTION
This study on the assessment of compensation management, motivation and organisational
performance in the insurance industry in Nigeria was borne out of the desire to bridge the
existing gap in the salaries of the employees in the public sector and the private sector. Such
disparities in the salaries of these different sectors necessitated consideration of having them
significantly as leaving them as they are would subject the affected employees to high levels
of exploitation. The following are some of the contributions to knowledge from this study:
1. Several studies on compensation management and organisational performance and
most of these studies made special emphasis on CEO compensation and
organisational performance, expatriate compensation and organisational performance,
executive compensation and organisational performance and mostly on reward
systems in the public sector. On the contrary, this study has been able to incorporate
compensation management, motivation and organisational performance together.
2. This study was also able to contribute to the frontier of knowledge by looking beyond
the motivational aspect of compensation management by looking at other variables
like job satisfaction, self-actualisation and leadership role all of which influence
organisational performance significantly.
3. This study was able to argue that non-financial compensation, such as supervisor’s
role, recognition and interpersonal relationship also enhance the motivation of the
employees towards improving organisational performance.
1.6 ORGANISATION OF THE STUDY
Chapter 1 introduces the study with an overview of compensation management and its link
to organisational performance, insurance industry in Nigeria, problem statement and rationale
of the study, and original contribution of study to the body of knowledge.
Chapter 2 focused on the insurance industry in Nigeria. It looks at the country of focus, that
is, Nigeria, structure of insurance industry in terms of historical antecedents, major players in
the industry, size, current performance of insurance industry compared with other industries,
the current and challenges facing insurance industry in Nigeria.
Chapter 3 presented compensation management and organisational performance,
compensation theories, legal requirements as regards compensation management in Nigeria,

13
the Employee Compensation Act 2010, the relationship between compensation and
performance and the role of leadership and management in respect of compensation
management.
Chapter 4 discussed motivation and organisational performance. This encapsulate
motivational theories like that of Maslow’s hierarchical needs theory, Herzberg’s two factor
theory, Vroom’s expectancy theory Porter-Lawler extension theory, Douglas McGregor
Theory X and Y and Onchi’s Theory Z. Types of motivation were also deliberated upon,
discussion on linkage between motivation and performance as well as the role of leadership
and management on motivation. Recommendation about motivation was equally given.
Chapter 5 outlines the design of the research, research questions of the study, description of
the target population, the study case and the method adopted in drawing sample. The design
of the measuring instruments and its administration were equally presented. The statistical
methods engaged in analysing responses from the questionnaire were also clarified.
Chapter 6 presented the statistical analysis of the data obtained through questionnaire
distribution to the respondents. The results were presented in tabular and narrative formats.
The chapter also discussed the results of the empirical findings from the data collected.
Chapter 7 contains the summary of findings, conclusion drawn from the findings in chapter
six and the literature review. This chapter also covers the recommendations and suggestion
for further studies in the field that are made.
1.7 CONCLUSION
Chapter 1 debates the background to the problem, the focus of the study and what prompt or
motivated the study. This chapter brings to fore what compensation management is as an
apparatus used by the management to motivate the employees in order to accomplish the
mission, vision and objectives of the organisation. The chapter also discussed the role of
compensation and motivation in organisational performance, objectives of compensation
management, types of compensation and motivation. An attempt was made here to discuss
the insurance industry in Nigeria briefly. The chapter also enunciated the aims and objectives
of the study, including the key research questions and the original contribution of this work.
This study aims to empirically evaluate the impact of compensation management and
motivation on organisational performance in the insurance industry in Nigeria. This research

14
hopes to highlight the importance of compensation management and motivation on
organisational performance at A&G Insurance Plc. in particular and through sharing of the
results of the study one hopes to extend this to other insurance businesses alike. Chapter 2
will discuss the insurance industry in Nigeria.

15
CHAPTER 2
THE INSURANCE INDUSTRY IN NIGERIA
2.1 INTRODUCTION
Insurance globally is concept that deals with risk spreading and it has been operating as long
as human existence. The first written insurance policy came into operation in ancient times
on a Babylonian obelisk monument having the code of King Hammurabi engraved into it.
The “Hammurabi code’’ was one of foremost forms of written laws in the world. These
ancient laws were extreme in nature and in most respects, but it presented basic insurance
coverage in the sense that a debtor do not have to pay back his loans if he experiences a
major personal disaster that made it impossible such as disability, death, flooding, etc.
(Investopedia, 2014). Major insurance business started in Europe and blossomed especially
after the industrial revolution. In America, the development of insurance industry was slow in
pace in the sense that the colonists’ lives were troubled with dangers that no insurance
businesses would touch. As a result of food shortages, wars with indigenous people and
terrible diseases, nearly three out of every four colonists died in the first 40 years of
settlement in America. The establishment of insurance in America took more than 100 years
and it was finally established, maturity was injected into it both in practice and policies that
developed during that same period in Europe (Investopedia, 2014). Nigeria as part of the
larger world cannot be an exception, so in this chapter, an overview of the country Nigeria
will be provided in terms of population, geographical location, the structure of the insurance
industry in relation to major key players in the industry, size, the current actual performance
of insurance industry in Nigeria in comparison with other industries, the current and historical
challenges facing the insurance industry in Nigeria.
2.2 OVERVIEW OF NIGERIA
Nigeria got her independence from colonial master in 1960 and became a Republic in
October, 1963. Nigeria is the most populous black nation in the whole world with an
estimated population of 177 million people with population growth of about 2.47% for 2014.
Ethnically, Nigeria is composed of 250 ethnic groups. Geographically, Nigeria is located at
western part of Africa bordering the equator, 10 degree north and 8 degree east of the equator
and surrounded by Atlantic Ocean. She is made up of 36 states and Federal Capital Territory

16
(FCT), Abuja as the capital also playing a dual role as a municipality. Despite the fact the
capital has been moved to Abuja, Lagos the former capital still plays the role of economic
nerve of the nation where most of the insurance companies are having their headquarters. The
country Nigeria is having a total land mass of 910,768 sq. km and water mass of 13,000 sq.
km making a cumulative total of 923,768 sq. km. (Nigeria Federal Ministry of Information)
Figure 2.1: Showing Nigeria within Africa Map Source: Visualculture09.wordpress.com
Figure 2.2 Nigeria Map showing some major cities Source: Travelingluck.com

17
Nigeria as a nation is having international boundaries with Benin Republic on the western
part for 773km, Cameroon on the eastern part for 1690km while on the northern part, she
shares borders with Niger Republic for 1497km and Chad Republic for 87km. Nigeria is
made up of 36 states while Abuja which is the seat of Government is centrally located in the
plateau region of the country and equally serves a municipality known as the Federal Capital
Territory (FCT) having a Federal Minister in charge of it. Some of the notable towns in
Nigeria include Lagos which was the former capital and still serves as the economic nerve of
the nation because of the Lagoon seaport that is located there. Other bid towns include Benin
City, Port Harcourt, Jos, Kaduna, Kano, Maiduguri, Sokoto. Nigeria is divided into three
areas by River Niger and River Benue (Federal Ministry of Information).
2.3 HISTORY AND DEVELOPMENT OF INSURANCE INDUSTRY IN NIGERIA
Jegede (2005) opined that the history of insurance industry in Nigeria dates back to 1920
which was started by Lloyd Brothers of London which was associated with Britain as a result
of the colonial affiliation. Before the advent of modern form of insurance, there had been in
existence some form of social insurance in the Nigerian society and these schemes has
evolved through extended family system and social associations like age grades and other
unions. As a result of the British connection, trading companies were granted insurance
agency certificates by foreign insurance companies. Such certificates gave opportunity for
such firms to issue covers and assist in claims supervision. The first kind of agency came into
being in 1918 when the Africa and East Trade Companies introduced the Royal Exchange
Assurance Agency and other agencies include Patterson Zochonis (PZ) Liverpool, London
and Globe, BEWAC’s Legal and General Assurance and the Law Union and Rock (Jegede,
2005).
The growth of the industry was negatively affected between 1921 and 1949 which was
attributable to the World War II on trading activities in United Kingdom and Nigeria
respectively. Nigeria recorded a remarkable improvement in the growth of insurance industry
shortly after the World War II (NICON, 1994). African Insurance Company Limited was the
first indigenous insurance company to be established in 1958 (Nigeria Re, 1993)
The changing face of insurance industry in Nigeria was a result of the report of Obande’s
Commission of 1961 which was the first step at regulating the activities of Insurance business
in Nigeria. The Obande’s report resulted in the establishment of insurance department in the

18
Federal Ministry of Trade and which was later transferred to the Federal Ministry of Finance.
The report also led to the promulgation of Insurance Companies Act 1961 which became
operational on 4th of May, 1967. Insurance Decree No 59 of 1976 was promulgated putting
together the provisions of the various laws. Among the provisions made by 1976 Decree were
condition for authorisation of Insurers, mode of operation, amalgamation and transfer,
administration and enforcement, penalties (Obasi, 2010; Ujunwa & Modebe,2011).
The insurance industry in Nigeria was reformed and reorganized as a result of reformation
that took place in the Nigeria Banking sector. Before the reformation, there were 104
insurance companies in Nigeria many of which were undercapitalized. The Nigerian
Government gave all the insurance companies until 28 February, 2007 to raise their capital
base by factors of over 1000%. As a result of the recapitalization, there was a spate of
mergers and acquisitions that led to the emergence of 71 stronger insurance companies (Niyi,
2007).
Notably, Nigeria has the ability to have the biggest insurance market in Africa but the large
insurance business was underwritten by foreign companies. The domestic insurance industry
is making frantic effort not only to dominate the domestic market but also to make progress
towards expanding its horizon to other regions of the African continent (Ujunwa and
Modebe, 2011).
2.3.1 Nigerian Insurance Commission (NAICOM)
Nigerian Insurance Commission (NAICOM) is a major player in the insurance industry in
Nigeria. NAICOM is a statutory agency of the Federal Government of Nigeria that was
established by law to regulate the activities and operations of insurance sector in Nigeria. The
commission derives its regulatory powers from the National Insurance Commission Act 1997
and Insurance Act 2003. The principal objective of NAICOM is to ensure the effective
administration, supervision, regulation and control of insurance business in Nigeria. The
commission is being headed by Commissioner for Insurance (NAICOM Act 1997; Insurance
Act 2003.
The functions of the commission include the following and many others:
1. Establish standards for the conduct of insurance business in Nigeria;

19
2. Approve rates of insurance premiums to be paid in respect of all classes of insurance
business;
3. Approve rates of commissions to be paid in respect of all classes of insurance
business;
4. Ensure adequate protection of strategic Government assets and other properties;
5. Regulate transactions between insurers and reinsurers in Nigeria and those outside
Nigeria;
6. Act as advisers to the Federal Government on all insurance related matters;
7. Approve standards, conditions and warranties applicable to all classes of insurance
business;
8. Protect insurance policy-holders and beneficiaries and third parties to insurance
contracts.
2.3.2 Nigeria Insurers Association (NIA)
The Nigeria Insurers Association (NIA) was established in 1971 as an aegis for all insurance
companies in Nigeria. The main aim of NIA is to promote and uphold the generally
acknowledged standards of business ethics and professional integrity among its members,
using modern technology in maintaining and circulating information universally. Another
objective of NIA is to safeguard and advance the common interests of Insurers in Nigeria by
building and supporting a positive image for the insurance industry and contributing to
legislation, and decisions made by the Government and other public authorities particularly in
the best interest of the industry and national economy at large (Proshare, 2013).
Some of the objectives of Nigeria Insurance Association (NIA) are as follows:
1. To advise members on any action or proposed action by Government or any other
authority in connection with any legislation or policy relating to insurance business;
2. To guide and assist members in complying with laws, regulations, orders and
Government directives relating generally to insurance business;
3. To create better understanding of insurance to all sections of the society including the
furtherance of knowledge and research on insurance and related matters;

20
4. To collect, collate and spread statistical, economic and other information relating to
insurance;
5. To maintain constant discussion with other trade associations with an understanding of
promoting good relationship between them and the NIA as well as the insuring public
(Proshare, 2013).
2.3.3 Nigerian Council of Registered Insurance Brokers (NCRIB)
The Nigerian Corporation of Insurance Brokers (NCIB) which was a precursor of the council,
that is, Nigerian Council of Registered Insurance Brokers (NCRIB) was established in 1962
to provide a central organisation for the regulation of all practicing Insurance Brokers in
Nigeria. The NCRIB was legalised in 1991 when the Insurance Decree No 58 of 1991 was
promulgated and made it compulsory for all practicing insurance brokers to become a
member before being registered by the Commissioner of Insurance (Inspenonline, 2013).
To make the legitimacy of NCRIB more effective, it was reestablished by an Act of the
National Assembly (NCRIB Act No. 21 of 2003) and was signed into law by the then
President and Commander-in-Chief of the Armed Forces of the Federal Republic of Nigeria,
Chief Olusegun Obasanjo, GCFR on 4th July, 2003.
Some of the objectives of NCRIB are as follows:
1. To establish and maintain a central organisation for insurance brokers and generally do all
such things as may, from time to time, elevate their status and safeguard and advance their
interest and procure their general efficiency and proper professional conduct, with a view
to ensuring for the community, the existence of a class of Insurance Brokers who can be
relied upon as being trustworthy and duly qualified to perform their responsible duties;
2. To watch over legislation affecting Insurance Brokers, and to promote, support and assist
in any legitimate manner, the carrying into effect of any legislation having for its object
the common interest of members, of the council and the general public;
3. To afford means of arbitration on, or for settling disputes, or questions between members
of the council, or between members and third party;
4. To collaborate as appropriate with government and with various institutions and
professional bodies in achieving the objectives of the council (Inspenonline, 2013).
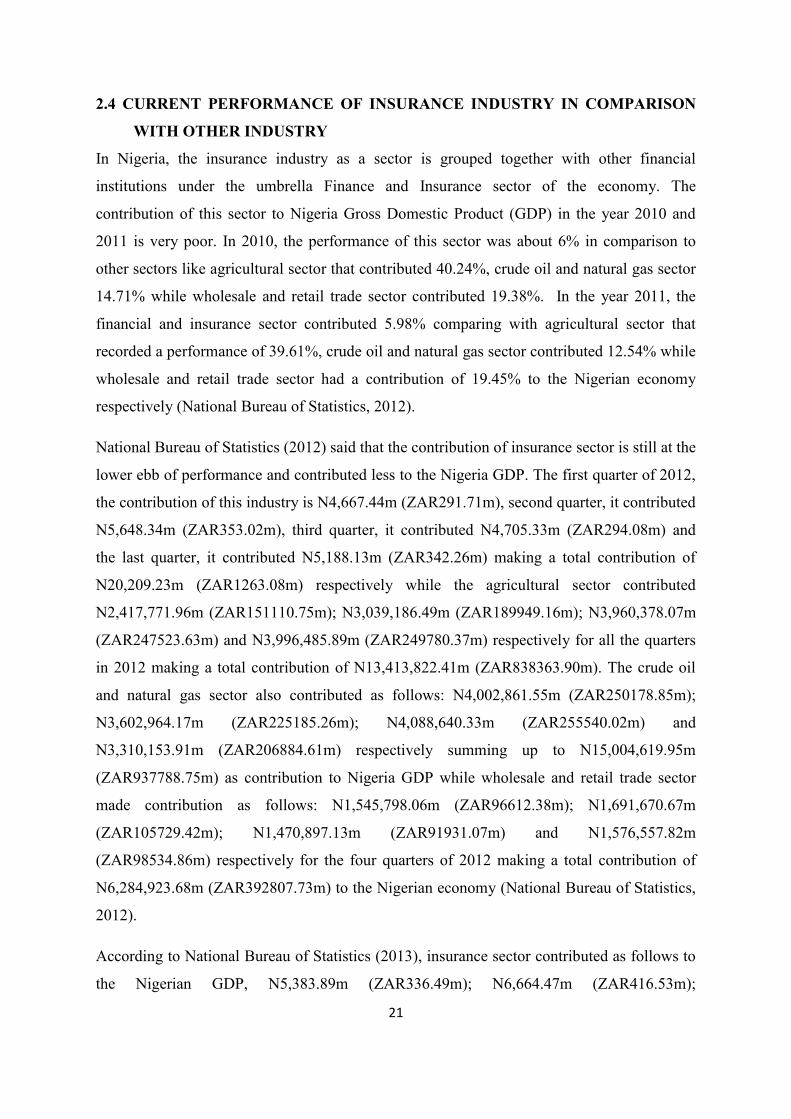
21
2.4 CURRENT PERFORMANCE OF INSURANCE INDUSTRY IN COMPARISON
WITH OTHER INDUSTRY
In Nigeria, the insurance industry as a sector is grouped together with other financial
institutions under the umbrella Finance and Insurance sector of the economy. The
contribution of this sector to Nigeria Gross Domestic Product (GDP) in the year 2010 and
2011 is very poor. In 2010, the performance of this sector was about 6% in comparison to
other sectors like agricultural sector that contributed 40.24%, crude oil and natural gas sector
14.71% while wholesale and retail trade sector contributed 19.38%. In the year 2011, the
financial and insurance sector contributed 5.98% comparing with agricultural sector that
recorded a performance of 39.61%, crude oil and natural gas sector contributed 12.54% while
wholesale and retail trade sector had a contribution of 19.45% to the Nigerian economy
respectively (National Bureau of Statistics, 2012).
National Bureau of Statistics (2012) said that the contribution of insurance sector is still at the
lower ebb of performance and contributed less to the Nigeria GDP. The first quarter of 2012,
the contribution of this industry is N4,667.44m (ZAR291.71m), second quarter, it contributed
N5,648.34m (ZAR353.02m), third quarter, it contributed N4,705.33m (ZAR294.08m) and
the last quarter, it contributed N5,188.13m (ZAR342.26m) making a total contribution of
N20,209.23m (ZAR1263.08m) respectively while the agricultural sector contributed
N2,417,771.96m (ZAR151110.75m); N3,039,186.49m (ZAR189949.16m); N3,960,378.07m
(ZAR247523.63m) and N3,996,485.89m (ZAR249780.37m) respectively for all the quarters
in 2012 making a total contribution of N13,413,822.41m (ZAR838363.90m). The crude oil
and natural gas sector also contributed as follows: N4,002,861.55m (ZAR250178.85m);
N3,602,964.17m (ZAR225185.26m); N4,088,640.33m (ZAR255540.02m) and
N3,310,153.91m (ZAR206884.61m) respectively summing up to N15,004,619.95m
(ZAR937788.75m) as contribution to Nigeria GDP while wholesale and retail trade sector
made contribution as follows: N1,545,798.06m (ZAR96612.38m); N1,691,670.67m
(ZAR105729.42m); N1,470,897.13m (ZAR91931.07m) and N1,576,557.82m
(ZAR98534.86m) respectively for the four quarters of 2012 making a total contribution of
N6,284,923.68m (ZAR392807.73m) to the Nigerian economy (National Bureau of Statistics,
2012).
According to National Bureau of Statistics (2013), insurance sector contributed as follows to
the Nigerian GDP, N5,383.89m (ZAR336.49m); N6,664.47m (ZAR416.53m);

22
N5,340.08(ZAR333.76m) and N5,296.27m (ZAR331.02m) making a total of N22,684.71m
(ZAR1417.79m) respectively. Agricultural sector contributed N2,697,962.62m
(ZAR168622.66m); N3,381,423.03m (ZAR211338.94m); N4,173,787.98m
(ZAR260861.75m) and N5,649,613.34m (ZAR353100.84m) respectively constituting a total
of N15,902,786.97m (ZAR993924.17m). The crude oil and natural gas sector contributed as
follows: N3,681,051.51m (ZAR230065.72m); N3,108,488.68m (ZAR194280.54m);
N3,654,032.75m (ZAR228377.05m) and N3,627,013.99m (ZAR226688.37m) respectively
making a sum of N14,070,586.93m (ZAR879411.68m) while the wholesale and retail trade
sector had the following contribution to Nigerian GDP: N1,795,908.18m (ZAR112244.26m);
N1,960,307.97m (ZAR112519.25m); N1,699,180.37 (ZAR106198.77m) and
N1,602,452.56m (ZAR100153.29m) respectively making a total contribution of
N7,057,849.08m (ZAR441115.57m). This is shown by the tables below as a summary and
equally depicted pictorially through bar chart.
Table 2.1: Contribution of insurance and other sectors to Nigerian GDP for 2012 in ‘Nmillion’
Sector Q1 Q2 Q3 Q4 Total
Insurance 4,667.44 5,648.38 4.705.33 5,188.13 20,209.24
Agriculture 2,417,771.96 3,039,186.49 3,960,378.07 3,996,505.89 13,413,842.41
Crude Oil and
Natural Gas
4,002,861.55 3,602,964.17 4,088,640.33 3,310,153.91 15,004,619.96
Wholesale &
Retail Trade
1,545,798.06 1,691,670.67 1,470,897.13 1,576,557.82 6,284,923.68
Total 7,971,099.01 8,339,469.67 9,524,620.86 8,888,405.75 34,723,595.29
Source: National Bureau of Statistics, 2012.
From the table above, as at 2012 Insurance sector had the least total contribution of N20,
209.24million to Nigerian GDP followed by Wholesale and retail trade with total
contribution of N6, 284,923.68million. The next is Agriculture that contributed a total sum of
N13, 413,842.41 to Nigerian GDP while Crude oil and natural gas contributed a whooping
sum of N15, 004,619.96million to Nigerian GDP which was the highest for that year 2012.

23
Figure 2.3: Sectoral performances of insurance and three major industries in 2012.
Source: Own compilation
Table 2.2: Contribution of insurance and other sectors to Nigerian GDP for 2013 in ‘Nmillion’
Sector Q1 Q2 Q3 Q4 Total
Insurance 5,383.89 6,664.47 5,340.08 5,296.27 22,684.71
Agriculture 2,697,962.62 3,381,423.03 4,173,787.98 5,649,613.34 15,902,786.97
Crude Oil
and Natural
Gas
3,681,051.51 3,108,488.68 3,654,032.75 3,627,013.99 14,070,586.93
Wholesale &
Retail Trade
1,795,908.18 1,960,307.97 1,699,180.37 1,602,452.56 7,057,849.08
Total 8,180,306.20 8,456,884.15 9,532,341.18 10,884,376.16 37,053,907.69
Source: National Bureau of Statistics, 2013.
The table above shows that in 2013, the insurance sector contributed N22, 684.71million to
the Nigerian GDP which is 12.25% above that of 2012, yet it is the least contributor to the
Nigerian out of all the sectors compared. Wholesale and retail sector contributed N7,
057,849.08million which has an increase of 12.30% above that of 2012, this followed by
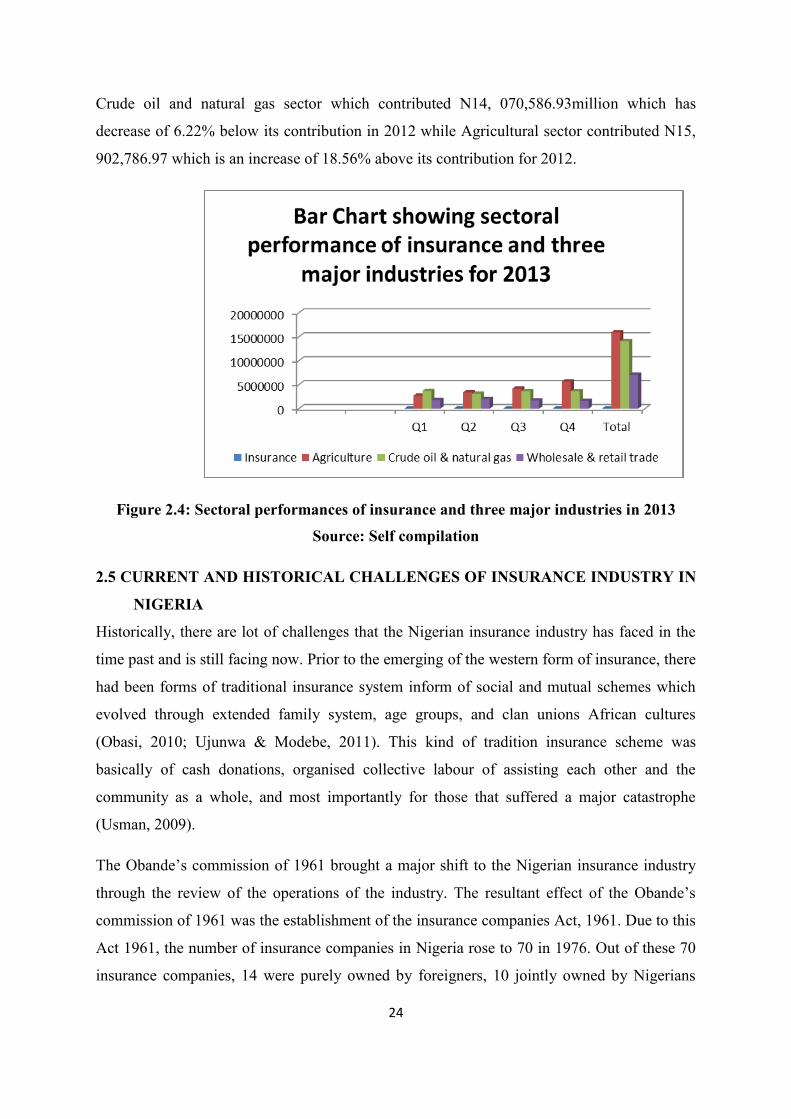
24
Crude oil and natural gas sector which contributed N14, 070,586.93million which has
decrease of 6.22% below its contribution in 2012 while Agricultural sector contributed N15,
902,786.97 which is an increase of 18.56% above its contribution for 2012.
Figure 2.4: Sectoral performances of insurance and three major industries in 2013
Source: Self compilation
2.5 CURRENT AND HISTORICAL CHALLENGES OF INSURANCE INDUSTRY IN
NIGERIA
Historically, there are lot of challenges that the Nigerian insurance industry has faced in the
time past and is still facing now. Prior to the emerging of the western form of insurance, there
had been forms of traditional insurance system inform of social and mutual schemes which
evolved through extended family system, age groups, and clan unions African cultures
(Obasi, 2010; Ujunwa & Modebe, 2011). This kind of tradition insurance scheme was
basically of cash donations, organised collective labour of assisting each other and the
community as a whole, and most importantly for those that suffered a major catastrophe
(Usman, 2009).
The Obande’s commission of 1961 brought a major shift to the Nigerian insurance industry
through the review of the operations of the industry. The resultant effect of the Obande’s
commission of 1961 was the establishment of the insurance companies Act, 1961. Due to this
Act 1961, the number of insurance companies in Nigeria rose to 70 in 1976. Out of these 70
insurance companies, 14 were purely owned by foreigners, 10 jointly owned by Nigerians

25
and foreigners while 46 were exclusively owned by Nigerians. The sudden upsurge in the
number of indigenous insurance companies does not translate to efficiency and effectiveness
(Ujunwa & Modebe, 2011), as foreign domination is still visible in terms of business volume
in this industry.
The Structural Adjustment Programme (SAP) introduced by Babangida led administration in
1985 caused an astronomical increase in the industry where their number moved up to 110 in
1990. The restructuring that took place in the financial sector in 2004 brought a dramatic
change to the insurance industry by way of asking the operators to recapitalise their base. The
NAICOM in September 2005, enforce the recapitalisation requirements for insurance
companies in this format: N2billion (ZAR125m) for life insurance, N3billion (ZAR187.5m)
for general insurance and N5billion (ZAR312.5m) for composite insurance or they face the
music by way of revoking their operating licenses. Through this capitalisation, merging and
acquisition took place and by now, we have only 49 insurance companies in operation (Obasi,
2010; Ujunwa & Modebe, 2011).
The current challenges facing the insurance industry is quite enormous and these include
2.5.1 Unfriendly macroeconomic environment
A conducive macroeconomic environment promotes the savings that are impetus to the
finance investments nature, that is, it is a precursor to attain or achieve a viable insurance
industry and leading to sustainable economic growth. The macroeconomic factors are
variables used by insurance companies to determine the amount they collect as premium and
their investment decisions is also anchored on it to meet up their claims. These
macroeconomic variables include among others, current account deficits size in relation to
foreign exchange reserves, inflation, government debt, interest and exchange rates. This
macroeconomic environment that is unfriendly is as a result of macroeconomic policies that
is characterised by gross periodic financial indiscipline, leading to high inflationary rate,
large exchange rate fluctuations etc. As a result of this, the insurance companies are not
willing to invest the premiums in long-term instruments because of the fear of inflation that
has built up over the years as a result of fiscal indiscipline and high inflationary rate (Ujunwa
& Modebe, 2011; Onwumere, Onudugo & Ibe, 2013).

26
2.5.2 Market suspicious of insurance companies/Bad image
The attitude and behavioural patterns of Nigerians toward insurance companies are negative
in nature. The patronage given to insurance companies are by Nigerians is very low. The low
coverage and performance of this industry was as a result of poor attitude of the insurers in
non-claims payment, because of this unbothered attitude of payment of premiums, there is a
bad form of publicity and imagery for the industry and consequently has led to erosion of
confidence in the industry and people are no longer interested in insurance. Through the
eroded confidence in the industry, Nigerians has developed a vehement unconcern for the
industry which made the industry an exile industry. The industry also refused to change over
time since their policy are almost obsolete and are still embedded with clauses that raise a
kind of mistrust with the customers (Yusuf, Gbadamosi & Hamadu, 2009; Yusuf, 2010;
Ujunwa & Modebe, 2011).
2.5.3 Poor regulatory framework
The legal framework guiding the operations of the industry are still poorly framed and not
strictly followed. The regulators of Nigerian insurance industry has displayed policies that are
not conducive thereby making the industry to be a non-viable one. The NAICOM is
empowered to maintain and ensure effective administration, supervision, regulation and
control of insurance business in Nigeria. NAICOM is also empowered by law to ensure that
the conduct of insurance business in Nigeria is operated on an established standard and is also
ethical. The empowerment of NAICOM is under Section 31 of the Insurance Commission
Act and to have a mandatory inspection every two years on insurers or as at when the
inspectorate section of the commission determines but the commission has failed to execute
this Section 31 fully. Supervisory role of NAICOM has not been effective as few insurance
companies published their financial details or reports on yearly basis that are more recent
than 2006, that is, there is no recent publications of financial reports of the insurance
companies. In developed and developing economies, the regulatory model for insurance
business or companies is risk-based model which has not been adopted and practiced in
Nigerian economy (Research & Market, NIR 2009; Yusuf & Babalola, 2009; Ujunwa &
Modebe, 2011).
27
2.5.4 Lack of skill
This another major challenge that is facing the insurance industry in Nigeria. There is lack of
required skills to participate in some specialised transactions like marine, aviation, oil and
gas, which are of high value risk segments of the insurance industry. Other challenges that
are confronting insurance industry in Nigeria include lack of communication strategy,
standard of living, inability to attract and retain skilled talents, low technology leverage, low
investment and assets capability, etc.(Aduloju, Awoponle and Oke, 2008; Ujunwa &
Modebe, 2011).
2.6 HISTORICAL BACKGROUND OF ALLIANCE AND GENERAL INSURANCE
PLC.
Alliance and General Insurance Plc. (A&G) was incorporated as a company on April 2, 1987
and commenced business operations fully by January 1989. The corporate headquarter is
located at No 12, Abibu Oki Street, Marina, Lagos, Nigeria.
The composition of A & G Plc. ownership is made up of 60 per cent Nigerians both corporate
and shareholders investors as well as 40 per cent Foreign ownership in terms of shareholding.
In the Year 1991, A & G Plc. acquired a corporate insurer status, it obtained Five Billion
Nigeria Naira (N5 Billion) authorised share capital as well as Five Billion Nigeria Naira (N5
Billion) paid-up share capital. The shareholder’s fund of A & G Plc. is to the tune of Thirteen
Billion Nigeria Naira (N13 Billion).
Due to the government’s policy of increasing the capital base of Insurance Company in 2007,
there was a merger between A & G Plc. and the British America Insurance Company in 2009
and this led to the boosting of the capitalisation of A & G Plc.
Currently, A & G Plc. has operational branch network in 27 States out of 36 States in the
Federal Republic of Nigeria with total employee strength of 500 throughout the branches
(EMIS, 2010).
2.7 CONCLUSION
This is the second chapter that gives an historical background of Nigeria as a nation and it
covers the over view of Nigeria by looking at the geographical location in Africa. It also
focus on the population, ethnic representation of about 250 ethnic groups and also shows

28
some major cities in Nigeria on the Nigerian map. The chapter also discussed the key players
in insurance industry in Nigerian, and the size etc., the current performance of insurance
industry in comparison with other industries in Nigeria was discussed too. The current
performance of insurance industry in comparison with three other major sectors was looked
into. The contributions of these sectors to Nigerian GDP as at 2012 and 2013 respectively
were considered. The current and historical challenges facing insurance industry in Nigeria
was paid attention to. Brief history of A&G Insurance Plc. Was highlighted.
The next chapter will be on compensation management and organisational performance. This
chapter brought to lime light Nigeria as part of nations of the world that engages in insurance
business which is the major area of this study.

29
CHAPTER 3
COMPENSATION MANAGEMENT AND ORGANISATIONAL PERFORMANCE
3.1 INTRODUCTION
Compensation management is a global phenomenon that determines the hiring and retention
of employees to attain the objectives of an organisation as well as that of an individual
employee which is also used as a means of control and is the basis of involvement of
individuals (Greckhamer, 2011; Xavier, 2014). Cox, Brown and Reilly (2010) found that the
North American reward strategy has greatly influenced the reward system in many parts of
Europe especially UK. Nigeria being part of the global world, compensation management
also plays a vital role in motivating employees to work harder in order to accomplish the set
goals of the organisation (Idemobi et al., 2011; Odunlade, 2012) In this chapter,
compensation management, organisational performance, compensation theories, legal aspect
of compensation management in Nigeria, the relationship between compensation and
performance as well as the role of leadership and management in compensation management
shall be discussed.
3.2 DEFINITION OF COMPENSATION
Various definitions have been given on compensation. Literally, compensation is a form of
reward given as a result of a job that has been done or effort put in to achieve a set goal and
as such this serves as a motivational factor that encourages an individual to put more energy
or commitment into his or her job (Armache, 2012; Ederer and Manso, 2013; Qureshi, 2013).
In most organisations, the main aim of compensation is to motivate the behaviour of the
employee in a particular way. Hence, an organisation not only desires to motivate employees
to stay within the organisation, but reinforces employee’s performance through adequate and
encouraging compensation. The three major elements in motivation have been stated as that:
which is important to a person, offering it as an exchange, and the desired behaviour
(Milkovich & Newman, 1999, Riddell, 2011, Shaw, 2014).
Hills et al., (1994: 11) on one hand define compensation ‘as the total sum of wage or salary,
employee benefits, non-recurring financial rewards and non-pecuniary rewards’. While
Milkovich et al., (2011: 10) on the other hand define compensation as ‘all forms of financial

30
returns on tangible services and benefits employees receive as part of an employment
relationship’.
Martocchio (2004: 2) argues that ‘compensation represents both the intrinsic and extrinsic
rewards employees receive for performing their jobs. Intrinsic compensation reflects
employees psychological mind sets that result from performing their jobs whilst extrinsic
compensation includes both monetary and non-monetary rewards’.
Worldatwork (2007: 7) is of the view that compensation is a ‘pay provided by an employer to
an employee for services rendered (that is, time, effort, and skill). It includes both fixed and
variable pay tied to levels of performance’ whereas Carrell (1998: 370) states that
‘compensation is what employees receive in exchange for their contribution to the
organisation’. It is notable therefore that ‘compensation is tied to performance’.
3.3 COMPENSATION PERSPECTIVES
Compensation connotes different meanings to different individuals and the way people
perceive it affects their behaviour towards their work, hence the overall performance of the
organisation is affected to a larger extent. This then leads to the identification of four
different perspectives (Milkovich et al; 2011:4).
3.3.1 Society Perspective
Milkovich et al., (2011: 4) and Rost and Weibel (2013) are of the view that members of the
society conceive of a pay as a way of measuring justice through comparing the pay between
men and women. This may be considered to constitute inequalities in the awarding pay and
benefits. It is maintained that people believe that if women could have the same education,
work experience and union coverage and work in similar industries and practice the same
occupation, they could be expected to earn as much as their male counterpart. Also some
people conceive of compensation as causing tax increase which invariably leads to the
inflation of prices of certain products. This group of people does not consider higher labour
costs as being of any economic benefits or good. This view was corroborated by the work of
Shin (2012) that the gender gap in executive compensation is infinitesimal when a greater
number of women are members of the compensation committee of the board that decides
what the executive compensation should be.

31
3.3.2 Stockholder’s Perspective
Chan (2008) and Milkovich et al., (2011: 6) opine that the amount employees are paid is of
paramount interest to the stockholders. The stockholders believe that paying the employees
with stock creates a sense of responsibility towards the improvement of their performance by
making them believe that they are co-owners of the business. The stockholder believes that
this invariably increases their wealth and riches. It is argued further that the stockholder’s
perspective on compensation is informed by its particular interest manifested by its
preference of paying the executives with stocks (e.g. by paying executives with stocks on the
basis of company performance measures such as stockholder return) by which it is hoped the
company’s performance will increase. The degree of options usage in the executive
compensation package were found to be absolutely related to the ownership concentration
and CEO share ownership, which was interpreted to be weak ownership structures that
enhances the adoption options (Scholtz, 2009; Collins, Gustafsson, Petersson and Smith,
2012). Stockholders are showing more interest in executive compensation and severance
packages as well as having a say on pay and vote at annual meetings for all the publicly
owned companies as it found out by (Bruvik and Gibson, 2011).
3.3.3 Manager’s Perspective
Milkovich et al., (2011: 7) and Bauweraerts, Vandernoot and Tyrant (2013) argue that
managers view compensation as influencing their success, in that the more they are paid, the
more successful they are in what they do. This being a major expense results in competitive
pressure which invariably forces them to consider the affordability of their compensation
decisions. Managers are of the conviction that they must use compensation or pay to
influence employee’s behaviours which in turn leads to the improvement in the organisations
performance. In recent times, the noticed gaps that exists between the executive pay packages
and that of the ordinary employees has been widened which has been a source of concern to
both employee and shareholders inform of dissatisfaction (Tay and Bipinchandra, 2013).
3.3.4 Employees Perspective
Milkovich et al., (2011: 8) argues that the payment received in return for the job done by
individuals or employees is a major source of their financial strength or security, which in
turn plays a vital role in their economic or social well-being. It is further argued that
‘Employees may see compensation as a return in exchange between their employer and
themselves, as an entitlement for being an employee of the company, or as a reward for a job

32
well done’ (Milkovich & Newman, 2008: 8). Having invested their money on education and
training and also contributed their time and energy at the workplace, employees consider
compensation as a return on those investments and contributions they would have made.
Nawab and Bhatti (2011) found that employees normally accept offer of employment where
both financial and non-financial compensation are adopted in measuring their importance or
the employee value. However, the views of Peberdy and Strowel (2010) is about what the
employees received as compensation when they invent new things and this is based on the
existing laws guiding the compensation of such within a particular number of years. The
employees are expectant that their employer must pay them as at when due or they make
legal litigation against the employer who refused to reward them accordingly.
3.4 COMPENSATION MANAGEMENT
The issue of compensation management has always been a major mechanism that affects the
decision of job applicants and employees of organisations and it has encouraged
organisations to execute their strategies which in turn secure competitive advantage against
other major competing organisations. Also, a huge amount of financial resources are invested
on designing, organising, and managing an organisation’s compensation system. Despite its
prominent role to the success and development of the firm, scholars and practitioners have
lamented that there is a slow pace in the advancement of compensation research which is in a
form of stagnancy and under representation (Heneman et al., 2000; Kersley & Forth, 2005).
In most recent times, the design delivery and the use of compensation management have
undergone major shifts that are dramatic in nature and have been reflected in the motivational
aspect of the employee’s performance (Heneman et al., 2000; Purcell et al., 2003).
For organisations, the major purpose of compensation management is to motivate the
employees to behave in a certain way (Pratheepkanth, 2011; Jehanzeb et al., 2012; Khan and
Mufti, 2012). In short, an organisation wants to motivate its employees to stay within the
organisation and reinforce the employee’s performance through adequate compensation
administration.
Compensation is a kind of reward adopted by organisations to motivate employees to behave
in ways they desire. However, compensation takes various forms (for instance, tangible
prices, paid vocation, stock option) with cash pay being the most generalised monetary
incentive in organisations (Rynes & Gerhert, 2000). In moderating human behaviour, money

33
can have instrumental or symbolic motivational properties (Stajkovich & Luthans, 2001:580).
Money can generate results that satisfy physiological or psychological needs in instrumental
form that is, meeting their needs in terms housing, clothing, food etc. Also, money generates
social comparison information in symbolic form, inform of interpersonal relationships,
affection, status within a group etc.
The issue of compensation management is one of the important functional areas of human
resources (Ramlall, Maimani & Diab, 2011; Absar, Nimalathasan & Mahmood, 2012).
Compensation administration, involves salaries and wages which are singular factors that are
crucial in motivating employees to achieve set up goals. Wages are part of the major factors
in the economic and social life of those that work in the private sector of any society. In
developed societies, the total wages of manual workers average 40 per cent or more of the
whole national income. Wage earners also form a percentage of the labour force (Robinson,
1990). Salaries are paid to the employees on a monthly basis with other benefits attached.
Salaries are also the reward for work and enhance recruitment, retention and motivation of
the employees (Yusuf, 1984; Robinson, 1990).
Compensation management is part of the motivational factor put in place with salary as a
major factor called the hygiene factor and not a motivator of performance (Herzberg et al.,
1959). For most organisations, the most important reason for compensation management is to
encourage and motivate employees to behave in certain ways that are desirable to the
organisations. However, an organisation wants to motivate employees for retention, and
reinforce employee’s performance through the management of compensation with the focus
on what is important to a person, offering it as an exchange for desired behaviour (Milkovich
& Newman, 1999). Thus, the offer from an organisation affects employee’s behaviour
through an exchange process.
Compensation foundation has been widely studied. Lawler (1987) divides it into three
philosophies and components: job-based, skilled-based, and performance-based pay.
Mahoney (1989: 337) established three vital components, namely job, performance and
person. These three components, inform compensation administration or structure according
to the analysis of the meaning, objectives, and foundation of compensation. Zhu (1996)
contended that protection, skill, job, and performance are the critical factors in managing

34
compensation. Huang (1997) submits that skill, job, and performance are the basis for
compensation management.
Compensation management is strategic in nature especially when it supports an organisations
mission, vision, and business goal as well as the goals and initiatives of human resource
systems. This sounds very simple, but there is a myriad of ways for an organisation to
connect its mission and values to a strategic, business-driven compensation philosophy.
Compensation managements are associated with better business performance and
organisation that connect its mission and values to its compensation system (Khan et al.,
2011; Milkovich et al., 2011: 8; Nazim-ud-Din, 2012).
There are so many different ways to reward or compensate employees and the basics of
compensation are job evaluation, merit pay, market surveys, the changing nature of pay, and
performance-based pay (Heneman, 2002).
Compensation or reward management aims at the formulation and implementation of
strategies and policies that are aimed at rewarding people fairly, equitably and consistently in
accordance with their value to the organisation (Brauns, 2013; Karami, Dolatabadi &
Rajaeepour, 2013; Pingle, 2014). It deals with the design, implementation and maintenance of
reward practices that are geared towards the improvement of organisational, team, and
individual performance (Dauda, 2010; Abolade, 2012). Compensation management is an
integral part of an human resource management approach to managing people, and as such it
supports the achievement of the business strategy and is concerned with developing a positive
employment relationship and psychological contract, to address longer term issues relating to
how people should be valued for what they do and what they achieve (Sisson, 2010;
Musenze, Thomas, Stella & Muhammadi, 2013). It embraces both financial and non-financial
rewards, and thus all these need to be taken into account and integrated in order to maximise
the effectiveness of reward policies and practices (Armstrong, 2003). Compensation
management connotes putting in place a fair compensation structure where employees are
rewarded for their efforts (Hewitt, 2009). This serves as a source of encouragement to top and
great performers to put in more effort and work harder so that jointly they may help in
building a robust and highly competitive atmosphere in the organisation (Hewitt, 2009).
Compensation management is said to be the function of HRM that deals with every type of
reward individuals receive in exchange for performing the organisations tasks. Employees

35
trade labour and loyalty for financial and non-financial compensation in terms of pay,
benefits, services, and recognition. The objective of compensation management is to create a
system of rewards that is equitable to the employer and employee alike (Mujtaba and Shuaib,
2010; Agwu, 2013). The desired outcome of compensation management is an employee who
is attracted to the work and motivated to do a good job for the employer, retain them, reduce
labour turnover and absenteeism and cause a reduction in industrial conflict (Ivancevich,
2004). The major function of HRM relating to compensation encompasses financial
participation which involves save-as-you-earn schemes (SAYE), share incentive plans (SIPs)
and employee wage and salary. It also involves employee engagement, fair pay and executive
reward (CIPD, 2005 & 2006). Armstrong and Brown (1998) assert that compensation
management is an essential HRM strategy that manages people within the firm. Hence, it
strengthens the accomplishment of business objectives and is likewise a strategic way of
addressing long time matters as regards to how human assets of the firm should be managed
and valued for what they seek to attain. Therefore, it is incorporated with the functions of the
HRM, and most importantly those concerned with the development of HR.
Armstrong (2005: 986) argues that compensation management entails developing a cordial
and positive employment relationship and psychological contract that engages a
comprehensive compensation tactics that identify quite a number of ways through which
people can be compensated. Compensation management is also viewed as being anchored on
a well enunciated philosophy- a set of beliefs and guiding principles that are coherent with
the values of the firm which acknowledges the truth that human resource management is all
about investing in human capital of which a reasonable and tangible return is being expected
and required. Then it is not out of place to compensate people in a way that is commensurable
with their contribution. This has been the foundation for the development of skills and
capabilities of workers in an attempt to boost the resource-based capacity of the firm
(Anyebe, 2003; Brown, 2003; Bob, 2011).
Similarly, Harrison and Liska (2008) contend that remuneration is the connecting rod of
employment contract between the employer and supplier of labour which is basically the
main objective which motivates people to work. This embraces all kinds of rewards; both
intrinsic and extrinsic are offered as a result of being employed by the organisation. Brown
(2003) views compensation as a return in exchange between the employer and employees
themselves and as an entitlement or gratification for being engaged by the organisation, or as

36
remuneration for a well-executed job. Employees’remuneration depends not only on the jobs
they are holding but also on the function of individual performance, group or team work, or
whole organisation as well as differences in employee qualities such as years of experience,
seniority, educational qualifications, geographical location, bargaining strength and skills
(Gehert & Milkovich, 1992: 417).
Reward does not only compensate employees for their abilities and efforts- but also have an
implication on the hiring and retention of endowed and talented people (Milkovich &
Newman, 2001: 508). Worldatwork (2007) was of the opinion that compensation
philosophies and aims must incorporate and be a reflection of the total culture, philosophies
as well as the strategic plans of the establishment. He postulates that there are two major
philosophies about compensation, which should be viewed as opposite ends of a continuum.
At one end of the continuum is the entitlement philosophy and at the other end is the
performance-oriented philosophy. Similarly, Bob (2011) argues that compensation
procedures depend purely on compensation philosophies and strategies. It contains
arrangement in the form of policies and strategies, guiding principles, structures and
techniques which are conceived and managed to provide and maintain suitable types and
levels of pay, benefits and other kinds of compensation. This is made up of evaluating job
values, planning and sustaining pay structures, paying for performance, ability and skills, and
providing other employee benefits (Bob, 2011; Khan & Jabbar, 2013). It is notable; however,
that compensation management goes beyond the issue of money, as it also covers non-
financial compensation which ushers/provides in intrinsic or extrinsic motivation (Bob, 2011;
Aguinis, Joo & Goltfredson, 2013).
Employees and likewise managers who are subscribers of the benefit philosophy are of the
view that those who have put in another year of meritorious work deserve a rise in the base
pay and that all incentives and other beneficiary programmes should continue unhindered
regardless of the changes that might have occurred in industrial and economic conditions. On
the other hand, in the case of the performance-oriented method, nobody is assured of
compensation just for putting in an additional year of work to the service of the organisation.
Instead, pay and other incentives are functions of the contribution and differences in terms of
employee performance. An employee who does not perform or are not diligent in their
responsibilities receives little or no increment in their compensation (Karami et al., 2013;
Khan & Jabbar, 2013). It is, therefore, imperative that organisations marry their

37
compensation practice with performance to boost the achievement of organisational goals and
thereby enhance the competitive advantage of the organisation (Brevis & Vrba, 2014). Fein
(2010) asserts that firms or establishments with formal bonus schemes have an average pre-
tax return on investment of 15.8 per cent compared with firms without a formal plan with the
profit after-tax being 8.6 per cent versus 5 per cent. Loomis (2008) plotted 2007
compensation paid which covers salaries, bonuses, profit-sharing, stock option contribution
against return on shareholders’ equity and established less perfect relationship. Moreover, he
stressed extreme cases where executives earned relatively huge increases in compensation at
the time of diminishing profits of the firms. Loomis (2008) contend that executive
compensation in these noticeable public firms should be more linked to firm performance.
Idemobi, Onyeizugbe and Akpunonu (2011) view “compensation management as a tool for
improving organisational performance” in the public sector of a state in Nigeria. They
contend that there is no significant relationship between financial compensation of public
staff and their performance and that the compensation earned is not measurable with the staff
effort. They stress that reformed programmes of the government have no corresponding and
significant effect on the financial compensation policies and practices in the public sector in
Nigeria due to improper compensation management.
Werner and Ward (2004) argue that for the continuous existence of an organisation, rewards
have been accepted as a major motivational factor that encourages employees’ to put in their
best as well as an essential tool and cost for organisations. The perceptions about the
construct reward system; its influence on organisations structure, system, strategies, and
employees has been an area of concern for research. Werner and Ward (2004) focused on
recent compensation research which is characteristically eclectic. Compensation management
is also essential to the organisation to encourage positive behaviours from the employees and
it is an integral part of total reward (Mathis & Jackson, 2011). Similarly, Vrba (2014) argue
that the behaviour or attitude of team members are greatly influenced by the evaluation and
reward system of the firm. A reward system shows the individual and teams how to manage
their energies and equally reinforce desired performance.
3.5 TYPES OF COMPENSATION
There are various forms of compensation and nearly all these forms of compensation can be
categorised into four broad types (Muchinsky et al., 1998: 226). The four broad types are:

38
(a) Wages and Salary: Wages are what is paid to employees who are not permanently
employed and typically pertains to hourly rates of pay (the more hours worked, the greater
the pay), while salary is what is paid to people that are permanently employed and this is at a
fixed weekly, monthly, or annual rate of pay.
(b) Incentive Plans: This is an additional compensation which is above and beyond the
employees wage or salary provided. It may be long term or short term in nature.
(c) Employee Benefit Programmes: Time off with pay, pension scheme, tuition
reimbursement, recreation activities, cafeteria services are all examples of employee benefit
programmes.
(d) Additional Privileges: Employees in organisations may have other privileges such as the
usage of company vehicles/cars, club membership or travelling allowance. These privileges
may be a substantial part of compensation, especially for the executives.
Kerrin and Oliver (2002) argue that there are several reward systems which operate within
organisations. This is frequently used as a vital management tool that can contribute to the
effectiveness of a firm by inducing individual and group behaviour. Remuneration systems
also bring in other objectives such as legal compliance, labour cost control, perceived fairness
towards employees and improvement of employee output to attain higher productivity level
and to meet customer’s satisfaction (Bellon et al., 2010; Tabiu & Nura, 2013). However, it is
observed that the design of remuneration schemes may incorporate pay for individual
performance, pay for individual development, benefits centered on the performance of small
groups or teams and finally remunerations may be anchored on division or organisational
performance.
In the same light, McNamara (2006) and Odunlade (2012) are of the view that compensation
covers issues concerning wage and /or salary programmes and structures cropping up from
job descriptions, merit-based programmes, bonus-based schemes, schemes based on
commission etcetera, while benefits exclusively talks about retirement plans, health life
insurance, disability insurance, vacation or leave allowance, employee stock ownership
scheme and so on. However, Gomez-Mejia, Balkin and Cardy (2006) view employee
compensation as the totality of base pay and fringe benefits. Base pay or cash pay is what is
made available directly by employers for work done and these captures salary, overtime pay,
39
shift allowance, costume allowances and pay. Compensation for performance includes merit
awards, incentive pay, bonuses, gain sharing and other fringe benefits. Compensation can
also include social security, health benefits, pension and gratuity plans, paid time off, tuition
reimbursement, Foreign Service premiums (Aamir et al., 2012; Terera & Ngriande, 2014).
Furthermore, skill based pay also comes with its own risks in the area of employee paying
higher compensation that are not offset by the organisation’s productivity. More so,
employees may become “corroded” if there is no opportunity to engage the skills acquired
(Aguinis et al., 2013). When the employee reaches the bar of the pay structure, he or she may
be frustrated and disengage from the organisation because the opportunity for further
increment in pay is no longer there (Tremblay & Chênevert, 2008). Employee benefits,
though a fractional part of the entire compensation encapsulates non-monetary form of
compensation ranging from health care plans, to pension or retirement plans, social security,
insurance, family and medical leave (Bernadin, 2007: 253-277). Severance pay, is payment
for time not worked (vacations, sabbatical, holidays) and workers compensation, that is paid
when employees are injured while on the job (Cascio, 2003).
Milkovich et al., (2011: 10) argue that there are varieties of returns that people receive from
work and this is categorised into two; namely total compensation and relational returns.
(a) Total Compensation: These are more transactional in nature and these include pay
received directly in cash form (e.g., base, merit incentives, cost of living adjustments) and
indirectly received as benefits (e.g., pensions, medical insurance scheme like National Health
Insurance Scheme in Nigeria) and other programmes to help balance work and life demands.
(b) Relational Returns: These are psychological in nature and include praise, employment
security, learning opportunities and challenging tasks. The two cannot be operated in
isolation; they must be managed together as represented in the diagram below:

40
Figure 3.1: Total Returns for Work Source: Milkovich et al.; (2011:11)
Notably, programmes to pay people can be designed in a variety of ways, and a single
employer typically uses more than one of such programmes (Henderson, 1989: 16-18,
Henderson, 2006: 25-27; Milkovich et al.; 2011: 10-14).
The authors above indicated these categories or forms of pay as follows: -
3.5.1 Cash Compensation: Base
It is argued that ‘Base wage is the cash compensation that an employer pays for the work
performed by the employee’. This typically reflects the value of the work, is a standard
compensation for the job irrespective of efforts or performance levels, and is often calculated
hourly, weekly, monthly or annually. This could also be joined by annual bonus or the 13th
month pay if it is guaranteed. Some pay systems set base wage based on the skill or education
that an employee possesses.

41
3.5.2 Cash Compensation: Merit Pay/Cost-of-Living Adjustments
There could be periodic changes to the base wages by employers based on certain factors
such as: -
The Cost-of-living adjustment:- An organisation may decide to adjust the base wage basically
because of changes or increase in the cost of living that arises as a result of inflation/changes
in experience or skill acquired. This does not take into consideration the performance level of
the employee.
The Merit adjustment:- An organisation may decide to give a merit increase based on
recognition of past contribution to the attainment of organisational goals such as long service
award. This could be given on ad-hoc basis.
3.5.3 Cash Compensation: Short Term Incentives
This incentive is performance based and is quite different from merit adjustment (Gerhart,
Rynes & Fulmer, 2009; Lakin, Pierce & Gino, 2012). Incentives do not bring an increment on
the base wage and has to be re-earned each period. It is most often known before hand, for
example, sales commission and employees generally know what is required to earn an
incentive and how much he/she can earn should the target be met. Incentives can be earned in
different ways or on different levels and these ways include
Individual employees
Team of employees
business unit or department
Company
Any combination of the above (Milkovich et al.; 2011)
The performance targets include some of the under listed
Reduction in expenses
Volume increase
Customer satisfaction

42
Growth in revenue
Return on investment etc. (Milkovich et al., 2011)
Incentives are paid once the targets are met, and as such do not affect the cost of labour or
employment permanently and are invariably considered as a variable cost (Milkovich et al.,
2011; Armstrong, Brown & Reilly, 2011; Madhani, 2011). This category includes bonus that
is being given annually or the 13th month pay, which is based on the attainment of a specific
performance goal (Milkovich et al., 2011; Stringer et al., 2011).
3.5.4 Cash Compensation: Long Term Incentives
This is an incentive used to arouse the interest of employees to concentrate on multiyear
results. These incentives may take the form of stock option, which more often than not
enables the employee to focus more on long-term financial objectives such as return on
investment (ROI), market share, and return on net assets (Milkovich et al., 2011; Chapman &
Kelliher, 2011; Gupta, Conroy & Delery, 2012).
3.5.5 Benefits: Income Protection
Benefits are an integral part of the total compensation. According to Milkovich et al., (2011:
10-14) and Marticchio (2004: 334-335) income protection is put in place against the future in
respect of unemployment, medical purpose, retirement programmes, life assurance. For
example, in Nigeria, it is expected of the employers to pay medical bills and contribute
towards the retirement of their employees as well as take up a compulsory life assurance
policy that has a sum assured of five times the employees’ gross salary.
The Obasanjo regime in 1999 established the National Health Insurance Scheme (NHIS)
through the act of parliament (NHIS Decree, 1999) while in the private sector of the
economy; they have their company clinics where their employees are being treated (NHIS
Decree, 1999; Odia and Okoye, 2012).
Employers are mandated to contribute 7.5 % of the basic salary of an employee towards
retirement while the employee contributes a minimum of 7.5%, which makes the employee to
be financially secured upon retirement in Nigeria (Odia and Okoye, 2012).

43
3.5.6 Benefits: Work/Life Values
These benefits help to integrate the work and life responsibilities of the employee. These
benefits include time-off like vacations, life counselling, flexi-time and other family matters
can be accommodated by the organisation. These benefits are offered to the employees to
attract them, motivate and use it as retention plan (Milkovich et al., 2011).
3.5.7 Benefits: Allowances
Allowances are part of the benefits offered to employees by organisations in Nigeria
especially to top management executives and other senior employees. Such allowances
include –
Car loan
Travelling allowances
Company Chauffeur driven cars and
Entertainment allowances (Ejiofor & Yerokun, 2013; Gberevbie, 2013).
3.5.8 Relational Returns
The relational returns are non-financial returns from work, which substantially affect the
employees’ behaviour at work. Such factors include recognition and status, learning
opportunities, employment security, challenging work, and personal satisfaction, which fall
outside the domain of total compensation but still form part of the benefits or returns that
employees receive from their employers and these form the basis of their employment
relationship (Milkovich et al., 2011).
3.5.9 Total Package
Worldatwork (2007) illustrates the elements that make up the total package or the
components of total package as total compensation strategy, compensation, benefits, work
life, performance and recoginition as well as development and career opportunities. This is
illustrated with the model below:

44
Figure 3.2: Components of Total Package
Sources: WorldatWork (2007:4).
3.6 CHARACTERISTICS OF COMPENSATION
Muchinsky et al., (1998: 227) list the major characteristics of compensation as follows:
It enhances improvement of both individual and organisational performance.
It encourages value-added performance.
It gives room for flexibility by helping to achieve the most efficient wage of human
resources within the organisation.
It provides managers with a support base.
It facilitates organisational strategic objectives.
It motivates employees.
It makes the labour market more competitive by attracting and retaining highly skilled
and quality people.
It gives room for fair play and equity.
It offers value for money.
It encourages teamwork (Martocchio, 2006: 18-23)
Milkovich et al., (2011: 15-18) highlight certain objectives of compensation as follows:
45
It creates room for efficiency in terms of improving performance, increasing quality,
delighting customers and stockholders:-
Controlling labour costs.
Compliance.
Ethics (Grobler et al., 2011; Mathis & Jackson, 2011).
3.7 COMPENSATION STRATEGY
In taking a decision about designing and developing a compensation strategy for an
organisation, the decision makers or policy makers of the organisation must take into
consideration the main company strategy and the resulting competitive advantages. In
essence, the compensation strategy must fully support the overall strategy of the organisation
and ensure that it assists in achieving the corporation’s vision, mission, and goals (Pearce &
Robinson, 1999; Milkovich et al., 2011).
‘‘The remuneration strategy is aligned with the strategy, vision, and mission of an
organisation, and considers the national and international industry trends. The strategy also
proposed that all factors influencing the attraction and retention of employees must be
considered. A key aspect of implementing a strategy is the institutionalisation of the strategy
to permeate the daily decisions and actions in a manner consistent with long-term strategic
success. Four fundamental elements must be managed to ‘fit’ a strategy if the strategy is to be
effectively institutionalised, namely organisational structure, leadership, culture, and
rewards’’(Pearce & Robinson, 1999: 366).
According to Milkovich et al., (2011: 15-21), a strategy perspective focuses on those
compensation choices that help the organisation gain and sustain competitive advantage.
Milkovich et al., (2011: 15-21) list the strategic compensation policies that face management
as follows:
(a) Objectives: Objectives serve as guidelines in the designing of pay systems and how
compensation should support the business strategy and be adaptive to the cultural and
regulatory pressures in the global environment. The objectives also serve as the
standards for judging the success of the pay system (Milkovich et al., 2011).

46
(b) Internal Alignment: This refers to how the different types and levels of skills and
work should be paid within the organisation. Jobs and the skill of the people are
compared in terms of their relative contributions toward the attainment of the overall
organisational business objectives. The internal relations have an indirect effect on the
capabilities of the workforce and hence it affects the efficiency of the entire
organisation (Milkovich et al., 2011).
(c) External Competitiveness: The issue of external competitiveness relates to how much
employers are prepared to pay in comparison to what other employers are paying such
that total compensation is positioned against competitors. External competitiveness
manifests itself in two dimensions (i) It ensures that the pay the employers offer is
enough to attract and retain employees, (ii) It controls labour costs so that the
organisation’s prices of products or services remain competitive in the global economy
(Milkovich et al., 2011).
(d) Employee Contribution: Pay adjustment or increases relates to the question of
whether or not should be on individual basis and/ or team-based, or corporate profit
sharing plans, on experience and/or continuous learning, on improved skills, changes
in cost-of-living(COLA) or on business unit performance. Milkovich et al., (2011: 20)
argue that both external competitiveness and employee contribution decisions should
be used jointly. Clearly, as argued by Milkovich et al., (2011: 20), market
compensation level is mostly effective and sustainable when it exists together with
above market employee contributions to productivity, quality, customer service , or
other important strategic objectives’’ (Milkovich et al., 2011).
(e) Management: Management is all about the openness of the management of the pay
system, that is, how open and transparent the pay system and decisions should be to all
employees. In light of this, it is argued that management must equally give the right
pay to the right people for accomplishing the right objectives or goals at the right time.
Taking decisions on these five issues forms a pattern that becomes an organisational
compensation strategy. The compensation and benefit strategy of an organisation is an
imperative aspect of the organisation’s competitive positioning in the market. In summary,
the above five issues that revolve around the compensation strategy can be represented in the
diagram below.

47
Figure 3.3: Compensation Strategy Model Source: Own compilation
3.7.1 Compensation Committee
Henderson (1989: 468) argues that compensation committees are a major unit in the
organisation and are involved in the development of personnel budget. The committee is
made up of the board of directors (BOD’s) which plays a prominent role in determining the
pay of the chief executive officer (CEO) and other members of senior management. At times,
it may have to review the compensation opportunities made available to all employees. In a
nutshell, the compensation committee can almost exercise prerogative powers over all the
compensation practices of the whole organisation.
Henderson (1989: 468) asserts that the compensation committee may perform all or a select
group of the following activities
Periodically review and appraise the performance of the chief executive officer and top
management.
Set compensation for the chief executive officer.
Review compensation of competitive companies.
Review and approve proposed increases in compensation for officers and directors.
Monitor executive perquisites and expenses.

48
Review general policies and procedures relating to director and officers compensation
and total compensation for all employees.
Ensure compatibility of the long-term strategic goals of the organisation and the
performance goals used as a base for determining long-term incentive awards.
Develop special supplemental awards in cash, stock, or a combination of both for
extraordinary accomplishment.
Review and approve personnel-related budgets.
Report findings to the full board.
According to Martocchio (2004: 421) the compensation committee are made up of BOD’s
members both within and outside the organisation. Martocchio (2004) is of the view that
outside members serve on compensation committees to serve as checks and balances so that
there is minimisation of conflict of interests. Thus, outside directors are the committee’s
membership majority. Martocchio (2004) highlights the three major duties that are performed
by compensation committee as the following: -
It reviews consultant’s alternate recommendations for compensation packages.
It discusses the assets and liabilities of the organisation.
It recommends the consultant’s best proposal to the BOD’s for its consideration.
3.7.2 Compensation Strategy as Components of HRP
Martocchio (2004: 19-23) argues that HRP cannot operate alone or in isolation, that is, HR is
related to others in different ways. Martocchio (2004) highlight the relationship between
compensation and each of the HRP as follows
Compensation, Recruitment, and Selection.
Compensation and Performance Appraisal.
Compensation and Training.
Compensation and Career Development.
Compensation and Labour Management Relations.
Compensation and Employment Termination.
Compensation and Legislation.
3.8 TOTAL COMPENSATION STRATEGY DEVELOPMENT
Developing a total compensation strategy is very vital to the growth of an organisation and it
enhances the competitive advantage of the organisation within the global industry in which it

49
operates. Milkovich et al., (2011: 43-50) argue that developing a compensation strategy
involves four simple steps which appear simple but are complex to execute. These four steps
are discussed below
3.8.1 Step 1: Assess Total Compensation Implications
To develop a concrete compensation strategy, thought must be given to the organisation’s
past, present and most importantly, it’s future. It should therefore be asked as to what factors
within the business environment have contributed to the success of the organisation and
which of these environmental factors are likely to become more (or less) important as the
organisation projects into the future. These factors include:
(a) Business Strategy and Competitive Dynamics: This involves knowing and
understanding the specific industry in which the organisation is operating and how the
organisation intends to compete with her competitors. It also needs to answer the
questions ‘‘what is your organisation’s strategy? How do you compete to win? How
should the compensation system support the strategy? (Hsieh & Chen, 2011; Diaz-
Fernández et al., 2013).
(b) HR Strategy: It should be asked whether pay is a Supporting Player or Catalyst for
Change. As earlier mentioned, the pay strategy is also influenced by how it fits with
other HR systems in the organisation. No matter what the overall HR strategy is, a
decision about the prominent role of pay in HR cannot be underestimated. Pay is a
support player as in the high performance approach or it can take the lead and be a
catalyst for change. However, compensation is embedded in the total HR approach
(Sahoo et al., 2011; Torres & Adler, 2012).
(c) Culture/Values: A pay system most often is a guide that reflects the values of an
employer’s behaviour and underlies how the employees are being treated by the
employer. The pay system is a mirror in which the organisation’s image and
reputation can be seen (Nazir, Shah & Zaman, 2012; Hogler, Henle & Gross, 2013).
(d) Social and Political Context: This is one of the factors to aid in the development of
compensation strategy and here the context refers to a wide range of factors such as
legal and regulatory framework, cultural differences, changing workforce
demographics in terms of gender base, expectations, and the likes which affect
compensation choices (van Essen, Hen & Carberry, 2012; Rekker, Benson & Faff,
2014).

50
(e) Employee Preferences: The preference of each employee is quite different from each
other and is easily overlooked when developing compensation strategy. Individual
employees join the organisation, make investment decisions, interact with customers,
design new products, and assemble components, etcetera. The individual employees
receive pay and this poses a major challenge in designing a pay system that better
satisfies the needs and preference of individual employees working in the organisation
(Weathington, 2008; Weathington & Reddock, 2011).
(f) Union Preference: The union-management relationship is a crucial part to be
considered when developing or designing the organisation’s compensation strategy.
The influence of union on pay decisions remains significantly high in the Nigerian
economy. Union preferences are tilted towards different forms of pay (for example,
protecting retirement and health care plans) and its concern with job security affects
pay strategy greatly (Ejiofor & Yerokun, 2013; Gberevbie, 2013).
3.8.2 Step 2: Map a Total Compensation Strategy
In developing a compensation strategy, there is a need to map together the compensation
strategy model? Objectives and the four policy choices of alignment, competitiveness,
contributions and management must be merged together.
3.8.3 Step 3: Implement
This is the step in which the strategy is implemented through the design and execution of the
compensation system. Here, the compensation system translates strategy into practice that
invariably translates into people’s bank accounts.
3.8.4 Step 4: Reassess
This is the stage at which reassessment and realignment closes the gap and is where the
compensation strategy recognises that it must change to fit changing conditions. Thus, the
essence of this periodic reassessment is to give room for continuous learning, adaptation and
improvement. The results from using the pay system need to be assessed and reassessed
against the objectives the organisation is trying to achieve. This is summarised in the figure
below

51
Figure 3.4: Key Steps in Developing a Total Compensation Strategy
Source: Milkovich et al., (2011:43)
3.9 DETERMINANTS OF COMPENSATION
Henderson (2006: 27-33) gives some critical or basic reasons underlying the differences in
pay and of compensation. Packages for different employees relate to the following thirteen
correlates or determinants. Notably, though each of these correlates is relatively simple and
straightforward, but like most factors influencing compensation decisions, their interactions
can become difficult to follow and understand.
3.9.1 Knowledge and skill
The kind of job the employee performs is the most important factor influencing the rate of
pay. In determining pay for a job, no single factor is more significant than the knowledge and
skills required or possessed by the job holder (Dulebohn & Werling, 2007; Ida & Ali, 2010).
For instance, pay for unskilled workers that perform relatively mundane, everyday tasks that
make life more meaningful and acceptable for most people is relatively different from pay

52
associated with workers that are highly skilled. Knowledge and skill are not only the
determinable factors used for job pay, other factors such as working conditions, effort, and
even seniority also affect the rate of pay (Atkinson, 2007).
3.9.2 Kind of business
The type of business is one of the significant factors that influences the amount received by
job holders. In many cases, the private sector businesses provide higher rates of pay than the
public sector of the economy (Jaiswall & Firth, 2009; Chen, Hsu & Chen, 2014).
3.9.3 Union-Non-union status
The businesses that are unionised receive higher rate of pay than those that are non-
unionised. The Nigerian situation is that the employees of the public sector are allowed to
belong to unions thereby giving them the opportunity to demand higher pay but in the case of
private businesses, unionism is prohibited (Long & Shields, 2009; Malik, Basit & Qazi,
2011).
3.9.4 Capital intensive versus Labour intensive
Business that requires low labour costs relative to revenues pay the employees higher
(Menezes-Filho, Muendler & Ramey, 2008). The labour intensive organisations are in need
of the service of large numbers of low skilled and unskilled workers. Hence, the rate of pay to
these set of workers is very low but as businesses become more capital intensive, applying
newer and sophisticated technology and processes, the required number of employees are
reduced. Ironically, these employees must possess higher knowledge and skills on the job,
which in turn means demand for higher pay rates (Menezes-Filho et al., 2008; Helpman,
Itskhoki & Redding, 2010).
3.9.5 Size of business
The size of the business is one of the determinants of compensation or pay rates. Larger
businesses offer higher pay rates than smaller businesses. The issue of profitability and
unionisation are usually and frequently tied to the organisation’s size. The demand for
products often leads to increase in the business size. For psychological reasons, the more
profitable a business is, the more likely it is to share some of its profits with the employees by
increasing the pay rates (Lluis, 2009; Shah, Javed & Abbas, 2009; Cao et al., 2012; Kashif &
Mustafa, 2012).

53
3.9.6 Management philosophy
The philosophy of management in deciding pay rates is also crucial in compensation
decisions. Some business owners and top executives are having the conviction that their
employees should be paid highly as much as possible whereas others hold a different view
and these biases has a definite impact on the amount of pay offered and given to employees
(Van der Merwe, 2009; Yau, Chun & Balaraman, 2009).
3.9.7 Total compensation package
The total amount to be received by the employee is also important when it comes to term of
determining the pay rate. Base pay or annual pay has been used to analyse the compensation
packages of employees. However, with the passage of time, this kind of comparison has
become less and less useful because employees have become interested in knowing their
employer’s pension scheme, medical allowances, meal subsidy and other benefits. In today’s
world, employees have significant interest in and knowledge of their compensation packages
which relates to the real worth and value of their major components (Goergen & Renneboog,
2011).
3.9.8 Geographic location
The geographic location of the job is also a serious factor to be considered when determining
compensation or pay rates because employment and unemployment do not affect all sections
of the nation equally. Some states in Nigeria like Lagos, Rivers, Abuja (FCT) and oil
producing states pay higher rates than others do (Xavier, 2014).
3.9.9 Supply and demand of labour
The rate at which labour is being supplied and demanded is widely used to determine the pay
rates of employees. In times of high unemployment, individuals with certain skills or abilities
are in great demand and sometimes the demands are in specific locations, at other times, and
they are national in scope.
3.9.10 Profitability of the organisation
Organisations with high levels of profit have the tendency of paying higher rates to their
employees than those organisations with low profits. The profitable organisations use high
rates of pay to attract, hire, and retain the best employees by paying them above the existing
pay rate in the markets.
54
3.9.11 Employment stability
Job security is important when it comes to determining or making decisions as regards pay
rates since employees become more concerned with the continuation of their employment
especially during periods when the workforce is being reduced in size. Psychologically,
employees want to know that their jobs are highly secured for as long as they want.
Employees who have the feeling that their jobs are permanently secured are often willing to
accept lower pay, on the understanding that the pay check will be there as long as the
assignment is performed in the most acceptable manner.
3.9.12 Gender and demographic differences
Gender and demographic differences is another factor that is considered in determining the
compensation package. In most cases, the gap between male and female rates of pay has been
a major cause necessitating advocating for women’s rights. There are some jobs that are
exclusively meant for men without women being given the opportunity to prove their worth.
Many a times, age and height are used to determine who picks a job and how much they will
be paid.
3.9.13 Employee tenure and performance
When determining pay rates by using various composite data, it is very difficult to separate
two critical employees’ differences, that is, tenure and performance. Most often, the low-
level rate used with minimal-skill jobs become more valuable as the length of service
increases. Individual performance or contribution also goes a long way in determining the
pay received by employees or incumbents in similar jobs. Both senior employees and high
performing employees have the opportunities of enlarging the jobs and increasing their value
to the organisation as well as expecting higher pay rates.
Werner and Ward (2004) summarise compensation determinants into 12 categories as
follows:
3.9.14 Environmental determinants
This covers the effect of legal environment, business environment, and industry on
compensation. In Nigeria, this includes minimum wage, arbitration statutes, prevailing wage
laws, layoff legislation affecting wages, benefits and employment. The business environment
also covers how economic factors, technological change, global competition, environmental
uncertainty, expected inflation, unemployment risk, and unionisation of employees

55
determines wages or incentives. The industry environment talks about wages at both the three
tiers of government in Nigeria, that is, federal, state and local governments. All studies done
in this area, paid attention to wages, and overlooked other components of compensation such
as bonuses, benefits, deferred compensation etcetera. (Gerhart & Rynes, 2003).
3.9.15 Firm determinants
The firm as a determinant of compensation embraces the effects of firm practices, firm
unionisation and other firm characteristics on compensation. Several studies like Yayla and
Hu (2008), Yoshikawa et al., 2010, and Colpan and Yoshikawa (2012) have checked on how
the firm practices like high performance, work practices, strategic orientation, diversification
strategy, outsourcing, and human resource practices, which have affected wages, incentives,
pay dispersion, pay systems and slashing of pay (Crisitini, Eriksson & Pozzdi, 2013;
Divkolaii, 2014). Other firm characteristics, which have influenced wages and pay plans,
include employee ownership, the firm size, ability to pay etcetera. Werner and Ward (2004)
conclude that not much has been done in researching to how human decision processes (for
example, compensation committee effects, implementation effects, and compensation
strategy formulation) have affected compensation (Rynes & Bono, 2000).
3.9.16 Job and group determinants
This covers how job factors, job changes and group factors have affected compensation. Job
factors that have influenced job ratings include job traits, job elements (supervisory
responsibility, work shifting, and computer usage), job tasks, job requirements, job
contingency, that is, contract labour, job centrality, seniority on the job, job payment
procedures and job overhauling (Werner & Ward, 2004). Considering the group factors such
as group size, lack of quality measures and management participation, it is revealed that they
have affected the use of group incentives (Cloutier, Morin & Renaud, 2013). However, this
area of study concentrated on job and individual wages paying little attention on other
features of compensation. Furthermore, not much has been done in the area of pay differences
between various groups of employees, and how the pay discrepancy should be between
production workers, service workers, supervisors, middle-level managers, etcetera. (Rynes &
Bono, 2000).

56
3.9.17 Gender and race determinants
Gender and race have been used as factors in analysing wage differences among employees
(Werner & Ward, 2004). The wage differential has been measured based on historical
antecedents, industrial and market survey. Factors that regulates the relationship between
gender and earnings include external labour market schemes, family reputation, education,
affirmative action, productivity, promotions, access to power, marriage, children, training and
development, mentoring, and the power to negotiate well (Kulich et al., 2011). In the case of
race, and remunerations, it is revealed that the moderating factors comprise of occupational
choice, productivity, education, labour force attachment, employer monitoring, language, job
tenure and experience. Other relevant studies ventured into race differences in employment,
search for job, layoffs, promotion, performance ratings, full-time wage premiums, union
wage premiums career length, etcetera., and suggestions for further research are offered in
respect of other aspects of compensation that go beyond wages (Gerhert & Rynes, 2003).
3.9.18 Individual determinants
The individual determinants of compensation are considered to be behavioural, experiential
and individual characteristics. According to Werner and Ward (2004) and Folger and
Salvador (2008) the behavioural determinants that have significantly impacted on pay include
social skill, task performance, and etcetera. Contrary to this, leave of absence, cigarette
smoking, and career differences are having a negative impact on the pay levels. Under the
experiential determinants of pay, factors that are considered include tenure, education, school
grades, training, developmental programmes, language proficiency and length of experience
etcetera. Other characteristics that are having a bearing with pay level are sexual orientation,
mental illness and so on. Gender and race are often used in the analysis of controlling or
moderating variables (Dreher, Lee & Clerkin, 2011).
3.9.19 Individual outcomes
Individual outcomes of compensation as a determining factor pay level entails variables like
job satisfaction, greater performance (quantity not quality), less rate of labour turnover for
high performers, greater employment stability, reduced absenteeism and greater risk in taking
decisions (Werner & Ward, 2004). It has been established that higher pay levels relates to
outcomes, such as lower turnover, greater job acceptances, changes in gender roles and
outstanding performance of experienced workers. It is argued that monetary incentives have a
significant influence on performance (Gerhert & Rynes, 2003; Werner & Ward, 2004).

57
3.9.20 Compensation psychology
In this aspect, pay satisfaction, motivation, the interpretation of money, and the psychological
response to compensation are construed as determinant factors. In relation to pay
satisfaction’s relationship to life satisfaction, sex, unionisation, firm type, turnover intent,
professional tenure, career stage, organisational citizenship behaviours as well as
measurement issues are adopted. Motivation as a factor indicates that individual incentives
have a positive connection with work motivation (Chaudhary, 2012). Quite a number of
studies (e.g. Mathis & Jackson, 2011; Manzoor, 2011) have dealt with how individual view
money in relation to demographic, attitudinal and behavioural variables. As part of their
research outcomes, Werner and Ward (2004) argue that viewing psychological reactions to
compensation, a favourable consideration is given toward utility analysis, applicant
attraction, choice of decision making as regards the job, employee attitudes, job and family
satisfaction, substantial pay increase and time allocation/management.
3.9.21 Organisational justice
Discussing organisational justice as an index in determining compensation, equity
(distributive justice), procedural justice, and ethical matters on compensation have been made
to be the subject of discussion. The equity aspect deliberates on the effects of equity
understanding (performance, job satisfaction, and turnover intent), equity effects
(performance, job satisfaction, turnover, remuneration apportionment, physical health,
psychological health, intent to look for job), and equitable performance procedures (Werner
& Ward, 2004). The findings by Werner and Ward (2004) show that there is a correlation
between procedural justice and views of distributive justice (reward plan understanding, plan
effectiveness, organisational commitment, job satisfaction, intent to remain, and performance.
The ethical issues give attention to the relationship that exists between compensation-related
variables such as commissions, incentives or benefits, equity sensitivity, and stealing while
the various business ethics variables deal with misrepresentation, self-sacrificing, ethical
intentions, ethics programmes, and moral development (Guillén, Ferrero & Hoffman, 2014).
3.9.22 Firm outcomes of compensation
This focuses on the firm-level effects of pay, firm-level effects of individual benefits, and
firm level effects of group inducements plans. The firm-level effects of pay comprises
organisational performance (negatively related to pay distribution which is curbed by
individual incentives and interdependence, positively related to skill-based pay), costs
58
(negatively connected to overtime use), financial influences (connected to pay level), and
sales growth (positively connected to pay level (Werner & Ward, 2004). Firm-level effects
connected to individual incentives capture sales, customer satisfaction, profit, performance,
and revenues (Shieh, 2008). Those connected to group incentives capture division incentives,
gain sharing, and stock-based and profit-sharing schemes.
3.9.23 Benefits
This pays attention to the usage of benefits, benefit satisfaction, and effects of different
benefit schemes. Concentration has been on how elements like firm objectives, cost,
unionisation, employee attitudes, wages, and anticipated benefits affect the use of different
benefits and schemes (for example, flexible schemes, pension scheme types, employees’
compensation, health insurance, disability retirement, and early retirement schemes). On the
other hand, employee benefit satisfaction reveal that its backgrounds consist of age, race, and
transaction cost factors, benefit choices, preferred benefits, while high benefit satisfaction
causes less behavioural withdrawal, less turnover and higher organisational commitment
(Khan et al., 2011). Effects of benefits and benefit schemes (pension brand, health insurance,
breaks, paid time off, early retirement, etc.) are associated with retirement wealth, economic
wage pressures, employee movement, search activity, productivity, organisations
performance and turnover (Weibel, Rost & Osterloh, 2010).
3.9.24 International compensation
This compensation determinant factor delves into the comparison aspects of compensation
amidst two or more countries, especially compensation schemes of multinational corporations
(MNCs). This comparison views compensation from the angle of wage inequality, union
wages, pay structure, wage systems, incentives, gender wage gap, and reward expectations
(Cox et al., 2010; Singh, Mohamed & Darwish, 2013).
3.9.25 Executive compensation
This is carried out by analysing what it is that determines the executive pay levels. It has been
established that executive pay levels are influenced by firm performance, organisations size,
novelty (in high-technology organisations), past pay, managerial decision, external versus
internal successors, human capital, organisational growth, and engaging consultants
(Pennings, 1993; Murphy & Sandino, 2010; Goergen & Renneboog, 2011). Executive pay is

59
also fixed in connection with consequent organisational performance, strategic changes and
strategic refocusing (Jaw & Lin, 2009; Callan & Thomas, 2011).
3.10 MERITS AND DEMERITS OF COMPENSATION
Before an organisation embarks on compensation decisions, the cons and pros must be
considered. Taking into consideration the merits and demerits of compensation enables the
organisation to achieve its set goals that enhance its competitive advantage.
3.10.1 Merits
According to Hills et al., (1994: 15-19) some of the merits of compensation are as follows:
To influence the employment behaviour of individuals who participate in the labour
force and to make personal decisions that is aligned with the organisation’s needs in
the sense that organisations use compensation package to motivate people to join the
organisation since labour is an essential requirement in the production process.
To motivate employees to stay with the organisation. This is done through the
intrinsic rewards from the job itself.
To achieve high level of performance from individual employees beyond the
minimally acceptable levels.
To enhance competitive advantage over other organisations within the same industry
in the sense that when individual employees are motivated through compensation
package, it leads to organisational performance.
To accomplish the organisation’s strategy because compensation strategy is anchored
around the organisation’s mission, vision, and objectives.
Enhances commitment and dedication from the employees when they are highly rated
and influences the attitude of leaders and their style in treating the employees well.
3.10.2 Demerits
The demerits of compensation can be looked at from the constraints angle, how it affects the
goals of motivating the employees in putting up certain behaviour that meet the needs of the
organisation as relating to performance.

60
Hills et al., (1994: 19-22) identified five major principal constraints that organisation’s
face when it comes to the compensation system. These constraints are explained below
Ability to Pay: The ability to pay is a veritable factor when it comes to determining
what to pay. This varies from organisation to organisation and from one industry to
the other. The competitive nature of the product market results in the shrinking of the
profit margins, which restricts the discretion of the organisation in the area of
compensation. Irrespective of the intentions of management, the product market may
determine the level of compensation that the organisation is willing to pay even
though the organisation is using sophisticated technology and is more creative.
Legal Constraints: The legal framework that exists within the domain at which the
organisation operates is a major constraint to the compensation system. The law may
require minimum wage, retirement age, occupational accident compensation and the
compensation manager must work within the arms of the law. In Nigeria, the
minimum wage law that was enacted in 2011 was N18, 000 (Eighteen thousand naira)
which is equal to ZAR1, 125 with many organisations claiming that their finances
cannot meet up with this wage bill.
Collective Bargaining: The activities of the union in bargaining for more
compensation cannot be overemphasised. It has been a major constraint because the
law requires a process of bargaining between the union members and their employer
which in terms of Cox ‘‘is a zero sum game’’ which means that the two parties must
agree on what is to be paid through the process of negotiation.
Internal Labour Market: This involves all jobs within the organisation, and how these
jobs relate to one another. There are entry levels to a job in organisations, then other
jobs into which employees can move into after the entry-level positions. Movement to
these high-level jobs is managed and controlled by rules and procedures within the
organisation. This automatically affects the compensation system.
External Labour Market: There is a market place at which all employers of labour
must bid for labour. The individual prefers to work for high money rather than for less
money, hence employers try to pay competitive wages. Organisations try to pay the
going market rate to the employees to motivate and retain them but in reality, this is
not often achieved. However, the employers might be willing to pay the market rate
but the ability to do so might not be there.

61
3.11 COMPENSATION THEORIES
Compensation management is not a new field of study in management, economics,
psychology and even sociology and many theories have been formulated as regards
compensation management (Jensen & Meckling, 1976, Fama, 1980; Fama & Jensen, 1983)
and one of such theory is agency theory.
3.11.1 Agency theory
The agency theory states that agency costs arise from the conflict of interest between the
principal and an agent. This conflict results for example, when managers, who are responsible
for major decision of the firm and employees who are responsible for the revenue generation
of the firm, are not primary claimants of the firm’s assets and thus do not beer a major share
of the wealth. It thus affects their decisions and productivity.
Jensen (1994) in his contribution to agency theory stressed that:
Managerial decisions on compensation that are often designed to strengthen
organizations are met with opposition from colleagues, employees and other
stakeholders providing managers with incentives to compromise their decisions.
Compensation plans should be designed so that managers have sufficient incentives to
make decisions that maximize shareholders wealth, motivate employees to greater
efficiency, and thus reduce the manager, employee shareholder agency problem.
Lewellen, Loderer and Martin (1987) found evidence that compensation packages are at least
in some respects, designed such that agency costs are reduced. Agency theory states that if
compensation management reduces agency costs, or is believed by shareholders to do so, the
adoption of a compensation package by a firm should result in an increase in shareholders
wealth as well as motivate employees which will lead to improved firm performance.
Larkin, Pierce and Gino (2011) in their research tagged “the psychological costs of pay-for-
performance: implications for the strategic compensation of employees” argue that the
agency theory do not incorporate strategic compensation choices by firms for non-executive
employee, that is, the concentration of agency theory is basically on executive pay. Larkin et
al., (2011) also submitted that agency theory predicts the adoption of individualised
performance-based pay which is more frequent than the non-executive employees, and it was
concluded that agency theory often fail because of performance-based pay which is less
effective in nature.

62
In another dimension, Kwak and Lee (2009) contend that agency theory is about conflict
resolution between the employer (owner) and employees (agent). It is said that the theory
focuses on determining what mostly governs the principal-agent relationship based on
assumptions about people (like self-interest, averting risks), organisations (like goal conflict
among members), and information (like information is a commodity which can be purchased)
(Kwak & Lee, 2009).
In a bid to proffer solution to the agency problem, two strands of solution were offered by
Bebchuk and Fried (2003) namely optimal contracting and managerial power approaches.
They submitted that with the approach of optimal contracting, well formulated compensation
scheme will furnish managers with adequate or efficient incentives to maximize shareholder
value (e.g. Jensen & Meckling, 1976; Jensen & Murphy, 1990). In a nut shell, a well-
constructed financial compensation is a major way of providing solution in the optimal
contracting view but the managerial power approach views compensation scheme as a
problem in itself. From the point of view of the managerial power approach, compensation is
not considered as a crucial solution to agency problems, but seeing it as a problem in itself.
Hence, managers are perceived to be capitalising on compensation by treating it as a form of
power or authority, and many at times abuse it or use it in a wrong way (Bebchuk & Fried,
2003; Kwak & Lee, 2009).
Similarly, Larkin et al., (2011) argue that agency theory explained that compensation is
strategic because the firm uses compensation scheme that maximises profit based on its
unique costs and benefits. It was further stressed that in agency theory, costs comes up as a
result of the differences between firms and employees in two important areas: objectives and
information. Under the objectives, the basic tension in agency theory comes from the
differences in both the firms and employees objectives. Profit maximisation is the primary
objective of the firm and subsequent increase in compensation draws down profitability but
motivates employee’s effort, attracting competent and highly skilled employees thereby
increasing wage costs while on the other hand, employees seek to maximise utility. It was
concluded that reviewing compensation affects utility through income increase, and
employees must maintain a balance utility from income with cost of increasing effort.
Therefore, agency theory argues “that effort is costly to employees at the margin; employees
may intrinsically enjoy effort in small or moderate levels, but dislike increases at higher
levels” (Prendergast, 1999; Lazear & Oyer, 2011).

63
In the case of information, Lazear (1986); Lazear & Oyer (2011) opined that there are two
information asymmetries, (i) the worker knows more than the firm, drive compensation
choices in agency theory. Workers therefore know their own effort exertion and level of their
skill. (ii) The firm only possess imperfect information about both. The submission of agency
theory is that firms can overcome these asymmetries through adequate incentives for workers
to put in more effort as well as self-select by skill level. For instance, giving a low assured
wage with a large performance element, a firm can incentivise higher effort from all workers,
hence; it can be engaged for attraction and retention of highly skilled workers while “weeding
out” those workers with low skills.
3.11.2 The Equity Theory
Armstrong (2003: 223) stated that equity theory is concerned with the perceptions people
have about how they are being treated as compared with others. Equity involves feelings and
perceptions and is always a comparative process. Armstrong (2003: 223) stressed further that
equity theory states in effect, that people will be better motivated if they are treated equitably
and demotivated if they are treated inequitably. It explains only one aspect of the process of
motivation and job satisfaction, although it may be significant in terms of morale.
Armstrong (2003: 223) quoting Adams (1965) suggested that “there are two forms of equity:
distributive equity, which is concerned with the fairness with which people feel they are
rewarded in accordance with their contributions and comparison with others; and procedural
equity or procedural justice, which is concerned with the perceptions employees have about
the fairness with the company procedures in such areas as performance appraisal, promotion,
and discipline are being operated.
Adams (1965) in equity theory of pay stated that inequity exists for persons whenever he
perceives that the ratio of his outcomes to inputs and the ratio of other’s outcomes to others
inputs are unequal. That is, either the ratio is
i.
From the formula above, the contribution of both employee A and employee B are equal and
their reward is also at par may be as a result of them having the same skills, talents, efforts,
education which they brought in to the job. The two of them receives the same reward, they

64
are well motivated and hence having pay satisfaction which will induce them to put more
effort to attain the goals of the organisation, thereby reducing absenteeism, reduction in
labour intent, more commitment and loyalty to the objectives of the firm.
ii.
This is when the reward of employee A is greater than that of employee B which may due to
the fact that employee A possess more skills, well educated, does his work with little or no
supervision, punctuality at work is high, ready to take more risk and more committed to the
goals and aspirations of the firm than employee B whom they were employed the same day
and this automatically leads to employee A being overpaid than employee B. This eventually
will cause dissatisfaction on the part of employee B which might demoralise him thereby
reducing his productivity level, not being faithful to the course of the firm (Cropanzano,
Rupp & Byrne, 2003; Edelman & Larkin, 2009; Gino & Pierce, 2010).
iii.
This is the converse of situation II which leads to inequitably underpaid of either of the two
employees which may brew-up tension. This may induce any of the workers who are
inequitably underpaid to increase his performance level. If he had the perception that his
action will automatically improve his take home pay and if not, he may put in nonchalant
attitude toward his work by reducing performance. Hence, he engages in job moonlight,
search for more equitable and rewarding job or quit the job thereby increasing the rate of
labour turnover (Schwarzwald, Koslowsky & Shalit, 1992; Nosenzo, 2010; Cohn et al.,
2011).
Outcomes refer to rewards such as pay/income which person receives for performing his job.
Inputs are skills, talents, age, education, efforts etc. that person brings to the job. The above
situations may occur;
1. When A and B are in direct exchange relationship as employee – employer or
65
2. When both are in an exchange relationship with a third party and A compares himself
to B. There are two clear cases from above (i) a situation of equity, (ii) and (iii) is a situation
of inequity. Inequity brings about tension, which the person acts to reduce the level of
inequity by acting in variety of ways. For instance an inequitably underpaid worker may
increase performance if he perceives that such action will improve his payment, otherwise he
may reduce performance, moonlight, search for more equitable job or quit.
In summary, equity theory suggests that motivation is moderated by the perceived fairness or
discrepancy between personal contributions and rewards, relative to what others receive.
There are two major dimensions to the equity process:
(1) Ratio of personal outcomes to inputs, that is, equity is the ratio of output to inputs.
(2) External comparisons
Comparisons to specific other individuals, this is the comparison done by employees to
those doing similar task in other firms that are rendering the same services as their own
organisation does, that is, external comparisons is done in relation to external equity or
competitiveness (Milkovich & Newman, 2005).
Comparisons to another reference group, this contrast are carried out by employees with
those that execute the same responsibility in other industries and those that possess the
same qualification, same experience, knowledge, and the same task involvement
(Milkovich & Newman, 2005).
Comparisons to generate occupational classifications, this kind of comparison is embark
upon to bring in that one discipline or occupation is of more importance than the other
within the same organization or externally. The employees may adopt the usage of
other inputs, both job-related and non-job-related for comparison which refers to as
general comparison (Cook & Hunsakers, 2001:218, Williams, McDaniel & Nguyen,
2006).
3.11.3 Bargaining Theory
Barcharach and Lawler (1981), Høgsnes (1989), Bárcena-Ruiz and Campo (2010) strengthen
the work of Davidson (1898) that bargaining situation consists of two parties that are
involved in conflict of interest in determining the wage level within the firm. The gain and

66
losses in the process of negotiation between the employer and employee is a function of the
bargaining strength each of the parties possesses. In similar view, Traxler (2010) argue that
bargaining theory is based on the strength of collectivism through organized interests of the
union that negotiates collectively on behalf of their union members in an organized business
environment. This simply means that how much is paid to workers is a function of ability to
negotiate or bargain whether as individual or represented by union. With increased
sophistication, and education the bargaining power of a union will increase and also their
ability to win better concession from management will be enhanced. The modern trend in
collective bargaining however is towards greater co-operation, understanding and caution.
Raw bargaining power is opposing to peaceful Industrial Relations. It cannot be disputed
however that concessions are won on the collective bargaining table especially in a com-coin
situation (Obisi, 1996).
3.11.4 Behavioural Wage Theory
This theory was based on the Hawthorne experiments conducted by Elton Mayo in 1930 at
the Hawthorne factory of the Western Electric Company in Chicago where he studied the
effect of illumination and working conditions on the productivity and behavioural pattern of
two groups of women employees. He thought that there will be a reduction in the productivity
levels as the illumination or other working conditions became worse with time. The result of
his experiment shows that whatever the changes in illumination of the environment or
working conditions, there is an improvement in the employees productivity levels. In
conclusion, Elton Mayo said that workers are best motivated as noted by Riley (2012):
• Better Communication: That there is a better level of communication that took place
between the managers and the workers through the consultation held with the
Hawthorne workers as well as having the opportunity to give feedbacks about the
experiments which enhances the productivity, behaviour and remuneration package of
the workers.
• Greater Manager Involvement: The managers were greatly involved in the employees
working lives, that is, the managers paid great attention to the employees working live
by providing better working environment as a result of the Hawthorne experiment.
• Working in Groups or Teams: Before the Hawthorne experiment, the workers do not
have team spirit or working together regularly which was achieved after the

67
experiment and brings about greater performance. Through the experiment at
Hawthorne, it was found out that it is not money only that motivates employees, the
behaviour of the employees has a linkage to their attitudes and it was concluded that
the needs and motivation of employees becomes a paramount focus of managers
within the organisation to provide necessary satisfaction and motivation to the
employees so that there will be an enhancement in organisational performance
(Dickson, 1973; Bedeian, 1993).
The results from the Hawthorne studies led by Mayo (1930) further gave several insights into
human behaviour at work. In addition, the works of Maslow (1943) Herzberg (1966), Opsahl
and Dunnette (1966) have shaped management’s thinking and orientation about human
motivation and satisfaction at work. Incentive, intrinsic (e.g. non-financial) and extrinsic (e.g.
financial) are now applied in a bid to help workers fulfil basic needs in addition to having
healthy attitude and morale in the work place. Organisations now reward worker in a way that
they are satisfied with job condition and hence stay longer and produce more.
3.11.5 Expectancy Theory of Wage
Vroom’s (1964) Valence Instrumentality-Expectancy (VIE) Model has served as a rich
source of theoretical innovation in domains such as organisational behaviour and
compensation. The theory stated with reference to compensation, it can be read to mean that a
worker with subjective probability (expectancy) that a particular course of action will bring
about reward (pay) will act to acquire pay for as long as the valence (value) of pay is strong
for him. Pay, this serves as instrument for bringing about action (effort) tendencies aimed at
targeted reward. To act is to reason that the action will bring desired outcome and the
outcome must have a strong value (valence) for him. Thus pay assumes the use of valence
because it has instrumental power for gaining other desired outcome in life e.g. meeting of
physiological, (food, shelter, clothing) social esteem and other needs. Compensation is thus a
useful tool in bringing about desired behaviour (performance, punctuality, commitment at
work). Essentially, for workers to exert alert;
The outcome must be attractive i.e. have valence (value) for him and
He must be sure that his effort will lead to desired outcome.

68
In the studies conducted by Kim (2006) as well as Sloof and Praag (2007) they identified
three different factors that play an important and interactive role in compensation scheme and
motivation. The first factor is effort-performance (E-P) expectancy, this is about the
perception of individual’s that effort is correlated with performance positively; the individual
will be motivated to exert effort when the E-P expectancy is high. The second factor is
referred to as performance-outcome (P-O) expectancy, this is also known as instrumentality.
It also deals with a person’s expectation that his remuneration is closely associated to his
performance level. This also depicts a positive effect on the individual’s motivation to exert
effort. The third factor is known as valence which is the degree to which individual values a
particular reward. This also shows that the higher this factor is, the tendency is that individual
will be more motivated. Sloof and Praag (2007) argue that expectancy theory brings out three
crucial instruments that employers should engaged to boost employee’s motivation: (i)
increasing the subjective expectations that greater effort will enhance greater levels of
performance (E), (ii) broadening and enhancing the perceived link between performance and
reward (I), and (iii) ascertaining that employees value the rewards given for high performance
(V). These three factors are referred to as the VIE- factors.
Similarly, Şafakli and Ertanin (2012) opined that expectancy theory is one of the important
ways that a manager can use to motivate employees and the emphasis is on equitable wage
being giving to them in correlation to their performance that will cause greater organizational
efficiency and performance. They aligned their submission with Vroom’s awarding
expectation and fair awarding systems theory which states that if the individual expectations
are positively related with the performance growth, the individual employees will manifest
great interest, be committed, diligent and work more tenaciously with elevated motivation.
3.12 HISTORICAL ANTECEDENT OF COMPENSATION MANAGEMENT IN
NIGERIA
The issue of compensation management (salaries and wages review commission) is not a
recent phenomenon in Nigeria and has not come into being overnight. A lot of struggles and
agitation have taken place for a major reformation and review of salaries of employees in
Nigeria notably in the public sector (Dibie, 2003). The review of salaries has been undertaken
by various administrations in Nigeria and in order to have a standardised salary scale
structure, boards and commissions has been set-up through an act of parliament and military
decrees (Dibie, 2003; Aminu, 2011).
69
Kester (2006), Adeoye, Elegunde, Tijani and Oyedele (2012) emphasise on wage review and
bodies of commissions that were set-up with the mandate to recommend to the government
ways to improve the compensation that is being paid to the employees. Morgan commission
of 1964 concluded that there is machinery for reviewing wages on a continuing basis and that
they cannot conclude because of the close inter-relationship between wages and other
conditions of employment. The Adebo commission of 1971 came into existence because of
the failure of Morgan commission (Dibie, 2003). The employers in the private sector of the
Nigerian economy had each a collective bargaining mechanism and mostly revised their
wages and salaries since 1964 while the public sector had no such mechanism of negotiation,
as a result of this, wages and salaries had been stagnant since 1964 (Dibie, 2003).
The interim report of Adebo commission of 1971 was accepted by the Federal Government
and the Government issued a statement that employers who had not reviewed their wages and
salaries since 1964 to the tune of 1/7d (16kobo) per day for daily paid workers and £2 (40
Nigerian Naira) per month for the monthly paid up to a minimum of £500 (1000 Nigerian
Naira) per annum should do so (Yusuf, 1984; Anazodo, Okoye and Chukwuemeka, 2012).
The industrial wages board was set up by decree No. 1 of 1973 under former military
government headed by General Yakubu Gowon retired (Fapohunda, Atiku and Lawal, 2012).
This came into force on October 1, 1974 which gave the Federal Commissioner for Labour
the prerogative power to perform the function of regulating the wages and other conditions of
employment in the public sector, if he is of the view that wages are considered unreasonably
minute or that no adequate machinery exists for the effective regulation of wages and other
conditions of employment of those workers (Dibie, 2003).
Another board that was established by decree is the National Wages Board (Fapohunda et al.,
2012). The power to establish this board was vested on the Federal commissioner for Labour
and the functions of the board include:
to examine the application to all unskilled workers of any agreed minimum wage rate
in any specified area.
to examine from time to time the adequacy of minimum wage rate for unskilled
workers in the light of any recommendation received from the area of minimum
wages committees.

70
to consider any matter referred to it by the commissioner with reference to the
minimum wage rates of unskilled workers in any area for which the minimum wages
committee has been set up and,
to report and make recommendations accordingly to the commissioner for labour.
Other commissions have been established which include Udoji commission of 1974, Philip
Aseidu commission during Shagari administration from 1979 to 1983. The Udoji commission
of 1974 was a fundamental one which pays attention on the big question of improving
efficiency and effectiveness in the Public Service with the view of meeting the challenges of
a versatile and development-oriented society. Amidst the recommendations of the
commission was Unified Grading and Salary Structure (UGSS) which will serve as an
umbrella for all positions in the Civil Service from the lowest to the highest position (Grade
Levels 01-17) and create room for equal chances for officers to grow and advance to the peak
in the Service, irrespective of their specialisation and provided they possess the requisite
qualification and experience that will take them there (Yusuf, 1984).
The Udoji commission (1975) emphasised broad relativities in rating and reward for all jobs.
The commission also suggested the usage of merit as a major apparatus for deciding the
advancement of officers in the Civil Service. The commission unequivocally suggested a
structured salary scale that would generally be applicable to all the strata’s in the Federal and
State Civil Services, the Local Government Services, the Armed Forces, the Nigerian Police,
the Judiciary, the Universities, the Teaching Services and other Parastatals. The commission
also advocate the need to guarantee that all Public Service employees have access to
justifiable treatment on pay and remunerations in such a way that no individual constituent of
the public sector would be at a disadvantage as regard recruitment and retaining of
employees. The commission also adopted five guiding principles for Nigeria’s Public
Service Compensation Plan as follows (Dibie, 2003)
Principle 1: There will be no segregation on the basis of ethnic origin, social class, or
geographical location, or conditions in establishing rates of remuneration package for job, the
performance of which requires the same knowledge, difficulty, responsibility and effort under
similar employment conditions;

71
Principle 2: The realisation of pay and benefits comparability between the public and private
sectors;
Principle 3: A reimbursement arrangement and suitable organisational structures and
patterns of service would give room for salary progression through career development,
through the assumption of work of great challenges and task, with a continuing requirement
for proficiency and efficiency;
Principle 4: A rewarding system that will give chances for salary upgrading at all levels,
based on the merit ideology;
Principle 5: Salary structures and rates of compensation for senior management and senior
supervisory positions would be adequate and reasonable in relation to those of subordinates
in order to ensure that the recruitment, retention and motivation of highly skilled, competent
and qualified personnel.
Among other things, the commission also advanced that the salary structure must pay
adequate attention to job content; room for career development; link public service pay and
benefits to those provided for equivalent employed and pay levels in the private sector; and
provide more equitable benefits and conditions of employment across the entire spectrum of
public service employment. The basic annual salary of the highest paid civil servant was
supposed to be N15, 000 per annum, while that of the lowest paid civil servant was N1200
thereby resulting in a compression ratio of 12.5:1. One of the counter attacks of the Udoji
Commission was the official backdating and subsequent implementation of the recommended
increases in wages and salaries (which ranged from 12 to 30 per cent) and generated an
inflationary spiral during the period (Anazodo et al., 2012).
The most recent development about salaries and wages review was under the administration
of late General Sanni Abacha where he approved of N2, 500 (ZAR162.34) minimum wages
in the public sector and the last military regime under General Abdulsalami Abubaker who
announced the minimum wage of N7, 500 (ZAR487.01) per month (Aiyede, 2002; Aminu,
2011).
At the inception of Obasanjo administration in May 29, 1999, he inherited this N7, 500
(ZAR487.01) minimum wages and he renegotiated with the Nigerian Labour Congress

72
(NLC) that there will be a yearly increment of 25% of the minimum wage which he did not
fulfilled. Equally, the Late President Musa Yar’adua signed into law N18, 000 (ZAR1,
168.83) minimum wages for Nigerian workers in 2008 (Eme & Ugwu, 2011).
3.13 LEGAL FRAMEWORK ON COMPENSATION MANAGEMENT IN NIGERIA
(EMPLOYEE’S COMPENSATION ACT 2010)
In any society, for fairness to be achieved, there must be rules and regulation that is in
operation to guide the behaviour of people, organisational entities as well as the government.
In respect of compensation management in Nigeria, the decision of how much to pay
employees in the private sector is exclusively in the hand of the business owner or the
management of that organisation. Most importantly, the Federal Government of Nigeria has
set a benchmark of N18, 000 (ZAR1, 168.83) as the minimum wage.
To enhance the benefits of Nigerian workers, the Federal Government of Nigeria also passed
into law the Employee’s Compensation Act, 2010.
Employee’s Compensation Act, 2010 supersedes the Workmen’s Compensation Decree of
1987 and 2004 that stipulates that all businesses must provide Employee’s Compensation
coverage for the benefit of the employees who may be injured or incapacitated while on the
job. This is a requirement of the law in Nigeria.
Employee’s Compensation Act, 2010 is an act of parliament that makes a concrete provision
for payment of compensation to employees who suffers a major disability that arises from
accident that occurred at workplace or in the course of employment. This compensation is
different from other ones that are mandatory like basic salary, housing allowance, transport
allowance, educational allowance etc. but in this case, it is being paid when there is an
occurrence of accident that can lead to permanent disability. Until this occurs such
compensation is not paid to anybody or employees.
This Act repeals the Workmen’s Compensation Act Cap W6 Laws of the Federation of
Nigeria, 2004 and makes comprehensive provisions for payment of compensation to
employee’s who suffer from occupational diseases or sustain injuries arising from accident at
workplace or in the course of employment. The employee’s compensation Act of 2010 was
signed into law on the 17th of December, 2010 (Employee’s Compensation Act, 2010).
1. The objectives of the Act are to:-

73
(a) provide for an open and fair system of guaranteed and adequate compensation for all
employees or their dependants for any death, injury, disease or disability arising out
of or in the course of employment;
(b) provide rehabilitation to employees with work-related disabilities as provided in this
Act;
(c) establish and maintain a solvent compensation fund managed in the interest of
employees and employers;
(d) provide for fair and adequate assessments for employers;
(e) provide an appeal procedure that is simple, fair and accessible with minimal delays;
and
(f) combine efforts and resources of relevant stakeholders for the prevention of
workplace disabilities, including the enforcement of occupational safety and health
standards.
2. (1) subject to the provisions of sections 3 and 70 of this Act, this Act shall apply to all
employers and employees in the public and private sectors in the Federal Republic of Nigeria.
(2) the Nigeria Social Insurance Trust Fund Management Board (NSITFMB) shall have the
power to implement this Act and the Fund established under section 56 of this Act.
3. Without prejudice to the generality of the provisions of section 2 of this Act, this Act shall
not apply to any member of the armed forces of the Federal Republic of Nigeria other than a
person employed in a civilian capacity (Employee’s Compensation Act, 2010).
3.13.1 Compensation for Death, Injury or Disease
The employee’s compensation Act of 2010 made provision for adequate compensation of an
employee who suffers any disabling injury cropping up out of workplace or in the course of
employment shall be entitled to payment of compensation in accordance with Part 1V of this
employee’s compensation Act of 2010 whether the death, injury or disease is or not within a
workplace. This part of the act stipulates that an employee is entitled to payment of
compensation with respect to any accident sustained while on the way between the place of
work and

74
(a) the employee’s principal or secondary residence;
(b) the place where the employee usually takes meals; or
(c) the place where he usually receives remuneration provided that the employer has prior
notification of such place (Employee’s Compensation Act, 2010).
3.13.2 Compensation for Occupational Disease
This is also contained in Part 111 of the employee’s compensation Act of 2010 where the
stipulation concerning this made that
(a) an employee suffers from the occupational disease and is disabled from earning full
remuneration at the workplace;
(b) the sudden death of an employee is caused by an occupational disease;
(c) the disease is shown to be due to the nature of any employment in which the
employee was employed, whether under one or more employments; or
(d) an employee suffers from any occupational disease listed in the first schedule of the
employee’s compensation Act of 2010 of the Federal republic of Nigeria.
Compensation and health care benefits shall be payable under this Act (Employee’s
Compensation Act, 2010).
3.13.3 Compensation for Hearing Impairment
The employee’s compensation Act of 2010 of the Federal Republic of Nigeria entrenched
that where the hearing mode of an employee is impaired, he/she is entitled to some sort of
compensation and this stipulates that
(1) where an employee suffers from hearing impairment of non-traumatic origin, but
arising out of or in the course of employment under the 2010 Act of parliament, the
employee shall be entitled to compensation.
(2) where the hearing impairment referred to in sub-section (1) of this section amounts to
total deafness, but with no loss of earnings resulting from the hearing impairment,
compensation shall be calculated as may be provided by regulations made by

75
NSITFMB under the employee’s compensation Act of 2010 in consultation with the
National Council for Occupational Safety and in respect of:-
(a) the ranges of hearing impairment;
(b) the percentages of disability;
(c) the methods or frequencies to be used to measure hearing impairment; and
(d) any other matter relating to hearing impairment (Employee’s Compensation Act,
2010).
3.13.4 Scale of Compensation
This is under Part 1V of the employee’s compensation Act of 2010 which graduated the
compensation into scales of different categories that include:-
3.13.4.1 Compensation in fatal cases
Under this category, compensations shall be paid to the dependants of the deceased that died
as a result of injuries sustained by an employee and this include
where the deceased employee leaves dependants wholly dependent on his earnings a
widow or widower;
where there is no surviving spouse eligible for monthly payments under this section,
and
(i) when the dependant is a child, a monthly payment of a sum equal to 40 per
cent of the total monthly rates will be paid;
(ii) when the dependant are 2 children, a monthly payment of sum equal to 60 per
cent of the monthly rate will be paid to them; and
(iii) if the dependants are 3 or more children, a monthly payment of a sum equal to
80 per cent of the total monthly rate will be paid to them.
monthly payments to eligible children under the employee’s compensation Act of
2010 shall be made available to children up to the age of 21 or until they complete
undergraduate studies, whichever comes first (Employee’s Compensation Act, 2010).

76
3.13.4.2 Period for making payments
The NSITFMB shall make monthly payments under the employee’s compensation Act of
2010 for the life of the person to whom the payment is to be made, unless a short period
applies under the provisions of this Act, or as the NSITFMB may from time to time by
regulations specify.
3.13.4.3 Proof of existence of dependants
The NSITFMB may, from time to time, require the proof of the existence and condition of
dependants in receipt of compensation payments that is deemed necessary by the NSITFMB,
pending the receipt of that proof; the NSITFMB may withhold further payments.
3.13.4.4 Permanent total disability
In line with the employee’s compensation Act of 2010, if a permanent total disability results
from the injury sustained by an employee, the NSITFMB shall pay to the employee
compensation that is a periodic payment equal to 90 per cent of the remuneration entitled to
the employee. The compensation here shall be payable monthly.
3.13.4.5 Permanent partial disability or disfigurement
According to employee’s compensation Act of 2010, if a permanent partial disability results
from the injury sustained by the employee, the NSITFMB shall:-
(a) estimate the impairment of earning capacity from the nature and degree of the injury;
and
(b) pay the employee’s compensation, that is, periodic payment equal to 90 per cent of an
estimate of the loss of remuneration resulting from the impairment (Employee’s
Compensation Act, 2010).
3.14 THE ROLE OF LEADERSHIP AND MANAGEMENT IN COMPENSATION
MANAGEMENT
The leadership and management role in compensation management cannot be over stretched.
This is because they both have an important part to act in determining what compensation
must be given to employees that will spur them to work hard toward the accomplishment of
organisational goal. For example, the study conducted by Hu, Huang, Chi and Chu (2007) on
comparison of the monetary reward decision of Taiwan and U.S. managers: allocation

77
context as a moderator using 224 Taiwan and 152 U.S. managers reveal that Taiwan
managers allocate more monetary rewards to subordinates with closer affective relationship.
In the case of U.S. managers, they place more priority on their subordinate’s work
contribution.
Based on the strategic role of compensation management, the compensation system be
designed, managed, measured, and communicated to the employees. Ideally, it is the basic
responsibilities of HR section to design and administer compensation system, answers
technical questions posed by employees, observes the usage of rewards by employees and
suggests benefits cost-control methods to the management. On the part of managers who are
the management team, they have the reward power to administer compensation to reward or
reinforce desirable behaviour. The manager’s answers simple questions on compensation
work in conjunction with HR specialist on compensation and communicate well with
employees getting close to retirement (Mathis & Jackson, 2011; Grobler et al., 2011; Brevis
& Vrba, 2014).
In conclusion, both the leaders and managers in organisations are having important role to
play in designing, managing, measuring and disseminating information to employees about
compensation. This is to ensure that the best individual are hired, developed and retained to
improve performance.
3.15 RELATIONSHIP BETWEEN COMPENSATION AND PERFORMANCE
There is always a link between compensation and performance of a firm. The performance of
the organisation when accurately measured determines the level of success achieved through
the alignment of the performance measures to the organisational vision, mission and strategy.
Milne (2007) found in her study of motivation, incentives and organisational culture that
rewards do have significant effect on performance within the organisation. The empirical
work done by San, Theen and Heng (2012) on the reward strategy and performance
measurement (evidence from Malaysian Insurance Companies), found that mutual
relationship exist between reward and performance of employees as well as that of the
organisation. Armache (2012) found employees that are well compensated for their efforts in
the organisation works harder and thereby leading to greater organisational performance.
Conclusively, it is evident from the study that when employees are well compensated, it will
enhance productivity or performance of the firm.

78
3.16 DEFINITION OF ORGANISATIONAL PERFORMANCE
Organisational performance is not a new phenomenon among the academics and the
industrialists as well as in the public institutions. Folan and Browne (2005: 663) argue that
organisational performance has been a source of influence to actions taken by companies.
The idea of organisational performance derives from the premise that it is a combination of
productive assets made up of human, physical and capital resources, for the major reason of
fulfilling a dream, vision or accomplishing a shared purpose.
Barney (2002); Carton and Hofer (2006) as well as Richard, Devinney, George & Johnson,
(2009) describe organisational performance as the real output measured against the intended
or expected output. These authors also view organisational performance as a term that is
made up of three major areas of firm outcomes and these are:
Financial Performance: This is made up of profits, return on assets (ROA), and
return on investment (ROI), etcetera.
Product Market Performance: This includes areas such as sales, market share, and
etcetera.
Shareholders Return: These include total shareholder return (TSR), economic value
added (EVA). Selden and Sowa (2004) describe organisational performance as what
is designed to assume that organisations are to accomplish certain goals that are
specified intrinsically and implicitly.
Organisational performance can be summarised as the approach used in assessing the
progress made toward goals, identifying and adjusting factors that have limited the progress
of the organisation in a competitive environment.
3.17 ORGANISATION
Organisation as a word describes the identity of a group or firm. Organisation could be an age
group within a community, civil society, unions or a business entity. Daft (2007: 10) define
organisations ‘‘as social entities that are goal-directed, designed as deliberately structured and
coordinated activity systems and are linked to the external environment.’’
Robbins (2005: 4-5) argues that ‘‘organisation is a consciously coordinated social unit
composed of two or more people, and that functions on a relatively continuous basis to
achieve a common goal or set of goals’’.

79
Schermerhorn, Hunt & Osborn, (2008: 8), Robbins and DeCenzo (2008: 4) assert that an
organisation is the arrangement of people in organised form for achieving a desired goal. It
could be concluded that organisations are established for the achievement of a certain goal by
using people and such organisations include manufacturing and service industries, social
clubs, schools, hospitals, military units, to mention but a few.
3.17.1 Types of organisation
Daft (2007: 11) identifies various types of organisations, which he categorised into: Large
organisations such as multinational corporations or private business, upon which this research
is based on the subject insurance industry, and small organisations like family owned shops.
Profit businesses or organisations are the organisations that are set up for profit maximisation
purpose and to satisfy all the stakeholders of the business while the non-profit organisations
are created or established to add value to people’s life and such non-profit organisations
include the Salvation Army, Red Cross Society, and non-governmental organisations.
Mullins (2005: 115-136) identifies formal, informal, private and public sector organisations,
which are discussed in detail below:
3.17.1.1 Formal organisation
This is defined by Mullins (2005:116) quoting from Schein as ‘‘the planned coordination of
the activities of a number of people for the achievement of some common, explicit purpose or
goal, through the division of labour and function and through a hierarchy of authority and
responsibility’’. Luthans (2011) shared the same view that formal organisation is structure
that harmonises the activities of two or more persons. The fact here remains that there is a
blueprint for the coordination of the activities that occur within the organisation, which make
use of people to accomplish the set goals of the organisation. Hence, the major features of a
formal organisation according to Mullins (2005: 116) are:
(a) deliberately planned and created
(b) concerned with the coordination of activities
(c) structured hierarchically with the objectives clearly stated; and
(d) based and built on certain principles such as the specification of tasks, and defined
relationships of authority and responsibility.

80
3.17.1.2 Informal organisation
Mullins (2005: 134) argues that the informal organisation exists or is present within the
formal organisation and this arises from the interaction of people working in the organisation,
their psychological and social needs coupled with the development of groups with their own
relationships and norms of behaviour, irrespective of those defined within the formal
structure. The features of the informal organisations are that:
(a) It is more flexible and loosely structured
(b) Its relationship may be left undefined and
(c) Its membership is spontaneous and with varying degrees of involvement.
3.17.1.3 Functions of informal organisation
The informal organisation provides some important functions that are equally indispensable
for the existence of the organisation and these functions are that it:
(a) Provides satisfaction to members as regards their social needs as well as making them
to have a sense of personal identity and belonging.
(b) Aids channels of communication through the ‘grapevine’ such that information of
great importance to a particular member is often communicated quickly.
(c) Is a source of great motivation, e.g. through status, social interaction, variety in
routine or tedious jobs, and informal methods of work.
(d) Provides a feeling of stability and security for the members.
(e) Is a means of highlighting the deficiencies or weaknesses in the formal organisation,
for instance, areas of duties or responsibilities not covered in the job descriptions or
out-dated systems and procedures?
By conclusion, the informal organisation has an important influence on the morale,
motivation, job satisfaction and performance of the staff.
3.17.2 Private and Public Sector Organisation
According to Mullins (2005: 118) traditionally, organisations could be distinguished in terms
of two generic groups namely: Private enterprise organisations and Public sector
organisations.
The dichotomy between the private enterprise organisation and the public sector organisation
can be highlighted on the ownership structure, finance and the profit maximization motive.
81
3.17.2.1 Private enterprise organisations
These organisations are purely owned, operated and financed by individuals, partners, or
shareholders in a joint stock company and are directly accountable to their owners or
members. These vary widely in size and nature and the type and scope of goods and services
provided. The major reason for the establishment of this kind of business is of commercial
nature such as profit maximization, return on capital employed (ROCE), market standing or
sales level. Examples of this in Nigeria are MTN Nigeria, Airtel, Shell Petroleum
Development Company (SDPC), Standard Trust Insurance Plc., Crusader Sterling Insurance
Plc., Leadway Assurance Plc., Alliance and General Insurance Plc. etcetera.
3.17.2.2 Public sector organisations
These are organisations purely created by the government to provide essential utilities for
society and they are not profit oriented, examples are municipal undertakings such as local
authorities that are owned by the council taxpayers and ratepayers and equally financed by
council taxes, rates, government grants, loans and charges for certain services. The public
sector organisations have a political undertone and do not distribute profits rather the surplus
of revenue over expenditure are or may be reallocated by improved services or reduced
charges. Hence, the main objective is to make life more meaningful and comfortable by
providing services that enhances the well-being of the community.
3.18 PERFORMANCE AND PERFORMANCE MANAGEMENT
In this study, it is of great importance to make a clear-cut distinction between performance
and performance management.
Literally, performance means what we do and the effort put in or exerted to achieve a
particular goal while performance management simply means how the effort put in is
managed so that the expected result does not diminish or go down.
In the literature, performance is defined as being related to performance appraisal. Hence,
performance appraisal is the systematic process of evaluating the performance of the
employees through provision of feedbacks to allow for adjustments where necessary and to
ascertain the level of employee’s contributions to their organisation (Schermerhorn et al.;
2008: 157, Jones & George, 2009: 441; Aldag & Kuzuhara, 2001: 540). Performance
management is viewed as one of the widely used terms within human resources (HR) that has
a specific meaning of reviewing and managing the individual performance within the

82
organisation (Bourne, Franco & Willces, 2003: 15). Performance management could also be
viewed as a closed loop control system, which deploys, enhances policy and strategy. Also
having feedback from various levels within the organisation is imperative for managing
performance of the system. This is to achieve the set goals of the organisation (Kagioglou,
Cooper & Aouad, 2001: 85; Bititci, Carrie & McDevitt, 1997: 46). Bititci et al.; (1997: 46) in
comparing performance management with performance measurement concludes that a
‘‘performance measurement is the information system which is at the heart of the
performance management process and it is of critical importance to the effective and efficient
functioning of the performance management system’’. Folan and Browne (2005: 674) as well
as Amaratunga and Baldry (2002: 217) argue that PM has been used for performance
measurement information to bring a decisive and positive change in the organisational
culture, systems and processes, by helping to set-up agreed-upon performance goals.
Allocation and resources priority, informing managers to either confirm or change current
policy or programme directions to meet these goals and sharing the results of the performance
in pursuing those goals. Performance management, therefore, is goal oriented and directed
through the information sieved from the performance measurement system (PMS) to ensure
that the organisation is aligned to its strategy, vision and objectives coupled with the meeting
of the yearnings of the stakeholders of the organisation.
3.19 ORGANISATIONAL PERFORMANCE (OP)
OP is paramount things to the business owners either it is a manufacturing or service
rendering organisations as in the case of this study dealing with insurance services. The
necessity of getting to know the wellbeing of an organisation in terms of performance is
evident today in the global markets. This is done to attract future investment, increase the
share value and attract high calibre employees within the competitive environment
(Kagioglou et al. 2001: 86; Katou & Budhwar, 2006). Traditionally, OP has been looked into
through the financial indicators alone and these are the subject of interest to the owners of the
business and such include return on investment (ROI), earnings per share (EPS), earnings
before tax (EBIT), sales or revenue, profit. Kohlbacher and Gruenwald (2011) carried out an
empirical study on firm performance in Austrian Corporations operating in the metal and
machinery industry by interviewing 152 organisations. They use two constructs namely
process performance measurement and the process owner role. They found that improvement
on firm performance can be achieved through both concepts.

83
Similarly, Vukšić, Bach and Popovič (2013) opined that firm performance can be
strengthened through business process management and business intelligence systems. They
concluded that there is no strong commitment to adopt both systems to accomplish greater
performance management. In the Nigerian context, this has been lacking. In the private
sector, which is the focus of this study, business owners are only interested in how much that
comes in and not minding how the firm performs (Odusami, Iyagba and Omirin, 2003;
Ehikioya, 2009). This has been the bane of most private businesses in Nigeria. Firm
performance is an issue that emerges from the layout and execution of the human resource
management policy for an organisation. The essence of an investment by any firm is to
improve skills, knowledge and employees capacity with an expectation that the employees
will increase productivity in the future (Shieh, 2008; Huang & Lien, 2012).
3.19.1 Measurement of Organisational Performance
As earlier indicated, organisational performance (OP) is often the most important aspect to
the business owners, as it relates to how the organisation fares in accomplishing the goals and
objectives for which it was set-up. This has called for the measurement of OP using some
indicators or parameters. Therefore, organisational performance measurement (OPM) is the
process or ways of determining the success of an organisation or individuals in attaining the
objectives, strategies or dreams (Kagioglou et al, 2001:85). According to Wouters (2009)
performance measurement system (PMS) is a system that serves different purposes. Wouters
argues that PMS are formal devices for control, comparison of both the past and present
position of the organisation and for the formulation and communication of organisation’s
strategy and thus PMS primarily serve higher-level managers. Kleingeld, Tuijl & Algera
(2004: 831) view the ‘design of a PMS entails components such as performance indicators,
goals and feedback, hence, putting PMS into action calls for the provision of feedback,
discussing feedback, solving problems and setting goals’. PMS is perceived as entire
management systems which encompass prevention and detection aimed at accomplishing
conformance of the work product or service. This is not only focused on data collection but
also related to predefined performance goal or standard. PMS involves measuring of costs,
quantity, cycle time, efficiency, productivity, etc., of products and services (Malik, Khan,
Shah & Gul, 2010).
In the past, researchers established that OPM has been done through the traditional financial
indicators that only view the past performance of the organisation. These traditional financial

84
indicators include cost and budget variance, return on investment, sales by employee, and
profit per unit production (Tangen, 2004, Kennerley & Neely, 2002:1223, Bourne et al.;
2003: 15-16, Kagioglou et al.; 2001: 86).
Due to increased complexities of organisations and the expansion of the market in which they
compete, the use of financial indicators as a measuring yardstick is no longer enough. There
is the emergence of other PM yardsticks such as balanced scorecard (BSC) introduced by
Kaplan and Norton, (1992), the performance prism (Kennerley & Neely, 2002), the
performance measurement matrix (Keegan, Eiler & Jones, 1989) and the SMART pyramid
(Lynch & Cross, 1991). For purposes of this study, the combination of both the financial
measurement and the balanced scorecard (BSC) is briefly reviewed.
3.19.2 Financial indicators for organisational performance measurement
Many financial indicators for measuring the performance of an organisation have been
highlighted by researchers such as Drury (2000: 799-800), Horngren, Datar and Rajan (2012)
and some of these shall be discussed in this study
a) Profitability Ratios: - the profitability of a division or firm can be expressed in
relation to the capital employed or its total revenue, that is, sales or gross earnings.
Measures that reflect profitability include: -
Return on investment (ROI):- This deals with a divisional performance measurement.
This is calculated by expressing the profit of a division as a percentage of the business
investment in the division. The calculation of ROI is done as follows:
Source: Drury, 2000.
OR

85
This is a measure of profitability, that is, it compares profits to the investment size made in
the division. This brings in a comparison between divisions that are different in sizes as
regards their performance (Drury, 2000: 799-800). However, the major disadvantage of ROI
when it is used as the primary performance measurement for divisional managers is that it
leads to behaviour that is not aligned with the interest of the business overall objectives
(Atrill & McLaney, 2002: 275-276; Anthony & Welsch, 1981: 386; Drury, 2000: 799-800).
Return on Capital Employed (ROCE): - this is also calculated as of using ROI. This
also relates to the ratio of profit to the investment made.
Return on Assets (ROA) : - this is calculated as follows
Return on Sales: this ratio serves as a measure of the profitability of sales. It is either
the Gross Profit percentage or Net Profit percentage depending on the need of the
analyst or users. The Gross Profit percentage is used to detect errors or frauds
affecting items in the trading account whilst the Net Profit percentage is used to gauge
the division or company’s net trading result in relation to other periods or even other
divisions or firms in the same industry.
Sales: - This is the total number of goods and services sold to the public consumer in
monetary terms. It is also referred to as revenue or turnover at times and it is
calculated as:
Gross Profit: - This is the gain that accrues to the organisation after deducting all
direct expenses attributable to generating the revenue, which is, cost of sales. It is
calculated as:
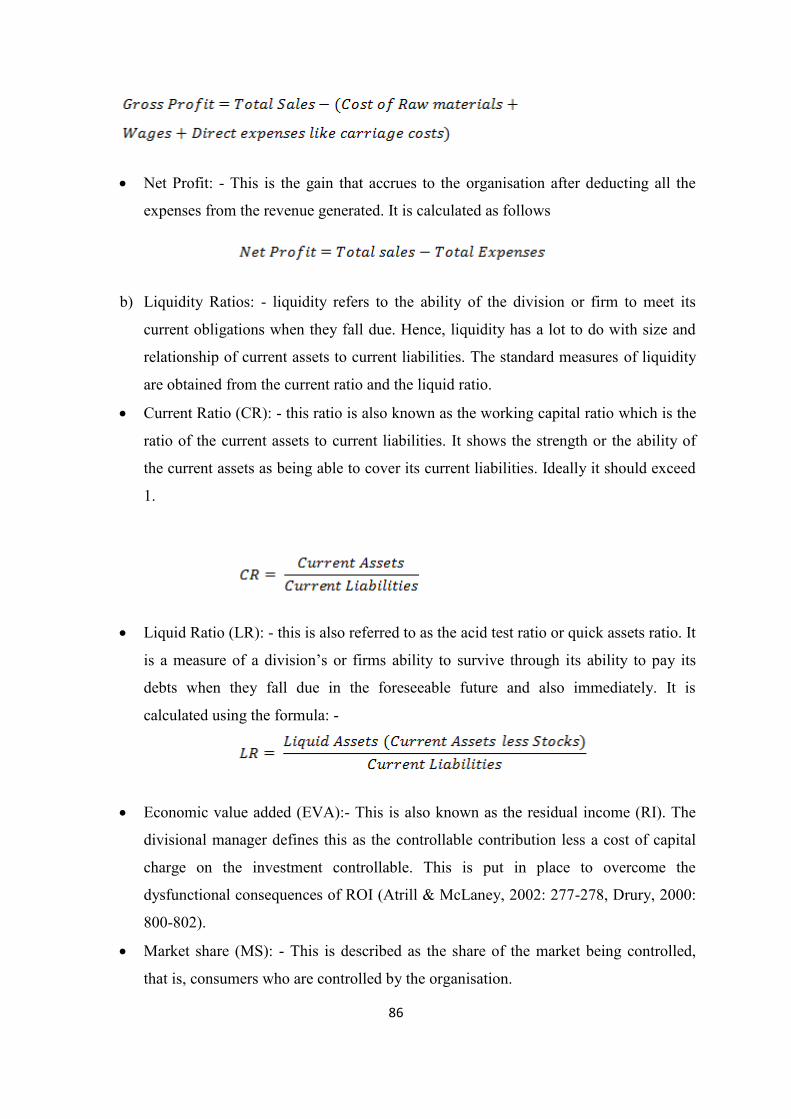
86
Net Profit: - This is the gain that accrues to the organisation after deducting all the
expenses from the revenue generated. It is calculated as follows
b) Liquidity Ratios: - liquidity refers to the ability of the division or firm to meet its
current obligations when they fall due. Hence, liquidity has a lot to do with size and
relationship of current assets to current liabilities. The standard measures of liquidity
are obtained from the current ratio and the liquid ratio.
Current Ratio (CR): - this ratio is also known as the working capital ratio which is the
ratio of the current assets to current liabilities. It shows the strength or the ability of
the current assets as being able to cover its current liabilities. Ideally it should exceed
1.
Liquid Ratio (LR): - this is also referred to as the acid test ratio or quick assets ratio. It
is a measure of a division’s or firms ability to survive through its ability to pay its
debts when they fall due in the foreseeable future and also immediately. It is
calculated using the formula: -
Economic value added (EVA):- This is also known as the residual income (RI). The
divisional manager defines this as the controllable contribution less a cost of capital
charge on the investment controllable. This is put in place to overcome the
dysfunctional consequences of ROI (Atrill & McLaney, 2002: 277-278, Drury, 2000:
800-802).
Market share (MS): - This is described as the share of the market being controlled,
that is, consumers who are controlled by the organisation.

87
Total shareholder return (TSR): - this is a ratio of the net profit after tax and gross
preference dividend to that of no ordinary shares existing as at that day.
3.19.3 Non-financial indicators for organisational performance measurement called
balanced scorecard
The Balanced scorecard (BSC) was developed in the 90s by Kaplan and Norton (Drury,
2000: 928-939; Geuser, Mooraj and Oyon, 2009). This was another perspective that goes
beyond the traditional financial indicators of measuring the performance of an organisation.
Since financial indicators alone are not sufficient to determine the performance of an
organisation there is a need to combine them with non-financial measure of performance. The
identification of key performance measures gave birth to the BSC which is defined as ‘‘a set
of measurement factors that give the top hierarchy of management a fast but comprehensive
view of the organisational unit (i.e. a division/strategic business unit (Folan & Browne, 2005:
668; Drury, 2000: 928-939, Kennerley & Neely, 2002: 1223-1224).
According to Kaplan and Norton, (1992, 1993, 1996a, 1996b) as quoted by Drury (2000:
929) BSC enables managers to have different perspectives about the business by seeking
answers to four basic and fundamental questions:
How do the customers see us? (customer perspective);
How do we look to shareholders? (financial perspective);
What must we excel at? (internal perspective);
Can we continue to improve and create value? (learning and growth).
These four perspectives are deliberated upon below one by one:
3.19.3.1 Customer perspective
This is required of the manager to be able to identify the customer and the market segments
in which the organisation or business units operates and functions. The target segments
should cover both the existing and potential customers. Typically, the customer’s perspective
of the BSC includes market share, customer retention and loyalty, customer acquisition,
customer satisfaction, and customer profitability.

88
3.19.3.2 Financial perspective
The financial perspective of the BSC deals with the financial success of the organisation and
that is a pointer to whether the organisation is able to withstand its competitors within the
same industry. This is viewed through ROI, ROCE, EVA, and sales as required by the
shareholders (Drury, 2000; Horngren et al., 2012). The financial objectives may include
increase in revenue, reduction in expenses or cost and asset utilisation (Horngren et al.,
2012). The financial measurement provides feedback on whether improved operational
performance is being transformed towards the improvement of the financial performance
which at the end summarises the economic consequences of strategic implementation.
3.19.3.3 Internal perspective
This internal perspective of the BSC is also tagged with the internal business process, which
gives the opportunity to the manager to identify the critical processes for which the
organisation must execute in order to excel in the business strategy. The internal perspective
of the BSC must, therefore, focus on the internal processes that create greater impact on the
customer’s satisfaction as well as giving room to the achievement of the financial objectives.
Hence, Kaplan and Norton (1996) identify three major or critical internal business processes
namely: - Innovation processes; Operation processes and Post-service sales processes.
3.19.3.4 Learning and growth perspective
This is the fourth perspective of the BSC, which embraces the identification of the basic
infrastructures that the business must build to create long-term sustenance and improvement.
This perspective emphasises the necessity of future investment in areas such as new product
research and development other than investing in assets and infrastructures (people, systems
and organisational procedures) if they have the mind of achieving their long-term financial
objectives. Three major enablers are identified for learning and growth objectives to be
achieved and these are
Employee capabilities;
Information system capabilities;
Motivation, empowerment and alignment.
These four perspectives of BSC are summarised diagrammatically below:

89
Figure 3.5: The Balanced Scorecard for Translating a Strategy into Operational Processes
Source: Kaplan and Norton (1996)
3.19.4 Reasons for organisational performance measurement
Performance measurement is necessary for organisations and this may be achieved
systematically and thoroughly, or on an ad hoc basis and superficially. External agents and
organisations such as shareholders, investment houses, banks, regulators, and etcetera also
measure performance (Charles, 2000: 63). He went further to answer the question, why do
organisations measure performance? Charles (2000: 63) provides the following reasons:
To identify success
To know whether they are meeting customer requirements, unless they embark on
measurement, how do they know that they are providing the services/products that
their customer requires?

90
It helps them to understand their processes, to confirm what they know or reveal what
they do not know;
It identifies problems that are in the form of bottlenecks, waste, etcetera; that exist and
where improvements are necessary ;
Ensures that decisions are based on facts, not supposition, emotion, faith or intuition
and
Shows if improvements planned actually happened.
3.19.5 Fundamentals of performance measurement Charles (2000: 64-65) highlights some fundamental factors that are important to performance
measurement in an organisation and these are as follows
1) There should be an alignment between performance measurement and the
organisation’s strategy. Charles (2000) emphasises that there must be a focus on those
things that are of great importance, that is, the measures adopted must be selective.
The performance measurement depends on the organisational vision, mission and
strategy. This indicates that there should be a constant review of the performance
regime in line with the normal strategic planning process to ensure alignment.
2) Sub-unit measures must be aggregated into the organisation-wide measures. Since the
larger organisation cannot operate in isolation without the contribution of the
divisions, the divisional measures should be integrated into the organisation-wide
measures.
3) There must be commitment to the measurement regime. This simply means that all
categories of people within the organisation must be totally committed to the
measurement regime, that is, the senior managers and the employees should
understand and be committed to the measures. To achieve this, managers must
effectively communicate the purposes and nature of the measurement regime to all
those who are concerned.
4) Measurement must have an effect on performance. For performance, measures to be
achieved there must be adequate analysis and feedback loop that ensures that
performance measurement is critically analysed and translated into action and
behaviour that invariably changes the nature of activity and of performance. In
essence, measurement must be a source of performance improvement.

91
5) Measures must be reliable. This deals with the benefit of measurement, which is often
dependent on the reliability, and comparison of measures over time. It is essential to
identify measures, which can be made reliable and consistent over the desired time.
3.20 SUMMARY
When it comes to the issue of compensation and achieving organizational performance, the
role of money cannot be deemphasized, hence the comment on the role that money plays are
as follows as emphasized by (Smit & Cronje, 1992: 325).
* The lower-level of needs in Maslow’s theory can be with money
* The Herzberg’s two factor theory can also be satisfied with money.
* In the case of Vroom expectancy theory, money can meet and satisfy various needs.
The basic assumption of this theory is that when employees have a perception that good
performance will generate good remuneration, money is thus a source of motivation.
* The equity theory out of all the theories, is the one that emphasis the value of good and
fair remuneration.
3.21 CONCLUSION
In this chapter, compensation was discussed, the theories of compensation management like
equity theory, bargaining theory, behavioural theory, etc., were discussed. Furthermore, the
legal framework on compensation management in Nigeria was highlighted, organisational
performance was discussed, and relationship between compensation and performance as well
as the roles of leadership and management on compensation management were part of
discussions in this chapter. The chapter concluded with summary of compensation
management theory in relation to monetary aspect of it. In reviewing the available literature
on compensation management and organisational performance, a decision was arrived at to
gather viewpoints and opinions across different industries and different parts of the globe. It
is established that compensation management is an instrument that can be used to achieve
organisational performance through the employees as a resource but a body of knowledge has
evolved across different industries and regions of the world, yet in Nigeria very insignificant
study has been done about the subject in the insurance industry, hence the motivation for this
study. The next chapter will focus on motivation and organisational performance.

92
CHAPTER 4
MOTIVATION AND ORGANISATIONAL PERFORMANCE
4.1 INTRODUCTION
The aim of this chapter is to provide a clearer in-depth to motivation as it relates to
organisational performance as well as that of the employees in a working environment like
insurance industry. The chapter covers motivation, motivational theories, types of motivation,
characteristics of motivation, merits and demerits of motivation, job satisfaction and
leadership.
Other areas covered include self-actualisation, relationship between motivation and
performance, the role of leadership and management in motivation, relationship between
compensation management, motivation and organisational performance. On a final note,
conceptual framework and conclusion was drawn.
4.2 UNDERSTANDING MOTIVATION
The word motivation means different things to different people and it was coined out of a
Latin word ‘‘movere’’ which means to move or change a thing (Adeoye, 2001). Mathauer
and Imhoff (2006: 3) define motivation as ‘‘the willingness to exert and maintain an effort
towards organisational goals’’. Adeoye (2001: 46) argues that ‘‘motivation is an inducement
to arouse the interest of an employee to achieve a set up goal of an organisation’’.
Alstrom & Bruton (2010: 200) are of the view that motivation is ‘‘the driving force behind an
individual’s actions that energizes and directs goal-oriented behaviour’’.
Ramlall (2004: 53) define motivation as the ‘‘willingness to exert high levels of effort
towards the organisation’s goals, conditioned by the efforts ability to satisfy some individual
need’’. He also asserts that motivation represents ‘‘those psychological processes that cause
the arousal, direction, and persistence of voluntary actions that are goal oriented’’. Seiler et
al., (2011), Mitchell, (1982: 81) and Lin (2007: 137) define motivation as “an internal driver
that activates and direct behaviour’’. These authors assert further that motivation energizes
and guides behaviour toward reaching a particular goal and is intentional and directional.
Grant et al., (2007: 56) considers motivation ‘‘as an umbrella concept encapsulating the
psychological processes that direct, energize, and sustain human behaviour’’.

93
In summary, motivation is defined as a way of tilting human behaviour to act in a certain way
to achieve a certain goal.
Malik (2010) assert that motivation is always viewed as making somebody to take action to
execute something with the prompt that he/she wants to do it. The assumption before was that
motivation has to be from outside but the perception now is that motivation arises because of
several different forces or reasons. According to Malik (2010) motivation is an assignment
that must be undertaken by managers to get the best result from their subordinates. This
covers possession of communication skill, leading by example, which is like mentoring the
junior ones, in facing difficult challenges. It is also to serve as an encouragement, giving
necessary feedback, and to be involved, delegate, educate, train and develop the subordinate,
towards being properly informed, and to brief and provide adequate and just remuneration.
Malik (2010) concluded by defining motivation “as an inner force that drives individuals to
accomplish personal and organisational goals”. It is further argued by Malik (2010), Abdullah
and Islam (2012) and Cong, Van and Huu (2013) that individuals have problems enunciating
in a consistent manner what they are particularly good at in a job. Hence, most employers of
labour have conscientiously ignored what the individuals are saying as regard what they
want. Rather they tell the employees’ what they are expecting from them, based on what the
managers understand about the worker’s need at any particular period or circumstance. Most
often, the employer’s decisions have been anchored on Maslow’s hierarchical needs
including the factor of proficiency (Islam & Ahmed, 2014). As a person grows with an
organisation, his employer makes available opportunities to meet the higher needs on
Maslow’s pyramid. Maslow’s findings suggest that one of the key factors that motivate
employees to higher productivity includes living in a safe area as well as receiving good pay
(O’Connor & Yballe, 2007). Maslow also makes some recommendations to the effect that
reward structures should include job enlargement, job enrichment, promotions, monetary, and
non-monetary compensation (Brevis & Vrba, 2014).
Kulkarni (2011) argues that motivating an employee is always a challenge to the employer of
labour. It is argued knowing the level of dedication and commitment of an employee to the
organisation, division or team, depends largely on the individual involved. However, the
relationship between motivation and job or organisational performance and job satisfaction
cannot be underestimated. Kulkarni (2011) asserts that motivation is an attempt to operate
organisational conditions, which gingers the employee’s emotion into an action that makes

94
him or her work toward the attainment of organisational goals. The main objective of
motivation is to fashion out conditions upon which people have the willingness and
conviction to work with zeal, initiative, interest and eagerness to work without being
monitored or supervised (Hewitt, 2009; Wininger & Norman, 2010). In this regard,
motivation is geared towards achieving group morale, satisfaction with a sense of
responsibility, loyalty, discipline, and pride with total confidence in such a consistent manner
so that the goals of the organisation or firm are realisable in an efficient and effective way
(Bob, 2011). In the study titled “revisiting Maslow the “IT” way-a case study’’. Kulkarni
(2011) reveals that the safety and social needs, which are part of the need levels identified by
Maslow, are more important to the employees of the IT industry in India than the esteem and
self-actualisation needs. This was corroborated by the work of Mawoli and Babandako
(2011) that the academic staffs of Ibrahim Badamasi Babangida University, Lapai, Niger
State in Nigeria are highly motivated and contented with the working environment, which is
about the safety nature of their job.
Živković (2013), in his work on management of occupational safety by motivating employees
to work safely, while quoting from Mawoli and Babandako (2011) defines “motivation as a
psychological process that causes the arousal, direction, intensity and persistence of
behaviour. The potency of motivation in the physical working environment has great value in
the performance of employees (Iguisi, 2009, Živković, 2013). In motivating for occupational
safety, it is of great necessity for the employees to use safety measures in their position, and
those measures must be current, sufficient and adequate to avert danger and harm (Živković,
2010). Furthermore, one of the essential factors for applying occupational safety measures as
workers’ motivation for this particular area is to reduce occupational accident, which is the
motivation for constant respect of the rights and responsibilities they have in the area of
safety (Todorović & Živković, 2010). Employees’ motivation is just a segment in human
resource management development strategy (Ukandu & Ukpere, 2011).
Motivation of employees is a vital aspect of human resources management towards
accomplishing the goals of the organisation as well as that of the employees. Human subjects
view motivation of employees as essential aspects of the organisational strategy adopted to
enhance the firm’s performance through the motivation of the employee’s effort or ability
and as attracting and retaining highly skilled employees (Gerhert et al., 2009, Larkin et al.,
2011). Milkovich and Newman (2005:261) put forward the vital question: “what motivates

95
employees”? In answering this question, Milkovich and Newman (2005: 261) assert that
motivation involves three elements:
What is important to a person?
Offering it for an exchange
Desired behaviour.
With regard to the first element which relates to what is important to employees, it has been
suggested that employees prefer pay systems that are influenced by individual performance
and changes in the cost of living as well as the duration of stay at the work place (Fein,
2010). This also extends to other variables such as security, the market rate, that is, what is
obtainable within the industry; to name but a few of the most important factors (Milkovich &
Newman, 2005:261). Similarly, Tsai (2005) assert that proper management of compensation
motivates individuals to perform; hence, there is a resultant positive effect on the
organisational performance.
According to Lawler (1981:11), “a great deal of research has been done on what determines
whether or not individuals are motivated or satisfied with the rewards they receive”.
Lawler’s (1981) study has proved that satisfaction is a complex and difficult reaction to
situations given the fact that it derives from a number of factors. Following is a summary of
Lawler’s (1981) arguments in this regard:
Satisfaction with a reward depends on how much is received and how much
individual perceptions should be received.
People’s feelings of satisfaction are influenced by comparisons with what happens to
others.
Often, there is misconception of the reward of others by people
Overall job satisfaction largely depends on how satisfied an employee is with both the
intrinsic and extrinsic rewards he receives from his job.

96
Figure 4.1: Model of the Determinants of Pay Satisfaction
Source: Lawler (1981: 13)
Lawler (1981) explains this model further as follows:
• Skill: This is the competence of the employee to carry out his or her duties with little or
no supervision that enhances his or her output that also affects his remuneration
package. Thus, skill is one of the resources for compensation that also determines the
motivational aspect of the job and this invariably leads to greater organisational
performance (Tuan, 1997; Brown et al., 2003; Cabral-Viera, 2005).
• Experience: This is the knowledge or know how acquired from the job. It is a crucial
factor in determining the reward of an employee which means if an experience is being
rewarded highly, it motivates, hence, there is satisfaction in the pay received which
automatically affects the performance of the firm positively (Tremblay et al., 2000;
Williams et al., 2006; Scarpello & Carraher, 2008) .

97
• Training: Training is the process of learning and acquiring a new skill to do a job in
order to boost the performance of the individual as well as that of the firm. The amount
of training given has a direct link to the remuneration and motivation that brings about
satisfaction that definitely enhances the overall performance of the organisation (Bontis
& Serenko, 2007; Leuven & Oosterbeek, 2008; Kuvaas & Dysvik, 2009; Görlitz, 2011;
Malik, Naeem & Ahma, 2012; Nadim & Khan, 2013).
• Effort: Effort is the ability put in by an individual to accomplish a task that leads to a
greater outcome. Many at times, the effort does earn monetary gains but non-monetary
means like end of year bonus, recognition, etc., which leads to high motivation and
satisfaction. At the tail end, it also increases or enhances the organisational outcome
(Fong & Shaffer, 2003; Gibbs et al., 2004).
• Age: The old employees tend to have more job satisfaction and more commitment
resulting from developing positive attitudes toward their jobs that are more often than
not rewarded with better pay in order to motivate them to stay longer on the job
(Shields & Price 2002; Schlett & Ziegler, 2014).
• Seniority: This is how long an employee has been working for the organization
coupled with the number of years of experience of the employee that allows him/her to
climb the ladder through promotion and advancement on the job. The higher the
employee moves within firm, the upward movement goes with increase in reward/pay
which ginger the employee’s motivation and ultimately has a direct impact on the
satisfaction of the worker resulting to outright results on the firm’s performance
(Werner & Ones, 2000; Bradley & Roberts, 2004; Currall et al., 2005).
• Education: The educational qualification of an employee is one of the factors that
determine pay satisfaction. The higher the educational attainments of the individual
employee is, either a university degree or professional qualification, the higher the
chances are, that these will have an impact in determining the reward an individual
deserves. This will most definitely motivate them thereby resulting to satisfaction and
achievement of the organisational performance goal (Guest et al., 2000; Purcell et al.,
2003; Ganzach, 2003).

98
• Company loyalty: Company loyalty is the organisational commitment, which is the
extent an employee believes in and accepts the goals and aspirations of the firm that
makes the employee to desire to stay with the organisation. Individuals that are
dissatisfied with their jobs or who lacks commitment to the firm may have the tendency
of withdrawing himself or herself from the service of the firm, this may be exhibited
through absenteeism or having a high rate of turnover intent (Mathis & Jackson, 2003;
Rashid et al., 2003).
• Past performance: Past performance of the employee towards the attainment of the
firm’s goal will lead to recognition and reward in terms of pay if it was significantly
high and will enhance motivation as well as satisfaction on the job. This will further
enhance the performance of both the employee and that of the firm (Fong & Shaffer,
2003; Gardner et al., 2004; Green & Heywood, 2008).
• Present performance: The present effort put in by the employee determines the pay
satisfaction derived by the employee because when the present performance is valued,
it leads to increase in pay which aids motivation and on the other hand, increase in
employees performance and satisfaction will follow and improvement of organisational
performance is recorded (Hanushek & Rivkin, 2004; Belfield & Heywood, 2008).
• Level, difficulty, time span and amount of responsibility: The position that an
employee occupies, the time-frame spent in achieving a particular goal or assignment
and the responsibility that goes with the level of the employee determines the level of
satisfaction that the employee derives. This is a factor of how much he/she is being paid
for that amount of responsibility and how tight the time-frame is (Brown et al., 2003).
• Perceived pay of referent others: This is the perception of an employee on what
others in the same job or others in similar industry takes as pay. If the individual earns
more than the referent others, he/she puts in more effort to earn more to increase the
level of performance and satisfaction as well as being motivated on the job (Heneman
& Judge, 2000; Agell & Lundborg, 2003; Bygren, 2004; Currall et al., 2005; Mas,
2008). This is done by doing a comparison with those doing a similar job in other firms.
It is found that employees use many different yardsticks to do their comparison and to
ascertain their degree of pay level satisfaction (Lawler, 1971; Goodman, 1974;
Summers & DeNisi, 1990; Williams et al., 2006).

99
• Actual pay received: This is the total amount received by the employee after taxes
have been deducted from the salary and this equally serves not only as determinant of
pay satisfaction but also as a factor of motivation that leads to an increment in the
employee performance and also assist in boosting the organisational performance (St-
Onge, 2000).
• Perceived personal job inputs: The perceived personal job input is the contribution
that an individual employee believes he/she made toward the attainment of the overall
goal of the establishment that is used to determine what should be paid to him/her. If
there is a corresponding measure between the amount paid him/her and what the
perceived personal job inputs is, then he/she is motivated and this in turn results to
satisfaction then there will also be a corresponding increase in his/her performance and
later metamorphosed to organisational performance. It is said that the perceived
personal job input is determined by both non-job-related input such as age, marital
status, gender, and tribal background while the job-related input such as education,
experience, job level, job tenure, and organizational tenure also counts in determining
the level of pay satisfaction by the employees (Schwab & Wallace, 1974; Miceli &
Lane, 1991; Williams et al., 2006).
• Perceived inputs and outcomes of referent others: This is a situation whereby an
employee compares his/her input/outcome with the inputs/outcomes of others and if
he/she finds out that his/her own input/outcome is greater than others and not receiving
a commensurate reward, he/she may decide to reduce his/her effort to be in line with
the referent others because there is no more pay satisfaction. But if they are equal in
terms of input/output, there is going to be pay satisfaction, morale boosting and
motivation sets in culminating to a positive effort on the performance of the employee
as well as that of the organisation. This is also viewed as a precursor of the perceived
amount of pay that should be expected by the employees (Rice et al., 1990; Heneman &
Judge, 2000; Currall et al., 2005; Williams et al., 2006).
• Perceived job characteristics: This is the understanding of the employee about what
the job entails or knowing the responsibilities which is expected to be executed in
respect of the job. This is also a factor that determines the reward to be paid and this
could serve as a motivating factor which will all together determine the satisfaction that

100
the employee received through pay. (Sloane & Williams, 2000; Bowling et al., 2008;
Spagnoli et al., 2012). The job characteristics that foretells the perceived amount that
should be expected include independence of the employee, skill variation, task
feedback, task identity, task connotation, and their cumulative, that is, the scope of the
job (Hackman & Oldham, 1974; Williams et al., 2006)
• Perceived amount that should be received: This is the total amount of reward that the
employee thinks should be given him/her as at when due which is a combination of
many factors or determinants such as skill, experience, training and development,
effort, level within the organisation, difficulty time span, amount of responsibility,
perceived personal job inputs, perceived inputs and outcomes of referent others and
perceived jobs characteristics, all which will serve as motivating factors and therefore
generating pay satisfaction of the employees and producing efficient firm performance
(Williams et al., 2006).
• Perceived amount received: The perceived amount received is the real amount paid to
the employee at the end of the job done which arises as a result of the perceived pay of
others and the actual pay received by the employee (Williams et al., 2006).
• A=B: This situation arises when the perceived amount that should be received by the
employee is equal to the perceived amount received of which the resultant effect is
satisfaction which will usher in less absenteeism, low labour turnover, employees
loyalty to the company and high performance of the employees and the end product
will be organisational performance (Lawler, 1971; Williams et al., 2006).
• A>B: This situation stems up when the perceived amount that should be received is
greater than the perceived amount received by the employee and which is not
commensurate with the work done, it will demotivate and hence dissatisfaction set in
which may lead to high rate of absenteeism, high turnover intent, low productivity, low
revenue generation, less commitment and less loyalty to the company by the employees
(Lawler, 1971; Williams et al., 2006).
• A<B: This is a situation whereby the perceived amount that should be received is less
than the perceived amount received by the employee which many a times may not
augur well for firm and dissatisfaction may be the end product that will brew up guilt,

101
inequity, discomfort etc., which at the end leads to less commitment, reduced loyalty
from the pay of the employees and leading to low organisational performance (Lawler,
1971; Williams et al., 2006).
Seiler et al (2011) quoted Adams (1965) as saying that “individual’s compared their own
efforts and rewards with efforts and rewards of others. Perceived inequity has a negative
influence on motivation (e.g. leading to reduced working efforts or requests for higher
compensation)”.
Steyn (2009: 9) quoting the work of Belcher (1974: 571) saying that “…the individual must
perceive that the rewards at least equal and preferably exceed contributions and the
organization must perceive that the individual’s contributions are greater than his reward”.
Bowie (2004: 1) posited that “to be effective, remuneration systems should be based on
sound understanding of the motivation of people at work. However, this has proved to be an
extremely complex topic, and very often reward systems used by employers have been based
on simplistic motivation theories and they have failed”.
4.3 MOTIVATIONAL THEORIES
Seiler et al (2011: 2) argued that different motivational theories have been put forward as to
why and how human behaviour is activated and directed. He said that these motivation
theories can be divided into two main categories:
• Content theories (e.g. Maslow’s (1943, 1954) hierarchy of needs, Alderfer’s (1972) ERG
Theory; McClelland’s (1961) three needs theory; or Herzberg et al (1959) two factor theory.
• Process theories (e.g. Adam’s (1965) equity theory; Vroom’s (1964) expectancy theory;
Lock’s (1968) goal setting theory; or Skinners (1969) reinforcement theory).
Armstrong and Murlis (1994: 40) stressed the following about the causes of satisfaction or
dissatisfaction with pay. “Reactions to reward policies and practices will depend largely on
the values and needs of individuals and on their employment conditions’’. It is therefore
dangerous to generalize the causes of satisfaction or dissatisfaction. However, it is more
reasonable to believe that, as mentioned above, feelings about external and internal equity
(the ‘felt fair’ principle) will strongly influence most people. They maintain further that other
factors which may affect satisfaction with pay include the degrees to which:
Individuals feel their rate of pay or increase has been determined fairly
102
Rewards are commensurate or equal with the perception of individuals about their
ability, contribution and value to the organization but this perception is likely to be
formed on information or beliefs about the amount being paid to other people both
internally and externally.
Individuals are satisfied and contended with other aspects of their employment
condition.
Ungson et al (1984) said that cognitive theories such as expectancy/valency theory of Victor
Vroom states that when performance is improved and employee see it as a connection to
rewards, it stimulates them to put in more effort, and non-cognitive theories such as
reinforcement theories, argued that rewards such as pay raises, bonuses, or even praise for a
job well done often serve as conditional reinforcements when tied to performance.
In motivational theories, it is assumed that rewards should be tied to performance in order to
ensure maximum performance”. Some of the most important motivational theories that have
been advanced or postulated are discussed in the following section.
4.2.1 Maslow’s Hierarchy of Needs
Smith (2000) and Ramlall (2004: 54) argued that “Maslow believed that human beings aspire
to become self-actualizing and viewed human potential as a vastly underestimated and
unexplained territory as illustrated by the figure below.
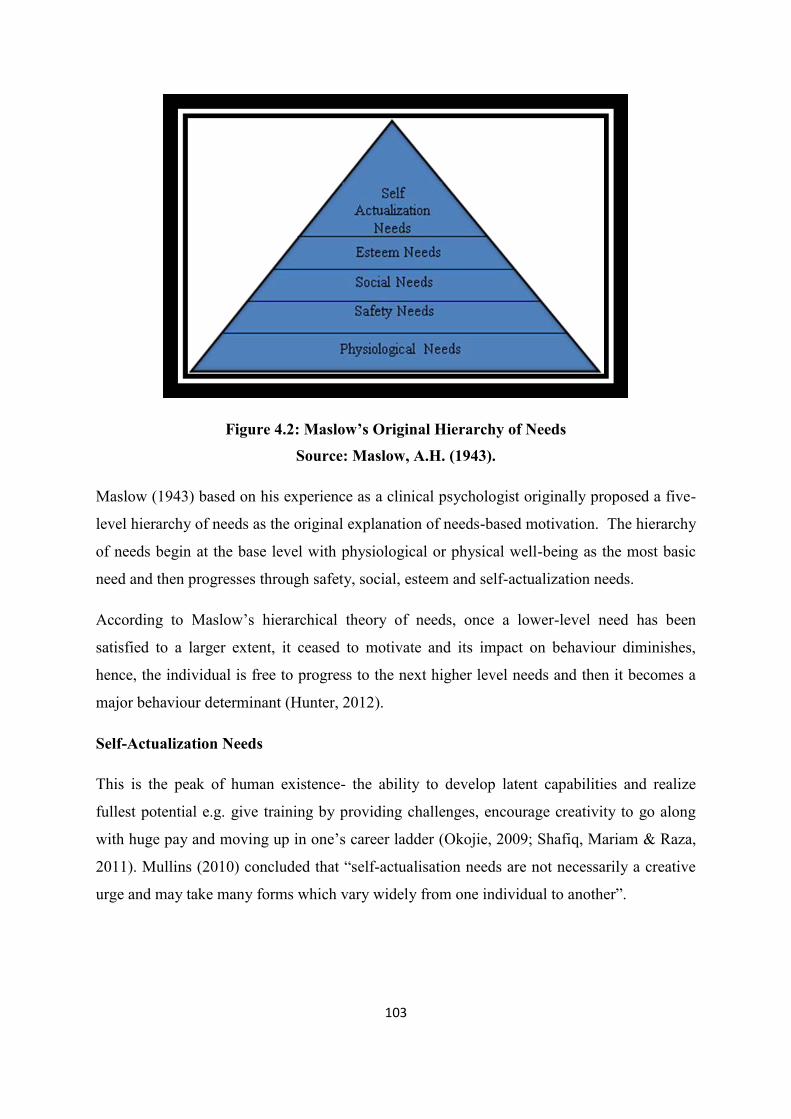
103
Figure 4.2: Maslow’s Original Hierarchy of Needs
Source: Maslow, A.H. (1943).
Maslow (1943) based on his experience as a clinical psychologist originally proposed a five-
level hierarchy of needs as the original explanation of needs-based motivation. The hierarchy
of needs begin at the base level with physiological or physical well-being as the most basic
need and then progresses through safety, social, esteem and self-actualization needs.
According to Maslow’s hierarchical theory of needs, once a lower-level need has been
satisfied to a larger extent, it ceased to motivate and its impact on behaviour diminishes,
hence, the individual is free to progress to the next higher level needs and then it becomes a
major behaviour determinant (Hunter, 2012).
Self-Actualization Needs
This is the peak of human existence- the ability to develop latent capabilities and realize
fullest potential e.g. give training by providing challenges, encourage creativity to go along
with huge pay and moving up in one’s career ladder (Okojie, 2009; Shafiq, Mariam & Raza,
2011). Mullins (2010) concluded that “self-actualisation needs are not necessarily a creative
urge and may take many forms which vary widely from one individual to another”.

104
Esteem Needs
Psychological wellbeing built in the perception of one as worthy and recognized by others,
that is, self-respect and respect from others. The self-respect in this case entails having
ambition for confidence, strength, autonomy, and freedom cum accomplishment while
respect from others covers reputation or prestige, position, attention and appreciation (
Qureshi, 2013; Piaralal, Mat, Piaralal & Bhatti, 2014).
Social Needs
Beyond existence needs lies the desire for nurturing, care, acceptance, respect etc. e.g. create
team spirit, allow participation. This also involves approval via others and the right of
belongingness or love (Roberts, 2005; Rahim and Wan-Daud, 2012).
Safety Needs
This is the need to be free from pain, harm or danger. It is also to enjoy security and
predictable life. This is the need for prevention against bodily or emotional hazard in an
atmospheric environment. Human assault and career safety are of this type (Roberts, 2005;
Shakir, Zamir & Zamir, 2013).
Physiological Needs
These are the most basic needs which encompass relief from thirst, hunger and physical
drives as well as comfort. The employees were able to meet these physiological needs
through financial rewards offered by the organisation (Mikander, 2010; Qureshi, 2013).
Lindner (1998) provides some useful insight into employee motivation. He said that the first
ranking motivational factor is interesting work which involves self-actualising factor because
it embraces both salary and job position. The second ranked motivator is good wages and this
is physiological factor because the basis of interesting work is the monetary involvement.
Lindner (1998) therefore suggests that for managers to adequately address the issue of
motivational factors which centres on employees interesting work, physiological, safety,
social, and esteem factors should be the priority in terms of satisfaction. He also opined that if
the managers had the interest of addressing the second most important factor that motivate
employees, good and adequate remuneration, salary increment would emerge.

105
Steyn (2009: 10) quoting from the works of Kendall et al (1997: 8) says that criticism against
the hierarchy of needs is that it is hierarchical by nature. The first needs can be met or
fulfilled by the employer to some extent. The existence of needs has been confirmed but
explanation could not be given why some needs are considered more crucial than others
(Hunter, 2012).
4.3.2 Vroom’s Expectancy Theory or VIE Theory
Vroom (1964), Armstrong (2003: 221) and Muchinsky et al (1998: 229) said that expectancy
theory was based on three components that instigates and tilt behaviours of an employee and
can be explained as follows:
Valency
This refers to the value placed by an individual with regards to outcomes. An outcome is said
to be positively valent for an individual if he/she prefers to have it or not. For instance, in
most cases an individual will prefer higher compensation for a job rather than lower
compensation. Hence, compensation is the outcome in question and the preference for higher
compensation to a lower one reflects the strength of the individuals underlying need state. A
clear distinction between valence and value was made e.g. an object may be desirable to a
person but derive little satisfaction from it, that is, no value provision or added to that fellow
and conversely, a person may not have a desire for an object but discover later that the object
provides a great deal of satisfaction. This sum up that valence is an expected satisfaction that
emerges from an outcome while value is the actual satisfaction derived from an outcome. The
valences of certain outcomes may be derived in their own right, but most often they are the
product of other outcomes to which they are expected to lead. A critical example is money
which many people thought and see as having an intrinsic worth and with derivation of
satisfaction from the real wealth accumulation/gathering (Chiang & Jang, 2008).
Instrumentality
Instrumentality simply means a belief that an action will lead to something else, if it helps in
achieving or attaining something else. Instrumentality determines the valence that an
employee associates with a given level of performance. Mullins (2005, 2010) viewed
instrumentality in two ways or levels that is either performance-related or need-related.

106
The first level outcomes are performance-related. This is normally called the quantity of
output or comparative level of performance. Some people determine to perform excellently
for their own sake without being thoughtful of the consequences or results of their actions.
However, performance outcomes acquire valence for the fact of the expectation that will
generate other outcomes as an expected source of satisfaction which is the second-level
outcomes.
The second-level outcomes need-related: These are gotten through the
accomplishment/achievement of the first-level outcomes-that is through recording of level
performance. Many of the need-related outcomes are a function of the actual performance
rather than the effort exerted. Rewards are awarded to people for what they have achieved
and not for effort alone or through trying hard.
Expectancy
Is the probability that action or effort will actually lead to an outcome and it is believed that if
an outcome is attainable; he or she will be more motivated to try for it. This is also expressed
as the relationship between a chosen course of action and its envisaged outcome.
The person’s motivation for a particular form of attitude or action is referred to as the
“motivational force”. Mullins (2005) expressed this with an equation
M=∑E.
Where motivation (M) is the sum of the products of the valence of all outcomes (V), times
the strength of expectancies that will result in achieving these outcomes (E).
In the same token, Hackman & Porter et al., (1968) enunciated the following formula for
calculating the effort (motivation) that an individual will exhibit in a particular situation as:
Effort (Motivation) = E*∑VI
Where
E= Expectancy that a given attitude will result in a first-level outcome
V= Valence, or value, that the individual emphasis on the second-level outcome

107
I= Instrumentality, or degree of belief, that a first-level outcome will lead to
second-level outcome.
4.3.3 Porter and Lawler’s Extension
The work of Vroom (1964) was extended by Porter and Lawler (1968) which was referred to
as expectancy model of motivation. According to Kreitner and Kinicki (1998) this model
attempted to (1) identify the source of people’s valences and expectancies and (2) link effort
with performance and job satisfaction. The Porter and Lawler Model viewed effort as a
function of the perceived value of a reward and the perceived effort-reward probability.
Ramlall (2004: 56) quotes Porter and Lawler (1968) saying that “employees should exhibit
more effort when they believe they will receive valued reward for task accomplishment. It is
concluded that employees are more satisfied when they feel equitably rewarded.
In addition, employees’ future effort-reward probabilities are influenced by past experience
with performance and rewards”. Porter and Lawler’s (1968) Expectancy Model is illustrated
in the figure below:

108
Figure 4.3: Porter and Lawler’s Expectancy Model
Source: Porter & Lawler III (1968).
The above model explains the relationship that exists between motivation, reward,
satisfaction and performance which they observed as separate variables. Porter and Lawler
(1968) offered that satisfaction is an effect and not a cause of performance, i.e. job
satisfaction is a result of performance. Mullins (2010) expatiated on the model as follows:
4.3.3.1 Value of reward
The desire of people about outcomes (reward) varied and people believe that it can be
achieved from work, i.e. what they offer to do that will earn them the money. The value that
people placed on an outcome (reward) is a factor of the strength of its desirability.
4.3.3.2 Perceived effort-reward probability
This connotes the person’s expectation that a particular outcome (rewards) is a dependent of a
given amount of effort, that is, what a person earns as reward has a direct linkage on what the
exerted effort is.
4.3.3.3 Effort
This is viewed as the amount of strength put in by a person on a given activity to achieve a
particular result. This does not have a bearing on how successful a person is in executing an

109
activity. The energy exerted by a person is based on the interaction of the input variables of
the value placed on the reward and the perception of the effort-reward relationship.
4.3.3.4 Abilities and traits
Porter and Lawler (1968) said that many a times effort exerted has no direct linkage to
performance but the characteristics of an individual has an influence on performance. It was
advanced that factors like intelligence, skills, knowledge, training and development, and
personality plays a role that affects the ability to execute a given activity.
4.3.3.5 Role perceptions
This depicts the ways an individual view or perceived their work and the role they should
engaged in doing the work which determines the kind of effort to be exerted. The role
perceptions of individual will influence the path and level of action which is thought and
believed to be imperative for effective and efficient performance.
4.3.3.6 Performance
This is not only a function of the amount of effort exerted but also depends on the intervening
influences of the person’s abilities and traits, and how they perceive their roles. If the person
do not possess the right ability or personality, nor has an inaccurate role perception of what is
required of him to do the job, then exerting more amount of energy may still lead to a low
level of performance or task accomplishment/attainment.
4.3.3.7 Rewards
These are desirable outcomes of putting in an effort. The intrinsic rewards are obtained from
the individual themselves and these include a sense of achievement, having a feeling of
responsibility and recognition, the work itself, advancement and potential to grow within the
job as pointed out as motivators by (Herzberg, 1966). The extrinsic rewards are the factors
that arisen from or derived from the organisation and the actions of others and these include
salary, working conditions, company policies, interpersonal relationships, supervisory styles,
job security and status which is called hygiene by Herzberg (1966) and when these factors are
not present, it gives rise to dissatisfaction of the employees.
4.3.3.8 Perceived equitable rewards
This is referred to the level of rewards that people feel they should fairly be given for a
particular standard of performance recorded. The understanding of most people is that there

110
should be commensuration between the levels of rewards they should receive and the
requirements, the demands of the job as well as the contribution that is expected from them.
Higher level of performances is associated with higher levels of expected equitable rewards.
4.3.3.9 Satisfaction
This is not having the same interpretation with motivation. It is more or less an attitude, an
individual’s internal state of the person. The determination of satisfaction is basically the
combination of actual rewards received and the perceived level of rewards provided by the
firm for a certain standard of performance. If the difference between the perceived equitable
rewards and actual rewards received is high, they experiences dissatisfaction and if
satisfaction occurs, it means the actual rewards received is greater than the perceived
equitable rewards.
Armstrong (2003: 222) quoting Porter and Lawler (1968) suggested that there are two factors
determining the effort people put into their job:
(1) the value of the rewards to individuals is so far as they satisfy their needs for
security, social esteem, autonomy and self-actualization.
(2) the probability that rewards depends on effort as perceived by individuals-in other
words, their expectations about the relationship between effort and reward.
Hence, if the value of a set of awards is high and if the chances of getting each of the
rewards are attached to the effort, the effort that will be exerted in given situation will
be greater.
4.3.4 Herzberg’s Two Factor Theory
Herzberg originally did this study by interviewing 200 accountants and engineers from
different industries in the Pittsburgh area of America (Luthans, 2011). In carrying out this
study, he adopted the critical incident method whereby the employees were asked to relate
times when they felt exceptionally good or bad about their job either presently or their
previous job. The responses of the employee were found to be consistent and which revealed
that there were two different sets of factors affecting employees motivation and work and this
led to the emergent of the two-factor theory of motivation and job satisfaction (Luthans,
2011). This is also known as the “Motivator-Hygiene Theory” that was developed by
Herzberg’s in 1966. Ramlall (2004:57) said that Herzberg discovered that employees tended

111
to describe satisfying experiences in terms of factors that were intrinsic to the content of the
job itself and these were called motivators while those that cause dissatisfaction are called
hygiene factors, which emanated from extrinsic or non-job related factors.
4.3.4.1 Motivators
These are intrinsic factors that bring satisfaction to the employees and such variables include
achievement, recognition, responsibility, the work itself, advancement and potential to grow
within the job. These factors are relative to conditions that lead to strong motivational levels
of employees when it is present, but does not necessarily lead to dissatisfaction when absent.
4.3.4.2 Hygiene
These are extrinsic factor that causes dissatisfaction of the employees and such variables
include company policies, salary, co-worker’s relations, supervisory styles, job security and
status. This set of factors, when absent, is relative to conditions which give rise to
dissatisfaction by employees. However, when present, it does not necessarily motivate them.
To motivate employees to put in their best, the manager must pay attention to the motivators.
The emphasis of Herzberg was that the hygiene factors are not a ‘second-class citizen system’
but equally necessary to avoid unpleasantness at work as well as to deny unfair treatment.
Mullins (2010) suggested that “management should never deny people proper treatment at
work”. The conclusion about Herzberg’s two-factor theory is that it is more evident that good
performance leads to job satisfaction rather than the reverse.
Steyn (2009) quoting Armstrong (1980: 19) summarized the Herzberg Theory as
follows…extrinsic rewards provided by the employer including money, can be important in
attracting and retaining employees and in the short-term-increasing effort and minimizing
dissatisfaction. Intrinsic rewards related to responsibility, achievement and the work itself
might have a longer and deeper effect in creating and increasing satisfaction.
4.3.5 Douglas McGregor Theory X and Theory Y
Ferrell et al (2008: 305-306) and Nickels et al (1999: 294-295) said of the Douglas McGregor
theory X and theory Y that “the way managers go about motivating people at work depends
greatly on their attitudes toward workers’’. The observation of Douglas McGregor is that
manager’s attitudes fall mainly into one of two entirely different managerial styles which he
referred to as theory X and theory Y. These are summarised in Table 4.1below

112
Table 4.1: Theory X and Theory Y
S/N THEORY X THEORY Y
1 Naturally, average human being dislikes work
and will be avoided when possible.
People likes work both physical and
mental, it is as natural as play or rest.
2 People must be forced, coerced, controlled,
directed or threatened with punishment to get
them to work toward the achievement of
organizational objectives
People will exercise self-direction and
self-control to achieve objectives to
which they are committed.
3 An average worker prefers to be directed and
to avoid responsibility, has relatively little
ambition and wants security.
Workers’ commitment to goals
basically depends on the perceived
rewards for achieving them.
4 Primary motivators are fear and money Average person will seek and accept
responsibility. People are capable of
using a relatively high degree of
imagination, creativity and cleverness
to solve problems, but most
organization failed to make adequate
use of these characteristics in the
employees. In organizations today,
the intellectual potentials of
employees are not fully utilized but
partially. People are motivated by a
variety of rewards. Each worker is
stimulated by a reward unique to a
particular worker (time off, money
recognition etc.).
Source: Nickels et al., (1999:295).
Nickels et al (1999: 295) suggested that theory Y emphasizes a relaxed managerial
atmosphere in which workers are free to set objectives, be creative, be flexible, and go

113
beyond the goals set by management and this is done through empowerment which gives
employees ability to make decisions and the tools to implement the decisions they make.
They went further to emphasize that for empowerment to be a real motivator, management
should follow these three steps:
Find out what people think the problems in the organization are
Let them design the solution and
Get out of the way and let them put those solutions into action.
4.3.6 Quchi’s Theory Z
This theory Z was developed by Professor William Ouchi in 1980’s and it was used to
describe the Japanese approach to employee motivation. However, it was noted that one of
the major factors to the successful outcome of Japanese firms was the approach adopted in
managing their resources especially the people which is considered to be the greatest assets
that any firm can possess (Ferrell et al., 2008: 307). They also argued that theory Z strive to
give employees more control over their jobs while making them more responsible for the
outcome of their efforts through programmes such as participative management, employee
involvement or self-directed work terms.
Ogundele (2005: 262-263) highlighted key features of Japanese industrial organisations
which are factors related to personnel through the adoption of Ouchi’s theory Z as follows:
• This is a high level of mutual trust, bond and loyalty that exists between management
and employee.
• Career paths are non-specialised with long-life job rotation as a central feature of career
development.
• Decision making is shared at all levels that cut across the organization, that is, from top
management cadre to lower cadre of management.
• Performance appraisal is long-term based, that is, it takes a longer period before
employee performance appraisal is embarked upon, and e.g. the first appraisal takes
place 10years after joining the firm.

114
• There is the exhibition of strong collective responsibility for the success of the firm, and
there is an encouragement of cooperative effort rather than a one man achievement
show.
• There is an elimination of artificial status barrier, i.e. there is a great deal of
harmonisation within the organisational set-up.
• It allows individuals to undertake meaningful roles which endear them with the
opportunity of contributing positively to the success and growth of the firm.
• It creates the avenue to develop training for management succession, that is, there is no
time that a vacuum will be created either through death, transfer, demotion or
termination of appointment of any management person.
• It creates high level of improvement in communicating the issues that borders on firm
performance, policies and future prospects within the firm.
• It avails the individuals the ample opportunity to be more responsible for work, quality
and environment.
• It introduces major improvements in factory housekeeping, which is, maintaining good
healthy environment and occupational safety measures.
4.3.7 The Reinforcement Theory
In the work of Milkovich and Newman (2005: 263) it was emphasized that the reinforcement
theory is built on the premise that immediate rewards is having a positive reinforcement on
performance and more so it geared individuals towards the accomplishment and sustenance
of the performance levels. In the other way round, behaviours that are not adequately
rewarded will have a negative impact by discontinuing the activity.
In the views of Werner and DeSimone (2009: 53) reinforcement theory is deeply rooted in
behaviourism by interpreting behaviour without special reference to unobservable internal
forces such as needs and thoughts. It has been argued that reinforcement theory is saying that
behaviour is a direct function of its consequences. According to this theory, a manager or
trainer can exercise control over an employee’s attitude by controlling the consequences that
follow the employee’s character.
Werner and DeSimone (2009: 53) opined that employee’s attitude can be controlled using
what is referred to as behaviour modification and four choices for controlling/modifying
employee’s attitude were highlighted as follows:

115
Positive reinforcement: This is the rate at which the frequency of behaviour by
following the behaviour with a pleasurable consequence is increasing.
Negative reinforcement: This is the rate at which the frequency of behaviour about
something dis-pleasurable after the behaviour is performed is being removed.
Extinction: This is an attempt to reduce the rate at which behaviour occurs by
removing the consequences that is reinforcing it.
Punishment: This is also an attempt to reduce the frequency of a behaviour/attitude by
incorporating an adverse consequence immediately there is an occurrence of behaviour.
4.4 TYPES OF MOTIVATION
Authors (e.g. Lin, 2007; Manzoor, 2011 and Chaudhary, 2012) on motivation observed that
there are two major types of motivation, which could be tagged as intrinsic and extrinsic
motivation. It is thus argued that motivation is an important aspect of getting the best out of
employees and notably, therefore, it is the responsibility of a leader or manager to establish
what it is that motivates his/her subordinates (Hunter, 2012, Gangwar, Padmaja & Bhar,
2013).
4.4.1 Intrinsic Motivation
Intrinsic motivation is what provides an immediate satisfaction or need. Osterloh (2005: 8)
argues that ‘‘intrinsic motivation is enhanced by commitment to the work, accordance with
the saying that if you want people to be motivated to do a good job, give them a good job to
do’’. Lin (2007: 137) describes intrinsic motivation as referring ‘‘to engaging in an activity
for its own sake, out of interest, or for the pleasure and satisfaction derived from the
experience’’, while Gagne and Deci (2005: 331) assert that ‘‘intrinsic motivation involves
people doing an activity because they find it interesting and derive spontaneous satisfaction
from the activity itself’’. Osterloh and Frey (2000: 539) view intrinsic motivation as a
basically undertaken task for the provision of immediate needs and satisfaction. They
conclude that the ideal incentive is contained in the content of the work itself, which may be
satisfactory and make the employee fulfilled.
George (1992: 192) defines intrinsic motivation as an ‘‘involvement of beliefs that the work
being done is meaningful and significant and that one’s own efforts are an important
contribution to the employment organisation’’. Kreps (1997: 360) contends that ‘in most

116
employment situations where intrinsic motivation is meant to be high, the employee usually
desires continued employment: he forms personal associations with co-workers, and he
develops capital specific to his particular job and employer.
Herzberg (1966) is of the view that intrinsic factors are motivators and these are
Achievement
Recognition
Responsibility
Advancement
Work itself.
Osterloh (2005:8) identifies two kinds of intrinsic motivation namely enjoyment-based
motivation and pro-social motivation. As the third kind of intrinsic motivation, obligation-
based intrinsic motivation was introduced by Frey (1997).
Enjoyment-based intrinsic motivation: According to Osterloh (2005: 8), this simply means
a satisfying flow of activity. Examples of enjoyment-based intrinsic motivation include
skiing, playing games, music, driving, reading of novels, mountain climbing or solving an
interesting puzzle like sodoku. In each of the aforementioned cases, pleasure is derived from
them not because of the compensation involved. In this case, individual acts as a ‘‘homo
ludens’’ (Osterloh, 2005:8, Huizinga, 1986), thus exhibiting characteristics of the playful
human being. A critical example of this kind of motivation is the open source software like
Linux, which has become a source of serious competition in the Microsoft world. The
production is made voluntarily as a public good that everybody can download from the
internet and to a larger extent; it does not involve monetary compensation and private
intellectual property rights. The producer of Linux software is just doing the programming
‘‘just for fun’’.
Pro-Social intrinsic motivation: This is a situation where the wellbeing of others supersedes
the individual, and without looking forward for any reward. The community welfare enters
into the preferences of the individuals. It is evident in many studies that many people are
indeed ready to contribute to the wellbeing of their community and company (Osterloh, 2005:
8; Frey, 1997). Osterloh (2005: 8) quoting (Ichino and Maggi, 2000) asserts that ‘‘individuals
feel better if they have observed group norms like ethical standards, professional codes of
practice, or norms of fairness, reciprocity or team spirit. Empirical work shows that due to

117
different group norms, substantial differences exist in shirking between branches of a
company, despite identical monetary incentives.
Obligation-based intrinsic motivation: Frey (1997) views this as a critical form of
incentive. Characteristically, it is the pursuance of self- defined goals or the obligations of
personal and social norms for their own sake (Osterloh et al, 2005: 233-234).
Gupta and Tayal (2013) describe intrinsic motivation as push factors that keep employees’
moving and moving at the work place and such factors include social and biological based
needs like hunger and thirst that are potential to motivate.
4.4.2 Extrinsic Motivation
This is a means to satisfy indirect needs, for example, money. To this end, money is just a
means to an end like paying for a vacation or buying a car and money is not an end in itself.
For example, the job that one does is just a tool to satisfy one’s needs through the salary paid
for the job in question. Examples of extrinsic motivation as highlighted by Herzberg (1966)
in his two-factor theory tagged hygiene factors are
Salary
Technical supervision
Interpersonal relations
Company policy and administration
Working condition
Job security.
Osterloh and Frey (2000: 539) argue that ‘‘employees are extrinsically motivated if they are
able to satisfy their needs indirectly, especially through monetary compensation’’. Money is a
‘‘goal which provides satisfaction independent of the actual activity itself’’ (Osterloh & Frey,
2000: 539; Calder & Staw, 1975). Gagne & Deci (2005: 331) argue that ‘‘extrinsic
motivation requires an instrumentality between the activity and some separable consequences
such as tangible or verbal rewards and that satisfaction comes not from the activity itself but
rather from the extrinsic consequences to which the activity leads. Extrinsic motivation
targets goal-driven reasons, for example, rewards or benefits obtained in the cause of carrying
out an activity (Lin, 2007: 137). Individual behaviour is determined by the perceived values
and benefits that are attached to an action. Organisational rewards are useful instruments that
encourage individuals to perform as is desirable and it can take the form of monetary

118
incentives such as increased salary and leave bonus to non-monetary incentives like
promotions and job security (Lin, 2007: 139). Gupta and Tayal (2013) identify the extrinsic
motivational factors as pullers. They argue that pullers are extrinsic enticers that jerk an
employee towards hard work, to be risk takers, face challenges, setting new targets for
themselves, creation of innovative ideas, taking the bull by the horn through responsibilities
and accountability and being able to cross all forms of hurdles at the work place.
4.4.3 Enhancing Intrinsic Motivation in Organisation
Despite the fact that intrinsically motivated behaviour is voluntary, only the conditions for
their emergence and strengthening can be managed and guaranteed (Osterloh et al; 2005:
235). It is concluded by Osterloh et al., (2005) that the following specific factors favour a
higher level of the respective intrinsic motivation:
Interest in the activity: An individual must express interest in the activity that supports the
job. Employees are happy on their job when they know the outcome of their input, when they
are responsible for the outcome, and when they are certain that their work is meaningful.
Personal communication and relationship: One of the factors that raise the intrinsic
motivation to cooperation level is when personal communication is very strong between the
different levels within the organisation especially when there is a team-based structure that
fosters personal relationships among the employees and between principals and agents.
Participation: When there is the possibility of co-determination among the employees,
employees tend to engage themselves in mutually-set goals and take the goals as their own.
Participation does not only allow far reaching compromises between divergent interests but
also assist in harmonizing preferences.
Message conveyed: Rousseau (1995) asserts ‘‘the more a principal acknowledges his or her
employees’ intrinsic motivation as part of a psychological contract, the more intrinsic
motivation is fostered. Such a message supports both enjoyments in the task as well as
obligation to internalised norms.
According to Osterloh (2005: 9) it is practically difficult to tailor a person who is intrinsically
motivated to work according to the particular goals of the organisation than to tailor a person
who works mainly for monetary compensation. Firstly, it is difficult to enforce intrinsic
motivation as it can only be enabled. Secondly, firms are not interested at all in enabling
some kind of intrinsic motivation like the reading of a novel at work. Osterloh (2005: 9)

119
further mentions how intrinsic motivation can be enhanced and the following is asserted in
this regard:
Autonomy, which refers to self-independence with less control from a leader
Feelings of Competence, which refers to the fact that the employee is competent to
handle the job skilfully
Social Relatedness, which refers to the relationship with others in the form of team
spirit.
Herzberg (1966) argues that intrinsic factors are motivators or satisfiers and these are:
Achievement
Recognition
Responsibility
Advancement and
Work itself.
4.4.4 What Motivates or Energies Employees
Notably, human resources is the greatest asset that any organisation can have to achieve the
goals and objectives of the organisation as well as enjoying competitive advantage in the
industry in which the organisation is operating. To accomplish this, there is a need for
motivation, hence, ‘managers must motivate employees and understand how to get the best
from the employees every-day of the week. Motivation is the world’s greatest management
principle, it is in light of this that understanding what motivates the employees, getting
creative with rewards, and recognition as well as putting together a system of low-cost
rewards is crucial (Nelson & Economy, 2005: 59).
Nelson and Economy (2005: 62-66) argue that managers should not believe that the only
thing that their employees want is money but suggest that managers can develop and maintain
motivated, energised employees with little or no cost. This according to Nelson and Economy
(2005) is a function of how employees are treated on a daily basis. They argue that manager
can do the following to energise the employees.
Praise: This is a form of saying thank you to the employees by their manager not
verbally alone but through writing e-mail, and short message services (sms). It is
contended that taking time to say you recognise them, makes the employees to do
120
more than they would normally do (Corpus & Lepper, 2007; Grant & Gino, 2010;
Mumm & Mutlu, 2011).
Support and involvement: Managers should support their employees by providing
them with needed information regarding their job and allow them to be involved in
decision-making processes, by seeking their opinion and ideas in respect of the job
they do and equally support them when they make mistakes in the course of carrying
out their daily or routine duties (Marinak & Gambrell, 2008; Prebensen, Woo, Chen
& Uysal, 2012).
Autonomy and authority: In most cases, employees are of the view that they should
be allowed to do their job in the best way they could, that is, making them to do their
duties independently and allow them to have authority over the job by giving them a
choice of assignment whenever it is possible. They should be given opportunities of
having autonomy and authority to get their job done and the ability to spend or
allocate resources, thus making decisions and manage others (João, Calheiros &
Barata, 2012; Cooman, Stynen, Van den Broeck, Sels & De Witte, 2013).
Flexible working hours: Time is a precious thing to the employees and it is the new
money for today’s employees who expect work to be integrated into their life and not
consume their entire lives. It is employee desire to have more time with their families;
managers should be sensitive to the free time of their employees irrespective of how it
is being spent, for example, with their families, church activities, leisure and so on.
Thus, managers should be more flexible in using time (McNall, Masuda & Nicklin,
2010; Van den Broeck, De Witte, Vansteenkiste, Germeys & Schaufeli, 2011).
Learning and development: Employees cherish the opportunities in which they can
acquire new knowledge and skills that broaden their horizon regarding the job and
that enhances their worth and marketability in their current job as well as future
positions. Thus, managers should support employees to learn new ideas, skills and
acquire more knowledge relating to their job by discussing career options with them
(Egan, Yang & Bartlett, 2004; Tabassi & Abu Bakar, 2009; De Rljdt, Stes, van der
Vleuten & Dochy, 2013; Hung, Lai & Chang, 2011).
Manager availability and time: It is recommended that managers spend more time
with their employees out of their busy schedule as this adds value to the employees
and inspire them to do more. This then serves as a practical purpose of learning and
communication, answering questions, discussing possibilities, or just listening to an

121
employee’s ideas, concerns and opinions (Collings & Mellahi, 2009; Jacobsen,
Hvitved & Andersen, 2013).
Malik (2010) argues that there are other factors that are neither financial nor monetary in
nature that motivate employees to do their best in terms of achieving the set goals of the
organisation. These motivational factors are rated according to the level of their importance
to the employees of the university where the research was conducted. These motivational
factors are living in a safe area, good salary, promotion and growth within the organisation,
interesting work, conducive working condition cum environment, sympathetic help with
personal problems, appreciation of work done and finally, personal loyalty to employees
which is also known as organisational commitment (Abdullah & Islam, 2012; Fagley &
Alder, 2012).
Gupta and Tayal (2013) through their empirical work on the impact of competing forces of
motivational factors at work place established that the desire for position, power, and security
were highly ranked factors that motivate male workers’ to produce more. On the other hand,
for the female sets, the need for security, achievement, working conditions and appreciated
by management were the motivating factors for them.
4.4.5 Employees’ Perceptions and Motivation
Herpen, Praag and Cools (2005) in their study of the effects of performance measurement and
compensation on motivation: entitled an empirical study contends that there exist a positive
relationship between the perceived features of the complete compensation system and
extrinsic motivation. Intrinsic motivation they argue is not influenced by the design of
monetary reward, but by promotional opportunities. These authors equally established that
the remuneration structure also affects work satisfaction and turnover intent in a significant
way. The most interesting thing is the contribution to the body of knowledge on the
employees’ perceptions and motivation. Herpen et al. (2005) asserts that for a remuneration
scheme to be effective, it depends on three major perceived characteristics and these three
characteristics are inter woven namely (a) transparency, (b) fairness and (c) controllability.
Each one of these is enumerated below in detail.
Transparency
The supposed openness of a reward system is a function of two things: communication and
complexity. The open system passes on information to an employee who likes to avert risk
122
not only of rules of remuneration scheme, but also of what the firm wants to achieve through
the compensation system. Also, undisrupted communication of the guidelines to the
personnel enlightens them as well as creating more support for the reward system (Urbanek,
2009; Umoh, 2011; Adewale, 2013).
Fairness
The employees’ perception of the reward system is that there should be fair play when it
comes to remuneration. This is anchored on the equity theory propounded by Adams (1965)
which emphasises that the employee needs to compare his reward with other employees to
determine whether their reward is also at par given that they possess the same skills, talents,
efforts, education which they brought in to the job. This is corroborated by Locke and Henne,
(1986) in their argument that an agent is expected to relate his or her ratio of effort over
reward to the same ratio of his or her counterpart agents. Any discrepancies in this ratio lead
to a state of inequity and may cause dissatisfaction on the part of the employee which is
affected and which invariably may impact negatively on the turnover intent.
Controllability
This is the third characteristic used by Herpen et al., (2005) in analysing the reward scheme’s
efficacy towards understanding the relationship between effort and compensation as a
variable. Baker (2002) views controllability as the degree to which the agent is able to
regulate or influence the result.
4.5 CHARACTERISTICS OF MOTIVATION
The characteristics of motivation include the following: -
Enhancing high productivity performance: motivation is put in place to increase the
level of productivity within the organisation so that the competitive advantage of the
firm is realisable within a short frame of time.
Boosting the morale of the employees: motivation is also provided for within the firm
to serve as an encouragement to the employees so that they would do their best by
being devoted, dedicated and committed to the set-up goals of the organisation.
Enhancing career development among employees: motivation is set up to serve as an
enhancement to the career development of employees and this becomes achievable
through the organised programmes that are being sponsored by the organisation in the

123
form of training like on-the-job training, off-the-job training, just-in-time and train the
trainers technique. The development programmes are an enhancement to career
development for those employees in the executive cadre by sending them to
conferences, seminars, simulation, brain storming, and role playing development
programmes.
Enhancing self-determination through employee contribution to teamwork within the
organisation: motivation is equally structured for each employee to determine for
himself or herself what he or she is going to contribute in the section where they work
or serve within the organisation and this is done through team spirit or what is
referred to in management as “enspirit de corps”.
Integrating the organisations strategy with the organisation’s mission, vision and
objectives: the integration of the mission, vision, and objectives alongside with the
organisation’s strategy goes a long way in motivating the employees because they
have an understanding of what the organisation’s strategy is all about, what the vision,
mission and objectives are all about and also in terms of being a leader in the industry,
working towards customer satisfaction, protecting the interest of the shareholders as
well as those of the employees.
4.6 MERITS AND DEMERITS OF MOTIVATION
In any given situation, there are gains and losses and the issue of motivation as a subject of
interest is not an exception in this regard. According to Aworemi, Abdul-Azeez and
Durowoju (2011), the merits and demerits of motivation are as follows:
4.6.1 Merits of Motivation
It boosts the morale of the employees.
It enhances employee productivity.
It enhances organisational productivity.
It encourages employees’ commitment and dedication to work.
It helps in the retention of skilful employees.
It reduces industrial conflict within the organisation.
It encourages harmonious relationship between the union and the management.
It reduces the rate of labour turnover among employees.
It equally puts to the barest minimum the rate of absenteeism of the employees from
work.

124
4.6.2 Demerits of Demotivation
it leads to low productivity of both the employee as well as that of the
Organisation
It can reduce the revenue of the organisation
It can also result into high rate of labour turnover of employees by losing highly
skilled personnel of the organisation
It can result in loss of competitive advantage
Absenteeism may be highly pronounced if employees are demotivated
Strikes may be the order of the day when there is lack of motivation within the
organisation
All the aforementioned demerits may come to play when motivational programmes
within the organisation are not properly organised and executed.
4.7 JOB SATISFACTION
The concept of job satisfaction is one of the rudimental factors in achieving organisational
performance as well as employee’s performance in an organisation. Hence, it is one of the
aspects of motivation that will endears the interest of employees in their responsibilities to
attain the set-up goals of the firm (Feinstein and Vondrasek, 2000; Ahmed et al., 2010; Ҫelik
et al., 2011; Amila Prasanga & Gamage, 2012).
Job satisfaction is a set of attitudes that individuals portray as regard their jobs which is a
resultant effect of the various perceptions of individuals concerning the job or task they do.
This is also an emotional issue or evaluative component that constitutes positive, neutral or
negative feelings of an individual’s attitude that might be tagged the attitude object, or the
focus of attitude (Ivancevich & Matteson, 1990; Greenberg & Baron, 2000; Aydogdu &
Asikgil, 2011).
Simialarly, Eren (1993) and Ҫelik et al., (2011) emphasise that job satisfaction is an exhibited
attitude by workers as regards their jobs and as such it is a general expression of workers’
attitudes that are developed in respect of their jobs and is based on different characteristics of
the job in question. This relates to the social strata they have attained or gained relating to

125
their jobs and the experiences acquired through the job environment (Ҫelik et al., 2011).
Rashid, Wani and Kumar (2013) argue that job satisfaction and motivation are inseparable
tangible principles when it comes to the issue of success of any firm and its workers. Thus, if
workers are encouraged towards their job, they feel more satisfied in their jobs. Through this,
they then, offer their best effort and contribute their quotas with all potential they possess.
Benita and Anghelache (2012), on a study pertaining to teacher motivation and satisfaction
for professional activity, established that there is no difference between male and female
teachers when it comes to overall job satisfaction and its scope. These authors are of the view
that satisfaction derives from adequate and continuous learning motivated by a strong desire
for achievements and affiliation. Likewise, Subhan, Thirupalu, Safare and Azash (2012)
conducted a study on job characteristics as determinants of work motivation and job
satisfaction. The results show that skills, task identity, task significance and feedback serve as
either positive or negative predictors of job satisfaction of the employees. Latif, Shahi, Sohail
and Shahbaz (2011) in their study focus on job satisfaction among public and private college
teachers of Pakistan. The study concentrates on factors that contribute to job satisfaction and
dissatisfaction as well as examining the level of job satisfaction of teachers in the public and
private sector colleges. This study reveals more level of job satisfaction among the public
sector teachers compared to the private sector employees.
Balachandan, Panchanathan and Subramanian (2010) are of the view that employees in the
private sector and government insurance companies do not get affected to the same degree as
the other institutions by the motivational factors. This emanates from the results of the study
embarked upon by Balachandan et al., (2010) looking at the job satisfaction factor towards
the motivation of the insurance company officers. Arshadi (2010) study on basic need
satisfaction, work motivation, and job performance in an industrial company in Iran reveal
that autonomy support anticipates satisfaction of three psychological needs that are also
anticipated work motivation as well as job performance. Tella, Ayeni and Popoola (2007)
argue that there is a correlational relationship between perceived motivation, job satisfaction
and commitment. Tella et al., (2007) study which was on work motivation, job satisfaction
and organisational commitment of the library personnel in Nigeria indicates that there is a
negative correlation between motivation and the commitment of the library personnel.
126
4.7.1 Factors that influence job satisfaction
Various factors have been adduced by different authors influencing job satisfaction (Yang,
2006; Aydogdu & Asikgil, 2011; Ekere & Amah, 2014) and these are summarised into two
categories namely (a) factors related to the job (b) factors related to individual (Aydogdu &
Asikgil, 2011, Ekere & Amah, 2014).
4.7.1.1 Factors related to the job
Among the numerous factors related to the job as highlighted by Yang (2006) and Aydogdu
& Asikgil, (2011) are:
4.7.1.1.1 Pay
Remuneration in terms of wage and salaries are vital factors that determine the level of
satisfaction of an individual with the job. Money does not only help personnel to attain their
basic needs but is also necessary in making available the upper-level needs satisfaction of the
workers (Luthans, 1992).
4.7.1.1.2 Work itself
The monograph work of Herzberg et al (1959) titled The Motivation to Work that was
published in 1959 advanced the argument that it has been established through substantial
evidence that the work itself plays a major role in bringing job satisfaction to the fore
(Feidmann & Arnold, 1985).
4.7.1.1.3 Supervision
Supervision is another factor that relates to the job itself and it depicts the attitude/behaviour
of the supervisor as playing a prominent part in determining the reactions of the employees to
an event that is problematic. Notably, therefore, it has been revealed that employees who
perceive their supervisor as being more approachable and responsive tend to raise out their
concerns and thus enhance their job satisfaction as individuals (Ivancevich et al., 2005: 86).
4.7.1.1.4 Promotion
The chances of being promoted that culminates in the availability of advancement
opportunities cause anxiety when people fear that they might not secure promotion and
advancement possibilities and this may have an adverse effect on their performance.
Feldmann and Arnold (1985), as well as Şirin (2009) argue that a negative relationship exists

127
between measures of promotional frustration and measures of attitudes toward the
organisation.
4.7.1.1.5 Peers
An interpersonal relation amongst workers is a paramount factor in determining job
satisfaction. This means that the level of interaction among peers within the work set-up goes
a long way towards job satisfaction and that definitely affects the performance of the firm in
its entirety (Ivancevich et al., 2005:86; Aydogdu & Asikgil, 2011).
4.7.1.1.6 Working condition
The environmental condition of the work place is also an important factor in job satisfaction
in terms of providing good working conditions. For example, this range from working place
cleanliness, illumination, adequate and relevant tools to work with and health safety
measures. All these aid the employees to execute their duties more efficiently and effectively.
Working conditions such as flexible time, job sharing and shorter working weeks are highly
appreciated and valued by employees because they can facilitate off the job activities such as
leisure and outdoor games (Feldmann & Arnold, 1985)
In summary, Herzberg’s two theories of motivation are significant as they shed light on the
factors that relate to the job in question and as such determine the level of job satisfaction.
4.7.1.2 Factors related to the individual
The following factors enumerated by Pichler and Wallace (2009), Aydogdu & Asikgil (2011)
relate to the individual’s job satisfaction.
4.7.1.2.1 Loyalty of individuals
When individuals are satisfied with their jobs the turnover intent is highly reduced and stays
longer on the job. Many of the employees intend staying in the organisation and this derives
from their sense of duty, loyalty or greater obligation/assignment. Emery and Barker (2007)
assert that job satisfaction positively influences normative commitment of the employees to
their job (Clugston, 2000).
4.7.1.2.2 Experience
Experiences have an immense effect on the individual employee. The response of individuals
to the things that they do often arises from a number of factors such as work experience and
may be favourable or unfavourable (Cano & Miller, 2005).

128
4.7.1.2.3 Age
Kaya (1995) argues that age is one of the major individual factors that determine job
satisfaction. Kaya further asserts that elderly workers are more satisfied with their jobs
compared to those who are still young. This suggests that there is a significant relationship
between age and job satisfaction of the employee with the organisation.
4.7.1.2.4 Education
Andres and Grayson (2002) argue that graduates who possess career-oriented disciplines
have more job satisfaction than those who do not have these disciplines and these are
employees in agriculture and education with 60 per cent in each of these categories. Notably,
the parent’s source of pride shifted to their children through education achievement. It is
worth noting that financing higher education towards occupational status which eventually
leads to job satisfaction for both men and women is gender-based (Andres & Grayson, 2003;
Ganzach, 2003).
Haque, Karim, Muqtadir and Anam (2012) in their study titled ‘‘Dimensions of Job
Satisfaction of Library Professionals: a Qualitative Exploration’’ established that religious
values and environment are vital factors that contribute to the satisfaction of the staffs of one
of the largest public university in Malaysia. Haque et al., (2012) argue that there are factors
affecting job satisfaction level of employees. These factors are (a) personal factors and (b)
organisational factors.
Haque et al., (2012) divide these personal factors into the following categories:
4.7.1.2.5 Age and Gender
The outcome of wide-range study conducted among library workers of the public and
academic libraries reveal that the older library employees are contented than the younger
ones (Berry, 2007; Haque et al., 2012) but on the contrary, Albanese (2008) concludes that
almost all the cadres of the participants in academic libraries are satisfied with their jobs
irrespective of age. Viewing this situation from a gender perspective, Marjanja and
Kiplang’at (2003) argue that there are notable differences between male and female who
occupy the same kind of job. This manifests itself in the fact that males do more of the
skilful and better paying jobs which, contrasts significantly with the level of satisfaction
derived by their female counterparts. This is corroborated by (Boatwright & Forrest, 2000;
Maxwell et al., 2004; MacLean, 2006; Aydogdu & Asikgil, 2011) studies in this regard.

129
4.7.1.2.6 Religion and Race
The issue of religious belief plays a prominent role as a major determinant of job satisfaction.
McGinn (2003) asserts that the religious beliefs of African American librarians tend to mould
the level of their job satisfaction greatly. McGinn contends that many Afro-Americans are
victims of segregation because of their ethnic group and age thus making the staff satisfaction
to be endangered (Estabrook et al., 1990; Lin, 2008).
Haque et al., (2012) outline the following as affecting job satisfaction:
4.7.1.2.7 Leadership
Many studies (e.g. Jing and Avery, 2008; Durowoju, Abdul-Azeez and Bolarinwa, 2011),
reveal the import of leadership roles in ensuring job satisfaction of the workers under them.
The study done by Pors and Johannsen (2002) supported by the work of Mullins and Linehan
(2006) established that factors that correlates directors’ job satisfaction such as job autonomy
and delegation in decision making process could make job satisfaction to flow down to all
levels of the employees in the organisation.
4.7.1.2.8 Organisational Change and Technology Innovation
Leong (2008) indicates that there is a positive response by employees’ to changes by
displaying satisfaction and keenness for new aspects of work that guarantees improved
services. However, Por (2003) shows that, though there has been rapid change in their work
environment, which has a great impact on job security despite there being yet almost 50 per
cent of the participants in his study indicate a high level of satisfaction on their job. In the
situation of developing countries, Bii and Wanyama (2001) investigated the impact of
automation on the job satisfaction among librarians in Kenya. These authors established that
the staff members in the library were of the view that automation enriches and increases their
satisfaction with the job.
4.7.1.2.9 Continuing Professional Development
The evident development and new moves in technologies are pointers that organisations
should refocus and set veritable and attainable goals for workers’ development. This would
serve to ensure and boost their satisfaction with the job by creating avenues and opportunities
relating to continuous professional development and execute training programmes for the
workers within or outside the workplace (Todaro & Smith, 2006). The study done by Adanu
(2007) on continuing professional development in state-owned university libraries in Ghana

130
shows an agreement among managers and the staff that an active participation in continuing
professional development steps up their satisfaction on the job as well as improving
competence and career advancement on the job.
4.7.1.2.10 Recruitment, Rotation and Retention
Recruitment, rotation and retention of staff in an establishment is a formidable factor that
will generate an opportunity will reduce the level of monotony and give chances to the staff
to gain more relevant skills that will ginger or stimulate satisfaction within them (Malinski,
2002; Haque et al., 2012). In the same vein, Adomi (2006) made an attempt to measure the
impact of job rotation on staff satisfaction in Nigerian university libraries found that there is a
constructive response from large numbers of the participants that rotating their job will
tantamount to higher staff performance. Moreover, the findings of Orlando and Johnson
(2001), MacLean (2006) corroborated previous studies in that the flexibility involved in the
deployment of staff will arouse job satisfaction of the workers, create an encouragement in
them for a better utilisation of their skills, and this in turn brings an improvement in retention
rates and also facilitates the full engagement of human resource should there be any
budgetary hick-up.
4.7.1.2.11 Working Environment, Communication and commitment
It is a well-known fact through research that working environment, communication and
commitment influences and groom satisfaction of workers, the non-availability of these
indices will automatically reduce organisational commitment (Moser, 1997). In another
study, Adio and Popoola (2010) on the relationship between job satisfaction and career
commitment of librarians in Nigeria federal university libraries. They try to delve into the
main cause of dissatisfaction of library users and managers as relates to inadequate funding,
lack of promotion and recognition, and poor condition of service. The outcome of the study
revealed that both job satisfaction and demographic elements of the participants has a major
influence on career commitment of the librarians. Adio & Popoola (2010) recommended that
managers and administrators will record an outstanding performance in framing sound
policies vis-à-vis adequate working facilities, good atmospheric working environment, and
adopting different kinds of incentives like provision of official car, housing loans or staff
accommodation, study leave allowance, etc. all these will go a long way to improve job
satisfaction and tend towards the enhancement of career commitment of the library managers.
If the library managers in organisations can develop a participatory management style, open
131
communication, built relationships on the basis of honesty and truthfulness, more employees
will be satisfied, more committed and reduces turnover intents (Burd, 2003; Rersley & Forth,
2005).
4.7.1.2.12 Salary
This is the basis upon which the employment contract between the employer and the
employee is signed. Odunlade (2012) carried out an investigation on the relationship between
job satisfaction and compensation and benefits among the librarians; the study established a
positive relationship between the job satisfaction and compensation cum benefits since a
larger proportion of the respondents conceded that they are satisfied with the amount of
salary they are receiving. Contrary to the findings of Odunlade (2012), other studies has
shown that the side of low salary is responsible for dissatisfaction of employees’ which is a
common feature of the results from the studies of Marjanja and Kiplan’at (2003), Lim (2007),
and Albanese (2008). Specifically, Albanese (2008) in his study concluded that about 50 per
cent of the respondents avail the information that their salary package is primarily responsible
for them being dissatisfied on their job.
4.7.1.2.13 Stress
This the last factor identified under the organisational factors that is affecting job satisfaction
of the employees’ by Haque et al., (2012). Their study buttressed the findings of Topper
(2007) that the impact of stress will have dwindling effect on the satisfaction of library
workers, emphasising the necessity to reduce the impact of stressful situations, attention
should be given to unsatisfying and un-conducive physical working environments, routine
works, heavy workload of the staff and staff attitude towards the usage of new and advanced
technologies (Paque, 2005; Shaugnessy, 2006).
However, the study conducted by Lee and Way (2010) on individual employment
characteristics of hotel employees that play a role in the employee satisfaction and work
retention identified some factors that influence the overall job satisfaction and the intent to
stay within the hotel establishment according to the employment characteristics. It was
discovered that work environment factors indicates that the location of the hotel,
communication/language, work accomplishment, and working department had a strong
interface with overall job satisfaction for nearly all the participants regardless of their
employment characteristics.

132
Lee and Way (2010) move a step further to highlight some other factors that are critical in
achieving the overall job satisfaction of employees and these factors are enumerated below
4.7.1.2.14 Work Itself
This is a factor that is aggregated based on working conditions, shifts, training, career
advancement, and job security. The findings indicated that work itself is an essential
apparatus in determining the overall job satisfaction and the level of intent of the participants
to stay within the establishment. This majorly reflects those participants that work early
morning shifts or night shifts. However, the respondents at the managerial cadre portray more
interest on these factors: work environment and work itself. The result indicates that
participants occupying managerial positions have their focus mainly on their career goals in
relation to progressing to executive management cadre (Castel, Lemoine & Durand-Delvigne,
2011; Saeed, Lodhi & Iqbal, 2013; Hannif, Cox & Almeida, 2014).
4.7.1.2.15 Supervision
This is another index for measuring overall job satisfaction of employees. This has shown the
impulse on overall job satisfaction for line employees who wants consistency in their
personal relationships with either managers or customers as well. The supervision factor also
narrates that the longer the employee works in an organisation, the more they become careful
by giving more attention to management practices and policies. The study of Lee and Way
(2010) corroborated the study done by Bedeian et al., (1992) that revealed a positive
relationship between experience on a job and other job satisfaction factors. The revelation
from the study shows that by creating additional job empowerment opportunities, job
enrichment or enlargement for employees experience on the job has the potential to increase
their level of overall job satisfaction. In describing the association between supervision and
the intent level of remaining within the current hotel, participants who are not having regular
work shifts behave more sensitively to supervision because they are working under the
observation of multiple supervisors/managers. Those participants may as of a necessity need
to have steady information and supervision irrespective of the work shifts.
4.7.1.2.16 Compensation
This as a factor encompasses benefit package, pay, and workload that were esteemed as an
essential yardstick for gauging overall job satisfaction. The participants that are working for
more than forty (40) hours per week, participants working in the housekeeping section, and

133
those who are mainly on morning shifts thought of pay and workload as imperative to job
satisfaction factors. The result of the study revealed that personal status was insignificant for
participants that their duty is in the area that demands physical activities, while it portrays a
distinct relationship for those concluding office or administrative responsibilities and
participants that need personal business interactions. The study also discovered that for
employees who have worked for a long period of time in the hotel and employees who did
not have routine shifts, personal status is a vital contributing factor to overall job satisfaction
(Hina, Zamir & Nudrat, 2014; Ukandu & Ukpere, 2014). From this study, it can be inferred
that employers should ascertain that increased responsibility that goes along with interacting
with the employees is having a direct linkage with the improvement of working environment,
rather than just paying much attention to employees’ time on their duties alone. Shockingly,
the result revealed that compensation and personal status were not distinctly related to the
intent level of the staff to remain at the hotel notwithstanding the employees’ employment
characteristics. The result shows that the workers of the hotel were less bothered about their
pay but highly bothered with whom they are working with, the work they do and where the
work is being executed (Leung, Zhu, and Ge, 2009; Hon, 2012).
4.7.2 Consequences of job dissatisfaction
Since job satisfaction is very crucial and at the heart of the firm for the continuous existence
of the organisation and is congruent from the perspective of the organisation, it tends toward
higher organisational commitment of employees and high commitment results to the overall
success and development of the organisation (Feinstein & Vondrasek, 2000). Consequently,
it enhances growth, diligence, effectiveness and efficiency of the company with low turnover
intent from the employees’ (Mosadeghard, Ferlie & Rosenberg, 2008) but when employees
are dissatisfied, they leave the organisation, then it will have an inflationary effect on the
motivation of those staying within the organisation (Feinstein & Vondrasek, 2000) with a
resultant effect of workers loosing performance and efficiency which might cause a sabotage
on the work. Hence, this leads to the exit of the employee on the job (Sonmezer & Eryaman,
2008).
The consequences of job dissatisfaction as discussed by Aydogdu and Asikgil (2011) are as
follows

134
4.7.2.1 Absenteeism
This is the rate at which employees do not present themselves at work which is majorly
associated with job dissatisfaction. It has been supported through literatures that one of the
main factors attributed to job attendance is that job satisfaction plays a vital role on
attendance of employees.
4.7.2.2 Turnover
One of the determinants of turnover intent or staying within the organisation is job
satisfaction. When employees are not happy or satisfy with their work, they have high
tendencies of abandoning the organisation but if the perception of the employees about their
treatment is fairly okay and receiving remuneration package, it reduces the intent of leaving
the company.
4.7.2.3 Low productivity
It is highly accepted that when people are satisfied on their job, there is going to be a
correspondence productivity that will boost the organisational performance. In most
researches done, it is evident that the relationship between job satisfaction and productivity is
not significant.
4.7.2.4 Early retirement
This is one of the resultant effects of job dissatisfaction, hence, when people are having
negative attitudes toward their job, they prefer to have early retirement.
4.7.2.5 Low organisational commitment
Declining organisational commitment is an outcome of dissatisfaction and commitment
connotes the willingness of an employee to put in effort on behalf of the organisation and
having the intention/opinion for staying longer within the organisation.
4.7.2.6 Mental and physical health
Aydogdu and Asikgil (2011) asserted that people with low mental and physical health tends
to have low satisfaction, hence they are slow in learning new job-related tasks, records high
job accidents and lots of grievances this invariably affects the performance of the
organisation. Whereas, employees with high mental and physical health are more positive in
learning a new job-related skills and tasks, thus having fewer job accidents and also records
fewer grievances on the job.

135
4.6.2.7 Life satisfaction
According to Aydogdu & Asikgil (2011) job satisfaction is having a contribution to overall
life satisfaction of the employees, but when the employees are not satisfied on the job, it has a
direct bearing on the overall satisfaction of the personnel which may result to occupational
accident, low productivity, absenteeism and high labour intent thereby having a negative
impact on organisational performance.
McMurray, Pirola-Merlo, Sarros and Islam (2010) studied leadership, climate, psychological
capital, commitment and wellbeing in a non-profit organisation and submitted that job
satisfaction is having an effect on transformation leadership and organisation culture as well
as having effect on transformation leadership and performance. Hence, job satisfaction was
tagged as employee’s recognition (Mowday et al., 1979). The working environment
satisfaction and the work itself will definitely have a subjective reflection on individual
feeling while the research work done on job satisfaction dimensions include management,
salary, welfare, praise, promotion, colleague, system and job condition as contained in the
Herzberg two factor theory of motivation (Yang, 2006).
Spagnoli et al., (2012) described job satisfaction as one of the most researched constructs in
business science and organisational behaviour in their work titled “satisfaction with job
aspects: do patterns change over time”? They found out that job satisfaction as a study is of
paramount interest to scholars for diverse reasons which include (i) subjective evaluation of
work conditions (e.g., job characteristics, Schjoedt, 2009), (ii) job satisfaction is crucial to
managers and investigators who are interested in organisational outcomes, such as
organisational commitment (e.g., Yousef, 2002; Tsai & Huang, 2008; Rutherford et al.,
2009), extra-role behaviour (Bowling, 2010), intent to leave the job (e.g., DeConinck &
Stilwell, 2004; Rutherford et al., 2009), (iii) job satisfaction is taken as a construct that is
having major implications because of its multidisciplinary nature and covers all professions,
work, jobs, and contexts (Cropanzano & Wright, 2001), several studies also revealed that job
satisfaction is a key factor that influences productivity (e.g., Spector, 1997; Judge et al., 2001;
Schleicher et al., 2004; Ng et al., 2009). Job satisfaction is an attitude that relates to overall
attitudes towards life, or life satisfaction (e.g., Tait et al., 1989; Ilies et al., 2009) as well as to
service quality provision (Schneider & Bowen, 1985; Hartline & Ferrell, 1996). To cap it all,
Job Satisfaction is “---- an attitude that individuals have about their jobs. Job satisfaction

136
results from the employees’ perception of their jobs and the degree to which there is a good
fit between the individual and the organisation” (Ivancevich et al., 2005:86).
In terms of conceptuality, job satisfaction is a verse construct that covers all or most of the
characteristics of the job itself and the work environment, which employees perceived as
rewarding, fulfilling and satisfying, or frustrating and dissatisfying (Weiss, 2002).
Conclusively, all the argument about job satisfaction hinges on the general and shared believe
that global job satisfaction is anchored with a complex set of interrelationships of incentives,
rewards, tasks, roles, responsibilities, promotion opportunities, supervision, co-workers, and
job security (Ivancevich et al., 2005:86; Bowling et al., 2008).
Kim and Brymer (2011) through their study on the effects of ethical leadership on manager
job satisfaction, commitment, behavioural outcomes, and firm performance submitted that
there is a positive relationship that exists between executives’ ethical leadership and the
middle managers’ job satisfaction. Their study confirmed the findings of Brown and Trevino
(2006) and Neubert et al., (2009) that there is a direct linkage between ethical leadership and
followers work attitude, ethical leaders also generate the job satisfaction for their followers,
and there is equally a direct and indirect association between ethical leadership behaviour and
employees’ job satisfaction cum organisational commitment.
4.8 LEADERSHIP
The critical survival of an organisation is largely anchored on the leadership that exists within
the sphere of the firm. It is the wire link between the vision, strategic direction and change of
the organisation. Leadership has been in existence for as long as people on earth have co-
existed and it is present in all the cultures (Rukmani et al., 2010; Fibuch, 2011).
Leadership because of its relevance in organisations has been looked into by various authors
and it has been defined as the process by which a manager made an attempt to influence a
task related activity on his/her subordinates (Eze, 2010; Thom-Otuya & Tamuno, 2011).
Iguisi (2009) viewed leadership as interpersonal activities in which the efforts of groups or
individuals are being coordinated, stimulated, and controlled as well as being directed by
someone who is of a higher authority. In a nutshell, leadership can be said to be a relationship
that one person uses to influence or tilt the attitude or actions of other people.
In the same vein, Kaiser, Hogan and Craig (2008) carried out a study on leadership and the
fate of organisations and submit that the attitude of leaders do have an influence on the

137
performance of an organisation. In trying to give a working definition of leadership, it means
providing a solution to the problem of collective or team effort, that is, problem of getting
people together and combining their efforts to achieve, stimulate accomplishment and
survival of the organisation (Hogan & Kaiser, 2005; Kaiser et al., 2008). Three implications
of the above view was noted by Kaiser et al., (2008) that
Leadership entails having an influence on individuals to willingly contribute their
quota to the good of the group;
Leadership also involves organising and supervising the group to accomplish its aims
Goals vary from organisation to organisation in the sense that most organisations are
competing for limited scarce resources’’ which is an umbrella for having a proper
understanding of group performance.
4.9 LEADERSHIP AND ORGANISATIONAL PERFORMANCE
The performance of an organisation cannot be diffused away from leadership that exists
within the firm, which determines the success of the firm largely.
Durowoju et al., (2011) examined leadership styles and organisational performance in
Nigeria, an empirical analysis. They examined the effect of democratic, charismatic,
visionary, transformational, transactional and autocratic leadership style to measure
organisational performance based on financial performance, customer satisfaction and
employee satisfaction. The study revealed that there is a clear-cut relationship between some
leadership styles and organisational performance, which is through democratic, visionary,
charismatic and transformational leadership styles that are positively related to firm
performance most especially financial performance and employee satisfaction. This view was
supported by Teece, Pisano and Shuen (1997); Bryant (2003); Alimo-Metcalfe, Alban-
Metcalfe, Bradley, Mariathansan and Samele (2008); and Jing and Avery (2008).
Furthermore, Kaiser et al., (2008) submitted that leadership could be measured in terms of
emergence and effectiveness. Viewing it from emergence perspectives, it means working out
an influence on a group of strangers or reaching a high position in a social system. They said
leadership effectiveness is measured through the evaluation done by managers or how
managers managed to boost employee satisfaction, motivation and enhance unit results.
Sometimes leadership assessments are done through supervisors and subordinates which are
138
subjective in nature. Kaiser et al., (2008) was of the opinion that leadership effectiveness
could be measured via objectivity such as productivity or the rate at which employees are
leaving the organisation.
Similarly, in another study done by Peterson, Smith, Martorana and Owens (2003) they found
that CEO personality can be used to predict the ratings of executive team dynamics and
measure the financial performance of an organisation (e.g., revenues and returns on assets).
Conclusively, leadership role is an important measuring instrument in determining the
success of a firm.
Wang et al., (2011) studies the linkage between CEO leadership behaviours, firm
performance and employees’ attitude in a sample drawn from 125 firms in China. Their
conclusion was that there is a direct linkage between the CEO’s task-focused behaviours and
firm performance. It was also submitted that the CEO’s relationship-focused behaviours are
significantly related to employee’s attitudes and these attitudes leads to an improvement in
the performance of the firm. This also shows that when employees’ are satisfied, it brings
about positive increase in the firm’s performance.
Ogbonna and Harris (2000) carried out a research on leadership style, organisational culture
and performance with empirical evidence from UK companies. However, the study reveals
that there is a linkage or relationship between leadership style and performance which is
moderated by the form of organisational culture that is in existence within the firm. Ogbonna
and Harris (2000) further stressed that celebrated issues of direct leadership-performance
linkage may be located in numerous anecdotal accounts of advancement in company
performance that is a function of changes in leadership (Nicholls, 1988; Quick, 1992; Simms,
1997). Further studies revealed that the association between leadership and performance
coincide with the re-emergence of the ‘one best way to lead’ debate.
There has been a keen interest in charismatic leadership, which is mostly referred to as
transformational leadership, which is linked to organisational performance (Salanova,
Lorente, Chambel & Martínez, 2011; Carter, Armenakis, Field & Mossholder, 2013). It was
also submitted that the visionary and inspirational skills of transformational leaders motivate
followers to deliver superior performance as well as leading to employee’s satisfaction
(Nicholls, 1988; Quick, 1992; Bass & Avolio, 1993; Howell & Avolio, 1993; Bycio et al.,
1995).

139
Leadership styles adopted by managers and executives is said to have a direct impact on the
performance of an individual as well as that of the organisation in a business set-up.
Moreover, it was found out that leadership is mostly about creating an avenue for people to
contribute substantially to the organisation by making things happen in an extraordinary way
to record a higher performance within the firm as a whole (Ardichvilli, 2001; Elenkov, 2002).
Obiwuru et al., (2011) in their study of effects of leadership on organisational performance in
selected small scale enterprises in Ikosi-Ketu council development area of Lagos State of
Nigeria established that transactional leadership style had a significant relationship and
positive effect on performance, while transformational leadership style had positive but
insignificant effect on performance. They finally submitted that it is more appropriate and
effective to induce performance through transactional leadership style.
Lee and Chuang (2009) opined that to record a high level of organisational performance, it is
highly essential and imperative that an excellent leader should not only inspire the potential
of the subordinates in order to enhance efficiency but also strife to meet the yearnings of the
subordinates in the process of accomplishing the goals of the firm. However, suggestions
have been made that improvement of performance as organisations faces new challenges can
be facilitated and enhanced through effective leadership behaviours (Teece et al, 1997;
McGrath & MacMillan, 2000; Jing & Avery, 2008).
Rowe (2001); Zhu, Chew and Spangler (2005) opined that leadership is a major thing that
contributes to the improvement of organisational performance. In their study titled “CEO
transformational leadership and organisational outcomes: the mediating role of human-
capital-enhancing human resource management” looked at leaders as a key player in decision
making process, responsible for the acquisition, development and deployment of firms
resources toward the realisation of the set goals of the organisation. They are equally
involved in transforming those resources into valuable products and services to consumables
for their customers, and engaged in the delivery of values to stakeholders in the organisation.
Thus, they have the potential to font for managerial rents and hence bring sustainability of
competitive advantage.
4.10 TYPES OF LEADERSHIP STYLES
There are various types of leadership styles that has been identified in the literatures but since
late 1980’s, much of the leadership research focus has been on nature, characteristics and

140
certain effects of charismatic or transactional and transformational leadership style (Bass,
1985; Tichy & Devanna, 1986; Ardicvilli, 2001; Walumbwa & Ojode, 2003; Rukmani et al.,
2010; Obiwuru et al., 2011).
4.10.1 Autocratic Leader
This style of leadership gives commands and expects total compliance. It is dogmatic and
positive in nature. It also leads by the ability to withhold or give rewards and punishment,
does things without consultation with the subordinates on a proposed action or plan and
discourages participation from the followers (Weihrich & Koontz, 1993; Obisi, 2003; El
Masry, Kattara & El Demerdash, 2004; Durowoju et al., 2011).
4.10.2 Democratic Leader
This is also known as participative leader who consults with his colleagues and subordinates
on a proposed action or actions to be executed by encouraging them to have a say in what he
wants to carry out. A democratic leader is the listening type that pays attention to the views of
his colleagues, group and his associates by also cherishing, loves and gives them the liberty
and freedom. The democratic leader believes that the opinion of the majority counts and that
through his colleagues and subordinates greatness can be attained. Thus, he believes strongly
in delegating authority (Weihrich and Koontz, 1993; Obisi, 2003: 183-187; Durowoju et al.,
2011; Hon & Chan, 2013).
4.10.3 Laissez-Faire Leader
This is also referred to as Free-rein leader who portrays a nonchalant or care free attitude
toward taking an action concerning anything he wants to do. He depends mostly on the
subordinates in setting his own goals and the processes of achieving the goals. Subordinates
on this leadership style are left exclusively on their own to make decisions on how well to
execute their job responsibilities. In this situation, the standard for performance will be set by
the leader and gives the employees the free hand to look for a way of achieving the standard
he (the leader) has set. For this to be efficient and effective likewise the standard must be well
known to the employees and there must be motivational factors on ground to enable the
attainment of the set-up standards (Ardichvilli, 2001; Ferrell et al., 2008; Durowoju et al.,
2011).

141
4.10.4 Transactional Leader
This is basically found on an exchange process through which the leader made available
rewards for the subordinates in return for their effort to accomplish the set-up goals of the
department as well as that of the organisational performance. Here, the manager decides and
give a definite goal for their subordinates, gives line of action to carry-out the tasks and gives
room for feedback and assessment. It was found that transactional leadership use to have a
favourable influence on the attitude and behavioural responses of employees (Ardichvilli,
2001; Rukmani et al., 2010; Obiwuru et al., 2011; Durowoju et al., 2011; Thom-Otuya &
Tamuno, 2011; Fry & Nisiewize, 2013).
Wang et al., (2011) stressed that transactional leadership is having an exchange relationship
that connects the exchange partners’ own self-interests. Wang et al., (2011) expanding on the
work of Yukl (2002) argued that the transactional leadership pays attention on relationship
with employees which captures being supportive of and helpful to subordinates, developing
trust and confidence in employees, creating a friendly atmosphere, getting acquainted with
the problems of their subordinates, giving applause for a subordinate’s ideas, and
acknowledging the contributions and accomplishments of the subordinates.
Transactional leadership has assisted organisations in achieving their aims and objectives in
an efficient and effective manner by connecting job effort with valued rewards and by
ascertaining that employees are having access to the resources needed to bring the job to
fruition (Bass & Avolio, 1993; Zhu et al., 2005).
4.10.5 Transformational Leader
Transformational leadership is alternatively referred to as “charismatic” or “visionary” leader
(Wang et al., 2011). The transformational leader pays attention on things like planning,
articulating the vision or goals for the firm, following-up the subordinate activities or
performance, and making available the necessary support gadgets, equipment and technical
assistance as may be required for the accomplishment of firm goals (Wangs et al., 2011).
Thom-Otuya & Tamuno (2011) contend that transforming leader is the type that elevates,
mobilises, inspires, exalts, uplifts, exhorts and evangelise. They said further that transforming
leadership shows dynamism by creating a rapport with the followers who will fill elevated by
it, hence nurturing new cadres of leaders.

142
Hall, Johnson, Wysocki and Kepner (2008) from their study found that the strength of
transformational leadership lies in having an effective influence on all the categories of
people within the organisation and building strongly on the needs and values of the
associates. On the weaknesses of transformational leadership, Hall et al., (2008) emphasised
strongly that leadership is being treated virtually as a personality trait than as a behaviour that
be learned, hence, the tendency of power abuse emerges.
Ardichvilli (2001) was of the view that transformational leader do not pay attention only to
the current needs of employee’s but are also particular about the futuristic needs. He
concluded that transformational leadership is not a replacement for transactional leadership
but serves as complementary. This is supported through the works of Avolio et al., (1988)
and Bass (1990).
It has been asserted that transformational leadership crafts strategic vision; communicate that
vision through framing and use of metaphor, modelling the vision to reality by “walking the
talk” and putting in conscientious action as well as building commitment and dedication
towards accomplishing the vision (McShane & Von Glinow, 2000; Zhu et al., 2005). Studies
conducted empirically have shown that transformational leadership will lead to high levels of
cohesion, commitment, trust, motivation, and performance in an organisational environment.
Some of the previous empirical research and meta-analyses have shown that there is a
positive relationship between individual performance, organisational performance and
transformational leadership. It is also reported that there is a positive influence of
transformational leadership on follower’s performance as well as outcomes of the firm (Bass
& Avolio, 1993; MacKenzie, Podsakoff & Rich, 2000; Jung & Sosik, 2002; Walumbwa,
2002; Avolio, Zhu, Koh & Puja, 2003; Zhu et al., 2005, Mehrabi, Shahtabebi & Etebarian,
2013).
4.11 SELF-ACTUALISATION
This is one of the needs identified by Maslow’s hierarchy of needs in motivation which is at
the top of the needs. Ferrell et al., (2008: 302) opined that self-actualisation connotes being
the best the employee can be. Self-actualisation entails potential maximisation and a self-
actualised person simply feels that life is being living at its fullest in every way.

143
From the original work of Maslow (1943) titled “A theory of Human Motivation” using the
Goldstein (1939: 383) argued that self-actualisation is having the inspiration for self-
fulfilment namely “to the tendency for him to become actualised in what he is potentially.
This tendency might be phrased as the desire to become more and more what one is, to
become everything that one is capable of becoming”. The need for self-actualisation varies
from person to person. It may take the form of becoming the best and ideal mother in one, yet
in another it may be to become a great athletic personality while in another it may be
expressed in painting pictures or inventing new things (Goldstein, 1939; Maslow, 1943; De
Brouwer, 2009; Basit & Santoro, 2011).
Self-actualisation needs can only be attained when other needs have been met which also
brings a reflection of employees’ desire to attain their maximum potential (McFarlin &
Sweeney, 2003: 323). Arnolds and Boshoff (2001) in their work titled “the challenge of
motivating top management: a need for satisfaction perspective” submitted that the
satisfaction of self-actualisation needs (also referred to as growth and self-fulfilment needs)
in the workplace is a function of promotional opportunities, level of autonomy, task
challenges that prevails within the work environment. It is also argued that the adequate and
optimal utilisation of people’s endowment to the highest level has been proved to have
greater influence on employee job performance especially in relation to top managers
(Alpander, 1990; Cranny et al., 1992; McCampbell, 1996; Arnold & Boshoff, 2001).
Susan et al., (2012) in their work tagged “influence of motivation on performance in the
public security sector with focus to the police force in Nairobi, Kenya” while reviewing
Maslow’s 1943 work opined that the concept of self-actualisation has a direct linkage to the
challenges and opportunities faced presently by employers and organisations. It was also
stressed that the provision of adequate understanding, meaning, purpose and authentic
personal development for employees’ for life and not just for work is mandatory for the
employers of labour (Zaccaro, 2001; Susan et al., 2012).
To attain self-actualisation needs of the employees, modern employers and organisations
must show great interest and ready to learn: that sustainable success is anchored on a serious
and compassionate commitment by helping them to identify, pursue and attain their own
personal unique potentials. Through this recognition by the employers, they offer
developmental support to their employees’ in any degree that the employee seeks to grow and

144
become more fulfilled since this will be tailored toward greater performance (Densten, 2003,
Schafer, 2010, Edwards & Gill, 2012).
The contribution of Muo (2013) in his research titled “motivating and managing knowledge
workers: evidences from diverse industries and cultures” opined that self-actualisation need is
“the need to become everything that one is capable of becoming”. He went further to say that
self-actualisation is the main advancement need which actually is never fully satisfied and
hence, it becomes a permanent source of motivation. Silva (2007) through her paper
“eLeadership-Leading IT professionals to drive results” said that self-actualisation is a need
for employees to fully achieve their talents, capabilities and potentials. Therefore, the
manager or employers should bring to bear by providing enabling environment, challenges
and opportunities for the employees’ that will aid them to reach their full or apex of their
career. The focus of Silva (2007) was on information technology professionals of which their
major concern was on their rights to be in the correct job or task.
Self-actualisation is not an end in itself, but it is a process and a continuum which means it is
an on-going process. The concept of self-actualisation is when people make a concerted effort
to create their own unique core values and then live tenaciously by it. Decision about growth
or advancement that entails risk taking and courage or facing difficult challenges that is not
supported by surrounding people or norms (O’Connor and Yballe, 2007; Serotkin, 2010).
Crone and Beike (2012) in their empirical studies involving 48 students in their final analysis
about priming the non-conscious goal of self-actualise: can even the highest order goals be
primed non-consciously? submitted that attaining self-actualisation is a personal
determination of an individual which most often is accomplished through priming
mechanism.
In summary, many of the works done on self-actualisation needs do not have full lens on the
impact of compensation management on getting or fulfilling the self-actualisation needs of
the employees’ which will have a direct bearing on the performance of the organisation at
large. This study will try to find the impact of compensation management on self-
actualisation in insurance industry in Nigeria.
145
4.12 RELATIONSHIP BETWEEN MOTIVATION AND PERFORMANCE
Performance is achieved when employees are properly motivated and in the real sense of it,
motivation cannot be separated from performance because motivation is an inducement to
achieve greater performance.
Elisenberger and Aselage (2008) said that there is a positive relationship between motivation
and performance. This finding was a result of two field studies and a laboratory study done
on reward for high performance on experienced performance pressure, intrinsic interest and
creativity. Morrell (2012) found that there is a relationship between nonmonetary reward as a
form of motivation and productivity of individual thereby leading to performance.
Nonmonetary incentives do not only lead to employee motivation engagement but also in
reduction of firm’s expenditure or cost.
Manolopoulos (2008) used three organisations/corporations where the state is a major
stakeholder as the basis of his study sample, and found motivation to be highly related to
performance. Similarly, Manolopoulos (2008) in an empirical study using Hellenic extended
public sector of Greece established that there is a strong link between motivation and
performance. Larson, Latham, Appleby and Harshman (2012) established through their study
about CEO attitudes and motivation: are they different for high-performing organisations?,
found that there is a strong relationship between motivation and achieving performance
excellence.
Amila-Prasanga and Gamage (2012) in their study using 219 sailors from Sri Lanka where
they investigated satisfaction-performance model in Rapid Action Boat Squadron of Sri
Lanka Navy found that there is a substantial connection between motivation of sailors and
their performance on the job. This invariably leads to improvement on individual
performance and ardently improves organisational performance. Similarly, Almutairi, Idrus,
Emami and Alanazi (2013) using three five star hotels and 91 employees for their study in
Riyadh, Saudi Arabia revealed when employees are motivated and satisfied on their job, it
has a significant results on job performance of the employees which will in turn affect the
overall performance of the organisation.
Nimalathasan and Brabele (2010) in their study on job satisfaction and job performance
found that a positive association exists between two variables, that high level of fair
promotion, reasonable salary system, appropriate work itself, and good working condition

146
results to high level of employees’ performance and consequently enhances the level of
organisational performance. Trivellas, Kakkos and Reklitis (2010) used 220 employees of
bank branches located in central Greece and the result reveals that three out of motivation
elements are positively related to job performance. Similarly, Trivellas (2011) using 220 bank
frontline employees in Greece concluded that there is a correlation between motivation of
frontline bank employees and high level of job performance which in turn affects the
organisational performance.
Lamptey, Boateng and Antwi (2013) selected six public universities in Ghana as the basis of
their study, and found that there is a high bond between motivation and performance level of
librarians in public universities in Ghana. Babalola and Nwalo (2013) in their study that is
made of 356 librarians in Colleges of Education in Nigeria found that majority of the sampled
librarians are productive because the job motivation has a great impact on the productivity
level of the librarians. Olusola (2011) used employees of two industries in Nigeria namely
Frigoglas Nigeria Plc., and Ayokunle Industry Ltd both located at Ijebu-Ode, South West
Nigeria and found that there is an affiliation between intrinsic motivation and job
performance of the workers.
Conclusively, it is evident from the literatures that there is a link between motivation and
performance; hence organisations should place paramount importance on employee’s
motivation for the organisation to attain its full performance level.
4.13 THE ROLE OF LEADERSHIP AND MANAGEMENT IN MOTIVATION
Leaders and managers have an important and crucial role to play when it comes to
employee’s motivation within an organisational set-up. Gangwar, Padmaja and Bhar (2013)
submitted that leaders and managers inclusive can determine the employee’s motivation.
They were able to establish this through the scientific analysis of empirical data that in
private sector enterprises that the combination of autocratic leadership style and task-
orientation behaviour leads to high motivation. In public sector enterprises, paternalistic
leadership style with people-orientation yields higher level of employee’s motivation.
Chaudhry and Jeved (2012) used banking sector of Pakistan in their study of impact of
transactional and laissez faire leadership style on motivation concluded that transformational
leader has a positive and strong association on motivation of workers within the bank.

147
Similarly, Al-Khasawneh and Futa (2013) used students from three public universities in the
northern region of Jordan. The result of their study revealed that academic staffs working at
the surveyed universities adopted democratic style of leadership to motivate the students to
modify their behaviours. Chaudhry, Javed and Sabir (2012) conducted a study using all the
employees of all private and public banking sector of Pakistan. The result shows that
independent variables of transformational and transactional leadership have a strong and
positive association on motivation. This reveals that the leadership and management within
the banking sector of Pakistan plays a strong role in motivating the bank employees.
In terms of motivation, the following recommendations are made:
• Managers should find out what motivates individual employee.
• Both short and long-term incentives should be incorporated in the compensational
programme in order to motivate the employee to excel and hence bring an improvement
in the company’s performance as well as that of the individual employee (expectancy
and reinforcement theory).
• Intrinsic motivational factors such as acknowledgement, praise, task, achievement and
advancement potential should be provided as part of compensational programme within
the company so that the performance of the organization will be boosted (motivational
hygiene theory of Herzberg).
4.14 RELATIONSHIP BETWEEN COMPENSATION MANAGEMENT,
MOTIVATION AND ORGANISATIONAL PERFORMANCE
There is congruence between compensation management, motivation and organisational
performance that are the three major construct of this study. This is to say that the three
variables are highly related. Stringer, Didham and Theivananthampillai (2011) in their study
about motivation, pay satisfaction and job satisfaction at the retailer that uses a pay-for-
performance plan for front-line employees in Australasia found that motivation is positively
related to pay satisfaction which in turn enhances the outcome of the organisation. It was
further stressed that the qualitative insights shows a degree of importance of pay fairness
through the comparisons made with others by the respondents. The respondents shared the
belief that what they are receiving does not compliment their effort.
Similarly, Ghazanfar, Chuanmin, Khan and Bashir (2011) found through their study
conducted on managerial cadre employees of the sales departments of the cellular service

148
providers in Lahore, Pakistan that there is a strong rapport between compensation and work
motivation that leads to satisfaction on the job which in turn has a bear on the performance of
the organisation. Likewise, there is strong linkage that exists between compensation
management and motivation of employees. This was asserted by Khan and Mufti (2012)
through their research on effect of compensation on motivating employees in public and
private banks of Peshawar (Bank of Khyber Ltd and United Bank Limited). It was revealed
that employees are not motivated because of their skills nor when they are informed that they
would be rewarded rather they are motivated if the reward is on something they value. This
also is having a significant impact on organisational performance.
Armache (2012) studied the effect of compensation and other motivational techniques on
organisational productivity and found that there is a corollary effect on organisational
performance when employees are well compensated and highly motivated. Ude and Coker
(2012) found that incentive schemes impacts highly on employees motivation and
productivity in both the organised private sector and public sector organisations in Nigeria.
4.15 CONCEPTUAL FRAMEWORK
The conceptual framework developed for this study as it affects the performance of Insurance
Industry in Nigeria with special reference to A&G Insurance Plc. Most of the items in this
framework have been discussed in chapters 1, 2, 3 and currently in chapter 4.

149
Figure 4.4: Conceptual Framework
Source: Own compilation
4.16 CONCLUSION
This chapter discussed motivation, motivational theories, and types of motivation, leadership,
job satisfaction, and self-actualisation, linkage between motivation and performance,
leadership and management role in motivation, relationship between compensation,
motivation and organisational performance as well as conceptual framework. Motivation in
the workplace is considered a veritable tool in achieving organisational performance through
the vital resource called employees globally. In the literature reviewed, many human resource
practices has been deliberated upon including motivation in different environments like
America, Europe, Asia and Africa and there is an acknowledgement that motivation of
employees is imperative in accomplishing organisational goals and the relevance of it to this
study. A body of knowledge has developed across different industries globally, however in

150
Nigeria very little has been written about this subject in the insurance industry which is
another motivational factor for this study.
The next chapter will focus on research methodology.

151
CHAPTER 5
RESEARCH METHODOLOGY
5.1 INTRODUCTION
This chapter presents the method adopted to carry out the study, the population covered by
the study and the reasons that informed the choice. The understanding of research
methodology is imperative in order to avoid mistakes in chosing research methods for the
study. This is predicated on the fact that, the choice of research methods in terms of:-
research design, study population, sample size, sampling frame, techniques of sampling,
research instruments and statistical tools adopted in analysing data will have far reaching
implications on the research outcomes.
Other areas covered include administration of instruments, and procedure for data analysis, as
well as validity and reliability tests for the data collected.A description of the sources of data
used is also presented.
5.2 THE RESEARCH PROCESS
The process followed in this study can be summarised in figure 5.1 below.
Figure 5.1: The Research Process
Source: Quinlan (2011: 177)

152
5.3 RESTATEMENT OF RESEARCH OBJECTIVES AND QUESTIONS
The primary aim of this study is to assess the impact of compensation management and
motivation on organisational performance in the Nigerian insurance sector. This
automatically leads to the evaluation of the objectives of the study and based on this research
questions were identified.
Specifically, the following objectives are highlighted for this study:
To identify and examine the extent of compensation management and its effect on the
performance of insurance industry in Nigeria (taking A&G Insurance Plc., as a case
study).
To determine whether the organisation has achieved the satisfaction of the employees
To investigate the effectiveness of the organisation in terms of resources allocation
and achievements of its objectives.
To ascertain the impact of compensation management on employees’ motivation.
To investigate the impact of compensation management on employees leadership
roles.
To examine the contribution of compensation management to self-actualisation of
employees.
To determine the effects of government policies on compensation management and
workers’ motivation in the insurance industry in Nigeria.
To determine the relationship between compensation management, motivation and
performance in the insurance industry in Nigeria.
Subsequently, from the objectives, the following research questions were raised:
To what extent does compensation management affect the performance of employees
in A&G Insurance Plc.?
How has the organisation achieved the satisfaction of its employees?
How has the organisation achieve effectiveness in the allocation of its resources?
How did compensation management impacts on the motivation of the employees
toward greater performance?
To what extent does compensation management determine the leadership role of
employees?
How does compensation management enhance self-actualisation of employees?

153
Do government policies affect the relationship between compensation administration
and employees’ motivation?
Does any relationshiop exists between compensation management, motivation and
performance in the insurance industry in Nigeria.
5.4 RESEACH PHILOSOPHY
This is related to the type of opinions of chosen an enquiry method, which determines the
design, process, strategies and techniques adopted in investigating or revisiting the nature of
the standing knowledge about an object or a construct. Object in the case of natural or
scientific enquiry and construct in the case of social/management sciences research
principally in the areas of management, human resource management, marketing and
organisational behaviour (Gill & Johnson, 2010: 52, 185). This study deliberates on the
research philosophies in line with Quinlan (2011: 179) ‘the methodological pyramid’. She
segregated this into three sections in the methodological pyramid namely fundamental
philosophies, research methodologies and data collection methods. This is depicted by figure
5.2 below:
Figure 5.2: The methodological pyramid 1
Source: Quinlan (2011:179)

154
Quinlan (2011: 177), under the fundamental philosophies identified the research
philosophies, positivism, constructionism, interpretivism, functionalism, and critical theory;
feminism, post-structuralism and post-modernism. Some of these research philosophies are
discussed below before showing how the philosophy for this study was adopted.
5.4.1 Positivism
Positivism connotes a research philosophy that is rooted in natural sciences and which is
often times referred to as an objective research strategy, it is also saying that there is only one
objective that is real which is achieved through experiment (Saunders et al., 2012; Quinlan,
2011). Positivism from an epistemological view acknowledged that it is an intellectual way of
hypothesising, investigating and reporting authentic research, originally in the natural
sciences, and later embedded in the social sciences (Thomson & Walker, 2010: 248).
Positivism therefore concludes that the object being investigated and the meaning ascribed to
that object have a distinct separate existence from the researchers own perspective (Bryman
& Bell, 2011: 15). This view is also embedded in ontological research philosophy that a
researcher is independent of the mentality of any particular person; in essence, the existence
of the researcher and the social actors largely depends on collective attitudes and practices
(Baillie & Meckler, 2012).
5.4.2 Constructivism
Constructivism from ontological point of view specifies that social constructs are social
phenomena that develop from the view of social actors, individuals and actions of researchers
who create in parts their own realities (Quinlan, 2011: 99; Bryman, 2012: 32). This submits
that social constructions are developed from an understanding of reality and collaborations
among the social actors, as different from being perceived as something that is external to
social actors. In the same vein, Lincoln, Lynham and Guba in Denzin and Lincoln (2011)
argue that constructivists are interested in collective reconstructions of social phenomena.
Constructivism is also aligned with the views of the ontological realist that human practices
exists independently of any individual person an1d give credence to objectivity in the field of
social sciences and management sciences (Bosch, 2010).
5.4.3 Interpretivism
According to Quinlan (2011: 99) interpretivism is emphasising that all knowledge is a
substance of interpretation while Saunders et al., (2012: 116) contends that interpretivism
originated from two major backgrounds: phenomenology and symbolic interactionism.

155
Phenomenology describes the way the social actors perceived the world around them while
symbolic interaction laid emphasis on continuous interpretations and thought of the world we
live in. This elucidates the manners actors interpret and deliberate on the world we live in
based on our behaviours; which often times inspire/guide our values and activities.
This also serves as an alternative to positivism as it is also relates to research in natural
sciences. Interpretivism decries that there is the need to bridge the gap between the researcher
as part of the social actors and that which is being investigated that stands as part of the social
actors (Saunder et al., 2012: 116). This is an indication that the investigator and the human
behaviour being investigated cannot be separated. This is often used by researchers in the
field of social and management sciences.
5.4.4 Hermeneutics
Hermeneutics is also emphasising the issue of interpretation and also hinges on the study of
the procedures involved in interpretation (Quinlan, 2011: 99). Similarly, Bernard (2013: 19)
viewed hermeneutics as the continuous interpretation and reinterpretation of texts. He opined
that hermeneutics approach stresses that:
The stories has some underlying meaning from the point of view of people who tells
the story, and
It is the duty of the researcher to discover that meaning, having the knowledge that the
meaning can change over a period of time.
In the world of today, hermeneutics as a research method is being engaged in the social
sciences and is applied to all forms texts (written materials), including jokes, sermons, songs
and actions (Bernard, 2013: 20). This view of Bernard was supported by the views of
Smythe, Ironside, Sims, Swenson and Spence (2008) that the researcher is a thinker, and so
the reader too is invited to think about the issue at hand. Hermeneutics is also viewed as part
of phenomenology is popularly engaged as a means of research in the field of nursing
(Dowling, 2004)
5.4.5 Functionalism
The functionalism as a philosophical framework is rooted in sociology which a branch of
social sciences and this entails the study of societal structures with relation to how those
structures meets the need of the society (Quinlan, 2011: 99). Functionalism is also viewed as
interpretive philosophical framework that deals with regulation and control of all

156
organsational affairs which is embedded in the structural composition of the organisation as a
mini society (Dhillon & Backhouse, 2001). Similarly, Jennings, Perren and Carter (2005)
held the same view that functionalism is in line with interpretive philosophy relating to
regulations within the society that has a social norm. They claimed that researcher’s sticks to
the regulation viewpoint explain society in relation to the status quo, social order, consensus,
integration, solidarity, individual or system needs satisfaction. In summary, this functionalism
philosophical framework is being used for research by researchers in the social sciences
particularly in sociology field.
5.4.6 Research philosophy adopted for this study
After a major study of the relevant research philosophies, the researcher identified that
positivism is the most appropriate philosophy guiding this study. This suggests the necessity
to succinctly investigate the impact of compensation management and motivation on
performance in the insurance sector. The justification for this is that, this study takes
quantitative approach to collect and analyse data. Saunders et al., (2012) submitted that
positivism gives room for objective reality and has the goal of universal truth that basically
deals with human practices in the field of management sciences (Bosch, 2010; Baillie &
Meckler, 2012; Rubin & Rubin, 2012: 15). This study basically investigates the impact of
compensation management and motivation on organisational performance in the Nigerian
insurance sector. Therefore, the option of positivism as a philosophical position for this study
is to ascertain reliable and quality research outcome.
5.5 RESEARCH METHODOLOGIES
Research methodologies or research strategies connotes the whole method that a researcher
engages in collecting data with the objective of conducting research and effectively drawing a
logical and realistic conclusion/deduction (Asika, 2008; Creswell, 2014). From the
methodological pyramid by Quinlan (2011), she highlighted different types of research
methodologies/strategies such as survey, case study, experimental design, ethnography,
action research. The research design is a road map to execute the research study. This is also
a structured means of investigation aimed at identifying variables and their relationship to
one another and this is basically used for the purpose of gathering data for the research
hypotheses to be tested by the researcher or provide answers to the research questions (Asika,
1991, Saunders et al., 2012). The research design is a detailed specification that makes
provision for guiding data handling in such a way that the research is reproducible and can be

157
examined critically at a later date or time (Krippendorff, 2004). The appropriate design
depends on the research objectives and data requirements in attaining the objectives. There
are many arguments as regarding the research design and these arguments appear to take
place at the philosophical and practical levels. At the philosophical level, the nature of
knowledge issues (epistemological) is predominating. Epistemology is referred to as the
branch of philosophy that studies the nature of knowledge, its presuppositions and
foundations, and its extent and validity. While at the practical level, issues on the choice of
specific methods are addressed. In designing a study, there is the need to make choices at the
two levels (Creswell, 2014). The research design could take the form of qualitative,
quantitative or mixed research designs.
5.5.1 Qualitative research
This research method is also referred to as a qualitative descriptive study, which is a method
of choice when straight descriptions of phenomena are, desired (Sandelowski, 2000).
Similarly, Leedy and Ormrod (2010) as well as Saunders et al., (2012) argue that a qualitative
research design is a non-numerical method that serves the purpose of description,
interpretation, verification and evaluation and which does not allow the researcher to find
cause-and-effect relationships in order to answer questions such as What caused what? or
Why did such-and-such happen? This is viewed as a research that produces results/findings
not often arrived at by statistical procedures or other mode of quantification (Gill & Johnson,
2010, Alasuutari, 2010). This is not fit for this study because it explores experiences,
perceptions and understanding of the respondents (Quinlan, 2011: 308). The qualitative
method research is advantageous when using a focus group discussion because it captures the
observations on a specific area of interest in a liberal, non-threatening atmosphere (Cremer &
Ramasamy, 2009). This is also another reason why qualitative research method is not chosen
for this study.
5.5.2 Quantitative research
This is the kind of research that is largely used as a substitute for any data gathering approach
(e.g. questionnaire) or data analysis procedure (e.g. graphs or statistics) that produces or
engages numerical data. This also many a times answers the questions why, how, what is the
effect of one variable on the other. (Saunders et al., 2012; Leedy & Ormrod, 2010). Newman
and Hitchock (2011, 2012) make a brief distinction between qualitative and quantitative
research methods in line with Denzin & Lincoln (2005) and Becker (1996) as follows:

158
Quantitative research depends on an aspect of positivism and post-positivism while
qualitative research holds on to postmodern sensibilities.
Qualitative researchers believe that they are better chanced in capturing the
individual’s point of view through interview and observation. On the contrary,
quantitative researchers are of the opinion that such techniques are unreliable and
subjective in nature.
Qualitative research focuses its lenses on securing rich descriptions of data whereas
quantitative researchers are less bordered with details.
The nature of this research necessitated the usage of the quantitative research design and the
reason for adopting this design is that it is an appropriate means for arriving at statistical
descriptions especially when the population is large. The population of A&G Insurance Plc
which is the focal point of this study is 500 which is one the insurance organisations with
such a population of employees in Nigeria. Moreover, quantitative research design gives the
opportunity to ask a series of questions from the respective respondents and can make a
summary of their responses using percentages, frequency counts or more advanced statistical
indexes (Amaratunga et al., 2002; Leedy & Ormrod, 2010; Tillman et al., 2011). The overall
success of data generation and satisfactory response in any research effort is a function of
efficient, effective administration and implementation of any survey research, which also
relates to issues such as questionnaire design (Osuagwu, 2006). However, in quantitative
research to which this study belongs, such paradigms include empiricism, rationalism and a
mixture or combination of both (Hirst, 1975; Badenhorst, 2008; Babbie, 2014; Creswell,
2014).
The research design for this study was an empirical study, which adopted the usage of
primary data through the survey method. Primary data was purposely collected afresh by the
researcher for the purpose of this study. Primary data could be collected through observation,
interviews and questionnaire distribution (Saunders et al., 2012). Information was gathered
from respondents through a close-ended questionnaire.
5.5.3 Mixed method research
This method is described as the combination of both qualitative and quantitative research
approach for purposes of having a good understanding and rationale of the two approaches
(Johnson & Onwuegbuzie, 2004; Johnson et al., 2007; Saunders et al., 2012; Coopers et al.,

159
2011; Harrison, 2012). Under this method, the quantitative and qualitative data gathering and
analysis stages can be done together or chronologically (Saunders et al., 2012). The adoption
of mixed method is more challenging in terms of time consumption, costs and the process of
gathering the data under this approach is cumbersome (Johnson et al., 2007).
5.5.4 Experimental method research
This method is mostly used when conducting an experiment and is viewed from two different
perspectives, the view that laboratory experiment being performed in artificial environment
and the other view that laboratory experiment is performed in a natural environment where
the experiment often take place (Sekaran, 2003) Laboratory experiment is often used in the
natural sciences and which are really used in conducting experiments in social/management
sciences as a field (Quinlan, 2011: 182). She asserted that laboratory experiments are really
used in the business or social science research because of the difficulties encountered in the
applicability of laboratory conditions into the business or social sciences construct. While the
field experiments are regularly used in the social/management science research which take
place in real life circumstances like in business organisations and societies (Bryman & Bell,
2011). However, the researcher views the experimental design assumption as not useful for
this study does not have the mind to manipulate the independent variable. The justification
for this also hinges on the problems of incorporating experimental research design into social
and business studies as enunciated by Quinlan (2011).
5.5.5 Research methodology adopted for this study
This study adopts the quantitative research method which is in line with the non-experimental
design of ex post facto type (because the researcher does not have direct control over the
independent variable, hence, the intention to manipulate is not there). This was hinged on the
need to collect data at a particular period (Edmonds & Kennedy, 2013) from selected
respondents. The researcher also consider this for this study because it gives room for a
broader spectrum in terms of number or population and enhances the generalisation of the
results as well as given room for a greater objectivity and accuracy of results (Babbie, 2010;
Brians, Willnat, Manheim & Rich, 2011). This is considered as an appropriate design for the
study, in making a concise investigation on the association between compensation
management, motivation and performance in the Nigerian insurance sector.

160
5.6 RESEARCH CHOICES
This study viewed research choices to be the various techniques that available for data
collection and procedures for analysing data. There are many windows of opportunity opened
to a researcher in the form of methods to adopt for data collection/generation. Alastalo (2008)
identified the various methods as observation, interpretative method, experimental research
and surveys, but Punch (2005) summarises data collection into qualitative and quantitative
methods. Under qualitative, there are interviews, observation and documentary data, while
the quantitative methods include questionnaires, which are empirical in nature. In the same
manner, Nardi (2006) categorises the methods in research into four major captions namely:
experimental design, qualitative methods, content analysis and archival research and
quantitative methods. Similarly, Quinlan (2011: 179) in her methodological pyramid with
caption ‘data collection methods’ enumerated it as follows:- observation, questionnaires,
interviews, focus groups and scale The different methods of data collection as highlighted
above are expatiated further as follows:
5.6.1 Observation method
This is a method adopted in gathering data or information through watching and recording of
the information by the researcher. The observation method includes monitoring behavioural
and non-behavioural activities and conditions of sample subjects. That is, the researcher
endeavour to join the participants, with their activities making the researcher to become a
member of the participating group which affords the researcher the opportunity of sharing the
group experience. The researcher is not merely serving as an observer but having a feeling of
what the participants are going through (Asika, 2008; Babbie, 2005; Alastalo, 2008; Saunders
et al., 2012). For this study, this method is not relevant because this research is not
investigating attitudes or behaviours.
5.6.2 Interpretive method
This is similar to an explanation, which represents the outcome of a research where a control
variable is detected to be having a moderating effect through which an independent variable
has its effect on a dependent variable (Alastalo, 2008). This is however dealing with
understanding the differences between humans in the role they play as social actors (McLeod,
1994; Babbie, 1998, 2005; Alastalo, 2008). This was not used in the study because this study
is neither historical nor dealing with cultural studies.

161
5.6.3 Experimental research and survey
This method of research is the one that is being carried out or conducted through experiment
probably to know the effect of one variable on the other. This is basically used in the physical
sciences or research dealing with “natural” human behaviour (Babbie, 2005; Nardi, 2006;
Alastalo, 2008). This is viewed from two perspectives, the laboratory view that experiments
are performed in an artificial environment and the other view that field experiments is
performed in a natural environment where the events are often carried out (Sekaran, 2003). In
experimental research, one of the major shortcomings is manipulation of the variables (Gill &
Johnson, 2010: 71). This is not applicable to this study because the researcher does not have
the intention of manipulating the variables.
5.6.4 Qualitative methods
This is the method that is mostly used for field research and historical research. It is non-
numerical findings and interpretation of observations for the main aim of detecting the
underlying meanings and pattern of relationships that exist between variables (Babbie, 1998;
Punch, 2005; Nardi, 2006; Edmonds & Kennedy, 2013). The interpretation of findings under
qualitative methods most often are not made stronger or confirmed unless it is quantified
numerically (Bernard, 2013: 23). This is not applicable to this study because the study is
empirical in nature and not subjective.
5.6.5 Quantitative methods
This method of research involves numerical representation and the observations can be
manipulated for the purpose of description and explanation of the phenomena that those
observations reflected (Babbie, 2005; Punch, 2005; Nardi, 2006; Edmonds & Kennedy,
2013). Similarly, Amaratunga et al., (2002) argue that quantitative method stems out of a
resilient academic tradition that places great trust in numbers that represent views or
concepts. This study engaged the quantitative method because it emphasis testing,
verification, result oriented and generalisation (Ali, 1998)
5.6.6 Content analysis
This is a kind of drawing analysis from recorded human communications. Books, magazines,
web pages, poems, newspapers, songs etc. are suitable forms of content analysis for study
(Babbie, 2005; Nardi, 2006; Bernard, 2013). Jobber (1991) posits that it is not possible to
advocate which method is the most superior to the other in abstract terms because each of the

162
methods is having their own strengths and weaknesses. He stressed further that the task
confronting researchers was to assess each of them in the light of the survey objectives, the
nature of the information required and the possible availability of the resources needed for the
research.
In this type of research, suggestions has been offered that attempt should be made to mix
methods to a certain degree, because it shed more light and provides wider perspective on the
phenomena being studied (Easterby-Smith, 1991; Gable, 1994; Perry, 1998). Hence, this
approach has been integrated in this study and for the fact that this research is quantitative in
nature; data for the study have been collected/generated through the combination of an
opinion-based questionnaire survey for primary data and from archival materials from
secondary data.
5.6.7 Data collection techniques and analysis procedures adopted for the study
This study adopted quantitative technique/method research design for data collection which
involves numerical representation and suitable form of data analytical tools. The researcher
views this as an appropriate step to elicit information from the respondents and also to
succinctly investigate the association between compensation management, motivation and
performance in the Nigerian insurance sector. Using quantitative technique for this study
involves distribution of questionnaire that the respondents answered on their own without
aiding them to interpret the questions.
5.7 POPULATION OF THE STUDY
Population is said to mean all the conceivable elements, subjects or observations relating to a
particular phenomenon of interest to the researcher. Subjects or elements are separate
individual items that constitute the entire population, which may either be observed or
physically counted (Asika, 1991). Saunders et al., (2012) opine that population is the full set
of cases from which a sample is drawn or the complete set of group members. Pelosi et al
(2001) view population as everything the researcher intends to study. Similarly, Babbie &
Mouton (2001) argued that study population is that aggregation of elements from which the
researcher intends to draw or select the actual sample.
There are many organisations in the insurance industry in Nigeria such as Industrial and
General Insurance (IGI), Sovereign Trust, Cornerstone Insurance, Royal Exchange Insurance,
Crusader Insurance and so on (Ayeleso, 2010; Fadun, 2013). There are also many industries

163
in Nigeria such as Oil industry, Pharmaceutical industry, Food and Beverage industry and
Construction industry (The Nigerian Stock Exchange, 2014). The insurance industry with
special focus on A&G Insurance Plc. was chosen for this study due to its present progress
within the Nigerian economy. A&G Insurance started its operation over two decades ago as a
separate entity and due to the recapitalisation of the banking sector, which insurance industry
falls on in 2007. A&G Insurance Plc. was one of the insurance companies to emerge as a
result of merger and acquisition, and take off immediately after the recapitalisation and has
operated under a new identity for more than six years now. In addition, the strategic location
of A&G Insurance headquarters in Lagos is an added advantage. Moreover, A&G Insurance
has been a source of employment to many Nigerians, which also enabled the company to
perform well vis-a-vis the timid population of subscribers of the insurance service.
5.7.1 Sampling frame and sample technique
Sampling frame is part of the entire population of the study, which is a working universe that
was considered and used for in this study. Therefore, sampling is the process adopted in
drawing samples from the main population. However, in this study, the insurance industry in
Nigeria was used and mainly focuses on A&G Insurance Plc. The total population of A&G
Insurance Plc. is 500 employees’ which is broken down as follows:
Table 5.1: A&G Insurance Plc. Branches and the employee’s number there
Branch Population
Lagos Headquarter 134
Abuja Annex 32
Port Harcourt Annex 22
26 other branches with 12 employees each 312
Total 500
The sample taken is 250 out of the total population of A&G Insurance Plc. The Open Source
Epidemiologic Statistics for Public Health software, version 3.01(OpenEpi) was used to
determine the sample. Staff were not below the grade of supervisor, may either be a graduate
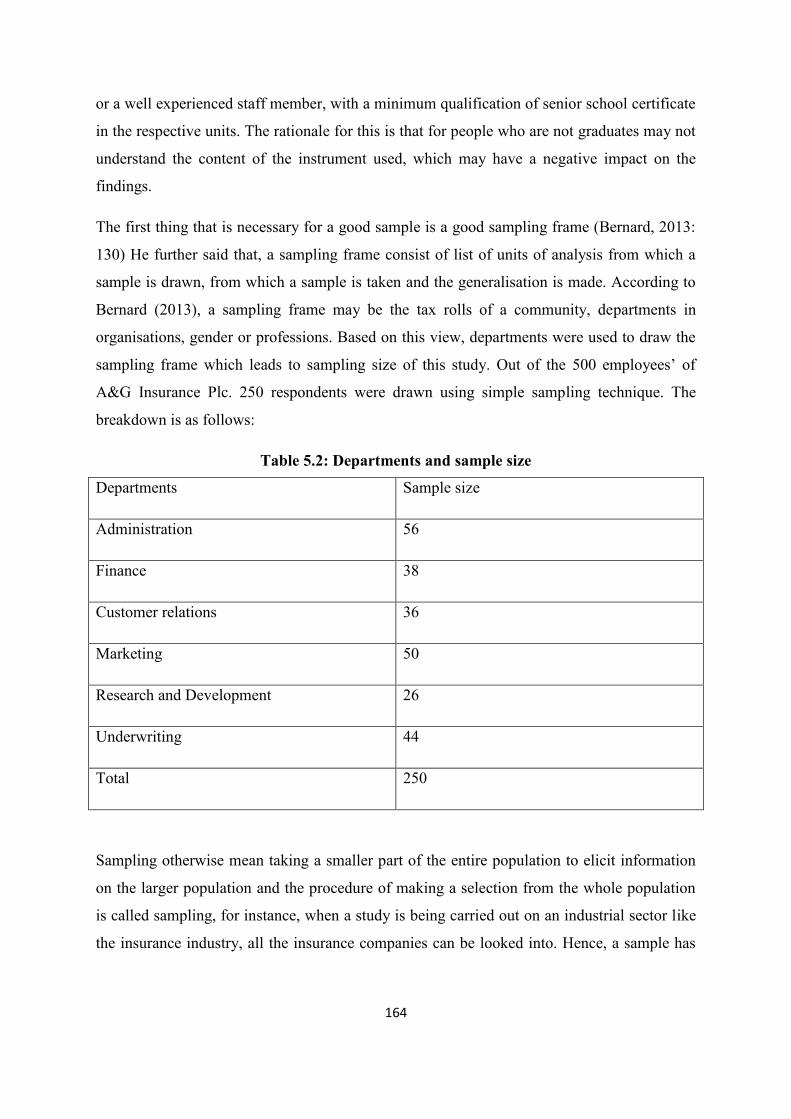
164
or a well experienced staff member, with a minimum qualification of senior school certificate
in the respective units. The rationale for this is that for people who are not graduates may not
understand the content of the instrument used, which may have a negative impact on the
findings.
The first thing that is necessary for a good sample is a good sampling frame (Bernard, 2013:
130) He further said that, a sampling frame consist of list of units of analysis from which a
sample is drawn, from which a sample is taken and the generalisation is made. According to
Bernard (2013), a sampling frame may be the tax rolls of a community, departments in
organisations, gender or professions. Based on this view, departments were used to draw the
sampling frame which leads to sampling size of this study. Out of the 500 employees’ of
A&G Insurance Plc. 250 respondents were drawn using simple sampling technique. The
breakdown is as follows:
Table 5.2: Departments and sample size
Departments Sample size
Administration 56
Finance 38
Customer relations 36
Marketing 50
Research and Development 26
Underwriting 44
Total 250
Sampling otherwise mean taking a smaller part of the entire population to elicit information
on the larger population and the procedure of making a selection from the whole population
is called sampling, for instance, when a study is being carried out on an industrial sector like
the insurance industry, all the insurance companies can be looked into. Hence, a sample has

165
to be taken out of the whole lot (Pelosi et al., 2001; Asika, 2008; Saunders et al., 2012; Leedy
& Ormrod, 2010).
5.7.2 Importance of sampling
According to Asika (2008), reasons for embarking on sampling process from a particular
population include the following:
To reduce the stress, cost involvement and time spent on the entire population
whether finite or infinite (i.e. may be the population size is imaginable and estimable
or not).
Within the components that constitutes the population of study, there are
commonalities hence the study of a few of those components gives a succinct
knowledge of what is peculiar or obtainable from the whole population of the study.
Whole population as a result of the nature and shape of the distribution or scattering
of the components of the population. Subsequently, there is need for sampling
because it is the only way to estimate the population characteristics in context.
Moreover, sampling affords the opportunity to deal with a fractional part of the
population; it is obviously cheaper to study a sample rather than the whole population
that is being considered.
Sampling gives the opportunity to be more comprehensive and gives room for a better
supervision than with a complete coverage of the population as a whole.
Sampling gives access to a quicker result than does a complete coverage of the
population.
5.7.3 Types of sampling
There are two types of sampling methods as identified in the literatures namely:
(i) Probability
(ii) Non-probability methods (Asika, 2008; Babbie, 2005; Saunders et al., 2012).
The choice of sampling technique for this study is probability sampling and this was chosen
because it gives room for using statistical inferences that can be generalised, achieving a

166
sample that is representative of the whole population (Lund Research, 2012). Another
justification for chosen probability sampling is that it reduces the error of duplication like
when conducting an interview, there is the tendency a person may interviewed twice or more
especially when the population is too large (Bernard, 2013: 129). Probability sampling is
guided by the positivist research paradigm and quantitative research method that is being
used for this study.
5.7.3.1 Probability sampling method
This is the method whereby the sample items or subjects are randomly chosen, that is, it is a
situation whereby every item in the whole population is given equal opportunity or chance of
being selected or included in the sample. The method of probability sampling include: (i)
random (ii) systematic (iii) stratified and (iv) area sampling (Bernard, 2013; Saunders et al.,
2012).
5.7.3.1.1 Random sampling
This means making a choice of a sample in such a way that every individual component of
the population has equal opportunity of being selected. However, when such a random
sample is made, it is assumed that the characteristics of the sample give an estimate
characteristic of the main population. Often, this process is referred to as randomisation
(Saunders et al., 2012).
5.7.3.1.2 Systematic sampling
This method involves the selection of the nth subject or the item from a serially listed
population subjects or units, where there is any number usually determined by dividing the
population by the required sample size. The population is normally denoted by N, for
example, in a population of 5000 items, 1000 items are to be selected using systematic
sampling procedure. The procedure is as follows:
Step 1: Number the items serially up to 5000
Step 2: Divide 5000 by 1000, that is, = = 5
Step 3: Randomly select a starting point, say, number ‘5’ on the population list
Step 4: Then select every 5th unit after the first. This list includes the following, 5th, 10th, 15th,
20th, 25th, 30th etc. on the population list (Asika, 2008; Lavrakas, 2008: 871).

167
5.7.3.1.3 Stratified sampling
This is a process whereby the entire population is grouped into some definite characteristics
and these groups are referred to as strata, and from these strata, the sample is chosen by
applying random selection technique on each stratum (Babbie, 2005; Saunders et al., 2012).
5.7.3.1.4 Area sampling
This is known as ‘cluster sampling’, which is used when there is recognition that some
populations are distributed in cluster forms (that is group of population that are close
together). This method is mostly applied or used in geographically distributed population
(Edmonds & Kennedy, 2013: 16).
5.7.3.2 Non-probability sampling methods
According to Asika (1991:45-46) this method does not allow or permit the use of
randomness. This is simply saying that not every item in the entire population has equal
chance or opportunity of being selected. The non-probability sampling methods include (i)
accidental or convenience (ii) quota and (iii) judgment
5.7.3.2.1 Accidental or Convenience sampling:
This is a situation whereby the opinion of people passing by is accidentally taken into
consideration to know their feelings about a particular situation. For instance, when a
researcher stands at the entrance of a supermarket shop and interviews any shopper that
accidentally passes by, about his views on a particular brand of product, this involvement is
called accidental or convenience sampling (Asika, 2008; Edmonds & Kennedy, 2013: 16).
5.7.3.2.2 Quota sampling
This sampling method involves matrix or a table, narrating the features of the target
population. This, most often, is a function of the research purpose. The need may arise to
know what proportion of the population is male or female as well as what proportions of each
gender falls within the age categories, educational levels, and ethnic groups and so on
(Lavrakas, 2008: 668-669; Quinlan, 2011: 214).
5.7.3.2.3 Judgment sampling
This method is based on the judgmental opinion of the researcher in question. For instance, a
person studying the use of birth control pills is not likely to get any good response from men,
very old women, pre-high school age girls, or people who are extremely religiously biased. In
the researchers view or judgment, typical cases will found among 16-35 years of age who are

168
still single and outgoing (Sekaran & Bougie, 2009: 280; Quinlan, 2011: 213; Edmonds &
Kennedy, 2013: 17).
5.7.3.3 Random sampling as a strategy adopted for the study
This is called simple random sampling or sampling without replacement (Quinlan, 2011: 210)
and what informed the choice of random sampling includes:
It reduces the level of biasness in terms of selection of items from the entire population
and guide against selecting cases that will support the research expectations or
hypotheses.
It provides room or basis for estimating the characteristics of the population as well as
estimates of the accuracy of samples.
It was chosen because of proximity or closeness to the base of the research or study.
It is convenient and reduces cost.
According to Creswell (2014), simple random sampling also aligns with convenience
sampling which emphasis the accessibility, enthusiasm or promptness of the respondents to
participate in the study. The biasness of convenience sampling could be removed when
adopted along with simple random sampling and this will lead to efficiency (Hedt & Pagano,
2011). The perspective of Ӧzdemir, St Louis and Topbaş (2011) is that probability sampling
is a better alternative compared to convenience sampling when it comes to making a
generalisation about the whole population. The process engaged in simple random sampling
is working with the human resource department of A&G Insurance Plc. to distribute the
instruments to the respondents
In order to be sure of gathering reliable and adequate data to investigate the research problem,
it was required that population sample was standardised and inclusive, that is, it is all
encompassing. As a matter of emphasis, it is necessary that such a population give a true
representation of insurance industry in Nigeria. Since the population targets have been
identified, the next step was to obtain a suitable sample frame. Hoinville and Jowell (1978)
suggest the use of single comprehensive database or source to establish sample frame in order
to avoid duplication or double counting (that is using a single source of information or by not
comparing two different entities together, for example banking sector and the manufacturing
sector).
169
The sampling technique that was adopted for this study and selection of the respondents from
A&G Insurance was random sampling techniques. According to Babbie & Mouton (2001)
and Krippendorff (2004) the major reason for sampling is to afford the researcher the
opportunity of selecting a set of elements from a population in such a way that those elements
(statistics) gives a true picture of the parameters of the total population from the elements
that are selected. Hence, the suggestion of random sampling or selection as a major process
where each element has an equal chance of being selected independently of any other event
in the selection process or chain. The reasons for making use of this method are in two folds
according to Babbie & Mouton (2001: 176):
‘‘First, this procedure serves as check on conscious or unconscious bias on the part of
the researcher. Researchers who select cases on intuitive basis might very well select
cases that would support their research expectations or hypotheses. Random selection
erases this danger. More importantly, random selection offers access to the body of
probability theory, which provides the basis for estimates of population parameters
and estimates of error’’.
This method was chosen because of proximity, convenience, and costs effectiveness to the
researcher and given every subject in the population an equal chance of appearing in the
selection. The sample will be an average of 250 respondents. This will cut across all the
departments within the organisation.
5.8 RESEARCH INSTRUMENTS
In this study, the researcher used the questionnaire as a research instrument. As observed by
Oppenheim (1992), Janke and Jones (2007) and Fink (2013) the opinion-based questionnaire
method as a self-administered questionnaire survey or mailing questionnaire survey is quite
useful. Hence, the researcher used it in this study. The first step taking was to obtain the
permission of the management of A&G Insurance Plc. and a gatekeeper letter was signed.
After the approval has been obtained, the questionnaires were given to the human resource
section for distribution to the respondents. Time that filling of the questionnaire will take was
stipulated on the introductory letter by the researcher and it was made known to the
respondents also that participation is voluntary. The respondents returned the completed
questionnaires to the human resource section of the organisation where it was collected after

170
two months. Frequent visit was made by the researcher to ensure that the questionnaires were
missing nor tampered with and kept secured.
Table 5.3: Linking the research objectives, research questions and questionnaire together
Research Objectives Research Question Questionnaire
To identify and examine the
extent of compensation
management and its
influence on the employee
performance of insurance
industry in Nigeria.
To what extent does
compensation management
affect the performance of
employees in A&G Insurance
Plc.?
My physical workings do not
influence my overall attitude
toward my duty.
When I finish a day work I
often feel I have
accomplished something
really worthwhile.
The supervision I receive
greatly discourages me from
putting in extra effort.
I completely satisfied with
supervision I got from my
immediate boss.
My feelings about my future
with company have a greater
influence on my overall
attitude toward my job.
I feel very uneasy about how
secure I am in my present
job.
To determine whether the
organisation is achieving the
Has the organisation
achieved the satisfaction of
Being able to keep busy all
the time.

171
satisfaction of the employees
them through compensation
its employees? The opportunities for
advancement on this job.
The chances to be
responsible to determine and
plan my work.
The policies and practices
toward employees of the
company.
My pay and the amount of
the duty I carry out.
The security of the job I do
for this company.
To investigate the
effectiveness of the
organisation in terms of
resources allocation and
achievements of its
objectives by motivating the
worker’s through modern
technologies and
infrastructural facilities.
Does the organisation
achieve effectiveness in the
usage of resources?
I am clear on the
performance objectives and
standards for my function.
I am clear on my decision
making authorities.
I have clear understanding of
my roles, responsibilities and
accountabilities.
My teams feel empowered
and supported to make
decisions.
We follow through on
promises commitments to
next steps.
I am clear on who I need to
collaborate with to be

172
successful in my role.
To ascertain the impact of
compensation management
on employees motivation.
Does compensation
management motivate the
employees toward greater
performance?
My supervisor allowed me to
do my own work on my own
and receive recognition from
as well.
My promotion is enhanced
through what I do on the job
or achieved.
The company policy is
friendly and flexible in
allowing contribution of new
ideas by an employee.
I do not enjoy adequate
interpersonal relationship
with my colleagues within
the organisation.
Developmental programmes
have been used by the
organisation to boost
employee’s morale.
I received the same
compensation with my
counterparts in similar
industry.
To investigate the impact of
compensation management
on employees leadership
roles.
To what extent does
compensation determine the
leadership role of
employees?
I make others feel good and
happy to be around me.
I explain with few simple
words about what we should

173
and could do.
I recognised and rewards
when others accomplished
their goals/objectives.
I make others to perceive and
think about old problems in
new ways.
I pay serious personal
attention to others who seem
rejected.
I am okay when agreed upon
standards are accomplished
by others.
To examine the contribution
of compensation
management to self-
actualisation of employees.
Does compensation
management enhance self-
actualisation of employees?
I do not feel ashamed of any
of my emotions.
I feel I must do what others
expect of me.
I believe that people are
essentially good and can be
trusted.
I avoid attempts to analyse
and simplify complex
domains.
I am extremely bothered by
fears of being inadequate.
I can express my feelings
even they tend to result to

174
unfavourable consequences.
To determine the effects of
government policies on
compensation management
and workers motivation in
the insurance industry in
Nigeria.
Does a government policy
affect the relationship
between compensation and
employees motivation?
Government policy as
regards compensation takes
adequate care of the private
sector.
Government policy on
compensation have greatly
influenced the review of
salaries in your organisation.
Government should enforce
her policies on compensation
on your organisation.
Government policy on
remuneration has contributed
to employee’s motivation in
your organisation.
Government policy on
remuneration has achieved
comparability between public
and private sectors pay and
benefit.
The questions posed to the respondents were commensurate with the objectives of the study
and such questions included the demographic data of the respondents such as sex, marital
status and age. This comprised section A of the questionnaire while section B questions were
asked on compensation such as (i) my salary is commensurate with the job I do? (ii) My
salary is better that than my counterparts own in similar industry etc. On job satisfaction (i)
being able to keep busy all the time (ii) there is opportunities for advancement on the job etc.
Questions on leadership role (i) I make others feel good and happy around me (ii) I explain

175
with few simple words about what we should and could do etc. Questions on job performance
(i) my physical working conditions do influence my overall attitude toward my duty (ii) when
I finish a day work I often feel I have accomplished something really worthwhile etc.
Questions on self-actualisation of the employees include (i) I do not feel ashamed of any of
my emotions at all (ii) I feel I must do what others expect of me etc. On organisational
effectiveness, questions include (i) I am clear on the performance objectives and standards for
my function (ii) I am clear on my decision-making authorities etc. Questions on motivation of
the employees include (i) my supervisor allowed me to do my own work on my own and
receive recognition from them as well (ii) my promotion is enhanced through what I do on
the job or achieved and so on. Governmental policy questions include (i) government policy
as regards compensation takes adequate care of the private sector (ii) government policy on
compensation have greatly influence the review of salaries in your organisation etc.
Moser and Kalton (1979) argue that this approach as outlined above is relatively simple and
not too difficult to administer. It has been evident from the literature that the design of the
questionnaire could take two forms- open or closed questionnaire (Fellows & Liu, 2008).
Questions in the open questionnaire were easy to ask but were very difficult to answer and
analyse while closed questions had a set number of responses as determined by the
researcher. The researcher was able to overcome these difficulties to some extent during his
vistitation to the organisation during the period of instrument administration.
Fellow and Liu, (2008) warned that such rigidity of available response may constrain the
responses artificially, hence a response opportunity of the other. In this study, the researcher
was flexible as it is a relevant tool for obtaining and gathering quantitative data for
statistically testing of some of the hypotheses of the study.
The researcher used questionnaires to collect data from primary sources. The questionnaire
method was used because the populations of the respondents were widespread across
geographical zones in Nigeria. In designing the questionnaire, both the objectives of the study
and the findings from the literature reviewed were taken into consideration.
A structured questionnaire was constructed and designed to elicit information’s from the
respondents in order to realise the objectives prepared for the research (Asika, 2008). This
original instrument mostly sought to establish how compensation is managed in the

176
organisation and how employees are motivated through compensation, job satisfaction of the
employees and how it leads to organisational performance in insurance industry in Nigeria.
The respondents here are the employees of Alliance and General Insurance Plc. (A&G
Insurance Plc.). The complexity and the technical nature of this research portrays the cogent
reason for directing the questionnaire to staff not below the grade of supervisor who may
either be a graduate or a well experienced staff with a minimum qualification of senior
secondary school certificate in the respective units that were covered.
The questionnaire for this study was divided into two sections, that is, Section A and B (See
Appendix B).
Section A: This section of the questionnaire requested general information about the bio-data
of the respondents. These questions include the age, sex, lengths of service, salary scale,
academic qualifications, professional qualifications, departments and geographical location of
the respondents. The researcher used this information to classify the respondents.
Section B: Section B of the questionnaire dealt with the issues of compensation management,
motivation, employee satisfaction, performance, leadership roles, self-actualisation,
organisational effectiveness and governmental policies. In this section, the respondents had to
score their opinions on Likert type scale of 1-7 as follows
1 Strongly Disagree
2 Disagree
3 Disagree Slightly
4 Neutral
5 Agree Slightly
6 Agree
7 Strongly Agree
The researcher chose the Likert-style of rating because it gives the opportunity to the
respondent’s show how he or she strongly disagrees or agrees with a specific statement or
chain of statements. In this study, the researcher decided to start from the strongly disagree to
strongly agree since there is no stringent rule in this regard.

177
In designing questionnaires for this research/study, guidelines from writers like Moser and
Kalton (1979) and Sinclair (1975) proposed five main issues worthy of consideration when
designing a questionnaire and these issues are:
1 Define objectives: The questionnaire should cover the defined objectives of the study
which has been highlighted in the earlier part of this study, that is, what the study is set out to
achieve (Sinclair, 1975; Moser & Kalton, 1979; Osuagwu, 2006).
2 Coverage: Coverage is the population of study for the research which is insurance industry
focusing its lens on Alliance and General Insurance PLC in Nigeria and the topic which is
perceived to be of great importance and sufficient interest to the respondents.
3 Sampling methods: This emphasis the procedure engaged for selecting units or elements
of observation from the entire population of study (Sinclair, 1975; Moser & Kalton, 1979;
Asika, 2008; Babbie, 2005).
4 Probability of non-response: This is meant to be the rate at which the respondent’s
responses are reduced which is a function of the length of the questionnaire. Experts has
submitted that reduction in the rate of non-response is achieved when the investigator or
researcher is not asking too many questions which may arouse the interest of the respondents
(Scot, 1961; Kanuk & Berenson, 1975; Sinclair, 1975; Hebertein & Baurngartner, 1978;
Moser & Kalton, 1979; Forsgren, 1989; Jobber, 1991; Ghauri et al., 1995).
5 Questionnaire wording: The wordings of the questionnaire must be simple to be
understood by the respondents and must be the one that will show the awareness and
knowledge of the respondents about the issues that the survey is covering. Lengthy questions
normally get the respondent tired or lose interest in getting the questions answered hence low
responses rate is recorded (Forsgren, 1989; Ghauri et al., 1995; Osuagwu, 2006).
In this study, which is addressing an assessment of compensation management and
motivation on organisational performance in insurance industry in Nigeria focusing on A&G
Insurance Plc. and it is perceived that it is of great importance and sufficient interest to the
respondents because compensation/salary is one of the major reasons why employees decides
to offer his/her serves to the organisation. In any case, the respondents are verse and well
informed which makes them to be able to supply the required information. The researcher
considered suggestions from both quarters of the debate regarding the effect of the length of

178
the questionnaire on the response rates. Therefore, the researcher made great efforts to reduce
the length of the questionnaire as much as possible and comprehensive enough as to be able
to capture the needed data to achieve the research objectives. In all, the questionnaire for this
study contains 54 questions.
Osuagwu (2006) reiterated that the foundation of any questionnaire is the questions. It is
necessary that the research objectives are translated into certain questions in the
questionnaire. The questions were developed and originated through a thorough review of
literature on compensation management, motivation and performance.
5.9 STRENGTHS AND WEAKNESSES OF QUESTIONNAIRE
Polesi et al., (2001), Babbie & Mouton (2001), Amaratunga et al., (2002), Tillman et al.,
(2011) and Bernard (2013) enumerated some of the strengths and weakness of questionnaire
as summarised in the table below
Table 5.4: Summary of strengths and weaknesses
Strengths Weaknesses
It establishes and creates both good rapport
and motivates the respondents because it is
clearly worded and easy to interpret by the
respondents. This connotes the
understandable nature of the questionnaire by
the respondents in order to be able to answer
the questions accurately and clearly.
The control of the interpretation of the
questions by the respondents is beyond the
control of the researcher no matter how hard
the researcher made efforts to make the
wordings to be simple.
It gives room for clarification of doubts in the
sense that wherever the respondents are not
having clear understanding about; the
questionnaire explains better and clears the
doubting attitudes of the respondents
The response rate is usually very low
especially when the questions are lengthy and
the researcher do not adequately follow up.
It is less expensive when administered to
groups of respondents if the respondents are
not located in different places because cost of
This highly subjected to serious sampling
problems especially when it is mailed or
when using phone book to select

179
transportation will not be too high. respondents.
It gives the assurance of almost 100 per cent
response rate especially when the
questionnaire is not lengthy and the wordings
are direct and easy to understand. This makes
it easy for the investigator to collect back
majority of the questionnaires from the
respondents without losing many of the
questionnaires
It is not possible to hide some questions away
from the respondents because the questions
have been prepared on a paper.
The anonymity of the respondents is high and
guaranteed because the identity of the
respondents are not known in the sense that
their names and address are not often
requested for when answering the questions
which gives room for utmost confidentiality
of the respondents information.
The respondents may react negatively
especially when it is going to take their time
when filling the questionnaire
It is useful in describing the characteristics of
a large population and making large samples
feasible especially self-administered
questionnaire because it allows the
investigator to have personal contact with the
respondents.
This is not useful when investigating into a
phenomenon with people that are not literate
or illiterate populations.
It is flexible in the sense that the researcher is
opportune to ask many questions on a given
topic, that is, there is the possibility of asking
variety of questions by the investigator on
his/her chosen topic.
The weaknesses were overcome through visitation to the organistaion and by making phone
calls at intervals.

180
5.10 ADMINISTRATION OF RESEARCH INSTRUMENT
The researcher administered the questionnaires personally to the various respondents in the
organisation during office hours through the assistance of HR department. This then followed
the administering of the instrument to the employees of the organisation across all the
departments within the firm. The total staff strength of the organisation is about 500
employees that cut across twenty-seven (27) states of the federation including the Federal
Capital Territory (FCT), Abuja. Two hundred and fifty (250) questionnaires were distributed.
The arguments of scholars like (Egbu, 1994; Olubodun, 1996) supported the self-
administered questionnaire. It is of the utmost importance to determine the sample prior to
having it administered. The sampling process of selecting the section or part of the population
from which the characteristics of the larger population can be inferred and be taken as a
legitimate and expeditions method of research (Egbu, 1994; Olubodun, 1996; Leedy &
Ormord, 2010; Punch, 2005; Gomm, 2008; Leeuw, 2008; Alasuutari et al., 2008).
Leeuw (2008) in Alasuutari et al., (2008) highlighted some of its importance and advantages
of self-administered questionnaire that made it quite different from structured interviews and
these are:
1. The presence of the researcher is not required while the respondents are answering the
questions, that is, the investigator’s physical presence is not necessarily required when the
respondents are answering the questions.
2. The respondents are having access to the questions in self-administered questionnaire,
which made the presentation of the questions to be visual, as well as having a general layout
that enhances the importance of the questionnaire. In this study, the presence of the
researcher is not 100 per cent needed when filling the questionnaire because the questions are
self explanatory and easy to understand.
5.11 PROCEDURES FOR PROCESSING DATA COLLECTED
The information obtained from the section A of the questionnaire (demographic data of the
respondents) was analysed with the aid of descriptive statistical techniques such as total
score, percentage, variance, mean and standard deviation. In the data analysis also, the
researcher used tables, diagrams, charts like pie chart, bar chart, and histogram and Pareto
diagram to show pictorial representation of the findings of the study.

181
(i) Total score: This is the summation of all the response of the respondents to all the
questions asked.
(ii) Percentage: This is the percentage representation of the respondents to the questions
asked (e.g. the percentage representation of the male respondents and female
respondents etc.).
(iii) Variance: This is the average of the squared deviation from the mean of the samples
which is obtained through the formula below
= this summation cover only the numerator of the formula of the equation
(iv) Mean: This is the summation of the total sample divided by the total number of
the valid responses X =
(v) Standard deviation: This is the positive square root of the variance, that is, the
sample standard deviation square root of the sample variance raw data that is
obtained from the respondents and the formula is
(vi) Tables: The researcher used this to depict the list of tables in analysing the data
collected, which appears in chapter 6 of the study.
(vii) Pie chart: This is a graphical presentation of a frequency distribution in a circular
form, which shows a breakdown of the responses of the respondents with
percentage share, for example, the educational qualification of the respondents are
attested to with the pie chart.

182
(viii) Bar chart: This is a form of frequency distribution that is used to depict the
information on the responses of the respondents, for example, the number of years
of experience in the job cum the number of respondents that have spent a certain
number of years in the job that are also in per cent shares.
(ix) Histogram: This is another form of frequency distribution and is a graph in which the
classes are marked on the horizontal and the class frequencies on the vertical axis. The
bars do not only represent the class frequencies but also join them together.

183
The graphs depict the responses of the respondents graphically in terms of their bio-data or
demographic information.
5.11.1 Quantitative survey data analysis
This was necessary for this study for analysing and interpreting the data gathered through the
questionnaire that was distributed to the respondents in the course of the study. This also gave
room to determine the relationship between compensation management, motivation and its
overbearing effect on organisational performance in the insurance industry with special
interest on Alliance and General Insurance PLC. To detect whether there were any problems
prior to computer entry, the researcher checked each completed questionnaire.
For data analysis, the researcher used the Statistical Package for Social Sciences (SPSS).
Firstly, for this purpose, the researcher assigned names to all the variables that were for entry
in the computer. Secondly, the researcher coded all the responses as well as fast tracked them
to the computer. Thirdly, the negatively word scale items were recorded and reassigned with
new values the moment the data entry had been completed. Fourthly, to get composite scores
for items on a scale, the researcher computed target variables. Fifthly, in a bid to minimise
data entry errors, the researcher carefully and thoroughly screened data files. In this regard,
the researcher checked frequencies or each variable in order to detect the out-of-range values
and values entered that were greater than five which would be rectified after reconciling them
with the questionnaires.
However, the researcher used inferential statistics for testing the non-parametric that
described the relationship between theory and observation of two or more independent
variables. Hence, such inferential statistics include analysis of variance (ANOVA), Chi-

184
Square (χ2) analysis, regression analysis and Pearson product moment correlation coefficient.
For this study, to proof the level of significance and analysing the research questions, the
researcher used the Pearson product moment correlation coefficient. These inferential
statistics are elaborated upon below
5.11.1.1 ANOVA
This is called analysis of variance. This is used to investigate hypothesis about the variances
in the means in groups. Analysis of variance is adopted in order to do a comparison between
the mean of several populations and also assists in testing certain prepositions as regards the
features of a model or to assess the components of the variance (Dodge, 2008: 9; Quinlan,
2011: 401). Lavrakas (2008: 26) put it as a statistical tool adopted in comparing groups on
possible differences in the average of a quantitative either on an interval/ratio or continuous
measure. He further stressed that ANOVA is the splitting of all the variation in the outcome
variable into units that can be explained by the features that are associated between the
groups. This was not used because the data collected does not involve many groups.
5.11.1.2 Chi-Square (χ2) analysis
The Chi-Square (χ2) analysis is used as a test of significance for definite variables. This
enables the researcher to get the probability that a sample estimate is a true representation of
the entire population (Lavrakas, 2008: 95). He said further that this is used as a test of
goodness-of-fit in univariate analysis or as a test of independence in bivariate analysis.
Similarly, Bernard (2013: 609) argue chi-square analysis shows may be there is relationship
between or among variables, it also depicts that the probability that an association is a result
of chance. He said that chi-square is mainly used for hypothesis testing that that there is no
significance between two normal variables. The formula for calculating Chi-Square (χ2) is
shown bellow
=
Where:
χ2 = chi-square
= summation
= the observed number of cases in a particular cell

185
= represents the expected number of cases for that particular cell
= the square of the difference between observed and expected.
This is not used because it does not really show the strength of association among variables.
5.11.1.3 Regression analysis
Regression analysis is a method that gives opportunity to someone to investigate and measure
the relation/association between two or more variables (Dodge, 2008: 450). He said that the
main aim of regression analysis is to evaluate the value of one variable as a function of one or
more variables. The variable that is being evaluated is referred to as the dependent variable
which is commonly represented by Y. While the variable that indicates variation or changes
in Y is commonly referred to as independent variables which are represented by X most
often. Bernard (2013: 626) viewed regression inform of a linear relationship between the
dependent and independent variables which is being represented by regression line and the
formula for this is
Where y is the dependent variable, and are some constants, and is the variable value of
the independent variable. It can be used to calculate the association between sales and profit
of an organisation over a period of time. The constant, a, is arrived at as follows
Where:
= constant
= mean of the independent variable
= another constant variable
= mean of variable value of the independent variable, and is arrived at through
the formula below

186
The researcher adopted and applied the categories of inferential statistical method to help
reduce the uncertainty that had surfaced and the reason for inferential statistical method is
because it gives the opportunity of generalisation for the whole set from the data in the
sample (Bernard, 2013). In making a business forecast, multiple regressions is a method that
is often favoured to the involvement of different environmental factors.
5.11.1.4 Pearson product moment correlation coefficient
This also referred to as Pearson’s (Bernard, 2013: 622) which is used to measure how much
of changes in one variable relate with correspondent changes in the other variables. It is also
engaged to determine the association/significance that exists between two variables.
Similarly, Ahlgren, Jarneving and Rousseau (2003) opined that Pearson’s correlation
coefficient measures the strength or direction (Strong association, weak association, or
moderate association, depending on the sign) of a linear relationship two variables and
can be arrived at through the formula below:
Where and stands for the means of the two variables. This view was also supported by
the study done by (Awai, Hiraishi & Hori, 2004; Koyuncu, Tok, Canpolat & Catikkas, 2010;
Krishna Naik, Gantasala & Prabhakar, 2010).
The correlation coefficient can take the values between -1 to +1. The positive or negative sign
of the correlation dictates the interpretation of its result. Laerd statistics (2014) argue that
when the correlation is positive ( 0), depicts that as the value of variable is increasing, so
does the other. For instance, when there is an improvement on reward system of an
organisation, so does the employee’s motivation, job satisfaction and self-actualisation.
This study used the Pearson product moment correlation coefficient to determine the level of
association that exists between the variables of the study and which is used to infer effects of
the variables on each other.
5.11.2 Test of validity and reliability
The test of validity and reliability was of great importance to this study as necessary entities
of instrument formulation as the investigator had to have a comprehensive report with
assurance on the outcome of the study (Burton & Mazerolle, 2011). Instrument produces

187
consistency in the results, or the consistency between the independent measurements of the
same research phenomenon (Osuagwu, 2002). This simply means that despite time variance,
the same set of elements must yield fairly the same results (Asika, 2008). The researcher used
Cronbach’s alpha (α) to test the validity of the instrument because of the large sample that
was taken, that is, 250 respondents (Sijtsma, 2009). Other tests of instrument validity were
regression coefficient and correlation coefficient.
5.11.2.1 Validity
The researcher attested to the validity to the degree to which the instruments measured the
constructs that were set out to measure or accurately measure what the researcher had
structured it for (Peter, 1981; Merriam, 1995; Burton & Mazerolle, 2011). Briefly, the
researcher clarified validity to be the accuracy of measurement and was to ascertain that the
instrument had actually measured the variables identified by the research work. Construct
validity was found to be more applicable to this research piece because it is the degree to
which an operation measure relationships with the theoretical concepts that is being studied.
This was crucial to this study because it allowed drawing the conclusion that is valid from the
outcome of study. The term validity specifically describes the extent to which an empirical
measure really shows the real meaning of the concept or phenomenon under consideration
(Burns & Bush, 1998; Babbie & Mouton, 2001; Burton & Mazerolle, 2011).
Construct validity in this study was assured by adapting the instruments developed by experts
in the field of study. Also, external validity of the instrument used in this study was
accomplished through comparison of the outcome of this study with similar study conducted
in other sectors of the Nigerian economy or other countries.
5.11.2.2 Reliability
This was to proof that the instrument produced the same outcome overtime when the
researcher used it to measure the variables that are about the degree to which the researcher
found the research outcome (Merriam, 1995; Burton & Mazerolle, 2011). Pelosi et al. (2001)
defined ‘‘reliability of a measure that indicates the extent to which the measure is without
bias (error free) and hence offers consistent measurement across time and across the various
items in the instrument.’’ In a simple way, the reliability of a measure shows the stability and
the consistency nature at which the instrument tends to measure the concept and helps in
assessing the goodness of a measure. Hammersley (2008) in Alasuutari et al. (2008), Babbie

188
and Mouton (2001) posit that reliability is all about the extent to which the same result on
different occasions or periods, that is, the measurement of the particular test as repeatable.
To test the consistency of the instrument utilised in this study, Cronbach’s coefficient alpha
was used through the application of Statistical Package for Social Science (SPSS) version 21.
The Cronbach’s alpha (α) was developed in 1951 by Cronbach (Streiner, 2003; Allen, Reed-
Rhoads, Terry, Murphy & Stone, 2008) and is the most widely used to measure the internal
consistency/reliability coefficient of an instrument by researchers (Webb, Shavelson &
Haertel, 2006). They argue further that it evaluates test-score reliability from single test
administration using evidence from the relationship amidst test items. Furthermore, it gives a
measure of reliability based on the covariation among items that are centre to the test; thus, it
is likewise referred to as internal-consistency coefficient. Another justification for the
utilisation of Cronbash’s alpha was that experts in similar field have adopted it in different
situations and in different environments and it produces similar outcomes. It has also been
used in Nigeria environment and the results are consistent.
5.11.2.3 Psychometric properties of the questionnaire
Psychometric properties considered the reliability and validity of the measuring instruments.
The statistical analyses of the data gathered from the measuring instrument involved an
assessment of internal reliability and validity of the instruments. This assessment includes the
calculation of Cronbach’s Coefficient Alpha (α). The Cronbach’s Coefficient Alpha (α)
measures the consistency among a set of items. The researcher examined all the aspects of the
instrument thoroughly to ascertain the reliability and validity of the instruments. Furthermore,
the researcher appraised the strength of the measuring instrument so that it produced
consistent results and that the procedure in its administration was reliable and valid for the
purpose of its measurement so that consistent could be accomplished (Denscombe, 2007).
5.12 INSTRUMENT MEASUREMENT
The instrument measurement are used to measure the variables of the study which are
adapted with modifications for the study, hence, 4.9.1 to 4.9.5 are the results from previous
studies from different backgrounds by different authors and not the outcome of this research
survey. This was important to this study to show that the instruments were relevant to this
study and was being adapted with modifications to boost the validity and reliability of this
work.

189
5.12.1 The Short Form of Minnesota Job Satisfaction Questionnaire (MSQ)
The Minnesota satisfaction questionnaire (MSQ) was developed by Weiss, Davis, England
and Lofquist (1967) and it was the outcome of the Work Adjustment Project. The aim of the
project was to advance an instrument for assessing work adjustment of the potential
applicants and the evaluation of work adjustment results. The long form of the MSQ is made
up of 100 items, 5 items per facet (Hancer & George, 2003; Khoo & St. J. Burch, 2008;
Bernhard & O’Driscoll, 2011).
Minnesota Job Satisfaction Questionnaire (MSQ), the short form of the MSQ consist of
twenty items and three-dimensional scales; intrinsic satisfaction, extrinsic satisfaction, and
general satisfaction and made up of 5-point scale ranging from 1 (very dissatisfied) to 5 (very
satisfied) (Weiss et al. 1967). Validity for the short form MSQ is subject to the long form
MSQ as well as from to other sources; studies of occupational group differences and studies
of the relationship between satisfaction and satisfactoriness (Weiss et al. 1967). Cronbach
coefficients for this measure depicts that the scales are reliable (Weiss et al. 1967). Scores on
the Intrinsic Satisfaction scale ranges from .84 to .91, scores on the Extrinsic Satisfaction
scale ranges from .77 to .82 while scores on the General Satisfaction scale ranges from .87 to
.92 and the median reliability coefficients were .86, .80, .90 for intrinsic satisfaction, extrinsic
satisfaction and general satisfaction respectively (Weiss et al. 1967). The short form of MSQ
was produced for research purposes. For this study, 6 items from the MSQ were chosen like
‘being able to keep busy all the time’; ‘the opportunity for advancement on this job’; ‘the
policies and practices toward employees of this company’ and ‘my pay and the amount of
duty I carry out’. This hinges on both the intrinsic and extrinsic satisfaction. In this study,
measure was based on 7-point Lirket scale ranging from 1(Strongly disagree) to 7 (Strongly
agree). For this study the Cronbach’s alpha (α) coefficient for the 6 items of MSQ was 0.74
which shows an internal consistency. MSQ has been engaged in various Nigerian samples
and it is found reported reliable alpha coefficient of 0.82 (Tella et al., 2007) and the internal
consistency between 0.82 and 0.93 (Gummi, 2011). The internal consistency of the
instrument is within the acceptable range and good coefficients based on the rule of the
thumb (Pallant, 2011, Bernard, 2013). This is relevant to this study to determine the level of
satisfaction that employees derived from their job via compensation management. It is
equally in Ngerian context because naturally people tends to exhibit the same nature and it is

190
to further validate the instrument in Nigerian environment as it has been reported by the
works of (Tella et al., 2007; Gummi, 2011)
5.12.2 Motivation Questionnaire Scale (MQS)
The researcher developed the Motivation Questionnaire Scale (MQS) items based on Mottaz
(1985), Brislin et al. (2005), Altindis (2011), and Mahaney and Lederer’s (2006) motivation
works. The MQS was scored on a 5-point Likert scale ranging from 1 (Strongly Disagree) to
5 (Strongly Agree). It consisted of 16 items and two dimensional scales; intrinsic motivation
(IM) measured by 8 items, for instance ‘‘I do have responsibilities related to work’’ while
extrinsic motivation (EM) was measured by 8 items, for instance ‘‘I have promotion
prospects’’. The Cronbach alpha α values of the main study were α = .79 for IM, α = .54 for
EM and α = .90 for motivation (the aggregate dimension of motivation) which reveals the
reliability of the scales (Altindis, 2011). For this study, 6 items from the MQS were chosen
like ‘My supervisor allowed me to do my own work on my own and receive recognition from
them as well’; ‘My promotion is enhanced through what I do on the job or achieved’ and
‘Developmental programmes have been used by the organisation to boost employee’s
morale’. In this study, measure was based on 7-point Lirket scale ranging from 1(Strongly
disagree) to 7 (Strongly agree). For this study the Cronbach’s alpha (α) coefficient for the 6
items of MQS was 0.81 which shows an internal consistency. MQS has been employed in
many Nigerian samples and with reported reliable alpha coefficient of 0.81 (Oyetola, 2012).
The internal consistency of the instrument is within the acceptable range and good
coefficients based on the rule of the thumb (Pallant, 2011, Bernard, 2013). This is relevant to
this study because it assists in determining or measuring factors that motivates the
respondents to put up certain behaviours or attitudes in the course of attending to the duty
schedules. In Nigerian context, it is also important because of every worker needs to be
motivated to get the best out of the worker and more so the scale has been widely adapted and
used in the literature in different situations which has yielded excellent coefficient. It is also
appropriate in Nigerian situation to strengthen the validity of the scale as it has been proved
by the study (Tella et al., 2007; Oyetola, 2012).
5.12.3 Job Performance Scale (JPS)
Brown and Leigh (1996) developed the Job Performance Scale (JPS) based on the lack of an
acceptable measure of performance that evaluated the time commitment (persistence) and

191
work intensity (energy applied per unit of time) which was based on the work of Naylor,
Pritchard and Ilgen (1980) that is on the dimensions of effort.
Job Performance Scale (JPS) was developed by Brown and Leigh (1996) made up of 10 items
and fashioned on Likert-type rating scale of 5-points ranging from 5 (Strongly Agree) and 1
(Strongly Disagree). The scale has two dimensions namely: time commitment and work
intensity made up of five items each. The scale has coefficient alpha of 0.82, time
commitment (0.86 and 0.82) and work intensity (0.82 and 0.83). The Cronbach coefficient
alpha yielded a value of 0.60 and the reliability coefficient is 0.66 (Brown & Leigh, 1996).
For this study 6 items from JPS were selected and these include items like ‘my physical
working conditions do influence my overall attitude toward my duty’; ‘when I finish a day
work I often feel I have accomplished something really worthwhile’; ‘my feelings about my
future with the company have a greater influence on my overall attitude toward my job’. The
measure for this study was on a 7-point Lirket scale ranging from 1(Strongly disagree) to 7
(Strongly agree). The Cronbach’s alpha (α) coefficient for this study for JPS is 0.83 which
shows an internal consistency. Researchers have used it in various Nigerian samples and
have reported reliable coefficient alpha of 0.93 as well as the internal consistency ranges
between 0.72 and 0.82 (Shadare & Hammed, 2009; Omolayo and Olufemi, 2012). The
internal consistency of the instrument is within the acceptable range and good coefficients
based on the rule of the thumb (Pallant, 2011, Bernard, 2013). The relevance of the
instrument to this study is that it gives room to the researcher to know which factors has
really contributes to the performance of the employees within the organisational set-up and
that has aided the employees to accomplish the overall organisational performance. This is
pertinent to Nigerian situation because it gives the opportunity for the researcher to validate
some of those questions in Nigeria work environment, to know may be it will yield excellent
coefficient like in other environments and again to strengthen the validity of the scale as it
was shown by the work of (Shadare & Hammed, 2009; Omolayo and Olufemi, 2012).
5.12.4 Multi-Factors Leadership Questionnaire-Form 5X (MLQ-Form 5X)
The Multi-Factor Leadership Questionnaire-Form 5X (MLQ-Form 5X) was developed by
Bass and Avolio in 1995 to evaluate leadership style in organisations. The MLQ is
constructed into two forms which is in both Self and Rater forms. The Self form is adopted to
evaluate self-perception of leadership behaviours while the Rate form is adopted to evaluate
leadership. The MLQ was used to measure transformational leadership style, transactional

192
leadership style and passive/avoidant leadership style (Boerner, Eisenbeiss & Griesser, 2007;
Pounder, 2008; Chen, Chen, & Chen, 2010).
Multi-factors Leadership Questionnaire (MLQ-Form 5X) constructed by Bass and Avolio
(1995, 2004) with items totalling 21 with ratings on 5-point scale with 1 standing for ‘‘Not at
all’’ and 5 standing for ‘‘frequently, if not always’’. It has 7 dimensions: Idealised influence,
Inspirational motivation, Intellectual stimulation, Individualised consideration, Contingent
reward and the likes. The Conbach’s alpha coefficient is 0.93, which makes it reliable
(Gumusluoglu & Ilsev, 2009). For this study, 6 items were chosen and adapted, such items
include ‘I make others feel good and happy to be around me’; I explain with few words about
what we should and could do’ and ‘I pay serious personal attention to others who seem
rejected’. The measure for the MLQ-Form 5X for this study was on a 7-point Likert scale
ranging from 1 (Strongly disagree) to 7 (Strongly agree) with Cronbach’s alpha (α)
coefficient of 0.80 that depicts an internal consistency. The MLQ-form 5X has been used in
Nigerian sample and reported a Cronbach’s alpha (α) coefficient of 0.74 (Chipunza et al.,
2011). The internal consistency of the instrument is within the acceptable range and good
coefficients based on the rule of the thumb (Pallant, 2011, Bernard, 2013). This is relevant to
this study in the sense that it opens up opportunity to evaluate the effect of leadership role on
the performance of the employees and that of the organisation as whole via the issue of
compensation management. In Nigeria, it gives the researcher to really test the validity of the
instrument as it has yielded good and excellent coefficient alpha result in different
environments as evident in the literature and also to see may be it is in line with the work of
(Chipunza et al., 2011).
5.12.5 The Reversed Brief Index of Self-Actualisation (BISA-R)
The Reversed Brief Index of Self-Actualisation (BISA-R) was developed by John Sumerlin
and Charles Bundrick in 1998 and has 32 items that were created from Sumerlin’s Personal
Attitude Survey of 65 items. The usage of BISA-R was suggested for researchers as a special
measure for Maslow’s model of self-actualisation (Sumerlin & Bundrick, 1998). It was also
based on a major review of Maslow’s work and a major revision of Sumerlin and Bundrick’s
(1996) 40 item Brief Index of Self-Actualisation.
Sumerlin and Bundrick (1998) employed the reversed Brief Index of Self-Actualisation
(BISA-R). 32 items were used adopting 6 Likert point scale ranging from 6 (Strongly agree)

193
to 1 (Strongly disagree). Sumerlin and Bundrick (1996) reported a strong psychometric
performance: The BISA has an internal consistency (α = 0.87) and a two-week test-retest
reliability of 0.89 as reported by (Beitel, Bogus, Hutz, Green, Cecero & Barry, 2013). In this
study 6 items were selected from BISA-R and these items include ‘I do feel ashamed of any
of my emotions at all’‘I must do what others expect of me’ and ‘I am extremely bothered by
fears of being inadequate’ and these items were used adopting 7 Likert point scale ranging
from 1 (Strongly disagree) to 7 (Strongly agree). For this study, the Cronbach’s alpha (α)
coefficient for BISA-R is 0.81 which depicts internal consistency. It has been widely used in
Nigerian samples and reported reliable Cronbach’s alpha coefficient of 0.86 (Prince, 2003).
The internal consistency of the instrument is within the acceptable range and good
coefficients based on the rule of the thumb (Pallant, 2011, Bernard, 2013). This scale is
important to this study to ascertain may be self-actualisation has contributed to the employees
motivation thereby leading to high performance or not and probably having an effect on the
overall performance of A&G Insurance Pc and the insurance industry at large in Nigeria. It is
also important to this study to contribute to the existing literature. Its relevance in Nigerian
context is that, it gives the opportunity to determine may be Nigerian employees really attain
self-actualisation in their career life and also to test validity of the instrument in Nigerian
environment.
5.13 LIMITATIONS OF THE STUDY
There is no study embarked upon by any researcher that is devoid of constraints and
challenges. Four main limitations can be identified:
The distribution of questionnaire was limited to the staff of A&G Insurance PLC who
possesses the requisite knowledge, adequate experience and skill.
The availability of the respondents was a major constraint that delayed the collection
and processing of the questionnaire.
Getting access to A&G Insurance Plc. as an organisation that was engaged in this
study was also a great challenge because of the difficulties met by the researcher in
obtaining approval from the gatekeeper of the A&G Insurance Plc. to carry out the
study.

194
Another crucial limitation contended with by the researcher was the release of some
information that was considered sensitive to the business by the respondents.
However, the researcher was able to surmount the challenges and constraints faced in
the cause of conducting this study. This was surmounted by persistent visit to the
organisation.
5.14 ETHICAL REQUIREMENTS
In order to make this study authentic and trustworthy, the ethical code and guidelines of
University of KwaZulu-Natal was adhered to by the researcher. This was accomplished by
completing the University’s Ethical Clearance Application Form, copy of the research
instruments used in the study and the gatekeeper’s letter from the participating organisation
were attached. The Humanities and Social Science Research Committee of the University of
KwaZulu-Natal issued an approval letter dated 21st of May, 2013 (See Appendix D). On the
basis of this, the researcher commenced the field survey by the end of May to the end of July
2013. The researcher reflects on the rights of all stakeholders in research by adhering to all
ethical demands applicable to each stakeholder as stipulated below:
Permission was sought officially from the participating organisation as evident in
their Gate Keeper’s letter.
Anonymity of the participating organisation was guaranteed while misuse of data
collected from the organisation was also avoided.
The instruments were administered to the participants on the date approved by the
Human Resources Manager of the participating organisation.
The fundamental human rights of the participants was effectively protected by
treating their information as confidential as possible, anonymity of the participants
was also guaranteed, questions that have to do with the participants privacy were
avoided in the study.
The research instruments used in this study were personally administered in
conjunction with the aid of the human resource unit of the participating organisation
to the participants/respondents; the purpose of the study was adequately
communicated to the participants before administering the instruments.
Each questionnaire contains the confidentiality clause on the covering letter while the
letter of consent indicated that participation in the study is voluntary and participants
can withdraw at any stage if they desire to do so.

195
All data collected in the process of this study shall be deposited to the School of
Management, Information Technology and Governance, University of KwaZulu-
Natal for safe keeping.
All secondary sources of data collected in this study were adequately cited and
referenced to avoid plagiarism.
5.15 CONCLUSION
This chapter discussed comprehensively the various research philosophies as well as the
relevant fields where they are applicable before chosen positivism as the philosophical stance
for this study. This chapter also elucidates the methodology and research design adopted in
this study with adequate justification. The population of the study was considered in relation
to the various sampling techniques studied, while sample size selection for the study was
based on proximity, availability and willingness of the participants. The design of the
research instrument for collection primary data was explained, efforts to ascertain
psychometric properties of the instrument were succinctly addressed and the procedures for
instrument administration were properly highlighted in this chapter.
The researcher used the computation of Cronbach’s Coefficient Alpha (α) together with
correlation coefficient for the main variables of the study to this effect. Limitations of this
study were addressed in this chapter while the ethical codes of conducts in research observed
by the researcher were equally stated. Data analysis using the Statistical Package for Social
Science (SPSS) version 21, presentation and interpretation of results in pictorial and tabular
form are presented in the next chapter.

196
CHAPTER 6
PRESENTATION AND INTERPRETATION OF RESULTS
6.1 INTRODUCTION
This study investigated the impact of compensation management and motivation on
performance of the Insurance Industry in Nigeria, with specific focus on Alliance and
General Insurance Plc. (A&G). The secondary purpose of the study was to determine the
extent to which compensation management affects the performance of the insurance industry.
Additionaly, the study attempted to ascertain the impact of compensation management in
achieving the satisfaction of the employees of the insurance industry in Nigeria; the
allocation of resources and achievements of the organisation’s objectives; self-actualisation
of the employees; workers motivation as well as the effects of government policies on
compensation management in the industry. Notably, the data collected from the relevant
sources were classified and analysed (See Appendix C). The trends, patterns and relationship
as inferred from the data were identified and interpreted. The data analysis was carried out
on the basis of the variables covered in the study. The Statistical Package for Social
Sciences (SPSS) version 21 for Windows was used to screen and analyse all the data
collected.
6.2 PRESENTATION AND ANALYSIS OF DATA
The data collected for this study were analysed using the appropriate statistical tools such as
simple percentage, mean and standard deviation. The summary of the results was obtaind
from the analysis of the questionnaires administered to the participants. Descriptive statistics
was adapted to analysis the demographic composition of the respondents supported by
pictorial diagrams like bar chart, pie chart and cone bar chart. The research objectives and
research questions were analysed through simple percentage, mean, standard deviation and
Pearson product moment correlation coefficient. The reason for using this is because this
study seeks to find the strength of relationship between compensation management,
motivation and performance in the insurance industry in Nigeria (Treiman, 2009; Collings,
Demirbag, Mellahi & Tatoglu, 2010; Hon, 2012). Following is the presentation of the
analysis.

197
6.3 DEMOGRAPHIC DATA ANALYSIS
There were seven demographic varibles investigated to designate the characteristics of the
respondents, namely gender, marital status, age, departments, educational qualification,
working experience and the salary earned per month.
6.3.1 Gender
The first demographical variable is gender of the respondents and Table 6.1 below shows the
distribution of respondents by gender.
Table 6.1: Distribution of Respondents by Gender
Frequency Percent Valid
Percent
Cumulative
Percent
Valid
Male 122 57.5 57.5 57.5
Female 90 42.5 42.5 100.0
Total 212 100.0 100.0
Source: Researcher’s Analysis of Field Survey, 2013
The data in Table 6.1 indicates that 122 (57.5%) of the respondents were male while females
were 90 (42.5%). It can be inferred from the data that the males constituted the greatest
majority of the personnel of the insurance industry in Nigeria. The significance of this to this
study is that larger proportions of the employees are male because Nigera is a masculine
society where managers are expected to assert their authority. Moreover, Nigeria believes
culturally that the males will be more assertive, performance driven and will be able to face
stiff competition in the insurance market, hence, A&G Insurance hires more male than
females (Hofstede, 2001). Figure 6.1 below represents the sex distribution of the respondents.

198
Figure 6.1: Bar Chart Representation of Gender Distribution of Respondents
6.3.2 Marital Status
The second demographical variable is marital status and Table 6.2 below shows the
distribution of respondents by marital status

199
Table 6.2: Distribution of Respondents by Marital Status
Frequency Percent Valid Percent Cumulative
Percent
Valid
Single 75 35.4 35.7 35.7
Married 120 56.6 57.1 92.9
Divorced 7 3.3 3.3 96.2
Widow 5 2.4 2.4 98.6
Separated 3 1.4 1.4 100.0
Total 210 99.1 100.0
Missing System 2 .9
Total 212 100.0
Source: Researcher’s Analysis of Field Survey, 2013
The data in Table 6.2 indicates that 120 (57.1%) of the respondents are married; 75 (35.7%)
are single; 7 (3.3%) are divorced; 5 (2.4%) are widows; while 3 (1.4%) are separated from
their spouses. It can be inferred from the data that the majority of the personnel working in
the in insurance industry in Nigeria are married. This is important to this study because
culturally and from Nigerian perspective, it is believed that people that are married are more
responsible. Hence, the reason for employing married people mostly by A&G Insurance Plc.
Figure 6.2 below indicates the representation of marital status more clearly.

200
Figure 6.2: Pie Chart Representation of Marital Status of Respondents
6.3.3 Age
The third variable is the age of the respondents and Table 6.3 below shows the distribution of
the respondents by their age.
Table 6.3: Distribution of Respondents by Age
Frequency Percent Valid
Percent
Cumulative
Percent
Valid
20-30 years 59 27.8 28.0 28.0
31-40 years 92 43.4 43.6 71.6
41-50 years 45 21.2 21.3 92.9
50 years and
above
15 7.1 7.1 100.0
Total 211 100.0
Missing System 1 .5
Total 212 100.0
Source: Researcher’s Analysis of Field Survey, 2013

201
The data in Table 6.3 indicates that 92 (43.6%) of the insurance industry personnel lies
between 31-40 years age group, 59 (28.0%) lies between 20-30 years age group, 45 (21.3%)
lies between 41-50 years age group while the remaining 15 (7.1%) of the insurance industry
personnel are above 50 years of age. It can be inferred from the data that the ages of the
majority of the personnel of the insurance industry are between 31-40 years of age group.
This is an economically active population, which is viewed to be concerned with proper
compensation of its personnel in order for it to produce business success and positive results
for the industry. These are matured adults in the company that were included in the study and
were therefore able to give informed opinions on the state of affairs of their company. Figure
6.3 below represents the age distribution of the participants
Figure 6.3: Bar Chart Representation of Age of Respondents
6.3.4. Respondents department
The fourth demographical variable is on respondent’s respective departments and Table 6.4 below
shows the distribution of respondents by departments.

202
Table 6.4: Distribution of Respondents by Departments
Frequency Percent Valid
Percent
Cumulative
Percent
Valid
Administration 55 25.9 26.1 26.1
Finance 33 15.6 15.6 41.7
Customer
Relations
30 14.2 14.2 55.9
Marketing 43 20.3 20.4 76.3
R & D 15 7.1 7.1 83.4
Underwriting 35 16.5 16.6 100.0
Total 211 99.5 100.0
Missing System 1 .5
Total 212 100.0
Source: Researcher’s Analysis of Field Survey, 2013
The data in Table 6.4 indicates that 55 (26.1%) of the respondents are administrative officers,
33 (15.6 %) are financial assistants, 30 (14.2%) are customer relations officers, 43 (20.4%)
are marketers, 15 (7.1%) of the respondents are R&D officers, and 35 (16.6%) are
underwriters. Figure 6.4 below shows the departmental representation of the respondents
clearer. The majority of the respondents are located in Administration, Marketing and
Underwriting department and this is due to the fact that the organisation need people to
handle administrative matters relating to their clients, markting executives to go out to market
the insurance policies to the customers. The underwriting department is also having a large
number of employee’s because they are the ones dealing with insurance technicalities in
terms of risk evaluations and claims

203
Figure 6.4: Cone Bar Chat Representation of Respondents by Departments
6.3.5 Respondents qualifications
The fifith variable is the qualifications of the respondents and Table 6.5 below indicates the
distribution of participants by qualifications.
Table 6.5: Distribution of Respondents According to Qualifications
Frequency Percent Valid
Percent
Cumulative
Percent
Valid
School Certificate 8 3.8 3.8 3.8
OND/NCE 26 12.3 12.3 16.0
HND/BSc 109 51.4 51.4 67.5
MBA/MSC 50 23.6 23.6 91.0
Professional 13 6.1 6.1 97.2
Others 6 2.8 2.8 100.0
Total 212 100.0 100.0
Source: Researcher’s Analysis of Field Survey, 2013

204
The data in Table 6.5 shows that 8 (3.8%) of the respondents are School Certoficate holders,
26 (12.3%) of the respondents are holders of the National Diplomas (OND) or National
Certificate of Education (NCE) in insurance and related disciplines. In total, 109 (51.4%) of
the respondents are holders of Higher National diploma/Bachelor of Science (HND/BSc)
degree in insurance and related fields, 50 (23.6%) of the respondents are holders of Masters
of Business Administration/Masters of Science (MBA/MSc) degree, 13 (6.1%) of the
personnel are professional certificate holders in insurance respectively and remaining 6
(2.8%) are having other qualications such as accounting, personnel management professional
qualifications. It is inferred from the data that the majority of the respondents are holders of
higher national diploma/bachelor of science degree in insurance.
Figure 6.5 below highlights the distribution of educational qualifications of the respondents
clearly and its shows that HND/BSc is qualifications that most respondents have.
Figure 6.5: Bar Chart Distribution of Respondents by Educational Qualifications
6.3.6 Working experience
The sixth demographical variable is the participants working experience and Table 6.6 below
shows the distribution of respondents by work experience they have.

205
Table 6.6: Distribution of Respondents According to Working Experience
Frequency Percent Valid
Percent
Cumulative
Percent
Valid
Below 1 Year 7 3.3 3.3 3.3
2-3 Years 44 20.8 20.9 24.2
4-5 Years 59 27.8 28.0 52.1
6-7 Years 31 14.6 14.7 66.8
8-9 Years 21 9.9 10.0 76.8
10 Years and
Above
49 23.1 23.2 100.0
Total 211 99.5 100.0
Missing System 1 .5
Total 212 100.0
Source: Researcher’s Analysis of Field Survey, 2013
The data in Table 6.6 shows that 59 (28.0%) of the respondents have spent between 4 and 5
years of service in the insurance company, followed by the personnel who have spent 10
years and above representing 49 23.2%), 44 (20.9%) have spent above 2-3 years, 31(14.7%)
have spent 6-7 years and 21 (10.0%) of the respondents have spent 8-9 years. The remaining
7 (3.3%) respondents have spent less than a year with the company. It can be inferred from
the data that the majority of the respondents have spent between 4 and 5 years of service in
the insurance company. It can be deduced that more than half of the respondents have a
sound knowledge of the company compensation policy and its implementation. Thus, the
information gathered from the respondents on their company can be regarded as relevant for
the subject under discussion.
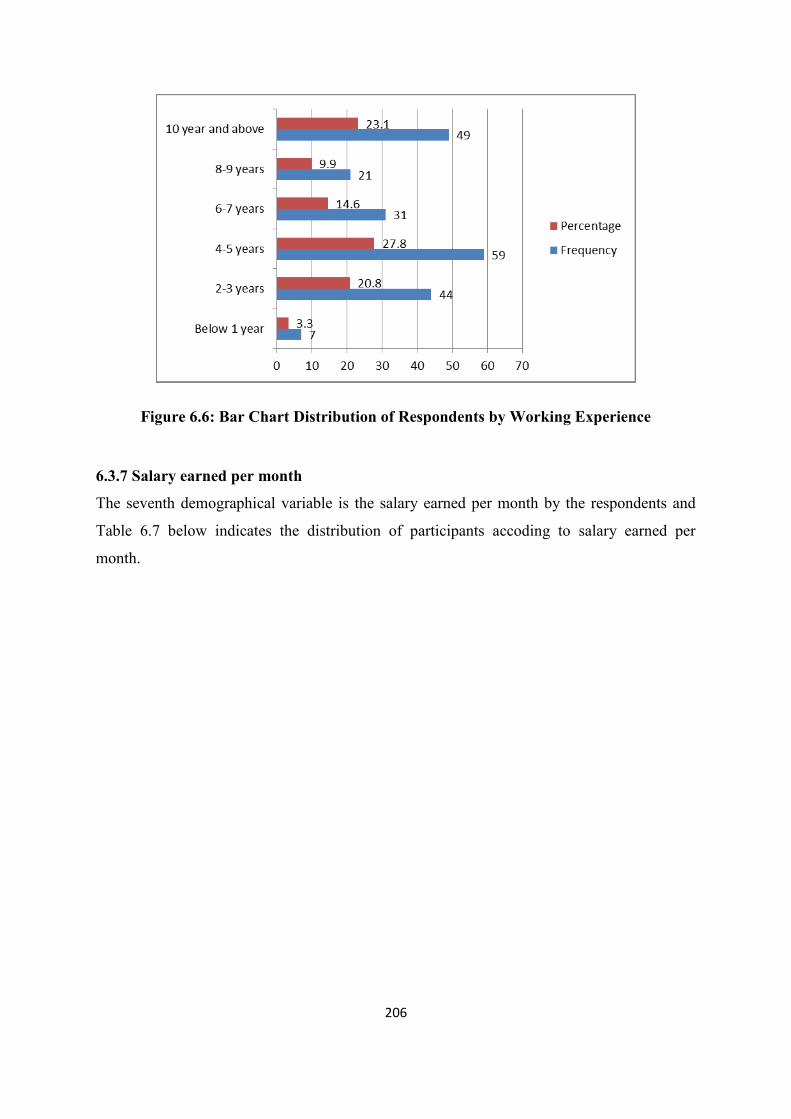
206
Figure 6.6: Bar Chart Distribution of Respondents by Working Experience
6.3.7 Salary earned per month
The seventh demographical variable is the salary earned per month by the respondents and
Table 6.7 below indicates the distribution of participants accoding to salary earned per
month.

207
Table 6.7: Distribution of Respondents According to Salary Earned Per Month
Frequenc
y
Percent Valid
Percent
Cumulative
Percent
Valid
N10, 000 - N50, 000 30 14.2 14.2 14.2
N51, 000 - N90, 000 71 33.5 33.5 47.6
N91, 000 - N130, 000 43 20.3 20.3 67.9
N131,000 – N170,
000
22 10.4 10.4 78.3
N171, 000 - N200,
000
21 9.9 9.9 88.2
N201, 000 – Above 25 11.8 11.8 100.0
Total 212 100.0 100.0
Source: Researcher’s Analysis of Field Survey, 2013
The salary earned by the respondents is presented in Table 6.7 above. It shows that the
majority of the rspondents earn between N51, 000 - N90, 000 (ZAR3,185.50-ZAR5,625) per
month which is (33.5%), while 21(9.9%) of the respondents earn between N171, 000 - N200,
000 (ZAR10,687.50-ZAR12,500) per month. From the analysis above it can be inferred that
over 50% of the respondents earn between N10, 000 and N130, 000 (ZAR625-ZAR8,125)
per month. The analysis also shows that the level of compensation of the personnel in the
company is still low considering the economic situation in Nigeria. In the same manner, it
can be inferred that about 32.1% of the respondents earn between N131, 000 and N200, 000
above (ZAR8,187.50-ZAR12,500) per month which is higher than the compensation in some
other companies in Nigeria as indicated in the table above. In other words, compensation
levels in the insurance industry in Nigeria is good when compared to other industries. Figure
6.7 depicts the representation of the monthly salary earned by the respondents and shows that
the majority earns between N51, 000-N90, 000

208
Figure 6.7: Pie Chart Distribution of Respondents According to Salary Earned per Month
This shows that 33.5 per cent of the partcipants earns between N51, 000-N90, 000
(ZAR3185.50 and ZAR5625) monthly; 14.2 per cent earns between N10, 000-N50, 000
(ZAR625 and ZAR3125) monthly; 1.8 per cent and earns between N201, 000-above
(ZAR12,562.50-above) monthly; 20.3 per cent and earns between N91, 000 and N130,000
(ZAR5687.50 and ZAR8125) monthly; 10.4 per cent earns between N131, 000 and N170,
000 (ZAR8187.50 and ZAR10,625) monthly while 9.9 per cent earns between N171, 000
and N200, 000 (ZAR10,687.50 and ZAR12,500) monthly. Conservatively, the exchange rate
as at the time this study was being conducted was N16 Nigerian Naira to ZAR1 South
African Rand.
6.4 MEASURES
Measures for this study are in two folds, that is, three of the scales were self-developed while
five were developed from published scales. This is being highlighted again to ensure that the
findings and the rationale of using specific statistics are better understood.
6.4.1 Compensation management
Compensation Management Questionnaire Scale (CMQS) was self-developed and was
measured by using six items asking the respondents to respond to on a seven-point response
scale. The responses to these items were measured as 7 (strongly agree) to 1 (strongly
disagree). In this study, the alpha coefficient of this scale was 0.87, which makes it to have
internal consistency reliability.

209
6.4.2 Job performance
In this study, job performance was measured using a six-item measure by requesting the
participants to respond to a seven-point response scale, which was adapted from Job
Performance Scale Questionnaire (JPSQ). Job Performance Scale (JPS) was developed by
Brown and Leigh (1996) made up of 10 items and fashioned on Likert-type rating scale of 5-
points ranging from 5 (Strongly Agree) and 1 (Strongly Disagree). The scale has two
dimensions namely: time commitment and work intensity made up of five items each. The
scale has coefficient alpha of 0.82, time commitment (0.86 and 0.82) and work intensity (0.82
and 0.83). The Cronbach coefficient alpha yielded a value of 0.60 and the reliability
coefficient is 0.66 (Brown & Leigh, 1996). It has been used in various Nigerian samples and
has reported reliable coefficient alpha of 0.93, as well as the internal consistency that ranges
between 0.72 and 0.82 (Shadare & Hammed, 2009; Omolayo and Olufemi, 2012). The
present study shows an alpha coefficient of 0.83 of the adapted scale.
6.4.3 Job satisfaction
Job satisfaction was measured using a six-item measure requesting the participants to respond
to seven-point scale. The Minnesota Job Satisfaction Questionnaire (MSQ) was adapted, the
short form of the MSQ consist of twenty items and three-dimensional scales; intrinsic
satisfaction, extrinsic satisfaction, and general satisfaction and made up of 5-point scale
ranging from 1 (very dissatisfied) to 5 (very satisfied) (Weiss et al. 1967). The validity for the
short form MSQ is subject to the long form MSQ as well as from other sources; studies of
occupational group differences and studies of the relationship between satisfaction and
satisfactoriness (Weiss et al. 1967). Cronbach’s coefficients for this measure depicts that the
scales are reliable (Weiss et al. 1967). Scores on the Intrinsic Satisfaction scale ranges from
.84 to .91, scores on the Extrinsic Satisfaction scale ranges from .77 to .82 while scores on
the General Satisfaction scale ranges from .87 to .92 and the median reliability coefficients
were .86, .80, .90 for intrinsic satisfaction, extrinsic satisfaction and general satisfaction
respectively (Weiss et al. 1967). MSQ has been engaged in various Nigerian samples and it is
found to have reported reliable alpha coefficient of 0.82 (Tella et al., 2007) and the internal
consistency between 0.82 and 0.93 (Gummi, 2011). For this study, the responses to these
items were measured as 7 (strongly agree) to 1 (Strongly disagree) and in this study, the alpha
coefficient of the adapted scale was 0.74.

210
6.4.4 Organisational effectiveness
The Organisational Effectiveness Assessment Questionnaire Scale (OEAQ) was also self-
developed. This was measured using six-items by asking the participants to answer to a
seven-point response scale. The responses to these items were measured as 7 (strongly agree)
to 1 (strongly disagree). The results of this study show an alpha coefficient of 0.79 that
exhibits internal consistency reliability.
6.4.5 Motivation
Motivation was measured using the six-item measure by asking the respondents to respond to
a seven-point response scale, which was adapted from the Motivational Questionnaires Scale
(MQS). The Motivation Questionnaire Scale (MQS) items were developed based on Mottaz
(1985), Brislin et al. (2005), Altindis (2011), and Mahaney and Lederer’s (2006) motivation
works. The MQS is scored on a 5-point Likert scale ranging from 1 (Strongly Disagree) to 5
(Strongly Agree). It consists of 16 items and two-dimensional scales; intrinsic motivation
(IM) measured by 8 items, for instance ‘‘I do have responsibilities related to work’’ while
extrinsic motivation (EM) was measured by 8 items, for instance ‘‘I have promotion
prospects’’. The Cronbach’s alpha α values of the main study were α = .79 for IM, α = .54 for
EM and α = .90 for motivation (the aggregate dimension of motivation) which reveals the
reliability of the scales (Altindis, 2011).MQS has been employed in many Nigerian samples
and with reported reliable alpha coefficient of 0.81 (Oyetola, 2012). In the present study, the
alpha coefficient of the adapted scale was 0.81.
6.4.6 Leadership role
In this study, the leadership role was measured using a six-item measure by asking the
respondents to respond to a seven-point response scale which was coined from Multi-factors
Leadership Questionnaire (MLQ-Form 5X). Multi-factors Leadership Questionnaire (MLQ-
Form 5X) constructed by Bass and Avolio (1995) with items totaling 21 with ratings on 5-
point scale with 1 standing for ‘‘Not at all’’ and 5 standing for ‘‘frequently, if not always’’. It
has 7 dimensions: Idealised influence, Inspirational motivation, Intellectual stimulation,
Individualised consideration, Contingent reward and the likes. The Cronbach’s alpha
coefficient is 0.93 that makes it reliable (Gumusluoglu & Ilsev, 2009). The MLQ-form 5X
has Cronbach’s alpha coefficient of 0.74 (Chipunza et al., 2011). In this study, the alpha
coefficient of the adapted scale was 0.80.

211
6.4.7 Self-actualisation
The self-actualisation was measured using a six-item measure by requesting the participants
to respond to a seven-point response scale adapted from the Reversed Brief Index of Self-
Actualisation (BISA-R). Sumerlin & Bundrick (1998) employed the reversed Brief Index of
Self-Actualisation (BISA-R). 32 items were used adopting 6 Likert point scale ranging from
6 (Strongly agree) to 1 (Strongly disagree). It has been widely used in Nigerian samples and
reported reliable Cronbach’s alpha coefficient of 0.86 (Prince, 2003). From the current study,
it was revealed that the alpha coefficient of the adapted scale was 0.81.
6.4.8 Governmental policy
The third scale that was self-developed is the Governmental Policy Questionnaire Scale
(GPQS). This was equally measured using six-items by requesting the respondents to answer
to a seven-point response scale. The responses to these items were measured as 7 (strongly
agree) to 1 (strongly disagree). In this present study, the alpha coefficient of this scale was
0.73 which gives internal consistency reliability.
6.5 PRESENTATION AND ANALYSIS OF RESEARCH QUESTIONS
6.5.1 Research Question 1
To what extent does compensation management affect the performance of employees in A&G
Insurance Plc?
The extent to which compensation management affect the performance of employees in A&G
Insurance Plc was determined by the mean and standard deviation scores of the compensation
management questionnaire scale that was self developed by the researcher. This is linked to
Measure 6.4.1
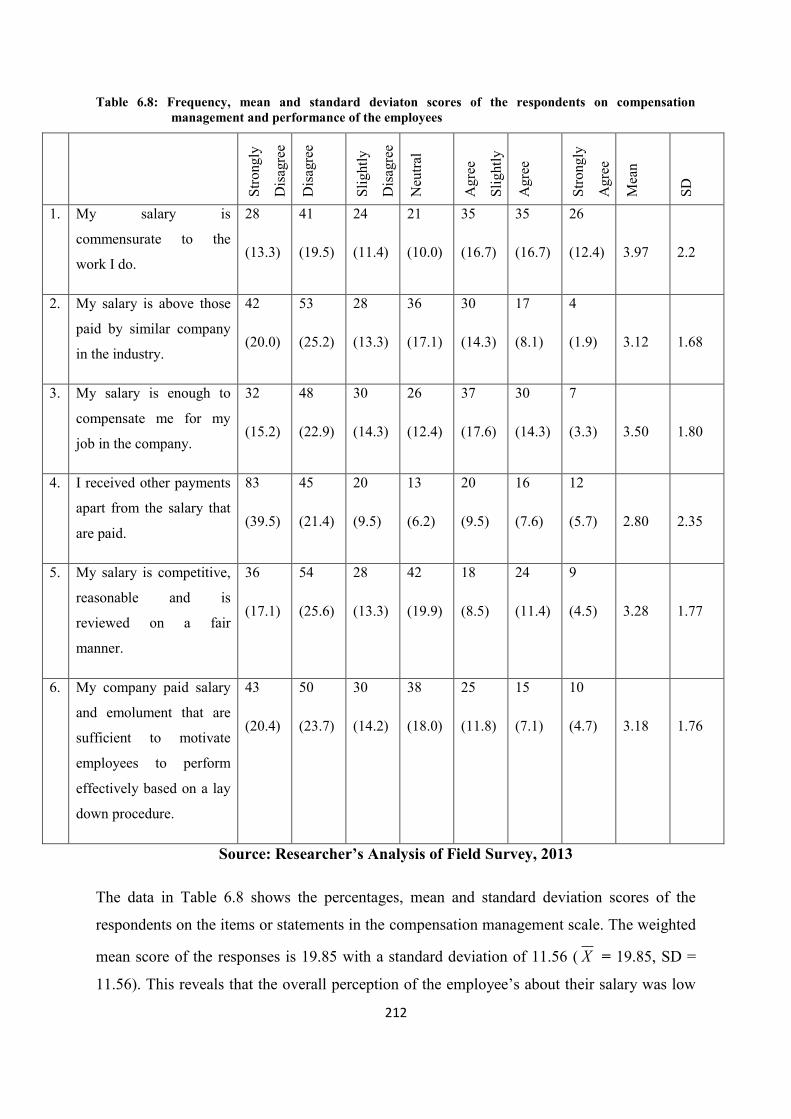
212
Table 6.8: Frequency, mean and standard deviaton scores of the respondents on compensation management and performance of the employees
Stro
ngly
Dis
agre
e
Dis
agre
e
Slig
htly
Dis
agre
e
Neu
tral
Agr
ee
Slig
htly
Agr
ee
Stro
ngly
Agr
ee
Mea
n
SD
1.
My salary is
commensurate to the
work I do.
28
(13.3)
41
(19.5)
24
(11.4)
21
(10.0)
35
(16.7)
35
(16.7)
26
(12.4)
3.97
2.2
2.
My salary is above those
paid by similar company
in the industry.
42
(20.0)
53
(25.2)
28
(13.3)
36
(17.1)
30
(14.3)
17
(8.1)
4
(1.9)
3.12
1.68
3. My salary is enough to
compensate me for my
job in the company.
32
(15.2)
48
(22.9)
30
(14.3)
26
(12.4)
37
(17.6)
30
(14.3)
7
(3.3)
3.50
1.80
4. I received other payments
apart from the salary that
are paid.
83
(39.5)
45
(21.4)
20
(9.5)
13
(6.2)
20
(9.5)
16
(7.6)
12
(5.7)
2.80
2.35
5. My salary is competitive,
reasonable and is
reviewed on a fair
manner.
36
(17.1)
54
(25.6)
28
(13.3)
42
(19.9)
18
(8.5)
24
(11.4)
9
(4.5)
3.28
1.77
6. My company paid salary
and emolument that are
sufficient to motivate
employees to perform
effectively based on a lay
down procedure.
43
(20.4)
50
(23.7)
30
(14.2)
38
(18.0)
25
(11.8)
15
(7.1)
10
(4.7)
3.18
1.76
Source: Researcher’s Analysis of Field Survey, 2013
The data in Table 6.8 shows the percentages, mean and standard deviation scores of the
respondents on the items or statements in the compensation management scale. The weighted
mean score of the responses is 19.85 with a standard deviation of 11.56 ( X = 19.85, SD =
11.56). This reveals that the overall perception of the employee’s about their salary was low

213
and inturn affects their performance. The result indicates that the level of employee
performance is not high but recommendable in A&G Insurance Plc. This is also a signal that
the company does not have a sound compensation structure in place. If employees are not
satisfied that their organisation is not offering a sound or reasonable compensation, then
their motivation is not at a higher level which may hamper their performance.
In addition, the significant effect of compensation management on the performance of
employees in A&G Insurance Plc was determined from the mean scores of their responses on
each item of the job performance scale. In response to the statement that their salary is
commensurate with the work they do, 26 (12.4%) participants strongly agrees with the
statement, 35 (16.7%) of them agreed with the statement, 35 (16.7%) participants agreed
slightly, 21 (10.0%) of them were neutral, 24 (11.4%) disagree slightly, 41 (19.5%) of the
respondents disagree with the statement and the remaning 28 (13.3%) participants are in
strong disagreement with the statement with a mean and standard deviation of ( X = 3.96, SD
= 2.01). With this result, the perception of the employee’s about this item in question is
below average, which means that the commensuration between their salary and their duty is
very low.
The statement that their salary is reasonable to compensate them for their jobs in the
company was strongly disagree to by 32 (15.2%) participants, 48 (22.9%) participants
disagreed, 30 (14.3%) of them disagreed slightly, 26 (12.4%) of them are neutral, 37 (17.6%)
agreed slightly with the statement, 30 (14.3%) agreed with the statement while the remaining
7 (3.3%) participants strongly agree with the statement with a mean and standard deviation of
( X = 3.50, SD = 1.80). This also shows that employee’s perceived that their salary is not
reasonable enough to compensate them for their jobs.
However, some of the respondents disagreed that their salary is above those paid by similar
company in the industry. In terms of the analysis, 42 (20.0%) of the respondents strongly
agree with the statement, 53 (25.2%) of them disagreed with the same statement, 28 (13.3%)
disagree slightly, 36 (17.1%) of the participants are neutral, 30 (14.3%) agreed slightly, 17
(8.1%) also agreed on the statement while the remaining 4 (1.9%) participants strongly agree
with the statement with a mean and standard deviation of ( X = 3.12, SD = 1.68). This is an
indication that the perception of the respondents that their salary is above that of their
counterparts in similar industry is not high.

214
The response of the participants on the statement that their company is paying a salary and
emoluments that are reasonable to motivate them to perform effectively based on a lay down
procedure is analysed as follows: 43 (20.4%) participants strongly disagree with the
statement, 50 (23.7%) of them are in disagreement with the statement, 30 (14.2%) disagree
slightly, 38 (18.0%) of the participants are neutral, 25 (11.8%) of the respondents agreed
slightly with the statement, 15 (7.1%) are in agreement with the same statement while the
other 10 (4.7%) participants strongly agreed to the statement. This is having a mean and
standard deviation of ( X = 3.17, SD = 1.75). This shows that the employee’s equally
perceived that their company is not paying salary and emoluments that are reasonale enough
to motivate them to perform effectively.
The statement that they are receiving other payments apart from the salary that is being paid
is discussed as follows: 83 (39.5%) participants strongly disagree, 45 (21.4%) of them are in
disagreement, 20 (9.5%) disagreed slightly, 13 (6.2%) of the respondents are neutral, 20
(9.5%) slightly agree, 16 (7.6%) of the participants agreed on the statement while the
remaining 12 (5.7%) participants strongly agree to the statement with a mean and standard
deviation of ( X = 2.79, SD = 2.35). This statement produced low mean scores which are less
than 3.50 what is acceptable but indicates low perception of the employees about receiving
other payments apart from their salary.
In addition, the respondents disagreed that their salary is competitive, reasonable and
reviewed on a fair manner in the sense that, 36 (17.1%) of the participants strongly agree to
the statement, 54 (25.6%) of them are in disagreement, 28 (13.3%) disagreed slightly, 42
(19.9%) of the participants are neutral, 18 (8.5%) of them agreed slightly, 24 (11.4%)
participants are in agreement to the statement while the remaining 9 (4.3%) participants
strongly agreed with a mean and standard deviation of ( X = 3.28, SD = 1.76). This statement
produced low mean scores less than 3.5 which is marked for acceptability. This implies a
moderate extent of compensation management with the overall performance of the employees
in A&G Insurance Plc. In conclusion, the mean from the above table shows that item 1 has
the highest mean of X = 3.97, item 3 with X = 3.50, item 5 with X = 3.28, item 6 with X =
3.18 and item 2 with X = 3.12 respectively and the respondents agreed slightly with all the
items but item 4 with X = 2.80 shows that the participants are in disagreement with the
statement. The aggregate standard deviation for all the items is 1.60. Finally, it is noted that

215
the perception is not a high one for the employees’ performance due to a reasonable
remuneration scheme which is low that is operating in the firm.
All the questions asked here are important to this study in the sense that it brings to the fore
the importance of compensation management in achieving greater performance from the
employees. The view of the respondents about the compensation management of A&G
Insurance Plc. was that it is inadequate compared with what their counterparts in similar
organisations are receiving, hence, it serves as a demotivator on the part of the employee’s.
This has a scholarly contribution that compensation plays a vital role in accomplishing
employee’s performance as well as the overall performance of the organisation in Nigeria as
it is obtainable in other part of the world.
6.5.2 Research Question 2
Has the organisation achieved the satisfaction of its employees?
To determine the level of job satisfaction of personnel of Alliance and General Insurance Plc
(A&G) in the organisation, respondents were asked to indicate the level of agreement or
disagreement with the 6 items or statements in the multi-dimensional Minnesota job
satisfaction questionnaire. This is linked to Measure 6.4.3 and the results are presented in
Table 6.9
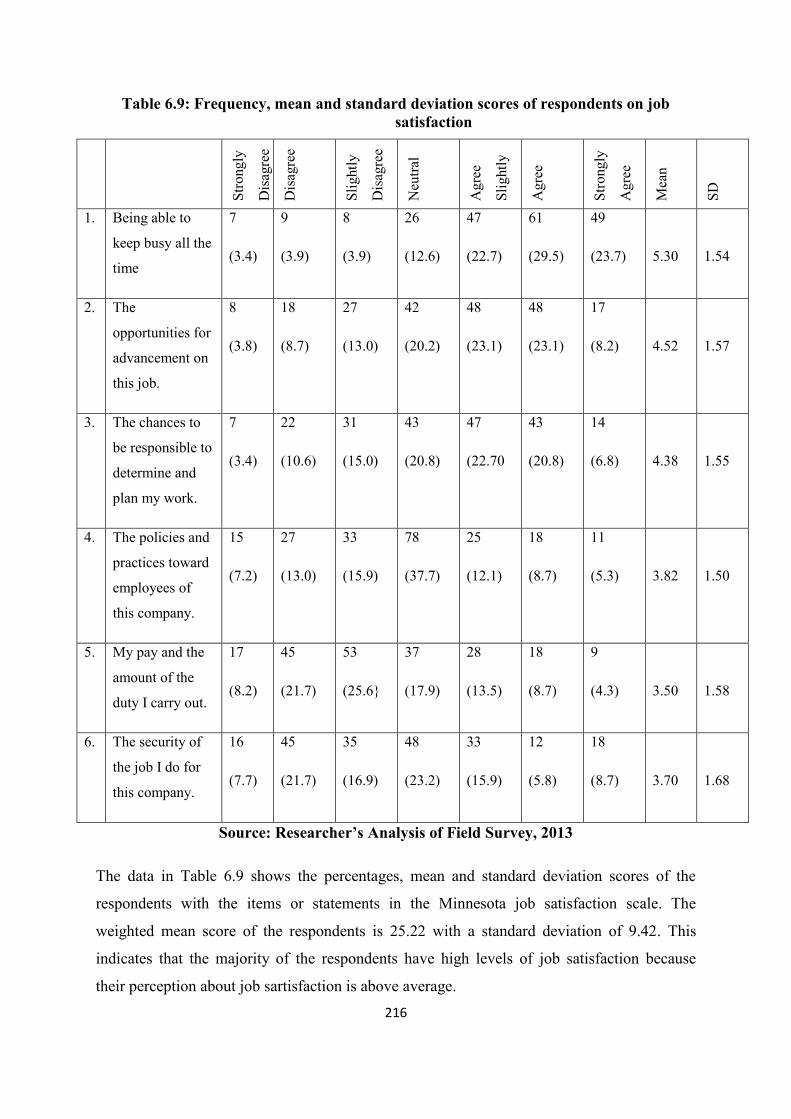
216
Table 6.9: Frequency, mean and standard deviation scores of respondents on job satisfaction
Stro
ngly
Dis
agre
e
Dis
agre
e
Slig
htly
Dis
agre
e
Neu
tral
Agr
ee
Slig
htly
Agr
ee
Stro
ngly
Agr
ee
Mea
n
SD
1.
Being able to
keep busy all the
time
7
(3.4)
9
(3.9)
8
(3.9)
26
(12.6)
47
(22.7)
61
(29.5)
49
(23.7)
5.30
1.54
2.
The
opportunities for
advancement on
this job.
8
(3.8)
18
(8.7)
27
(13.0)
42
(20.2)
48
(23.1)
48
(23.1)
17
(8.2)
4.52
1.57
3. The chances to
be responsible to
determine and
plan my work.
7
(3.4)
22
(10.6)
31
(15.0)
43
(20.8)
47
(22.70
43
(20.8)
14
(6.8)
4.38
1.55
4. The policies and
practices toward
employees of
this company.
15
(7.2)
27
(13.0)
33
(15.9)
78
(37.7)
25
(12.1)
18
(8.7)
11
(5.3)
3.82
1.50
5. My pay and the
amount of the
duty I carry out.
17
(8.2)
45
(21.7)
53
(25.6}
37
(17.9)
28
(13.5)
18
(8.7)
9
(4.3)
3.50
1.58
6. The security of
the job I do for
this company.
16
(7.7)
45
(21.7)
35
(16.9)
48
(23.2)
33
(15.9)
12
(5.8)
18
(8.7)
3.70
1.68
Source: Researcher’s Analysis of Field Survey, 2013
The data in Table 6.9 shows the percentages, mean and standard deviation scores of the
respondents with the items or statements in the Minnesota job satisfaction scale. The
weighted mean score of the respondents is 25.22 with a standard deviation of 9.42. This
indicates that the majority of the respondents have high levels of job satisfaction because
their perception about job sartisfaction is above average.

217
In addition, the high level of job satisfaction among the employees of Alliance and General
Insurance Plc (A&G) can also be determined from the mean scores of their responses with
each of the 6 items on the Minnesota job satisfaction scale. The majority of the respondents
indicated that they are very satisfied with their duties. In responding to item 1, 7 (3.4%) of
them strongly disagreed, 9 (4.3%) disagreed, 8 (3.9%) disagree slightly, 26 (12.6%) of the
respondents were neutral, 47 (22.7%) agree slightly, 61 (29.5%) of them are in agreement
with the statement while the remaining 49 (23.7%) participants strongly agree with the fact
that they are able to keep busy all the time which is having a mean and standard of ( X =5.29,
SD=1.54). This mean and standard deviation indicates that the perception of the respondents
is high as regards doing their work with less interference from their supervisor.
The second statement deals with the advancement opportunities on their job. 8 (3.8%) of the
participants strongly disagree, 18 (8.7%) of them disagreed, 27 (13.0%) disagree slightly, 42
(20.2%) of the respondents are neutral. However, 48 (23.1%) of them slightly agree, 48
(23.1%) equally agree with the statement and the remaining 17 (8.2%) of the participants
strongly agree with the statement with a mean and standard deviation of ( X =4.51, SD=1.56).
This shows that the participant’s perception of opportunities for advancement was very high
thereby leading to job satisfaction.
The next statement borders on whether they have the right and scope to determine and plan
their work. In total, 7 (3.4%) of them strongly disagree, 22 (10.6%) disagree with the
statement. 31 (15%) of the participants slightly disagree, 43 (20.8%) said they are neutral. 47
(22.7%) of the respondents agreed slightly, and 43 (20.8%) of the respondents are in
agreement with the statement. The remaining 14 (6.8%) strongly agree that they have the
opportunity to be responsible to determine and plan their work. This is having a mean and
standard deviation of ( X =4.53, SD=1.55). The implication of this is that the participants
perceived that they can plan their wor schedule independently and making them to have
control over their work. This invariably increases the level of their job satisfaction.
The fourth statement emphasis is on the policies and practices toward employees in the
company. In total 15(7.2%) of the participants strongly disagree with the statement, 27(13%)
of them disagreed, 33(15.9%) said they disagreed slightly, 78(37.7%) of the respondents are
neutral. 25(12.1%) of them agreed slightly, 18(8.7%) agree while 11(5.3%) said they strongly
agree with the statement. This is having a mean and standard deviation of ( X =3.81,

218
SD=1.50). This result indicates that the view of the employee’s about the policies and
practices of the organisation toward them is not satisfactory thereby their perception was low,
hence, low satisfaction on the job.
The fifth statement is about compensation and it indicates that their pay and the amount of the
duty they are carrying out is commensurable , A total of 17 (8.2%) of the participants
strongly disagreed with the statement, 45 (21.7%) of them are in disagreement, 53 (25.6%) of
the repondents disagreed slightly, 37 (17.9%) of them are neutral about the statement, 28
(13.5%) of the participants slightly agreed. 18 (8.7%) of them are completely in agreement
with the statement whilst the remaining 9 (4.3%) strongly agreed thus constituting a mean
and standard deviation of ( X =3.50, SD=1.50). This is an indication of low level of
satisfaction of the respondents because their perception about their pay and the duty they
carried out is not commensurate thereby leading to low satisfaction.
The last statement is on the security of the job they do for their company in terms of laying
off, retirement or dismissal. A total of 16 (7.7%) of the respondents strongly disagree with the
statement, 45 (21.7%) of them disagreed with the nature of job security in their company. 35
(16.9%) disagreed slightly, 48 (23.2%) of them are neutral, 33 (15.9%) participants agree
slightly, 12 (5.8%) of them are in agreement with the statement. The remaining 18 (8.7%)
said that they strongly agree with the statement and this constitutes a mean and standard
deviation of ( X =3.70 SD=1.68). This shows that the respondents are having low satisfaction
about the level of job security in the organisation.
In summary, the respondents were very satisfied with each of the 6 dimensions of job
satisfaction in the Alliance and General Insurance Plc (A&G). In summary, it could be
inferred that item 1 has the highest mean of X =5.30 which shows that the respondents are
strongly in agreement with the statement that they are able to keep busy all the time. This is
followed by item 2 with X =4.52, item 3 with X =4.38, item 4 with X =4.82, item 6 with
X =3.70 respectively while item 5 with X =3.50 has the lowest. In terms of the standard
deviation, they all have 1.5 and above which shows that there is a significant variation in the
responses of all the participants and this implies that the employees are satisfied with the job.
The questions asked under the research question are all relevant to this study because they are
pertinent to the satisfaction of the employee’s while on the job. That is, doing their duties

219
without much distraction, their career growth on the job, being able to schedule their work
plan themselves, commesuration between their pay and their responsibilities as well as have a
job that is well secured contributes to the level of job satisfaction they have. The respondents
through their responses affirm that they are satisfied on the job though the level of
satisfaction is not strong enough as expected in the insurance sector of Nigeria especially in
A&G Insurance Plc. and the scholarly contribution of this study is that the level of job
satisfaction of the respondents was low. Therefore, much needs to be done in the area of
employee’s job satisfaction in Nigeria insurance sector.
6.5.3 Research Question 3
Does the organisation achieve effectiviness in the use of its resources?
To answer this question, the organizational effectiveness assessment questionnaire was used
which is Measure 6.4.4. The results of the mean and standard deviation scores is presented in
Table 6.10 below
Table 6.10: Frequency, mean and standard deviation scores of the respondents on organization effectiveness in the use of its resources
Stro
ngly
Dis
agre
e
Dis
agre
e
Slig
htly
Dis
agre
e
Neu
tral
Agr
ee
Slig
htly
Agr
ee
Stro
ngly
Agr
ee
Mea
n
SD
1.
I am clear on the
performance objectives
and standards for my
function.
3
(1.4)
11
(5.3)
10
(4.8)
13
(6.3)
67
(32.2)
70
(33.7)
34
(16.3)
5.29 1.37
2.
I am clear on my
decision making
authorities.
4
(1.9)
5
(2.4)
5
(2.4)
14
(6.7)
58
(27.8)
85
(40.7)
38
(18.2)
5.51 1.25
3. I have clear
understanding of my
roles, responsibilities
and accountabilities.
1
(0.5)
2
(1.0)
6
(2.9)
14
(6.7)
43
(20.7)
104
(50.0)
38
(18.3)
5.69 1.05
4. My teams feel
empowered and
2 5 10 33 57 79 22 5.23 1.22

220
supported to make
decisions.
(1.0) (2.4) (4.8) (15.9) (27.4) (38) (10.6)
5. We follow through on
promises and
commitments to next
steps.
-
(0.0)
7
(3.3)
16
(7.7)
40
(19.1)
57
(27.3)
66
(31.6)
23
(11.0)
5.09 1.24
6. I am clear on who I
need to collaborate
with to be successful in
my role.
1
(0.5)
6
(2.9)
6
(2.9)
16
(7.6)
46
(21.9)
89
(42.4)
46
(21.9)
5.62 1.20
Source: Researcher’s Analysis of Field Survey, 2013
The data in Table 6.10 reveals that Alliance and General Insurance Plc (A&G) is very
effective in its use of its resources. This is indicated by the overall organisational
effectiveness mean score which is 27.34 with a standard deviation of 7.33.
In addition, the organisational effectiveness in the use of its resources can also be determined
from the mean score of each of the 6 dimensions of the organisational effectiveness as
measured by the organisational effectiveness assessment questionnaire. The majority of the
respondents stated that they have a clear understanding of their roles, responsibilities and
accountability. A total of 38 (18.3%) of the participants strongly agree with the statement,
104 (50%) of them are in agreement with the statement, 43 (20.7%) repondents slightly
agreed, 14 (6.7%) of them are neutral, 6 (2.9%) participants disagreed slightly, 2 (1.0%) of
them disagreed completely. 1 (0.5%) respondent strongly disagreed with the statement
The second statement, which has huge support, is that they had clear information on who they
need to collaborate with to be successful in their roles. In total, 46 (21.9%) participants
agreed strongly with the statement, 89 (42.4%) of them agreed with the statement, 46 (21.9%)
respondents agreed slightly, 16 (7.6%) of the respondents are neutral, 6 (2.9%) of them
disagreed slightly, 6 (2.9%) of them also disagree with the statement. The remaining 1 (0.5%)
participant strongly disagreed with the statement.
The statement that they have confidence in their decision making authorities was strongly
agreed to by a total of 38 (18.2%) participants, 85 (40.7%) participants agreed with the

221
statement, followed by 58 (27.8%) of the participants agreeing slightly with the statement, 14
(6.7%) of them are neutral, 5 (2.4%) of the participants disagreed slightly as well as 5 (2.4%)
of them are in disagreement with the statement and 4 (1.9%) participants strongly disagree
with the statement.
Another major statement is whether they understood the company performance objectives
and standards for their function. A total of 34 (16.3%) respondents strongly agreed that they
understood the company performance objectives and standard for their function, 70 (33.7%)
of them agreed, 67 (32.2%) of them agreed slightly, 13 (6.3%) participants are neutral, 10
(4.8%) of them disagree slightly, 11 (5.3%) are in disagreement and the remaining 3 (1.4%)
participants strongly disagree with the statement. In total, 22 (10.6%) participants strongly
agree with the statement that workers are empowered and supported to participate in decision
making, 79 (38.0%) of them agreed with the statement, 57 (27.4%) agreed slightly, 33
(15.9%) participants are neutral, 10 (4.8%) slightly disagree, 5 (2.4%) of the respondents
disagree with the statement and the other 2 (1.0%) strongly disagree with the statement.
The last statement that employees follow through the promises and commitments to the next
steps was strongly agreed to by a total of 23 (11.0%) participants, 66 (31.6%) of them are in
agreement with the statement, 57 (27.3%) participants agreed slightly, 40 (19.1%) of the
respondents are neutral, 16 (7.7%) disagreed slightly while the remaining 7 (3.3%)
participants disagreed with the statement.
This implies that there is efficient and effective utilisation of resources in Alliance and
General Insurance Plc (A&G) in Nigeria. This is indicated by the various responses on each
item in the survey. From the above, it could be deduced that with item 3 with the mean of
( X =5.69) has the highest agreement of the respondents followed by item 6 with the mean of
( X =5.62), item 2 with the mean of ( X =5.51). Item 1 has a mean of ( X =5.29), item 4 has a
mean of ( X =5.23) and item 5 has a mean of ( X =5.09) in an ascending order coupled with
the fact that they all have a standard deviation that is above 1. The fact that the level of their
responses varied significantly implies that there is an effective use of the organisational
resources. This implies that the overall perception of the respondents about the resources
allocation and its effective usage within the organisation was very high.

222
From the results, the perception of the employees about the effectiveness of A&G Insurance
Plc. and the questions were a germane issue in this study because it shows how the
organisation has been able to inculcate the belief in A&G Insurance Plc. by allowing the
employees to have a perfect understanding of the performance objectives and standard
required for their jobs, line of authorities, empowered team work, promises and commitments
to the next step as well as who they need to work with in order for them to be successful on
their job. It is found that it aligns with one of the objectives of this study through the
responses of the participants; they have the strong belief that A&G Insurance Plc has been
effective in terms of its resources allocation and achievements of its objectives via
compensating her employees adequately. The scholarly contribution of this study is that
compensating employees adequately will enhance organisational effectiveness in the
insurance sector of Nigeria.
6.5.4 Research Question 4
Does compensation management motivate the employees towards greater performance?
To answer this question, the motivational questionnaire scale (MQS) was used which
Measure 6.4.5. The results of the mean and standard deviation scores is presented in Table
6.11 below
Table 6.11: Frequency, mean and standard deviation scores of the respondents on compensation management and employees motivation
Stro
ngly
Dis
agre
e
Dis
agre
e
Slig
htly
Dis
agre
e
Neu
tral
Agr
ee
Slig
htly
Agr
ee
Stro
ngly
Agr
ee
Mea
n
SD
1.
My supervisor
allowed me to do my
own work on my own
and receive
recognition from them
as well.
2
(.9)
6
(2.8)
8
(3.8)
21
(10.0)
58
(27.5)
73
(34.6)
43
(20.4)
5.46 1.27
2.
My promotion is
enhanced through
what I do on the job or
9
(4.3)
29
(13.7)
31
(14.7)
43
(20.4)
26
(20.4)
45
(21.3)
28
(13.3)
4.39 1.87

223
achieved.
3. The company policy
is friendly and flexible
in allowing
contribution of new
ideas by an employee.
21
(10.0)
37
(17.5)
34
(16.1)
45
(21.3)
39
(18.5)
23
(10.9)
12
(5.7)
3.76 1.63
4. I do enjoy adequate
interpersonal
relationship with my
colleagues within the
organization.
3
(1.4)
9
(4.3)
5
(2.4)
21
(10.1)
29
(13.8)
82
(39.0)
61
(29.0)
5.63 1.40
5. Developmental
programmes have
been used by the
organization to boost
employee’s morale.
19
(9.1)
54
(25.3)
32
(15.3)
44
(21.1)
29
(13.9)
23
(11.5)
8
(3.8)
3.53 1.64
6. I received the same
compensation with my
counterparts in similar
industry.
70
(33.3)
45
(21.4)
20
(9.5)
31
(14.8)
26
(12.4)
13
(6.2)
5
(2.4)
5.62 1.20
Source: Researcher’s Analysis of the Field Survey, 2013
The data in Table 6.11 shows the percentages, mean and standard deviation scores of the
respondents to the items or statements in the motivational questionnaire scale. The weighted
mean score of their responses is 28.39 with a standard deviation of 9.01. This indicates that
the majority of the respondents have a high level of motivation because of the compensation
structure.
The extent to which compensation management affects employees’ motivation was also
determined from the mean score of their responses to each item on the organisational
commitment scale. As indicated in Table 6.11, the majoritity of the respondents stated that
they are motivated because of the human relations they have with their co-workers.A total of
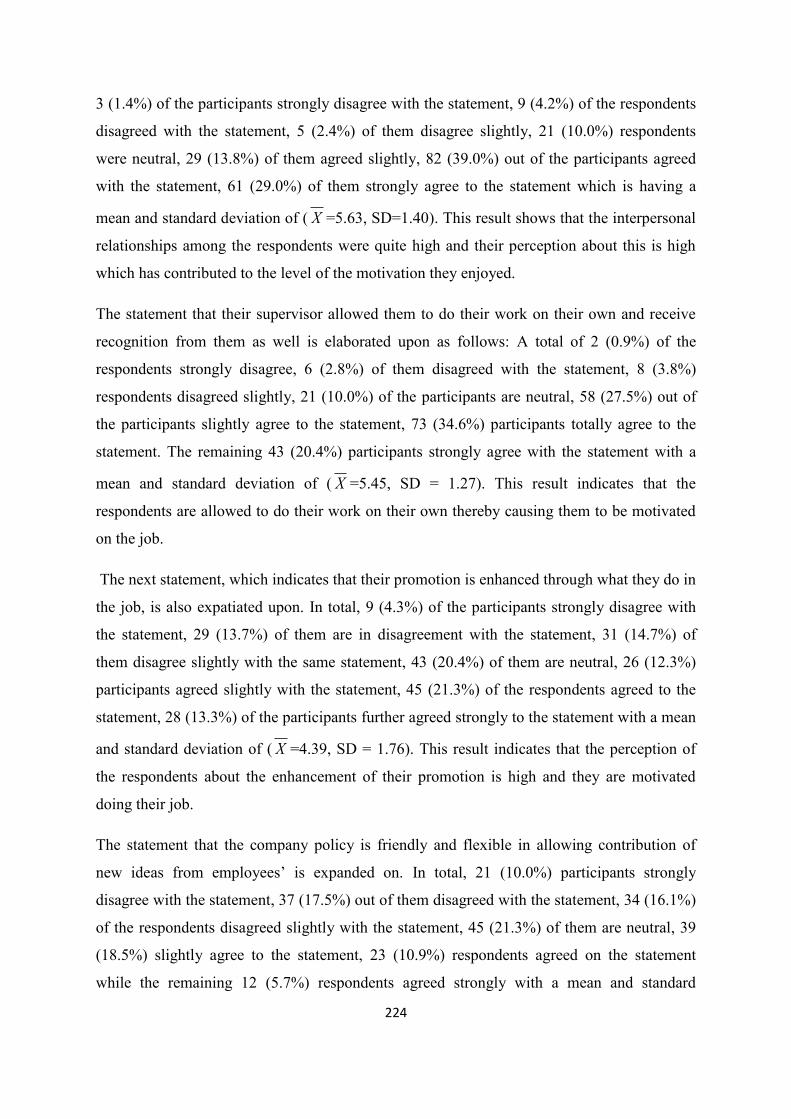
224
3 (1.4%) of the participants strongly disagree with the statement, 9 (4.2%) of the respondents
disagreed with the statement, 5 (2.4%) of them disagree slightly, 21 (10.0%) respondents
were neutral, 29 (13.8%) of them agreed slightly, 82 (39.0%) out of the participants agreed
with the statement, 61 (29.0%) of them strongly agree to the statement which is having a
mean and standard deviation of ( X =5.63, SD=1.40). This result shows that the interpersonal
relationships among the respondents were quite high and their perception about this is high
which has contributed to the level of the motivation they enjoyed.
The statement that their supervisor allowed them to do their work on their own and receive
recognition from them as well is elaborated upon as follows: A total of 2 (0.9%) of the
respondents strongly disagree, 6 (2.8%) of them disagreed with the statement, 8 (3.8%)
respondents disagreed slightly, 21 (10.0%) of the participants are neutral, 58 (27.5%) out of
the participants slightly agree to the statement, 73 (34.6%) participants totally agree to the
statement. The remaining 43 (20.4%) participants strongly agree with the statement with a
mean and standard deviation of ( X =5.45, SD = 1.27). This result indicates that the
respondents are allowed to do their work on their own thereby causing them to be motivated
on the job.
The next statement, which indicates that their promotion is enhanced through what they do in
the job, is also expatiated upon. In total, 9 (4.3%) of the participants strongly disagree with
the statement, 29 (13.7%) of them are in disagreement with the statement, 31 (14.7%) of
them disagree slightly with the same statement, 43 (20.4%) of them are neutral, 26 (12.3%)
participants agreed slightly with the statement, 45 (21.3%) of the respondents agreed to the
statement, 28 (13.3%) of the participants further agreed strongly to the statement with a mean
and standard deviation of ( X =4.39, SD = 1.76). This result indicates that the perception of
the respondents about the enhancement of their promotion is high and they are motivated
doing their job.
The statement that the company policy is friendly and flexible in allowing contribution of
new ideas from employees’ is expanded on. In total, 21 (10.0%) participants strongly
disagree with the statement, 37 (17.5%) out of them disagreed with the statement, 34 (16.1%)
of the respondents disagreed slightly with the statement, 45 (21.3%) of them are neutral, 39
(18.5%) slightly agree to the statement, 23 (10.9%) respondents agreed on the statement
while the remaining 12 (5.7%) respondents agreed strongly with a mean and standard

225
deviation of ( X =3.76, SD = 1.68). This result implies that the respondents are not motivated
enough because the company policy is not friendly and flexible in giving them the
opportunity to contribute new ideas.
The statement about compensation system that says they receive the same compensation with
their counterparts in similar industry is hereby interpreted as follows: in total, 70 (33.3%) out
of the participants strongly disagreed, 45 (21.4%) of them are in disagreement with the
statement, 20 (9.5%) of them disagree slightly, 31 (14.8%) out of them are neutral, 26
(12.4%) participants agreed slightly, 13 (6.2%) of them agreed and the remaining 5 (2.4%)
respondents strongly agree with the statement with a mean and standard deviation of
( X =5.31, SD = 1.76). This shows that there is high level of demotivation among the
respondents because their level of agreement was a negative one. This means that their
perception that they receive the same compensation with their counterparts in similar industry
was negative.
The statement, which says that developmental programmes have been used by the
organisation to boost employees’ morale, a total of 19 (9.1%) participants strongly disagree
with the statement, 54 (25.8%) of them disagreed with the statement, 32 (15.3%) out of them
slightly disagree with the statement, 44 (21.1%) respondents were neutral, 29 (13.9%) out of
the respondents agreed slightly with the statement, 23 (11.0%) of the participants agreed with
the same statement and the other 8 (3.8%) participants strongly agreed with a mean and
standard deviation of ( X =3.53, SD = 1.64). This result indicates that the participants are not
satisfied with the developmental programmes been organised by the organisation and this
shows that their perception of the developmental programmes was low.
The results indicate that the employees of A&G Insurance Plc are highly motivated on 5
motivational items - human relations/co-workers, independence and recognition, promotion
and company policy. Additionally, the result indicates that compensation management
motivate the employees towards achieving greater performance on each of the 5 motivational
items. A compensation structure in which the employees who perform better are paid more
than the average performing employees, motivates the employees to perform better and
harder. From the foregoing table, the mean revealed that item 4 has the highest mean of
( X =5.63), followed by item 6 with ( X =5.62), item 1 with ( X =5.46), item 2 with

226
( X =4.39), item 3 with ( X =3.76) and item 5 with ( X =3.53) in that order of magnitude. This
reveals that the statements are agreed to strongly by the respondents. The standard deviation
for all the items is above 1.20 which shows that the respondents varied significantly in their
responses with the statements under compensation management and employees motivation.
These results are a strong indication that the employees of A&G are well motivated. The
questions raised in this section are very vital to this study in the sense that they are related to
the motivation construct and to be able to achieve the 4th objective whether compensation
management has impacted on employee’s motivation. However, from the responses of the
participants, it is found that they employees are not well motivated through the management
of reward system in the insurance sector of Nigeria. This is a scholarly contribution of this
study to the area of employee’s motivation in the insurance sector of Nigeria. This should be
improved upon in order to enhance the motivation of employees so that it will lead to high
retention of skilful employees as well as reducing absenteeism, labour unrest and also
increasing the competitive edge of the organisation in the industry.
6.5.5 Research Question 5
To what extent does compensation management determine the leadership role of the
employees?
The extent to which compensation management affects the leadership role of the employees
was determined by asking the respondents to indicate the level of agreement or disagreement
with the 6 items or statements in the multifactor leadership style questionnaire which is
Measure 6.4.6. The results of the analysis are presented in Table 6.12 below.

227
Table 6.12: Frequency, mean and standard deviation scores of the respondents on compensation management and leadership role of the employees
Stro
ngly
D
isag
ree
Dis
agre
e
Slig
htly
D
isag
ree
Neu
tral
Agr
ee
Slig
htly
Agr
ee
Stro
ngly
A
gree
Mea
n
SD
1.
I make others feel good and happy to be around me.
1
(0.5)
4
(1.9)
2
(0.9)
8
(3.8)
51
(24.1)
82
(38.9)
63
(29.9)
5.86
1.09
2.
I explain with few simple words about what we should and could do.
1
(0.5)
7
(3.3)
13
(6.2)
17
(8.1)
59
(28.0)
75
(35.5)
39
(18.5)
5.40
1.28
3. I recognized and rewards when others accomplished their goals/objectives.
11
(5.2)
7
(3.3)
7
(3.3)
12
(5.7)
66
(31.3)
68
(32.2)
40
(19.0)
5.27
1.53
4. I make others to perceive and think about old problems in new ways.
5
(2.4)
11
(5.2)
2
(0.9)
34
(16.1)
37
(17.5)
92
(43.6)
30
(14.2)
5.29
1.41
5. I pay serious personal attention to others who seem rejected.
4
(1.9)
8
(3.8)
4
(1.9)
35
(16.6)
55
(26.1)
64
(30.3)
41
(19.4)
5.30
1.37
6. I am okay when agreed upon standards are accomplish by others.
4
(1.9)
5
(2.4)
5
(2.5)
17
(8.1)
49
(23.2)
90
(42.7)
41
(19.4)
5.50
1.27
Source: Researcher’s Analysis of Field Survey, 2013
The data in Table 6.12 shows the percentages, mean and standard deviation scores of the
respondents to the items or statements in the multifactor leadership questionnaire form- 5X
(MLQ). The weighted mean score of their responses is 32.62 with a standard deviation of
7.95. This indicates that the majority of the respondents perceived their leadership roles as
satisfactory. This implies that compensation management has a significant and positive
relationship effect on the leadership roles of the employees.

228
In addition, the satisfactory level of leadership roles or behaviours among the respondents can
be determined from the mean scores of their responses on each item on the multifactor
leadership questionnaire form. On the seven-point scale, the mean score of 3.50 and above
would generally imply agreement with the suggested notion of the item while the lower mean
score indicates disagreement. The statement that they make others feel good and happy to be
around them was strongly disagreed to by 1 (0.5%) participant, 4 (1.9%) of them disagreed
with the statement, 2 (0.9%) slightly disagree with the statement, 8 (3.8%) participants were
neutral, 51 (24.1%) respondents agreed slightly with the statement, 82 (38.9%) participants
are in agreement with the statement while only 63 (29.9%) repondents strongly agree with the
statement. This is having a mean and standard deviation of ( X =5.86, SD=1.09). This
indicates that the respondents satisfied by making others feel good and happy to be around
them and they perceived that they have been able to execute the leadership roles to some
extent.
The statement that says they are satisfied when agreed upon standards are accomplished by
co-workers is explicated as follows, 4 (1.9%) of the respondents strongly disagreed with the
statement, 5 (2.4%) of them disagreed, 5 (2.4%) participants equally disagreed slightly with
the statement, 17 (8.1%) of them are neutral, 49 (23.2%) of the participants agreed slightly
with the statement. A total of 90 (42.7%) respondents are in agreement with the statement
while the remaining 41 (19.4%) participants strongly agree with a mean and standard
deviation of ( X =5.50, SD=1.27). This shows that the perception of the participants about the
accomplishment of agreed standards is high. This is an indication that they are satisfied with
their leadership roles.
The statement that says they explain with few simple words about what co-workers should
and could do is explained thus: 1 (0.5%) participant strongly disagreed with the statement, 7
(3.3%) of the participants disagreed with the statement, 13 (6.2%) of them slightly disagree
with the statement, 17 (8.1%) of the respondents are neutral, 59 (28.0%) participants agreed
slightly, 75 (35.5%) of them agreed with the statement while 39 (18.5%) participants agreed
strongly with the statement with a mean and standard deviation of ( X =5.40, SD=1.28). This
result shows that the perception of the respondents to what the co-workers should and could
do is equally high and this indicates that they are satisfied with their leadership roles within
the organisation.

229
The decision of the respondents on the statement that they pay serious attention to others who
seem rejected, however, was explained further. In total, 4 (1.9%) of the participants strongly
disagree with the statement, 8 (3.8%) of them are in disagreement with the statement, 4
(1.9%) participants equally disagree slightly, 35 (16.6%) out of them are neutral, 55 (26.1%)
of the participants agreed slightly with the statement, 64 (30.3%) participants agreed to the
statement while only 41 (19.4%) of the respondents are strongly in agreement with the
statement with a mean and standard deviation of ( X =5.30, SD=1.37). This result reveals that
the perception of the participants of paying attention to others who seem rejected was high
and this depicts that they were able to play and exhibit their leadership roles.
The view of the respondents on the statement that they make others to perceive and think
about old problems in new ways is enumerated as follows, 5 (2.4%) of the respondents
disagreed strongly with the statement, 11 (5.2%) of the participants disagreed with the
statement, 2 (0.9%) of them disagree slightly with the statement, 34 (16.1%) out of them are
neutral, 37 (17.6%) participants agreed slightly, 92 (43.6%) of the respondents are in
agreement with the statement while the remaining 30 (14.2%) participants strongly agreed
with the statement with the mean and standard deviation of ( X =5.29, SD=1.41). From this, it
indicates that perceived that their leadership role has helped them in making others to
perceive and think about old problems in a new way. This shows that they are satisfied with
their leadership role.
The assessment of the participants on the statement that says they recognised and reward
others when they accomplished their goals/objectives is butrressed with the following
explanation that 11 (5.2%) of the respondents strongly agree with the statement, 7 (3.3%) out
of them disagreed with the statement, 7 (3.3%) of the participants equally disagree slightly
with the statement as well, 12 (5.7%) of them are neutral, 66 (31.3%) participants agreed
slightly with the statement, 68 (32.2%) of the respondents are in agreement with the
statement. However, the remaining 40 (19.0%) participants strongly agreed with the
statement with a mean and standard deviation of ( X = 5.27, SD = 1.53). This result shows
that the participants are satisfied with their leadership role by recognising and rewarding
others when goals/objectives are accomplished.
The results indicate that leadership roles of the employees is satisfactory. This means that
employees are committed to their organisations when they are involved in decision making.

230
The mean of each item indicated as follows, item 1 with ( X = 5.86), item 6 with ( X =5.50),
item 2 with ( X =5.40), item 5 with ( X =5.30), item 4 with ( X =5.29), and item 3 with ( X =
5.27) respectively and this shows the level of agreement of the respondents to the statements
is strong but the standard deviation of each statement is greater than 0.5 which indicates that
the level of their response variation is significant. This equally demonstrates that the
employees of A&G Insurance Plc are able to accomplish their leadership roles within the
firm.
The results from the MLQ questions shows that leadership is an important part of this study
because the responses of the participants depict that when employees have the opportunity to
play leadership role and is also enhanced by compensation/reward that is commensurate to
their leadership position, they perform more which will translate to organisational
performance in the insurance sector in Nigeria. This study has scholarly contributed that
employees leadership role is important in accomplishing the set goals of an organisation in
the insurance sector in Nigeria especially when their reward is commensurate with the
position of leadership.
6.5.6 Research Question 6
Does compensation management enhance self-actualization of employees?
This research question is answered using responses from the index of self-actualisation scale
which is Measure 6.4.7. The summary of the results are presented in Table 6.13 below:
Table 6.13: Frequency, mean and standard deviation scores of the respondents on compensation management and self-actualisation of the employees
Stro
ngly
Dis
agre
e
Dis
agre
e
Slig
htly
Dis
agre
e
Neu
tral
Agr
ee
Slig
htly
Agr
ee
Stro
ngly
Agr
ee
Mea
n
SD
1.
I do feel
ashamed of any
of my emotions
at all
13
(6.2)
38
(18.2)
50
(23.9)
39
(18.7)
18
(8.6)
28
(13.4)
23
(11.0)
3.89 1.77
2. I feel I must do
what others
39 38 40 21 22 26 19 3.50 1.96

231
expect of me. (19.0) (18.5) (19.5) (10.3) (10.7) (12.7) (9.3)
3. I believe that
people are
essentially
good and can
be trusted.
18
(8.6)
25
(12.0)
55
(26.3)
41
(19.6)
31
(14.8)
33
(15.8)
5
(2.9)
3.86 1.97
4. I avoid
attempts to
analyse and
simplify
complex
domains.
36
(17.2)
40
(19.1)
31
(14.8)
45
(21.6)
23
(11.0)
22
(10.6)
12
(5.7)
3.45 1.79
5. I am extremely
bothered by
fears of being
inadequate.
14
(6.7)
22
(10.5)
35
(16.7)
55
(26.3)
39
(18.7)
35
(16.7)
9
(4.4)
4.07 1.56
6. I can express
my feelings
even they tend
to result to
unfavourable
consequences.
5
(2.4)
8
(3.8)
11
(5.3)
21
(10.1)
60
(28.9)
58
(27.9)
45
(21.6)
5.29 1.45
Source: Researcher’s Analysis of Field Survey, 2013
The data in Table 6.13 shows the percentages, mean and standard deviation scores of the
respondents to the items or statements in the index of self-actualization scale. The weighted
mean score of their responses is 24.05 with a standard deviation of 10.47. This indicates that
compensation management relates to the attainment of the employees’ self-actualisation.
In addition, the effect of compansation management on the self-actualisation of the
employees can be determined from the mean score of their responses to each item on the
index of self-actualisation scale. As shown in Table 6.13, the views of most respondents on
the statement that they can express their feelings even if it tends to result to unfavourable

232
consequences is clarified as follows, 5 (2.4%) of the participants strongly disagree with the
statement, 8 (3.8%) participants are in disagreement with the statement, 11 (5.3%) of
respondents are in disagreement slightly with the statement, 21 (10.1%) respondents are
neutral, 60 (28.9%) participants agreed slightly with the statement, 58 (27.8%) participants
agreed with the statement while the remaining 45 (21.6%) participants strongly agree with the
statement with a mean and standard deviation of ( X = 5.29, SD = 1.45). The result shows
that the participants were satisfied that they can still express their feelings even if it will result
into an unfavourable consequences. The perception of the employee’s was high about
expressing their feelings.
The view of the participants on the statement that they were extremely bothered by fears of
being inadequate is explained as follows, 14 (6.7%) of the respondents disagreed strongly
with the statement, 22 (10.5%) of the respondents are in disagreement with the statement, 35
(16.7%) respondents slightly disagreed with the statement, 55 (26.3%) of them are neutral, 39
(18.7%) of the respondents slightly agreed with the statement, 35 (16.7%) participants agreed
on the statement while only 9 (4.4%) of the participants strongly agreed to the statement with
a mean and standard deviation of ( X = 4.07, SD = 1.56). This result shows that the
respondents are bothered about fears of being inadequate in executing their duties and their
perception about this is high.
The decision of the participants on the statement that they feel ashamed of any of their
emotions when it is contrary to organisational performance objectives is described as follows,
13 (6.2%) of the participants strongly agree with the statement, 38 (18.2%) of them disagreed
with the statement, 50 (23.9%) participants disagreed slightly on the statement, 39 (18.7%)
respondents are neutral, 18 (8.6%) of them are in agreement slightly, 28 (13.4%) participants
are in complete agreement with the statement while the remaining 23 (11.0%) participants
strongly agree with the statement with a mean and standard deviation of( X = 3.89, SD =
1.77). This result shows that the perception of the respondents about feeling ashamed of any
of their emotions when it runs contrary to organisational performance objectives was low.
This shows that they are not ashamed to some extent.
The respondents equally expressed their views on the statement that they believe that people
are essentially good and can be trusted. In total, 18 (8.6%) participants strongly agree with
the statement, 25 (12.0%) out of them are in disagreement with the statement, 55 (26.3%)

233
respondents disagreed slightly, 41 (19.6%) out of the participants are neutral, 31 (14.8%)
respondents agreed slightly with the phrase, 33 (15.8%) of the respondents are in agreement
with the expression. The remaining 6 (2.9%) participants strongly agree with the expression
with a mean and standard deviation of ( X =3.86, SD = 1.97). This result indicates that the
participants are of the opinion that people are good but cannot be trusted because their
perception was low on the statement that I believe that people are essentially good and can be
trusted.
The expression of the participants on the statement that says they feel they must do what
others expected of them in the company is discussed as follows: 39 (19.0%) participants
strongly agreed with the statement, 38 (18.5%) of the respondents disagreed with the
expression, 40 (19.5%) participants disagreed slightly with the phrase, 21 (10.3%) of the
respondents are neutral on the statement, 22 (10.7%) of the participants agreed slightly on the
statement, 26 (12.7%) of them are completely in agreement with the statement while only 19
(9.3%) participants are strongly in agreement with the statement with a mean and standard
deviation of ( X = 3.50, SD = 1.96). This result shows that the participants were of the
opinion that they must not do what others expected of them in the company. Therefore, their
perception about the statement that I must do what others expect of me was low.
The conclusion of the respondents on the last statement that says they avoid attempts to
analyse and simplify complex domains is expressed as follows: 36 (17.2%) of the participants
are strongly in disagreement with the statement, 40 (19.1%) of them are in disagreement with
the statement, 31 (14.8%) respondents disagreed slightly with the statement, 45 (21.6%) of
the participants are neutral, 23 (11.0%) participants slightly agree on the statement, 22
(10.6%) out of them are in total agreement with the statement while the other 12 (5.7%)
participants strongly agree with the statement with a mean and standard deviation of ( X =
3.45, SD = 1.79).
However, there is an indication that the employees avoid any attempts to analyse and
simplify complex domains, and this comprised the lowest mean score of ( X =3.44). This
means that the employees avoid activities which do not contribute to their rewards or
compensation in the company. In other words, the leadership of A&G Insurance Plc needs to
design a policy that recognises compensation of additional service rendered by the
employees. The results indicate that there is direct and positive relationship between

234
compensation management and self-actualisation of the employees at A&G Insurance Plc.
The table above shows the mean of each statement in the order of magnitude as follows: item
6 is having a mean of ( X =5.29), item 5 is having ( X =4.07), item 1 is having ( X =3.89),
item 3 is having ( X =3.86), item is 2 having ( X =3.50) and item 4 is having ( X =3.44).
This indicates that the respondents are in agreement with the statements under the study
question and the standard deviation for each statement is above 0.5 which means that the
respondents varied significantly in their responses to the statements. Invariably, the responses
of the participants show the validity of the statement that they have been able to attain self-
actualisation with the kind of compensation management that is in place at A&G Insurance
Plc as a firm.
The result from the BRIS-R scale shows that the questions raised about self-actualisation are
germane to this study which is also in line with one of the objectives to examine the
contribution of compensation management to self-actualisation of employees in the insurance
sector in Nigeria. It was found that larger percentage of the respondents disagree with the
items 1 to 4 while they agree with items 5and 6 which shows that the respondents attached
great importance to their actualising their dreams of getting to the peak of their career in the
insurance sector if well compensated. In a way, the scholarly contribution of this study is that
self-actualisation is a motivational needs to the employees according to Maslow’s hierarchy
of needs and that it is also essential to achieve it in Nigeria’s insurance sector as it is in other
part of the world.
6.5.7 Research Question 7
Do government policies affect the relationship between compensation administration and
governmental policy?
This study question is answered using responses from the governmental policy questionnaire
scale which is Measure 6.4.8. The summary of the results is presented in Table 6.14 below:

235
Table 6.14: Frequency, mean and standard deviation scores of the respondents on
government policies as it affects compensation administration and employees’ motivation.
Stro
ngly
Dis
agre
e
Dis
agre
e
Slig
htly
Dis
agre
e
Neu
tral
Agr
ee
Slig
htly
Agr
ee
Stro
ngly
Agr
ee
Mea
n
SD
1.
Government policy as
regards compensation
takes adequate care of
the private sector.
46
(21.9)
69
(33)
28
(13.3)
41
(19.5)
11
(5.2)
8
(3.8)
7
(3.3)
2.83
1.60
2.
Government policy
on compensation have
greatly influence the
review of salaries in
your organization
16
(7.6)
42
(20.0)
30
(14.3)
50
(23.8)
9
(4.3)
39
(18.6)
24
(11.4)
2.78
1.56
3. Government should
enforce her policies
on compensation on
your organization.
33
(15.7)
70
(33.3)
38
(18.1)
28
(13.3)
17
(8.1)
16
(7.6)
8
(3.8)
3.98
1.85
4. Government policy
on remuneration has
contributed to
employee’s
motivation in your
organization.
46
(22.1)
51
(24.5)
29
(13.9)
28
(13.5)
8
(3.8)
26
(12.5)
20
(9.6)
3.02
1.65
5. Government policy
on remuneration has
achieved
comparability
between public and
private sectors pay
and benefit.
46
(21.9)
69
(32.9)
28
(13.3)
41
(19.5)
11
(5.2)
8
(3.8)
7
(3.3)
3.28
2.00
Source: Researcher’s Analysis of Field Survey, 2013

236
Table 6.14 reveals the relationship between compensation administration and governmental
policy in the insurance industry in Nigeria. The weighted mean score of their responses is
15.89 with a standard deviation of 8.66 and this shows that the overall perception of the
participants was low. This indicates that governmental policy is responsible for the
formulation and implementation of strategies and policies that aim to compensate people
fairly, equitably and consistently in accordance with their value to the organization in the
insurance industry in Nigeria.
As shown in Table 6.14, the mean score of government policy on compensation which should
be enforced in their organization was higher than all the items presented under governmental
policy questionnaire scale. This can further be explained as follows: 33 (15.7%) of the
respondents strongly disagree with the statement, 70 (33.3%) of them are in disagreement
with the statement, 38 (18.1%) participants disagreed slightly, 28 (13.3%) of the respondents
are neutral, 17 (8.1%) out of them agreed slightly with the statement, 16 (7.6%) participants
agreed with the statement and only 8 (3.8%) participants are strongly in agreement with the
statement with a mean and standard deviation of ( X = 3.98, SD = 1.85). This result shows
that the participants are of the opinion that government policy on compensation
administration has not been enforced in their organisation therefore they have a low
perception about it.
The next statement to this is that government policy on remuneration has achieved
comparability between public and private sectors pay and benefit. In total, 46 (22.1%)
participants strongly disagreed, 69 (32.9%) participants disagreed, 28 (13.3%) of them
disagree slightly, 41 (19.5%) of the respondents were neutral, 11 (5.2%) participants agreed
slightly, 8 (3.8%) of the respondents are in agreement with the statement and the remaining 7
(3.3%) participants are strongly in agreement with the statement with a mean and standard
deviation of ( X = 3.28, SD = 2.00). This result is an indication that participants perceived
that government policy on remuneration has not achieved comparability between public and
private sectors pay and benefit. Therefore, their perception about the statement was low.
The next statement in terms of aggregation is that government policy has contributed to the
employees’ motivation in their organisation and is explained as follows: 46 (22.1%)
participants strongly disagree, 51 (24.5%) of them are in disagreement with the statement, 29
(13.9%) participants disagreed slightly, 28 (13.5%) of them are neutral, 8 (3.8%) of the

237
respondents agreed slightly with the statement, 26 (12.5%) of the participants are in
agreement with the statement while the remaining 20 (9.6%) participants strongly agreed on
the statement with a mean and standard deviation of ( X = 3.02, SD = 1.65). This result
shows that the participants were not very satisfy with the contribution of government policy
contribution on employee’s motivation in A&G Insurance Plc. Hence, their perception about
it was low and not satisfactory.
The next statement says government policy as regards compensation takes adequate care of
the private sector and the views of the participants are as follows: 46 (21.9%) of them are in
strong disagreement with the statement, 69 (33.0%) of them also disagree with the statement,
28 (13.3%) participants disagreed slightly, 41 (19.5%) of the respondents were neutral, 11
(5.2%) of them agreed slightly, 8 (3.8%) participants are in agreement with the statement
while the other 7 (3.3%) participants are strongly in agreement with the statement with a
mean and standard deviation of ( X = 2.83, SD = 1.60). From the result, it was established
that the participants were not very satisfy on government policy as regards compensation for
not taking adequate care of the private sector. Therefore, the perception of the respondents
was very low.
The last statement that is having the least value is that government policy on compensation
has greatly influenced the review of salaries in their organisation, the views of the
participants are as follows: 16 (7.6%) participants strongly disagreed with the statement, 42
(20.0%) out of the participants are in disagreement with the statement, 30 (14.3%) of them
disagreed slightly, 50 (23.8%) of them were neutral, 9 (4.3%) participants agreed slightly, 39
(18.6%) of the them are in agreement with the statement, and the remaining 24 (11.4%)
participants are having strong agreement with the statement with a mean and standard
deviation of ( X = 2.78, SD = 1.56), this shows that the participants were not really satisfied
that government policy on compensation has greatly influenced the review of salaries in their
organisation. In other words, government policy on remuneration has no effect on the
relationship between compensation administration and employees’ motivation in the private
sector.
The results indicate that the respondents are dissatisfied with this statement. This implies that
in the perception of the respondents there is no relationship between compensation
administration and governmental policy in the insurance industry in Nigeria. Likewise, the

238
above table portrays the mean of each statement as responded to by the participants as
follows: item 3 is having a mean of ( X =3.98), item 5 is having ( X =3.28), item 4 is having
( X =3.02), item 1 is having ( X =2.83), while item 2 has ( X =2.78) which shows that the
respondents are not in agreement with the statements. The standard deviation of each
statement that is greater than 1.5 reveals that the participants varied in a significant way in
their responses to the statements. Above all, the responses of the participants revealed that
government policy on compensation management does not really affect reward
administration in the insurance industry in Nigeria that operates within the private sector.
The questions asked in this section are imperative to this study in the sense that it will
highlight how government policies on compensation have influenced the management of
compensation in the insurance sector in Nigeria. In all the 5 items in this section, majority of
the respondents disagree with the items which is an emphasis that governmental policies on
compensation in Nigeria does not have a bearing or influence on the remuneration in the
Nigeria’s insurance sector. Thus, this will have a scholarly contribution by laying emphasis
that government policies on compensation package should be enforced since government is
indirectly controlling the operations of insurance business through its regulatory framework
carried out National Insurance Commission (NICOM) created by government.
6.6 RELIABILITY TESTING
Cronbach's Alpha (α) is the most common method used to measure the reliability of Likert
scales (Sekaran, 2003; Dong, Simon, Odwazny & Garbien, 2008). The Cronbach’s alpha
analysis was performed on all the accepted variables to ensure the reliability of the
questionnaire and to test for the existence of any substantial flaws, which could have beeen
created while the survey was being undertaken. The generally accepted cut off is that the
alpha scores should be higher than 0.7 (George and Mallery, 2003). From Table 6.15, all the
measuring instruments had a Cronbach’s alpha coefficient of more than 0.6 that signifies the
consistency and reliability of the questionnaire. Therefore, it can be concluded that there is
homogeneity between the questions that measure the same variable.

239
Table 6.15: Descriptive Statistics and Correlation Coefficient among Variables Variables Mean Standard
Deviation
1 2 3 4 5 6 7
1 Compensation
Management
19.83 8.933 -
2 Job Satisfaction 25.21 6.242 .641** -
3 Leadership Role 32.64 5.632 -.017 .094 -
4 Job
Performance
29.32 7.311 -.141* .046 .106 -
5 Self-
Actualisation
24.11 6.181 .116 -.119 -.017
.212**
-
6 Organisational
Effectiveness
32.54 4.620 .132 .180* .318** -.034 .004 -
7 Motivation 25.59 5.592 .583 .468 .079 -.077 .213 .167** -
8 Government
Policy
15.93 5.565 .360** .439** -.059 .074 .105 .067 .419
** Correlation is significant at the 0.01 level (2-tailed).
* Correlation is significant at the 0.05 level (2-tailed).
Table 6.15 above shows the descriptive statistics and correlation coefficient (r) among the
variables used in this study. From the table, the result depicts that positive (r=.641) is an
indication that there is a moderate association or significant relationship between
compensation management and job satisfaction at the 0.01 level (2-tailed), that is, r=.641** at
the 0.01 level (2-tailed). The results from the table also revealed that there is a negative (r=-
.141) which means that there is a significant negative relationship that existed between
compensation management and job performance of the employees’ at the 0.05 level (2-
tailed). The r=-.141* at the 0.05 level (2-tailed) shows that there is a weak association
between the two variables. It was also established through the results that a significant

240
positive relationship exists between self-actualisation and job performance of the employees’
and this is shown by r=.212 at the 0.01 level (2-tailed). The r=.212** is not a strong
relationship between the two variables. From the table also, it was recognised that there is a
positive (r=.318) association between organisational effectiveness and leadership roles which
is a very weak one at 0.01 level (2-tailed). The r=.318** is at the 0.01 level (2-tailed).
The results from the Table 6.15 also show that there is a positive (r=.180) association
between organisational effectiveness and job satisfaction at the 0.05 level (2-tailed) though it
is a weak significant association, that is, r=.180* at the 0.05 level (2-tailed). The table also
shows that another positive relationship existed between motivation and organisational
effectiveness in the sense that r=.167 at the 0.01 level (2-tailed), that is, r=.167** at the 0.01
level (2-tailed). There is another significant relationship that exists between government
policy and compensation management which is positive (r=.360) at the 0.01 level (2-tailed)
and not strong, that is, r=.360** at the 0.01 level (2-tailed). Finally, there is positive (r=.439)
association between government policy and job satisfaction at the 0.01 level (2-tailed) which
also signifies a weak association between the two variables, that is, r=.439** at the 0.01 level
(2-tailed).
Table 6.16 Cronbach’s alpha (α) coefficient for variables
Construct Cronbach’s Alpha Number of Item
Compensation Management 0.869 6
Job Satisfaction 0.741 6
Leadership -5X(MLQ) 0.796 6
Job Performance 0.828 6
Self-Actualization 0.809 6
Organizational Effectiveness 0.709 6
Motivation 0.813 6
Governmental Policy 0.733 5
Source: Researcher’s Analysis of Field Survey, 2013

241
6.7 DISCUSSION OF FINDINGS
The major findings of this study in respect of each of the research objectives and research
questions will be discussed below.
6.7.1 Research Objective and Question 1
The first research objective states that ‘to identify and examine the extent of compensation
management and its effect on the performance of insurance industry in Nigeria’ while the
research question states ‘to what extent does compensation management affect the
performance of employees in A&G Insurance Plc.? The study revealed that the level of
employee performance in A&G Insurance Plc is satisfactory and high to some extent in
Nigeria compared with other sectors such as industrial and energy in Nigeria. From item 1, it
is found that the employees believe that their salary was commensurate with the work they do
with the mean score of 3.97 and the standard deviation of 2.20 ( X = 3.97, SD = 2.20) which
attest to the fact that the respondents strongly agree with the statement. From item 3, which is
the second in ranking according to the respondents that their salary is high enough to
compensate them for their jobs with a mean of 3.50 and the standard deviation of 1.80 ( X =
3.50, SD = 1.80). This exhibited that employee’s in Nigeria insurance sector are satisfied to
some extent with their pay which will equally enhance their performance. It was determined
from item 5 that the respondents were dissatisfied with the statement that their salary is
competitive, reasonable and is reviewed on a fair manner with a mean of 3.28 and the
standard deviation of 1.77 ( X = 3.28 SD = 1.77). This means that the employees of the
insurance industry in Nigeria using A&G Insurance Plc as a focus are not happy. Item 6
showed that the respondents were equally not satisfied with the statement that the company
pays salary and emoluments that were reasonable to motivate employees to perform
effectively. Based on a lay down procedure, item 6 had the mean score of 3.18 and the
standard deviation of 1.76 ( X = 3.18 SD = 1.76). This also indicates that the employees of
the insurance industry in Nigeria are not encouraged which may lead to low performance and
performance of the organisation will be affected. The participants in item 2 are in
disagreement that their salary is more than what is paid in similar companies in the industry
with a mean of 3.12 and the standard deviation of 1.68 ( X = 3.12 SD = 1.68). This is an
indication that the employees of insurance industry in Nigeria may be affected in their morale
toward their duty and affects their performance negatively. The study also revealed in item 4
that the participants are not in agreement with the statement that they received other

242
payments apart from the main salary. This was supported with the mean score of 2.80 and the
standard deviation of 2.35 ( X = 2.80 SD = 2.35). This is a pointer that employees of the
insurance industry in Nigeria are not well cartered for, thus their performance level is
affected and which tells on the overall performance of the organisation. It could be inferred
that the reward apparatus does not enhance performance of the employees at A&G Insurance
Plc with a weighted mean score of 19.85 and the standard deviation of 11.56 ( X = 19.85 SD
= 11.56).
Table 6.17 below shows the Pearson correlation between compensation management and the
performance of A&G Insurance Plc employees.
Table 6.17: Pearson Correlation between compensation management and performance of A&G Insurance Plc employees
N Mean Std. D R P
compensation management
Job Performance
210
210
3.9667
5.7524
1.05111
1.05111
.626
.009
Correlation is significant at the 0.05 level. p<0.05
It is evident from the analysis that the correlation between compensation management and the
performance of A&G Insurance Plc employees is .626 which is significant at 0.05 (r=0.626,
ρ<0.05). The p-value of 0.009 was lower than .05 with correlation coefficient R=0.626 or
62.6%. This implies that compensation management contributes significantly to the
performance of A&G Insurance Plc employees. Thus, following the rule of the thumb, there
is a moderate association between compensation management and employees’ performance
which is an indication that performance of the employees in the insurance industry in Nigeria
is relatively high. This shows that employee’s performance has been affected by the
compensation management in A&G Insurance Plc and thus having bearing on the overall
performance of the industry. The findings revealed that the performance of the employees of
A&G Insurance Plc has been affected to some extent.
6.7.2 Research objective and question 2
The second objective is to determine ‘whether the organisation is achieving the satisfaction of
the employees’ while the research question states that has ‘the organisation achieved the

243
satisfaction of its employees?’ One major findings of this study was the relatively high level
of job satisfaction of the employees of A&G Insurance Plc. This can be buttressed by the
overall mean of their responses which was 25.22 with the standard deviation of 9.42.
In addition, in item 1 the majority of the respondents stated that they were very satisfied with
their activities – being able to keep busy all the time with the mean of 5.29 shows that the
respondents strongly agree with the statement with the standard deviation of 1.54 ( X = 5.29,
SD = 1.54). This means that employees in the Nigerian insurance industry were given the
opportunity to do their job with less interference from the superior officers. It was find in
item 2 that there is opportunities for advancement in their job with a mean of 4.51 and with
standard deviation of 1.56 ( X = 4.51, SD = 1.56), this clearly shows that there is a career
growth path in the insurance industry in Nigeria. In terms of responsibility – item 3 shows
that the chance to be responsible, to determine and plan their work is having a mean of 4.53
and standard deviation of 1.55 ( X = 4.53, SD = 1.55). This indicates that employees of
insurance industry in Nigeria are given the opportunity to chart/planned their schedule of
work in as much they are able to meet up with their targets. In relation to company policy –
item 4 shows that the policies and practices toward the employees in the company has a mean
of 3.81 and the standard deviation of 1.50 ( X = 3.81, SD = 1.50). The employees of
Nigeria’s insurance industry are not in agreement with the policies and practices of the
insurance industry toward them, hence they are not satisfied. Item 6 deals with job security –
from the respondents, the security of the job they do for their company has a mean of 3.70
and the standard deviation of 1.68 ( X = 3.70, SD = 1.68). This shows that their job security
is not totally garantteed in the insurance industry in Nigeria which will dampen their morale
on the job. Item 5 is on compensation – their pay and the amount of the duty they carry out
has a mean of 3.50 as well as a standard deviation of 1.50 ( X = 3.50, SD = 1.50). These are
the least ranked among the items for the second research question which indicates that the
pay they are receiving is not commensurate with their duty. This is to say that the pay in
insurance industry in Nigeria is very low compared with other industries in Nigeria. However
in totality, it shows that there is a high level of job satisfaction among the employees. The
overall mean score of 25.22 and a standard deviation of 9.42 is an attestation of the fact that
A&G Insurance Plc as an organisation has achieved the satisfaction of its employees. To

244
further address this issue the Pearson product moment correlation coefficient (PPMCC) was
calculated using Statistical Package for Social Sciences and is shown on the Table 6.18
Table 6.18: Pearson correlation between compensation management and employees’ satisfaction
N Mean Std. D R P
compensation management
employees satisfaction
207
207
5.7536
5.2995
5.09542
1.54139
-
.445
-
.027
Correlation is significant at the 0.05level i.e, p<0.05, there exists a significant relationship
between compensation management and the employees’ satisfaction.
Table 6.18 indicates that the correlation between compensation management and the
employees’ satisfaction is .445 which is significant at 0.05 level (r=.445, p<0.05). This
implies that there is significant positive relationship between compensation management and
employees’ satisfaction of A&G Insurance Plc in Nigeria. The value of p which is 0.027 is
lower than 0.05 and the correlation coefficient is 0.445 or 44.5% indicates that there is a
relationship between compensation management and the employees’ satisfaction. Thus,
following the rule of the thumb, there is a weak association between compensation
management and employees’ performance which is an indication that satisfaction of the
employees in the insurance industry in Nigeria is relatively weak. This shows that employee’s
satisfaction has not been highly affected by the compensation management in A&G Insurance
Plc and thus having low bearing on the performance of the employees in A&G Insurance Plc
as well as the organisation as a whole. The findings indicate that A&G Insurance Plc has not
achieved the satisfaction of its employees to a larger degree.
6.7.3 Research objective and question 3
The third research objective states that ‘to investigate the effectiveness of the organisation in
terms of resources allocation and achievements of its objectives’ while the research question
states that ‘does the organisation achieve effectiveness in the usage of its resources? Another
major finding of the study is the effectiveness of the use of resources at Alliance and General
Insurance Plc (A&G). The study revealed that Alliance and General Insurance Plc (A&G) is
very effective in the use of its resources. The respondents’ responses had an overall mean

245
score of 27.34 and a standard deviation of 7.33. The study also revealed that the respondents
had a clear understanding of their roles, responsibilities and accountability with the mean of
5.69 and a standard deviation of 1.05 ( X = 5.69, SD = 1.05), which indicates that the
employees have an understanding of their roles and responsibilities as regards the effective
utilisation of the organisational resources in the insurance industry in Nigeria. Based on item
6 which was rated high, the respondents showed that they have clear information on who they
need to collaborate with in order to be successful in their roles with a mean of 5.62 and the
standard deviation of 1.20 ( X = 5.62, SD = 1.20). The employees in the insurance industry in
Nigeria were in the know of who they should collaborate with to ensure their success on the
job. Item 2 ranked third showing that employees equally have confidence in their decision-
making authorities with a mean of 5.50 and the standard deviation of 1.25 ( X = 5.50, SD =
1.25). This shows that the employees have confidence in their superiors when it comes to
decision-making process which enhances the effective usage of resources in the insurance
industry in Nigeria. It was established through item 1 that respondents understands the
company performance objectives and the standards for their function having the mean of 5.28
and standard deviation of 1.37 ( X = 5.28, SD = 1.37). This shows that the employees are
well acquinted with the performance objectives of A&G Insurance Plc, thereby making the
employees to work in accordance with the stated performance objectives, which will translate
to individual performance, as well as the entire performance of the organisation. Item 4
shows that workers are empowered and participated in decision making with a mean of 5.22
and the standard deviation of 1.21 ( X = 5.22, SD = 1.21). This indicates that employes of
A&G Insurance Plc were opportuned to participate in decision-making process that has a
positive effect on resources utilisation in the organisation. The last ranked item here is item 5
which indicate that employees were taught to believe in the promises and commitments to the
next steps that will assist in achieving other performance objectives. This is having a mean of
5.09 and the standard deviation of 1.24 ( X = 5.09, SD = 1.24). In conclusion, the
respondents strongly agree that there was an effective use of the organisational resources. The
overall mean score of 27.34 and the standard deviation of 7.33 support this conclusion that
A&G Insurance Plc uses its resources judiciously. This is collaborated by using the Pearson
product moment correlation coefficient to realise the stated objective as exhibited through
Table 6.19 below.

246
Table 6.19: Pearson Correlation between organisational effectiveness and achievement of its objectives
N Mean Std. D R P
organization effectiveness
objectives achievement
206
206
5.6845
3.5194
1.05111
1.64008
.319
.026
Correlation is significant at the 0.05 level. p<0.05 that is, there exists a significant
relationship between organisational effectiveness and the achievements of its objectives.
From Table 6.19 the correlation between the effectiveness of the organisation and the
achievement of its objectives is .319 which is significant at 0.05 level (r=.319, p<0.05). This
implies that there is a significant relationship between the effectiveness of the organisation
and the achievement of its objectives. The p-value is lower than .05 for both variables. The
correlation coefficient is .319 or 31.9%. Thus, following the rule of the thumb, there is a
weak association between organisational effectiveness and the achievements of its objectives
in A&G Insurance Plc. This is an indication that the resources in the insurance industry in
Nigeria has not been judiciously utilised especially the human resource due to low
remuneration package offered to the employees which usually results to labour turnover. This
shows that there is no tangible relationship between organisational effectiveness and the
achievement of its objectives.
6.7.4 Research objective and question 4
The fourth research objective of this study states that ‘to ascertain the impact of
compensation management on employees’ motivation’ while the research question states that
‘does compensation management motivates employees toward greater performance?’ One of
the major findings of this study is that the level of motivation of the employees in A&G
Insurance Plc is high. The study reveals that, the following motivational items were rated as
satisfactory.
Human relations/co-workers – they enjoyed adequate interpersonal relationship with their
colleagues with a mean score of 5.63 and standard deviation of 1.40 ( X =5.63, SD=1.40). It
can be deduced that the employees are highly motivated through the interpersonal
relationship they are having with their counterparts at workplace in the insurance industry in
Nigeria. On the item of independence and recognition, they agree that their supervisor allows

247
them to do their work independently and received recognition from them as well with a mean
of 5.46 and standard deviation of 1.27 ( X =5.46, SD = 1.27). This shows that the workers of
A&G Insurance Plc were accorded the opportunities to take initiatives on their own as relates
to their duty and their decision is being honoured and recognised by their managers.
Concerning promotion – their promotion was enhanced through what they do on the job or
the achievement recorded with a mean of 4.39 and standard deviation of 1.87 ( X =4.39, SD =
1.87), this is an indication that the employees contribution toward the development and
growth of A&G Insurance Plc was recognised and adequately compensated with promotion.
Item 3 is in relation to company policy – the respondents are not totally in agreement that
company policy is friendly and flexible as it allows contribution of new ideas by the
employees’ with a mean score of 3.76 and a standard deviation of 1.63 ( X =3.76, SD = 1.63).
This is an indication that the new ideas initiated by employees at times are not been
considered as important contribution by the senior managers which most often dampens the
morale of the employees of insurance industry in Nigeria. The statement that developmental
programmes which is item 5 have been used by the organization to boost the employee’s
morale is not supported by the respondents with a mean of 3.53 and standard deviation of
1.64 ( X =3.53, SD = 1.64). This means that company management does not use
developmental programmes like information technology training, seminers, conferences to
enhance the career growth of the employees. However, on compensation system – the
respondents are not in support of the statement that they are receiving the same compensation
as their counterparts in similar industry with a mean of 5.62 and standard deviation of 1.20
( X =5.62 SD = 1.20). The response of the participants indicates that their remuneration is at
variance with what their counterparts in similar industry are receiving especially in the
banking industry in Nigeria. Hence, this indicates that employees of A&G Insurance Plc are
highly motivated on 5 motivational items, which are, human relations/co-workers,
independence and recognition, promotion and company policy. This shows that compensation
management is a great motivational inducement that motivates the employees towards greater
performance. The aggregate mean of 28.39 and standard deviation of 9.01( X =28.39,
SD=9.01) is a confirmation that the employees are well motivated as a result of the reward
structure that is in place at A&G Insurance Plc. A compensation structure, in which the
employees who perform better are paid more than the average performing employees,
motivates employees to perform better and harder. This can also be buttressed by the analysis

248
done using Pearson product moment correlation coefficient to know may be compensation
has an impact on employees motivation and is shown through the Table 6.20 below.
Table 6.20: Pearson correlation between compensation management and employees’ motivation
N Mean Std. D R P
Compensation
Management
Employees Motivation
208
208
3.9667
5.7524
2.00334
1.40433
.648
.000
Correlation is significant at the 0.05 level. p<0.05 that is, the relationship between
compensation management and the employees motivation is significant.
Table 6.20 shows the relationship between compensation management and the employees’
motivation in A&G Insurance Plc in Nigeria. As indicated in the table, the correlation
between compensation management and the employees’ motivation is 0.648. The p-value is
0.000 and is lower than .05 with correlation coefficient R=0.648. This also indicates that the
association between compensation management and employees’ motivation of A&G
Insurance Plc is a moderate one because the correlation coefficient is 0.648 or 64.8%. This
gives sufficient evidence of the linear relationship between the variables. This means that
there is a positive significant relationship between compensation management and the
employees’ motivation in A&G Insurance Plc in Nigeria. In other words, compensation
management contributes significantly to the employees motivation in the company. This
indicates that compensation management has an impact on employee’s motivation in the
insurance industry in Nigeria.
6.7.5 Research objective and question 5
The fifth research objective of this study states ‘to investigate the impact of compensation
management on employees leadership roles’ while the research question states ‘to what
extent does compensation management determine the leadership role of employees? The
study reveals that the A&G Insurance Plc employees are assumed to have satisfactorily
performed their leadership roles because they have the chance to do things for other people.
They also make their co-workers feel good and happy to be around them with a mean score
of 5.86 and a standard deviation of 1.09 ( X =5.86, SD=1.09). They were happy when agreed

249
standards were accomplished by co-workers with an average of 5.50 and standard deviation
of 1.27 ( X =5.50, SD=1.27).They agreed that, they explain with few simple words what co-
workers should and could do about their task with a mean score of 5.40 and standard
deviation of 1.28 ( X =5.40, SD=1.28). They confirmed that they pay serious personal
attention to others who are rejected with a mean of 5.30 and standard deviation of 1.37
( X =5.30, SD=1.37). The respondents are satisfied by making others to perceive and think
about old problems in new ways with a mean of 5.29 and standard deviation of 1.41
( X =5.29, SD=1.41). The participants said recognition and rewards are accorded others who
accomplished their set goals/objectives with a mean of 5.27 and standard deviation of 1.53
( X = 5.27, SD = 1.53). The cumulative mean of 32.62 with a standard deviation of 7.95
suggests that the majority of the respondents perceived the leadership roles of the employees
of A&G insurance Plc as satisfactory. This is an indication that compensation management
has a significant and positive impact on the employees’ leadership roles. This can further be
verified through the Pearson product moment correlation coefficient calculated through the
usage of SPSS and is shown by Table 6.21 below.
Table 6.21: Pearson correlation between compensation management and leadership role of employees
N Mean Std. D R P
Compensation
Management
Leadership
208
208
3.9904
5.8558
2.00962
1.08942
.481
.000
Correlation is significant at the 0.05 level. p<0.05 that is, the relationship that exists between
compensation management and employees’ leadership roles is very significant.
From Table 6.21, the correlation between compensation management and the leadership role
of the employees is .481 which is significant at 0.05 level (r=.481, p <0.05).This implies that
there is a significant relationship between compensation management and the leadership role
of the employees in A&G Insurance Plc in Nigeria. The p-value of 0.000 is lower than .05
with correlation coefficient R=0.481. This reveals that the correlation coefficient is 0.481 or
48.1% shows a weak association between compensation management and employee’s
leadership role which gives an evidence of linear relationship between the variables. This

250
indicates that compensation management has not strongly determine the leadership roles of
the employee’s in A&G Insurance Plc and which can be generalised for the insurance
industry as a whole in Nigeria.
6.7.6 Research objective and question 6
The sixth research objective for this study is ‘to examine the contribution of compensation
management to self-actualisation of employees’ while the research question states ‘does
compensation management enhance self-actualisation of employees? For the effects of
compensation management on self-actualisation of the employees, A&G Insurance Plc
employees have rated the following as satisfactory. They can express their feelings even
though it tends to result into unfavourable consequences with an average of 5.29 and standard
deviation of 1.42 ( X = 5.29, SD = 1.42), this implies that the employee’s of A&G Insurance
Plc are able to voice out their feelings even though it may have some negative consequences
on them . They said that they were extremely bothered by the fear of being inadequate with a
mean of 4.07 and standard deviation of 1.56 ( X = 4.07, SD = 1.56). This means that
employee’s of A&G Insurance Plc are afraid of their shortcomings which may hinder them
from realising their dreams in terms of self-actualisation which can be generalised in the
insurance industry in Nigeria.
The respondents often felt ashamed of their emotions that relate to organisational
performance objectives with an average of 3.89 and standard deviation of 1.77 ( X = 3.89,
SD = 1.77). The findings here show that the employee’s are not happy emotionally when they
are unable to meet the organisational performance objectives. This in most case is attached to
their moving up careerwise, which means self-actualisation as a dream may be hindered. The
respondents do not believe that people are essentially good and can be trusted in the course of
their duty with an average score of 3.86 and a standard deviation of 1.97 ( X =3.86, SD =
1.97). They disagreed with the statement that they must be willing to do what others expected
of them in the company with an average score of 3.50 and standard deviation of 1.96 ( X =
3.50, SD = 1.96). This finding reveals that employee’s are not ready to compromise standard
even if they are offered gratifications in terms of money.
The respondents did not agree that they avoid attempts to analyse and simplify complex
domains with an average score of 3.44 and standard deviation of 1.79 ( X = 3.44, SD = 1.79).
This implies that the employees A&G Insurance Plc employees in Nigeria are of the view

251
that they avoid any attempt to analyse and simplify complex domains beacuse it does not add
anything to their compensation from the management. The aggregate mean score of 24.05
and standard deviation of 10.47 ( X = 24.05, SD = 10.47) indicates that the employees are
self-actualised and this also indicates that the aim of the employees being self-actualised is
being complemented by the reward structure that is in place within the organisation. In order
to verify whether compensation management has contributed to self-actualisation of
employee’s or not, Pearson product moment correlation coefficient was calculated through
the usage of SPSS and is presented in Table 6.22 below.
Table 6.22: Pearson correlation between compensation management and self-actualisation of employees
N Mean Std. D R P
Compensation
Management
self-actualization of
employees
206
206
3.9466
5.2913
2.00294
1.45924
.381
.000
Correlation is significant at the 0.05 level. p<0.05 showing that there exist a relationship
between compensation management and self-actualisation of the employees.
From Table 6.22, the correlation between compensation management and self-actualisation of
the employees is .381 which is significant at 0.05 level (r=.381, p <0.05). The p-value of
0.000 is lower than 0.05 which reveals an insignificant relationship between compensation
management and self-actualisation of the employees of A&G Insurance Plc and the
correlation coefficient R of 0.381 or 38.1% which is very weak. Thus, following the rule of
the thumb, there is a weak association between compensation management and self-
actualisation of employees in A&G Insurance Plc and can be concluded that the contribution
of compensation management to self-actualisation of employees in A&G Insurance Plc and
insurance industry generally in Nigeria is insignificant.
6.7.7 Research objective and question 7
The seventh research objective for this study states ‘to dtetermine the effects of government
policies on compensation management and workers’ motivation in the insurance industry in
Nigeria’ while the research question states ‘does government policies affect the relationship

252
between compensation administration and employees motivation? The employees of A&G
Insurance Plc have appraised the items thus: that government should enforce its policies on
compensation in the firm with a mean score of 3.98 and standard deviation of 1.85 ( X =
3.98, SD = 1.85). Government policy on remuneration has achieved comparability between
the public and private sectors pay and benefit was not agreed upon with a mean of 3.28 and
standard deviation of 2.00 ( X = 3.28, SD = 2.00). The respondents were not in agreement
with the statement that government policy on remuneration has contributed to the employee’s
motivation in their organisation with a mean of 3.02 and standard deviation of 1.65 ( X =
3.02, SD = 1.65). The participants also had a negative view on government policy as regards
compensation as it takes adequate care of the private sector with a mean of 2.83 and standard
deviation of 1.60 ( X = 2.83, SD = 1.60). The respondents disagreed with the view that
government policy on compensation has greatly influenced the review of salaries in their
organisation with a mean of 2.78 and standard deviation of 1.56 ( X = 2.78, SD = 1.56). The
aggregate mean score of 15.89 and standard deviation of 8.66 depicts that government policy
has not favoured compensation administration and the employee’s motivation in A&G
Insurance Plc. The study reveals that the majority (67.1 percent) of A&G Insurance Plc
employees in Nigeria declared that the government should enforce its policies on
compensation in private companies. They believed that government policy on remuneration
has not achieved comparability between the public and the private sectors pay and benefit.
They agreed that government policy on remuneration has contributed to the employee’s
motivation only in the public organisation and that government policy as regards
compensation do not take adequate care of the private sector. To further determine may be
government policies is having an effect on compensation management/administration and
workers’ motivation in the insurance industry in Nigeria, Pearson product moment correlation
coefficient was calculate and the result is shown in Table 6.23 below.

253
Table 6.23: Pearson correlation between government policies on compensation and workers’ motivation
N Mean Std. D R P
government policies on
compensation
workers’ motivation
209
209
3.9856
5.6364
1.86434
1.40460
.073
.292
Correlation is significant at the 0.05 level. p>0.05 shows that there is no significant
relationship between government policies on compensation management and the workers’
motivation
From Table 6.23, the correlation between government policies on compensation and the
workers’ motivation is .073 was identified which is not significant at 0.05 level (r=.073, p
>0.05). This implies that there is a very weak relationship between government policies on
compensation and the workers’ motivation in A&G Insurance Plc in Nigeria. The p value of
0.292 is greater than 0.05 which reveals that there is an insignificant relationship between
government policies on compensation administration and the employees’ motivation in the
insurance industry in Nigeria where A&G Insurance Plc falls. The implication of this result
is that government policy on compensation in Nigeria has a negligible significance on the
workers’ motivation in the private sector in Nigeria.
Secondly, government policy on compensation has little influence on the workers’ motivation
level. Thirdly, the result could also be indicative of the fact that government policy on
compensation is meaningless without extending it to the private sector. Lastly, this result may
probably be due to the fact that government often neglects the private sector in some of its
policy implementation because it is not seen as part of the public sector.
6.8 CONCLUSION
This chapter covers the data analysis and interpretation of results. The section A of the
instrument is about the demographical data of the the participants that was analysed using
simple percentage and were represented both tabularly and graphically. The section B of the
instrument is the section that was used to address the objectives of this study and the
measures that were used namely compensation management questionnaire scale (CMQS), the

254
short form of the Minnesota job satisfaction questionnaire (MSQ), multifactor leadership
questionnaire form-5X (MLQ), job performance scale questionnaire (JPSQ), the reversed
brief index of self-actualisation scale (BISA-R), motivational questionnaire scale (MQS) and
government policy questionnaire scale (GPQS). The variables were measured using a six-
item measure by requesting the participants to respond to 7 Likert point scale ranging from
7(Strongly agree) to 1 (Strongly disagree). The responses of the participants was analysed
using mean, standard deviation and Pearsman product moment correlation coefficient and
Cronbach’s alpha (α) coefficient to determine the reliability of the instrument. This chapter
also covers the discussion of the findings upon which the summary of the findings was based.
One of the major findings of this study is that the remunerations paid to the employees is very
low compared with their responsibilities as worker’s of the organisation. It was found that the
level of job satisfaction of the employees of insurance industry in Nigeria is not high because
of some reasons such as lack of job security, the policies and practices toward employees of
this company and the disparity between the pay they are receving and the amount of duty
they do. Another major finding of this study is that the development programmes have not
been used by the organisation to boost employee’s morale in the insurance industry in
Nigeria.
The next chapter will focus on the summary of the findings, recommendation, conclusion,
contribution to knowledge and suggestion for further studies.

255
CHAPTER 7
SUMMARY OF THE FINDINGS, CONCLUSIONS, RECOMMENDATIONS AND
SUGGESTIONS FOR FURTHER STUDY.
7.1 INTRODUCTION
The previous chapter discussed data analysis, interpretation of data and discussed the finding
in relation to the research objectives of this study and equally provide answers to the research
questions as discussed at the beginning of this study.
This chapter contains the overall conclusions and recommendations of the study, as well as
the limitations of the research and recommendations regarding future research. The aim of
this study was largely to investigate the impact compensation management and motivation on
organisational performance in the insurance industry in Nigeria focusing on Alliance and
General Insurance Plc. The research was conducted using quantitative research method by
administering questionnaires to the respondents. The literature study focused the overview of
Nigeria, historical background of insurance industry in Nigeria, compensation management
and organisational compensation.
The literature study also focused on motivation and organisational performance, job
satisfaction, leadership, self-actualisation, motivational theories as well as the relationship
between compensation management, motivation and organisational performance. In relation
to the primary goal of this study that is on finding the impact of compensation management
and motivation on organisational performance in the insurance industry in Nigeria, the
research objectives were to:
To identify and examine the extent of compensation management and its effect on the
performance of insurance industry in Nigeria.
To determine whether the organisation has achieved the satisfaction of the employees.
To investigate the effectiveness of the organisation in terms of resources allocation
and achievements of its objectives.
To ascertain the impact of compensation management on employees’ motivation.

256
To investigate the impact of compensation management on employees leadership
roles.
To examine the contribution of compensation management to self-actualisation of
employees.
To determine the effects of government policies on compensation and workers’
motivation in the insurance industry in Nigeria.
To determine the relationship between compensation management, motivation and
performance in the insurance industry in Nigeria.
7.2 SUMMARY OF FINDINGS
This is the section that summarises the findings of this study and it is highlighted as follows
7.2.1 Employees/organisational pefromance
The first major finding of this study is that compensation is an important factor in achieving
employee’s performance in the Nigeria insurance industry. It was established in this study
that the salary paid to employee’s of insurance industry in Nigeria is not commensurate to the
work they do, hence, the employee’s are dissatisfied leading to low performance which will
have an adverse effect on the organisational performance in the Nigerian insurance industry.
It is also found that the salary that is being paid in insurance industry in Nigeria is not at par
with what is offered by similar industry in the same sector especially with what is being paid
in the banking industry in Nigeria. This has been a major source of demotivation for the
employee’s of insurance industry in Nigeria which has also contributed to the low
performance of employee’s in the industry which invariably affects the organisational
performance of A&G Insurance Plc.
Another finding of this study is that the salary offered by the insurance industry in Nigeria is
grossly inadequate for the job the employee’s are doing in the industry which has led to low
performance of the employee’s and consequently affected the overall performance of the
organisation when compared with other industries in Nigeria. The resultant effect of this is
low commitment, low dedication to duty by the employee’s.
The study also revealed that other emoluments that are paid apart from the salary is also
discouraging because majority of the respondents disagreed with the statement that they

257
receive other payments apart from their salary. This however has an impact on the
performance of employee’s of insurance companies and it definitely affects the general
performance of the insurance industry in Nigeria.
It is also found that the salary paid in the insurance industry in Nigeria is not competitive
when viewed along side with other industries within the same sector, that is, the financial
sector; it is also not a reasonable package and not being reviewed in a fair manner which
makes the insurance industry in Nigeria less attractive to job applicants. This authomatically
impact the performance of the employee’s and that of the organisation in an insignificant
way.
Another major finding of this study is that the salary and emoluments that are paid to the
employee’s of insurance industry in Nigeria does not encourage them to perform effectively
based on lay down procedures. This inturn has an effect on the performance of the
employee’s in such a less positive manner and have an overbearing effect on the performance
of the industry.
It is therefore submitted that compensation management in A&G Insurance Plc has not
significantly impact on the performance of employee’s which has impacted on the overall
organisational performance of insurance industry in Nigeria insignificantly.
7.2.2 Job satisfaction
The findings about the employee’s job satisfaction are as follows
A major finding is that the employee’s of A&G Insurance Plc were satisfied on their job
because they are able to keep themselves busy all the time with little interference from their
superiors which makes them to have more concentration while executing their duty. This has
greatly enhanced their performance which later translates to the overall performance of the
organisation.
This study also established that there are opportunities for career advancement in A&G
Insurance Plc and in insurance industry in Nigeria generally. This is inform of promotion of
the employee’s as at when due to the next level on the career ladder which has boost the
morale of the employee’s and equally gears them towards greater performance and also
impact on the general performance of insurance industry in Nigeria. This indicates that the

258
employee’s are satisfied with their job and can encourage them to stay longer as an employee
of the organisation.
It is equally found that the employee’s of A&G Insurance Plc were given the chance to be
responsible to determine and plan their own schedule of duty which has highly encourage
them to put in their best in the course of carrying out the work schedule. This brought in job
satisfaction for the employee’s that later improved their performance and consequently
improved the organisational performance of the insurance industry in Nigeria.
Another important finding of this study is that the policies and practices toward the
employee’s of A&G Insurance Plc is not satisfactory enough which made the employee’s to
loose interest in the organisation and subsequently, the performance of the employee’s was
lowered and this also affected the overall performance of the organisation and the insurance
industry in Nigeria at large.
It is also established in this study that there is no congruence between the amount of money
paid to the employee’s and their responsibilities within the organisation and this has reduced
their satisfaction on the job. This will often have an effect on the performance level of the
employees and at the end will affect the organisational performance of A&G Insurance Plc
and the industry generally in Nigeria. At the end of the day, the employee’s might engaged
themselves in shaddy deals by transacting insurance business with their clients without
rendering an account of what they have done properly.
The last finding under the job satisfaction is that of job security. The issue of job security at
A&G Insurance Plc is not encouraging because the employee’s are saying that they are not
happy. This shows that employement agreement can be terminated any time without
considering the impact on the employee’s which has a direct impact on the performance level
of both the employee’s and the organisation.
All these findings indicate that the objective of achieving the satisfaction of the employees
has not being significantly accomplished in the insurance industry in Nigeria.
7.2.3 Organisational effectiveness
On the achievement of effectiveness through the usage of its resources, this study finds that

259
The employee’s of A&G Insurance Plc had a clearer understanding of the organisation’s
performance objectives and standards as regards their duty. This has enabled them to perform
optimally in achieving a huge success in the utilisation of resources of the organisation which
later caused an improvement on overall organisational performance of the company.
It is equally established that the workers’ of A&G Insurance Plc perfectly understood their
line of decision making authorities which has greatly enabled them to make decisions that is
within their area of operation and also aligns with the expectations of the organisation.
This study also found that employees are acquinted with their roles, responsibilities and
accountabilities which has given them the ample opportunity to be accountable for any
decision they made as regards the effective utilisation of the resources of the organisation to
aid their performance and will at the same time improve the quality of performance of the
organisation as a whole.
From the fore going, it is established that the A&G Insurance Plc has been effective in its
resources allocation and achievements of its objectives.
7.2.4 Motivation
On the construct of motivation which is an important aspect of this study, it has been
established that:
The employee’s of A&G Insurance Plc has been allowed by their supervisors to do their work
on the own and also receive recognition from them as well in terms of praise, thank you or a
word like weldone. This has boosted the morale of the employee’s which also endears their
heart to the organisation. This will definitely improved their performance and serve as an
enhancement for the overall performance of the organisation and the insurance industry in
Nigeria at large.
It was also found that the promotions of the employee’s is anchored on what they do or
achieved in the course of executing their duties. This clearly shows that promotion as a
motivational factor has been based on individual merit not god fatherism and it has increase
the enthusiasm of the employee’s of A&G Insurance Plc to work toward accomplishing
greater performance as an individual as well as achieving organisational performance in the
insurance industry in Nigeria.

260
Another finding of this study is that the company policy is unfriendly and not flexible on new
ideas emanating from the employee’s in the sense that their ideas are not taking serious by
their superiors and this has a demoralising effect on them. This will have a negative impact
on their performance and also affect the entire performance of the industry. In short, the
employee’s are not miotivated by the policies of the company.
This study further established that there is a high level of interpersonal relationship among
the employee’s of A&G Insurance Plc. and this indicates that they enjoy team spirit that make
them to work together as a group to accomplish the company’s set goals. This is a great
source of motivation and it has achieved a great measure of performance on the part of
individuals within the organisation as well as the general organisational performance within
the insurance industry in Nigeria.
It is also established that A&G Insurance Plc has not engaged the use of developmental
programmes to boost the morale of its employee’s which has considerably demoralised the
employee’s to put in their best since they have no opportunity of learning new skills of doing
their job. This invariably affects their performance and likewise the overall performance of
the organisation and their entire insurance industry in Nigeria.
Another major finding here hinges on the compensation received by the employee’s that is
not comparable with what is obtainable in similar industry. In fact, there is an outcry through
the responses of the participants that their pay is relatively low in comparison with their
counterparts in similar industry. It can be deduced from their reponses that they are not
significantly motivated like their colleagues especially in the banking industry which tells on
their performance and also affects the overall performance of the insurance industry in
Nigeria.
However, it is ascertained that compensation management has impacted on employee’s
motivation though the impact was a weak one and this has also enhance the performance of
the employee’s to a certain degree which later translates to overall performance of the
organisation in the insurance industry in Nigeria.
7.2.5 Leadership roles
The findings of this study on leadership roles of the employee’s are as follows

261
It is found that employee’s achieved greater performance when they exhibit their leadership
role by making others feel real good and happy when around them. That is, they are happy
doing their job when they have good companionship with other members or coworkers within
the organisation coupled with their take home pay. This has helped A&G Insurance Plc to
accomplish its goal and at large the insurance industry in Nigeria.
It is equally established that the employee’s were able to accomplish their leadership
responsibilities when they express themselves with few and simple words about what should
be and what can be done. This is an indication that the time wasted in explain issues to each
other can be used to accomplish certain objectives of the organisation which will cause an
improvement on employee’s individual performance as well as the performance of the
organisation generally within the insurance industry in Nigeria.
The leadership role of recognising and rewarding others when they accomplished their goals
or objectives is another vital finding of this study which has made them to contribute in their
own small way to the boosting of the morales of others within the organisation. This is
having a direct relationship to their performance and that of others within A&G Insurance Plc
which also induces the performance of the entire organisation.
It is found that the employee’s also made others to perceive and think about old problems in a
new way in the sense that they do not allow themselves to be weighed down by the mistakes
made in the past. They do this by encouraging themselves and not shifting blames on
anybody about the cause of any previous problem.
It is established that serious personal attention is being paid to others who seem rejected, may
be as a result of bad superior-subordinate relationship that can affect the performance of that
person which will also have a direct linkage to the performance of the organisation via the
performance of that individual within the organisation.
The last findings here is that through the leadership role of the employee’s, they are okay
when agreed standards are accomplished by others because it is going to be a plus for them
when doing their performance appraisal. It will also have a positive implication on the overall
performance of the insurance industry in Nigeria.
However, it has been established through this study that compensation management has some
measure of significant impact on employee’s leadership roles.

262
7.2.6 Self-actualisation
The summary of findings on self-actualisation for this study is as follows
It has been revealed through this study that the employee’s feel ashamed of any of their
emotions as it relates to organisational performance and financially may have an impact on
the take home package. This is because most insurance companies worked based on
commission for their employee’s and when there is no financial motivation, to be self-
actualised may not be attainable. Once employees are not getting to the peak of their career, it
will affect their performance as well as that of the organisation.
It is equally established that the empolyee’s have the opportunity to express themselves even
in the face of unfavourable consequences that can cost them their job or means of livelihood.
This is achieved if they perceive that they are on the right track. Being able to do this
automatically aid them in getting actualised and this will bring an improvement on their
performance and that of the organisation at large.
Another finding of this study is that employee’s are extremely bothered by fears of being
inadequate when they are not able to meet the demands of the office they occupied. This
position goes with a lot of responsibilities and monetary attachment which has always being a
source of motivation for them to be more self-actualised. This will practically have an impact
on their performance and that of the organisation.
From the findings and through the Pearson product moment correlation coefficient, it is
established that compensation management has contributed to the self-actualisation of the
employee’s in the insurance industry in Nigeria.
7.2.7 Government policy
The researcher has established that government policies on compensation management have
not been adhered to in their entirety by management in the private sector. This shows that the
reward system in terms of pay and benefit in the private sector is low and solely in the hand
of the management of the organisation. Hence, the majority of the respondents are totally in
disagreement that government policies do affect the relationship between compensation
administration and employees motivation in A & G Insurance Plc.
It is concluded that compensation management and workers’ motivation in the insurance
industry in Nigeria has not been affected by government policies

263
7.3 CONCLUSION
This study investigated the relationship between compensation management, motivation and
organisational performance in the insurance industry in Nigeria. The findings revealed that
there is a relationship between compensation management, employees’ motivation and
organisational effectiveness in the insurance industry that operates within the private sector of
the Nigerian economy. Conclusions are drawn from the findings linking it to the research
objectives.
Conclusion 1
The research revealed that the salaries of the employees’ are commensurate with their work
which shows that the perception of the employee’s about their salary is equal to their output.
This has really encouraged them to work hard leading to higher performance and
consequently enhancing the organisational performance of the insurance industry in Nigeria.
The findings of this study equally revealed that the relationship between compensation
management and job performance of the employees is not significant in the sense that their
salary is not at par with what is obtainable in similar companies within the industry. There are
no sufficient emoluments to motivate the employees to perform well as the salary they
receive is not enough but fair and on the average, their pay is reasonable. This, in turn, has
enhanced the employees’ performance with a correspondence increase in the performance of
A & G Insurance Plc. This finding is in agreement with the finding of earlier studies carried
out by Kim et al. (2008), Loomis (2008), Redling (2008), Fein (2010), and Odunlade (2012)
who reported that compensation management have a significant positive effect on
organisational performance. They stated that firms with formal bonus plans had an average
pre-tax return on investment better than firms without a formal plan. The finding is also in
congruent with the Vroom’s expectancy theory which reported that linking an increasing
amount of rewards to performance increases motivation and performance in organisations.
This is also corroborated by the works of Sloof and Praag (2007) and Şafakli and Ertanin
(2012) that equitable wage will bring a correlational relationship between employee’s
motivation and their performance that will cause greater organisational efficiency and
performance.
However, this is at variance with studies by Idemobi, Onyeizugbe, and Akpunonu (2011),
who found that financial compensation for staff members in the public service does not have

264
a significant effect on their performance and that financial compensation received is not
commensurate with the staff efforts. Also, Loomis (2008), found a less than perfect
correspondence between compensation and the returns on shareholders equity.
This has supported the research objective that compensation management has an effect on the
employee’s performance as well as that of the organisation as a whole.
Conclusion 2
This study was able to establish that the insurance organisation has been able to achieve the
satisfaction of its employees to some extent while in terms of policy administration of the
company, the amount they received and security of the job of the employees was
discouraging to the workers. Consequently, on job insecurity and policy administration, they
were dissatisfied. In other words, the level of job security in A & G Insurance Plc is low. The
study has also demonstrated that job satisfaction is one of the fundamental factors towards
achieving organisational performance as well as that of the employees. This job satisfaction
derives from the opportunity for growth within the firm. Notably, employees have the leeway
to determine and plan their work schedule, which makes them more accountable.
Additionally, there are good policies and practices within the organisation that border on the
welfare of the employees. This result is in line with the findings of Cole and Cole (2008) who
reported that workplace attitudes such as job satisfaction have a positive correlation with
performance outcomes. Also, the results concur with the findings of Schneider et al. (2003)
who reported that there was a positive relationship between the performance and the
satisfaction of the employees. They claimed that employees who are in higher performing
organizations are more likely to be satisfied than those in lower performing organizations
simply because their organizations are doing well. Similarly, the report of the study
conducted by Ryan, Schmit, and Johnson (1996) in an auto finance company indicated that
the employee morale was related to subsequent business performance indicators, customer
satisfaction sentiments, and turnover ratios. This is also supported by the works of Ahmed et
al., (2010), Ҫelik et al., (2011), Aydogdu and Asikgil (2011), Benita and Anghelache (2012)
and Rashid et al., (2013) that job satisfaction comes up when workers are encouraged towards
their job, they feel more satisfied in their jobs. Through this, employee’s then, offer their best
effort and contribute their quotas with all potentials they possess.

265
These findings also aligns with Herzberg’s two factor theory that talks of motivators which
are intrinsic factors like advancement, recognition, achievements and work itself. On the
other hand, Herzberg (1966) talks of hygiene as the second factor which is also referred to as
dissatisfiers or extrinsic factors such as salary, company policies, job security, interpersonal
relationships and supervisory styles. The conclusion of Herzberg’s two factor theory is that it
is more evident that good performance is a product of job satisfaction rather than the reverse.
Another theory that supported the findings here is Porter and Lawler’s (1968) expectancy
model that was an extention of Vroom’s (1964) expectancy theory where Porter and Lawler
(1968) viewed effort as a function of the perceived value of a reward and the perceived
effort-reward probability. Their model explains the relationship that exists between
motivation, reward, satisfaction and performance. Hence, Porter and Lawler (1968) suggested
that satisfaction is an effect and not a cause of performance, i.e. job satisfaction is a result of
performance.
It is evident from the findings that A&G Insurance Plc as an organisation has been able to
achieve the satisfaction of its employee’s to a certain degree.
Conclusion 3
The researcher has established that the achievement of organisational effectiveness via the
use of its resources is very high. This is due to the clarity about the performance objectives
and decision-making authorities, having a clear understanding of their roles, responsibilities
and accountabilities by the employees. Organisational effectiveness is realised when
employees feel empowered and supported to make decisions on their own. Employees need
to know who they need to collaborate with in order for them to be successful in their roles in
the organisation. This, however, has led to the achievement of organisational performance of
A & G Insurance Plc. Another major finding is that there is a significant relationship between
the effectiveness of the organisation and the achievement of its objectives. This is also in line
with past studies which reported that there existed positive relationship between effectiveness
of the organisation and the achievement of its objectives. The study conducted by Khandekar
and Sharma (2005) using human resource as a reources revealed that there is a relationship
between organisational effectiveness and resource utilisation. This is also corroborated by the
studies of Carton and Hofer (2006) and Richard et al., (2009) that organisational
effectiveness is the real output measured against the intended or expected output.

266
It is therefore submitted that the organisation has been effective in its resources allocation and
objective achievements.
Conclusion 4
The findings of this study show that compensation management enhances employees’
motivation and in turn reflects on the performance of the firm. This is due to the recognition
the employees receive from their supervisors and the promotion they earn deriving from the
duty they perform and the interpersonal relationship with their colleagues within the
organisation. All these are non-financial compensatory measures but have the potential of
endearing the heart of the employees to the organisation leading to an improvement in the
organisational performance. Similarly, it was likewise revealed that factors like lack of
developmental programmes and being paid less than their counterparts within the industry as
well as the company policy have not really motivated the employees. This has a negative
impact not only on the performance of the employees but also affects the performance of
A&G Insurance Plc.
This finding is consistent with the findings of earlier studies conducted by Wolf (1999),
Mawoli and Babandako (2011), and Solomon et al. (2012). Wolf (1999) reported that pay for
performance is the only grail of modern compensation, but claimed that the main thing is
defining performance properly, and that the organization pays for results and not for effort. In
addition, Mawoli and Babandako (2011) stated that a positive relationship existed between
compensation management and the employees’ motivation. They argued further that as pay
increases, the employees commitment to the organization also increases. Also, Solomon et al.
(2012) reported that there was a significant positive relationship between compensation
management and the employees’ motivation leading to the improvement in the employees’
productivity. They concluded that a sound compensation program is essential so that pay can
serve to motivate employee’s production sufficiently to keep labour costs at an acceptable
level. Similarly, the findings of Malik (2010) and Gupta and Tayal (2013) aligned with the
findings of this study that desire for position, power, security, achievement, working
conditions, and recognition by management of A&G Insurance Plc are source of motivation
for the employee’s that gears them toward greater performance which also enhances the
overall performance of the organisation in the insurance industry in Nigeria.

267
The findings of this study also aligned with the Herzberg’s (1966) two factor theory that
describes motivation as either motivators or hygiene factors. The motivators include variables
like achievement, recognition, responsibility, work itself, advancement and potential to grow
within the job. However, Herzberg (1966) also identified the hygiene factors to include
variables such as company policies, salary, co-worker’s relations, supervisory styles, job
security and status. Herzberg (1966) suggested further that to motivate employees to put in
their best, the manager must pay attention to the motivators; nevertheless, the hgiene factors
are not a ‘second-class citizen system’ but equally necessary to avoid unpleasantness at work
as well as to deny unfair treatment. This was also corroborated by the study done by Rashid
et al., (2013) that job satisfaction and motivation are inseparable tangible principles when it
comes to the issue of success of any firm and its workers.
The findings of this study therefore affirm that compensation management has impacted on
employee’s motivation in the insurance industry in Nigeria.
Conclusion 5
This study indicates that compensation management has influenced the leadership role of the
employees thus leading to their commitment, dedication and being faithful to the
organisation. This invariably has a bearing on the performance of the organisation, that is, A
& G Insurance Plc.
Another major finding is that there is a significant relationship between compensation
management and the leadership role of the employees at A&G Insurance PLC in Nigeria.
This finding is in line with ealier studies by Durowoju, et al., (2011), Wang, et al., (2011),
and Ogbonna and Harris (2000).
Durowoju, et al., (2011) reported that there is a clear cut relationship between some
leadership styles and organizational performance which is through democratic, visionary,
charismatic and transformational leadership styles that are positively related to the firm’s
performance most especially financial performance and employee’s satisfaction.
Also, Wang et al., (2011) concluded that there was a direct link between the CEO’s task-
focused behaviours and the firm’s performance. It was also argued that the CEO’s
relationship-focused behaviours are significantly related to the employee’s attitudes and these
attitudes lead to an improvement in the performance of the firm. This also shows that when

268
employees’ are satisfied, it brings about positive increase in the firm’s performance. Also,
Ogbonna and Harris (2000) carried out a study on leadership style, organisational culture and
performance with empirical evidence from UK companies. However, the study reveals that
there is a relationship between leadership style and performance which is moderated by the
form of organisational culture that is in existence in the firm.
The finding of this study was in congurency with the Douglas McGregor Theory X and
Theory Y that the way managers go about motivating people at work is a function of their
attitudes toward workers. Douglas McGregor observed that manager’s attitudes fall mainly
into one of two entirely different managerial styles which he referred to as theory X and
theory Y. Moreover, this was supported by the works of Nickels et al., (1999) and Ferrell et
al., (2008) that theory Y essentially emphasises a relaxed managerial atmosphere where
workers are free to be creative, be flexible, and go beyond the goals set by the management.
This is done through empowerment which gives employee ability to make decisions and the
tools to implement the decisions they make. All these are in line with the research questions
on the leadership roles of the employees.
The outcome of this study also comfirm that compensation management impacts on
employee’s leadership role at A&G Insurance Plc.
Conclusion 6
The findings of the study reflect that self-actualisation of the employees of A & G Insurance
Plc is attributable to the compensation management that are not financial in nature. These are
basically based on what the employee feels about their emotions, not doing what others
expect of them, believe that people are good then trust them, bothered by fear of being
independent, then expressing their feelings even if the result is going to be unfavourable in
terms of consequences. This research work on compensation management, motivation and
organisational performance further discovered that employees avoids attempt to analyse and
simplify complex domains in terms of making critical decisions within the organisation
which will automatically affect the performance of A & G Insurance Plc as an organisation.
Furthermore, findings from this research reveal that the relationship between compensation
management and self-actualisation of employees is significant. This is achieved through non-
financial compensation factors such as recognition by the employers by offering the

269
employees developmental support programmes to any level that the employee wants to grow
and become more fulfilled, thus resulting to the accomplishment of greater performance. The
researcher established that self-actualisation is the main advancement needed by employees
that actually does not become a reality or never fully satisfied. Thus, it becomes a permanent
source of motivation.
The findings of this study is in agreement with the findings of Mullins (2010) which reported
self-actualisation needs are not necessarily a creative urge and may take many forms which
vary widely from one individual to another. To attain the self-actualisation needs of the
employees, modern employers and organisations must show great interest and be ready to
learn: that sustainable success is anchored on a serious and compassionate commitment by
helping them to identify, pursue and attain their own personal unique potentials. Through this
recognition by the employers, they offer developmental support to their employees to any
degree that the employee seeks to grow and become more fulfilled since this will be tailored
toward greater performance (Densten, 2003; Schafer, 2010; Edwards & Gill, 2012).
Also, the contribution by Muo (2013) in his study titled “motivating and managing
knowledge workers: evidences from diverse industries and cultures” argued that self-
actualisation need is “the need to become everything that one is capable of becoming”. Muo
went further to say that self-actualisation is the main advancement need which actually is
never fully satisfied and hence it becomes a permanent source of motivation. Silva (2007)
through her paper “eLeadership-Leading IT professionals to drive results” argued that self-
actualisation is a need for employees to fully achieve their talents, capabilities and potentials.
Therefore, the manager or employers should bring to bear by providing enabling
environment, challenges and opportunities for the employees’ that will aid them to reach their
full or apex of their career. Silva (2007) focus was on information technology professionals
whose major concern was on their rights to be in the correct job or task.
The findings of this study is in alignment with Maslow’s (1943) hierarchy of needs that
emphasises self-actualisation as the fifth need in the line of hierarchy of motivation of human
beings which connotes the best that an employee can be. It was corroborated by the findings
of Ferrell et al., (2008), De Brouwer (2009), Basit and Santoro (2011) that the need for self-
actualisation varies from person to person. Also, Susan et al., (2012) while reviewing

270
Maslow’s 1943 work concluded that the concept of self-actualisation has a direct linkage to
the challenges and opportunities faced presently by employers and organisations.
The outcome of this study also comfirm that compensation management has contributed to
self-actualisation of employee’s of A&G Insurance Plc.
Conclusion 7
This study was able to establish that when government formulate policies as regards
compensation management, it does not have an impact on determination of compensation in
the private sector of the Nigerian economy where A&G Insurance Plc operates which
invariably may not enhance the motivation of the employees towards greater performance of
the organisation.
Another major finding of the study is that there is a weak relationship between government
policies on compensation and workers’ motivation in the insurance industry in Nigeria. The
study revealed that government policies (past) on compensation in Nigeria have had no
positive significant impact on the workers’ motivation in the private sector. This finding is
supported by the work of Idemobi et al., (2011).
Thus, the findings of this study revealed that government policies have no effect on
compensation management and worker’s motivation in the insurance industry in Nigeria.
This is because most insurance organisations are in the private sector where the employer has
the prerogative to negotiate and determine how much he is going to pay the employee’s and
is supported by the findings of (Balachandan et al., 2010).
7.4 RECOMMENDATIONS
Based on the findings of this study, the following recommendations are made:
Recommendation 1
The salary of the employees should be made commensurate with the task they carry out, that
is, pay should be tied to individual performance. This is associated with the competency of
the employee or skill of the employee and is normally been done by the management through
performance appraisal that could either be a quantitative or qualitative measure. This always
takes the nature of pay increase which is often done annually. The essence of this is to
motivate the employees and also to align their effort to the organisational goal. This will also

271
create the opportunity to retain the best hand in the organisation as well as institutionalising
the culture of high performance within the stratas of the organisation.
The salary of the employees in A&G Insurance Plc should be made at par with their
counterparts in similar industry especially with the salary paid in the banking industry since
they are all in the financial sector of the economy. This could be achieved by conducting
industrial survey about salaries paid in the financial sector, even going to the neighbouring
countries to compare what they pay with their own. This will serve as a retention strategy and
equally reduce the turnover intent
The other payments like housing allowance, transport allowance, health allowance,
costume/wadrobe allowance and educational allowance should be given attention and paid
adequately to motivate the employees of A&G Insurance Plc. This could be addressed based
on the inflationary rate that is prevalent within the economy. This will consequently draw
more commitment and dedication from the employees.
The salary of the employees within the insurance industry should be made more competitive,
reasonable in comparison with what is obtainable in other line of business such as making it
compartible with what is being paid in oil and gas sector, health sector and so on. The review
of the salary should also be done without bias, on a fair manner and lay down procedure
should also be followed like yearly review, review based on promotion or based on special
contribution by the employees. When this is done, it will enhance the productivity of the
employees which also translate to the overall performance of the organisation.
Recommendation 2
The opportunities for the career advancement of employees of A&G Insurance Plc and
employees of insurance industry in Nigeria should be given adequate and prompt attention by
allowing them to have growth as they spend more years within the organisation. If this is
done, it will reduce the level of job moonlighting, absenteeism and industrial unrest within
the industry.
The management of A&G Insurance Plc should have strong believe and faith in her
employees by given them the opportunity and making them responsible to determine and plan
their work schedule in line with the objectives of the company. This will make the employees

272
to have more sense of belonging and thereby setting tasks that are challenging for themselves
that will enhance their performance and that of the organisation at large.
The management of A&G Insurance Plc should take the matter of employee’s job security
important by ensuring that there is job security within the establishment. This can be done by
making sure that people are not treated anyhow nor have their appointment terminated
without following the due process of disciplinary panel that would ensure that the decision
taken is justifiable and not biased.
The company’s policies and practices regulating the welfare of the employees should be more
flexible. The company’s policies should be made friendlier that will allow the employees to
do their job maximally.
Recommendation 3
The management of A&G Insurance Plc should endeavour to emphasis more on the
performance objectives of the company and the required standards for the employees to
execute their duties in order for them to be more effective and efficient. This can be carried
out by giving them written documents that contains the vision, mission and strategic
objectives of the organisation which will translate to the performance that will make the
organisation to have a competitive advantage in the insurance industry in Nigeria.
The management of A&G Insurance Plc should emphasis more on the need for collaboration
among the employees in order for them to be more successful in their responsibilities that
will cause an improvement in their performance. This automatically will have a positive
impact on the overall performance of the organisation. This is to say that team work should
be encouraged.
The management of A&G Insurance Plc and the insurance industry in Nigeria should give
premium to the employees to have a clear cut understanding of their roles, responsibilities
and accountabilities when executing their duties which will make them to work within the
domains of their duty by not going to the purviews of other employees. This will create room
for specialisation that will bring in efficiency and effectiveness to the organisation.

273
Recommendation 4
The management of A&G Insurance Plc should also make a critical effort to ensure that the
supervisors are having less interference with the duties or works of the junior teams by giving
them the room to work maximally on their own. The superior officers should from time to
time recognise the contribution of the employees toward the accomplishment of the
organisational goals. The recognition could take the form of praise, commendation or a pat at
back and these will energies or motivate them to have a greater performance.
The management of A&G Insurance PLC should establish policies and developmental
programmes like sending the workers on on-the-job training, off-the-job training, conferences
and seminars. The management should place premium priority and adequate recognition to
the possession of professional qualifications and even pay for the cost involved in getting
these professional qualifications by the workers.
The management of A&G Insurance Plc and the insurance industry in Nigeria at large should
create a conducive working environment for the employees to come together and share their
memories with eachother. This can be achieved by making the atmosphere a bit more
democratic and more relaxable.
Recommendation 5
The management of A&G Insurance Plc and the insurance industry in Nigeria as a whole can
enhance the leadership role of the employees by applauding them when agreed standards are
accomplished that contributes to the competitive edge of the organisation. This will
invariably reduce the issue of labour turnover in the organisation.
Recognising and rewarding employees when they have accomplish their goals/objectives that
are in consonant with the overall objectives of the organisation by the management of A&G
Insurance Plc and the insurance industry in Nigeria will contribute in no small measure to the
leadership roles of the employees. This at the end will boost the performance of the employee
and that of the organisation.
The management of A&G Insurance Plc should endeavour to make the employees to perceive
old problems as if they are not real but make them to see it with a new eye. This can be

274
achieved by telling them where they have missed it and the way to resolve the problem in a
better and refined manner that will benefit the employee and the system as a whole.
Recommendation 6
The management of A&G Insurance Plc and Nigerian insurance industry as a whole can
boost the employee’s sef-actualisation by building confidence in them by allowing them to
express their feelings even it tends to result to unfavourable consequences. This is to say that
you don’t throw away the baby with the bath water. This is accomplished by giving them the
opportunity to express their feelings or more importantly, a suggestion box can be provided
for them to drop their opinion with a promise of not punishing anybody for the suggestions or
comment made.
The management of A&G Insurance Plc should build more confidence in her employees by
allowing them to make attempts to analysis and simplify complex domains. This is done by
giving them tasks that are challenging and result oriented to handle by encouraging them that
they can do it better.
Recommendation 7
The management of A & G Insurance PLC should give more attention to government policies
as regards compensation by using it to review their compensational package whenever the
government reviews the remuneration package in the public sector. That is, there should be a
level of comparison between the public and private sectors’ pay and benefit.
The above recommendations are offered based on the findings of this study but the insurance
industry in Nigeria are facing more stringent challenges to enhance performance, sustain
financial and operational targets and comply with the regulations that guide the daily
operations of insurance business. These challenges may have negative impact in achieving
operational efficiency of insurance companies in Nigeria, but they can still overcome these
challenges and the way to accomplish this includes:
Improved customer service strategy: - This is through the provision of services that are
customer friendly and satisfactory to the customers by way of offering qualitative services,
delivery of more personalised services, improved cross-sell and up-sell rates as well as
lowering operating costs. They can also improve customer satisfaction through the usage of

275
web where customers can view policy coverage, pay bills, make changes to policies, submit
claims as well as monitoring the claim progress online.
Adoption of modern technology: - Since insurance process in Nigeria is paper oriented, there
is the need to look for ways of making things to work faster and reducing the hip of papers in
offices, this can only be done by adopting modern technologies of doing things.
Educate the public: - Another way to overcome the challenges is to educate the public about
insurance business, the importance and the reason why people need to take up insurance
policy. This can be done through adverts on bill boards, jingles on the television, radios and
other media channels.
Adoption of the regulatory framework: - The regulatory framework should be enforced by the
NAICOM on the erring insurance companies by punishing them when they have done
anything that contravenes the existing regulation that guides the operation of the insurance
industry in Nigeria.
7.5 SUMMARY OF PEARSON PRODUCT MOMENT CORRELATION
COEFFICIENT (PPMCC)
From the calculated Pearson product moment correlation coefficient for this study, it can be
summarised as follows and in consonant with the stated objectives for this study
Firstly, the contribution of compensation management to employees’ performance in the
insurance industry in Nigeria is immense. From the PPMCC, the coefficient is 0.626 or
62.6% which exhibits a moderate association between compensation management and
employee’s job performance. This indicates that compensation management is having effect
on the performance of the employee’s in insurance industry in Nigeria as well as affecting the
overall performance of the organisation.
Secondly, there is a weak relationship between compensation management and employees’
satisfaction in Nigerian insurance industry. This is shown through the PPMCC calculation
with the coefficient of 0.445 or 44.5%, which is a weak association between the two
variables. This implies that in insurance industry in Nigeria, compensation management has
not really been used by insurance organisations to achieve satisfaction of the employees.
276
Thirdly, there is a weak bond between organisational effectiveness and achievements of the
objectives of the organisation. The calculated PPMCC of 0.319 or 31.9% revealed that there
is also a weak association that existed between the variables in insurance industry in Nigeria.
This is an indication that A&G Insurance Plc has slightly achieved organisational
effectiveness in terms of resources allocation and realisation of its objectives.
Fourthly, the employees’ of the insurance industry in Nigeria are significantly motivated
through adequate compensation management. The PPMCC of 0.648 or 64.8% depicts that
there is a moderate relationship that exists between compensation management and
employee’s motivation toward a greater performance in the insurance industry in Nigeria.
This is a pointer that compensation management has not significantly impact employee’s
motivation in A&G Insurance Plc and is having an over bearing effect on the organisational
performance of insurance industry in Nigeria.
Fifthly, the employees in the insurance industry in Nigeria are able to execute their leadership
responsibilities on the strength of effective and efficient compensation management. The
calculated PPMCC is 0.481 or 48.1% which shows a weak relationship between
compensation management and employee’s leadership role in A&G Insurance Plc. This
finding indicates that compensation management does not actually have a strong positive
impact on employee’s leadership role in insurance industry in Nigeria.
Sixthly, compensation management has helped towards the realisation of the self-
actualisation and aspirations of the employees of the insurance industry. From the calculated
PPMCC of 0.381 or 38.1%, it shows that the exists a weak association between compensation
management and employee’s self-actualisation in A&G Insurance Plc which is an indication
that employee’s self-actualisation has not be significantly impacted upon by compensation
management in Nigerian insurance industry.
Finally, there is no tangible relationship between government policy on compensation
management and motivation of the employees in the private sector of the Nigerian economy.
This shows that government policy on compensation administration has not had an impact
positively the on workers’ motivation in the private sector and the result also indicates that
government policy on compensation administration is meaningless and is not worth its salt
without extending it to the private sector where the insurance industry is domiciled. This
corroborated by the calculated PPMCC of 0.073 or 7.3% which reveals that there is a very

277
weak association between government policies, compensation administration and workers’
motivation in the insurance industry in Nigeria.
7.6 GENERAL OBSERVATIONS AND RECOMMENDATIONS
Firstly, it was generally observed from the result of this study that the employee’s of the
insurance industry in Nigeria are poorly remunerated by the employers in the sense that the
pay package for them is not at par with what is obtainable in the banking industry which is
also in the financial sector like the insurance industry, hence, they are not satisfied
(Ajemunigbohun et al., 2013; Obisi, Uche & Ifekwem, 2014). It is therefore recommended
that the remuneration package for the employee’s of insurance industry in Nigeria should be
visited and reviewed upward to be in line with what is obtainable other industries in the
financial sector of Nigeria.
Secondly, it was observed generally that the level of job satisfaction of the workers’ of
insurance industry in Nigeria is very low which is as a result of low pay, the policies and
practices of the organisation toward the employee’s as well as the job insecurity that is
prevalent in the industry which has eitherto affected the performance of the employee’s of the
insurance industry in Nigeria and even the public enterprises is also being affected (Samuel,
Osinowo & Chipunza, 2009; Olorunsola, 2010; Iwu & Ukpere, 2012). Hence, it is
recommended that factors that will increase employees job satisfaction in the insurance
industry in Nigeria should be put in place like ensuring adequate job security on the job,
encourage interpersonal relationships among the employees and the working environment
should be made more conducive.
Thirdly, it was also observed that employee’s of insurance industry in Nigeria were
dissatisfied and not motivated through the developmental programmes organised for them
and this has not really boost the employee’s morale towards greater performance which has
affected the organisational performance negatively (BGL Report, 2010). Therefore, it is
strongly recommended that more developmental programmes should be arranged for the
employee’s to gain more knowledge and new skills in theinsurance field and these
development programmes could be inform of on-the-job training, off-the-job training, brain
storm session, role play or seminars.
Fourthly, it was equally observed generally that the employee’s of insurance industry in
Nigeria are aggrieved about the company policy that is not friendly and flexible to

278
accommodate their contributions in terms of new ideas to can bring a positive change thereby
their readiness to offer suggestions that aid the organisation to accomplish its goals is
hampered. It is therefore suggested that the management of the organisation should have a
listening hear and give consideration to some of the suggestions raised by the employee’s
because most often they are the one that relates with the clients of the company.
Lastly, it was generally observed that government policy about compensation does not have
effect on the compensation management in insurance industry in Nigeria because the focus
the government is always on the public sector and most insurance companies in Nigeria are
privately owned. To this end, the owners of the insurance businesses believed that they have
the sole right to determine what they will pay their employee’s (Isimoya, 2014). It is strongly
recommended that government policies on remuneration should be enforced on the insurance
organisationsin Nigeria.
7.7 AREAS OF FUTURE RESEARCH
In view of the foregoing discussions, one hopes that future studies will embrace the
following:
1. Many companies in the insurance industry in Nigeria can be incorporated to extend
the study.
2. More companies in Nigeria from the financial divison such as banks and
Stockbrokerage firms can be included.
3. Concentrate on more other factors that will enhance organisational performance like
compensation management, shareholders perspective and organisational performance.
4. Further studies can embacked upon using other sectors in the Nigerian economy as
well as using other insurance companies in Nigeria to compare results of this study to
other insurance companies.
5. Developed and developing countries can be studied and compare their insurance
sectors with Nigeria insurance sector.

279
7.8 SUMMARY OF EACH CHAPTER
This section entails the summary of each chapter of this study
7.8.1 Chapter 1: Nature and scope of study
This chapter covers the background to the problem, the focus of the study and what motivated
the study. The chapter also brings to the fore the role of compensation and motivation in
organisational performance, objectives of compensation management, types of compensation
and motivation. The chapter also enunciated the aims and objectives of the study, including
the key research questions and the original contribution of the study.
7.8.2 Chapter 2: The insurance industry in Nigeria
This chapter gives an historical background of Nigeria as a nation and the over view of
Nigeria by looking at her geographical location in Africa. It also focuses on the Nigerian
population, ethnical representation and also showing some major cities in Nigeria on the
Nigerian map. Key players in insurance industry in Nigeria, the size, the current performance
of insurance industry in comparison with three other major sectors (agriculture, crude oil &
natural gas and wholesale & retail trade) was looked into. The contributions of these sectors
to Nigerian GDP as at 2012 and 2013 respectively were considered. The current and
historical challenges facing insurance industry in Nigeria was paid attention to as well as the
brief history of A&G Insurance Plc was highlighted.
7.8.3 Chapter 3: Compensation management and organisational performance
This chapter of the study focus on compensation, theories of compensation management like
agency theory, equity theory, bargaining theory, and behavioural theory. The legal
framework on compensation management in Nigeria was discussed. The relationship between
compensation and performance as well as the roles of leadership and management on
compensation management were part of discussions in this chapter. The chapter concluded
with summary of compensation management theory in relation to monetary aspect of it and
that compensation management is an instrument that can be used to achieve employee’s
performance as well as organisational performance through the employees as a resource.
7.8.4 Chapter 4: Motivation and organisation performance
The focus of this chapter was on motivation, motivational theories like Maslow’s hierarchy of
needs, Vroom’s expectancy theory, Porter and Lawler’s extension, Herzberg’s two factor
theory and so on were deliberated upon. The constructs like leadership, job satisfaction and

280
self-actualisation were discussed as well as the linkage between motivation and performance,
leadership and management role in motivation, relationship between compensation,
motivation and organisational performance was also highlighted. It is concluded that
motivation of employee’s is essential for the accomplishment of organisational goals.
7.8.5 Chapter 5: Research methodology
Comprehensively, this chapter discussed the various research philosophies as well as the
relevant fields where they are applicable before making a choice of positivism as the
philosophical stance for this study. This chapter equally deliberated on the research
methodology and research design adopted in this study. The population of the study was
considered in relation to the various sampling techniques studied, while sample size selection
for the study was based on proximity, availability and willingness of the participants. The
design of the research instrument for collection of primary data was explained and the
procedures for instrument administration were discussed. The Cronbach’s alphas (α) together
with correlation coefficient for the main variables of the study were used for computation.
Limitations of this study were addressed while the ethical codes of conducts in research
according to University of KwaZulu- Natal as observed by the researcher were equally stated
in this chapter.
7.8.6 Chapter 6: Presenstation and interpretation of results
This chapter covers the data analysis and interpretation of results. The section A of the
instrument is about the demographical data of the the participants that was analysed using
simple percentage and were represented both tabularly and graphically like pie chart, bar
chart and cone bar chart. The section B of the instrument is the section that was used to
address the objectives of this study and the measures that were used namely compensation
management questionnaire scale (CMQS), the short form of the Minnesota job satisfaction
questionnaire (MSQ), multifactor leadership questionnaire form-5X (MLQ), job performance
scale questionnaire (JPSQ), the reversed brief index of self-actualisation scale (BISA-R),
motivational questionnaire scale (MQS) and government policy questionnaire scale (GPQS).
The variables were measured using a six-item measure by requesting the participants to
respond to 7 Likert point scale ranging from 7(Strongly agree) to 1 (Strongly disagree). The
responses of the participants was analysed using mean, standard deviation and Pearsman

281
product moment correlation coefficient and Cronbach’s alpha (α) coefficient to determine the
reliability of the instrument. This chapter also covers the discussion of the findings upon
which the summary of the findings was based.
7.8.7 Chapter 7: Summary of findings, conclusions, recommendations and suggestions
for further study.
This chapter contains the overall conclusions and recommendations of this study, summary of
findings, general observations and recommendations, areas of future researchand summary of
each chapter of the study. The chapter also contains scholarly contribution of this study as
well as overall conclusion.
7.9 SCHOLARLY CONTRIBUTION OF THIS STUDY
This study on the assessment of compensation management, motivation and organisational
performance in the insurance industry in Nigeria was borne out of the desire to bridge the
existing gap in the salaries of the employees in the public sector and the private sector. Such
disparities in the salaries of these different sectors necessitated great consideration and
improving on them significantly; also leaving them as they are would subject the affected
employees to high levels of exploitation. The following are some of the contributions to
knowledge from this study:
1. Several studies on compensation management and organisational performance have
been done and most of these studies made special emphasis on CEO compensation
and organisational performance, expatriate compensation and organisational
performance, executive compensation and organisational performance and mostly on
reward systems in the public sector. On the contrary, this study has been able to
incorporate compensation management, motivation and organisational performance
together.
2. This study was also able to contribute to the frontier of knowledge by looking beyond
the motivational aspect of compensation management by looking at other variables
like job satisfaction, self-actualisation and the leadership role, all of which influences
organisational performance significantly.

282
3. This study was able to argue that non-financial compensation, such as the supervisor’s
role, recognition and interpersonal relationship also enhance the motivation of the
employees towards improving organisational performance.
4. Most of the previous research on compensation and motivation were focused on the
public sector, the banking sector, the construction sector and the educational sector.
For instance, Idemobi et al., (2011) researched on compensation management as a
tool for improving organisational performance in the public sectors in Nigeria.
Jehanzeb et al., (2012) carried out a study on the impact of rewards and motivation on
job satisfaction in the banking sector of Saudi Arabia. Khan et al., (2011) did their
own research on the banking sector of Pakistan while Adedokun et al., (2013)
researched the motivation schemes in enhancing site worker’s productivity in the
construction industry in Nigeria. This study found that nothing much has been done in
the private sector, especially in the insurance industry and in Nigeria which was a gap
and this study has been able to research into that and the study revealed that
compensation and motivation is important in achieving employee’s performance and
that of the organisation as a whole in the insurance industry in Nigeria.
5. Most of the past researches focused on so many factors such as skills, education,
gender, geographical location and so many other factors in determining the
compensation an employee receives, without paying attention to governmental
policies on wages of employee’s, but this study was able to establish that government
policies in Nigeria has an insignificant impact on the administration of compensation
and worker’s motivation in the insurance industry in Nigeria.
7.10 OVERALL CONCLUSION
The aim of this study was to investigate the impact of compensation management and
motivation on organisational performance in the insurance industry in Nigeria with special
focus on Alliance and General Insurance Plc. The the objectives were to determine and
examine the extent of compensation management and its effect on the performance of
insurance industry in Nigeria (taking A&G Insurance Plc., as a case study), to determine
whether the organisation has achieved the satisfaction of the employees, to investigate the
effectiveness of the organisation in terms of resources allocation and achievements of its
objectives. Other objectives include to ascertain the impact of compensation management on

283
employees’ motivation, to investigate the impact of compensation management on employees
leadership roles, to examine the contribution of compensation management to self-
actualisation of employees and lastly, to determine the effects of government policies on
compensation management and workers’ motivation in the insurance industry in Nigeria.
The data collected answered all the research questions and addressed all the objectives that
compensation management has impact on employees job performance, employees
satisfaction, organisational effectiveness in resources allocation and achievements of its
objectives, employees motivation, employees leadership roles, realisation of employees self-
actualisation but the impact of compensation management on the affore mentioned constructs
are very significant but moderate and weak. From the findings, government policies in
Nigeria have not affected compensation management and workers’ motivation in the
insurance industry in Nigeria in a positive way. From the findings, conclusions were drawn
and recommendations made for managers in the insurance industry in Nigeria as well as
suggesstions for further studies. The goal and objectives of this study was achieved.

284
BIBLIOGRAPHY Aamir, A., Jehanzeb, K., Rasheed, A. and Malik, O.M. (2012). Compensation methods and
employees motivation (with reference to employes of National Commercial Bank,
Riyadh). International Journal of Human Resource Studies, 2(3): 221-230.
Abolade, D.A. (2012). Impact of unionisation and non-unionisation of workers on
organisational efficiency in work organisations in south-western Nigeria. Economic
Insight-Trends and Challenges, 64(2): 19-29.
Abdullah, A.M.B. and Islam, R. (2012). Employee motivational factors: A comparison
between Malaysia and Sultanate of Oman. Journal of Global Business Advancement,
5(4): 285-306.
Absar, N., Nimalathasan, B. and Mahmood, M. (2012). HRM-market performance
relationship: Evidence from Bangladesh organisations. South Asian Journal of Global
Business Research, 1(2): 238-255.
Adams, J.S. (1965). Toward an understanding of inequity. Journal of Abnormal and Social
Psychology, 67: 422-436.
Adanu, S.A.T. (2007). Continuing professional development (CPD) in state-owned university
libraries in Ghana. Library Management, 28: 292-305.
Adedokun, O.A., Ibironke, O.T. and Olanipekun, A.O. (2013). Vulnerability of motivation
schemes in enhancing site workers’ productivity for construction industry’s
sustainability in Nigeria. International Journal of Sustainable Construction
Engineering and Technology, 4(1): 21-30.
Adeoye, A.O. (2001). Contemporary issues in human resources management and
organisational behaviour. Lagos, Nigeria: Pumark Publishers.
Adeoye, A.O., Elegunde, A.F., Tijani, A.A and Oyedele, O.O. 2012. Salary and wages and
employee motivation in Nigeria service industry. Scottish Journal of Arts, Social
Sciences and Scientific Studies, 2(2): 89-98.
Adewole, T.O. (2013). The impact of corporate governance on the survival and sustainability
of Banks in Nigeria. International Journal of Economics and Finance, 3(1): 70-107.

285
Adio, G. and Popoola, S.O. (2010). Job satisfaction and career commitment of librarians in
federal university libraries in Nigeria. Library Review, 59(3): 175-184.
Adomi, E.E. (2006). Job rotation in Nigerian university libraries. Library Review, 55: 66-74.
Aduloju, S.A., Awoponle, A.L. and Oke, S.A. (2008). Recapitalisation, mergers and
acquisition of the Nigerian insurance industry. Journal of Risk Finance, 9(5): 449-
466.
Agell, J. and Lundborg, P. (2003). Survey evidence on wage rigidity and unemployment:
Sweden in the 1990s. Scandinavian Journal of Economics, 105(1): 15-29.
Aguinis, H., Joo, H. and Goltfredson, R.K. (2013). What monetary rewards can and cannot
do: How to show employees the money. Business Horizons, 56(2): 241-249.
Agwu, M.O. (2013). Impact of fair reward system on employee’s job performance in
Nigerian Agip Oil Company Limited, Port Hacourt. British Journal of Education,
Society and Behavioural Science, 3(1):47-64.
Ahlgren, P., Jarneving, B., and Rousseau, R. (2003). Requirements for a cocitation similarity
measure, with special reference to Pearson’s correlation coefficient. Journal of the
American Society for Information Science and Technology, 54(6): 550-560.
Ahlstrom, D. and Bruton, G.D. (2010). International Management: Strategy and Culture in
the Emerging World, London: South-Western, Cengage Learning, EMEA.
Ahmed, I., Nawaz, M.M., Iqbal, N., Ali, I., Shaukat, Z. and Usman, A. (2010). Effects of
motivational factors on employees job satisfaction: A case study of university of the
Punjab, Pakistan. International Journal of Business and Management, 5(3): 70-80.
Ajemunigbohun, S.S., Tijani, A.A. and Oreshile, A.S. (2013). Comparison of reward systems
in selected insurance companies and banks in Nigeria. Indian Journal of Commerce
and Management Studies, 4(3): 1-8
Alastalo, M. (2008). The history of social research methods. In Alasuutari et al. (2008) Ed.
The Sage handbook of social research methods. London: Sage Publications, Chapter
3.

286
Alasuutari, P. (2010). The rise and relevance of qualitative research. International Journal of
Social Research Methodology, 13(2): 139-155.
Alaasuutar, P., Bickman, L. and Brannen, (2008). The sage handbook of social research
methods. London: Sage Publications Incorporation.
Albanese, R.A. (2008). Take this job and love it. Library Journal, 36-39.
Aldag, R.I. and Kuzuhara, L.W. (2002). Organisational Behaviour and Management: An
Integrated Skills Approach, South-Western, Thomson Learning, USA.
Allen, k., Reed-Rhoads, T., Terry, R.A., Murphy, T.J. and Stone, A.D. (2008). Coefficient
alpha: An engineer’s interpretation of test reliability. Journal of Engineering
Education, 97(1): 87-94. http://dx.doi.org/10.1002/j.2168-9830.2008.tb00956.x
(Accessed 2014/05/12).
Ali, S. (1998). Research methodology: Back to basics. Abac Journal, 18(1):, January-April.
Alimo-Metcalfe, B., Alban-Metcalfe, J., Bradley, M., Mariathasan, J. and Samele, C. (2008).
The impact of engaging leadership on performance, attitudes to work and wellbeing at
work: A longtitudinal study. Journal of Health Organisation and Management, 22(6):
586-598.
Al-Khasawneh, A.L. and Futa, S.M. (2013). The impact of leadership styles used by the
academic staff in the Jordanian public universities on modifying student’s behaviour:
A field study in the northern region of Jordan. International Journal of Business and
Management, 8(1): 1-10.
Almutairi, D.O., Moradi, E., Idrus, D., Emami, R. and Alanazi, T.R. (2013). Job satisfaction
and job performance: A case study of five star hotels in Riyadh, Saudi Arabia. World
Journal of Social Sciences, 3(1): 27-37.
Alpander, G.G. (1990). Relationship between commitment to hospital goals and job
satisfaction: A case study of a nursing department. Health Care Management Review,
15(4): 51-62.

287
Altindis, S. (2011). Job motivation and organisational commitment among the health
professionals: a questionnaire survey. African Journal of Business Management,
5(21): 8601-8609.
Amaratunga, D. and Baldry, D. (2002). Moving from performance measurement to
performance management. Facilities, 20(5-6), 217-223.
Amaratunga, D., Baldry, D., Sarshar, M. and Newton, R. (2002). Quantitative and qualitative
research in the built environment: Application of ‘‘mixed’’ research approach. Work
Study. 51(1): 17-31.
Amila-Prasanga, A.P. and Gamage, A.S (2012). Job satisfaction and job performance of the
Sailors in Rapid Action Boat Squadron of Sri Lanka Navy. Sri Lankan Journal of
Human Resource Management, 3(1): 49-57.
Aminu, A. (2011). Government wage review policy and public-private sector wage
differential in Nigeria. African Economic Research Consortium, Nairobi, AERC
Research Paper 223: 1-42.
Anazodo, R.O., Okoye, J.C. and Chukwuemeka, E.E.O. (2012). Civil service reforms in
Nigeria: The journey so far in service delivery. American Journal of Social and
Management Sciences, 3(1): 17-29.
Andres, L. and Grayson, J.P. (2002). Educational attainment, occupational status and job
satisfaction: A ten-year portrait of Canadian women and men, paper presented at the
annual meeting of American educational research association.
Andres, L. and Grayson, J.P. (2003). Parents, educational attainment, jobs and satisfaction:
what is the connection? A 10-year portrait of Canadian young women and men.
Journal of Youth Studies, 6(2): 181-202.
http:/www.doi.10.1080/1367626032000110309 (accessed 2013/10/04).
Anthony, R.N. and Welsch, G.A. (1981). Fundamentals of management accounting. 3rd ed.,
New York: Richard D Irwin Incorporation.
Anyebe, A. (2003). The Nigerian civil service: Issues in structure and operation. Journal of
Professional Administration, 5: 11-17.

288
Ardichvilli, A. (2001) Leadership styles of Russian entrepreneurs and managers. Journal of
Developmental Entrepreneurship, 6(2): 1-21.
Armache, J. (2012). Effect of compensation and other motivational techniques on
organisational performance. Franklin Business and Law Journal, March (1): 88-96.
Armstrong, M. (2003). A handbook of human resource management practice. 9th Ed., Great
Britain: Cambrian Printers Ltd., Aberystwyth, Wales.
Armstrong, M. (2005). A handbook of human resources management practices. UK: Kogan
Page.
Armstrong, M. and Brown, D. (1998). Relating competences to pay: The UK experience.
Compensation and Benefits Review, 30(3): 28-39.
Armstrong, M., Brown, D. and Reilly, P. (2011). Increasing effectiveness of reward
management: An evidence-based approach. Employee Relation, 33(2): 106-120.
Armstrong, M. and Murlis, H. (1994). Reward management: A handbook of remuneration
strategy and practice, 3rd ed. London: Kogan Page.
Arnolds, C.A. and Boshoff, C. (2001). The challenge of motivating top management: A need
satisfaction perspective. Journal of Industrial Psychology, 27(1): 39-42.
Arshadi, N. (2010). Basic need satisfaction, work motivation and job performance in an
industrial company in Iran. Social and Behavioural Science, 5: 1267-1272.
Asika, N. (1991). Research methodology in the behavioural sciences, Lagos, Nigeria:
Longman Plc.
Asika, N. (2008). Research methodology: Process approach. Lagos: Mukugamu Brothers,
Atkinson, A.B. (2007). The distribution of earnings in OECD Countries. International
Labour Review, 146(1/2): 41-60.
Atrill, P. and McLaney, E. (2002). Management accounting for Non-specialists. 3rd ed.,
London: Pearson Education Ltd.
Avolio, B.J. and Bass, B.M. (2004). Multi factor leadership questionnaire (journal report)
Redwood City, CA: wind garden.

289
Avolio, B.J., Waldman, D. and Einstein, W.O. (1988). Transformational leadership in a
management game simulation. Group and Organisation Studies, 13 (March), 59-80.
Avolio, B.J., Zhu, W., Koh, W. and Puja, B. (2003). Transformational leadership,
psychological empowerment, organisational commitment and leadership distance.
Paper presented at the Academy of Management Annual Conference, Seattle,
Washington.
Awai, K., Hiraishi, K. and Hori, S. (2004). Effect of contrast material injection duration and
rate on aortic peak time and peak enhancement at dynamic CT involving injection
protocol with dose tailored to patient weight. Radiology, 230(1): 142-150.
http://dx.doi.org/10.1148/radiol.2301021008 (Accessed 2014/05/120).
Aworemi, J.R., Abdul-Azeez, I.A. and Durowoju, S.T. (2011). An empirical study of the
motivational factors of employees in Nigeria. International Journal of Economics and
Finance, 3(5): 227-233.
Aydogdu, S. and Asikgil, B. (2011). An empirical study of the relationship among job
satisfaction, organisational commitment and turnover intention. International Review
of Management and Marketing, 1(3): 43-53.
Ayeleso, O. Nigeria @ 50: Insurance in retrospect, 2010.
http://www.tribune.com.ng/index.php/insurance/11686-nigeria--50 insurance-in-
retrospect. (Accessed 2014/05/22).
Babalola, G.A. and Nwalo, K.I.N. (2013). Influence of job motivation on the productivity of
librarians in Colleges of Educationin Nigeria. Information and Knowledge
Management, 3(5): 70-75.
Babbie, E.R. (1998). The practice of social research. 8th Ed. New York: Thomson,
Wadsworth Publishing Company.
Babbie, E.R. (2014). The basics of social research. 6th ed., International ed., Belmont, CA:
Wadsworth, Cengage Learning.
Babbie, E.R. (2010). The practice of social research. 12th ed. Belmont, CA: Wadsworth
Cengage.

290
Babbie, E.R. (2005). The basics of social research. Belmont, CA, Thomson, Wadsworth
Publishing Company.
Babbie, E.R. and Mouton, J. (2001). The practice of social research. South African Edition,
Oxford University Press, Cape Town, South Africa.
Babchuk, L. and Fried, J. (2003). Executive compensation as an agency problem. Journal of
Economic Perspective, 17(3): 71-92.
Badenhorst, C. (2008). Dissertation writing: A research journey. Pretoria: Van Schaik
Publishers.
Baillie, J. and Meckler, M.R. (2012). Truth and objective regained. Journal of Management
Inquiry, 21(3): 248:260.
Baker, G.P. (2002). Distortion and risk in optimal incentives contracts. Journal of Human
Resources, 37: 728-751.
Balachandan, G., Panchanathan, N. and Subramanian, K. (2010). Impact of job satisfaction
on the motivation of insurance company officers: A developmental perspective.
International Journal of Trade, Economics and Finance, 1(4).
Bárcena-Ruiz, J.C. and Campo, M.L. (2010). Wage bargaining and partial ownership.
Estudios de Economia, 37(1): 27-42.
Barcharach, S.B. and Lawler, E.J. (1981). Bargaining, power tactics and outcomes. San
Francisco: Jossey-Bass Publishers.
Barney, J.B. (2002). Gaining and sustaining competitive Advantage, 2nd ed., Upper Saddle
River, New Jersey: Pearson Education.
Bartlett, C. and Ghoshal, S. (2013). Building competitive advantage through people. MIT
Sloan Management Review, 43(2): 34-41.
Basit, T.N., and Santoro, N. (2011). Playing the role of ‘cultural expert’: Teachers of ethnic
difference in Britain and Australia. Oxford Review of Education, February, 37(1): 37-
52
Bass, B. (1985). Leadership, performance beyond expectations. New York: Free Press.

291
Bass, B.M. (1990). Bass and Stogdill’s handbook of leadership: Theory, research and
managerial applications. New York: The Free Press.
Bass, B.M. and Avolio, B.J. (1993). Transformational leadership and organisational culture.
Public Administration Quarterly, 17(1): 112-117.
Bass, B.M. and Avolio, B.J. (1993). Transformational leadership: a response to critiques. In
M.M. Chemers & P. Ajman (Eds), Leadership theory and research perspectives and
directions (pp 49-80). San Diego, CA: Academic Press.
Bass, B.M. and Avolio, B.J. (1995). MLQ, Multi-factor Leadership Questionnaire. 2nd Ed.
Redwood City, CA: Mind Gardens.
Bauweraerts, J., Vandernoot, J. and Tyrant, T. (2013). Manager’s compensation in large
public firms in Belgium: An analysis on the BEL 20. Eurasian Journal of Business
and Economics, 6(11): 15-38.
Becker, H.S. (1996). The epistemology of qualitative research. In R. Jessor, A.Colby, and
R.A. Shweder (Eds.), Ethnography and human development: Context and meaning in
social inquiry, Chicago: University of Chicago Press.
Bedeian, A., Ferris, G. and Kacmar, K. (1992). Age, tenure, and job satisfaction: A tale of
two perspectives. Journal of Vocational Behaviour, 40: 33-48.
Bedeian, A.G. (1993). Management, 3rd Ed. New York: Dryden Press.
Beitel, M., Bogus, S., Hutz, A., Green, D., Cecero, J.J. and Barry, D.T. (2013). Stillness and
motion: an empirical investigation of mindfulness and self-actualisation. Person-
Centered and Experimental Psychotherapies.
http://dx.doi.org/10.1080/14779757.2013.855131 (Downloaded 2014/05/13).
Belcher D. W. (1974). Compensation administration. Englewood Cliffs, New Jersey:
Printice-Hill.
Belfield, C.R. and Heywood, J.S. (2008). Performance pay for teachers: Determinants and
consequences. Economics of Education Review, 27: 243-252.
Bellon, J.S., Estevez-Cubilete, A., Rodriguez, N., Dandy, R., Lane, S. and Deringer, E.
(2010). Employee engagement and customer satisfaction. Proceedings of the

292
Academy of Health Care Management, Allied Academics International Conference,
New Orleans, 7(1): 1-5.
Benita, C.C. and Anghelache, V. (2012). Teacher motivation and satisfaction for professional
activity. Social and Behavioural Science, 33: 563-567.
Bernadin, H.J. (2007). Human resource management: An exponential approach. 4th Ed. New
York: McGraw-Hill/Irwin.
Bernard, H.R. (2013). Social research methods: Qualitative and quantitative approaches. Los
Angeles: SAGE Pulications.
Bernhard, F. and O’Driscoll, M.P. (2011). Psychological ownership in small family-owned
businesses: leadership style and nonfamily-employees’ work attitudes and behaviours.
Group and Organisation Management, 36(3): 345-384.
Berry, N.J. (2007). Great work, genuine problems. Library Journals, 36-39.
BGL Insurance Report (2010). http://www.bglgroupng.com/docs/Insurance_Report.pdf.
(Accessed 2014/06/17).
Bii, K.H. and Wanyama, P. (2001). Automation and its impact on the job satisfaction among
the staff of the Margaret Thatcher library, Moi University. Library Management, 22:
303-310.
Bititchi, U.M.; Carrie, A.S. and McDevitt, L. (1997). Integrated performance measurement
systems: An audit and development guide. The TQM Magazine, 9(1), 46-53.
Boatwright, K.J. and Forrest, L. (2000). Leadership preferences: the influence of gender and
needs for connection on workers’ ideal preferences for leadership behaviours. The
Journal of Leadership Studies, 7(2): 18-34.
Bob, N. (2011). Making employees suggestions count. Journal of Personnel Management,
17: 20-41.
Boerner, Eisenbeiss, S.A. and Griesser, D. (2007). Follower behaviour and organisational
performance: the impact of transformational leader. Journal of Leadership and
Organisational Studies, 13(3): 15-26.

293
Bontis, N. and Serenko, A. (2007). The moderating role of human capital management
practices on employees capabilities. Journal of Knowledge Management, 11(3): 31-
51.
Bosch, R. (2010). Objectivity and plausibility in the study of organisations. Journal of
Mamagement Inquiry, 19(1): 383-391.
Bourne, M., Franco, M. and Willces, J. (2003). Corporate performance management.
Measuring Business Excellence, 7(3), 15-21.
Bowie, R. (2004). Ethical Studies, 2nd Ed., United Kingdom: Nelson Thomas Ltd.
Bowling, N.A. (2010). Effects of job satisfaction and conscientiousness on extra-role
behaviours. Journal of Business Psychology, 25: 119-130.
Bowling, N.A., Hendricks, E.A. and Wagner, S.H. (2008). Positive and negative affectivity
and facet satisfaction: A meta- analysis. Journal of Business Psychology, 23: 115-125.
Bradley, D.E. and Roberts, J.A. (2004). Self-employment and job satisfaction: Investigating
the role of self-efficacy, depression and seniority. Journal of Small Business
Management, 42(1): 37-58, January.
Brauns, M. (2013). Aligning strategic human resources management to human resources,
performance and reward. International Business and Economic Research Journal,
12(11): 1405-1410.
Brevis, T. and Vrba, M. (2014). Contemporary management principles. South Africa: Juta
and Company Ltd.
Brians, C.L., Willnat, L.B., Manheim, J.B. and Rich, R.C. (2011). Empirical political
analysis: Quantitative and qualitative research methods. 8th ed. Boston: Longman.
Brislin, R.W., Kabgting, F., Macnab, B., Zukies, B., and Worthley, R. (2005). Evolving
perceptions of Japanese workplace motivation. International Journal of Cross
Cultural Management, 5: 87-103.
Brown, D. (2003). Reward strategies. Journal of Personnel Management, 1: 17-29.
294
Brown, M.E. and Trevino, L.K. (2006). Ethical leadership: A review and future directions.
The Leadership Quarterly, 17: 595-616.
Brown, M.P., Sturman, M.C. and Simmering, M.J. (2003). Compensation policy and
organizational performance: The efficiency, operational, and financial implications of
pay levels and pay structure. The Academy of Management Journal, 46(6): 752-762.
Brown, S.P. and Leigh, T.W. (1996). A new look at psychological climate and its relationship
to job inducement, effort and performance. Journal of Applied Psychology, 81(4):
358-368. URL: http://dx.doi.org/10.1037/0021-9010.81.4/358. (Assessed:
12/09/2012).
Bruvik, K. and Gibson, J.W. (2011). The past, present and future of executive compensation.
Business Studies Journal, 3(1): 69-83.
Bryant, S.E. (2003). The role of transformational and transactional leadership in creating,
sharing and exploiting organisational knowledge. The Journal of Leadership and
Organisational Studies, 9(4): 32-44.
Bryman, A. (2012). Social research methods. Oxford: Oxford University Press.
Bryman, A. and Bell, E. (2011). Business research methods. Oxford: oxford University Press.
Burd, B. (2003). Work values of academic librarians: exploring the relationships between
values, job satisfaction, commitment and intent to leave. ACRL Eleventh National
Conference, April 10-13, Charlotte, North Carolina, USA.
Burns, A.C. and Bush, R.F. (1998). Marketing research, London: Prentice Hall.
Burton, L.J. and Mazerolle, S.M. (2011). Survey instrument validity Part 1: Principles of
survey instrument development and validation in athletic training education research.
Athletic Training Education Journal, 6(1): 27-35.
Bycio, P., Hackett, R.D. and Allen, J.S. (1995). Further assessments of bass’s (1985)
conceptualisation of transactional and transformational leadership. Journal of Applied
Psychology, 80(4): 468-478.
Bygren, M. (2004). Pay reference standards and pay satisfaction: What do workers evaluate
their pay against? Social Science Research, 33(2): 206-224.

295
Cabral Vierra, J.A. (2005). Skill mismatches and job satisfaction. Economics Letters, 89: 39-
47.
Calder, B.J. and Staw, B.M. (1975). The self-perception of intrinsic and extrinsic motivation.
Journal of Personality and Social Psychology, 31, 599-605.
Callan, S.J. and Thomas, J.M. (2011). Executive compensation, corporate social
responsibility, and corporate financial performance: A multi-equation framework.
Corporate Social Responsibility and Environmental Management, 18(6): 332-351.
Cano, J. and Miller, G. (2005). A gender analysis of job satisfaction, job satisfier factors and
job dissatisfier factors of agricultural education teachers. Journal of Agricultural
Education, 33: 40-46.
Cao, T., Donnelly, R. and McCarthy, J. (2012). Pay, performance and governance in Irish
Plcs. Irish Accounting Review, 1: 1-22.
Carrell, M.R. (1998). Human resource management in South Africa. South Africa: Prentice
Hall.
Carter, M.Z., Armenakis, A.A., Field, H.S. and Mossholder, K.W. (2013). Transformational
leadership, relationship quality, and employee’s performance during continuous
incremental organisational change. Journal of Organisational Behaviour, 34(7): 942-
958.
Carton, R.B. and Hofer, C.W. (2006). Measuring organisational performance: Metrics for
entrepreneurship and strategic management research. Northampton, MA, USA:
Edward Elgar.
Cascio, W.F. (2003). Managing human resources: productivity, quality of work, life, profits.
6th Ed. New York: McGraw-Hill Higher Education.
Castle, D., Lemoine, C. and Durand-Delvigne, A. (2011). Working in cooperatives and social
economy: effects on job satisfaction and the meaning of work. Perspectives
Interdisciplinaires sur le travail et la santé, 13(2): 2-14.
Ҫelik, M., Man, M., Modrak, V., Dima, I.C. and Pachura, P. (2011). A theoretical approach
to the job satisfaction. Polish Journal of Management Studies, 4: 7-15.

296
Chan, M. (2008). Executive compensation. Business and Society Review, 113(1): 129-161.
Chandler, C.I.R., Chonya, S., Mtei, F., Reyburn, H. and Whitty, C.J.M. (2009). Motivation,
money and respect: A mixed –method study of Tanzanian non-physician clinicians.
Social Science and Medicine, 68(11): 2078-2088.
http://dx.doi.org/10.1016/j.socscimed.2009.03.007
Chapman, J. and Kelliher, C. (2011). Influences in reward mix determination: Reward
consultants perspectives. Employee Relations, 33(2): 121-139.
Charles, P. (2000). Performance measurement. Work Study, 49(2), 63-67.
Chartered Institute of Personnel and Development (2005). Reward Management. Survey
report. London: CIPD.
Chartered Institute of Personnel and Development (2006). International reward and
recognition guide. London: CIPD.
Chaudhary, P. (2012). Effects of employees’ motivation on organisational performance: A
case study. International Journal of Research in Economics and Social Sciences, 2(9):
81-87.
Chaudhry, A.Q. and Javed, H. (2012). Impact of transactional and laissez faire leadership on
motivation. International Journal of Business and Social Sciences, 3(7): 258-264.
Chaudhry, A.Q., Javed, H. and Sabir, M. (2012). The impact of transformational and
transactional leadership styles on the motivation of employees in Pakistan. Pakisatn
Economic and Social Review, 5(2): 223-231.
Chen, C.J., Hsu, C.Y. and Chen, Y.L. (2014). The impact of family control on the top
management compensation mix and incentive orientation. International Review of
Economics and Finance, 32: 29-46.
Chen, L.T., Chen, C.W. and Chen, C.Y. (2010). Are educational background and gender
moderator variables for leadership, satisfaction and organisational commitment?
African Journal of Business Management, 4(2): 248-261.
Chiang, C.F. and Jang, S.S. (2008). An expectancy theory model for hotel employee
motivation. International Journal of Hospitality Management, 27(2): 313-322.

297
Chipunza, C., Samuel, M.O. and Mariri, T. (2011). Leadership style, employee motivation
and commitment: Empirical evidence from consolidated retail bank operating in a
depressed economy. African Journal of Business Management, 5(20): 8337-8346.
Cloutier, J., Morin, D. and Renaud, S. (2013). How does variable pay relate to pay
satisfaction among Canadian workers? International Journal of Manpower, 34(5):
465-485.
Clugston, M. (2000). The mediating effects of multidimensional commitment on job
satisfaction and intent to leave. Journal of Organisational Behaviour, 21: 477-486.
Cohn, A., Fehr, E., Herrmann, B. and Schneider, F. (2011). Social comparison in the
workplace: Evidence from a field experiment. IZA Discussion Paper No. 5550.
Cole, L.E. and Cole, M.S. (2008). Employee satisfaction and organizational performance: A
summary of key findings from applied psychology. Available online @
http://www.teammax.net/files/LiteratureReview.pdf
Collin, S.V., Gustafsson, L., Petersson, E and Smith, E. (2012). Options are a CEOs best
friend: executive compensation and ownership in Swedish listed corporations.
Working Papers Series in Corporate Governance presented at: The Corporate
Governance research group at Linnaeus University, Pp. 1-38.
http://www.nu.se/forskargrupper/corporate-governance
Collings, D.G., Demirbag, M., Mellahi, K. and Tatoglu, E. (2010). Strategy orientation,
human resource management practices and organisational outcomes: Evidence from
Turkey. The International Journal of Human Resource Management, 21(14): 2589-
2613.
Collings, D.G. and Mellahi, K. (2009). Strategic talent management: A review and research
agenda. Human Resource Management Review, 19(4): 304-313.
Colpan, A.M. and Yoshikawa, T. (2012). Performance sensitivity of executive pay: The role
of foreign investors and affiliated Directors in Japan. Corporate Governance: An
International Review, 20(6): 547-561.

298
Cong, N.N., Van, D.N. and Huu, T.H. (2013). Effects of motivation on employees’
performance at Petrovietnam Nghe An Construction Joinst Stock Corporation.
American Journal of Business and Management, 2(2): 160-164.
Cook, C. W. and Hunsaker, P. L. (2001). Management and organizational Behaviour, 3rd Ed.
New York: McGraw Hill/Irwin.
Cooman, R.D., Stynen, D., Van den Broeck, A., Sels, L. and De Wittle, H. (2013). How job
characteristics relate to need satisfaction and autonomous motivation: Implications for
work effort. Journal of Applied Psychology, 43(6): 1342-1352.
Cooper, S., Porter, J. and Endacott, R. (2011). Mixed methods research: A design for
emergency care research. Emergency Medicine Journal, 28: 682-685.
Corpus, J.H. and Lepper, M.R. (2007). The effects of person versus performance praise on
children’s motivation: Gender and age as moderating factors. Educational
Psychology, 27(4): 487-508.
Cox, A., Brown, D., and Reilly, P. (2010). Reward strategy: Time for a more realistic
reconceptualisation and reinterpretation. Thunderbird International Business Review,
52(3): 249-260.
Cranny, C.J., Smith, P.C. and Stone, E.F. (1992). Job satisfaction, how people feel about
their jobs and how it affects their performance. New York: Lexington Books.
Cremer, R.D. and Ramasamy, B. (2009). Engaging China: strategies for the small
internationalising firm. Journal of Business Strategy, 30(6): 15-26.
Creswell, J.W. (2014). Research design: Qualitative, quantitative and mixed methods
approach. 4th ed., Thousand Oaks, CA: Sage Publications.
Crisitini, A., Eriksson, T. and Pozzdi, D. (2013). High-performance management practices
and employee outcomes in Denmark. Scottish Journal of Political Economy, 60(3):
232-266.
Crone, T.S. and Beike, D.R. (2012). Priming the nonconscious goal to self-actalise: Can even
the highest order goals be primed nonconsciously? The Humanistic Psychologist, 40:
274-282.

299
Cropanzano, R. and Wright, T. (2001). When a “happy” worker is really a “productivity”
worker, a review and further refinement of the happy-productive worker thesis.
Consult Psychology Journal of Practical Research, 53: 182-199.
Cropanzano, R., Rupp, D.E. and Byrne, Z.S. (2003). The relationship of emotional
exhaustion to work attitudes, job performance, and organizational citizenship
behaviours. Journal of Applied Psychology, 88(1): 160-169.
Cruz, N.M., Pérez, V.M. and Cantero, C.T. (2009). The influence of employee motivation on
knowledge transfer. Journal of Knowledge Management, 13(6): 478-490.
Currall, S.C., Towler, A.J., Judge, T.A. and Kohn, L. (2005). Pay satisfaction and
organizational outcomes. Personnel Psychology, 58: 613-640.
Daft, R.L. (2007). Understanding the Theory and Design of Organisations, International
Student Ed., USA: Thomson, South-Western.
Danish, R.Q. and Usman, A. (2010). Impact of reward and recognition on job satisfaction and
motivation: An empirical study from Pakistan. International Journal of Business and
Management, 5(2): 159-167.
Dauda, Y.A. (2010). Technological innovation and organisational performance: Employee
relations strategies. Nigerian Journal of Industrial Relations, (NIRA) 11: 96-110.
Davidson, J. (1898). The bargain theory of wages. New York: GP Putnam’s Sons.
Dean, A.G., Sullivan, K.M.and Soe, M.M. OpenEpi: open source epidemiologic satistics for
public health, version 3.01 updated 2013/04/06, (Accessed 2014/05/31)
DeBrouwer, Philippe J.S., (2009). Maslowian portifolio theory: An alternative formulation of
the behavioural portifolio theory. Journal of Assets Management, 9(6): 359-365.
De Rljdt, C., Stes, A., Van der Vleuten, C. and Dochy, F. (2013). Influencing variables and
moderators of transfer of learning to the workplace within the area of staff
development in high education: research review. Educational Research Review, 8: 48-
74.

300
Deconinck, J.B. and Stilwell, C.D. (2004). Incorporating organisational justice, role states,
pay satisfaction and supervisor satisfaction in a model of turnover intentions. Journal
of Business Research, 57: 225-231.
Demming, W.E. (1986). Out of the Crisis, Cambridge, MA: MIT Institute for Advanced
Engineering Study.
Denscombe, M. (2007). The good research guide for small-scale social research projects. 3rd
Ed. London: McGraw-Hill/Irwin.
Densten, I.L. (2003). Senior police leadership: Does rank matter? Policing: An International
Journal of Police Strategies and Management, 26(3): 400-418.
Denzin, N.K. and Lincoln, Y.S. (2005). The discipline and practice of qualitative research. In
N.K. Denzin and Y.S. Lincoln (Eds.), The Sage handbook of qualitative research (3rd
ed.), Thousand Oaks, CA: SAGE.
Diaz-Fernández, M., López-Cabrales, A. and Valle-Cabrera, R. (2013). In search of
demanded competencies: Designing superior compensation systems. The
International Journal of Human Resource Management, 24(3): 643-666.
Dhillon, G. and Backhouse, J. (2001). Current directions in IS security research: Towards
socio-organisational perspectives. Information Systems Journal, 11(2): 127-153.
http://dx.doi.org/10.1046/j.1365-2575.2001.0009.x (Accessed 2014/05/03).
Dibie, R. A. (2003). Public Management and Sustainable Development in Nigeria: Military-
Bureaucracy Relationship. Hampshire: Ashgate.
Dickson, W.J. (1973). Hawthorne experiments. In C.Heyel (Ed.), the encyclopedia of
management, 2nd ed. Pp. 298-302. New York: Van Nostrand Reinhold.
Divkolaii, M.S. (2014). An investigation on factors influencing on human resources
productivity. Management Science Letters, 4(5): 883-886.
Dodge, Y. (2008). The concise encyclopedia of statistics. London: Springer.
Dong, X., Simon, M.A., Odwazny, R. and Garbien, M.J. (2008). Depression and elder abuse
and neglect among community-dwelling Chinese elderly population. Journal of Elder
Abuse and Neglect, 20(1): 25-41.

301
Dowling, M. (2004). Hermeneutics: an exploration. Nurse Researcher, 11(4): 30-39.
http://dx.doi.org/10.7748/nr2004.07.11.4.30.c6213 (Accessed 2014/05/03).
Dreher, G.F., Lee, J.Y. and Clerkin, T.A. (2011). Mobility and cash compensation: The
moderating effects of gender, race and executive search firms. Journal of
Management, 37(3): 651-681.
Drury, C. (2000). Management and Cost Accounting. 5th Ed., USA: Thomson Learning.
Dulebohn, J.H. and Werling, S.E. (2007). Compensation research past, present and future.
Human Resource Management Review, 17: 191-207.
Durowoju, S.T., Abdul-Azeez, I.A. and Bolarinwa, S.A. (2011). Leadership styles and
organisational performance in Nigeria: an empirical analysis. Proceedings of
international conference on social sciences and humanities, Port Novo, Republic of
Benin, 1(4): 56-63.
Easterby-Smith, M. (1991). Management research: An introduction, London: Sage
Publications.
Encinosa III, W.E., Gaynor, M. and Rebitzer, J.B. (2007). The sociology of groups and
economics of incentives: Theory and evidence on compensation systems. Journal of
Economic Behaviour and Organisation, 62(2): 187-214.
Edelman, B. and Larkin, I. (2009). Envy and deception in academia: evidence from self-
inflation of SSRN downloads counts. Working paper, MA: Harvard Universrity,
Cambridge.
Ederer, F. and Manso, G. (2013). Is pay for performance detrimental to innovation?
Management Science, 59(7): 1496-1513.
Edmonds, W.A. and Kennedy, T.D. (2013). An applied reference guide to research designs:
quantitative, qualitative and mixed methods. Thousands Oaks, California: Sage
Publications Incorporation.
Edwards, G. and Gil, R. (2012). Transformational leadership across hierarchical levels in UK
manufacturing organisations. Leadership and Organisation Development Journal,
33(1): 25-50.

302
Egan, M.; Yang, B. and Bartlett, K.R. (2004). The effects of organisational learning culture
and job satisfaction on motivation to transfer learning and turnover intention. Human
Resource Development Quarterly, 15(3): 279-30.
Egbu, C.O. (1994). Management education and training for refurbishment work within
construction industry. PhD Unpublished Thesis. Department of Civil Engineering and
Construction. University of Salford.
Ehikioya, B.I. (2009). Corporate governance structure and firm performance in developing
economies: Evidence from Nigeria. Corporate Governance, 9(3): 231-243.
Eisenberger, R. and Aselage, J. (2009). Incremental effects of reward on experienced
performance pressure: Positive outcomes for intrinsic interest and creativity. Journal
of Organisational Behaviour, 30(1): 95-117.
Ejiofor, Y.E. and Yerokun, O.M. (2013). Tax auditing and investigation in a developing
nation : Information technology imperative. Journal of Computing Technologies, 2(9):
30-37.
Ekere, A.U. and Amah, E. (2014). Staff benefits and organisational performance: A study of
private hospitals in Rivers State, Nigeria. IOSR Journal of Business and Management,
16(2): 24-28.
Elenkov, D.S. (2002). Effects of leadership on organisational performance in Russian
companies. Journal of Business Research, 55(6): 467-480.
El-Masry, S., Kattara, H. and El-Demerdash, J. (2004). A comparative study on leadership
styles adopted by general managers: A case study of Egypt. Anatolia: An
International Journal of Tourism and Hospitality Research, 15(2): 109-124.
Eme, O.I. and Ugwu, S.C. (2011). Governors and the new minimum wage act: implications
for state-labour relations in Nigeria. Arabian Journal of Business and Management
Review, 1(3): 1-14.
Emery, C.R. and Barker, K.J. (2007). The effect of transactional and transformational
leadership styles on the organisational commitment and job satisfaction of customer
contact personnel. Journal of Organisational Culture, 11(1): 77-90.

303
EMIS, (2010), www.securities.com/.../Alliance__General_Insurance_companies_en_2.
(Accessed 2014/04/07).
Employee compensation act, 2010.
Eren, E. (1993). Management and organisation. 2nd ed. Istanbul: Beta Basim Yayim Daǧitim.
Estabrook, L., Bird, C. and Gilmore, F. (1990). Job satisfaction: Does automation make a
difference? Journal of Library Administration, 13: 175-179.
Eze, H.C. (2010). Leadership in organisation management in Nigeria. 46(1): 29-35, Jan-
March.
Fadun, O.S. (2013). Information and communication technology (ICT) and insurance
profitability in Nigeria. International Journal of Business and Management Invention,
2(1): 84-92.
Fagley, N.S. and Alder, M.G. (2012). Appreciation: A spiritual path to finding value and
meaning in the workplace. Journal of Management, Spirituality and Religion, 9(2):
167-187.
Fama, E. F. and Jensen, M.C. (1983). Separation of ownership and control. Journal of Law
and Economics, 26:301-325.
Fama, E.F. (1980). Agency problems and the theory of the firm. Journal of Political
Economy, 88: 288-307.
Fapohunda, T.M., Atiku, S.O. and Lawal, I.B. (2012). Minimum wage implementation and
management in a post-recession economy: The Nigerian experience. European
Scientific Journal, 8(7): 18-35.
Fein, B. (2010). Compensation management strategies. Journal of Personnel Management,
18: 13-27.
Feinstein, A.H. and Vondrasek, D. (2000). A study of relationships between job satisfaction
and organisational commitment among restaurant employees (2013). Retrieved 17th
July, 2013 from http://hotel.unlv.edu/pdf/job Satisfactionpdf

304
Feldman, D.C. and Arnold, H.J. (1985). Managing individual and group behaviour in
organisations, New York: McGraw-Hill Book Company.
Fellows, R.F. and Liu, A.A. (2008). Research methods for construction, 3rd Ed., London:
Wiley Blackwell.
Ferrell, O. C., Hirt, G. and Ferrell, L. (2008). Business: A changing World. 6th Ed., New
York: McGraw-Hill/Irwin.
Fibuch, E.E. (2011). Failure of senior leadership- is this a problem in your hospital?
Physician Executive, 37(2): 46-50.
Fink, A. (2013). How to conduct surveys: A step-by-step guide. 5th ed. Thousand Oak,
California: Sage Publications Incorporation.
Folan, P. and Browne, J. (2005). A review of performance measurement: Towards
performance management. Computers in Industry, 56, 663-680.
Fong, S.C.L. and Shaffer, M.A. (2003). The dimensionality and determinants of pay
satisfaction: A cross-cultural investigation of a group incentive plan. International
Journal of Human Resource Management, 14(4): 550-580, June.
Forsgren, M. (1989). Managing the internationalisation process: The Swedish case. London
and New York: Routledge.
Frey, B.S. (1997). Not Just for the Money: an Economic Theory of Personal Motivation.
Brookfield: Edward Elgar Incorporation.
Fry, L.W. and Nisiewize, M.S. (2013). Maximising the triple bottomline through spiritual
leadership. Stanford, CA: Stanford University Press.
Gable, G.G. (1994). Integrating case study and survey research methods: An example in
information systems. European Journal of Information Systems, 3(2): 112-126.
Gagne, M. and Deci, E.L. (2005). Self-determination theory and work motivation. Journal of
Organisation Behaviour, 26, 331-362.

305
Gangwar, S., Padmaja, K.V. and Bhar, S. (2013). Impact of behavioural style, self orientation
and task orientation of leaders on employee motivation. International Journal of
Global Business Management and Research, 1(2): 57-120.
Ganzach, Y. (2003). Intelligence, education and facets of job satisfaction. Work and
Occupations, 30(1): 97-122, February.
Gardner, D.G., Dyne, L.V. and Pierce, J.L. (2004). The effects of pay level on organization-
based self-esteem and performance: A field study. Journal of Occupational and
Organisational Psychology, 77(3): 307-322, September.
Gberevbie, D.E. (2013). Ethical issues and Nigeria’s quest for development. Rwanda
Journal, Series B: Social sciences, 1(1): 21-35.
George, D. and Mallery, P. (2003). SPSS for Windows step by step: A simple guide and
reference. 11.0 update (4th Ed.). Boston: Allyn & Bacon.
George, J.M. (1992). Extrinsic and intrinsic origins of perceived social loafing in
organisations. The Academy of Management Journal, 35(1), 191-202.
Gerhart, B. and Rynes, S.L. (2003). Compensation: theory, evidence and strategic
implications. Thousand Oaks. CA: Sage Publications.
Gerhart, B., Rynes, S. and Fulmer, I. (2009). Pay and performance: Individuals, groups, and
executives. The Academy of Management Annals, 3: 251-315.
Gerhart, C. and Milkovich, G.F. (1992). Performance pay as a competitive weapon. New
York: Willey.
Geuser, F.D., Mooraj, S. and Oyon, D. (2009). Does the balanced scorecard add value?
Empirical evidence on its effect on performance. European Accounting Review, 18(1):
93-122.
Ghauri, P.N., Grønhaug, K. and Kristianslund, I. (1995). Research methods in business
studies: A practical guide. New York: Prentice Hall.
Ghazanfar, F., Chuanmin, S., Khan, M.M. and Bashir, M. (2011). A study of relationship
between satisfaction with compensation and work motivation. International Journal
of Business and Social Sciences, 2(1): 120-131.

306
Gibbs, M., Merchant, M.A., Ven der Stede, W.A. and Vargus, M.E. (2004). Determinants
and effects of subjectivity in incentives. The Accounting Review, 79(2): 409-436.
Gill, J. and Johnson, P. (2010). Research methods for managers. 4th ed. Los Angeles: Sage
Publications Incorporation.
Gino, F. and Pierce, L. (2010). Robin Hood under the hood: Wealth-based discrimination in
illicit customer help. Organisation Science, 21(6): 1176-1194.
Goergen, M. and Renneboog, L. (2011). Managerial compensation. Journal of Corporate
Finance, 17: 1068-1077.
Goldstein, K. (1939). The organism: a holistic approach to biology. New York: The
American Book.
Gomez-Mejia, L.R., Balkin, D.B. and Cardy, R.L. (2006). Managing human resources. New
Jersey: Pearson Prentice Hall.
Gomm, R. (2008). Social research methodology: A critical introduction, 2nd ed., Palgrave
Macmillan, New York.
Goodman, P.S. (1974). An examination of referents used in the evaluation of pay.
Organisational Behaviour and Human Performance, 12: 170-195.
Görlitz, K. (2011). Continuous training and wages: An empirical analysis using comparison-
group approach. Economics of Education Review, 30(4): 691-701.
Grant, A.M., Campbell, E.M., Chen, G., Contone, K., Lapeclis, D. and Lee, K. (2007).
Impact and the art of motivation maintenance: The effects of contact with
beneficiaries on persistence behaviour. Organisational Behaviour and Human
decision Processes, 103, 53-67.
Grant, A.M. and Gino, F. (2010). A little thanks goes a long way: Explaining why gratitude
expressions motivate prosocial behaviour. Journal of Personality and Social
Psychology, 98(6): 946-955.
Greckhamer, T. (2011). Cross-cultural differences in compensation level and inequality acrss
occupations: A set-theoretical analysis. Organisation Studies, 32(1): 85-115.

307
Green, C. and Heywood, J.S. (2008). Does performance pay increase job satisfaction?
Economica, 75(300): 710-728, November.
Greenberg, J. and Baron, R.A. (2000). Behaviours in organisations, 7th Ed. New Jersey:
Prentice Hall.
Grobler, P.A., Wärnich, S., Carrell, M.R., Elbert, N.F. and Hatfield, R.D. (2011). Human
resource management in South Africa. 4th ed., UK: Cengage Learning EMEA.
Guest, D., Michie, J. and Sheehan, M. (2002). Effective people management. Chartered
Institute of Personnel and Development (CIPD), UK.
Guillén, M., Ferrero, I. and Hoffman, W.M. (2014). The neglected ethical and spiritual
motivations in the workplace. Journal of Business Ethics, Springer: DOI:
10.1007/s/10551-013-1985-7. (Accessed 2014:03:29).
Gummi, A.S. (2011). Impact of global financial crisis on job satisfaction of employees of
Nigerian Banks. International Journal of Social Sciences and Humanities Review,
2(2): 14-18.
Gumusluoglu, L. and Ilsev, A. (2009). Transformational leadership, creativity, and
organisational innovation. Journal of Business Research, 62: 461-473.
Gupta, A, and Tayal, T. (2013). Impact of competing force of motivational factors on
employees at work place. Information and Knowledge Management, 3(5): 143-148.
Gupta, N., Conroy, S.A. and Delery, J.E. (2012). The many faces of pay variation. Human
Resource Management Review, 22(2): 100-115.
Hackett. T. J. and McDermott, D.G. (1999). Integrating Compensation Strategies that work
from the boardroom to the shop floor. Compensation and Benefits Review,
September-October, 36-43.
Hackman, J.R. and Oldham, G.R. (1974). The job diagnostic survey: an instrument for the
diagnosis of jobs and the evaluation of job redesign projects (AD-779 828).
Washington, DC: National Technical Information Service, US Department of
Commerce.

308
Hackman, J.R. and Porter, L.W. (1968). Expectancy theory prediction of work effectiveness.
Organisational Behaviour and Human Performance, 12: 417-426.
Hall, J., Johnson, S., Wysocki, A. and Kepner, K. (2008). Transformational leadership: the
transformation of managers and associates. University of Florida, IFAS Extension,
Pp. 1-3. http://edis.ifas.ufl.edu/pdiffiles/HR?HR02000.pdf. (Accessed 2013:10:11).
Hammersley, M. (2008). Assessing validity in social research. In Alasuutari et al. (2008) Ed.
The Sage handbook of social research methods, London: Sage Publications
Incorporations, Chapter 4.
Hancer, M. and George, R.T. (2003). Job satisfaction of restaurant employees: An empirical
investigation using the Minnesota Satisfaction Questionnaire. Journal of Hospitality
and Tourism, 27(1): 85-100.
Hannif, Z., Cox, A. and Almeida, S. (2014). The impact of ICT, workplace relationships and
management styles on the quality of work life: insights from the call centre front line.
Labour and Industry, 24(1): 69-83.
Hanushek, E.A. and Rivkin, S.G. (2004). How to improve the supply of high quality teachers.
In D. Ravitch (Ed.), Brooking papers on education policy, 2004. Washington, D.C.:
Brookings Institution Press.
Haque, M., Karim, A.N.M., Muqtadir, A. and Anam, S. (2012). Dimensions of job
satisfaction of library professionals: A qualitative exploration. International Journal
of Business and Social Research, 2(5): 46-62.
Harrison, D.A. and Liska, Z. (2008). Promoting regular exercise in occupational fitness
programme. Journal of Personnel Psychology, 5(5): 27-45.
Harrison, R.L. (2012). Using mixed methods designs in the journal of business research,
1990-2010. Journal Business Research (2012), doi:10.1016/j.jbusres.2012.01.006.
Hartline, M.D. and Ferrell, O.C. (1996). The management of customer-contact service
employees: An empirical investigation. Journal of Marketing, 60: 52-70.
309
Hebertein, T. and Baumgartner, R. (1978). Factors affecting response rates to mailed
questionnaires: A quantitative analysis of the published literature. American
Sociological Review, 43: 447-462.
Hedt, B.L. and Pagano, M. (2011). Health indicators: Eliminating bias from convenience
sampling estimators. Statistics in Medicine, 30(5): 560-568.
Helpman, E., Itskhoki, O. and Redding, SC. (2010). Inequality and unemployment in a global
economy. Econometrica, 78(4): 1239-1283.
Henderson, R.I. (1989). Compensation management: Rewarding performance, 5th ed., New
Jersey: Prentice-Hall Incorporation.
Henderson, R.I. (2006). Compensation management in a knowledge-based World. 10th ed.,
New Jersey: Pearson Education Incorporation.
Hendry, C., Woodward, S., Bradley, P. and Perkins, S. (2010). Performance and Rewards:
Cleaning out the Stables. Human Resources Management Journal, 10(3): 46 – 62.
Heneman III, H. G., Judge, T.A. and Heneman, R.L. (2000). Staffing organizations. New
York: McGraw Hill Irwin.
Heneman R.L., Ledford, Jr. G.E. and Gresham, M.T. (2000). The changing nature of work
and its effects on compensation design and delivery. In R.L. Rynes & B. Gerhart
(Eds.), Compensation in Organisation. San Francisco: CA: Jossey-Bass Publication.
Heneman, H.G. III, and Judge, T.A. (2000). Compensation attitudes. In Rynes, S.L., and
Gerharts, B. (Eds.), Compensation in organisations: current research and practice (pp.
61-203). San Francisco: Jossey-Bass
Heneman, R.L. (1992). Merit Pay, Addison Wesley Publishing Company.
Heneman, R.L. (2002). Strategic Reward Management: Design, Implementation, and
Evaluation. Greenwich, CT: information Age Publishers.
Herpen, M.V., Praag, M.V. and Cools, A.K. (2005). The effects of performance measurement
and compensation on motivation: an empirical study. De Economist, 153: 303-329.
Herzberg, F. (1966). Work and the nature of man. Clevelland: World.

310
Herzberg, F.; Mausner, B. and Snyderman, B. (1959). The motivation to work. 2nd Ed., New
York: Wiley.
Hewitt, A. (2009). Managing performance with incentive pay. Journal of Personnel
Management, 7(1): 20-31.
Hills, P.S.; Bergmann, T.J. and Scarpello, V.G. (1994). Compensation decision making, 2nd
Ed., New York: The Dryden Press.
Hina, Q., Zamir, S. and Nudrat, S. (2014). Impact of employee benefits on job satisfaction of
teachers at higher level. Journal of Education and Practice, 5(7): 122-129.
Hirst, P.Q. (1975). Durkheim Bernard and Epistemology. London and Boston: Routledge &
Kegan Paul Ltd,103-104.
Hofstede, G. (1980). Culture’s consequences: International differences in work-related
values, Beverly Hills, CA: Sage Publications.
Hofstede, G. (2001). Culture’s consequences: Comparing values, behaviours, institutions and
organisations across nations, 2nd ed., Thousand Oaks, Carlifornia: Sage Publications
Incorporations.
Hogan, R. and Kaiser, R.B. (2005). What we know about leadership. Review of General
Psychology, 9: 169-180.
Hogler, R., Henle, C. and Gross, M. (2013). Ethical behaviour and regional environments:
The effects of culture, values and trust. Employees Responsibilities and Rights
Journal, 25(2): 109-121.
Høgsnes, G. (1989). Wage bargaining and norms of fairness: A theortical framework for
analyzing the Norwegian wage formation. Acta Sociologica, 34(4): 339-357.
Hoinville, G. and Jowell, R. (1978). Survey research practice. London: Heinemann
Educational Books.
Hon, A.H.Y. (2012). When competency-based pay relates to creative performance: The
moderating role of employee psychological need. International Journal of Hospitality
Management, 31: 130-138.
311
Hon, A.H.Y. and Chan, W.W.H. (2013). Team creative performance: the roles of
empowering leadership, creative-related motivation, and task interdependence.
Cornell Hospitality Quarterly, 54(2): 199-210.
Horngren, C.T., Datar, S.M. and Rajan, M.V. (2012). Cost accounting: A managerial
emphasis. 4th ed. England: Pearson Education Limited.
Howell, J.M. and Avolio, B.J. (1993). Transformational leadership, transactional leadership,
locus of control and support for innovation: Key predictors of consolidated-business-
unit performance. Journal of Applied Psychology, 78: 891-902.
Hsieh, Y.H. and Chen, H.M. (2011). Strategic fit among business competitive strategy,
human resource strategy and reward system. Academy of Strategic Management
Journal, 10(2): 11-32.
Hu, H.H., Huang, K.L. Chi, S.C. and Chu, C.M. (2007). Comparison of the monetary reward
decision of Taiwan and U.S. managers: allocation context as a mediator. International
Journal of Information and Management Sciences, 18(4): 437-459.
Huang, C.F. and Lien, H.C. (2012). An empirical analysis of the influences of corporate
social responsibility on organisational performance of Taiwan’s construction industry:
Using corporate image as a mediator. Construction Management and Economics, 30:
263-275.
Huang, J.C. (1997). A study on relationships between technology and basis for pay: The
performance control perspectives. Unpublished Doctoral Dissertation, Nation Taiwan
University, Taipei.
Huizinga, J. (1986). Homo Ludens Ort: Beacon Press.
Hung, S.Y., Lai, H.M. and Chang, W.W. (2011). Knowledge-sharing motivations affecting
R&D employees’ acceptance of electronic knowledge repository. Behaviour and
Informantion Technology, 30(2): 213-230.
Hunter, M. (2012). How motivation really works: Towards an emoto-motivation paradigm.
Economics, Management and Financial Markets, 7(4): 138-196.

312
Hyondong, K. (2006). Strategic impacts of compensation system on organisational outcomes:
an empirical study of the conceptualisations of fit and flexibility in the compensation
design. Unpublished doctoral dissertation, the Graduate School of the Ohio State
University, USA.
Ichnio, A. and Maggi, G. (2000). Work environment and individual background: Explaining
regional shirking differentials in a large Italian firm. Quarterly Journal of Economics,
115, 1057-1090.
Ida, I.I. and Ali, B. (2010). Is job satisfaction mediating the relationship between
compensation structure and organisational commitment? A study in the Malaysian
power utility. Journal of Global Business and Economics, 1(1): 1-19.
Idemobi, E. I., Onyeizugbe, C. U., and Akpunonu, E. O. (2011). Compensation management
as tool for improving organizational performance in the Public Sectors: A study of the
Civil Service of Anambra State of Nigeria. Sacha Journal of Policy and Strategic
Studies Volume 1 Number 1 (2011), pp. 109-120.
Iguisi, O. (2009). The cultural dynamics of management leadership in Africa: Management in
Nigeria, 44(2): 6-13, April-June.
Illes, R., Wilson, K.S. and Wagner, D.T. (2009). The spillover of daily job satisfaction onto
employees’ family lives: The facilitating role of work-family integration. Academy of
Management Journal, 52: 87-102.
Inayatullah, A. and Jehangir, P. (2012). Teacher’s job performance: The role of motivation.
Abasyn Journal of Social Sciences, 5(2): 78-99.
Inspenonline, (2013). Inspenonline.blogspot.com (accessed 2014/04/07)
Institute of Chartered Accountants of Nigeria Study Pack, (2006). Financial Reporting and
Audit Practice, VI Publishing Limited, Lagos. 6-9.
Investopedia, (2014). US, a division of IAC. www.investopedia.com/articles/08/history-of-
insurance.asp. (Accessed 2014/04/07).
Isimoya, O. (2014). Business ethics in insurance industry in Nigeria. International Journal of
Management and Sustainability, 3(6): 341-359.

313
Islam, R. and Ahmed, S. (2014). Do managers and employees perceive motivating factors
differently in Malaysia? International Journal of Business and System Research, 8(1):
72-90.
Ivancevich, J.M. (2004). Human resource management. 9th Ed., New York: McGraw Hill.
Ivancevich, J.M. and Matteson, M.T. (1990). Organisational behaviour and management, 2nd
ed. Boston: Bpi Irwin.
Ivancevich, J.M., Konopaske, R. and Matteson, M.T. (2005). Organisational behaviour and
management, 7th Ed. New York: McGraw-Hill/Irwin.
Iwu, C.G. and Ukpere, W.I. (2012). Revisiting incentives and job satisfaction of Nigerian
bank employees. African Journal of Business Management, 6(46): 11536-11548.
Jacobsen, C.B., Hvitved, J. and Andersen, L.B. (2013). Command and motivation: How the
perception of external interventions relates to intrinsic motivation and public service
motivation. Public Administration, 1-17. DOI:10.1111/padm.12024 (Accessed
2014/04/25).
Jaiswall, M. and Firth, M. (2009). CEO pay, firm performance, and corporate governance in
India’s listed firms. International Journal of Corporate Governance, 1(3): 227-240.
Janke, R. and Jones, M.C. (2007). Essential elements of questionnaire design. Journal of
Clinical Nursing, 16(2): 234-243.
Jaw, Y.L. and Lin, W.T. (2009). Corporate elite characteristics and firm’s
internationalisation: CEO-level and TMT-level roles. The International Journal of
Human Resource Management, 20(1): 220-233.
Jegede, M.I. (2005). ‘‘A comprehensive analysis of the Insurance Act 2003 and its
implications on the insurance business environment’’, issues in merger and
acquisition for the insurance industry. A proceeding of the 2003 NIA workshop om
Insurance Act 2003 (Ed) Ezekiel, O.C., pp 61-78.
Jehanzeb, K., Rasheed, M.F., Rasheed, A. and Aamir, A. (2012). Impact of rewards and
motivation on job satisfaction in banking sector of Saudi Arabia. International
Journal of Business and Social Science, 3(21): 272-278.

314
Jennings, P.L., Perren, L. and Carter, S. (2005). Guest editors’ introduction: Alternative
perspectives on entrepreneurship research. Entrepreneurship Theory and Practice,
29(2): 145-152. http://dx.doi.org/10.1111/j.1540-6520.2005.00073.x (Accessed
2014/05/03).
Jensen, M. and Murphy, K. (1990). Performance pay and top management incentive. Journal
of Political Economy, 98: 225-263.
Jensen, M. C. & Meckling, W. T. (1976). Theory of the Firm: Managerial behaviour, agency
costs and ownership structure. The Journal of Financial Economics, 3:305-306.
Jensen, M.C. (1994). Self-Interest, altruism, incentives and agency theory. Journal of
Applied Corporate Finance, 7(2):1-17.
Jing, F.F., and Avery, G.C. (2008). Missing links in understanding the relationship between
leadership and organisational performance. International business and Economics
Research Journal, 7(5): 67-78.
João, G., Calheiros, M.M. and Barata, M.C. (2013). Authority in the classroom: adolescent
autonomy, autonomy support, and teacher’s legitimacy. European Journal of
Psychology of Education, 28: 1065-1076.
Jobber, D. (1991). Choosing a survey method in management research. In Smith, N.C. and
Dainty, P. (Eds.): The management research handbook, London: Routledge.
Johnson, R.B. and Onwuegbuzie, A.J. (2004). Mixed methods research: A research partadigm
whose time has come. Educational Research, 33(7): 14-26.
Johnson, R.B., Onwuegbuzie, A.J. and Turner, L.A. (2007). Toward a definition of mixed
method research. Journal of Mixed Methods Research, 11(2): 112-133.
Jones, G.R. and George, J.M. (2009). Contemporary management, 6th Ed., New York:
International Ed., McGraw Hill.
Judge, T.A., Thoresen, C.J., Bono, J.E. and Patton, G.K. (2001). The job satisfaction-job
performance relationship: A qualitative and quantitative review. Psychology bull, 127:
376-407.

315
Jung, D. and Sosik, J. (2002). Transformational leadership in work groups: The role of
empowerment cohesiveness, and collective-efficacy on perceived group performance.
Small Group Research, 33: 313-336.
Kagioglou, M., Cooper, R. and Aouad, G. (2001). Performance management in construction:
A conceptual framework. Construction Management and Economics, 19, 85-95.
Kaiser, R.B., Hogan, R. and Craig, S.B. (2008). Leadership and the fate of organisations.
American Psychology, 9: 169-180.
Kanuk, L. and Berenson, C. (1975). Mail surveys and response rates: A literature review,
Journal of Marketing Research, 12(4): 440-453.
Kaplan, R.S. and Norton, D.P. (1992). The balanced scorecard-measures that drive
performance. Harvard Business Review, Jan-Feb, 71-79.
Kaplan, R.S. and Norton, D.P. (1993). Putting the balanced scorecard to work. Harvard
Business Review, Sept-Oct, 134-147.
Kaplan, R.S. and Norton, D.P. (1996a). Using the balanced scorecard as a strategic
management system. Harvard Business Review, Jan-Feb, 75-85.
Kaplan, R.S. and Norton, D.P. (1996b). The balanced scorecard: Translating strategy into
action. Boston, Harvard Business School Press.
Kaplan, R.S. and Norton, D.P. (2007). Using the balanced scorecard as a strategic
management system. Harvard Business Review, July-August: 1-15.
Karami, A., Dolatabadi, H.R. and Rajaeepour, S. (2013). Analysing the effectiveness of
reward management system on employee performance through the mediating role of
employee motivation case study: Isfahan Regional Electric Company. International
Journal of Academic Research in Business and Social Sciences, 3(9): 327-338.
Kashif, S. and Mustafa, K. (2012). The determinants of CEO compensation: Evidence from
family-owned listed corporations in Karachi Stock Exchange. Middle East Journal of
Economics and Finance, 5(1/2): 45-61.

316
Katou, A. A. and Budhwar, P. S. (2006). Human resource management systems and
organizational performance is a test of mediating model in the Greek manufacturing
context. International Journal of Human Resource Management, 17(7): 1223 – 1253.
Kaya, E. (1995). Job satisfaction of the librarians in the developing countries, 61st ifla general
conference proceedings, 1.
Keegan, D., Eiler, R. and Jones, C. (1989). Are your performance measures obsolete?
Management Accounting, 70(12), 45-50.
Kelly, P. (2009). International business and management, London: South-Western,
Cengage Learning, EMEA.
Kendall, N.A.S., Linton, S. J. & Main, C. J. (1997). Guide to Assessing Psychological
Yellow Flags in Acute Low Back Pain: Risk Factors for Long-Term Disability and
Work Loss. Wellington, New Zealand: Accident Rehabilitation and Compensation
Insurance Corporation of New Zealand and the National Health Committee, Ministry
of Health.
Kennerley, M. and Neely, A. (2002). A framework of the factors affecting the evaluation of
performance measurement systems. International Journal of Operations and
Production Management, 22(11), 1222-1245.
Kerrin, M. and Oliver, N. (2002). Collective and individual improvement activities: The role
of reward systems. Personnel Review, 31(3): 320-337.
Kersley, B.A. and Forth, J. (2005). Inside the workplace: First findings from 2004 Workplace
Employment Relations Survey (WERS 2004). London: Economic and Social
Research Council.
Kester, O.K. (2006). A perspective on wage determination and bargaining in Nigeria. Ibadan,
John Archer’s Publishers’ Ltd.
Khan, R.I., Aslam, H.D. and Lodhi, I. (2011). Compensation management: A strategic
conduit towards achieving employee retention and job satisfaction in banking sector
of Pakistan. International Journal of Human Resource Studies, 1(1): 89-97.

317
Khan, M.M. and Jabbar, M. (2013). Determinants of employees performance in corporate
sector: Case of an emerging market. Business and Management Research, 2(3): 25-
32.
Khan, W. and Mufti, O. (2012). Effect of compensation on motivating employees in public
and private banks of Peshawar (BOK and UBL). Journal of Basic and Applied
Scientific Research, 2(5): 4616-4623.
Khandekar, A. and Sharma, A. (2005). Managing human resource capabilities for sustainable
competitive advantage: An empirical analysis from Indian global organisations.
Education + Training, 47(8/9): 628-639.
Khoo, H.S. and St.J. Burch, G. (2008). The ‘dark side’ of leadership personality and
transformational leadership: An exploratory study. Personality and Individual
Differences, 44(1): 86-97.
Kim, D. (2006). Employee motivation: “just ask your employees”. Seoul Journal of Business,
12(1): 19-36, June.
Kim, J.Y., Shim, J.P. and Ahn, K.M. (2011). Social networking service: Motivation, pleasure,
and behaviour intention to use. Journal of Computer Information System, Summer:
92-101.
Kim, S., Mone, M.A. and Kim, S. (2008). Relationships among self-efficacy, pay-for-
performance perceptions, and pay satisfaction: A Korean examination. Human
Performance, 21(2): 158-179.
Kim, W.G. and Brymer, R.A. (2011). The effects of ethical leadership on manager job
satisfaction, commitment, behavioural outcomes, and firm performance. International
Journal of Hospitality Management. (2011), doi:10.1016/j.ijhm.2011.03.008.
(Downloaded 2013:09:23).
Kleingeld, A.D., Tuijl, H.V. and Algera, J.A. (2004). Participation in the design of
performance management systems: A quasi-experimental field study. Journal of
Organisational Behaviour, 25(7): 831-851.
318
Kohlbacher, M. and Gruenwald, S. (2011). Process ownership, process performance
management and firm performance. International Journal of Productivity and
Performance Management, 60(7): 709-720.
Koyuncu, M., Tok, S., Canpolat, A.M. and Catikkas, F. (2010). Body image satisfaction and
dissatisfaction, social physique anxiety, self-esteem, and body fat ratio in female
exercisers and nonexercisers. Social Behaviour and Personality, 38(4): 561-570.
http://dx.doi.org/10.2224/sbp.2010.38.4.561 (Accessed 2014/05/12).
Kreitner, R. and Kinicki, A. (1998). Organizational behaviour, 4th Ed. McGraw
Hill/Irwin.
Kreps, D.M. (1997). Intrinsic motivation and extrinsic incentives. The American Economic
Review, 87(2), 359-364.
Krippendorff, K. (2004). Content analysis: An introduction to its methodology. Thousand
Oaks, California: Sage Publications Incorporation.
Krishna Naik, C.N., Gantasala, S.B. and Prabhakar, G.V. (2010).Service quality (Servqual)
and its effect on customer satisfaction in retailing. European Journal of Social
Sciences, 16(2): 231-243.
Kulich, C., Trojanowski, G., Ryan, M.K., Haslam, S.A. and Renneboog, L.D.R. (2011). Who
gets the carrot and who gets the stick? Evidence of gender disparities in executive
remuneration. Strategic Management Journal, 32: 301-321.
Kulkarni, M. (2011). Revisiting Maslow the “IT” way: a case study. International
Conference on Management (ICM 2011) proceedings, 48-57.
Kuvaas, B. (2006). Work performance, affective commitment, and work motivation: the
roles of pay administration and pay level. Journal of Organisational Behaviour,
27(3): 365-385.
Kuvaas, B. and Dysvik, A. (2009). Perceived investment in employee development, intrinsic
motivation and work performance. Human Resource Management Journal, 19(3):
217-236.

319
Kwak, J. and Lee, E. (2009). An empirical study of fringe benefits and performance of the
Korean firms. International Journal of Business and Management, 4(2): 3-9,
February.
Laerd Statistics. (2014). Pearson product moment correlation.
http://www.statistics.laerd.com/.../pearson-correlation-coefficient-statistic-gui...
(Accessed 2014/05/12).
Lakin, I., Pierce, L. and Gino, F. (2012). The psychological costs of pay for performance:
Implications for the strategic compensation of employees. Strategy Management
Journal, 33(10): 1194-1214.
Lamptey, R.B., Boateng, M.S. and Antwi, I.K. (2013). Motivation and performance of
librarians in public universities in Ghana. Library Philosophy and Practice, 1-25.
http://digtalcommons.unl.edu/libphilprac/911 (Accessed 2014/03/13).
Larkin, I.; Pierce, L. and Gino, F. (2011). The psychological costs of pay-for-performance:
Implications for the strategic compensation of employees. Working Paper No 11-056,
Harvard Business School.
Larson, M.D., Latham, J.R., Appleby, C.A. and Harshman, C.L. (2012). CEO attitudes and
motivations: are they different for high-performing organisations? Quality
Management Journal, 19(4): 55-69.
Latif, K., Shahid, M.N., Sohail, N. and Jamai, S. (2011). Job satisfaction among public and
private college teachers of District Faisalabad, Pakistan: A comparative analysis.
Interdisciplinary Journal of Contemporary Research in Business, 3(8): 235-242.
Lavrakas, P.J. (2008). Encyclopedia of survey research methods, volume 1and 2. Thousand
Oaks, California: Sage Publications Incorporation.
Lawler E.E. (1981) Pay and Organization Development, Massessuat, USA: Addision-Wesley.
Lawler III, E.E. (2003). Reward practices and performance management system
effectiveness. A paper delivered at Centre for Effective Organisations, Marshall
School of Business, University of Southern California, and July 2003: 1-19.

320
Lawler, E.E. (1987). The design of effective reward systems. In Lorsch, J.W. (Ed) Handbook
of Organisational Behaviour, New Jersey: Prentice Hill.
Lawler, E.E., III. (1971). Pay and organizational effectiveness. New York: McGraw-Hill.
Lazear, E.P. (1986). Salaries and piece rates. The Journal of Business, 59(3): 405-431.
Lazear, P. and Oyer, P. (2011). Personnel economics: Hiring and incentives. In Ashenfelter,
O. and Card, D. (Eds.): Handbook of Labour Economics, Vol. 4b, Great Britain,
North Holland, 2011, Pp. 769-1823.
Lee and Chuang (2009). The impact of leadership styles on job stress and turnover intention:
Taiwan insurance industry as an example. [email protected]
Lee, C. and Way, K. (2010). Individual employment charateristics of hotel employees that
play a role in employee satisfaction and work retention. International Journal of
Hospitality Management, 29(3): 344-353.
Lee, C.H. and Bruvold, N.T. (2003). Creating value for employees: Investment in employee
development. International Journal of Human Resource Management, 14(6): 981-
1000.
Lee, M.K.O., Cheung, C.M.K. and Chen, Z. (2005). Acceptance of internet-based learning
medium: The role of extrinsic and intrinsic motivation. Journal of Information and
Management, 42(8): 1095-1104.
Leedy, P.D. and Ormrod, J.E. (2001). Practical research: planning and design, 7th Ed., Merill
Prentice Hall. Upper Saddle River, New Jersey.
Leedy, P.D. and Ormrod, J.E. (2010). Practical research: Planning and design, 9th Ed.,
Boston: Pearson Education International.
Leeuw, E. (2008). Administered questionnaires and standardised interviews. In Alasuutari et
al. (2008) Ed. The Sage Handbook of Social Research Methods, London: Sage
Publications, Chapter 18.
Leong, J. (2008). Academic reference librarians prepare for change: An Australian case
study. Library Management, 29(1/2): 77-86.

321
Lepak, D.P. and Snell, S.A. (2002). Examining the Human Resource Architecture: The
relationships among human capital, employment and human resource configurations.
Journal of Management, 28(4): 517-543.
Leung, K., Zhu, Y. and Ge, C. (2009). Compensation disparity between locals and
expatriates: moderating the effects of perceived injustice in foreign multinationals in
China. Journal of World Business, 44(1): 85-93.
Leuven, E. and Oosterbeek, H. (2008). An alternative approach to estimate the wage returns
to private-sector training. Journal of Applied Economics, 23(4): 423-434.
Lewellen, W. G., Loderer, C. and Martin, K. (1987). Executive Compensation and Executive
Incentive Problems: An Empirical Analysis. Journal of Accounting and Economics,
9(3):287-310.
Lim, S. (2007). Library informational technology workers: their sense of belonging, role, job
autonomy and job satisfaction. The Journal of Academic Leadership, 33(4): 492-500.
Lin, H.F. (2007). Effects of extrinsic and intrinsic motivation on employee knowledge
sharing intentions. Journal of Information Science, 33(2), 135-149.
Lin, Y. (2008). The relationship between the cross-strait cultural differences and employee
satisfaction: Taking a Taiwanese-based company as an example. Unpublished Master
thesis, Graduate Institute of Human Resource Management, Taiwan.
Lincoln, Y.S., Lynharm, S.A. and Guba, E.G. (2011). Paradigmatic controversies,
contradictions, and emerging confluences, revisited. In N.K. Denzin and Y.S. Lincoln:
The Sage handbook of qualitative research, 4th ed. Thousand Oaks: Sage Publications
Incorporation, Chapter 6.
Lindner, J.R. (1998). Understanding employee motivation. Journal of Extension, 36(3):
http://www.joe.org/joe/1998june/index.php (Accessed 2013/09/19).
Lluis, S. (2009). The structure of wages by firm size: A comparison of Canada and the USA.
Labour, 23(2): 51-63.

322
Locke, E.A. and Henne, D. (1986). Work motivation theories: In C.L. Cooper and I.T.
Robertson (Eds.), International Review of Industrial and Organisational Psychology,
Chichester, UK: Willey, 1-35.
Long, R.J. and Shields, J.L. (2009). Do unions affect pay methods of Canadian firms? A
longitudinal study. Industrial Relations, 64(3): 442-465.
Loomis, K. (2008).Reward management, Journal of Industrial Relation, 21:5-12.
Lund Research (2012). Probability sampling. http://dissertation.laerd.com/probability-
sampling.php. Lund Research Limited (Accessed 2014/05/08).
Luthans, F. (1992). Organisational behaviour, 6th Ed. New York: McGraw-Hill, Inc.
Luthans, F. (2011). Organisational behaviour: an evidence based approach. 12th ed.
International edition, New York: McGraw-Hill/Irwin.
Lynch, R. and Cross, K. (1991). Measure up. The essential guide to measuring business
performance, London: Mandarin.
MacKenzie, S., Podsakoff, P. and Rich, G. (2001). Transformational and transactional
leadership and salesperson performance. Journal of the Academy of Marketing
Science, 29(2): 115-134.
MacLean, B.D.A. (2006). Gender, flexibility and opportunity: Best use of human resources in
UK HE libraries. Library Review, 55(7): 403-413.
Madhani, P.M. (2011). Realigning fixed and variable pay: compensation management. SCMS
Journal of Indian Management, 8(1): 5-17.
Mahaney, C.R. and Lederer, A.L. (2006). The effect of intrinsic and extrinsic rewards for
developers on information systems project success. Project Management Journal,
37(4): 42-54.
Mahoney, T. A. (1989). Multiple pay contingencies: Strategy design of compensation.
Human Resource Management, 28(3): 337-347.
Malik, M.E., Naeem, B. and Ahmad, W. (2012). Creative performance of pharmaceutical
saleforce: Role of intrinsic motivation and learning goal orientation. Journal of Basic
and Applied Scientific Research, 2(12): 12633-12640.

323
Malik, M.S., Basit, A.B. and Qazi, A.K. (2011). Unions and management: A case study of
Pakistan Telecommunication Corporation. Pakistan Journal of Social Sciences, 33(1):
185-199.
Malik, N. (2010). A study on motivational factors of the faculty members at University of
Balochistan. Serbian Journal of Management, 5(1): 143-149.
Malik, T.A., Khan, H.U., Shah, A. and Gul, S. (2010). Performance management using
distributed performance knowledge management system: Empirical case study of
Coca Cola Enterprises. International Review of Business Research Papers, 6(1): 250-
282.
Malinski, R.M. (2002). Job rotation in an academic library: Damned if you do, damned if you
don’t. Library Trends, 50(4): 673-680.
Manolopoulos, D. (2008). An evaluation of employee motivation in the extended public
sector in Greece. Employee Relations, 30(1): 63-85.
Manolopoulos, D. (2008). Work motivation in Hellenic extended public sector: An empirical
investigation. The International Journah of Human Resource Management, 19(9):
1738-1762.
Manzoor, Q.A. (2011). Impact of employee’s motivation on organisational effectivieness.
European Journal of Business and Management, 3(3): 36-44.
Marinak, B.A. and Gambrell, L.B. (2008). Intrinsic motivation and rewards: What sustains
young children’s engagement with text? Literacy Research and Instruction, 47(1): 9-
26.
Marjanja, M. and Kiplang’at, J. (2003). Women librarians in Kenya: A study of their status
and occupational characteristics. Library Management, 24(1/2): 70-78.
Martocchio, J.J. (2004). Strategic compensation: A human resource management approach,
3rd ed., Upper Saddle River, New Jersey: Pearson, Prentice Hall.
Martocchio, J.J. (2006). Strategic compensation: A human resource management approach,
4rd ed., Upper Saddle River, New Jersey: Pearson, Prentice Hall.

324
Mas, A. (2008). Labour unrest and the quality of production: Evidence from the construction
equipment resale market. Review of Economic Studies, 75(1): 229-258.
Maslow, A. H. (1943). A theory of human motivation. Psychological Review, 50: 394-395.
Maslow, A. H. (1970). Motivation and personality, New York: Harpers and Row.
Mathauer, I. and Imohoff, I. (2006). Health worker motivation in Africa: The role of non-
financial incentives and human resource management tools. Human Resources for
Health, 4(24). [Downloaded: http://www.human-resource-
health.com/content/2011/11/24].
Mathis, R.L. and Jackson, J.H. (2003). Human resource management, 10th Ed. USA.
Thomson Learning.
Mathis, R.L. and Jackson, J.H. (2011). Human resource management. 13th ed., USA: South-
Western Cengage Learning.
Mattson, M., Torbiöm, I. and Hellgren, J. (2014). Effects of staff bonus systems on safety
behaviours. Human Resource Management Review, 24(1): 17-30.
Mawoli, M.A. and Babandako, A.Y. (2011). An evaluation of staff motivation, dissatisfaction
and job performance in an academic setting. Australian Journal of Business and
Management Research, 1(9): 01-13.
Maxwell, G., Ogden, S. and Mctavish, D. (2006). Career development of female managers in
retailing: Inhibitors and enablers. Journal of Retail and Consumer Services, 13(2):
111-120.
Mayo, E. (1930). The human effect of mechanisation. American Economic Review: Papers
and proceedings 20, 156-176.
McCampbell, A.S. (1996). Promoting productivity of plateaued managers by providing
autonomy. Production and Inventory Management Journal, 37(1): 61-64.
McFarlin, D.B. and Sweeney, P.D. (2003). International management: Strategic
opportunities and cultural challenges, New York: Houghton Mifflin Company.
McGinn, H.F. (2003). An investigation into factors that influence job satisfaction of African
American librarians in some urban public library systems in the United States.
Unpublished PhD Dissertation, Emporia State University.

325
McGrath, G.R. and Macmillan, I.C. (2000). Entrepreneurial mindset: Strategies for
continuously creating opportunity in an age of uncertainty. Harvard Business School
Press Books.
McLeod, D.B. (1994). ‘Research on affect and mathematics learning in the JRME: 1970 to
the present’. Journal for Research in Mathematics Education, 24(6): 637-647.
McMurray, A.J., Pirola-Merlo, A., Sarros, J.C. and Islam, M.M. (2010). Leadership, climate,
psychological capital, commitment, and wellbeing in a non-profit organisation.
Leadership and Organisation Development Journal, 31(5): 436-457.
McNall, L.A., Masuda, A.D. and Nicklin, J.M. (2010). Flexible work arrangements, job
satisfaction, and turnover intentions: The mediating role of work-to-family
enrichment. The Journal of Psychology, 144(1): 61-81.
McNamara, C. (2006). Employee benefits and compensation: basics about employee
motivation: nuts and bolts guide to leadership and supervision in business.
Minneapolis, Minnesota: Authencity Consulting LLC.
McShane, S.L. and Von Glinow, M.A. (2000). Organisational behaviour. Boston, MA:
Irwin/McGraw-Hill.
Mehrabi, A., Shahtalebi, B. and Etebarian, A. (2013). An analysis of the cause and effect
relationships and finding the structural equation model between all aspects of
transformational leadership organisational forgetting and the perception of
productivity. Reef Resources Assessment and Management Technical Paper, RRAMT
2014, 38(5): 336-344.
Merriam, S.B. (1995). Theory to Practice, what can you tell from an N of 1? Issues of validity
and reliability in qualitative research. PAACE Journal of Lifelong Learning, 4: 51-60.
Menezes-Filho, N.A., Muendler, M.A. and Ramey, G. (2008). The structure of worker
compensation in Brazil, with a comparison to France and United States. The Review of
Economics and Statistics, 90(2): 324-346.
Miceli, M.P. and Lane, M.C. (1991). Antecedents of pay satisfaction: A review and
extension. In K. Rowland & J. Ferris (Eds.), Research in Personnel and Human
Resources Management, 9: 235-309. Greenwich, CT: JAI Press.

326
Mikander, C. (2010). The impact of a reward system on employee motivation in Motonet-
Espoo. Unpublished Degree Thesis in International Business.
Milkovich G. T. and Newman J. M. (2005) Compensation 8th Ed., Newtown
McGrawhill/Irwin.
Milkovich, G.T. and Newman, J.M. (1999). Compensation. 6th Ed., New York: McGraw Hill.
Milkovich, G.T. and Newman, J.M. (2001). Compensation approach. Boston: Irwn.
Milkovich, G.T. and Newman, J.M. (2008). Compensation. 9th Ed. Boston, MA:
Irwin/McGraw-Hill.
Milkovich, G.T.; Newman, J.M. and Gerhart, B. (2011). Compensation. 10th International
Ed., New York: McGraw Hill.
Milne, P. (2007). Motivation, incentives and organisational culture. Journal of Knowledge
Management, 11(6): 28-38.
Mitchell, T.R. (1982). Motivation: New direction for theory, research, and practice. Academy
of Management Review, 7(1): 80-88.
Morrell, D.L. (2011). Employee perceptions and the motivation of nonmonetary incentives.
Compensation and Benefits Review, 43(5): 318-323.
Mosadeghard, A.M., Ferlie, E. and Rosenberg, D. (2008). A study of the relationship between
job satisfaction, organisational commitment and turnover intention among hospital
employees. Health Service Management Research, 21(4): 211-217.
Moser, C.A. and Kalton, G. (1979). Survey methods in social investigation, 2nd Ed.,
Aldershot: Gower Publishing Company Limited.
Moser, K. (1997). Commitment in organisations. Psychologies, 41(4): 160-170.
Mottaz, J.C. (1985). The relative importance of intrinsic and extrinsic rewards as
determinants of work satisfaction. The Sociological Quarterly, 26(3): 365-385.
Mowday, R.T., Steers, R.M. and Porter, L.W. (1979). The measurement of organisational
commitment. Journal of Vocational Behaviour, 14(2): 224-247.

327
Mucinsky, P.M.; Kriek, H.J. and Schreuder, A.M.G. (1998). Personnel psychology.
Goodwood: Thomson Publishing Company.
Mujataba, B. and Shuaib, S. (2010). An equitable total rewards approach to pay for
performance management. Journal of Management Policy and Practice, 11(4): 111-
121.
Mullins, J. and Linehan, M. (2006). Desired qualities of public library leaders. Leadership
and Organisational Development Journal, 27(2): 133-143.
Mullins, L.J. (2005). Management and organisational behaviour, 7th ed., Pearson Educational
Ltd, Edinburgh, UK.
Mullins, L.J. (2010). Management and organisational behaviour. 9th Ed. New York. Financial
Times, Prentice Hall, Pearson.
Mumm, J. and Mutlu, B. (2011). Designing motivational agents: the role of praise, social
comparison, and embodiment in computer feedback. Computers in Human Behaviour,
27(5): 1643-1650.
Münstermann, B., Eckhardt, A. and Weitzel, T. (2010). The performance impact of business
process standardisation: An empirical evaluation of the recruitment process. Business
Process Management Journal, 6(1): 29-56.
Muo, I.K. (2013). Motivating and managing knowledge workers: Evidences from diverse
industries and cultures. Journal of Management and Sustainability, 3(2): 119-131.
Murphy, K.J. and Sandino, T. (2010). Executive pay and ‘‘independent’’ compensation
consultants. Journal of Accounting and Economics, 49(3): 247-262.
Musenze, I.A, Thomas, M., Stella, B. and Muhammadi, L. (2013). Reward management and
organisational performance: An empirical study of private universities in Uganda.
International Journal of Innovative Research and Development, 2(8): 90-96.
Nadim, A.G. and Khan, M.A. (2013). The moderating role of employee engagement on the
relationship of determinants of job satisfaction and job satisfaction itself: A study on
the cement industry of Pakistan. Business and Management Review, 2(11): 1-12.

328
Nardi, P.M. (2006). Doing survey research: a guide to quantitative methods. 2nd Ed., Pearson,
New York.
National Bureau of Statistics. (2013). 2013 and estimates for Q1-Q3, 2013: Gross Domestic
Product (GDP) for Nigeria.http://www.nigerianstat.gov.ng
National Health Insurance Scheme Decree. Nigeria Law (1999).
http:/www.nigeria.law.org/National%20Health%20Insurance%20Scheme%20
(Accessed 2014/04/09).
Nawab, S. and Bhalti, K.K. (2011). Influence of employee compensation on organisational
commitment and job satisfaction: A case study of educational sector of Pakistan.
Internationl Journal of Business and Social Science, 2(8): 25-32.
Naylor, J.C., Pritchard, R.D and Ilgen, D.R. (1980). A theory of behaviour in organisations.
New York: Academic Press.
Nazim-ud-Din, M. (2013). HR practices in insurance companies: A case study of Bangladesh.
Abasyn Journal of Social Sciences, 6(2): 77-90.
Nazir, T., Shah, S.F.H. and Zaman, K. (2012). Literature review on total rewards: An
international perspective. Africa Journal of Business Management, 6(8): 3046-3058.
Nelson, B. and Economy, P. (2005). The management bible. New Jersey: John Wiley and
Sons Incorporation.
Neubert, M., Carlson, D.S., Kacmar, K.M., Roberts, J. and Chonko, L.B. (2009). The
virtuous influence of ethical leadership behaviour: Evidence from the field. Journal of
Business Ethics, 90(2): 157-170.
Newman, I. and Hitchcock, J.H. (2011). Underlying agreements between quantitative and
qualitative research: the short and tall of it. Human Resources Development Review,
10: 381-398.
Newman, I. and Hitchcock, J.H. (2012). Underlying agreements between quantitative and
qualitative research: The short and tall of it, (Part 2). Human Resources Development
Review, 12(1): 36-52.

329
Ng, T.W.H., Soresen, K.L. and Yim, F.H.K. (2009). Does the job satisfaction-job
performance vary across cultures? Journal of Cross Cultural Psychology, 1-36.
Nicholls, J. (1988). The transforming autocrat. Management Today, March: 114-118.
NICON Insurance Plc. NICON at 25, 1969-1994. Lagos: NICON Insurance Plc.
Nickels, W.G., McHugh, J.M. and McHugh, S.M. (1999). Understanding business. 5th Ed.
McGraw Hill Irwin, New York.
Nigeria Federal Ministry of Information, www.nigeria.gov.ng/2012-10-29-11-05-46/history
of Nigeria. (accessed 2014/04/03).
Nigeria Insurance Act 2003.
Nigerian Insurance Commission Act 1997.
Nigeria Reinsurance Corporation Plc, (1993). Insurance and development in Nigeria. Lagos:
Nigeria Reinsurance Corporation.
Niyi, O. (2007). Insurance in Nigeria in African Business Special Report, April 2007
ab_nigeria_insurance_0407.pdf. (accessed 2014/03/12
Nimalathasan, B. and Brabete, V. (2010). Job satisfaction and employees’ work performance:
A case study of people’s bank in Jaffna Peninsula, Sri Lanka. Management and
Marketing Journal, 8(1): 43-47.
Nosenzo, D. (2010). The impact of pay compensation on effort behavior. CeDEx Discussion
Paper No. 2010-03, Centre for Decision Research and Experimental Economics at the
University of Nottingham, Nottingham, UK.
Nweke, A. (2009). Three years of visionary leadership in Anambra State, Journal of
Anambra State, Civil Service, 8(1): 7-12.
O’Connor, D. and Yballe, L. (2007). Maslow revisited constructing a road map of human
nature. Journal of Management Education, 31(6): 738-756.
Obasi, N. (2010). Policies, challenges, reforms and Nigerian disposition to insurance
contracts. The Fronteira Post, 1-6.

330
Obisi, C. (1996). Personnel management. Ibadan: Freeman publications.
Obisi, C. (2003). Organisational behaviour: Concepts and applications. Lagos: Malthouse
Press Limited.
Obisi, C., Uche, C.B.N. and Ifekwem, N.E. (2014). Employee compensation management in
Nigerian organisations: Some observations and agenda for research. Swiss Journal of
Management and Business Studies, 1(1): 23-32.
Obiwuru, T.C., Okwu, A.T., Akpa, V.O. and Nwankwere, I.A. (2011). Effects of leadership
style on organisational performance: A survey of selected small-scale enterprises in
Ikosi-Ketu council development area of Lagos state, Nigeria. Australian Journal of
Business and Management Research, 1(7): 100-111.
Odia, J.O. and Okoye, A.E. (2012). Pensions reform in Nigeria: a comparison between the
old and new scheme. Afro Asian Journal of Social Sciences, 3(1): Quarter 1
Odunlade, R.O. (2012). Managing employee compensation and benefits for job satisfaction in
libraries and information centres in Nigeria.
http://digitalcommons.unl.edu?utm_source=digitalcommons.unl.edu%2flibphilprac%
2f714&utmmedium=pdf&utm_campaign=pdfcoverpages/ (Accessed 2013:09:23).
Odusami, K.T., Iyagba, R.R.O. and Omirin, M.M. (2003). The relationship between project
leadership, team composition and construction project performance in Nigeria.
International Journal of Project Management, 21(7): 519-52.
Ogbonna, E. and Harris, L.C. (2000). Leadership style, organisational culture and
performance: Empirical evidence from UK companies. International Journal of
Human Resource Management, 11(4): 766-788.
Ogundele, O.J.K. (2005). Management and organisation: Theory and behaviour. Lagos,
Nigeria: Molofin Nominee Publishers.
Okojie, V. (2009). Reward policy and employee motivation in the National Library of
Nigeria. Samaru Journal of Information Studies, 9(2): 33-45.
Olorunsola, E.O. (2010). Job satisfaction and gender factor of administrative staff in South
West Nigeria Universities. Contemporary Issues in Education Research, 3(10): 51-55.

331
Olubodun, O.F. (1996). An empirical approach to the evaluation of factors in local authority
housing maintenance requirements in the city of Manchester. PhD Unpublished
Thesis. Research Institute, Department of Surveying. University of Salford.
Olusola, O. (2011). Intrinsic motivation, job satisfaction and self-efficacy as predictors of job
performance of industrial workers in Ijebu zone of Ogun State, Nigeria. The Journal
of International Social Research, 4(17): 569-577.
Omolayo, B.O. and Olufemi, A.A. (2012). Influence of workers’ attitude towards time and
work on perceived job performance in private and public sectors. Journal of
Management and Strategy, 3(3), June: 1-9.
Onwumere, J.U.J., Onudugo, V. and Ibe, I.G. (2013). Financial structure and economic
growth: Evidence from Nigeria. Global Journal of Management and Business
Research, 13(5), Version 1.0: 18-26.
Oppenheim, A.N. (1992). Questionnaire design, interviewing and attitude measurement, 2nd
ed., Pinter: London and Washington. 195-200.
Opsahl, R.L. and Dunnette, M.D. (1966). The role of financial compensation in industrial
motivation. Psychological Bulletin, 66(2): 94-118.
Orlando, C.R. and Johnson, N.B. (2001). Strategic human resource management
effectiveness and firm performance. The International Journal of Human Resource
Management, 12: 299-310.
Osterloh, M. (2005). Human resources management and knowledge creation forthcoming: In
Nonaka, I. and Ichijo, K. (Ed.): Handbook of Knowledge Creation, Oxford University
Press.
Osterloh, M. and Frey, B.S. (2000). Motivation, knowledge transfer, and organisation forms.
Organisation Science, 11(5), 538-550.
Osterloh, M., Frey, B.S. and Frost, J. (Jr). (2005). Managing motivation, organisation and
governance. Roundtable, Cognition, Rationality and Governance, 231-239.
Osuagwu, L. (2002). Marketing principles and management. 2nd Ed., Grey Resources
Limited, Lagos.

332
Osuagwu, L. (2006). Business research method. Lagos. Grey Resources Limited.
Oyetola, S.O. (2012). Influence of motivation on turnover of library personnel in some public
universities in South West Nigeria. Library Philosophy and Practice, e-journal.paper
722. URL:http://digtalcommons.unl.edu/libphiprac/722 (assessed: 12/09/2012).
Ӧzdemir, R.S., St Louis, K.O. and Topbas, S. (2011). Public attitudes toward stuttering in
Turkey: Probability versus convenience sampling. Journal of Fluency Disorders,
36(4): 262-267.
Pallant, J. (2011). SPSS survival manual: A step by step guide to data analysis using SPSS
(4th ed.). Australia: Allen and Unwin.
Paque, D. (2005). Innovation-ASCLA style, Interface 27, 1.
Pearce, J. and Robinson, R. (1999). Strategic management. Irwin, USA.
Peberdy, M. and Strowel, A. (2010). Employee’s rights to compensation for inventions: A
European perspective. Cross-Border Life Sciences, 2009/10: 63-70.
http://www.practicallaw.com/lifescienceshandbook. (Accessed 2014/04/16).
Pelosi, M.K., Sandifer, T.M. and Sekaran, U. (2001). Research and evaluation for business,
John Wiley and Sons Inc., USA.
Pennings, J. (1993). Executive reward system: A cross-national comparison. Journal of
Management Studies, 30(2): 261-280.
Perry, C. (1998). Thesis resource paper: A structured approach to presenting thesis.
Peter, J.P. (1981). Construct validity: A review of basic issues and marketing practices.
Journal of Marketing Research, 8(2): 133-145.
Petera, P. (2011). Evaluating the quality of rewards systems. European Financial and
Accounting Journal, 6(3): 66-91.
Peterson, R.S., Smith, D.B., Martorana, P.V. and Owens, P.D. (2003). The impact of chief
executive officer personality on top management team dynamics. Journal of Applied
Psychology, 88: 795-808.

333
Piaralal, N.K., Mat, N., Piaralal, S.K. and Bhatti, M.A. (2014). Human resource management
factors and service recovery performance in Malaysian life insurance industry:
Exploring the moderating effects of employment status. European Journal of Training
and Development, 38(6) in press. (Accessed 2014/06/12).
Pichler, F. and Wallace, C. (2009). What are the reasons for differences in job satisfaction
across Europe? Individual compositional, and institutional explanations. European
Sociological Review, 25(5): 535-549.
Pingle, S. (2014). Reward and recognition practices in public sector: An empirical study at
Steel Authority of India Ltd (SAIL). Journal of Institute of Environment and
Management, 7(1): 10-15.
Pors, O.N. (2003). Job satisfaction among library managers: A cross-cultural study of stress,
freedom and job conditions. New Library World, 104: 464-473.
Pors, O.N. and Johannsen, C.G. (2002). Job satisfaction and motivational strategies among
library directors. New Library World, 103: 199-209.
Porter, L. W. and Lawler III, E. E. (1968). Managerial attitudes and performance.
Homewood: Irwin.
Pounder, J.S. (2008). Transformational leadership: Practicing what we teach in the
management classroom. Journal of Education for Business, 84(1): 2-6.
http://dx.doi.org/10.3200/JOEB.84.1.2-6 (Downloaded 2014/05/16).
Pratheepkanth, P. (2011). Reward system and its impact on employee motivation in
Commercial Bank of Sri Lanka Plc in Jaffna District. Global Journal of Management
and Business Research, 11(4): 84-92.
Prebensen, N.K., Woo, E., Chen, J.S. and Uysal, M. (2012). Motivation and involvement as
antecedent of the perceived value of the destination experience. Journal of Travel
Research, 52(2): 253-264.
Prendergast, C. (1999). The provision of incentives in firms. Journal of Economic Literature,
37(1): 7-63.

334
Prince, K.J. (2003). An empirical examination of the relationships among authenticity, self-
actualisation and nulticultural counseling competency. Unpublished Doctoral
Dissertation, University of Georgia. URL: http://hdl.handle.net/10724/6912.
Proshare (2013). Proshareng.com (Accessed 2014/03/10).
Punch, K.F. (2005). Introduction to social research: Quantitative and qualitative approaches.
2nd Ed., Sage Publications, London.
Purcell, J., Kinnie, N. and Hutchinson, S. (2003). Understanding the people and performance
link: Unlocking the black box. Chartered Institute of Personnel and Development,
London.
Quick, J.C. (1992). Crafting an organisational culture: Herb’s hand at southwest airlines.
Organisational Dynamics, 21(1): 45-56.
Quinlan, C. (2011). Business research methods. UK: South Western Cengage Learning
EMEA.
Qureshi, M. (2013). Relationship between rewards and employee motivation in
Administration Block of Punjab University. International Journal of Innovative and
Applied Finance, 1-13.
Rahim, M.A. and Wan-Daud, W.N. (2012). A proposed conceptual framework for rewards
and motivation among administrators of higher educational providers in Malaysia.
International Journal of Business and Commerce, 1(9): 67-78.
Ramlall, S. (2004). A review of employee motivation theories and their implications for
employee retention within organisations. Journal of American Academy of Business.
Cambridge, 5(1&2): 52-63.
Ramlall, S., Maimani, K.., and Diab, A. (2011). Compensation practices and plan
effectiveness in Saudi Arabia. Compensation and Benefits Review, 43(1): 52-60.
Rashid, U., Wani, N.A. and Kumar, F.A. (2013). Difference in job satisfaction and work
motivation among government and private company employees. International Journal
of Innovative Research and Development, 2(7): 143-148.
335
Rashid, Z.A., Sambasivan, M. and Johari, J. (2003). The influence of corporate culture and
organizational commitment on performance. Journal of Management Development,
22(8): 708-728.
Redling, O. (2008). Effects of merit pay on performance. Journal of Management, 31: 12-19.
Rekker, S.A.Y., Benson, K.L. and Faff, R.W. (2014). Corporate social responsibility and
CEO compensation revisited: Do disaggregation, market stress, gender matters?
Journal of Economics and Business, 92: 84-103.
Rersley, B.A. and Forth, J. (2005). Inside the Workplace: First Findings from the 2004
Workplace Employment Relations Survey (WERS 2004). London: Economic and
Social Research Council.
Research and Market, Nigerian Insurance Report (2009). (Accessed 2014/04/07).
Resurreccion, P.F. (2012). Performance management and compensation as drivers of
organisational competitiveness: The Philippine perspective. International Journal of
Business and Social Science, 3(21): 20-30.
Rice, R.W., Phillips, S.M. and McFarlin, D.B. (1990). Multiple discrepancies and pay
satisfaction. Journal of Applied Psychology, 75: 386-393.
Richard, P.J., Devinney, T.M., George, S.Y. and Johnson, G. (2009). Measuring
organisational performance: Towards methodological best practice. Journal of
Management, 35(3), 718-804.
Riddell, C. (2011). Compensation policy and quit rates: A multilevel approach using
benchmaking data. Industrial Relations: A Journal of Economy and Society, 50(4):
656-677.
Riley, L. (2012). Theories of motivation.
http://www.tutor2u.net/business/gese/people_motivation_theories htm. (Download
22/03/2013). Pp. 1-4.
Robbins, S.P. (2005). Organisational behaviour. International Ed., 11th Ed., Pearson
Education Incorporation, Upper Saddle River, New Jersey, USA.

336
Robbins, S.P. and DeCenzo, D.A. (2008). Fundamentals of management: Essential Concepts
and Applications, 6th ed., Pearson Educational Incorporation, Upper Saddle River,
New Jersey, USA.
Robert, R.L. (2005). The relationship between rewards, recognition and motivation at an
insurance company in the Western Cape. Unpublished Masters Degree Thesis in
Industrial Psychology, University of Western Cape, South Africa.
Robison, D. (1990). Civil Service Pay in Africa, International Labour Office, Geneva.
Roll-Hansen, D. (2010). Performing more than can be expected: motivation in NSIs in Sub
Saharan Africa. Workshop on human resources management and training in statistical
offices, 14-16 September.
Rost, K. and Weibel, A. (2013). CEO pay from social norm perspective: the infringement and
reestablishment of fairness norms. Corporate Governance: An International Review,
21(4): 351-372.
Rousseau, D.M. (1995). Psychological Contracts in Organisation: Understanding Written and
Unwritten Agreements (Thousand Oaks, London and New Delhi: Sage Publications).
Rowe, W.G. (2001). Creating wealth in organisations: The role of strategic leadership.
Academy of Management Executives, 15: 81-94.
Rubin, H.J. and Rubin, I.S. (2010). Qualitative interviewing: The art of hearing data. 3rd ed.
Los Angeles: Sage Publications Incorporation.
Rukmani, K., Ramesh, M. and Jayakrishnan, J. (2010). Effect of leadership styles on
organisational effectiveness. European Journal of Social Sciences, 15(3): 365-370.
Rutherford, B., Boles, J., Hamwi, G.A., Madupalli, R. and Rutherford, L. (2009). The role of
seven dimensions of job satisfaction in salesperson’s attitudes and behaviours.
Journal of Business Research, 62: 1146-1151.
Ryan, A. M., Schmitt, M. J., & Johnson, R. (1996). Attitudes and effectiveness: Examining
relations at an organizational level. Personnel Psychology, 49, 853-882.

337
Rynes, S. and Gerhart, B. (2000). Bringing compensation into I/O psychology (and vice
versa) In R.L. Rynes & B. Gerhart (Eds.), Compensation in Organisations. San
Francisco, CA: Jossey-Bass Publication.
Rynes, S.L. and Bono, J.E. (2002). Psychological research on determinants of pay. In S.L.
Rynes and Gerhart (Eds.), Compensation in organisations: current research and
practice (pp. 3-31). San Francisco, CA: Jossey-Bass.
Saeed, R., Lodhi, R.N. and Iqbal, A. (2013). Factors influencing job satisfaction of
employees in Telecom sector of Pakistan. International Journal of African and Asian
Studies, 3: 124-130.
Şafakli, O.V. and Ertanin, M. (2012). Universality of factors motivating employees in the
banking sector of Northern Cyprus and their demographic reflections. International
Journal of Academic Research in Business and Social Sciences, 2(1): 627-643.
Sahoo, C.K., Dos, S. and Sundaray, B.K. (2011). Strategic human resource management:
Exploring the key drivers. Employment Relations Record, 11(2): 18-32.
Salanova, M., Lorente, L., Chambel, M.J. and Martínez, I.M. (2011). Linking
transformational leadership to nurses’ extral-role performance: The mediating role of
self-efficacy and work engagement. Journal of Advanced Nursing, 67(10): 2256-
2266.
Samuel, M.O., Osinowo, H.O. and Chipunza, C. (2009). The relationship between bank
distress, job satisfaction, perceived stress and physichological wellbeing of employees
and depositors in Nigeria’s banking sector. African Journal of Business Management,
3(11): 624-632.
San, O.T., Theen, Y.M. and Heng, T.B. (2012). The reward strategy and performance
measurement: Evidence from Malaysian insurance companies. International Journal
of Business, Humanities and Technology, 2(1): 211-223.
Sandelowski, M. (2000). Focus on research methods, what happened to qualitative
description? Research in Nursing and Health, 23: 334-340.
Saunders, M.N., Lewis, P. and Thornhill, A. (2012). Research methods for business students,
6th Ed., Pearson Education Limited. England.

338
Scarpello, V. and Carraher, S.M. (2008). Are pay satisfaction and pay fairness the same
construct? A cross-country examination among the self-employed in Latvia,
Germany, the UK, and the USA. Baltic Journal of Management, 3(1): 23-29.
Schafer, J.A. (2010). Effective leaders and leadership in policing: Traits, assessment,
development, and expansion. Policing: An International Journal of Police Strategies
and Management, 33(4): 644-663.
Schermerhorn, J.R., Hunt, J.G. and Osborn, R.N. (2008). Organisational behaviour, 10th Ed.,
John Wiley and Sons Incorporation, USA.
Schjoedt, L. (2009). Entrepreneurial job characteristics: An examination of their effect on
entrepreneurial satisfaction. Entrepreneurship Theory and Practice, 33: 619-644.
Schleicher, D.J., Watt, J.D. and Greguras, G.J. (2004). Reexaming the job satisfaction-
performance relationship: The complexity of attitudes. Journal of Applied
Psychology, 89: 165-177.
Schlett, C. and Ziegler, (2014). Job emotions and job cognitions as determinants of job
satisfaction: The moderating role of individual differences in need for affects. Journal
of Vocational Behaviour, 84(1): 74-89.
Schneider, B. and Bowen, D.E. (1985). Employee and customer perceptions of service in
banks: Replication and extension. Journal of Applied Psychology, 70: 423-433.
Schneider, B., Hanges, P. J., Smith, D. B., & Salvaggio, A. N. (2003). Which comes first:
Employee attitudes or organizational financial and market performance? Journal of
Applied Psychology, 88, 836-851.
Scholtz, H.E. (2009). Share options as part of executive remuneration aligning the interest of
stakeholders. South African Business Review, 13(2): 58-87.
Schwab, D.P. and Wallace, M.J., Jr. (1974). Correlates of employee satisfaction with pay.
Industrial Relations, 13: 78-89.
Schwarzwald, J., Koslowsky, M. and Shalit, B. (1992). A field study of employees’ attitudes
and behaviours after promotion decisions. Journal of Applied Psychology, 77: 511-
514.

339
Scott, C. (1961). Research on mail surveys. Journal of the Royal Statistical Society, 124,
Series A, Part 2, 143-191.
Seiler, S., Lent, B.; Pinkowska, M. and Pinazza, M. (2011). An integrated model of factors
influencing project managers’ motivation-findings from a Swiss survey. International
Journal of Project Management, doi: 10.1016/j.ijproman.2011.03.002.
Sekaran, U. (2003). Research methods for business: A skill building approach. New York:
John Wiley and Sons Incorporation.
Sekaran, U. and Bougle, R. (2009). Research methods for business: a skill building approach.
5th ed. New York: John Wiley and Sons Ltd.
Selden, S.C. and Sowa, J.E. (2004). Testing a multi-dimentional model of organisational
performance: prospects and problems. Journal of Public Administration Research and
Theory, 14(3), 395-416.
Serotkin, S.V. (2010). The relationship between self-actualisation and creativity as a self-
growth practice. Unpublished Doctoral Dissertation, California Institute of Integral
Studies.
Shadare, O.A. and Hameed, T.A. (2009). Influnce of work motivation, leadership
effectiveness and time management on employees’ performance in selected industries
in Ibadan, Oyo State, Nigeria. European Journal of Economics, Finance and
Administrative Sciences, 16: 7-17.
Shafiq, M.M., Mariam, M. and Raza, M.S. (2011). Association between reward and
employee motivation: A case study of banking sector of Pakistan. European Journal of
Humanities and Social Sciences, 5(1): 166-178.
Shah, S.Z.A., Javed, T. and Abbas, M. (2009). Determinants of CEO compensation: An
empirical evidence from Pakistani listed companies. International Research Journal
of Finance and Economics, 32: 148-159.
Shakir, N., Zamir, S. and Zamir, S. (2013). Impact of reward on teacher’s performance at
secondary level. Journal of Education and Practice, 5(4): 107-112.

340
Shaugnessy, T. (2006). Job stress/plateauing/professional isolation/balance. Metronet, 631-
646.
Shaw, J.D. (2014). Pay dispersion. The Annual Review of Organisational Psychology and
Organisational Behaviour, 2014(1): 521-544.
Shieh, C.J. (2008). Effect of corporate compensation design on organisational performance.
Social Behaviour and Personality, 36(6): 827-840.
Shields, M. and Price, S. (2002). Racial harassment, job satisfaction and intentions to quit:
Evidence from British nursing profession. Economics, 69: 295-362.
Shin, T. (2012). The gender gap in executive compensation: The role of female directors and
Chief Executive Officers. The ANNALS of the American Academy of Political and
Social Science, 639: 258-278. DOI: 10.1177/0002716211421119 (Downloaded
2014/04/15)
Sinclair, M.A. (1975). Questionnaire design. Applied Ergonomics, 6(2): 73-80.
Singh, S., Mohamed, A.F. and Darwish, T. (2013). A comparative study of performance
appraisals, incentives and rewards practices in domestic and multinational enterprises
in the country of Brunei Darussalam. The International Journal of Human Resource
Management, 24(1): 3577-3598.
Sijtsma, K. (2009). On the use, the misuse, and the very limited usefulness of Cronbach’s
alpha. Psychometrika, 74(1): 107-120.
Silva, C. (2007). eLeadership- leading Theory and Practice in Education, 5(1): 85-104. It
professionals to drive results. Proceedings of the 24th South East Asia regional
computer conference, November 18-19: 6.1-6.5.
Simms, J. (1997). Beauty queen. Marketing Business, March: 48-51.
Şirin, A.F. (2009). Analysis of relationship between job satisfaction and attitude. Journal of
Theory and Practice in Education, 5(1): 85-104.
Sisson, K. (2010). Employment relations matters. Research Studies and Reports, ILR
collection. http://digitalcommons.ilr.cornell.edu/reports (Accessed 2014/ 04/17).
341
Sloane, P.J. and Williams, H. (2000). Job satisfaction comparison, earnings, and gender.
Labour, 14: 473-502.
Sloof, R. and Mirjam van Praag, C. (2007). Performance measurement, expectancy and
agency theory: An experimental study. IZA, Discussion Paper No. 3064, September,
Pp. 1-30.
Smit, P. J. and Cronje, G. J. (1992). Management Principles-A Contemporary Edition for
Africa, Lansdown: Juta.
Smith, M. (2000). Getting value from exit interviews. Association Management, 54 (4): 22.
Smythe, E.A., Ironside, P.M., Sims, S.L., Swenson, M.M. and Spence, D.G. (2008). Doing
heideggerian hermeneutic research: A discussion paper. International Journal of
Nursing Studies, 45(9): 1389-1397. http://dx.doi.org/10.1016/j.ijnurstu.2007.09.005
(Accessed 2014/05/03).
Snell, S.A. and Dean, J.W. Jr. (1994). Strategic compensation for integrated manufacturing:
The moderating effects of job and organisational inertia. Academy of Management
Journal, 37, 1109-1140.
Solomon, O., Hashim, N.H., Mehdi, Z.B. and Ajagbe, M.A. (2012). Employee motivation
and organizational performance in Multinational Companies: A study of Cadbury
Nigeria Plc. International Journal of Research in Management and Technology, 2 (3):
303-311.
Sonmezer, M.G. and Eryaman, M.Y. (2008). A comparative analysis of job satisfaction level
of public and private school. Journal of Theory and Practice in Education, 4(2): 189-
212.
Spagnoli, P., Caetano, A. and Santos, S.C. (2012). Satisfaction with job aspects: Do patterns
change over time? Journal of Business Research, 65: 609-616.
Spector, P.E. (1997). Job satisfaction: Application, assessment, causes, and consequences.
Thousand Oaks, CA: Sage.
Stajkovic, A.D. and Luthans, F. (2001). Differential effects of incentive motivators on work
performance. Academy of Management Journal, 44(3), 580-590.

342
Steyn, T. (2009). Inviting Schools in the United States of America and Hong Kong: An
appreciation inquiry. Journal of Invitational Theory and Practice; 15: 4-18.
St-Onge, S. (2000). Variables influencing the perceived relationship between performance
and pay in a merit pay environment. Journal of Business and Psychology, 14(3): 459-
479.
Streiner, D.L. (2003). Starting at the beginning: an introduction to coefficient alpha and
internal consistency. Journal of Personality Assessment, 80(1): 99-103.
http://dx.doi.org/10.1207/S15327752JPA8001_18 (Accessed 2014/05/12).
Stringer, C., Didham, J. and Theivananthampillai, P. (2011). Motivation, pay satisfaction, and
job satisfaction of front-line employees. Qualitative Research in Accounting and
Management, 8(2): 161-179.
Subhan, P., Thirupalu, N., Safare, R. and Azash, S. (2012). Job characteristics as predictors
of work motivation and job satisfaction of bank employees. International Journal of
Business and Management Tomorrow, 2(1): 1-7.
Sumerlin, J.R. and Bundrick, C.M. (1998). Revision of the Brief Index of Self-Actualisation.
Perceptual and Motor Skills, 87: 115-125. Summary of key findings from applied
psychology. Available online @ http://www.teammax.net/files/LiteratureReview.pdf
Summers, T.P. and DeNisi, A.S. (1990). In search of Adam’s other: Reexamination of
referents used in evaluation of pay. Human Relations, 43: 497-511.
Susan, W.M., Gakure, R.W., Kiraithe, E.K. and Waititu, A.G. (2012). Influence of
motivation on performance in the public security sector with a focus to the police
force in Nairobi, Kenya. International Journal of Business and Social Science, 3(23):
195-204.
Tabassi, A.A. and Abu Bakar, A.H. (2009). Training, motivation and performance: The case
of human resource management in construction projects in Mashhad, Iran.
International Journal of Project Management, 27(5): 471-480.
Tabiu, A. and Nura, A.A. (2013). Assessing the effects of human resource management
(HRM) practices on employee job performance: A study of Usman Danfodiyo
University, Sokoto. Journal of Business Studies Quarterly, 5(2): 247-259.

343
Tait, M., Padgett, M.Y. and Baldwin, T.T. (1989). Job and life satisfaction: A reevaluation of
the strength of the relationship and gender effects as a function of the date of the
study. Journal of Applied Psychology, 74: 502-507.
Tangen, S. (2004). Performance measurement: from philosophy to practice. International
Journal of Productivity and Performance Management, 53(8), 727-737.
Tay, A. and Bipinchandra, P.A/L. (2013). Compensating human capital in organisations: The
general concerns about paying top executives excessively. Scottish Journal of Arts,
Social Sciences and Scientific Studies, 14(2): 158-174.
Teece, D.J., Pisano, G. and Shuen, A. 1997. Dynamic capabilities and strategic management.
Strategic Management Journal, 18(7): 509-533.
Tella, A., Ayeni, C.O. and Popoola, S.O. (2007). Work motivation, job satisfaction, and
organizational commitment of library personnel in academic and research libraries in
Oyo State, Nigeria. Library Philosophy and Practice, April: 1-16.
Terera, S.R. and Ngriande, H. (2014). The impact of rewards on job satisfaction and
employee retention. Mediterranean Journal of Social Sciences, 5(1): 481-487.
The Nigerian Stock Exchange (2014). Industry sectors. http://www.nse.com.ng. (Accessed
2014/05/04).
Thom-Otuya, V.C. and Tamuno, M.P. (2011). Challenges of leadership and good governance
for sustainable human development in Africa. Proceedings of international conference
on social sciences and humanities, Port Novo, Republic of Benin, 1(4): 7-14.
Thomson, P. and Walker, M. (2010). The routledge doctoral student’s companion: Getting to
grips with research in education and the social sciences. New York: Routledge.
Tichy, N.M. and Devenna, M.A. (1986). The transformational leader. New York: John Wiley
and Sons.
Tillman. J.G., Clemence, A.J. and Stevens, J.L. (2011). Mixed methods research design for
pragmatic psychoanalytic studies. Journal of the American Psychoanalytic
Association, 59(5): 1023-1040.

344
Todaro, J. and Smith, M.L. (2006). Training library staff and volunteers to provide
extraordinary customer service. New York: Neal-Schumen Publishers.
Todorović, M. and Živković, S. (2010). Organisational culture in the function of occupational
healthcare at work. 13th International Conference Dependability and Quality
Management. ICDQM-2010, pp. 155-161.
Topper, F.E. (2007). Stress in the library workplace. New Library World, 108: 561-564.
Torres, E. and Adler, H. (2012). Hotel compensation strategies: Perception of top industry
executives. Journal of Human Resources in Hospitality and Tourism, 11: 52-71.
Traxler, F. (2010). The long-term development of organized business and its implications for
corporatism: a cross-national comparison of membership, activities and governing
capacities of business interest associations, 1980-2003. European Journal of Political
Research, 49: 151-173.
Treiman, D.J. (2009). Quantitative data analysis: Doing social research to test ideas. San
Francisco: John Wiley and Sons, Incorporations.
Tremblay, M. and Chênevert, D. (2008). Influence of compensation strategies in Canadian
technology-intensive firms on organisational and human resources performance.
Group and Organisation Management, 33(3): 269-302.
Tremblay, M., Sire, B. and Balkin, D.B. (2000). The role of organizational justice in pay and
employee benefit satisfaction, and its effects on work attitudes. Group and
Organisation Management, 25: 269-290.
Trivellas, P. (2011). Work motivation and job performance of frontline employees: The
mediating role of organisational commitment. Industrial Engineering and Engineering
Management (IEEM), 2011 IEEM International Conference on 6-9 December, 2011:
1878-1882. DOI 10.1109/IEEM.2011.6118241 (assessed 2014:03:24).
Trivellas, P., Kakkos, N. and Reklitis, P. (2010). Investigating the impact of motivation on
loyalty and performance intentions in the Greek banking sector. A paper presented at
7th International Conference on Enterprise Systems, Accounting and Logistics (7th
ICESAL 2010) 28-29 June 2010, Rhodes, Greece, pp74-88. (assessed 2014:03:24).

345
Tsai, C. (2005). Reward Incentive Compensation and Organizational Performance. Evidence
from semi-conductor industry. Performance and Reward Conference, Manchester
U.K.
Tsai, M.T. and Huang, C.C. (2008). The relationship among ethical climate types, facets of
job satisfaction, and the three components of organisational commitment: a study of
nurses in Taiwan. Journal of Business Ethics, 80: 565-581.
Tuan, T. (1997). Determinants of job satisfaction of Federal Government Employees. Journal
of Public Personnel Management, 26(3): 313-325, Fall.
Ude, U. and Coker, M.A. (2012). Incentive schemes, employee motivation and productivity
in organisations in Nigeria: Analytical linkages. Journal of Business and
Management, 1(4): 32-39.
Udoji, (1975). Udoji Salaries and Wages Commission, Nigeria.
Ujunwa, A. and Modebe, N.J. (2011). Repositioning insurance industry for operational
efficiency: The Nigerian case. Jouranl of Applied Finance and Banking, 1(3): 15-32.
Ukandu, N.E. and Ukpere, W.I. (2011). Strategies to improve the level of employee
motivation in the fast food outlets in Cape Town, South Africa. Africa Journal of
Business Management, 5(28): 11521-11531.
Ukandu, N.E. and Ukpere, W.I. (2014). Factors impacting job satisfaction of employees in
the fast food industry in Cape Town. Mediterranean Journal of Social Sciences, 5(3):
51-60.
Umoh, N. (2011). Innovative governance and workers motivation in Nigeria’s Public Sector.
Journal of Emerging Trends in Economics and Management Sciences, 2(5): 418-425.
Ungson, G. R. and Steers, R. M. (1984). Motivation and politics in executive compensation.
Academy of Management Review, 9(2): 313-323.
Urbanek, P. (2009). CEOs remuneration in corporate governance codes in EU member
countries. Comparative Economic Research, 12(1-2): 61-73.
Usman, O.A. (2009). Scale economics and performance evaluation of insurance market in
Nigeria. The Social Sciences, 4(1): 1-11.

346
Van den Broeck, A., Schreurs, B., De Witte, H., Vansteenkiste, M., Germeys, F. and
Schaufeli, W. (2011). Understanding workaholics’ motivations: A self-determination
perspective. Applied Psychology: An International Review, 60(4): 600-621.
Van der Merwe, S.P. (2009). Determinants of family employee work performance and
compensation in family business. South African Journal of Business Management,
40(1): 51-63.
Van Essen, M., Hen, J. and Carberry, E.J. (2012). Assessing managerial power theory: a
meta-analytic approach to understanding the determinants of CEO compensation.
Journal of Management, Advance Online Publication, doi
10.1177/0149206311429378 (Accessed 24/04/21).
Vrba, M. (2014). Work groups and terms. In Brevis, T. and Vrba, M. (Eds): Contemporary
management principles. South Africa: Juta and Company Ltd.
Vroom, V. H. (1964). Work and motivation. New York: Wiley.
Vukšić, V.B., Bach, M.P. and Popovič, A. (2013). Supporting performance management
wiyh business process management and business intelligence: A case analysis of
integration and orchestration. International Journal of Information Management,
33(4): 613-619.
Walker, C.O., Greene, B.A. and Mansell, R.A. (2006). Identification with academics,
intrinsic/extrinsic motivation, and self-efficacy as predictors of cognitive engagement.
Learning and Individual Differences, 16(1): 1-12.
Walumbwa, F.O. and Ojode, L.A. (2003). Gender stereotype and instructors’ leadership
behaviour: transformational and transactional leadership. Paper presented at the
Midwest Academy of Management Annual Conference, pp 1-21, March 30-April 1 in
Chicago, IL. www.sba.muohio.edu/management/mwAcademy/2000/10c.pdf
(accessed 2013/10/05).
Walumbwa, O.F. (2002). The relationships between leadership styles, cultural orientation,
organisational commitment, job satisfaction and perceptions of organisational
withdrawal behaviours. Urbana-Champaign, Urbana, Illinois: University of Illinois.
Unpublished dissertation.

347
Wang, H., Tsui, A.S. and Xin, K.R. (2011). CEO leadership behaviours, organisational
performance, and employees’ attitudes. The Leadership Quarterly, 22: 92-105.
Weathington, B.L. (2008). Income level and the value of non-wage employee benefits.
Employees Responsibilities Rights Journal, 20(4): 291-300.
Weathington, B.L. and Reddock, C.M. (2011). Equity sensitivity in ‘‘fringe’’ benefit value
and satisfaction. Journal of Behavioural and Applied Management, 13(1): 44-59.
Webb, N.M., Shavelson, R.J. and Haertel, E.H. (2006). Reliability coefficients and
generalizability theory. Handbook of Statistics, 26, 86-124.
Weibel, A., Rost, K. and Osterloh, M. (2010). Pay for performance in the public sector-
benefits and (hidden) costs. Journal of Public Administration Research and Theory,
20(2): 387-412.
Weihrich, H. and Koontz, H. (1993). Management: A global perspective. NY: McGraw-Hill,
Inc.
Weiss, D.J., Davis, R.V., England, G.W. and Lofquist, L.H. (1967). Manual for the
Minnesota Satisfaction Questionnaire. Minnesota: IRC. University of Minnesota.
Weiss, H.M. (2002). Deconstructing job satisfaction: Separating evaluations, beliefs and
affective experiences. Human Resource Management Review, 12: 173-194.
Werner, J.M. and DeSione, R.L. (2009). Human resource development, 5th Ed. International
Student Edition, Mason, USA. South-Western Cengage Learning.
Werner, S. and Ones, D.S. (2000). Determinants of perceived pay inequities: the effects of
comparison, other characteristics and pay-system communication. Journal of Applied
Social Psychology, 30(6): 1281-1309, June.
Werner, S. and Ward, S.G. (2004). Recent compensation research: An eclectic review.
Human Resource Management Review, 14: 201-227.
Williams, M.L., McDaniel, M.A. and Nguyen, N.T. (2006). A meta-analysis of the
antecedents and consequences of pay level satisfaction. Journal of Applied
Psychology, 91(2): 392-413.

348
Willis-Shattuck, M., Bidwell, P., Thomas, S., Wyness, L., Blaauw, D. and Ditlopo, P. (2008).
Motivation and retention of health workers in developing countries: a systemic
review. BMC Health Service Research, 8:247. http://www.biomedcentral.com/1472-
6963/8/247.
Wininger, S.R. and Norman, A.D. (2010). Assessing coverage of Maslow’s theory in
educational psychology textbooks: a content analysis. Teaching Educational
Psychology, 6(1): 33-48.
Wolf, F. (1999). Performance management in the U.K. Journal of Management, 1(11).
WorldatWork, (2007). The WorldatWork Handbook of Compensation, Benefits and Total
Rewards: A comprehensive guide for HR professionals. John Wiley and Sonc,
incorporation, New Jersey.
Wouters, M. (2009). A developmental approach to performance measure- Results from a
longitudinal case study. European Management Journal, 27(1): 64-78.
Xavier, B. (2014). Shaping the future research agenda for compensation and benefits
management: Some thoughts based on stakeholder inquiry. Human Resource
Management Review, 24(2014): 31-40. http://dox.doi.org/10.1016/j.hrmr.2013.08.011
Yamoah, E.E. and Ocansey, E. (2013). Motivational factors of lecturers of private
universities in Ghana. Arabian Journal of Business and Management Review (OMAN
chapter), 3(1): 32-36.
Yang, R.C. (2006). The research of relation among personality, job attitude and job
performance: a case study of Chunghwa telecom mobile business group Taichung
branch office. Unpublished master’s thesis, Chaoyang University.
Yau, F.S., Chun, L.S. and Balaraman, R. (2009). Intellectual capital reporting and corporate
characteristics public listed companies in Malaysia. Journal of Financial Reporting
and Accounting, 7(1): 17-35.
Yayla, A.A. and Hu, Q. (2008). Determinants of CIO compensation structure and its impact
on firm performance. Proceedings of the 41st Hawaii International Conference on
System Sciences 2008. ieeeplore.ieee.org. (Accessed 2014/04/22).

349
Yoshikaw, T., Rasheed, A.A. and Del Brio, E.B. (2010). The impact of firm strategy and
foreign ownership on executive bonus compensation in Japanese firms. Journal of
Business Research, 63(11): 1254-1260.
Yousef, D.A. (2002). Job satisfaction as a mediator of the relationship between role stressors
and organisational commitment: A study from Arabic cultural perspective. Journal of
Managerial Psychology, 15: 250-267.
Yukl, G.A. (2002). Leadership in organisations, New Jersey: Prentice Hall, Upper Saddle.
Yusuf, T.M. (1984). The dynamics of industrial relations: The Nigerian Experience,
University Press Ltd., Ibadan.
Yusuf, T.A., Gbadamosi, A. and Hamadu, D. (2009). Attitudes of Nigerians towards
insurance services: an empirical study. African Journal of Accounting, Finance and
Banking Research, 4(4): 36-46.
Yusuf, T.O. and Babalola, A.R. (2009). Control of insurance fraud in Nigeria: An exploratory
study (case study). Journal of Financial Crime, 16(4): 418-435.
Yusuf, T.O. (2010). Brokers and control of post contractual opportunism in the Nigerian
insurance market. Journal of Financial Crime, 17(2): 223-239.
Zaccaro, S.J. (2001). The nature of executive leadership: A conceptual and empirical analysis
of success. American Psychological Association, Washington, DC. pijps28,4 618.
Zaheer, A., Rehman, K.U. and Khan, M.A. (2010). Development and testing of a business
process orientation model to improve employee and organisational performance.
African Journal of Business Management, 4(2): 149-161.
Zhu, C.M. (1996). The relationship of compensation design and organisational effectiveness
on the context of organisation and task. Unpublished doctoral dissertation, Nation
Taiwan University, Taiwan.
Zhu, W., Chew, Irene K.H., and Spangler, W.D. (2005). CEO transformational leadership
and organisational outcomes: The mediating role of human-capital-enhancing human
resource management. The Leadership Quarterly, 16: 39-52.

350
Žicković, S. (2010). Contemporary concept of quality management in living and working
environment safety. 6th International Conference: Innovation-2010, Illyanovsk State
University, Collection of Scientific Works, pp. 35-39.
Žicković, S. (2013). Management of occupational safety by motivating employees to work
safely. African Journal of Business Management, 7(12): 936-946.

351
APPENDICES
CONTENTS
Letter to the respondents
Questionnaire
Data sheet
Ethical Clearance

352
APPENDIX A LETTER TO THE RESPONDENTS
Adeoye, Abayomi Olarewaju (Mr)
University of KwaZulu-Natal
School of Management, Information Technology and Governance
Department of Management
Westville Campus, Durban
South Africa.
Dear Sir/Madam
I am a PhD student of the above University, school and department, presently carrying out an
academic research in an interesting area of compensation management and organisational
performance. You have been chosen as a respondent to this study because of the position you
occupy within the organisation and because your opinion counts and will have a direct
bearing on the data needed. Your response shall be kept in strict confidence and will be used
purely for the purpose of academic research.
Thank you very much for your co-operation.
Adeoye, Abayomi O. (Mr)
07057115063, +27723849542

353
APPENDIX B
QUESTIONNAIRE
SECTION A: DEMOGRAPHIC DATA
SEX: MALE FEMALE
MARITAL: SINGLE MARRIED DIVORCED
WIDOW SEPARATED
AGE:
20 - 30 YEARS 31 – 40 YEARS
41 - 50 YEARS 50 YEARS AND ABOVE
DEPARTMENT:
ADMINISTRATION FINANCE
CUSTOMER RELATIONS MARKETING
R & D
UNDERWRITING
QUALIFICATION
SCHOOL CERTIFICATE OND/NCE HND/BSc
MBA/MSc PhD PROFESSIONAL
OTHERS
WORKING EXPERIENCE:
BELOW 1YEAR 2-3 YEARS 4-5 YEARS
6-7 YEARS 8-9 YEARS 10 YEARS ABOVE
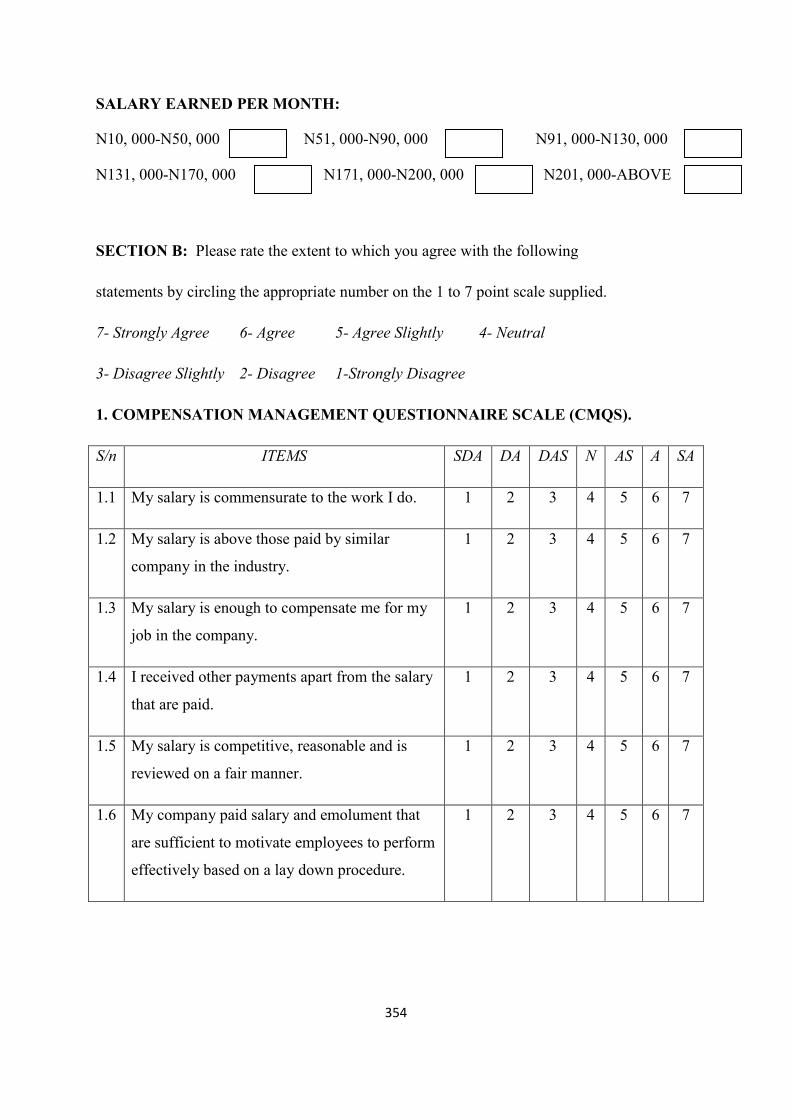
354
SALARY EARNED PER MONTH:
N10, 000-N50, 000 N51, 000-N90, 000 N91, 000-N130, 000
N131, 000-N170, 000 N171, 000-N200, 000 N201, 000-ABOVE
SECTION B: Please rate the extent to which you agree with the following
statements by circling the appropriate number on the 1 to 7 point scale supplied.
7- Strongly Agree 6- Agree 5- Agree Slightly 4- Neutral
3- Disagree Slightly 2- Disagree 1-Strongly Disagree
1. COMPENSATION MANAGEMENT QUESTIONNAIRE SCALE (CMQS).
S/n ITEMS SDA DA DAS N AS A SA
1.1 My salary is commensurate to the work I do. 1 2 3 4 5 6 7
1.2 My salary is above those paid by similar
company in the industry.
1 2 3 4 5 6 7
1.3 My salary is enough to compensate me for my
job in the company.
1 2 3 4 5 6 7
1.4 I received other payments apart from the salary
that are paid.
1 2 3 4 5 6 7
1.5 My salary is competitive, reasonable and is
reviewed on a fair manner.
1 2 3 4 5 6 7
1.6 My company paid salary and emolument that
are sufficient to motivate employees to perform
effectively based on a lay down procedure.
1 2 3 4 5 6 7

355
2. THE SHORT FORM OF THE MINNESOTA JOB SATISFACTION
QUESTIONNAIRE (MSQ).
S/n ITEMS SDA DA DAS N AS A SA
2.1 Being able to keep busy all the time 1 2 3 4 5 6 7
2.2 The opportunities for advancement on this job. 1 2 3 4 5 6 7
2.3 The chances to be responsible to determine and
plan my work.
1 2 3 4 5 6 7
2.4 The policies and practices toward employees of
this company.
1 2 3 4 5 6 7
2.5 My pay and the amount of the duty I carry out. 1 2 3 4 5 6 7
2.6 The security of the job I do for this company. 1 2 3 4 5 6 7
3. MULTIFACTOR LEADERSHIP QUESTIONNAIRE FORM -5X (MLQ)
S/n ITEMS SDA DA DAS N AS A SA
3.1 I make others feel good and happy to be around
me.
1 2 3 4 5 6 7
3.2 I explain with few simple words about what we
should and could do.
1 2 3 4 5 6 7
3.3 I recognised and rewards when others
accomplished their goals/objectives.
1 2 3 4 5 6 7
3.4 I make others to perceive and think about old
problems in new ways.
1 2 3 4 5 6 7
3.5 I pay serious personal attention to others who
seem rejected.
1 2 3 4 5 6 7
3.6 I am okay when agreed upon standards are 1 2 3 4 5 6 7

356
accomplish by others.
4. JOB PERFORMANCE SCALE QUESTIONNAIRE (JPSQ)
S/n ITEMS SDA DA DAS N AS A SA
4.1 My physical working conditions do influence
my overall attitude toward my duty.
1 2 3 4 5 6 7
4.2 When I finish a day work I often feel I have
accomplished something really worthwhile.
1 2 3 4 5 6 7
4.3 The supervision I receive greatly discourages
me from putting in extra effort.
1 2 3 4 5 6 7
4.4 I am completely satisfied with supervision I got
from my immediate boss.
1 2 3 4 5 6 7
4.5 My feelings about my future with the company
have a greater influence on my overall attitude
toward my job.
1 2 3 4 5 6 7
4.6 I feel very uneasy about how secure I am in my
present job.
1 2 3 4 5 6 7
5. THE REVERSED BRIEF: INDEX OF SELF ACTUALISATION SCALE (BRISAS)
S/n ITEMS SDA DA DAS N AS A SA
5.1 I do feel ashamed of any of my emotions at all 1 2 3 4 5 6 7
5.2 I feel I must do what others expect of me. 1 2 3 4 5 6 7
5.3 I believe that people are essentially good and
can be trusted.
1 2 3 4 5 6 7

357
5.4 I avoid attempts to analyse and simplify
complex domains.
1 2 3 4 5 6 7
5.5 I am extremely bothered by fears of being
inadequate.
1 2 3 4 5 6 7
5.6 I can express my feelings even they tend to
result to unfavourable consequences.
1 2 3 4 5 6 7
6. ORGANISATIONAL EFFECTIVENESS ASSESSMENT QUESTIONNAIRE
(OEAQ)
S/n ITEMS SDA DA DAS N AS A SA
6.1 I am clear on the performance objectives and
standards for my function.
1 2 3 4 5 6 7
6.2 I am clear on my decision making authorities. 1 2 3 4 5 6 7
6.3 I have clear understanding of my roles,
responsibilities and accountabilities.
1 2 3 4 5 6 7
6.4 My teams feel empowered and supported to
make decisions.
1 2 3 4 5 6 7
6.5 We follow through on promises and
commitments to next steps.
1 2 3 4 5 6 7
6.6 I am clear on who I need to collaborate with to
be successful in my role.
1 2 3 4 5 6 7

358
7. MOTIVATIONAL QUESTIONNAIRES SCALE (MQS)
S/n ITEMS SDA DA DAS N AS A SA
7.1 My supervisor allowed me to do my own work
on my own and receive recognition from them
as well.
1 2 3 4 5 6 7
7.2 My promotion is enhanced through what I do
on the job or achieved.
1 2 3 4 5 6 7
7.3 The company policy is friendly and flexible in
allowing contribution of new ideas by an
employee.
1 2 3 4 5 6 7
7.4 I do enjoy adequate interpersonal relationship
with my colleagues within the organisation.
1 2 3 4 5 6 7
7.5 Developmental programmes have been used by
the organisation to boost employee’s morale.
1 2 3 4 5 6 7
7.6 I received the same compensation with my
counterparts in similar industry.
1 2 3 4 5 6 7
8. GOVERNMENTAL POLICY QUESTIONNAIRE SCALE (GPQS)
S/n ITEMS SDA DA DAS N AS A SA
8.1 Government policy as regards compensation
takes adequate care of the private sector.
1 2 3 4 5 6 7
8.2 Government policy on compensation have
greatly influence the review of salaries in your
organisation
1 2 3 4 5 6 7
8.3 Government should enforce her policies on 1 2 3 4 5 6 7

359
compensation on your organisation.
8.4 Government policy on remuneration has
contributed to employee’s motivation in your
organisation.
1 2 3 4 5 6 7
8.5 Government policy on remuneration has
achieved comparability between public and
private sectors pay and benefit.
1 2 3 4 5 6 7
THANK YOU.

360
APPENDIX C ANALYSIS DATA SHEET
S
N
S
e
x
M
a
r
i
t
a
l
A
g
e
D
e
p
t
Q
u
a
l
E
x
p
e
r
S
a
l
a
r
y
C
M
_
1
C
M
_
2
C
M
_
3
C
M
_
4
C
M
_
5
C
M
_
6
M
S
J
S
_
1
M
S
J
S
_
2
M
S
J
S
_
3
M
S
J
S
_
4
M
S
J
S
_
5
M
S
J
S
_
6
M
L
Q
_
1
M
L
Q
_
2
M
L
Q
_
3
M
L
Q
_
4
M
L
Q
_
5
M
L
Q
_
6
J
P
S
Q
_
1
J
P
S
Q
_
2
J
P
S
Q
_
3
J
P
S
Q
_
4
J
P
S
Q
_
5
J
P
S
Q
_
6
S
e
l
f
_
A
c
t
_
1
S
e
l
f
_
A
c
t
_
2
S
e
l
f
_
A
c
t
_
3
S
e
l
f
_
A
c
t
_
4
S
e
l
f
_
A
c
t
_
5
S
e
l
f
_
A
c
t
_
6
O
E
A
Q
_
1
O
E
A
Q
_
2
O
E
A
Q
_
3
O
E
A
Q
_
4
O
E
A
Q
_
5
O
E
A
Q
_
6
M
Q
S
_
1
M
Q
S
_
2
M
Q
S
_
3
M
Q
S
_
4
M
Q
S
_
5
M
Q
S
_
6
G
P
Q
S
_
1
G
P
Q
S
_
2
G
P
Q
S
_
3
G
P
Q
S
_
4
G
P
Q
S
_
5
1 2 2 3 5 4 6 6 7 5 6 1 6 5 7 7 7 3 5 5 6 6 6 6 5 6 5 6 3 5 6 6 3 1 1 1 4 7 6 6 6 6 6 6 6 6 5 7 4 5 3 3 1 2 2
2 1 1 1 5 3 2 3 5 5 5 1 1 3 5 5 5 4 5 4 5 5 4 5 4 5 4 5 4 4 4 5 4 2 2 2 5 6 4 4 3 6 4 2 3 3 2 3 3 5 3 1 3 2 2
3 1 2 2 2 3 4 6 6 3 5 1 6 4 5 5 7 4 5 3 6 5 6 6 5 7 5 6 7 2 4 5 3 2 2 4 6 5 5 6 6 5 6 2 2 3 5 4 1 3 2 2 2 3
4 2 2 2 1 3 2 2 2 1 1 1 1 1 5 4 4 3 2 2 7 5 5 5 6 7 3 7 5 5 4 3 3 2 3 1 1 6 6 6 6 6 6 6 6 3 3 7 3 1 3 2 1 1 2
5 1 2 2 5 3 3 3 2 2 4 2 3 2 5 4 6 4 4 2 5 6 5 7 5 5 5 5 4 4 5 6 2 2 1 3 3 5 5 5 5 5 3 5 4 4 2 6 5 1 3 3 2 2 1
6 1 2 4 6 4 6 6 6 3 5 1 4 3 6 4 5 3 5 2 6 6 6 6 6 6 5 5 6 3 7 7 4 3 5 3 6 6 6 6 6 6 6 6 6 5 2 6 3 1 1 1 1 2 1
7 1 2 4 6 4 6 6 3 1 2 1 2 1 6 3 6 1 1 1 5 7 6 5 4 6 7 5 6 1 1 1 7 1 1 1 3 5 5 5 5 3 5 5 6 3 1 7 2 1 3 2 3 3 1
8 1 2 3 5 3 6 6 1 1 1 1 1 1 7 2 5 1 1 1 7 5 5 5 4 6 7 7 6 2 6 7 5 1 3 1 1 6 5 5 6 5 5 6 4 1 1 7 1 1 2 5 4 2 1

361
9 2 1 2 1 7 6 6 5 1 4 1 3 2 7 1 7 4 4 3 5 5 5 6 4 6 5 6 6 6 3 5 2 5 1 1 3 6 6 6 6 6 5 5 6 6 5 4 6 1 1 3 3 3 1
1
0 1 4 2 4 4 4 6 6 2 5 2 5 2 6 7 6 3 6 2 7 6 6 6 6 6 5 6 3 4 5 5 4 3 3 5 7 5 5 6 5 5 6 7 6 3 7 2 1 3 2 4 1 3
1
1 1 2 3 2 3 6 6 7 7 7 1 7 4 7 7 6 4 6 5 6 6 6 7 6 7 5 5 4 4 5 3 2 2 2 2 5 7 6 6 6 6 6 6 6 5 3 7 2 7 2 2 2 2 1
1
2 1 2 2 4 3 6 6 3 1 3 1 1 1 5 4 5 2 2 1 5 6 5 7 7 7 6 5 7 1 5 1 5 1 3 1 6 7 5 6 6 5 5 6 5 3 1 7 2 1 1 1 1 2 1
1
3 2 2 2 1 3 3 2 4 4 5 1 3 2 6 4 6 6 5 5 5 5 5 6 7 6 1 5 2 6 2 4 2 2 5 1 4 7 6 6 6 6 6 7 6 6 4 7 4 3 1 1 3 2 2
1
4 2 1 1 4 3 2 3 5 3 3 6 3 3 5 2 5 2 2 2 5 5 6 6 4 6 2 6 3 5 3 5 2 1 5 2 5 6 5 5 6 6 6 5 6 4 4 6 4 2 3 1 4 1 1
1
5 1 2 3 4 3 3 3 5 5 5 5 4 2 5 4 5 2 2 4 5 5 6 6 6 6 3 6 4 5 2 4 3 3 3 1 1 5 6 6 6 6 6 7 4 2 2 6 2 1 3 2 2 2 3
1
6 2 1 3 2 2 1 5 4 5 3 4 4 5 4 5 4 5 5 5 5 5 6 5 6 5 5 4 5 4 4 3 3 3 3 3 5 5 5 5 5 5 6 4 4 4 6 4 3 4 4 4 4 3
1
7 1 2 2 6 3 2 2 3 1 3 1 2 1 5 4 6 3 3 3 6 6 5 5 7 6 5 5 2 6 3 5 3 3 3 2 2 6 6 6 6 5 5 6 5 3 3 7 3 1 1 1 2 2 1
1
8 1 2 2 1 6 4 6 6 6 6 1 6 3 7 6 6 2 5 5 6 6 5 5 5 7 3 6 1 7 6 5 2 1 3 1 5 7 6 6 6 6 6 6 7 5 4 7 2 5 3 1 5 3 1
1 1 2 2 5 3 3 3 3 3 3 1 3 4 5 5 4 4 3 3 5 5 5 7 5 6 4 5 5 3 4 5 3 1 4 3 3 6 5 5 6 5 5 5 5 4 3 7 3 1 1 1 3 2 1

362
9
2
0 1 2 3 6 3 6 3 3 1 1 1 1 3 7 6 5 6 2 2 5 4 5 6 6 6 4 5 5 3 3 3 2 1 4 2 2 5 5 5 5 4 5 7 5 5 4 5 1 1 3 2 2 1 1
2
1 2 1 1 4 3 2 3 4 4 4 1 4 4 6 7 6 4 4 4 5 5 4 4 4 5 4 5 4 4 5 4 3 1 4 3 4 5 5 5 5 4 5 6 5 4 4 6 4 2 1 2 2 2 1
2
2 2 2 3 1 3 6 2 3 3 3 1 3 1 5 2 5 3 1 1 5 5 5 6 5 6 3 5 4 3 4 3 3 3 4 1 4 6 5 5 6 6 6 6 6 3 3 6 2 1 2 2 2 2 2
2
3 1 2 2 1 7 6 1 5 4 4 3 4 2 5 4 5 4 4 4 5 4 5 5 5 5 5 5 4 5 3 5 3 3 3 5 5 5 5 5 5 5 5 5 5 4 2 5 2 1 6 3 2 2 1
2
4 1 2 2 1 1 4 1 5 5 5 4 5 3 5 5 5 5 5 5 5 5 6 6 5 5 5 5 4 4 5 5 2 2 4 2 4 5 5 6 6 4 5 6 5 5 5 4 3 2 3 3 2 2 3
2
5 1 2 4 1 2 4 1 6 5 5 4 4 4 5 5 3 4 4 4 6 5 5 6 5 5 4 4 4 4 4 5 3 3 3 2 4 5 5 5 6 6 5 5 5 5 5 4 3 1 2 2 2 2 2
2
6 1 2 2 6 3 3 2 3 3 3 3 3 3 5 2 5 2 2 4 5 6 5 6 5 6 4 5 4 4 5 5 2 2 3 2 4 5 5 5 6 5 6 6 5 4 3 7 3 1 3 3 3 2 1
2
7 1 2 2 6 3 3 3 5 4 4 3 2 3 6 4 4 4 4 2 6 5 5 7 5 5 4 6 4 5 4 5 2 4 4 1 4 6 6 6 6 5 6 6 5 4 4 7 2 1 3 4 4 3 3
2
8 1 2 3 1 1 6 1 5 5 5 1 3 1 5 3 5 3 2 4 5 5 5 5 5 5 5 5 5 4 5 5 4 3 3 2 4 2 6 6 6 5 6 6 5 4 4 7 2 1 3 4 4 3 3
2 1 2 2 6 3 6 6 6 5 5 7 5 6 3 6 4 3 4 4 3 3 2 1 4 6 5 6 6 5 4 6 4 3 3 1 1 5 5 6 6 5 5 5 5 4 4 6 4 2 3 2 4 4 2
363
9
3
0 1 2 4 1 7 6 1 6 4 6 1 4 4 6 4 4 4 4 5 6 5 5 6 6 6 5 6 4 5 5 4 3 4 5 3 3 5 5 5 5 4 5 6 4 4 3 5 3 1 5 3 2 2 1
3
1 1 2 3 1 7 6 1 6 4 6 1 4 4 6 4 4 4 4 4 6 5 5 6 6 6 5 6 4 5 5 4 4 5 5 4 4 7 6 6 6 6 5 5 6 6 5 6 4 5 4 4 4 4 4
3
2 1 2 3 1 7 6 2 6 6 6 1 5 2 5 4 4 4 4 4 5 5 5 6 6 6 3 6 5 4 4 5 1 3 3 1 4 6 5 6 6 6 6 6 6 4 4 6 2 2 2 1 3 3 3
3
3 2 1 1 3 2 2 1 3 3 3 3 2 2 6 3 4 2 2 2 6 5 5 6 6 6 3 6 5 3 4 5 1 3 4 2 3 6 6 6 6 6 6 6 5 3 2 6 2 1 3 2 1 1 2
3
4 2 1 1 5 3 2 2 4 3 3 1 4 2 5 5 5 6 5 5 4 5 5 3 3 5 5 5 5 2 4 5 5 5 5 4 4 6 6 5 4 4 6 4 2 3 3 4 3 3
3
5 1 2 2 2 3 3 6 6 4 5 1 4 4 4 5 4 4 4 5 5 5 5 7 5 7 6 7 2 5 4 4 1 1 4 3 2 6 6 6 4 6 7 5 6 5 5 7 4 3 2 2 2 2 1
3
6 1 2 2 5 3 3 2 5 3 4 1 3 3 6 5 3 4 2 2 5 5 5 6 5 7 4 6 2 6 4 4 3 1 3 2 4 5 5 5 5 4 5 5 5 5 5 7 4 2 2 2 2 2 1
3
7 1 2 2 5 3 3 2 1 1 2 1 1 1 6 4 1 1 1 1 6 6 6 7 5 5 7 5 6 2 6 6 3 1 4 2 4 5 5 5 5 4 5 5 4 4 3 7 1 1 1 2 2 3 1
3
8 1 2 2 1 6 4 3 2 2 2 1 2 2 5 5 2 2 2 2 6 6 6 6 6 6 4 6 2 6 3 6 2 1 5 3 4 5 5 5 5 4 5 5 5 4 4 6 2 1 3 3 3 3 2
3 2 1 2 6 3 4 2 2 1 2 1 1 1 6 5 2 2 1 1 5 6 5 6 4 5 3 5 3 6 4 5 3 1 3 2 4 6 6 6 5 5 7 5 5 3 3 6 3 1 2 2 2 2 2

364
9
4
0 1 2 2 6 3 3 2 3 1 2 1 1 2 5 6 3 3 3 3 7 5 5 7 4 5 3 5 5 4 4 6 3 3 3 3 5 5 5 5 5 6 6 5 5 3 2 7 2 1 1 2 2 2 1
4
1 2 2 2 3 3 3 2 4 3 3 1 2 3 6 4 2 3 3 3 5 5 6 6 4 5 2 7 3 5 5 5 2 2 3 1 3 5 5 5 5 5 5 6 5 3 3 6 2 1 1 1 3 2 1
4
2 2 1 2 3 3 2 2 3 2 2 1 3 1 3 6 2 2 2 7 4 5 6 5 7 3 6 3 5 3 6 3 2 3 1 6 6 6 6 6 6 7 7 5 3 6 7 2 1 3 2 3 2 1
4
3 2 1 1 3 3 2 2 4 4 3 3 2 2 2 4 4 4 4 2 5 5 5 7 3 6 3 5 4 4 4 5 3 1 3 2 3 5 5 5 5 5 5 6 5 3 2 7 2 1 3 2 3 2 1
4
4 2 2 2 3 3 3 2 5 3 5 1 2 5 2 3 5 3 2 2 5 5 5 6 4 6 3 5 4 5 3 5 3 2 4 3 4 5 5 5 5 6 5 6 5 2 2 5 2 1 1 1 3 1 2
4
5 1 1 1 5 3 2 2 3 2 3 2 2 2 5 5 3 3 3 3 5 5 6 5 4 5 5 5 4 5 5 5 3 3 3 2 2 6 6 6 6 5 5 5 4 3 3 6 3 2 3 3 4 4 3
4
6 1 2 2 6 3 2 2 3 2 4 1 4 4 6 5 6 3 3 4 7 5 6 6 5 5 5 5 5 2 6 5 6 3 4 2 3 5 6 6 5 5 5 6 5 2 2 6 3 1 3 1 3 3 2
4
7 2 3 2 4 3 3 4 5 3 3 2 4 4 4 4 3 3 4 3 5 5 5 6 6 6 3 6 4 5 4 4 3 3 3 2 3 7 6 6 6 5 5 6 5 6 4 6 4 1
4
8 2 1 2 4 3 2 2 2 2 3 1 3 2 2 2 6 4 2 2 7 7 7 7 5 6 1 7 5 4 5 6 3 4 4 1 6 7 6 6 6 6 6 6 5 5 5 6 3 2 2 2 1 2 2
4 1 2 2 3 3 4 2 3 3 3 3 2 3 3 5 6 2 2 2 6 6 6 7 5 6 3 6 5 4 4 5 3 3 3 1 4 7 7 7 6 7 5 5 7 4 3 2 7 3 1 1 2 1 2

365
9
5
0 1 1 1 1 3 2 2 5 4 3 1 4 3 5 4 4 4 4 4 5 5 5 5 5 6 2 5 4 4 4 5 1 3 3 2 1 5 5 6 6 6 6 6 4 3 5 7 2 1 2 2 2 2 2
5
1 1 2 4 6 2 6 2 2 1 2 4 2 1 1 3 5 3 3 3 5 5 5 5 5 5 4 5 4 4 4 6 3 1 3 1 3 7 5 6 6 5 6 7 4 3 3 6 3 1 2 3 3 3 3
5
2 1 2 3 1 3 6 6 1 1 1 1 1 1 7 5 5 1 1 1 7 7 6 7 7 7 1 7 6 3 1 7 2 1 3 1 1 7 6 6 6 5 6 7 4 2 2 7 2 1 1 1 1 1 1
5
3 1 2 4 1 7 6 4 7 2 7 1 7 4 7 7 4 7 7 1 7 6 7 4 7 7 5 7 7 7 7 7 7 7 1 7 4 1 2 1 2 2 3 5 5 2 2 7 2 1 1 6 3 2 1
5
4 1 1 1 1 3 2 2 3 2 3 4 4 3 6 6 2 3 4 1 7 4 5 6 5 6 3 6 4 5 4 6 2 3 3 1 4 7 5 6 6 6 4 6 7 7 4 6 4 7 3 4 4 4 1
5
5 1 1 2 4 3 3 1 1 1 1 1 1 1 5 4 2 2 1 1 6 5 5 7 5 6 5 5 5 2 3 7 3 1 4 3 2 5 5 5 5 6 5 7 5 4 2 7 3 1 4 3 3 3 1
5
6 1 1 2 2 3 3 3 6 4 6 2 6 4 6 6 6 6 3 5 5 5 5 4 4 5 2 6 4 3 4 6 1 3 3 1 6 7 5 7 6 5 5 7 4 4 4 7 1 1 2 1 1 3 1
5
7 1 2 2 2 4 5 6 6 6 6 1 6 3 3 5 5 4 6 6 6 6 6 6 4 5 3 6 5 4 4 6 1 3 3 1 6 6 7 7 6 6 6 7 6 3 4 7 1 1 3 3 2 3 3
5
8 2 1 1 2 3 2 3 6 5 5 3 4 4 5 4 5 4 4 4 5 5 5 6 6 5 4 6 6 4 4 4 5 3 3 4 1 3 7 5 5 5 5 7 5 2 2 6 3 1 4 4 4 2 1
5 1 1 2 2 3 3 3 6 5 4 1 1 3 4 4 4 4 5 4 5 5 5 5 5 5 4 5 5 3 4 4 3 3 3 2 3 5 5 5 5 6 5 6 5 3 3 6 1 1 2 3 2 2 2

366
5
6
0 1 1 2 6 3 1 2 3 3 2 1 1 1 6 4 2 2 2 5 6 5 6 7 5 6 5 5 2 5 4 5 1 1 3 1 3 6 5 5 6 6 5 6 5 4 6 6 3 1 1 1 1 2 2
6
1 1 2 3 1 1 6 1 5 6 5 2 4 4 5 5 3 4 3 3 5 5 5 6 6 5 5 6 6 6 5 5 1 3 3 2 5 5 5 5 5 5 6 5 5 5 4 4 2 2 3 3 3 2 2
6
2 1 2 3 1 1 6 1 5 5 5 1 4 4 6 5 4 4 4 4 5 6 5 6 6 6 4 5 6 5 4 4 4 4 3 1 4 5 5 5 6 5 4 6 5 5 4 5 2 1 4 3 3 3 2
6
3 1 2 2 1 1 4 1 6 5 5 2 3 4 6 4 5 4 4 4 6 5 5 6 5 5 5 5 5 6 5 4 3 3 5 5 4 5 5 5 6 5 4 5 5 4 3 5 4 2 5 2 3 2 2
6
4 1 2 2 2 3 3 6 6 5 6 1 4 4 7 4 4 5 5 4 5 5 5 6 5 7 4 5 3 5 4 4 3 1 4 3 5 5 5 5 5 5 5 5 5 4 5 7 4 5 3 3 3 3 1
6
5 1 2 2 5 3 2 2 3 1 2 1 2 1 1 3 4 5 3 2 6 6 6 6 5 6 7 3 6 5 7 7 5 3 4 2 6 6 5 5 5 5 6 6 6 3 2 6 1 1 1 1 4 2 1
6
6 2 1 1 2 3 2 2 6 4 5 1 4 4 6 5 4 5 3 3 6 5 6 6 6 5 6 2 6 6 6 5 6 5 3 5 6 6 6 6 6 6 6 6 5 5 4 6 2 1 1 1 4 2 2
6
7 1 2 2 4 3 3 3 4 3 4 5 4 4 3 3 3 4 3 5 3 4 3 3 5 3 4 3 3 4 3 4 2 6 2 2 6 5 6 6 6 5 4 4 5 4 6 5 3 4 4 4 4 4 4
6
8 1 2 3 1 4 6 6 5 2 2 1 1 2 6 5 5 1 2 4 6 6 6 4 6 6 6 2 6 5 5 2 2 5 1 4 5 6 6 6 5 6 6 5 2 2 5 2 2 2 2 4 2 2
6 1 2 3 6 6 6 5 2 3 2 1 3 2 5 3 4 3 3 2 7 6 6 6 7 6 7 7 2 5 6 6 2 1 1 2 2 5 4 6 6 6 5 6 5 2 1 7 5 2 2 1 6 2 7

367
7
6
8 2 2 3 1 3 6 5 6 4 6 1 6 5 6 5 7 6 6 5 7 7 7 7 7 7 6 7 1 7 6 4 6 6 4 2 4 6 6 6 6 5 5 5 3 3 3 6 5 1 2 2 6 2 7
6
9 1 2 3 1 2 6 2 3 2 2 2 2 2 6 6 6 3 1 7 6 6 6 6 6 6 6 6 7 6 6 6 2 7 6 1 6 7 6 6 6 3 6 6 6 6 1 6 1 1 1 1 6 1 6
7
0 1 2 3 1 4 6 6 2 2 1 2 2 2 6 3 4 3 2 2 6 6 7 6 6 6 6 7 5 2 6 5 2 1 2 3 2 5 5 6 6 5 4 6 5 3 2 7 5 1 2 1 7 2 7
7
1 2 1 1 1 3 3 2 2 1 1 2 1 1 6 2 3 4 3 4 7 6 7 6 7 6 7 6 5 7 6 3 6 2 3 7 3 2 1 3 6 6 6 2 2 1 4 5 6 3 7 6 7 4 6
7
2 1 2 2 1 4 4 3 1 1 2 1 2 1 6 4 3 4 3 4 7 6 6 6 6 6 6 7 5 6 6 2 3 1 2 4 5 4 3 6 6 6 4 6 6 2 2 6 3 1 1 2 7 5 6
7
3 2 2 2 4 3 6 6 2 2 1 2 1 2 6 2 4 4 3 5 6 7 6 7 7 7 6 7 6 7 7 2 3 3 1 4 5 6 3 7 6 7 4 7 7 6 5 6 5 1 1 5 6 3 6
7
4 1 1 2 1 3 2 2 1 1 1 1 1 1 7 1 3 1 1 1 7 7 7 7 7 7 3 7 3 3 7 7 3 3 7 5 1 7 7 7 7 1 3 7 1 3 1 7 1 1 1 1 7 1 1
7
5 1 1 2 4 3 5 4 5 2 3 7 5 5 6 6 5 5 5 5 6 6 6 6 4 6 5 6 2 6 5 5 2 2 6 2 2 5 6 6 6 6 6 6 6 6 5 6 5 6 5 5 4 5 2
7
6 1 2 2 1 4 5 4 5 5 4 7 6 6 6 6 6 6 6 5 6 6 6 6 5 6 6 6 2 6 5 5 2 2 6 2 2 6 6 6 6 6 6 6 6 2 5 6 2 1 2 2 4 2 2
7 1 1 3 4 6 6 2 1 1 1 6 1 1 6 5 6 2 2 2 6 6 6 6 6 6 2 6 2 6 2 2

368
7
7
8 2 1 1 2 3 2 3 7 7 7 6 6 5 6 6 6 5 6 6 7 7 5 5 5 5 2 5 4 2 2
7
9 2 3 2 1 3 3 3 5 4 2 1 7 7 6 6 6 7 7 7 6 6 6 6 7 6 6 6 7 7 5 5 3 1 4 4 3 4 3 2 7 5 4 6 7 6 2 6 3 2 3 2 2 3 2
8
0 1 2 3 1 4 6 3 1 1 1 1 2 2 5 3 4 4 3 2 6 7 5 6 5 4 6 6 4 6 6 6 7 7 6 7 1 6 6 3 2 6 4 4 7 7 7 1 7 2 2 2 2 2 2
8
1 2 2 2 6 3 6 3 2 2 2 2 1 2 6 4 3 1 2 2 7 4 6 4 7 6 7 7 7 7 7 7 7 7 6 7 6 7 6 2 6 4 4 7 7 7 1 7 2 2 2 2 2 2 2
8
2 2 2 6 3 6 3 2 2 2 2 1 2 6 3 3 1 2 2 7 4 6 3 7 6 7 7 7 7 7 7 7 6 6 6 5 4 6 6 5 6 5 6 5 7 2 1 6 1 2 2 2 6 2 2
8
3 2 2 3 4 3 3 2 1 2 2 2 1 2 6 2 1 2 2 4 6 7 1 5 5 6 7 2 2 1 5 1 6 6 6 5 4 2 2 6 4 4 7 5 7 2 1 6 2 2 1 2 2 2 2
8
4 2 2 3 4 4 3 2 1 2 2 1 2 6 1 2 1 2 2 4 6 7 1 5 5 6 7 2 2 5 1 1 6 6 6 5 4 6 6 5 6 5 6 5 7 2 1 6 2 2 2 6 2 2 2
8
5 2 2 3 4 4 3 2 1 2 2 2 1 2 6 2 1 2 2 2 4 6 7 1 6 5 6 7 2 2 1 5 1 6 6 6 5 4 6 6 5 6 5 6 5 7 2 1 6 1 2 1 1 6 1
8
6 2 2 3 4 4 3 2 1 2 2 2 1 2 6 2 1 2 2 2 2 4 6 7 1 5 5 6 7 2 2 1 5 1 6 6 6 5 4 6 6 5 6 5 6 5 7 2 1 6 1 2 6 1 1
8 2 2 3 2 4 5 3 1 2 1 1 2 2 6 6 2 4 3 3 7 2 1 2 1 1 6 5 2 5 6 6 2 3 3 4 5 6 6 7 7 2 2 7 7 2 2 6 2 2 1 2 7 6 2

369
7
8
8 1 2 4 3 2 4 1 7 1 6 7 6 2 7 1 2 3 3 5 5 7 6 4 4 4 5 6 6 6 2 6 6 3 6 6 6 6 5 6 7 7 7 7 7 7 7 7 4 6 5 4 7 3 2
8
9 2 3 3 2 3 4 5 6 1 6 6 6 1 7 2 2 3 6 6 7 7 5 4 6 7 6 5 2 5 6 3 6 6 5 6 6 7 7 6 7 7 6 7 7 6 5 6 5 4 2 2 6 3 3
9
0 2 2 4 3 2 3 1 6 1 6 7 6 1 7 1 2 3 5 5 6 6 4 4 6 6 5 6 2 5 6 3 5 6 5 5 5 7 7 6 6 6 6 6 6 6 4 5 6 4 1 2 6 3 2
9
1 1 1 2 6 4 2 2 2 1 2 1 2 1 6 4 2 1 2 1 6 6 7 4 5 6 6 5 6 7 7 7 7 6 2 6 7 6 2 2 6 4 4 6 6 6 2 7 6 1 2 2 1 2 1
9
2 2 1 2 6 3 3 3 2 2 1 2 2 1 7 3 3 1 2 1 7 4 7 7 4 5 7 5 7 6 6 7 6 7 2 7 6 7 2 1 7 5 4 6 7 6 1 7 2 2 2 1 2 1 2
9
3 1 1 2 4 3 2 2 1 1 1 1 1 1 7 4 2 1 1 1 7 4 7 4 7 5 7 5 7 7 7 7 7 7 2 6 7 7 1 1 7 4 4 7 7 7 1 7 1 1 1 1 1 1 1
9
4 2 2 2 4 3 5 6 1 6 5 1 5 3 7 5 3 4 6 3 6 2 1 2 2 1 6 6 2 6 6 6 2 2 3 4 5 6 6 7 7 3 2 6 6 2 3 6 3 2 2 1 6 7 3
9
5 1 1 1 2 1 2 2 1 2 1 2 1 7 6 3 4 2 3 6 3 2 2 1 2 6 6 3 4 5 6 3 2 3 4 5 6 6 7 6 3 2 6 6 3 2 6 2 3 2 2 6 7 2
9
6 1 2 2 1 4 5 5 1 2 2 2 1 1 7 6 3 4 3 3 6 3 2 2 2 1 7
7
6 3 6 7 7 3 3 4 6 5 7 6 6 3 2 6 6 3 3 6 3 2 2 1 6 6 3 3
9 1 1 2 6 6 5 5 7 3 3 2 2 3 7 3 6 3 3 2 6 7 7 5 6 6 6 6 6 7 3 7 6 6 3 2 4 7 6 7 6 7 6 4 6 6 3 2 6 3 3 2 2 6 6

370
7
9
8 2 2 1 3 3 3 2 4 4 4 4 2 1 1 4 2 3 4 3 7 3 3 2 4 5 2 4 2 6 3 3 3 3 6 3 2 4 4 5 6 4 6 2 2 4 4 6 2 4 1 3 6 3 4
9
9 2 1 1 3 3 2 2 5 3 4 3 2 4 3 4 3 4 3 7 2 3 4 4 4 3 4 3 5 3 3 4 6 6 6 2 4 5 5 5 4 5 4 2 4 4 5 4 4 4 3 2 2 4
1
0
0 2 1 1 3 2 1 2 2 1 1 2 2 1 7 6 3 4 3 2 6 3 1 3 2 2 5 6 3 5 5 7 3 2 3 4 5 7 7 6 7 3 3 6 6 3 2 7 2 3 2 1 6 7 3
1
0
1 1 1 2 4 3 4 3 3 2 2 3 2 3 4 6 3 4 3 3 6 3 3 2 2 7 5 3 6 5 5 7 2 3 3 2 3 7 6 6 6 2 3 6 6 3 2 6 2 3 2 2 6 6 3
1
0
2 2 2 2 2 4 5 4 2 1 1 2 3 2 7 6 3 5 2 3 6 2 3 2 2 2 6 5 2 5 5 6 3 2 3 4 5 5 6 7 6 3 2 6 6 3 2 5 2 3 2 3 6 5 3
1
0
3 2 2 2 3 4 6 3 2 2 2 2 2 2 6 4 3 1 2 2 7 4 6 4 7 6 7 7 7 7 7 7 7 7 1 7 7 7 2 2 6 4 4 7 7 7 1 7 2 2 2 2 2 2
1
0
4 2 1 1 6 3 2 2 1 1 1 1 1 1 2 2 2 2 2 4 7 6 1 6 7 5 7 7 6 6 1 7 6 4 6 4 4 7 7 7 7 6 7 6 7 1 1 7 1 1 1 1 7 1 1
371
1
0
5 1 2 2 4 3 3 2 1 2 1 1 2 1 6 1 2 1 1 4 7 6 1 6 7 7 6 2 7 7 4 5 6 7 6 5 6 5 7 7 7 7 7 7 7 1 2 6 2 1 2 2 6 2 2
1
0
6 2 3 3 2 3 3 4 6 2 6 6 6 2 6 2 2 2 5 6 6 7 4 4 6 6 6 6 1 6 5 3 7 7 6 7 6 5 6 6 7 6 7 6 7 6 6 4 7 6 4 3 2 7 2
1
0
7 1 2 2 6 3 2 3 2 1 2 1 1 6 1 1 2 1 1 4 7 7 1 6 6 6 6 1 1 2 4 1 7 6 6 4 4 6 5 5 6 5 6 5 6 1 2 7 2 1 1 1 7 1 1
1
0
8 2 2 2 6 4 3 3 1 2 1 1 2 1 6 1 2 1 1 4 7 6 1 6 7 7 6 2 6 6 5 5 7 6 6 6 4 6 7 6 7 6 7 6 7 2 2 7 1 2 1 1 7 1 1
1
0
9 1 1 2 6 3 6 3 1 1 1 2 1 2 6 4 3 2 1 1 6 4 7 4 6 7 6 7 6 7 6 7 6 6 2 6 6 6 2 1 4 4 7 6 7 1 7 2 2 2 1 2 1 2
1
1
0 1 1 1 6 3 2 2 1 1 1 1 1 1 2 2 2 2 2 4 7 6 1 6 7 5 7 7 6 6 1 7 6 4 6 4 4 7 7 7 7 6 7 6 7 1 1 7 1 1 1 1 7 1 1
1
1 2 2 1 1 3 3 2 5 3 5 3 3 5 6 6 6 5 5 3 5 5 7 4 7 6 7 7 2 5 7 4 5 6 3 2 5 4 6 6 7 6 6 5 2 5 5 6 5 2 2 5 5 2

372
1
1
1
2 1 1 1 6 3 2 1 7 5 7 7 4 7 6 4 6 6 4 6 6 7 7 5 7 7 6 1 7 5 4 6 6 5 5 1 3 1 7 6 7 7 6 7 7 7 4 6 6 3 2 2 6 7 6
1
1
3 1 1 1 5 3 2 1 1 1 1 1 1 1 5 5 5 4 3 3 6 6 7 6 5 7 3 7 7 7 1 1 5 3 6 1 2 5 7 6 7 5 6 7 3 7 4 6 5 2 2 2 6 2 2
1
1
4 1 2 3 2 4 6 2 2 2 2 2 2 2 5 3 5 3 3 3 6 6 6 6 6 6 6 5 3 5 5 4 4 5 5 3 1 1 7 7 7 5 7 7 6 5 5 7 5 5 5 4 4 3 3
1
1
5 2 1 1 3 3 3 3 7 6 5 6 6 6 6 7 7 5 6 5 6 6 4 7 7 7 7 1 7 5 3 3 3 6 3 5 3 7 7 7 7 7 7 6 6 6 6 6 6 5 5 5 5 5 5
1
1
6 2 2 3 4 4 6 4 3 3 5 5 5 5 6 6 6 6 6 6 5 6 6 6 6 6 6 6 1 7 6 1 4 4 6 1 1 6 7 7 7 6 6 7 6 7 6 6 6 5 5 5 6 5 5
1
1
7 1 1 1 1 2 2 2 1 2 2 1 2 1 5 6 3 4 3 2 6 7 5 6 5 6 6 3 6 7 6 3 2 4 5 5 5 5 6 5 3 5 5 2 1 6 1 2 2 1 6 6 3
1 2 1 1 3 3 3 2 2 1 2 1 2 1 5 6 3 4 3 2 6 6 7 7 5 7 5 6 7 2 6 7 6 2 2 4 5 5 6 5 6 5 2 3 6 7 2 1 1 2 1 2 1 7 2

373
1
8
1
1
9 1 2 2 4 4 5 3 2 1 3 2 3 2 7 6 4 4 3 3 6 7 6 5 7 6 6 7 3 7 6 6 2 2 4 4 6 6 7 7 7 2 3 5 5 2 2 6 2 1 1 3 5 6 2
1
2
0 1 2 2 3 4 6 6 2 2 2 1 2 1 6 5 3 4 3 2 7 6 7 5 6 5 7 7 2 7 6 6 2 2 4 4 5 5 6 6 6 3 3 6 6 1 1 7 1 1 1 2 6 6 2
1
2
1 2 1 1 4 3 3 5 6 6 4 1 6 6 4 4 4 3 2 6 4 3 6 4 4 3 6 4 5 4 5 4 3 6 6 4 4 5 4 4 4 4 4 5 5 4 4 5 4 6 4 4 4 4 4
1
2
2 1 2 2 2 4 6 4 6 5 4 5 6 5 4 6 5 4 4 4 6 6 6 5 4 6 4 4 4 4 4 5 4 4 4 3 5 5 5 6 5 5 5 6 6 6 5 5 5 6 5 4 4 4 4
1
2
3 1 1 1 3 3 4 3 7 6 6 5 6 5 6 5 6 6 6 5 5 6 6 6 6 5 4 4 3 3 5 5 3 4 4 4 3 6 6 6 6 6 5 5 5 4 4 3 4 4 4 4 5 4
1
2
4 2 2 2 5 4 3 3 4 4 4 5 4 4 5 4 4 4 3 4 6 5 5 4 5 5 5 4 4 4 4 5 5 6 5 5 4 6 7 4 5 5 5 5 6 4 5 5 4 5 5 4 3 7 4

374
1
2
5 2 1 1 1 2 3 1 1 6 6 5 1 4 4 6 4 5 4 3 6 6 7 4 7 6 5 6 4 7 3 4 6 7 4 3 4 4 6 4 7 5 5 5 4 5 4 2 4 4 3 2 7 1 2
1
2
6 1 2 2 2 3 4 2 4 5 4 4 4 5 5 5 4 3 4 4 7 5 5 5 4 4 4 6 7 4 4 4 4 7 4 4 4 7 5 5 7 5 7 7 4 4 4 5 5 1 2 2 7 1 4
1
2
7 2 2 3 4 4 4 2 4 4 4 3 4 4 5 3 4 4 3 3 7 6 5 4 5 4 4 4 5 4 4 4 4 4 6 5 5 5 7 7 6 6 5 5 6 4 4 4 5 4 4 1 2 3 4
1
2
8 2 1 1 3 2 3 2 4 4 4 3 3 4 4 4 7 4 6 5 7 5 4 4 4 4 4 6 5 5 5 4 4 4 4 4 3 6 7 4 4 6 5 5 6 4 4 4 4 4 2 4 3 6 6
1
2
9 2 1 1 1 3 4 4 2 1 3 2 1 2 5 6 2 4 3 2 2 1 2 1 2 1 1 2 2 6 5 4 5 2 2 5 4 5 5 6 6 6 3 3 6 7 1 2 2 1 6 6 2
1
3
0 1 1 2 6 6 5 5 7 3 3 2 2 3 7 3 6 3 3 2 6 7 7 5 6 6 6 6 6 7 3 7 6 6 3 2 4 7 6 7 6 7 6 4 6 6 3 2 6 3 3 2 2 6 6
1
3 1 1 1 2 2 1 1 5 4 5 3 4 4 2 5 4 4 4 4 4 4 2 2 4 2 3 4 5 3 3 3 3 4 3 3 4 3 5 1 4 3 2 5 4 6 4 4 4 4 1 1 1 1

375
1
1
3
2 2 2 2 1 3 3 2 3 2 3 2 4 4 4 3 4 4 4 3 5 3 3 4 3 3 4 3 5 3 5 5 3 3 6 4 3 3 5 3 5 2 3 3 2 4 4 5 5 4 2 2 1 3
1
3
3 2 4 3 4 2 6 2 4 4 4 5 4 5 5 6 4 6 6 6 6 6 5 6 5 5 5 5 4 4 4 4 4 4 4 4 5 5 6 5 5 5 5 6 4 4 5 6 6 5 6 5 4
1
3
4 1 2 3 6 4 5 5 6 6 5 4 5 6 6 6 6 6 5 5 6 6 6 6 6 6 6 6 4 6 6 5 5 5 5 3 3 3 6 6 6 6 6 6 6 6 5 6 6 5 4 4 4 4 5
1
3
5 1 1 1 1 1 1 1 2 1 3 1 2 3 6 3 3 2 2 2 6 4 4 5 6 5 6 6 5 5 4 4 4 5 4 4 4 5 6 4 5 4 4 4 5 4 4 4 4 4 4 4 4 4 4
1
3
6 1 2 2 1 3 4 3 3 3 2 1 6 7 7 6 5 4 3 4 7 6 6 6 7 7 4 6 6 4 6 3 5 5 6 7 6 6 5 6 6 7 6 2 6 6 6 6 3 5 2 2 2 2 6
1
3
7 1 3 2 2 4 5 4 7 7 6 6 7 7 7 7 5 7 7 7 7 7 5 4 4 6 7 7 7 4 7 4 7 4 4 5 5 2 1 7 7 7 4 7 7 7 7 7 6 4 5 4 3 3 3
1 2 2 1 4 2 3 1 6 4 5 5 5 7 7 6 7 4 7 7 7 5 5 5 2 7 7 7 4 7 7 7 7 7 7 5 5 7 5 7 4 5 2 1

376
3
8
1
3
9 2 4 4 2 4 6 5 7 4 1 4 7 1 7 7 7 5 5 7 7 7 6 4 4 7 7 7 6 5 1 5 1 4 1 1 7 4 7 7 7 5 7 6 7 7 4 5 1 6 6 4 2 1
1
4
0 2 1 2 3 4 4 4 4 4 5 6 4 5 7 7 6 7 7 7 7 7 5 6 2 2 1 7 6 6 1 5 2 1 4 7 7 7 7 4 4 7 7 7 6 4 4 7 5 4 7 4 4 2 7
1
4
1 2 2 2 2 4 3 2 7 5 5 4 7 5 4 7 7 7 4 7 7 7 6 7 7 4 4 5 4 4 7 5 2 2 4 7 2 4 6 6 7 5 4 7 4 7 5 5 6 6 4 4 5 1 1
1
4
2 1 1 1 4 2 2 1 2 4 5 1 2 5 7 7 6 7 1 7 7 7 7 6 7 7 7 5 1 7 7 1 1 1 1 1 1 1 7 7 7 5 6 7 7 7 6 6 5 1 5 1 2 2 6
1
4
3 1 3 3 3 3 6 2 7 7 7 6 6 7 7 3 3 4 5 6 7 7 6 7 6 7 7 6 5 4 3 7 6 6 7 2 4 7 4 5 1 1 1
1
4
4 2 5 3 6 3 4 2 7 7 1 7 6 7 7 7 6 6 7 7 6 4 4 4 4 5 4 2 1 6 7 1 7 1 1 2 3 4 7 7 6 4 5 7 1 4 5 4 4 1 7 7 4 5 4

377
1
4
5 1 1 1 2 2 2 1 5 3 4 3 5 3 4 5 5 5 5 5 5 5 4 4 4 4 4 4 4 4 4 4 4 5 5 5 4 4 5 5 5 4 5 5 6 5 5 5 5 4 4 4 4 4 4
1
4
6 2 2 2 1 3 5 2 4 2 3 1 2 3 4 4 4 4 5 5 5 4 4 4 5 6 6 2 4 4 3 4 4 4 4 4 4 5 5 5 5 5 4 5 6 5 6 4 4 7 4 4 4 4 4
1
4
7 2 2 2 4 3 3 3 5 4 4 3 4 5 4 6 6 6 6 5 4 6 6 6 6 6 6 6 6 3 6 6 3 4 6 4 5 5 6 6 6 6 5 6 6 4 5 4 6 5 4 5 4 3 3
1
4
8 1 2 3 1 4 6 5 5 5 6 6 6 5 6 6 6 5 6 5 6 6 1 5 5 3 4 5 5 3 3 3 6 6 6 6 5 5 5 5 5 6 6 5 6 6 6 6 6
1
4
9 2 4 3 1 3 5 3 5 4 4 5 5 5 5 6 6 5 4 6 6 5 5 5 5 5 6 6 2 5 6 3 2 3 4 2 2 4 5 5 5 5 5 5 5 6 5 5 5 4 4 4 2 3 3
1
5
0 2 2 1 3 2 2 1 4 3 4 3 3 4 4 5 4 4 5 5 5 5 5 5 5 5 5 4 3 5 6 6 4 5 4 3 3 4 4 4 4 4 4 4 5 4 4 5 5 4 3 1 4 3 4
1
5 2 2 1 6 4 3 3 7 4 2 1 4 5 7 7 7 7 2 7 7 7 7 6 6 7 4 6 1 7 6 1 1 1 1 1 1 7 7 7 7 6 7 7 6 6 7 7 7 4 1 6 7 4 7

378
1
1
5
2 2 1 1 1 3 4 2 4 4 5 5 6 6 4 7 7 6 6 7 7 4 2 7 5 5 2 5 7 7 4 2 6 6 7 7 4 4 5 6 7 6 7 7 5 4 7 7 3 5 5 4 4 5 7
1
5
3 2 2 6 6 6 6 6 2 2 1 2 3 7 3 6 4 2 2 6 6 7 6 6 7 7 6 6 2 7 7 7 3 2 4 7 7 7 7 6 7 5 6 6 3 3 6 2 3 2 1 6 1 7
1
5
4 2 2 2 6 3 5 4 6 2 3 2 3 3 7 2 5 3 3 2 7 7 7 5 7 6 6 6 6 2 6 7 6 3 1 4 6 7 6 7 6 6 4 7 7 2 3 7 3 2 2 1 6 2 7
1
5
5 1 2 6 4 6 6 6 7 2 2 1 2 3 7 3 6 4 2 3 6 6 7 6 6 7 7 6 6 2 7 6 7 3 2 6 7 7 7 7 6 6 5 6 7 2 3 7 2 3 2 1 6 1 7
1
5
6 1 2 3 5 3 4 4 2 1 2 1 2 1 5 6 3 4 3 2 6 7 6 7 6 6 6 7 3 6 7 6 2 2 5 4 5 6 6 5 6 3 3 5 6 1 2 6 2 2 1 2 6 5 2
1
5
7 2 1 1 2 2 2 1 2 3 2 2 3 2 2 6 6 5 2 4 6 5 5 6 6 6 6 6 4 6 6 4 6 5 2 6 5 6 6 5 6 3 6 6 6 6 5 6 6 6 1 1 5 2 6
1 2 3 2 4 3 3 4 6 5 5 2 5 5 6 6 6 6 5 4 7 7 6 6 6 6 6 6 3 6 6 5 6 5 3 5 6 6 6 6 6 6 6 6 6 6 5 7 7 5 4 4 4 4 4

379
5
8
2
1
5
9 1 2 3 4 4 4 4 3 5 3 3 2 5 4 5 5 4 3 4 6 6 5 6 7 7 6 6 3 6 6 5 5 3 3 6 5 6 6 6 6 6 6 6 6 6 5 6 5 5 3 3 3 3 6
1
6
0 1 1 1 2 3 3 2 6 6 6 4 4 6 6 6 4 4 6 4 6 6 6 4 6 6 4 4 4 2 6 4 4 4 4 4 6 6 4 4 5 6 6 6 6 6 6 4 4 6 6 4 4 4
1
6
1 1 1 1 3 1 1 1 2 2 2 6 4 6 6 6 6 6 5 5 6 6 7 6 5 6 6 6 1 6 6 4 4 2 4 2 4 6 6 6 6 6 6 6 6 6 6 6 4 4 4 4 4 4 4
1
6
2 1 2 2 2 4 3 4 4 6 6 6 4 6 6 6 4 4 4 6 6 6 6 6 6 4 4 4 6 6 6 4 2 2 2 2 6 4 4 6 6 4 6 6 6 6 6 7 6 4 4 4 6 4
1
6
3 2 1 1 1 2 2 1 4 4 6 6 6 4 6 4 4 6 4 4 6 6 4 4 6 6 4 4 4 6 6 4 4 1 1 2 4 4 6 6 6 4 6 6 6 6 6 6 6 6 4 6 6 6
1
6
4 1 2 2 3 3 4 2 4 2 3 1 1 2 4 4 2 3 5 2 2 5 4 6 6 5 6 5 6 6 6 6 6 4 4 5 6 6 4 4 6 4 4 4 6 3 2 3 2 5 3 2 2

380
1
6
5 1 2 3 6 4 5 5 2 2 2 2 2 2 4 4 4 4 4 4 4 4 4 4 4 4 4 4 4 4 4 4 4 4 4 4 4 4 4 4 4 4 4 4 4 4 4 4 4 4 4 4 4 4 4
1
6
6 1 2 2 6 4 4 4 3 2 2 1 3 5 5 5 6 4 3 4 7 3 6 6 6 7 3 6 2 5 6 3 3 6 5 2 4 2 2 5 3 1 3 1 4 4 4 4 4 4 4 4 4 4 4
1
6
7 1 2 2 2 4 5 4 2 2 1 1 2 1 7 5 6 4 2 3 6 7 7 7 7 6 7 7 6 2 6 5 2 2
2
1 4 3 7 6 7 6 7 4 7 6 1 1 7 2 1 1 2 6 2 6
1
6
8 2 2 1 3 3 3 2 2 2 1 4 2 7 6 7 6 7 4 6 7 6 6 6 6 7 7 7 6 2 7 5 2 2 1 4 3 7 6 6 7 6 4 7 6 2 3 6 2 2 2 2 7 3 6
1
6
9 1 1 1 3 2 3 2 2 1 1 1 3 1 7 5 6 5 2 3 7 6 7 6 7 6 7 7 5 3 6 5 2 1 2 4 3 7 5 7 6 7 4 6 6 2 3 7 2 2 2 1 6 2 7
1
7
0 2 2 2 1 4 6 5 2 1 1 2 3 2 6 5 5 4 3 3 7 6 7 6 7 6 7 6 5 3 6 5 3 1 2 4 3 6 5 6 6 7 4 6 5 2 2 7 6 1 1 2 6 2 6
1
7 1 2 1 3 3 3 2 1 2 2 1 3 2 7 6 5 4 2 3 6 7 6 6 7 7 6 7 6 2 7 5 3 2 2 4 3 7 5 6 7 6 6 4 6 6 3 2 6 3 2 2 7 2 7
381
1
1
7
2 1 2 3 6 3 3 3 2 4 4 5 4 4 7 7 6 4 5 4 6 6 5 6 5 7 7 6 5 6 6 7 7 6 6 6 7 5 2 3 3 4 4 4 5 7 7 6 7
1
7
3 2 1 2 4 4 4 4 7 6 7 7 4 7 7 4 5 1 1 3 6 7 7 6 6 4 7 7 7 6 6 7 7 7 5 3 3 4 6 6 5 4 4 4 7 7 4 4 4 4 7 7 7 5 5
1
7
4 1 2 2 2 3 3 6 7 5 5 5 4 4 7 7 5 5 7 7 7 7 7 7 5 5 6 6 6 5 7 7 7 7 5 5 5 4 7 7 5 5 6 2 7 2 3 7 7 5 4 4 2 3 7
1
7
5 2 1 1 4 1 1 1 7 5 4 4 5 6 7 1 1 3 6 7 7 7 5 4 4 5 7 1 2 2 2 3 7 7 5 5 2 2 2 3 3 4 4 7 7 7 4 4 5 5 2 7 7 4 5
1
7
6 2 1 2 1 4 5 5 1 2 1 1 1 2 5 2 4 6 1 3 6 7 7 6 6 6 6 6 7 2 7 6 2 1 1 2 3 3 2 4 7 6 5 5 6 5 3 6 3 2 2 1 7 3 7
1
7
8 1 2 2 2 4 5 5 2 1 1 2 2 2 5 3 4 5 2 3 7 6 7 6 7 6 6 7 5 3 6 6 2 1 2 3 2 2 3 4 6 5 5 6 6 5 3 6 3 1 1 2 6 2 6
1 2 2 2 3 5 5 7 6 5 6 2 3 2 3 4 5 5 2 6 5 5 2 3 3 7 6 6 2 3 3 6 7 6 6 2 3 3 3 4 3 3 4 7 7 7 5 4 5 3 3 7 1 6

382
7
9
1
8
0 2 2 1 2 4 4 5 7 5 5 6 2 3 2 3 4 4 5 2 7 5 5 2 3 3 7 6 5 2 2 2 7 6 5 5 2 2 2 3 4 4 3 4 7 7 7 5 4 4 3 3 4 4 6
1
8
1 2 2 4 4 2 6 3 7 5 7 6 7 4 7 6 7 7 6 7 7 6 6 6 4 4 3 4 4 5 5 6 7 7 5 5 6 7 7 6 6 7 7 6 7 7 4 6 6 4 7 7 5 5 6
1
8
2 1 2 6 3 3 3 3 5 3 2 2 3 2 6 3 5 2 2 2 6 6 7 6 7 6 7 7 5 2 7 6 5 2 1 4 5 5 5 6 6 5 4 6 6 3 2 6 2 1 1 2 7 1 6
1
8
3 2 2 1 1 3 4 3 1 1 2 1 2 2 5 6 5 4 3 2 6 7 6 6 6 7 7 6 5 4 7 3 2 2 1 3 6 3 4 6 7 6 4 7 6 3 3 6 2 2 1 1 6 2 7
1
8
5 1 2 2 4 4 6 5 2 2 1 2 2 1 5 5 4 5 3 2 6 6 7 6 7 6 6 7 5 3 7 3 3 1 3 2 6 5 3 7 7 6 6 3 6 6 5 3 6 2 2 2 1 6 5
1
8
6 1 1 1 4 2 3 2 2 1 1 2 2 1 5 6 4 4 3 2 7 6 7 7 6 6 6 6 5 3 6 3 3 1 2 3 5 5 4 6 6 6 4 7 5 5 2 7 2 1 1 2 7 1 6

383
1
8
7 2 2 2 4 3 2 2 4 5 6 6 4 5 7 6 5 5 7 5 1 3 5 5 7 7 5 6 7 2 2 2 1 2 3 3 3 4 7 7 6 6 7 7 7 7 5 7 3 4 7 7 4 5 7
1
8
8 1 2 3 1 4 4 6 3 5 2 2 1 1 7 5 4 7 4 2 7 5 6 4 7 4 7 6 7 4 6 2 4 1 7 6 4 5 7 7 7 5 7 7 4 7 5 7 4 2 7 3 4 4 7
1
8
9 2 1 1 6 3 2 2 7 5 7 5 2 4 7 5 2 3 5 2 7 3 5 1 5 7 6 6 4 4 3 7 4 2 6 1 6 7 7 6 4 7 2 5 7 6 1 2 4 5 7 4 3 6 3
1
9
0 1 5 3 5 6 6 5 7 4 5 7 7 4 1 4 3 4 6 7 7 7 7 6 5 5 7 5 6 4 7 6 1 6 7 2 4 6 7 7 6 5 6 7 7 5 4 7 1 2 3 4 4 1 7
1
9
1 2 2 1 3 6 3 4 4 5 2 3 6 7 6 7 6 7 7 7 6 7 7 7 6 5 6 7 5 7 4 4 7 4 6 3 1 7 7 6 7 7 7 7 7 5 7 6 7 3 4 4 5 6
1
9
2 2 1 1 2 4 2 4 2 3 7 4 3 7 7 5 7 2 1 7 7 6 5 4 5 7 6 4 5 6 7 1 3 4 4 3 4 7 7 6 5 6 7 4 4 3 4 4 3 7 7 5 7
1
9 1 1 2 4 3 3 2 7 4 6 7 2 6 7 5 7 2 6 7 7 7 5 6 4 7 7 7 5 6 4 7 6 5 4 5 7 4 2 2 3 4 5 7 7 4 6 6 3 5 7 2 2 3 5

384
3
1
9
4 2 2 4 1 4 6 5 6 2 3 2 2 3 6 6 3 5 3 2 6 7 6 6 7 6 7 6 3 6 7 3 2 2 1 3 7 6 3 7 7 6 3 6 6 6 2 6 3 1 1 2 6 1 7
1
9
5 1 2 4 2 4 6 6 5 2 2 2 3 2 7 5 3 4 3 4 7 6 6 6 7 6 6 7 3 6 6 3 3 1 2 4 6 6 3 6 6 6 3 6 5 5 3 6 5 2 2 1 7 3 6
1
9
6 1 1 1 4 2 3 2 6 6 6 5 6 6 4 5 5 4 3 4 6 6 6 6 6 6 4 5 2 5 5 5 5 6 6 6 5 5 5 5 5 6 6 6 6 6 6 6 5 3 2 2 2 2 2
1
9
7 1 2 1 1 3 2 3 6 6 6 7 7 7 5 6 6 6 5 7 6 5 6 7 6 4 5 2 5 6 7 6 7 6 7 6 6 6 6 6 7 7 7 6 6 6 6 5 3 1 2 3 1 3
1
9
8 1 1 2 4 3 2 2 6 6 6 3 5 2 5 6 6 5 4 5 5 5 5 5 5 5 5 5 2 6 6 5 4 5 5 1 5 5 5 5 5 6 6 6 5 5 5 5 4 2 2 2 6 2 2
1
9
9 1 1 2 2 6 4 3 5 2 6 2 5 2 4 5 5 4 3 4 5 5 5 5 5 5 4 5 2 5 5 5 4 5 5 1 5 5 5 5 5 6 6 6 6 6 6 6 4 2 2 2 6 2 1
2 2 1 1 6 2 2 1 5 2 6 2 5 2 4 5 5 4 3 4 6 6 6 6 6 6 5 6 3 6 6 6 4 5 5 2 6 6 5 5 5 6 6 6 5 6 6 4 2 3 3 5 2 3

385
0
0
2
0
1 1 1 3 1 3 2 2 5 2 6 3 4 4 5 5 4 3 4 5 5 6 5 6 5 6 5 3 6 6 6 4 5 5 3 6 6 5 5 5 6 6 6 5 6 5 6 4 2 3 3 3 4 3
2
0
2 1 1 3 6 3 3 3 1 5 5 4 4 2 4 5 5 4 3 4 5 5 6 5 6 5 6 5 3 6 5 5 4 5 5 3 6 6 5 5 6 6 6 6 5 6 5 6 4 2 3 3 3 4 3
2
0
3 1 1 1 2 6 3 2 5 2 6 2 5 2 4 5 5 4 3 4 5 5 5 5 5 5 4 5 2 5 5 5 5 5 6 6 5 5 5 5 5 6 6 6 6 6 6 6 4 2 2 2 6 2 2
2
0
4 1 5 3 4 4 6 5 6 5 6 5 6 5 4 5 5 5 5 5 5 5 6 5 6 6 4 4 5 5 6 6 4 5 5 6 6 6 6 5 5 6 6 4 7 7 7 7 5 6 4 4 5 5 4
2
0
5 1 2 2 1 3 6 5 5 6 2 2 1 5 3 6 5 2 2 2 2 6 6 6 6 7 6 4 4 4 4 6 6 4 6 5 4 6 6 6 6 6 7 6 7 6 7 5 6 6 5 4 4 7 5
2
0
6 1 2 2 1 3 4 3 3 2 2 5 4 4 6 6 5 4 3 6 6 2 5 4 6 5 3 6 4 6 3 4 4 4 4 4 4 4 5 6 6 4 4 3 3 6 5 6 5 4 4 4 4 4 4

386
2
0
7 2 1 1 1 2 2 1 6 4 5 5 5 5 4 6 4 5 5 6 7 3 2 4 4 4 4 6 2 6 6 2 4 4 5 4 5 3 5 5 5 4 4 4 3 5 5 5 4 4 4 4 4 4 4
2
0
8 1 1 2 4 3 2 3 5 4 5 5 4 5 5 5 5 5 5 4 4 3 1 1 1 4 3 3 3 4 3 3 4 3 3 4 3 5 3 4 5 4 4 3 4 4 4 6 4 4 4 4 4 4 4
2
0
9 2 4 3 5 4 5 4 5 4 4 5 4 4 3 5 3 4 4 5 6 2 5 2 4 5 2 2 1 1 2 2 4 2 6 4 2 3 6 6 6 4 4 4 3 3 6 6 5 4 4 4 4 4 4
2
1
0 1 1 1 3 3 3 4 7 3 3 2 3 2 6 3 6 3 2 3 6 6 7 5 6 6 7 7 6 2 7 7 7 2 2 4 7 7 6 7 7 7 4 6 6 2 3 6 3 3 2 2 6 1 6
2
1
1 2 1 1 1 3 2 2 2 2 2 1 1 1 5 2 2 3 4 3 6 6 5 6 5 6 5 4 5 5 3 3 2 3 3 3 2 5 5 5 5 4 5 5 4 2 2 6 2 2 2 2 3 3 4
2
1
2 2 2 2 4 3 3 1 2 2 2 3 4 2 4 5 6 5 4 4 6 6 6 6 6 6 4 4 2 6 6 4 4 2 2 4 4 6 6 6 4 6 6 6 4 2 4 5 3 5 2 4 4 3 3

387
APPENDIX D
ETHICAL CLEARANCE

© Kamla-Raj 2014 J Soc Sci, 41(3): 345-352 (2014)
Compensation Management and Employee Job Satisfaction:A Case of Nigeria
Abayomi Olarewaju Adeoye and Ziska Fields
School of Management, Information Technology and Governance, University of KwaZulu-Natal, Westville, South Africa
KEYWORDS Compensation. Employees. Insurance Sector. Job Satisfaction. Effectiveness
ABSTRACT Human resources are the pivot of organisational effectiveness and the greatest asset that an organisationcan possess. The retention of skilful and well equipped workforce in an organisation is pertinent to the growth andoverall performance of an organisation. The satisfied employees’ surely contribute to the organisation to achieveits competitive advantage over its competitors. The present study is an attempt to investigate the relationshipbetween compensation management and employees’ job satisfaction in Nigeria’s Insurance Sector. The instrumentused in information gathering was questionnaire. In all, 250 questionnaires were administered to the employees’ ofan insurance company, 213 were retrieved and 212 were found usable for response rate of 84.4%. The statisticalanalysis revealed that compensation management and employees’ job satisfaction are significantly correlatedthough weak and that compensation management have an impact on motivation and job satisfaction of employees’.Implications of the study for managers in the perspective of HR practices have been highlighted andrecommendations are offered.
INTRODUCTION
Nigeria is the most populous African coun-try and has tremendous economic potential dueto its rich endowment of both natural and hu-man resources. While a country might haveabundant physical resources, it will not achieverapid economic and social progress unless itscitizens are enterprising and have the requiredskills and attitude. Developing nations, in par-ticular, require versatile human resources.
Nigeria’s insurance sector is part of thebroader financial sector. This sector is an impor-tant financial institution that covers individualpolicy holders in the event of death, accidentsor damage to property through fire or environ-mental disasters. It also offers investment vehi-cles for savings. The Nigerian insurance sectorhas not been able to measure up to the interna-tional standards because it is confronted by anumber of challenges, one of which is a lack ofskilled employees. This has prevented the in-dustry from growing. The sector has been un-able to attract qualified and efficient employeesdue to poor remuneration and low levels of jobsatisfaction. Insurance companies thereforeneed to adopt effective recruitment, selectionand placement processes in order to attract andretain efficient employees.
Compensation management is a useful in-strument in the hand of management to contrib-
ute to the organisational effectiveness and canimpact positively on the behaviour and produc-tivity of employees (Bustamam et al. 2014;Greene 2014). Compensation management de-termines the hiring retention of employees toattain the objectives of an organisation, and isthe basis of involvement of individuals to rein-force the performance of employees (Bustamamet al. 2014; Shaw 2014; Terera and Ngirande 2014;Xavier 2014).
Compensation management is, therefore, amajor factor in attracting and retaining staff. Askilled and stable workforce enables organisa-tions to successfully implement their strategiesto gain competitive advantage over competingorganisations (Heneman et al. 2000; Ivancevich2004). While substantial financial resources areinvested in designing, organising and manag-ing compensation systems and despite theirprominent role in determining the success anddevelopment of the firm, scholars and practitio-ners have lamented the slow pace of researchon compensation management specifically (Hen-eman et al. 2004; Kersley and Forth 2005). Thedesign, delivery and use of compensation man-agement have undergone major shifts to accom-modate the motivational aspect of employeeperformance that promotes improved organisa-tional performance (Heneman et al. 2000; Purcellet al. 2003).
Khan et al.’s (2011) study on 450 Habib BankLimited employees in Pakistan noted that com-

346 ABAYOMI OLAREWAJU ADEOYE AND ZISKA FIELDS
pensation management aims to encourage andretain employees to enhance the overall effec-tiveness and efficiency of an organisation. Sim-ilarly, Idemobi et al. (2011) viewed compensa-tion management as a tool to improve organisa-tional performance. Employees that experiencehigh levels of job satisfaction are more commit-ted and dedicated to their responsibilities and,through training and development, are able totake decisions independently. This is achievedby allowing an employee a measure of controlover what s/he wants to do and how to do it(Mathis and Jackson 2011; Chaudhary 2012; In-ayatullah and Jehangir 2012; Brevis and Vrba2014).
Employee compensation refers to all the re-turns that accrue to employees arising from theiremployment (Dessler 2008; van der Merwe et al.2009; Nazim-ud-Din 2013). Compensation man-agement requires accuracy and precision as, ifnot adequately and objectively dealt with, it mayhamper or organisation’s operations. An idealcompensation strategy should encourage em-ployees to work harder with more determinationand dedication to their duties (Khan et al. 2011).
Job satisfaction is expressed as the “plea-surable emotional state resulting from the ap-praisal of one’s job as achieving or facilitatingone’s job values” (Locke 1969: 317). This is alsocorroborated by Callaghan and Coldwell (2014)and Yadav and Aspal (2014). Job satisfaction isviewed as a function of diverse specific satis-factions and dissatisfactions that emerges as aresult of different dimensions of work that theemployee experienced (Rehman et al. 2010; Bus-tamam et al. 2014).
Objectives
To determine the extent of compensationmanagement in Nigeria’s insurance sector,andTo determine the relationship between com-pensation management and employee jobsatisfaction at A and G Insurance Plc.
Literature Review
Compensation is a crucial instrument for theattraction and retention of talented employeesthat are dedicated to their responsibilities with-in the firm. Compensation management aims topromote the achievement of business goals
through attracting, motivating and retaining hardworking employees (Shieh 2008; Petera 2011).
Compensation Management
Compensation management is a crucial com-ponent of the overall management of an organi-sation. It refers to the process by which employ-ees are remunerated for their input at the work-place (Khan et al. 2011).
Types of Compensation
For the purpose of this study, compensationis classified into the following categories:
Financial compensationNon-financial compensationCompensation and the individual
Financial Compensation
Financial compensation is concerned withfinancial rewards and incentives. Armstrong(2003: 687) accepted that “financial rewards pro-vide financial recognition to people for theirachievements in the shape of attaining or ex-ceeding their performance targets or reachingcertain levels of competence or skill while finan-cial incentives aim at motivating people in achiev-ing their objectives, improve their performanceor enhance their competence or skills by focus-ing on specific targets and priorities”.
Non-financial Compensation
This type of compensation does not directlyinvolve money and is usually related to the workitself. It includes achievement, autonomy, rec-ognition and the scope of the work. Other formsof non-financial compensation include skillsdevelopment, training and career developmentopportunities (Armstrong 2003: 626; Herzberg1966). This category of rewards aims to boostemployee morale (Danish and Usman 2010; Res-urreccion 2012).
Compensation and the Individual
Researchers are of the view that firms thatseek to improve employees’ productivity shouldlink remuneration and personal effort (Encinosalll et al. 2007; Kaplan and Norton 2007; Bartlettand Ghosal 2013). Heneman (1992) argued thatrewards and bonuses for personal effort are the

COMPENSATION MANAGEMENT AND EMPLOYEE JOB SATISFACTION 347
most visible ways of acknowledging an employ-ee’s efforts. However, programs that reward ef-fort cannot be compared with new administra-tive procedures based on uninterruptedprogress, joint effort and support (Demming1986; Snell and Dean 1994; Lepak and Snell 2002).
Firms are beginning to give greater recogni-tion to individual pay and performance not onlyto encourage increased productivity and effi-ciency, but also to retain highly valued toachieve the firm’s objectives (Kuvaas 2006). Leeand Bruvold (2003) note, that the more encour-agement employees receive, the higher their levelof commitment to the firm. Gardner et al. (2004)concur with this point of view. Similarly, Lawler(2003) argues that when remuneration is linkedto effort, both individual and organisational per-formance is enhanced. Lawler (2003) added thattying remuneration to performance improvesemployee motivation, as workers become moreresults-oriented. Employees will make more ef-fort to achieve results when they are aware thattheir remuneration package is determined bytheir contribution to the firm’s performance (Lawl-er 2003).
Low job satisfaction, a high rate of absen-teeism and staff turnover, and moonlighting aresome of the consequences of insufficient andinadequate compensation (DeCenzo and Rob-bins 2006; Khan et al. 2011; Majumder 2012; Alam2012). Among the 5 Ms, that is, Men, Money,Machines, Material and Market, men are an or-ganisation’s most valuable asset. Employees arethe architects of a firm. To maintain job satisfac-tion and retain their services, compensation inthe form of wages should be fair and adequate.Effective managers compare their firm’s compen-sation strategies with similar firms in the sectoror with the established benchmark.
Job Satisfaction
Job satisfaction is a key to improving bothorganisational and individual performance. Em-ployees with high levels of job satisfaction aremore motivated to achieve the firm’s objectives(Feinstein and Vondrasek 2000; Ahmed et al.2010; ªelik et al. 2011). Job satisfaction refers toemployees’ attitude towards their jobs which arethe result of their perceptions of the job or taskthat they do. It is an emotional or evaluativeresponse that can be positive, neutral or nega-
tive (Ivancevich and Matteson 1990; Greenbergand Baron 2000; Aydogdu and Asikgil 2011).
Similarly, Eren (1993) and ªelik et al. (2011)emphasise that job satisfaction is a worker’s at-titude towards his/her job, based on the differ-ent characteristics of the job in question. Thelevel of job satisfaction is determined by thesocial status attained through their job and theirexperience in the working environment (ªelik etal. 2011). Rashid et al. (2013) argued that jobsatisfaction and motivation are inseparable tan-gible principles when it comes to the success ofany firm and its workers. Thus, if workers areencouraged in their job, they experience higherlevels of job satisfaction and are inclined to usetheir skills to put more effort into their work.
Benita and Anghelache’s (2012) study onteachers’ motivation and job satisfaction foundno difference between male and female teachersin terms of overall job satisfaction and its scope.They posited that job satisfaction derives fromadequate and continuous learning motivated bya strong desire for achievement and affiliation.Likewise, Azash et al. (2012) study on job char-acteristics as determinants of work motivationand job satisfaction revealed that skills, taskidentity, task significance and feedback serveas either positive or negative predictors of em-ployee job satisfaction. Latif et al. (2011) exam-ined job satisfaction among public and privatecollege teachers in Pakistan, focussing on thefactors that contribute to job satisfaction anddissatisfaction. College teachers in the publicsector reported higher levels of job satisfactionthan their private sector counterparts.
Balachandan et al.’s (2010) study on job sat-isfaction among officers employed by insurancecompanies concluded that employees in the pri-vate sector and government insurance compa-nies are not affected by motivational factors tothe same degree as employees in other institu-tions. Arshadi’s (2010) study on basic needssatisfaction, work motivation, and job perfor-mance in an industrial company in Iran revealedthat a high level of autonomy satisfies three psy-chological needs and therefore enhances moti-vation as well as job performance. Ayeni andPopoola (2007) viewed that the work motivation,job satisfaction and organisational commitmentof library personnel in Nigeria concluded thatthere is a correlational relationship between per-ceived motivation, job satisfaction and commit-ment. It established a negative correlation be-

348 ABAYOMI OLAREWAJU ADEOYE AND ZISKA FIELDS
tween the motivation and commitment of librarypersonnel.
METHODOLOGY
The data for this paper were collected fromemployees of an insurance company operatingin south-west Nigeria. Questionnaires were handdelivered to the HR section from where theywere distributed to employees. Participation inthe study was boosted by management’s com-mitment to the exercise. Confidentiality was en-sured as the employees did not state their nameson the completed questionnaire. Two hundredand fifty copies of the questionnaire were dis-tributed; to the participants and out of them 213questionnaire were returned, 212 were usable,yielding a response rate of 84.4%.
In terms of gender, 122 (57.5%) of the respon-dents are male and 90 (42.5%) are female. A hun-dred and twenty (56.6%) are married. The aver-age age is 31-40 years. Turning to educationalqualifications, 63.7% of the respondents had afirst degree, while 23.6% and 8.9% had a post-graduate degree and professional qualification,respectively. Table 1 displayed that 76.4% of therespondents had 1-9 years work experience.
Measures
There are two measures for this study. Onewas self developed and the other was adaptedfrom a published scale.
Compensation Management
Compensation management was measuredusing a self-developed scale called the Compen-sation Management Questionnaire Scale (CMQS)on a six-item measure requesting the participantsto respond to a seven-point response scale. Theitems include “my salary is commensurate to thework I do”, “my salary is above those paid bysimilar companies in the industry” etc. Respons-es to this item were measured on a 7-point scale,where 7 = strongly agree and to 1 = stronglydisagree. The cronbach’s á of this scale was 0.87which shows internal consistency reliability.
Job Satisfaction
Job satisfaction was measured using theMinnesota Job Satisfaction Questionnaire
(MSQ) on a six-item measure, also asking theparticipants to respond to a seven-point re-sponse scale. The items are “being able to keepbusy all the time”, “there are opportunities foradvancement in this job”, etc. The responses tothis item were measured on a 7-point scale where7 = strongly agree and 1 = strongly disagree.Cronbach’s á coefficient of the adapted scalewas 0.74 which shows internal consistency reli-ability.
Data Collection
Two hundred and fifty questionnaires weredistributed to the employees of an insurancefirm in Nigeria through the Human ResourcesDepartment to all the company’s branches, in-cluding the headquarters. Two hundred and thir-teen were returned, of which 212 were useable,representing a return rate of 84.8%. The ques-tionnaire was divided into two sections: a sec-tion on demographic information set out in Ta-ble 1 and a second section covering CMQS andMSQ adapted from the work of Weiss et al. (1967)with modification.
Data Analysis
Table 1: Demographic information
Frequency Percentage
GenderMale 122 57.5Female 90 42.5
Marital StatusSingle 75 35.4Married 120 56.6Divorced 7 3.3Widow 5 2.4Separated 3 1.4Missing Item 1 0.9
Age20-40 151 71.240-51 45 21.251-above 15 7.1Missing Item
Education 1 0.5School certificate 8 3.8Undergraduate Degree 135 63.7Post-graduate degree 50 23.6Professional and other
qualificationsExperience 19 8.9
1-5years 110 51.96-9years 52 24.510years-above 49 23.1Missing Item 1 0.5
Source: Field Survey

COMPENSATION MANAGEMENT AND EMPLOYEE JOB SATISFACTION 349
The data collected were analysed using theStatistical Package for the Social Sciences (SPSS)version 21. Descriptive statistics were employedto describe the participants’ demographic pro-files and Pearson Product Moment Correlationwas engaged to test the research proposition.
RESULTS AND DISCUSSION
The descriptive statistics for the measuresof compensation management are reported inTable 2, and the descriptive statistics for themeasures of job satisfaction are reported in Ta-ble 3. Table 4 reports the results of Pearson cor-relation testing the association between com-pensation management and job satisfaction.
Compensation Management
Compensation management is a crucial com-ponent of managing employees to achieve ef-fectiveness and efficiency. It is used to motivateand retain employees and ultimately enhancesthe overall effectiveness of an organisation. Anorganisation designs its compensation structurein line with its vision, mission and strategies.Compensation management is beneficial to bothparties in the employment relationship. Employ-ers benefit from a reduced absenteeism rate. If
an employee finds his/her work rewarding andis satisfied with his/her current pay and bene-fits, there is far less need to absent him/ her fromthe job. Secondly, compensation motivates em-ployees to work harder because they are awarethat when they achieve a certain goal, they willbe rewarded or receive an increment. Thirdly, itpromotes job satisfaction, reducing employees’intention to quit. Compensation benefits em-ployees by building self-confidence and self-esteem/self-efficacy. Reward schemes, etc. are away of recognising employees’ efforts and theyfeel that they are valued by the organisation.When an organisation gives different assuranc-es to employees, it put their fears to rest.
Table 2 presented that the majority of therespondents are not satisfied with the compen-sation offered by the insurance company. Thefinding of the study supports the outcome ofthe impact of rewards on job satisfaction andemployee retention (Terera and Ngirande 2014).
Job Satisfaction
Today’s world is dynamic and ever-chang-ing. In this environment, job satisfaction is anintegral factor in motivating employees to ac-complish organisational goals and objectives.Job satisfaction has been recognised as one of
Table 2: Compensation management
Statement SDA DA DAS N AS A SA MEAN SD
My salary is commensurate to the work I do 28 41 24 21 35 35 26 3.97 2.02My salary is above those paid by similar companies 42 53 28 36 30 17 4 3.12 1.68My salary is enough to compensate me for my job 32 48 30 26 37 30 7 3.50 1.80I received other payments apart from the salary 83 45 20 13 20 16 12 2.80 2.35My salary is competitive, reasonable and is reviewed 36 54 28 42 18 24 9 3.28 1.77My company pays salary and emoluments that are 43 50 30 38 25 15 10 3.18 1.76 sufficient to motivate employees
Source: Field Survey.
Table 3: Job Satisfaction
Statement SDA DA DAS N AS A SA MEAN SD
Being able to keep busy all the time. 7 9 8 26 47 61 49 5.30 1.54The opportunity for advancement on the job. 8 18 27 42 48 48 17 4.51 1.57The chance to be responsible to determine and 7 22 31 43 47 43 13 4.38 1.55 plan my work.The policy and practices towards employees of 15 27 33 78 25 18 11 3.82 1.50 the company.My pay and the duties I carry out are commensurate. 17 45 53 37 28 18 9 3.50 1.58The security of my job is guaranteed. 16 45 35 48 33 12 18 3.70 1.68
Source: Field Survey

350 ABAYOMI OLAREWAJU ADEOYE AND ZISKA FIELDS
the key issues in the service sector of the econ-omy, including insurance. To cope up with cur-rent changes and future challenges, organisa-tions need to identify the factors that signifi-cantly influence organisational outcomes, in-cluding job satisfaction.
The statements in Table 3 were designed toestablish whether or not the respondents areable to grow and feel secure in their jobs. Mostof the respondents indicated that they are satis-fied with the opportunities provided to grow inthe industry but were neutral on whether or notthey are offered the chance to be responsible todetermine and plan their work and did not agreethat their pay is commensurate with their dutiesor that their job security is guaranteed. The re-sult of the research is in consonant with thefindings of reward management and job satis-faction among frontline employees in hotel in-dustry in Malaysia (Bustamam et al. 2014).
Correlation is significant at the 0.05 level, thatis p<0.05; therefore there is a significant rela-tionship between compensation managementand employees’ job satisfaction.
Table 4 indicates that the correlation betweencompensation management and employees’ jobsatisfaction is .445 which is significant at 0.05level (r=.445, p<0.05). This implies that there is asignificant positive relationship between com-pensation management and employees’ job sat-isfaction at insurance companies in Nigeria. Thevalue of p which is 0.027, is lower than 0.05 andthe correlation coefficient is 0.445 or 44.5%.There is a relationship between compensationmanagement and employees’ job satisfaction.Besides, the null hypothesis that states that,there is no significant relationship between com-pensation management and employees’ job sat-isfaction is rejected and the alternative hypoth-esis that states that, there is a significant rela-tionship between compensation managementand employees’ job satisfaction at insurancecompanies in Nigeria is accepted. The outcomeof this research is in track with the impact ofrewards on job satisfaction and employee reten-
tion that there is no significant relationship be-tween rewards and job satisfaction amidst em-ployees (Terera and Ngirande 2014).
CONCLUSION
The objective of the present study was toinvestigate the relationship between compen-sation management and job satisfaction in theinsurance industry in Nigeria, as well as its con-sequences for this industry’s performance. Thefindings indicate that the respondents are notsatisfied with the compensation they receive inthe insurance industry; they regard it as inade-quate and insufficient. This supports the viewsexpressed in the literature that if workers are notsatisfied with their compensation, the organisa-tion will suffer low levels of job satisfaction, highrates of absenteeism and labour turnover, andmoonlighting. The study’s findings also revealthat insurance employees’ level of job satisfac-tion is negatively affected by the fact that theirremuneration is not commensurate with the tasksthey perform and job security is not guaranteed.This finding concurs that employees in the pri-vate sector and government insurance compa-nies are not affected by motivational factors tothe same degree as employees in other institu-tions. The Pearson product moment correlationcoefficient shows that there is a relationshipbetween compensation management and the jobsatisfaction of employees in the insurance in-dustry in Nigeria; however, this is not very sig-nificant. The cumulative effect of these findingsis that, the retention rate of employees in theinsurance industry will be very low, and thatthese companies will suffer high absenteeismrates and increased intention to quit. All thesefactors have a negative impact on organisation-al productivity.
RECOMMENDATIONS
Arising from the outcomes of this study, thefollowing recommendations are offered:
Table 4: Pearson correlation between compensation management and employees’ job satisfaction
N Mean Std D R P
Compensation management 207 5.7536 5.09542Employees’ job satisfaction 207 5.2995 1.54139 .445 .027Source: Field Survey

COMPENSATION MANAGEMENT AND EMPLOYEE JOB SATISFACTION 351
Firstly, Insurance companies should improvetheir compensation strategy and remunerationto boost employees’ dedication and commitmentto efficiently deliver good customer service. Thiswill improve the sector’s image. Secondly, In-surance companies should conduct research onremuneration levels in other sectors, particularservice-related sectors like the banking indus-try. Thirdly, Insurance companies should pro-mote adequate job security in order to reduceabsenteeism, labour turnover and moonlightingamong employees. Finally, Insurance companiesshould design and implement career develop-ment programs, including conferences, seminarsand other training exercises as a reward for com-mitted and dedicated staff members.
REFERENCES
Ahmed I, Nawal MM, Iqbal N, Ali I, Shaukat Z, UsmanA 2010. Effects of motivational factors on em-ployees job satisfaction: A case study of universityof the Punjab, Pakistan. International Journal ofBusiness and Management, 5(3): 70-80.
Alam T 2012. Factors affecting job satisfaction, moti-vation and turnover rate of Medical PromotionOfficer (MPO) in Pharmaceutical industry: A studybased in Khulna City. A Bus Rev, 1(1): 126-131.
Ayeni CO, Popoola SO 2007. Work Motivation, JobSatisfaction and Organisational Commitment of Li-brary Personnel in Academic and Research Librariesin Oyo State, Nigeria. Library Philosophy And Prac-tice. From <http://digitalcommons.unl.edu/cgi/viewcontent.cgi?article=1118 &context= libphil-prac> (Retrieved on 24 April 2014).
Armstrong M 2003. A Handbook of Human ResourceManagement Practice. 9th Edition. Great Britain,Aberystwyth, Wales: Cambrian Printers Ltd.
Arshadi N 2010. Basic need satisfaction, work motiva-tion and job performance in an industrial companyin Iran. Social and Behavioural Science, 5: 1267-1272.
Aydogdu S, Asikgil B 2011. An empirical study of therelationship among job satisfaction, organisationalcommitment and turnover intention. InternationalReview of Management and Marketing, 1(3): 43-53.
Azash S, Safari R, Thirupalu N, Subhan B 2012. Jobcharacteristics as predictors of work motivation andjob satisfaction of bank employees. InternationalJournal of Business and Management Tomorrow,2(1): 1-7
Balachandan G, Panchanathan N, Subramanian K 2010.Impact of job satisfaction on the motivation ofinsurance company officers: A developmental per-spective. International Journal of Trade, Econom-ics and Finance, 1(4): 349-353.
Bartlett C, Ghoshal S 2013. Building competitive ad-vantage through people. MIT Sloan ManagementReview, 43(2): 34-41.
Benita CC, Anghelache V 2012. Teacher motivationand satisfaction for professional activity. Socialand Behavioural Science, 33: 563-567.
Brevis T, Vrba M 2014. Contemporary ManagementPrinciples. South Africa: Juta and Company Ltd.
Bustamam FL, Teng SS, Abdullah FZ 2014. Rewardmanagement and job satisfaction among frontlineemployees in hotel industry in Malaysia. Proce-dia–Social and Behavioural Sciences, 144: 392-402.
Callaghan CW, Coldwell D 2014. Job satisfaction andjob performance: The case of research productivi-ty. Journal of Economics, 5(1): 97-113.
Celik M, Man M, Modrak V, Dima IC, Pachura P 2011.A theoretical approach to the job satisfaction. Pol-ish Journal Management Studies, 4: 7-15.
Chaudhary P 2012. Effects of employees’ motivationon organisational performance: A case study. Inter-national Journal Research in Economics and So-cial Science, 2(9): 81-87.
Danish RQ, Usman A 2010. Impact of reward and rec-ognition on job satisfaction and motivation: Anempirical study from Pakistan. International Jour-nal of Business and Management, 5(2): 159-167.
DeCenzo DA, Robbins SP 2006. Fundamentals of Hu-man Resource Management. USA: Nice PrintingPress Daily.
Demming WE 1986. Out of the Crisis. Cambridge, MA:MIT Institute for Advanced Engineering Study.
Dessler G 2008. Human Resource Management. USA:Prenctice Hall.
Encinosa III WE, Gaynor M, Rebitzer JB 2007. Thesociology of groups and economics of incentives:theory and evidence on compensation systems. Jour-nal of Economic Behaviour and Organisation,62(2): 187-214.
Eren E 1993. Management and Organisation. 2nd Edi-tion. Istanbul: Beta Basim Yayim Daçitim.
Feinstein AH, Vondrasek D 2000. A Study of Relation-ships between Job Satisfaction and OrganisationalCommitment among Restaurant Employees (2013).From <http://hotel.unlv.edu/pdf/jobSatisfaction.pdf>(Retrieved on 24 April 2014).
Gardner DG, Dyne LV, Pierce JL 2004. The effects ofpay level on organization-based self-esteem andperformance: A field study. Journal of Occupation-al and Organisational Psychology, 77(3): 307-322.
Greenberg J, Baron RA 2000. Behaviours in Organisa-tions. 7th Edition. NJ: Prentice Hall.
Greene RJ 2014. The Role of Employee Ownership inthe Total Rewards Strategy. Compensation and Ben-efits Review, 19 May: 1-4. DOI:10.1177/0886368714529919 (Retrieved on 17 October 2014).
Heneman RL 1992. Merit Pay: Linking Pay Increasesto Performance Ratings. MA, US: Addison-Wesley/Addison Wesley Longman
Heineman III HG, Judge TA, Heneman RL 2000. Staff-ing Organizations. New York: McGraw Hill Irwin.
Herzberg F 1966. Work and the Nature of Man. Clevel-land: World.
Hyondong K 2006. Strategic Impacts of Compensa-tion System on Organisational Outcomes: An Em-pirical Study of the Conceptualisations of Fit andFlexibility in the Compensation Design. PhD The-sis, Unpublished. Ohio: The Graduate School of theOhio State University, USA.

352 ABAYOMI OLAREWAJU ADEOYE AND ZISKA FIELDS
Idemobi EI, Onyeizugbe CU, Akpunonu EO 2011.Compensation management as tool for improvingorganizational performance in the public sectors: Astudy of the Civil Service of Anambra State of Nige-ria. Sacha Journal of Policy and Strategic Studies,1(1): 109-120.
Inayatullah A, Jehangir P 2012. Teacher’s job perfor-mance: The role of motivation. Abasyn Journal ofSocial Sciences, 5(2): 78-99.
Ivancevich JM, Matteson MT 1990. OrganisationalBehaviour and Management. 2nd Edition. Boston:Bpi Irwin.
Kaplan RS, Norton DP 2007. Using the balanced score-card as a strategic management system. HarvardBusiness Review, July-August: 1-15.
Kersley BA, Forth J 2005. Inside the Workplace: FirstFindings from 2004 Workplace Employment Rela-tions Survey (WERS 2004). London: Economic andSocial Research Council.
Khan RI, Aslam HD, Lodhi I 2011. Compensationmanagement: A strategic conduit towards achievingemployee retention and job satisfaction in bankingsector of Pakistan. International Journal of Hu-man Resource Studies, 1(1): 89-97.
Kuvaas B 2006. Work performance, affective com-mitment, and work motivation: The roles of payadministration and pay level. Journal of Organisa-tional Behaviour, 27: 365-385.
Latif K, Shahid MN, Sohail MN, Shahbaz M 2011. Jobsatisfaction among public and private college teach-ers of District Faishlabad, Pakistan: A comparativeanalysis. Interdisciplinary Journal of Contempo-rary Research in Business, 3(8): 235-242.
Lawler III EE 2003. Reward Practices and PerformanceManagement System Effectiveness. A Paper Deliv-ered at Centre for Effective Organisations, MarshallSchool of Business, University of Southern Califor-nia, Los Angeles, California, USA, July 8, pp. 1-19.
Lee CH, Bruvold NT 2003. Creating value for employ-ees: investment in employee development. Inter-national Journal of Human Resource Management,14(6): 981-1000.
Lepak DP, Snell SA 2002. Examining the human re-source architecture: The relationships among hu-man capital, employment and human resource con-figurations. Journal of Management, 28(4): 517-543.
Locke EA 1969. What is job satisfaction? OrganisationBehaviour and Human Performance, 5(4): 165-176.
Majumder TH 2012. Human resource management prac-tices and employees’ satisfaction towards privatebanking sector in Bangladesh. International Reviewof Management and Marketing, 2(1): 52-58.
Mathis RL, Jackson JH 2011. Human Resource Man-agement. 13th Edition. USA: South-Western Cen-gage Learning.
Nazim-ud-Din M 2013. HR practices in insurance com-panies: A case study of Bangladesh. Abasyn Journalof Social Sciences, 6(2): 77-90.
Petera P 2011. Evaluating the quality of rewards sys-tems. European Financial and Accounting Jour-nal, 6(3): 66-91.
Purcell J, Kinnie N, Hutchinson S 2003. Understand-ing the People and Performance Link: Unlockingthe Black Box. London: Chartered Institute of Per-sonnel and Development.
Rashid U, Wani NA, Kumar FA 2013. Difference in jobsatisfaction and work motivation among govern-ment and private company employees. InternationalJournal of Innovative Research and Development,2(7): 143-148.
Rehman MZU, Khan MR, Ziauddin Lashari JA 2010.Effect of job rewards on job satisfaction, moderat-ing role of age differences: An empirical evidencefrom Pakistan. African Journal of Business Man-agement, 4(6): 1131-1139.
Resurreccion PF 2012. Performance management andcompensation as drivers of organisational compet-itiveness: The Philippine perspective. Internation-al Journal of Business and Social Science, 3(21):20-30.
Shaw JD 2014. Pay dispersion. The Annual Review ofOrganisational Psychology and Organisational Be-haviour, 2014(1): 521-544.
Shieh CJ 2008. Effect of corporate compensation de-sign on organisational performance. Social Behav-iour and Personality, 36(6): 827-840.
Snell SA, Dean JW Jr 1994. Strategic compensationfor integrated manufacturing: The moderating ef-fects of job and organisational inertia. Academy ofManagement Journal, 37: 1109-1140.
Terera SR, Ngirande H 2014. The impact of rewards onjob satisfaction and employee retention. Mediter-ranean Journal of Social Sciences, 5(1): 481-487.
Van der Merwe SP 2009. Determinants of family em-ployee work performance and compensation in fam-ily business. South African Journal of Business Man-agement, 40(1): 51-63.
Weiss DJ, Davis RV, England GW, Lofquist LH 1967.Manual for the Minnesota Satisfaction Question-naire. Minnesota: IRC, University of Minnesota.
Xavier B 2014. Shaping the Future Research Agendafor Compensation and Benefits Management: SomeThoughts Based on Stakeholder Inquiry. Human Re-source Management Review, 24(2014): 31-40. From<http://dox.doi.org/10.1016/j.hrmr.2013.08.011>(Retrieved on 17 October 2014)
Yadav P, Aspal J 2014. Importance of job satisfactionand talent management. International Journal ofResearch in IT and Management, 4(7): 55-65.
ISSN 2039-2117 (online) ISSN 2039-9340 (print)
Mediterranean Journal of Social Sciences MCSER Publishing, Rome-Italy
Vol 5 No 27 December 2014
342
The Influence of Compensation Management on Employee’s Leadership
Role in Insurance Sector: Nigeria Experience
Abayomi Olarewaju Adeoye
Department of Business Administration, Faculty of Management Science, Lagos State University, Ojo, Lagos, Nigeria
Doi:10.5901/mjss.2014.v5n27p342 Abstract
The huge success of an organisation and its ability to survive competitive pressure from its competitors in a globalised economy depends on the leadership role of the employees. Leadership is the ability to persuade others to ensure the attainment of defined goals/objectives of the organisation with enthusiasm. The current study focuses on the influence of compensation management on employee’s leadership role in insurance sector with evidence from Nigeria. The study used quantitative (questionnaire) approach to gather information from the participants. In all, 250 questionnaires were administered to the employees of an insurance company, 213 returned and 212 (84.4%) were found usable. Ethically, participation in the survey was voluntary and confidentiality of response was of paramount esteem. The study affirmed that there is a positive relationship amongst the variables though the association was not strong which is r= 0.481 (48.1%). That is, there is a correlation between compensation management and employee’s leadership role in the insurance industry in Nigeria. The outcome of the study also reveals that compensation management do have influence on employee’s leadership roles, as well that leadership do motivate employees to perform effectively. Implications of the study for managers in the perspective of HR practices have been enumerated and recommendations offered. Suggestions for future studies are also made.
Keywords: Compensation management, Employees, Insurance industry, Leadership role, Nigeria.
1. Introduction Employees are pivotal to the achievement of organisational goal and enhancing the competitive advantage of the organisation in the global world and within the industry where the business firm is operating. Hence the leadership role of the employee’s in achieving this cannot be underestimated and to this done adequate measure must be put in place by the organisation through well managed compensation structure. Therefore, compensation management as one of the fundamental functions of human resource department is meant to attract, retain, developed employees toward attaining organisational effectiveness, efficiency and competitive advantage in the globalised world (Adeoye, 2001; Tsai, 2005; Adeoye, Elegunde, Tijani & Oyedele, 2012).
Compensation management is a veritable instrument that affects the decision of job applicants and employees within the organisation. It has aided the firms to achieve their competitive edge over their competitors in the industry (Heneman & Judge, 2000; Ivancevich, 2004; Hyondong, 2006). Furthermore, a lot of monetary resources are invested on crafting, organising as well as administering organisational remuneration arrangement. Despite its vital contribution toward the success and development of the firm, scholars and even practitioners have lamented that there is a slow pace in the advancement of compensation research (Heneman & Judge, 2000; Kersley & Forth, 2005). In most recent times, the plan release cum adoption of reward management, have gone through a major shift that are dramatic in nature. This has reflected the motivational aspect in the employees’ leadership roles and performance (Heneman & Judge, 2000; Purcell et al., 2003).
In the context of organisational effectiveness, leadership roles cannot be underestimated and the critical existence of an organisation is largely anchored on the leadership that exists within the sphere of the firm. It is reiterated that the wire link between the vision, strategic direction and change of the organisation is leadership. Leadership has been in existence for as long as people on earth have co-existed and it is present in all the cultures (Rukmani et al., 2010; Fibuch, 2011). Bontis and Serenko (2009) and Ilies et al., (2006) viewed leadership from the managerial perspective and opined that managerial leadership is the grace to be able to encourage, arouse, mentally excite, propagate, anchor, visibly coordinates the organisational goals, and show good examples to subordinates. Articulate leaders must be ready to give feedbacks about the different aspects of the subordinates’ effort that may have positive result on self-efficacy, job

ISSN 2039-2117 (online) ISSN 2039-9340 (print)
Mediterranean Journal of Social Sciences MCSER Publishing, Rome-Italy
Vol 5 No 27 December 2014
343
satisfaction, and commitments of employees with focus on areas of improvement (Shea and Howell, 1999; Jawahar, 2006; Bontis & Serenko, 2009).
Objective of the study To ascertain the influence of compensation management on employees leadership role. Prepositions P1: Does compensation management influence employees’ leadership role. P2: Does leadership affects employees’ motivation.
2. Literature Review For organisations, the main objective of CM is to tilt the behavioural pattern of the employee’s in a particular way and embedded in them some leadership acumen that will make the organisational goals achievable. Though, the dream of any organisation is to stimulate employee’s retention with the organisation, and then articulate employees’ effort with adequate reward administration toward the importance of organisational goal (Bommer, Rich and Rubin, 2005; Wright, Moynihan and Pandey, 2011; Wang, Tsui and Xin, 2011). 2.1 Compensation Management The issue of compensation management is one of the important functional areas of human resources. Compensation administration, involves salaries and wages which are singular factors that are crucial in motivating employees to achieve set up goals. As such therefore, wages are part of the major factors in the economic and social life of those that work in the private sector of any society. In developed societies, the total wages of manual workers average 40 per cent or more of the whole national income. Wage earners form a percentage of the labour force (Robinson, 1990). Salaries are the money paid to the employees on monthly basis with other benefits attached to guarantee the employment. Salaries are also the reward for work and enhance recruitment, retain and motivate the employees (Robinson, 1990; Yusuf, 1984).
Adeoye et al., (2012) view compensation management inform of salaries and wages that are of paramount interest to both the workers, employers and state who the major players in industrial relations, of which they may jointly have vested interest in increasing the total quality of goods and services produced, from which wages, profits and revenues are obtained. Similarly, Harrison and Liska (2008) contend that remuneration is the connecting rod of employment contract between the employer and supplier of labour which is basically the main objective which motivates people to work. This embraces all kinds of rewards; both intrinsic and extrinsic are offered as a result of being employed by the organisation. Brown (2003) views compensation as a return in exchange between the employer and employees themselves and as an entitlement or gratification for being engaged by the organisation, or as remuneration for a well-executed job. Employees ’remuneration depends not only on the jobs they are holding but also on the function of individual performance, group or team work, or whole organisation as well as differences in employee qualities such as years of experience, seniority, educational qualifications, geographical location, bargaining strength and skills (Gehert & Milkovich, 1992: 417).
Idemobi, Onyeizugbe and Akpunonu (2011) view “compensation management as a tool for improving organisational performance” in the public sector of a state in Nigeria. They contend that there is no significant relationship between financial compensation of public staff and their performance and that the compensation earned is not measurable with the staff effort. They stress that reformed programmes of the government have no corresponding and significant effect on the financial compensation policies and practices in the public sector in Nigeria due to improper compensation management. Werner and Ward (2004) argue that for the continuous existence of an organisation, rewards have been accepted as a major motivational factor that gingers employees’ to put in their best as well as an essential tool and cost for organisations. The perceptions about the construct reward system; its influence on organisation’s structure, system, strategies, and employees has been an area of concern for research. Werner and Ward (2004) focused on recent compensation research which is characteristically eclectic. The objectives of compensation are attracting, equitable, balanced, security, cost effective, incentive-providing, retention and competitive position (Nickels et al., 1999; Ivancevich, 2004)
Types of Compensation There are various forms of compensation and nearly all these forms of compensation can be categorised into four
broad types (Muchinsky et al.; 1998: 226). The four broad types are: (a) Wages and Salary: Wages are what is paid to employees who are not permanently employed and typically
pertains to hourly rates of pay (the more hours worked, the greater the pay), while salary is what is paid to people that are permanently employed and this is at a fixed weekly, monthly, or annual rate of pay.

ISSN 2039-2117 (online) ISSN 2039-9340 (print)
Mediterranean Journal of Social Sciences MCSER Publishing, Rome-Italy
Vol 5 No 27 December 2014
344
(b) Incentive Plans: This is an additional compensation which is above and beyond the employees wage or salary provided. It may be long term or short term in nature.
(c) Employee Benefit Programmes: Time off with pay, pension scheme, tuition reimbursement, recreation activities, cafeteria services are all examples of employee benefit programmes.
(d) Additional Privileges: Employees in organisations may have other privileges such as the usage of company vehicles/cars, club membership or travelling allowance. These privileges may be a substantial part of compensation, especially for the executives. DeCenzo and Robbins (2007) and Khan et al., (2011) explored compensation/reward management and they submitted that rewards are of three major types which are as follows: (a) Intrinsic and Extrinsic Rewards: Intrinsic rewards are self-generated rewards whish are anchored on self-
contentment arising from the job itself and this often referred to as intangible rewards such as being part of a team, ego as a result of achieving a goal and self-importance and satisfaction arising from one’s own work/effort. While extrinsic rewards are emoluments provided by the superiors such as salary increment, bonus, sales commission etc. and this is also referred to as the tangible rewards.
(b) Financial and Non-financial Rewards: Financial rewards are the rewards received by employees in monetary forms and this assists the employees to boost the financial and social status. But non-financial rewards is made up of inexpensive rewards to heighten the employees morale like long service award, best employee of the year etc.
(c) Performance-based and membership-based Rewards: Firms equally offer rewards to its employees based on their membership in that organisation or on the basis of accomplishing high performance.
2.2 Leadership The critical survival of an organisation is largely anchored on the leadership that exists within the sphere of the firm. It is the wire link between the vision, strategic direction and change of the organisation. Leadership has been in existence for as long as people on earth have co-existed and it is present in all the cultures (Rukmani et al., 2010; Fibuch, 2011).
Leadership because of its relevance in organisations has been looked into by various authors and it has been defined as the process by which a manager made an attempt to influence a task related activity on his/her subordinates (Eze, 2010; Thom-Otuya & Tamuno, 2011). Iguisi (2009) viewed leadership as interpersonal activities in which the efforts of groups or individuals are being coordinated, stimulated, and controlled as well as being directed by someone who is of a higher authority. In a nutshell, leadership can be said to be a relationship that one person uses to influence or tilt the attitude or actions of other people.
In the same vein, Kaiser, Hogan and Craig (2008) carried out a study on leadership and the fate of organisations and submit that the attitude of leaders do have an influence on the performance of an organisation. In trying to give a working definition of leadership, it means providing a solution to the problem of collective or team effort, that is, problem of getting people together and combining their efforts to achieve, stimulate accomplishment and survival of the organisation (Hogan & Kaiser, 2005; Kaiser et al., 2008). Three implications of the above view was noted by Kaiser et al., (2008) that
Leadership entails having an influence on individuals to willingly contribute their quota to the good of the group;
Leadership also involves organising and supervising the group to accomplish its aims Goals vary from organisation to organisation in the sense that most organisations are competing for limited
scarce resources’’ which is an umbrella for having a proper understanding of group performance. 2.2.1 Types of Leadership There are various types of leadership styles that has been identified in the literatures but since late 1980’s, much of the leadership research focus has been on nature, characteristics and certain effects of charismatic or transactional and transformational leadership style (Bass, 1985; Tichy & Devanna, 1986; Ardicvilli, 2001; Walumbwa and Ojode, 2003; Rukmani et al., 2010; Obiwuru et al., 2011). 2.2.1.1 Autocratic Leader This style of leadership gives commands and expects total compliance. It is dogmatic and positive in nature. It also leads

ISSN 2039-2117 (online) ISSN 2039-9340 (print)
Mediterranean Journal of Social Sciences MCSER Publishing, Rome-Italy
Vol 5 No 27 December 2014
345
by the ability to withhold or give rewards and punishment, does things without consultation with the subordinates on a proposed action or plan and discourages participation from the followers (Weihrich and Koontz, 1993; Obisi, 2003; El Masry, Kattara and El Demerdash, 2004; Durowoju et al., 2011). 2.2.1.2 Democratic Leader This is also known as participative leader who consults with his colleagues and subordinates on a proposed action or actions to be executed by encouraging them to have a say in what he wants to carry out. A democratic leader is the listening type that pays attention to the views of his colleagues, group and his associates by also cherishing, loves and gives them the liberty and freedom. The democratic leader believes that the opinion of the majority counts and that through his colleagues and subordinates greatness can be attained. Thus, he believes strongly in delegating authority (Weihrich and Koontz, 1993; Obisi, 2003: 183-187; Durowoju et al., 2011). 2.2.1.3 Laissez-Faire Leader This is also referred to as Free-rein leader who portrays a nonchalant or care free attitude toward taking an action concerning anything he wants to do. He depends mostly on the subordinates in setting his own goals and the processes of achieving the goals. Subordinates on this leadership style are left exclusively on their own to make decisions on how well to execute their job responsibilities. In this situation, the standard for performance will be set by the leader and gives the employees the free hand to look for a way of achieving the standard he (the leader) has set. For this to be efficient and effective likewise the standard must be well known to the employees and there must be motivational factors on ground to enable the attainment of the set-up standards (Ardichvilli, 2001; Ferrell et al., 2008; Durowoju et al., 2011). 2.2.1.4 Transactional Leader This is basically found on an exchange process through which the leader made available rewards for the subordinates in return for their effort to accomplish the set-up goals of the department as well as that of the organisational performance. Here, the manager decides and give a definite goal for their subordinates, gives line of action to carry-out the tasks and gives room for feedback and assessment. It was founded that transactional leadership use to have a favourable influence on the attitude and behavioural responses of employees (Ardichvilli, 2001; Rukmani et al., 2010; Obiwuru et al., 2011; Durowoju et al., 2011; Thom-Otuya & Tamuno, 2011). Wang et al., (2011) stressed that transactional leadership is having an exchange relationship that connects the exchange partners’ own self-interests. Wang et al., (2011) expanding on the work of Yukl (2002) argued that the transactional leadership pays attention on relationship with employees which captures being supportive of and helpful to subordinates, developing trust and confidence in employees, creating a friendly atmosphere, getting acquainted with the problems of their subordinates, giving applause for a subordinate’s ideas, and acknowledging the contributions and accomplishments of the subordinates.
Transactional leadership has assisted organisations in achieving their aims and objectives in an efficient and effective manner by connecting job effort with valued rewards and by ascertaining that employees are having access to the resources needed to bring the job to fruition (Bass & Avolio, 1993; Zhu et al., 2005). 2.2.1.5 Transformational Leader Transformational leadership is alternatively referred to as “charismatic” or “visionary” leader (Wang et al., 2011). The transformational leader pays attention on things like planning, articulating the vision or goals for the firm, following-up the subordinate activities or performance, and making available the necessary support gadgets, equipment and technical assistance as may be required for the accomplishment of firm goals (Wangs et al., 2011). Thom-Otuya & Tamuno (2011) contend that transforming leader is the type that elevates, mobilises, inspires, exalts, uplifts, exhorts and evangelise. They said further that transforming leadership shows dynamism by creating a rapport with the followers who will fill elevated by it, hence nurturing new cadres of leaders. Hall, Johnson, Wysocki and Kepner (2008) from their study found that the strength of transformational leadership lies in having an effective influence on all the categories of people within the organisation and building strongly on the needs and values of the associates. On the weaknesses of transformational leadership, Hall et al. (2008) emphasised strongly that leadership is being treated virtually as a personality trait than as a behaviour that be learned, hence, the tendency of power abuse emerges.
Ardichvilli (2001) was of the view that transformational leader do not pay attention only to the current needs of
ISSN 2039-2117 (online) ISSN 2039-9340 (print)
Mediterranean Journal of Social Sciences MCSER Publishing, Rome-Italy
Vol 5 No 27 December 2014
346
employee’s but are also particular about the futuristic needs. He concluded that transformational leadership is not a replacement for transactional leadership but serves as complementary. This is supported through the works of (Avolio et al., 1988; Bass, 1990).
It has been asserted that transformational leadership crafts strategic vision; communicate that vision through framing and use of metaphor, modelling the vision to reality by “walking the talk” and putting in conscientious action as well as building commitment and dedication towards accomplishing the vision (McShane and Von Glinow, 2000; Zhu et al., 2005). Studies conducted empirically have shown that transformational leadership will lead to high levels of cohesion, commitment, trust, motivation, and performance in an organisational environment. Some of the previous empirical research and meta-analyses have shown that there is a positive relationship between individual performance, organisational performance and transformational leadership. It is also reported that there is a positive influence of transformational leadership on followers performance as well as outcomes of the firm (MacKenzie, Podsakoff and Rich, 2000; Jung and Sosik, 2002; Walumbwa, 2002; Avolio, Zhu, Koh and Puja, 2003; Zhu et al., 2005). 2.3 Leadership and Motivation Leaders and managers have an important role to play when it comes to employee’s motivation within an organisational set-up. Gangwar, Padmaja and Bhar (2013) submitted that leaders and managers inclusive can determine the employee’s motivation. They were able to establish this through the scientific analysis of empirical data that in private sector enterprises that the combination of autocratic leadership style and task-orientation behaviour leads to motivation. In public sector enterprises, paternalistic leadership style with people-orientation yields higher level of employee’s motivation.
Chaudhry and Javed (2012) used banking sector of Pakistan in their study of impact of transactional and laissez-faire leadership style on motivation concluded that transformational leader has a positive and strong association on motivation of workers within the bank.
Similarly, Al-Khasawneh and Futa (2013) used students from three public universities in the northern region of Jordan. The result of their study revealed that academic staffs working at the surveyed universities adopted democratic style of leadership to motivate the students to modify their behaviours. Chaudhry, Javed and Sabir (2012) conducted a study using all the employees of all private and public banking sector of Pakistan. The result shows that independent variables of transformational and transactional leadership have a strong and positive association on motivation. This reveals that the leadership and management within the banking sector of Pakistan plays a strong role in motivating the bank employees.
3. Methods The data for this study were collected from employees of an insurance company operating in south-west Nigeria. The collection of data from a single organisation was prompted by Byron’s (2005) suggestion that lack of homogeneity in study samples can make data interpretation problematic.
Questionnaires were hand delivered to the HR section from where they were distributed to employees. Participation in the study was boosted by management’s commitment to the exercise. Confidentiality was ensured as the employees did not state their names on the completed questionnaire. Two hundred and fifty questionnaires were distributed; of the 213 returned, 212 were usable, yielding a response rate of 84.4%.
In terms of gender, 122 (57.5%) of the respondents are male and 90 (42.5%) are female. A hundred and twenty (56.6%) are married. The average age is 31-40 years. Turning to educational qualifications, 63.7% of the respondents had a first degree, while 23.6% and 8.9% had a postgraduate degree and professional qualification, respectively. Table 1 shows that 76.4% of the respondents had 1-9 years’ work experience.

ISSN 2039-2117 (online) ISSN 2039-9340 (print)
Mediterranean Journal of Social Sciences MCSER Publishing, Rome-Italy
Vol 5 No 27 December 2014
347
Table 1: Demographic information
Frequency Percentage Gender Male 122 57.5%
Female 90 42.5% Marital Status Single 75 35.4%
Married 120 56.6% Divorced 7 3.3% Widow 5 2.4% Separated 3 1.4% Missing Item 1 0.9%
Age 20-40 151 71.2% 40-51 45 21.2% 51-above 15 7.1% Missing Item 1 0.5%
Education School Certificate 8 3.8% Undergraduate Degree 135 63.7% Post-graduate Degree 50 23.6% Professional & Other Qualifications 19 8.9%
Experience 1-5years 110 51.9% 6-9years 52 24.5% 10years-above 49 23.1% Missing Item 1 0.5%
Source: Field Survey 3.1 Measures There are two measures for this study. One was self-developed and the other was adapted from a published scale. 3.1.1 Compensation management Compensation management was measured using a self-developed scale called the Compensation Management Questionnaire Scale (CMQS) on a six-item measure requesting the participants to respond to a seven-point response scale. The items include “my salary is commensurate to the work I do”, “my salary is above those paid by similar companies in the industry” etc. Responses to this item were measured on a 7-point scale, where 7 = strongly agree and to 1 = strongly disagree. The Cronbach’s α of this scale was 0.87 which shows internal consistency reliability 3.1.2 Leadership role Leadership role was measured using the Multi-factors Leadership Questionnaire-Form 5X (MLQ-Form 5X) on a six-item measure, also asking the participants to respond to a seven-point response scale. The items are “I make others feel good and happy to be around me”, “I explain with few simple words about what we should and could do”, etc. The responses to this item were measured on a 7-point scale where 7 = strongly agree and 1 = strongly disagree. Cronbach’s α coefficient of the adapted scale was 0.80 which shows internal consistency reliability for this study. 4. Methodology 4.1 Data collection 250 questionnaires were distributed to the employees of an insurance firm in Nigeria through the Human Resources Department to all the company’s branches, including the headquarters. 213 were returned, of which 212 were useable, representing a return rate of 84.8%. The questionnaire was divided into two sections: a section on demographic information set out in table 1 and a second section covering CMQS and MLQ (Form-5X) adapted from the work of Bass and Avolio (1995) with modification.

ISSN 2039-2117 (online) ISSN 2039-9340 (print)
Mediterranean Journal of Social Sciences MCSER Publishing, Rome-Italy
Vol 5 No 27 December 2014
348
4.2 Data analysis The data collected were analysed using the Statistical Package for the Social Sciences (SPSS) version 21. Descriptive statistics were employed to describe the participants’ demographic profiles and Pearson Product Moment Correlation was engaged to test the research proposition. 5. Results 5.1 Compensation Management Compensation management is a crucial component of managing employees in order to achieve effectiveness and efficiency. It is used to motivate and retain employees and ultimately enhances the overall effectiveness of an organisation. An organisation designs its compensation structure in line with its vision, mission and strategies. Compensation management is beneficial to both parties in the employment relationship. Employers benefit from a reduced absenteeism rate. If an employee finds his/her work rewarding and is satisfied with his/her current pay and benefits, there is far less need to absent him/herself from the job. Secondly, compensation motivates employees to work harder because they are aware that when they achieve a certain goal/target, they will be rewarded or receive an increment. Thirdly, it promotes job satisfaction, reducing employees’ intention to quit. Compensation benefits employees by building self-confidence and self-esteem/self-efficacy. Employee’s remuneration also aid the achievements of leadership roles played by employee’s within an organisation because the higher the position, the higher the pay package that goes with that office or position the employee occupies. Reward schemes, etc. are a way of recognising employees’ efforts and they feel that they are valued by the organisation. When an organisation gives different assurances to employees, it put many of their fears to rest.
Table 2: Compensation Management Statement SDA DA DAS N AS A SA MEAN SD My salary is commensurate to the work I do. 28(13.3) 41(19.5) 24(11.4) 21(10.0) 35(16.7) 35(16.7) 26(12.4) 3.97 2.02 My salary is above those paid by similar companies 42(20.0) 53(25.2) 28(13.3) 36(17.2) 30(14.3) 17(8.1) 4(1.9) 3.12 1.68 My salary is enough to compensate me for my job. 32(15.2) 48(22.9) 30(14.3) 26(12.4) 37(17.6) 30(14.3) 7(3.3) 3.50 1.80 I received other payments apart from the salary. 83(39.7) 45(21.5) 20(9.6) 13(6.2) 20(9.6) 16(7.5) 12(5.7) 2.80 2.35 My salary is competitive, reasonable and is reviewed. 36(17.1) 54(25.6) 28(13.3) 42(19.9) 18(8.5) 24(11.4) 9(4.2) 3.28 1.77
My company pays salary and emoluments that are sufficient to motivate employees 43(20.4) 50(23.7) 30(14.2) 38(18.0) 25(11.8) 15(7.1) 10(4.7) 3.18 1.76
Source: Field Survey. Table 2 above shows that, a total of 93 (44.2%) disagreed with item 1 while 96 (45.8%) supported that their salary is commensurate with the work they do. In total, 123 (58.5%) of the respondents disagreed with the statement that their salary is above what is being paid in similar companies while 51(24.3%) agreed. From item 3, 110 (52.4%) completely opposed the idea that their salary is enough to compensate them for their job and a total of 74 (35.2%) supported it. Likewise, a total of 148 (70.8%) respondents disagreed that they received other payments apart from their salary while 48 (22.8%) are in agreement. My salary is competitive, reasonable and is reviewed was opposed by 118 (56.0%) and agreed to by 51 (24.2%) and lastly, a total of 123 (58.3%) respondents disagreed that their company pays salary and emoluments that are sufficient to motivate them while 50 (23.6%) of them agreed. This indicates that majority of the respondents are not satisfied with the compensation offered by the insurance company. From the mean and standard deviations, it was revealed that the perception of the participant’s compensation management in the insurance industry in Nigeria was low. 5.2 Leadership Role The critical survival of an organisation is largely anchored on the leadership that exists within the sphere of the firm. Leadership serves as the bond between the vision, strategic direction and change of the organisation. Leadership has

ISSN 2039-2117 (online) ISSN 2039-9340 (print)
Mediterranean Journal of Social Sciences MCSER Publishing, Rome-Italy
Vol 5 No 27 December 2014
349
been in existence for as long as people on earth have co-existed and it is present in all cultures (Rukmani, Ramesh & Jayakrishnan, 2010; Fibuch, 2011). In the competitive business world of today, for an organisation to have competitive advantage over her competitors, she must have a dynamic and formidable leadership within the organisation. Table 3: Leadership Roles
Statement SAD DA DAS N AS A SA MEAN SD
I make others feel good and happy to be around me. 1(0.5)
4(1.9)
2(0.9)
8(3.8)
51(24.1)
82(38.9)
63 (29.9) 5.86 1.09
I explain with few simple words about what we should and could do. 1(0.5)
7(3.3)
13(6.2)
17(8.1)
59(27.9)
75(35.5)
39 (18.5) 5.40 1.28
I recognised and rewards when others accomplished their goals/objectives.
11(5.2)
7(3.3)
7(3.3)
12(5.7)
66(31.3)
68(32.2)
40 (19.0) 5.27 1.53
I make others to perceive and think about old problems in new ways. 5(2.4)
11(5.2)
2(0.9)
34(16.2)
37(17.5)
92(43.6)
30 (14.2) 5.29 1.41
I pay serious personal attention to others who seem rejected. 4(1.9)
8(3.8)
4(1.9)
35(16.6)
55(26.1)
64(30.3)
41 (19.4) 5.30 1.37
I am okay when agreed upon standards are accomplished by others. 4(1.9)
5(2.4)
5(2.4)
17(8.1)
49(23.2)
90(42.7)
41 (19.4) 5.50 1.27
Source: Field Survey Table 3 above revealed that, a total of 7 (3.3%) of the respondents disagreed with item 1 while 196 (92.9%) supported the item. In total, 21 (10%) of the participants disagreed with the statement that I explained with few simple words about what we should and could do while 173 (82%) were in agreement. A total of 25 (11.8%) respondents disagreed that I recognised and rewards when others accomplished their goals/objectives while 174 (82.5%) agreed in totality with the statement. 18 (8.5%) of the respondents disagreed that I make others to perceive and think about old problems in new ways and 159 (75.3%) agreed completely with the statement. Also, a total of 16 (7.6%) of the respondents disagreed with that I pay serious personal attention to others who seem rejected while 160 (75.8%) agreed. Lastly, a total of 14 (6.7%) disagreed with the statement that I am okay when agreed upon standards are accomplished by others while 180 (85.3%) of them were in agreement with the statement. This indicates that majority of the respondents are satisfied with their leadership role in the insurance company. From the mean and standard deviations, it was revealed that the perception of the participant’s on their leadership role in the insurance industry in Nigeria was above average. Table 4: Pearson correlation between compensation management and leadership role of employees
N Mean Std. D R P Compensation Management 208 3.9904 2.00962
Leadership 208 5.8558 1.08942 .481 .000 Correlation is significant at the 0.05 level. p<0.05 that is, the relationship that exists between compensation management and employees leadership roles is significant.
Source: Field Survey. From Table 4 above, the correlation between compensation management and the leadership role of the employees is .481 which is significant at 0.05 level (r=.481, p <0.05).This implies that there is a significant relationship between compensation management and the leadership role of the employees in A&G Insurance Plc in Nigeria. The p-value of 0.000 is lower than .05 with correlation coefficient R=0.481. This reveals that the correlation coefficient is 0.481 or 48.1%, which gives sufficient evidence of the linear relationship between the variables. This means that there is a positive significant relationship between compensation management and the employees’ leadership roles in A&G Insurance Plc in Nigeria. This indicates that there is a relationship between compensation management and leadership role of employees. The association between compensation management and employees leadership role in insurance industry in Nigeria is a weak one.

ISSN 2039-2117 (online) ISSN 2039-9340 (print)
Mediterranean Journal of Social Sciences MCSER Publishing, Rome-Italy
Vol 5 No 27 December 2014
350
6. Conclusion The aim of this study was to assess the influence of compensation management on employee’s leadership role in the insurance industry in Nigeria, as well as its effects on organisational performance and that of the individual employees. The outcome of this study reveals that the employees are satisfied and motivated by their leadership roles in the insurance industry in Nigeria which is complimented by the remuneration that goes with the position they are holding in their organisation. This finding is in line with ealier studies by Durowoju, et al., (2011), Wang, et al., (2011), and Ogbonna and Harris (2000).
Durowoju, et al. (2011) reported that there is a clear cut relationship between some leadership styles and organizational performance which is through democratic, visionary, charismatic and transformational leadership styles that are positively related to the firm’s performance most especially financial performance and employee’s satisfaction.
Also, Wang et al., (2011) concluded that there was a direct link between the CEO’s task-focused behaviours and the firm’s performance. It was also argued that the CEO’s relationship-focused behaviours are significantly related to the employee’s attitudes and these attitudes lead to an improvement in the performance of the firm. This also shows that when employees’ are satisfied, it brings about positive increase in the firm’s performance. Also, Ogbonna and Harris (2000) carried out a study on leadership style, organisational culture and performance with empirical evidence from UK companies. However, the study reveals that there is a relationship between leadership style and performance which is moderated by the form of organisational culture that is in existence in the firm. The Pearson product moment correlation coefficient of 0.481 (48.1%) depicts a weak relationship between compensation management and leadership role of employees in insurance industry in Nigeria. The overall effect of these findings is that, there organisational commitment may be lacking, the leadership trait of the employees may not be exploited by not giving them the room to initiate good ideas that can make the organisation to enjoy competitive advantage. 7. Recommendations The following recommendations are offered as a result of the outcomes of this study:
• Insurance companies should encourage more interpersonal relationships and employees. • Insurance companies should allow the employees to play their leadership role to adequately recognise and
reward others when they accomplished their goals/objectives. • In order for the employee’s to play their leadership role effectively and efficiently, the management of
insurance companies should remunerate them adequately with the position they are holding. All these recommendations will enhance the performance of the employee’s which will translate to overall organisational performance.
8. Suggestion for Further Studies It is recommended that future studies should be comparative in nature, which is, comparing the effect of compensation management on employee’s leadership role using more companies such as banking industry with insurance industry, combining two or more insurance companies together. References Adeoye, A.O. (2001). Contemporary issues in human resources management and organisational behaviour. Lagos, Nigeria: Pumark
Publishers. Adeoye, A.O., Elegunde, A.F., Tijani, A.A & Oyedele, O.O. (2012). Salary and wages and employee motivation in Nigeria service
industry. Scottish Journal of Arts, Social Sciences and Scientific Studies, 2(2), 89-98. Al-Khasawneh, A.L. & Futa, S.M. (2013). The impact of leadership styles used by the academic staff in the Jordanian public universities
on modifying student’s behaviour: A field study in the northern region of Jordan. International Journal of Business and Management, 8(1), 1-10.
Ardichvilli, A. (2001). Leadership styles of Russian entrepreneurs and managers. Journal of Developmental Entrepreneurship, 6(2), 1-21. Avolio, B.J., Waldman, D. & Einstein, W.O. (1988). Transformational leadership in a management game simulation. Group and
Organisation Studies, 13 (March), 59-80. Avolio, B.J., Zhu, W., Koh, W. & Puja, B. (2003). Transformational leadership, psychological empowerment, organisational commitment
and leadership distance. Paper presented at the Academy of Management Annual Conference, Seattle, Washington. Bass, B. (1985). Leadership, performance beyond expectations. New York: Free Press.

ISSN 2039-2117 (online) ISSN 2039-9340 (print)
Mediterranean Journal of Social Sciences MCSER Publishing, Rome-Italy
Vol 5 No 27 December 2014
351
Bass, B.M. (1990). Bass and Stogdill’s handbook of leadership: Theory, research and managerial applications. New York: The Free Press.
Bass, B.M. & Avolio, B.J. (1993). Transformational leadership and organisational culture. Public Administration Quarterly, 17(1), 112-117.
Bommer, W.H., Rich, G.A. & Rubin, R.S. (2005). Changing attitudes about change: Longitudinal effects of transformational leader behaviour on employee cynicism about organisational change. Journal of Organisational Behaviour, 26(7), 733-753.
Bontis, N. & Serenko, A. (2007). The moderating role of human capital management practices on employees capabilities. Journal of Knowledge Management, 11(3), 31-51.
Brown, D. (2003). Reward strategies. Journal of Personnel Management, 1, 17-29. Chaudhry, A.Q. & Javed, H. (2012). Impact of transactional and laissez faire leadership on motivation. International Journal of Business
and Social Sciences, 3(7), 258-264. Chaudhry, A.Q., Javed, H. & Sabir, M. (2012). The impact of transformational and transactional leadership styles on the motivation of
employees in Pakistan. Pakisatn Economic and Social Review, 5(2), 223-231. DeCenso, D.A. & Robbins, S.P. (2007). Fundamentals of human resource management. (8th ed.). America: John Wiley and Sons
Incorporation. Durowoju, S.T., Abdul-Azeez, I.A. & Bolarinwa, S.A. (2011). Leadership styles and organisational performance in Nigeria: an empirical
analysis. Proceedings of international conference on social sciences and humanities, Port Novo, Republic of Benin, 1(4), 56-63. El-Masry, S., Kattara, H. & El-Demerdash, J. 2004. A comparative study on leadership styles adopted by general managers: a case
study of Egypt. Anatolia: An International Journal of Tourism and Hospitality Research, 15(2): 109-124. Eze, H.C. (2010). Leadership in organisation management in Nigeria. 46(1), 29-35, Jan-March. Ferrell, O. C., Hirt, G. & Ferrell, L. (2008). Business: A changing World. (6th ed.). New York: McGraw-Hill/Irwin. Fibuch, E.E. (2011). Failure of senior leadership- is this a problem in your hospital? Physician Executive, 37(2), 46-50. Gangwar, S., Padmaja, K.V. & Bhar, S. (2013). Impact of behavioural style, self orientation and task orientation of leaders on employee
motivation. International Journal of Global Business Management and Research, 1(2), 57-120. Gerhart, C. & Milkovich, G.F. (1992). Performance pay as a competitive weapon. New York: Willey. Hall, J., Johnson, S., Wysocki, A. & Kepner, K. (2008). Transformational leadership: the transformation of managers and associates.
University of Florida, IFAS Extension, Pp. 1-3. http://edis.ifas.ufl.edu/pdiffiles/HR?HR02000.pdf. (Accessed 2013:10:11). Harrison, D.A. & Liska, Z. (2008). Promoting regular exercise in occupational fitness programme. Journal of Personnel Psychology, 5(5),
27-45. Heneman, H.G. III, & Judge, T.A. (2000). Compensation attitudes. In Rynes, S.L., and Gerharts, B. (Eds.), Compensation in
organisations: current research and practice (pp. 61-203). San Francisco: Jossey-Bass Hogan, R. & Kaiser, R.B. (2005). What we know about leadership. Review of General Psychology, 9, 169-180. Hyondong, K. (2006). Strategic impacts of compensation system on organisational outcomes: an empirical study of the
conceptualisations of fit and flexibility in the compensation design. Unpublished doctoral dissertation, the Graduate School of the Ohio State University, USA.
Idemobi, E. I., Onyeizugbe, C. U., & Akpunonu, E. O. (2011). Compensation management as tool for improving organizational performance in the Public Sectors: A study of the Civil Service of Anambra State of Nigeria. Sacha Journal of Policy and Strategic Studies, 1(1), 109-120.
Iguisi, O. (2009). The cultural dynamics of management leadership in Africa: Management in Nigeria, 44(2), 6-13, April-June. Ilies, R., Judge, T. & Wagner, D. (2006). Making sense of motivational leadership: The trail from transformational leaders to motivated
followers. Journal of Leadership and Organisational Studies, 13(1), 1-22. Ivancevich, J.M. (2004). Human resource management. (9th ed.). New York: McGraw Hill. Jawahar, I.M. (2006). An investigation of potential consequences of satisfaction with appraisal feedback. Journal of Leadership and
Organisational Studies, 13(2), 14-28. Jung, D. & Sosik, J. (2002). Transformational leadership in work groups: The role of empowerment cohesiveness, and collective-efficacy
on perceived group performance. Small Group Research, 33, 313-336. Kaiser, R.B., Hogan, R. & Craig, S.B. (2008). Leadership and the fate of organisations. American Psychology, 9, 169-180. Kersley, B.A. & Forth, J. (2005). Inside the workplace: First findings from 2004 Workplace Employment Relations Survey (WERS 2004).
London: Economic and Social Research Council. Khan, R.I., Aslam, H.D. & Lodhi, I. (2011). Compensation management: A strategic conduit towards achieving employee retention and
job satisfaction in banking sector of Pakistan. International Journal of Human Resource Studies, 1(1), 89-97. MacKenzie, S., Podsakoff, P. and Rich, G. (2001). Transformational and transactional leadership and salesperson performance. Journal
of the Academy of Marketing Science, 29(2), 115-134. McShane, S.L. & Von Glinow, M.A. (2000). Organisational behaviour. Boston, MA: Irwin/McGraw-Hill. Mucinsky, P.M.; Kriek, H.J. & Schreuder, A.M.G. (1998). Personnel psychology. Goodwood: Thomson Publishing Company. Nickels, W.G., McHugh, J.M. & McHugh, S.M. 1999. Understanding business. (5th ed.). McGraw Hill Irwin, New York. Obisi, C. (2003). Organisational behaviour: Concepts and applications. Lagos: Malthouse Press Limited. Obiwuru, T.C., Okwu, A.T., Akpa, V.O. & Nwankwere, I.A. (2011). Effects of leadership style on organisational performance: A survey of
selected small-scale enterprises in Ikosi-Ketu council development area of Lagos state, Nigeria. Australian Journal of Business and Management Research, 1(7), 100-111.

ISSN 2039-2117 (online) ISSN 2039-9340 (print)
Mediterranean Journal of Social Sciences MCSER Publishing, Rome-Italy
Vol 5 No 27 December 2014
352
Ogbonna, E. & Harris, L.C. (2000). Leadership style, organisational culture and performance: Empirical evidence from UK companies. International Journal of Human Resource Management, 11(4), 766-788.
Purcell, J., Kinnie, N. & Hutchinson, S. (2003). Understanding the people and performance link: Unlocking the black box. Chartered Institute of Personnel and Development, London.
Robison, D. (1990). Civil Service Pay in Africa, International Labour Office, Geneva. Rukmani, K., Ramesh, M. & Jayakrishnan, J. (2010). Effect of leadership styles on organisational effectiveness. European Journal of
Social Sciences, 15(3), 365-370. Shea, C.M. & Howell, J.M. (1999). Charismatic leadership and task feedback: A laboratory study of their effects on self-efficacy and task
performance. Leadership Quarterly, 10(3), 375-396. Thom-Otuya, V.C. & Tamuno, M.P. (2011). Challenges of leadership and good governance for sustainable human development in
Africa. Proceedings of international conference on social sciences and humanities, Port Novo, Republic of Benin, 1(4), 7-14. Tichy, N.M. & Devenna, M.A. (1986). The transformational leader. New York: John Wiley and Sons. Tsai, C. (2005). Reward Incentive Compensation and Organizational Performance. Evidence from semi-conductor industry. Performance
and Reward Conference, Manchester U.K. Walumbwa, F.O. & Ojode, L.A. (2003). Gender stereotype and instructors’ leadership behaviour: transformational and transactional
leadership. Paper presented at the Midwest Academy of Management Annual Conference, pp 1-21, March 30-April 1 in Chicago, IL. www.sba.muohio.edu/management/mwAcademy/2000/10c.pdf (accessed 2013/10/05).
Walumbwa, O.F. (2002). The relationships between leadership styles, cultural orientation, organisational commitment, job satisfaction and perceptions of organisational withdrawal behaviours. Urbana-Champaign, Urbana, Illinois: University of Illinois. Unpublished dissertation.
Wang, H., Tsui, A.S. & Xin, K.R. (2011). CEO leadership behaviours, organisational performance, and employees’ attitudes. The Leadership Quarterly, 22, 92-105.
Weihrich, H. & Koontz, H. (1993). Management: A global perspective. NY: McGraw-Hill, Inc. Werner, S. & Ward, S.G. (2004). Recent compensation research: An eclectic review. Human Resource Management Review, 14, 201-
227. Wright, B.E., Moynihan, D.P. & Pandey, S.K. (2011). Pulling the levers: Transformational leadership, public service motivation, and
mission valence. Public Administration Review, 72(2), 206-215. Yukl, G.A. (2002). Leadership in organisations. New Jersey: Prentice Hall, Upper Saddle. Yusuf, T.M. (1984). The dynamics of industrial relations: The Nigerian Experience. Ibadan: University Press Ltd. Zhu, W., Chew, Irene K.H., & Spangler, W.D. (2005). CEO transformational leadership and organisational outcomes: The mediating role
of human-capital-enhancing human resource management. The Leadership Quarterly, 16, 39-52.

ISSN 2039-2117 (online) ISSN 2039-9340 (print)
Mediterranean Journal of Social Sciences MCSER Publishing, Rome-Italy
Vol 5 No 27 December 2014
88
Compensation Management and Motivation:
Cooking utensils for Organisational Performance
Abayomi Olarewaju Adeoye
Department of Business Administration, Faculty of Management Sciences Lagos State University, Ojo, Lagos, Nigeria
Ayobami Folarin Elegunde
Department of Business Administration, Faculty of Management Sciences Lagos State University, Ojo, Lagos, Nigeria
Doi:10.5901/mjss.2014.v5n27p88 Abstract
The achievement of organisational performance is essential for sustainability and continuous existence of the organisation. Obviously, this is a function of employees that are well remunerated and motivated, thus, it is contingent that compensation management and employees motivation should be aligned with the vision, mission and objectives of the organisation. In doing this, the attainment of organisational performance becomes an easy task and it will also reduce the antecedent negative impact of absenteeism, labour turnover, industrial unrest and non-commitment attitude of the employees. Efficient and adequate compensation management and employees motivation will improve organisational productivity and image of the organisation. In order to attract, hire and retain skilful employees that will ensure the achievement of organisational performance, it is therefore; recommended that there should be a periodical review of compensation package. It is against the backdrop of the import of compensation and motivation as cooking utensils for organisational performance that this addressed.
Keywords: Compensation management, Employees, Motivation, Organisation, Performance
1. Introduction In the global world of today, for any organisation to have competitive edge amidst her competitors, there must be in place a formidable compensation strategy to attract, motivate people to join the firm. This should also reduce the turnover intent from the employees.
The need for organizations to develop a programme that will facilitate a performance-enhancing system leading to the best management and development of employees and thus increase their competitive advantage has made the links between human resource management and organisational performance a prominent issue in the field of human resource management across the core functional areas of human resource practices. These practices range from staffing, performance appraisals, training and development, manpower planning, workers management participation and compensation management. Notably, the relationship between compensation management and performance has been visible in the management literature. It is generally believed that if there is proper management of compensation, individuals can be motivated to perform and thus have a resultant positive effect on the organisational performance (Tsai, 2005)
Compensation management is a global phenomenon that determines the hiring and retention of employees to attain the objectives of an organisation as well as that of an individual employee which is also used as a means of control and is the basis of involvement of individuals (Greckhamer, 2011; Xavier, 2014). Cox, Brown and Reilly (2010) found that the North American reward strategy has greatly influenced the reward system in many parts of Europe especially UK. Nigeria being part of the global world, compensation management also plays a vital role in motivating employees to work harder in order to accomplish the set goals of the organisation (Idemobi et al., 2011; Odunlade, 2012)
Motivations as a phenomenon in human resource management and contemporary management have been widely research into (Kelly, 2009; Ahlstrom & Bruton, 2010; Seiler et al, 2011). Motivation is that propeller that energises behaviour, gives attitudinal direction and underlies the continuous persistence even when an individual employee faces

ISSN 2039-2117 (online) ISSN 2039-9340 (print)
Mediterranean Journal of Social Sciences MCSER Publishing, Rome-Italy
Vol 5 No 27 December 2014
89
one or more challenges (Grobler et al., 2011; Mathis and Jackson, 2011; Brevis and Vrba, 2014). 2. Compensation Management Various definitions have been given on compensation. Literally, compensation is a form of reward given as a result of a job that has been done or effort put in to achieve a set goal and as such this serves as a motivational factor that encourages an individual to put more energy or commitment into his or her job (Armache, 2012; Ederer and Manso, 2013; Qureshi, 2013). In most organisations, the main aim of compensation is to motivate the behaviour of the employee in a particular way. Hence, an organisation not only desires to motivate employees to stay within the organisation, but reinforces employee’s performance through adequate and encouraging compensation. The three major elements in motivation have been stated as that: which is important to a person, offering it as an exchange, and the desired behaviour (Milkovich & Newman, 1999, Riddell, 2011, Shaw, 2014).
Hills et al., (1994: 11) on one hand define compensation ‘as the total sum of wage or salary, employee benefits, non-recurring financial rewards and non-pecuniary rewards’. While Milkovich et al., (2011: 10) on the other hand define compensation as ‘all forms of financial returns on tangible services and benefits employees receive as part of an employment relationship’.
Martocchio (2004: 2) argues that ‘compensation represents both the intrinsic and extrinsic rewards employees receive for performing their jobs. Intrinsic compensation reflects employees psychological mind sets that result from performing their jobs whilst extrinsic compensation includes both monetary and non-monetary rewards’.
Worldatwork (2007: 7) is of the view that compensation is a ‘pay provided by an employer to an employee for services rendered (that is, time, effort, and skill). It includes both fixed and variable pay tied to levels of performance’ whereas Carrell (1998: 370) states that ‘compensation is what employees receive in exchange for their contribution to the organisation’. It is notable therefore that ‘compensation is tied to performance’.
Compensation or reward management aims at the formulation and implementation of strategies and policies that are aimed at rewarding people fairly, equitably and consistently in accordance with their value to the organisation (Brauns, 2013; Karami, Dolatabadi & Rajaeepour, 2013; Pingle, 2014). It deals with the design, implementation and maintenance of reward practices that are geared towards the improvement of organisational, team, and individual performance (Dauda, 2010; Abolade, 2012). Compensation management is an integral part of an human resource management approach to managing people, and as such it supports the achievement of the business strategy and is concerned with developing a positive employment relationship and psychological contract, to address longer term issues relating to how people should be valued for what they do and what they achieve (Sisson, 2010; Musenze, Thomas, Stella & Muhammadi, 2013). It embraces both financial and non-financial rewards, and thus all these need to be taken into account and integrated in order to maximise the effectiveness of reward policies and practices (Armstrong, 2003). Compensation management connotes putting in place a fair compensation structure where employees are rewarded for their efforts (Hewitt, 2009). This serves as a source of encouragement to top and great performers to put in more effort and work harder so that jointly they may help in building a robust and highly competitive atmosphere in the organisation (Hewitt, 2009). 2.1 Characteristics of compensation Muchinsky et al., (1998: 227) list the major characteristics of compensation as follows:
• It enhances improvement of both individual and organisational performance. • It encourages value-added performance. • It gives room for flexibility by helping to achieve the most efficient wage of human resources within the
organisation. • It provides managers with a support base. • It facilitates organisational strategic objectives. • It motivates employees. • It makes the labour market more competitive by attracting and retaining highly skilled and quality people. • It gives room for fair play and equity. • It offers value for money. • It encourages teamwork (Martocchio, 2006: 18-23) Milkovich et al., (2011: 15-18) highlight certain objectives of compensation as follows:

ISSN 2039-2117 (online) ISSN 2039-9340 (print)
Mediterranean Journal of Social Sciences MCSER Publishing, Rome-Italy
Vol 5 No 27 December 2014
90
• It creates room for efficiency in terms of improving performance, increasing quality, delighting customers and stockholders:-
• Controlling labour costs. • Compliance. • Ethics (Grobler et al., 2011; Mathis & Jackson, 2011).
2.2 Types of compensation There are various forms of compensation and nearly all these forms of compensation can be categorised into four broad types (Muchinsky et al; 1998: 226). The four broad types are:
Wages and Salary: Wages are what is paid to employees who are not permanently employed and typically pertains to hourly rates of pay (the more hours worked, the greater the pay), while salary is what is paid to people that are permanently employed and this is at a fixed weekly, monthly, or annual rate of pay.
Incentive Plans: This is an additional compensation which is above and beyond the employees wage or salary provided. It may be long term or short term in nature.
Employee Benefit Programmes: Time off with pay, pension scheme, tuition reimbursement, recreation activities, cafeteria services are all examples of employee benefit programmes.
Additional Privileges: Employees in organisations may have other privileges such as the usage of company vehicles/cars, club membership or travelling allowance. These privileges may be a substantial part of compensation, especially for the executives. 2.3 Objectives of compensation management The main objectives of the compensation function are to create a system of rewards that is equitable and acceptable to both parties in employment relationship. The resultant outcome of compensation is an employee who is attracted to the work and motivated to do a good job for the employer. Ivancevich (2004: 298) and Nickels et al (1999: 331) highlight the objectives of compensation as follows:
Attract: Attracting the right kind of people in terms of qualification and experience as required by the organization and in sufficient numbers.
Equitable: Each person should be treated fairly as regards the amount paid in line with his or her effort, abilities, skills and training acquired.
Balanced: Pay, benefits and other rewards should provide a reasonable total reward package. Security: Providing employees with some sense of financial security through insurance and retirement scheme. Cost Effective: The pay should not be excessive, considering what the organization can afford to pay. Incentive-Providing: The pay should provide incentives that will motivate effectively, efficiently and productively at
work. Retention: The pay should be able to keep valued employees from leaving and going to competitors or starting
competing firms. Competitive Position: The pay should maintain a competitive advantage in the market place by keeping costs low
through high productivity from a satisfied workforce. 3. Motivation The word motivation means different things to different people and it was coined out of a Latin word ‘‘movere’’ which means to move or change a thing (Adeoye, 2001). Mathauer and Imhoff (2006: 3) define motivation as ‘‘the willingness to exert and maintain an effort towards organisational goals’’. Adeoye (2001: 46) argues that ‘‘motivation is an inducement to arouse the interest of an employee to achieve a set up goal of an organisation’’. Alstrom & Bruton (2010: 200) are of the view that motivation is ‘‘the driving force behind an individual’s actions that energizes and directs goal-oriented behaviour’’.
Malik (2010) assert that motivation is always viewed as making somebody to take action to execute something with the prompt that he/she wants to do it. The assumption before was that motivation has to be from outside but the perception now is that motivation arises because of several different forces or reasons. According to Malik (2010) motivation is an assignment that must be undertaken by managers to get the best result from their subordinates. This

ISSN 2039-2117 (online) ISSN 2039-9340 (print)
Mediterranean Journal of Social Sciences MCSER Publishing, Rome-Italy
Vol 5 No 27 December 2014
91
covers possession of communication skill, leading by example, which is like mentoring the junior ones, in facing difficult challenges. It is also to serve as an encouragement, giving necessary feedback, and to be involved, delegate, educate, train and develop the subordinate, towards being properly informed, and to brief and provide adequate and just remuneration. Malik (2010) concluded by defining motivation “as an inner force that drives individuals to accomplish personal and organisational goals”. It is further argued by Malik (2010), Abdullah and Islam (2012) and Cong, Van and Huu (2013) that individuals have problems enunciating in a consistent manner what they are particularly good at in a job. Hence, most employers of labour have conscientiously ignored what the individuals are saying as regard what they want. Rather they tell the employees’ what they are expecting from them, based on what the managers understand about the worker’s need at any particular period or circumstance. Most often, the employer’s decisions have been anchored on Maslow’s hierarchical needs including the factor of proficiency (Islam & Ahmed, 2014). As a person grows with an organisation, his employer makes available opportunities to meet the higher needs on Maslow’s pyramid. Maslow’s findings suggest that one of the key factors that motivate employees to higher productivity includes living in a safe area as well as receiving good pay (O’Connor & Yballe, 2007). Maslow also makes some recommendations to the effect that reward structures should include job enlargement, job enrichment, promotions, monetary, and non-monetary compensation (Brevis & Vrba, 2014).
Kulkarni (2011) argues that motivating an employee is always a challenge to the employer of labour. It is argued knowing the level of dedication and commitment of an employee to the organisation, division or team, depends largely on the individual involved. However, the relationship between motivation and job or organisational performance and job satisfaction cannot be underestimated. Kulkarni (2011) asserts that motivation is an attempt to operate organisational conditions, which gingers the employee’s emotion into an action that makes him or her work toward the attainment of organisational goals. The main objective of motivation is to fashion out conditions upon which people have the willingness and conviction to work with zeal, initiative, interest and eagerness to work without being monitored or supervised (Hewitt, 2009; Wininger & Norman, 2010). In this regard, motivation is geared towards achieving group morale, satisfaction with a sense of responsibility, loyalty, discipline, and pride with total confidence in such a consistent manner so that the goals of the organisation or firm are realisable in an efficient and effective way (Bob, 2011). In the study titled “revisiting Maslow the “IT” way-a case study’’. Kulkarni (2011) reveals that the safety and social needs, which are part of the need levels identified by Maslow, are more important to the employees of the IT industry in India than the esteem and self-actualisation needs. This was corroborated by the work of Mawoli and Babandako (2011) that the academic staffs of Ibrahim Badamasi Babangida University, Lapai, Niger State in Nigeria are highly motivated and contented with the working environment, which is about the safety nature of their job.
Živković (2013), in his work on management of occupational safety by motivating employees to work safely, while quoting from Mawoli and Babandako (2011) defines “motivation as a psychological process that causes the arousal, direction, intensity and persistence of behaviour. The potency of motivation in the physical working environment has great value in the performance of employees (Iguisi, 2009, Živković, 2013). In motivating for occupational safety, it is of great necessity for the employees to use safety measures in their position, and those measures must be current, sufficient and adequate to avert danger and harm (Živković, 2010). Furthermore, one of the essential factors for applying occupational safety measures as workers’ motivation for this particular area is to reduce occupational accident, which is the motivation for constant respect of the rights and responsibilities they have in the area of safety (Todorović & Živković, 2010). Employees’ motivation is just a segment in human resource management development strategy (Ukandu & Ukpere, 2011). 3.1 Types of motivation Financial motivation: Financial motivation is said to be direct or indirect. Direct financial motivation comprises the pay an employee receives in the form of wages, salaries, bonuses or commissions while indirect financial motivation consists of all financial motivation or rewards that are not included in direct financial motivation such as vacation, child care or elder care, and various kinds of insurance (Invancevich, 2004: 298).
Non-Financial motivation: Non-financial motivation is a kind of motivation that does not involve monetary terms like praise, responsibility, self-esteem and recognition which affects the motivation and productivity of an employee (Ivancevich, 2004: 298). It is not enough to motivate workers with money alone but could be combined with non-monetary incentives such as recognition to enhance greater productivity (Willis-Shattuck, Bidwell, Thomas, Wyness, Blaauw and Ditlopo, 2008; Mattson, Torbiöm & Hellgren, 2014). Similarly, Chandler, Chonya, Mtei, Reyburn and Whitty (2009) opine that social status expectations, working environments and relationships between different cadres at workplace as non-financial motivators goes a long way to ginger workers toward higher performance.

ISSN 2039-2117 (online) ISSN 2039-9340 (print)
Mediterranean Journal of Social Sciences MCSER Publishing, Rome-Italy
Vol 5 No 27 December 2014
92
Intrinsic motivation: This simply means doing an activity for the sake of doing that activity which denotes that the activity is interesting, engaging and brings satisfaction. For instance, the acceptability of internet-based learning medium by students is basically based on perceived enjoyment for their intention to use the new learning medium (Lee, Cheung and Chen, 2005). This could also be engaged in the Nigerian insurance industry to boost the performance of their employees by sending them on computer training. In the same vein, intrinsic motivation could be derived through knowledge sharing. Employees get fulfilled by enhancing their knowledge self-efficacy or assurance in their effort by providing useful knowledge to the firm to broaden the performance of the firm as well as their own performance (Lin, 2007; Cruz, Pérez and Cantero, 2009).
Extrinsic motivation: Extrinsic motivation is a means to satisfy indirect needs or something given by someone else as recognition for good work done, for example, pay increases, praise and promotion. These are motivation that is anchored on the achievement of a desired goal or some other kind of external remuneration such as money or awards (Walker, Greene and Mansell, 2006). Lin (2007) was of the opinion that extrinsic motivation centers on the goal-driven reasons such as recompenses or remunerations gotten when executing a duty. He submitted that the combination of both intrinsic and extrinsic motivation affects individual intentions concerning an activity as well as their real attitude. This view was supported by the study done by Kim, Shim and Ahn (2011) that extrinsic motivation deals with behaviours that are engaged in response to activities that is apart from its own sake, such as payments or recognition or the dictates of other people. This is relevant to this study in the sense that without team work, the expected performance may not be achieved.
3.2 What motivates or energies employees Notably, human resources is the greatest asset that any organisation can have to achieve the goals and objectives of the organisation as well as enjoying competitive advantage in the industry in which the organisation is operating. To accomplish this, there is a need for motivation, hence, ‘managers must motivate employees and understand how to get the best from the employees every-day of the week. Motivation is the world’s greatest management principle, it is in light of this that understanding what motivates the employees, getting creative with rewards, and recognition as well as putting together a system of low-cost rewards is crucial (Nelson & Economy, 2005: 59).
Nelson and Economy (2005: 62-66) argue that managers should not believe that the only thing that their employees want is money but suggest that managers can develop and maintain motivated, energised employees with little or no cost. This according to Nelson and Economy (2005) is a function of how employees are treated on a daily basis. They argue that manager can do the following to energise the employees.
Praise: This is a form of saying thank you to the employees by their manager not verbally alone but through writing e-mail, and short message services (sms). It is contended that taking time to say you recognise them, makes the employees to do more than they would normally do (Corpus & Lepper, 2007; Grant & Gino, 2010; Mumm & Mutlu, 2011).
Support and involvement: Managers should support their employees by providing them with needed information regarding their job and allow them to be involved in decision-making processes, by seeking their opinion and ideas in respect of the job they do and equally support them when they make mistakes in the course of carrying out their daily or routine duties (Marinak & Gambrell, 2008; Prebensen, Woo, Chen & Uysal, 2012).
Autonomy and authority: In most cases, employees are of the view that they should be allowed to do their job in the best way they could, that is, making them to do their duties independently and allow them to have authority over the job by giving them a choice of assignment whenever it is possible. They should be given opportunities of having autonomy and authority to get their job done and the ability to spend or allocate resources, thus making decisions and manage others (João, Calheiros & Barata, 2012; Cooman, Stynen, Van den Broeck, Sels & De Witte, 2013).
Flexible working hours: Time is a precious thing to the employees and it is the new money for today’s employees who expect work to be integrated into their life and not consume their entire lives. It is employee desire to have more time with their families; managers should be sensitive to the free time of their employees irrespective of how it is being spent, for example, with their families, church activities, leisure and so on. Thus, managers should be more flexible in using time (McNall, Masuda & Nicklin, 2010; Van den Broeck, De Witte, Vansteenkiste, Germeys & Schaufeli, 2011).
Learning and development: Employees cherish the opportunities in which they can acquire new knowledge and skills that broaden their horizon regarding the job and that enhances their worth and marketability in their current job as well as future positions. Thus, managers should support employees to learn new ideas, skills and acquire more knowledge relating to their job by discussing career options with them (Egan, Yang & Bartlett, 2004; Tabassi & Abu Bakar, 2009; De Rljdt, Stes, van der Vleuten & Dochy, 2013; Hung, Lai & Chang, 2011).
Manager availability and time: It is recommended that managers spend more time with their employees out of
ISSN 2039-2117 (online) ISSN 2039-9340 (print)
Mediterranean Journal of Social Sciences MCSER Publishing, Rome-Italy
Vol 5 No 27 December 2014
93
their busy schedule as this adds value to the employees and inspire them to do more. This then serves as a practical purpose of learning and communication, answering questions, discussing possibilities, or just listening to an employee’s ideas, concerns and opinions (Collings & Mellahi, 2009; Jacobsen, Hvitved & Andersen, 2013).
Malik (2010) argues that there are other factors that are neither financial nor monetary in nature that motivate employees to do their best in terms of achieving the set goals of the organisation. These motivational factors are rated according to the level of their importance to the employees of the university where the research was conducted. These motivational factors are living in a safe area, good salary, promotion and growth within the organisation, interesting work, conducive working condition cum environment, sympathetic help with personal problems, appreciation of work done and finally, personal loyalty to employees which is also known as organisational commitment (Abdullah & Islam, 2012; Fagley & Alder, 2012).
Gupta and Tayal (2013) through their empirical work on the impact of competing forces of motivational factors at work place established that the desire for position, power, and security were highly ranked factors that motivate male workers’ to produce more. On the other hand, for the female sets, the need for security, achievement, working conditions and appreciated by management were the motivating factors for them. 3.3 Characteristics of motivation For motivation to be effective and accomplish the main aim of it in an organisation, it is therefore imperative that it must possess some characteristics and these characteristics includes the following: -
Enhancing high productivity performance: motivation is put in place to increase the level of productivity within the organisation so that the competitive advantage of the firm is realisable within a short frame of time.
Boosting the morale of the employees: motivation is also provided for within the firm to serve as an encouragement to the employees so that they would do their best by being devoted, dedicated and committed to the set-up goals of the organisation.
Enhancing career development among employees: motivation is set up to serve as an enhancement to the career development of employees and this becomes achievable through the organised programmes that are being sponsored by the organisation in the form of training like on-the-job training, off-the-job training, just-in-time and train the trainers technique. The development programmes are an enhancement to career development for those employees in the executive cadre by sending them to conferences, seminars, simulation, brain storming, and role playing development programmes.
Enhancing self-determination through employee contribution to teamwork within the organisation: motivation is equally structured for each employee to determine for himself or herself what he or she is going to contribute in the section where they work or serve within the organisation and this is done through team spirit or what is referred to in management as “enspirit de corps”.
Integrating the organisations strategy with the organisation’s mission, vision and objectives: the integration of the mission, vision, and objectives alongside with the organisation’s strategy goes a long way in motivating the employees because they have an understanding of what the organisation’s strategy is all about, what the vision, mission and objectives are all about and also in terms of being a leader in the industry, working towards customer satisfaction, protecting the interest of the shareholders as well as those of the employees. 4. Organisation Organisation as a word describes the identity of a group or firm. Organisation could be an age group within a community, civil society, unions or a business entity. Daft (2007: 10) define organisations ‘‘as social entities that are goal-directed, designed as deliberately structured and coordinated activity systems and are linked to the external environment.’’
Robbins (2005: 4-5) argues that ‘‘organisation is a consciously coordinated social unit composed of two or more people, and that functions on a relatively continuous basis to achieve a common goal or set of goals’’.
Schermerhorn, Hunt & Osborn, (2008: 8), Robbins and DeCenzo (2008: 4) assert that an organisation is the arrangement of people in organised form for achieving a desired goal. It could be concluded that organisations are established for the achievement of a certain goal by using people and such organisations include manufacturing and service industries, social clubs, schools, hospitals, military units, to mention but a few.

ISSN 2039-2117 (online) ISSN 2039-9340 (print)
Mediterranean Journal of Social Sciences MCSER Publishing, Rome-Italy
Vol 5 No 27 December 2014
94
4.1 Organisational performance Organisational performance is a paramount thing to the business owners either it is a manufacturing or service rendering organisations as in the case of this study dealing with insurance services. The necessity of getting to know the wellbeing of an organisation in terms of performance is evident today in the global markets. This is done to attract future investment, increase the share value and attract high calibre employees within the competitive environment (Kagioglou et al. 2001: 86; Katou & Budhwar, 2006). Traditionally, OP has been looked into through the financial indicators alone and these are the subject of interest to the owners of the business and such include return on investment (ROI), earnings per share (EPS), earnings before tax (EBIT), sales or revenue, profit. Kohlbacher and Gruenwald (2011) carried out an empirical study on firm performance in Austrian Corporations operating in the metal and machinery industry by interviewing 152 organisations. They use two constructs namely process performance measurement and the process owner role. They found that improvement on firm performance can be achieved through both concepts.
Similarly, Vukšić, Bach and Popovič (2013) opined that firm performance can be strengthened through business process management and business intelligence systems. They concluded that there is no strong commitment to adopt both systems to accomplish greater performance management. In the Nigerian context, this has been lacking. In the private sector, which is the focus of this study, business owners are only interested in how much that comes in and not minding how the firm performs (Odusami, Iyagba and Omirin, 2003; Ehikioya, 2009). This has been the bane of most private businesses in Nigeria. Firm performance is an issue that emerges from the layout and execution of the human resource management policy for an organisation. The essence of an investment by any firm is to improve skills, knowledge and employees capacity with an expectation that the employees will increase productivity in the future (Shieh, 2008; Huang & Lien, 2012).
4.2 Relationship between compensation management, motivation and organisational performance There is congruence between compensation management, motivation and organisational performance that are the three major construct of this study. This is to say that the three variables are highly related. Stringer, Didham and Theivananthampillai (2011) in their study about motivation, pay satisfaction and job satisfaction at the retailer that uses a pay-for-performance plan for front-line employees in Australasia found that motivation is positively related to pay satisfaction which in turn enhances the outcome of the organisation. It was further stressed that the qualitative insights shows a degree of importance of pay fairness through the comparisons made with others by the respondents. The respondents shared the belief that what they are receiving does not compliment their effort.
Similarly, Ghazanfar, Chuanmin, Khan and Bashir (2011) found through their study conducted on managerial cadre employees of the sales departments of the cellular service providers in Lahore, Pakistan that there is a strong rapport between compensation and work motivation that leads to satisfaction on the job which in turn has a bear on the performance of the organisation. Likewise, there is strong linkage that exists between compensation management and motivation of employees. This was asserted by Khan and Mufti (2012) through their research on effect of compensation on motivating employees in public and private banks of Peshawar (Bank of Khyber Ltd and United Bank Limited). It was revealed that employees are not motivated because of their skills nor when they are informed that they would be rewarded rather they are motivated if the reward is on something they value. This also is having a significant impact on organisational performance.
Armache (2012) studied the effect of compensation and other motivational techniques on organisational productivity and found that there is a corollary effect on organisational performance when employees are well compensated and highly motivated. Ude and Coker (2012) found that incentive schemes impacts highly on employees motivation and productivity in both the organised private sector and public sector organisations in Nigeria. 5. Conclusion and Recommendation Compensation management and motivation has been observed by scholars and enunciated to be very fundamental to an organisation and in enhancing its performance. For an organisation to stand a test of time and to enjoy competitive advantage in a competing environment, effective compensation strategy and for motivational factors must be put in place to attract, retain and develop skilful employees that will be dedicated, committed and endeared to the achievement of the organisational set goals. Compensation management and motivation as a veritable instrument in the hand of managers can be adopted to reduce absenteeism, labour turnover, industrial unrest and so on within the organisation thus improvement on organisational performance and employees performance is guaranteed that lead to competitive

ISSN 2039-2117 (online) ISSN 2039-9340 (print)
Mediterranean Journal of Social Sciences MCSER Publishing, Rome-Italy
Vol 5 No 27 December 2014
95
advantage. However, for any organisation to enjoy sustainability and remain on top, adequate remuneration and motivational
process must be entrenched to the philosophy of the organisation that will be of great interest to both the employees and the organisation. This can be achieved through periodical review of the remuneration package by the organisation.
References
Abolade, D.A. (2012). Impact of unionisation and non-unionisation of workers on organisational efficiency in work organisations in south-western Nigeria. Economic Insight-Trends and Challenges, 64(2), 19-29.
Abdullah, A.M.B. & Islam, R. (2012). Employee motivational factors: A comparison between Malaysia and Sultanate of Oman. Journal of Global Business Advancement, 5(4), 285-306.
Adeoye, A.O. (2001). Contemporary issues in human resources management and organisational behaviour. Lagos, Nigeria: Pumark Publishers.
Ahlstrom, D. & Bruton, G.D. (2010). International Management: Strategy and Culture in the Emerging World, London: South-Western, Cengage Learning, EMEA.
Armache, J. (2012). Effect of compensation and other motivational techniques on organisational performance. Franklin Business and Law Journal, March (1), 88-96.
Armstrong, M. (2003). A handbook of human resource management practice. 9th Ed., Great Britain: Cambrian Printers Ltd., Aberystwyth, Wales.
Bob, N. (2011). Making employees suggestions count. Journal of Personnel Management, 17, 20-41. Brauns, M. (2013). Aligning strategic human resources management to human resources, performance and reward. International
Business and Economic Research Journal, 12(11), 1405-1410. Brevis, T. & Vrba, M. (2014). Contemporary management principles. South Africa: Juta and Company Ltd. Carrell, M.R. (1998). Human resource management in South Africa. South Africa: Prentice Hall. Chandler, C.I.R., Chonya, S., Mtei, F., Reyburn, H., & Whitty, C.J.M. (2009). Motivation, money and respect: A mixed –method study of
Tanzanian non-physician clinicians. Social Science and Medicine, 68(11), 2078-2088. http://dx.doi.org/10.1016/ j.socscimed.2009.03.007
Collings, D.G. & Mellahi, K. (2009). Strategic talent management: A review and research agenda. Human Resource Management Review, 19(4), 304-313.
Cong, N.N., Van, D.N., & Huu, T.H. (2013). Effects of motivation on employees’ performance at Petrovietnam Nghe An Construction Joint Stock Corporation. American Journal of Business and Management, 2(2), 160-164.
Cooman, R.D., Stynen, D., Van den Broeck, A., Sels, L., & De Wittle, H. (2013). How job characteristics relate to need satisfaction and autonomous motivation: Implications for work effort. Journal of Applied Psychology, 43(6), 1342-1352.
Corpus, J.H. & Lepper, M.R. (2007). The effects of person versus performance praise on children’s motivation: Gender and age as moderating factors. Educational Psychology, 27(4), 487-508.
Cox, A., Brown, D., & Reilly, P. (2010). Reward strategy: Time for a more realistic reconceptualisation and reinterpretation. Thunderbird International Business Review, 52(3), 249-260.
Cruz, N.M., Pérez, V.M., & Cantero, C.T. (2009). The influence of employee motivation on knowledge transfer. Journal of Knowledge Management, 13(6), 478-490.
Daft, R.L. (2007). Understanding the Theory and Design of Organisations, International Student Ed., USA: Thomson, South-Western. Dauda, Y.A. (2010). Technological innovation and organisational performance: Employee relations strategies. Nigerian Journal of
Industrial Relations, (NIRA) 11, 96-110. De Rljdt, C., Stes, A., Van der Vleuten, C., & Dochy, F. (2013). Influencing variables and moderators of transfer of learning to the
workplace within the area of staff development in high education: research review. Educational Research Review, 8, 48-74. Ederer, F. & Manso, G. (2013). Is pay for performance detrimental to innovation? Management Science, 59(7), 1496-1513. Egan, M.; Yang, B., & Bartlett, K.R. (2004). The effects of organisational learning culture and job satisfaction on motivation to transfer
learning and turnover intention. Human Resource Development Quarterly, 15(3), 279-30. Ehikioya, B.I. (2009). Corporate governance structure and firm performance in developing economies: Evidence from Nigeria. Corporate Governance, 9(3), 231-243. Fagley, N.S. & Alder, M.G. (2012). Appreciation: A spiritual path to finding value and meaning in the workplace. Journal of Management,
Spirituality and Religion, 9(2), 167-187. Ghazanfar, F., Chuanmin, S., Khan, M.M., & Bashir, M. (2011). A study of relationship between satisfaction with compensation and work
motivation. International Journal of Business and Social Sciences, 2(1), 120-131. Grant, A.M. & Gino, F. (2010). A little thanks goes a long way: Explaining why gratitude expressions motivate prosocial behaviour.
Journal of Personality and Social Psychology, 98(6), 946-955. Greckhamer, T. (2011). Cross-cultural differences in compensation level and inequality across occupations: A set-theoretical analysis.
Organisation Studies, 32(1), 85-115. Grobler, P.A., Wärnich, S., Carrell, M.R., Elbert, N.F., & Hatfield, R.D. (2011). Human resource management in South Africa. 4th ed., UK:
Cengage Learning EMEA. Gupta, A, & Tayal, T. (2013). Impact of competing force of motivational factors on employees at work place. Information and Knowledge
Management, 3(5), 143-148.

ISSN 2039-2117 (online) ISSN 2039-9340 (print)
Mediterranean Journal of Social Sciences MCSER Publishing, Rome-Italy
Vol 5 No 27 December 2014
96
Hewitt, A. (2009). Managing performance with incentive pay. Journal of Personnel Management, 7(1), 20-31. Hills, P.S.; Bergmann, T.J., & Scarpello, V.G. (1994). Compensation decision making, 2nd Ed., New York: The Dryden Press. Hung, S.Y., Lai, H.M., & Chang, W.W. (2011). Knowledge-sharing motivations affecting R&D employees’ acceptance of electronic
knowledge repository. Behaviour and Informantion Technology, 30(2), 213-230. Huang, C.F. & Lien, H.C. (2012). An empirical analysis of the influences of corporate social responsibility on organisational performance
of Taiwan’s construction industry: Using corporate image as a mediator. Construction Management and Economics, 30, 263-275. Idemobi, E. I., Onyeizugbe, C. U., & Akpunonu, E. O. (2011). Compensation management as tool for improving organisational
performance in the Public Sectors: A study of the Civil Service of Anambra State of Nigeria. Sacha Journal of Policy and Strategic Studies 1(1), 109-120.
Iguisi, O. (2009). The cultural dynamics of management leadership in Africa: Management in Nigeria, 44(2), 6-13, April-June. Islam, R. & Ahmed, S. (2014). Do managers and employees perceive motivating factors differently in Malaysia? International Journal of
Business and System Research, 8(1), 72-90. Ivancevich, J.M. (2004). Human resource management. 9th Ed., New York: McGraw Hill. Jacobsen, C.B., Hvitved, J., & Andersen, L.B. (2013). Command and motivation: How the perception of external interventions relates to
intrinsic motivation and public service motivation. Public Administration, 1-17. DOI:10.1111/padm.12024 (Accessed 2014/04/25). João, G., Calheiros, M.M., & Barata, M.C. (2013). Authority in the classroom: adolescent autonomy, autonomy support, and teacher’s
legitimacy. European Journal of Psychology of Education, 28, 1065-1076. Kagioglou, M., Cooper, R., & Aouad, G. (2001). Performance management in construction: A conceptual framework. Construction
Management and Economics, 19, 85-95. Karami, A., Dolatabadi, H.R., & Rajaeepour, S. (2013). Analysing the effectiveness of reward management system on employee
performance through the mediating role of employee motivation case study: Isfahan Regional Electric Company. International Journal of Academic Research in Business and Social Sciences, 3(9), 327-338.
Katou, A.A. & Budhwar, P. S. (2006). Human resource management systems and organisational performance is a test of mediating model in the Greek manufacturing context. International Journal of Human Resource Management, 17(7), 1223 – 1253.
Kelly, P. (2009). International business and management, London: South-Western, Cengage Learning, EMEA. Khan, W. & Mufti, O. (2012). Effect of compensation on motivating employees in public and private banks of Peshawar (BOK and UBL).
Journal of Basic and Applied Scientific Research, 2(5), 4616-4623. Kim, J.Y., Shim, J.P., & Ahn, K.M. (2011). Social networking service: Motivation, pleasure, and behaviour intention to use. Journal of
Computer Information System, Summer, 92-101. Kohlbacher, M. & Gruenwald, S. (2011). Process ownership, process performance management and firm performance. International
Journal of Productivity and Performance Management, 60(7), 709-720. Kulkarni, M. (2011). Revisiting Maslow the “IT” way: a case study. International Conference on Management (ICM 2011) proceedings,
48-57. Lee, M.K.O., Cheung, C.M.K., & Chen, Z. (2005). Acceptance of internet-based learning medium: The role of extrinsic and intrinsic
motivation. Journal of Information and Management, 42(8), 1095-1104. Lin, H.F. (2007). Effects of extrinsic and intrinsic motivation on employee knowledge sharing intentions. Journal of Information Science,
33(2), 135-149. Malik, N. (2010). A study on motivational factors of the faculty members at University of Balochistan. Serbian Journal of Management,
5(1), 143-149. Marinak, B.A. & Gambrell, L.B. (2008). Intrinsic motivation and rewards: What sustains young children’s engagement with text? Literacy
Research and Instruction, 47(1), 9-26. Martocchio, J.J. (2004). Strategic compensation: A human resource management approach, 3rd ed., Upper Saddle River, New Jersey:
Pearson, Prentice Hall. Martocchio, J.J. (2006). Strategic compensation: A human resource management approach, 4rd ed., Upper Saddle River, New Jersey:
Pearson, Prentice Hall. Mathis, R.L. & Jackson, J.H. (2011). Human resource management. 13th ed., USA: South-Western Cengage Learning. Mattson, M., Torbiöm, I., & Hellgren, J. (2014). Effects of staff bonus systems on safety behaviours. Human Resource Management
Review, 24(1), 17-30. Mawoli, M.A. & Babandako, A.Y. (2011). An evaluation of staff motivation, dissatisfaction and job performance in an academic setting.
Australian Journal of Business and Management Research, 1(9), 01-13. McNall, L.A., Masuda, A.D., & Nicklin, J.M. (2010). Flexible work arrangements, job satisfaction, and turnover intentions: The mediating
role of work-to-family enrichment. The Journal of Psychology, 144(1), 61-81. Milkovich, G.T. & Newman, J.M. (1999). Compensation. 6th Ed., New York: McGraw Hill. Milkovich, G.T., Newman, J.M., and Gerhart, B. (2011). Compensation. 10th International Ed., New York: McGraw Hill. Mucinsky, P.M., Kriek, H.J., & Schreuder, A.M.G. (1998). Personnel psychology. Goodwood: Thomson Publishing Company. Mumm, J. & Mutlu, B. (2011). Designing motivational agents: the role of praise, social comparison, and embodiment in computer
feedback. Computers in Human Behaviour, 27(5), 1643-1650. Musenze, I.A, Thomas, M., Stella, B., & Muhammadi, L. (2013). Reward management and organisational performance: An empirical
study of private universities in Uganda. International Journal of Innovative Research and Development, 2(8), 90-96. Nelson, B. & Economy, P. (2005). The management bible. New Jersey: John Wiley and Sons Incorporation.

ISSN 2039-2117 (online) ISSN 2039-9340 (print)
Mediterranean Journal of Social Sciences MCSER Publishing, Rome-Italy
Vol 5 No 27 December 2014
97
Nickels, W.G., McHugh, J.M., & McHugh, S.M. 1999. Understanding business. 5th Ed. McGraw Hill Irwin, New York. O’Connor, D. & Yballe, L. (2007). Maslow revisited constructing a road map of human nature. Journal of Management Education, 31(6),
738-756. Odunlade, R.O. (2012). Managing employee compensation and benefits for job satisfaction in libraries and information centres in
Nigeria. http://digitalcommons.unl.edu?utm_source=digitalcommons.unl.edu%2flibphilprac%2f714&utmmedium=pdf&utm_campaign=pdfcoverpages/ (Accessed 2013:09:23).
Odusami, K.T., Iyagba, R.R.O., & Omirin, M.M. (2003). The relationship between project leadership, team composition and construction project performance in Nigeria. International Journal of Project Management, 21(7), 519-52.
Pingle, S. (2014). Reward and recognition practices in public sector: An empirical study at Steel Authority of India Ltd (SAIL). Journal of Institute of Environment and Management, 7(1), 10-15.
Prebensen, N.K., Woo, E., Chen, J.S., & Uysal, M. (2012). Motivation and involvement as antecedent of the perceived value of the destination experience. Journal of Travel Research, 52(2), 253-264.
Qureshi, M. (2013). Relationship between rewards and employee motivation in Administration Block of Punjab University. International Journal of Innovative and Applied Finance, 1-13.
Riddell, C. (2011). Compensation policy and quit rates: A multilevel approach using benchmaking data. Industrial Relations: A Journal of Economy and Society, 50(4), 656-677.
Robbins, S.P. (2005). Organisational behaviour. International Ed., 11th Ed., Pearson Education Incorporation, Upper Saddle River, New Jersey, USA.
Robbins, S.P. & DeCenzo, D.A. (2008). Fundamentals of management: Essential Concepts and Applications, 6th ed., Pearson Educational Incorporation, Upper Saddle River, New Jersey, USA.
Schermerhorn, J.R.; Hunt, J.G., & Osborn, R.N. (2008). Organisational behaviour, 10th Ed., John Wiley and Sons Incorporation, USA. Seiler, S.; Lent, B.; Pinkowska, M., & Pinazza, M. (2011). An integrated model of factors influencing project managers’ motivation-
findings from a Swiss survey. International Journal of Project Management, doi: 10.1016/j.ijproman.2011.03.002. Shaw, J.D. (2014). Pay dispersion. The Annual Review of Organisational Psychology and Organisational Behaviour, 2014(1), 521-544. Shieh, C.J. (2008). Effect of corporate compensation design on organisational performance. Social Behaviour and Personality, 36(6),
827-840. Sisson, K. (2010). Employment relations matters. Research Studies and Reports, ILR collection. http://digitalcommons.ilr.cornell.
edu/reports (Accessed 2014/ 04/17). Stringer, C., Didham, J., & Theivananthampillai, P. (2011). Motivation, pay satisfaction, and job satisfaction of front-line employees.
Qualitative Research in Accounting and Management, 8(2), 161-179. Tabassi, A.A. & Abu Bakar, A.H. (2009). Training, motivation and performance: The case of human resource management in
construction projects in Mashhad, Iran. International Journal of Project Management, 27(5), 471-480. Todorović, M. & Živković, S. (2010). Organisational culture in the function of occupational healthcare at work. 13th International
Conference Dependability and Quality Management. ICDQM-2010, 155-161. Tsai, C. (2005). Reward Incentive Compensation and Organisational Performance. Evidence from semi-conductor industry. Performance
and Reward Conference, Manchester U.K. Ude, U. & Coker, M.A. (2012). Incentive schemes, employee motivation and productivity in organisations in Nigeria: Analytical linkages.
Journal of Business and Management, 1(4), 32-39. Ukandu, N.E. & Ukpere, W.I. (2011). Strategies to improve the level of employee motivation in the fast food outlets in Cape Town, South
Africa. Africa Journal of Business Management, 5(28), 11521-11531. Van den Broeck, A., Schreurs, B., De Witte, H., Vansteenkiste, M., Germeys, F., & Schaufeli, W. (2011). Understanding workaholics’
motivations: A self-determination perspective. Applied Psychology: An International Review, 60(4), 600-621. Vukšić, V.B., Bach, M.P., & Popovič, A. (2013). Supporting performance management wiyh business process management and
business intelligence: A case analysis of integration and orchestration. International Journal of Information Management, 33(4), 613-619.
Walker, C.O., Greene, B.A., & Mansell, R.A. (2006). Identification with academics, intrinsic/extrinsic motivation, and self-efficacy as predictors of cognitive engagement. Learning and Individual Differences, 16(1), 1-12.
Willis-Shattuck, M., Bidwell, P., Thomas, S., Wyness, L., Blaauw, D., & Ditlopo, P. (2008). Motivation and retention of health workers in developing countries: a systemic review. BMC Health Service Research, 8, 247. http://www.biomedcentral.com/1472-6963/8/247.
Wininger, S.R. & Norman, A.D. (2010). Assessing coverage of Maslow’s theory in educational psychology textbooks: a content analysis. Teaching Educational Psychology, 6(1), 33-48.
WorldatWork, (2007). The WorldatWork Handbook of Compensation, Benefits and Total Rewards: A comprehensive guide for HR professionals. John Wiley and Sonc, incorporation, New Jersey.
Xavier, B. (2014). Shaping the future research agenda for compensation and benefits management: Some thoughts based on stakeholder inquiry. Human Resource Management Review, 24(2014), 31-40. http://dox.doi.org/10.1016/j.hrmr.2013.08.011
Žicković, S. (2010). Contemporary concept of quality management in living and working environment safety. 6th International Conference: Innovation-2010, Illyanovsk State University, Collection of Scientific Works, pp. 35-39.
Žicković, S. (2013). Management of occupational safety by motivating employees to work safely. African Journal of Business Management, 7(12), 936-946.


