An Assessment of Ceramic Filtration for a Metallurgical...
139
An Assessment of Ceramic Filtration for a Metallurgical Process DISSERTATION FOR THE DEGREE OF MSc By Janet Smith 819988 A dissertation submitted to the School of Chemical and Metallurgical Engineering, Faculty of Engineering and the Built Environment, University of the Witwatersrand, in fulfilment of the requirements for the degree Master of Science in Chemical Engineering Johannesburg 2015
-
Upload
nguyencong -
Category
Documents
-
view
222 -
download
5
Transcript of An Assessment of Ceramic Filtration for a Metallurgical...

An Assessment of Ceramic Filtration for a Metallurgical Process
DISSERTATION FOR THE DEGREE OF MSc
By
Janet Smith
819988
A dissertation submitted to the School of Chemical and Metallurgical Engineering, Faculty of
Engineering and the Built Environment, University of the Witwatersrand, in fulfilment of the
requirements for the degree Master of Science in Chemical Engineering
Johannesburg 2015

ii
Declaration
I declare that this dissertation is my own unaided work. It is being submitted for the degree of Master
of Science in Chemical Engineering to the University of the Witwatersrand, Johannesburg. It has not
been submitted before for any degree or examination to any other University.
Janet Smith
07 October 2015

iii
Abstract
Conventional vacuum filtration was previously used for dewatering of iron-ore product, but with
changing product quality requirements and declining ore grades, compounded by the complexity of
mineralogy and increased energy costs, alternative, more efficient dewatering solutions are being
sought. The purpose of this study was to investigate the effectiveness of ceramic filtration for iron-
ore dewatering.
Ceramic filtration is a technology best suited to dewatering slurries with high and consistent solids
concentration and with particles in a size range between 30 µm and 150 µm. Although the technology
is already widely applied to base metal concentrates and ferrochrome products, the introduction of
the technology to the iron-ore industry is relatively recent.
Ceramic filter discs are vacuum-disc filters that comprise sintered alumina sector plates with uniform
micro-pores. The micro-pores create suction through capillary action and, once wetted, the filter
medium allows only liquid to pass through during the filtering process. A filter cake forms on the
surface of the disc and is removed by a scraper. Significant energy savings are stated, owing to the
lack of air penetrating the ceramic discs. Other stated benefits include continuous operation, low
operating costs, high filtration rates, dry filter cakes and high operational availability with an inert
ceramic media that is resistant to most chemicals and slurry temperatures.
This technology is used for the final dewatering stage of the concentrate product at the Anglo
American Minas-Rio iron-ore operation in Brazil. To produce a concentrate product, a friable
itabirite with approximately 40 % haematite in the feed, is processed using crushing, grinding and
flotation steps with thickening of the tails, slimes and concentrate product. The concentrate is
pumped over 529 km to a port facility where it undergoes further thickening before reporting to
ceramic filter units for final dewatering of product.
Assessment of prior testwork programmes performed by the operation showed that the slurry
conditions that contributed to highest filtration capacities and lowest cake moistures included a high
feed solids concentration, neutral pH and addition of coagulant. Operating conditions that contributed
to highest product yield, although with a high cake moisture content, included employment of

iv
maximum vacuum level, maximum disc rotation speed and greatest basin level. The lowest cake
moisture content was achieved at minimum vacuum and basin levels and at highest rotation speed.
The only factor that was shown to reduce moisture, while increasing productivity, was increased
rotational speed of the filter disc. Ultrasonic cleaning, backwashing and use of good quality filter
plates also resulted in improvements in filtration efficiencies. Controlled flocculant addition
contributed to good product yield, and other factors, notably allocation of sufficient time to facilitate
preventative and corrective maintenance and shorter time intervals between acid washing of the
plates, plate regeneration and plate replacement, all improved filtration efficiency.
The testwork performed for this programme verified that the highest filtration capacities were
achieved at neutral pH, although highest filtration capacities could also be achieved in instances
where lime was used to adjust the slurry to higher alkaline pH values. The greatest dry solids
capacity, with the required cake moisture content of 8 %, were achieved at neutral slurry conditions,
using nitric acid for pH adjustment, along with the addition of small amounts of flocculant.
Flocculant addition at more alkaline pH values did not prove to be as successful as the testwork
performed at neutral pH, and, despite achieving low cake moisture content, considerably lower
filtration capacities were accomplished. Decreased temperatures of ~30 °C resulted in decreased
vacuum pressure and reduced plate permeability. Higher slurry temperatures of ~36 °C gave
improved filtration capacities that are attributed to decreased slurry viscosities. Testwork showed that
improved filtration capacities were generally accompanied by an increase in cake moisture content.
Oxalic acid had a negative impact on plate permeability when used for plate regeneration while plate
permeability was improved when using either nitric acid, or hydrochloric acids for plate regeneration.
Provided that slurry and operational conditions were optimised and adequate maintenance regimes
maintained, the testwork outlines in this thesis demonstrated that sufficient filtration capacities and
the required cake moisture content for final concentrate product can be achieved. Thus ceramic
filtration is a suitable method for the metallurgical process of dewatering of iron-ore concentrate.

v
Acknowledgements
I wish to thank Anglo American for providing me the opportunity to pursue my MSc studies and am
most grateful to the Anglo American Metallurgical Council members who recommended that I
embark on further studies.
Thank you to Iron Ore Brazil and the Minas-Rio Operation for consenting to and facilitating my
study of the ceramic filtration units installed at their operation, Mr. Jose Francisco Cabello Russo, the
operation’s Process and Product Development Manager, for permitting and encouraging this study,
and my immense gratitude to Dr Henrique Dias Gatti Turrer, for his technical support and assistance
during my time on site, throughout this study and for final review of this thesis. A special thank you
to the pilot-plant staff at Conceição do Mato Dentro who were responsible for ensuring that the
required testwork programme was so brilliantly carried out and also to the many operational
personnel who assisted in countless ways, from preparing the slurry sample to providing the
operational information required for this study.
Thank you to my academic supervisor, Dr Craig Sheridan, for his support and guidance during my
studies and also my industrial supervisors: my manager, Mr Sandip Naik, for his encouragement,
support, and assistance in realising this opportunity, and Dr Neville Plint, without whose constant
support, I may not have persevered through my prior studies.
Thanks to Mr. Marek Dworzanowski for his technical expertise and advice, Mr Nicholas Downer for
his chemistry brainstorming sessions, Dr Kathy Sole for generously offering to review this document,
giving her much valued comment to allow me further to improve this work, and to Mr Stephen
Batchelor, my mentor spanning most of my professional career, for his guidance and friendship, and
also his endless lessons in the correct use of the English language, for which I am eternally grateful.
To my husband and best friend, Steve, for his love, encouragement, unending patience and support to
afford me the opportunity to pursue my studies. To my precious daughter Nicole, for her
understanding and comradery through our many shared hours of studying and exam jitters. Also to
my “Dachshund children”, Baby and Sodium, for their unwavering companionship when studying.

vi
There are many others that have contributed, not individually mentioned, but I am truly grateful to
everyone that has helped me to fulfil this dream. I am constantly reminded of a quote by George
Matthew Adams: “There is no such thing as a ‘self-made man’, we are made up of thousands of
others, everyone who has ever done a kind deed for us, or spoken one word of encouragement to us,
has entered into the make-up of our character, and our thoughts, as well as our success.”

vii
Table of Contents
CHAPTER 1 ...................................................................................................................................... - 1 -
1. INTRODUCTION ...................................................................................................................... - 1 -
1.1 Problem Statement .............................................................................................................. - 4 -
1.2 Aims and Objectives ........................................................................................................... - 5 -
1.3 Structure of Dissertation ..................................................................................................... - 5 -
CHAPTER 2 ...................................................................................................................................... - 7 -
2.1 LITERATURE REVIEW ........................................................................................................... - 7 -
2.1.1 Iron Ore Globally ............................................................................................................ - 7 -
2.1.2 Iron Ore In Brazil ............................................................................................................ - 9 -
2.2 PROCESSING OF IRON ORE................................................................................................ - 11 -
2.2.1 Comminution - Crushing and Grinding ........................................................................ - 13 -
2.2.1.1 Primary Crushing ............................................................................................... - 13 -
2.2.1.2 Secondary Crushing ........................................................................................... - 14 -
2.2.1.3 Tertiary Crushing ............................................................................................... - 15 -
2.2.1.4 Grinding ............................................................................................................. - 15 -
2.2.2 Ore Screening ................................................................................................................ - 16 -
2.2.3 Hydrocyclone classification and desliming................................................................... - 18 -
2.2.4 Flotation ........................................................................................................................ - 19 -
2.3 DEWATERING – SOLID–LIQUID SEPARATION .............................................................. - 22 -
2.3.1 Thickening ..................................................................................................................... - 22 -
2.3.2 Filtration ........................................................................................................................ - 24 -
2.3.2.1 Filter Selection ................................................................................................... - 25 -
2.3.2.2 Pressure Filters - The Filter Press – Plate-and-Frame Press .............................. - 27 -
2.3.2.3 Pressure Filters – Pressure Leaf Filters .............................................................. - 28 -
2.3.2.4 Centrifugal Filters .............................................................................................. - 29 -
2.3.2.5 Vacuum Filters - Rotary Drum Filters ............................................................... - 31 -
2.3.2.6 Vacuum Filters – Disc Filters ............................................................................. - 33 -
2.3.2.7 Vacuum Filters – Horizontal Belt Filter ............................................................. - 34 -
2.4 CERAMIC FILTRATION ....................................................................................................... - 35 -
2.4.1 The Mechanism of Filtration ......................................................................................... - 38 -
2.4.2 Operating Principle of Ceramic Filtration ..................................................................... - 38 -
viii
2.4.2.1 Cake Formation .................................................................................................. - 39 -
2.4.2.2 Cake Drying ....................................................................................................... - 39 -
2.4.2.3 Cake Discharge .................................................................................................. - 39 -
2.4.2.4 Backflow Washing ............................................................................................. - 39 -
2.4.2.5 Disc Regeneration .............................................................................................. - 40 -
2.4.3 The Outotec CC-144 Unit ............................................................................................. - 40 -
2.4.4 Factors Affecting Ceramic Filtration ............................................................................ - 42 -
2.4.4.1 Zeta Potential ...................................................................................................... - 42 -
2.4.4.2 Flocculant Addition ............................................................................................ - 45 -
2.4.4.3 Temperature and Viscosity ................................................................................. - 47 -
2.4.4.4 Ceramic Filter Media Blockage Mechanisms .................................................... - 48 -
2.4.4.5 Acid Types ......................................................................................................... - 49 -
2.5 COMPARISON OF DIFFERENT FILTRATION SYSTEMS ............................................... - 49 -
2.6 PRIOR TESTWORK CONDUCTED BY ANGLO AMERICAN .......................................... - 50 -
2.7 CONSIDERATION OF FUTURE TEST REQUIREMENTS ................................................ - 51 -
CHAPTER 3 .................................................................................................................................... - 54 -
3.1 METHODOLOGY ................................................................................................................... - 54 -
3.1.1 Sample Preparation ....................................................................................................... - 54 -
3.2 REAGENT PREPARATION ................................................................................................... - 55 -
3.2.1 Flocculant Preparation ................................................................................................... - 55 -
3.2.2 Nitric Acid Preparation ................................................................................................. - 55 -
3.2.3 Hydrochloric Acid Preparation ..................................................................................... - 56 -
3.2.4 Oxalic Acid Preparation ................................................................................................ - 56 -
3.2.5 Carbon Dioxide Preparation .......................................................................................... - 56 -
3.2.6 Sodium Hydroxide Preparation ..................................................................................... - 56 -
3.3 LAROX LEAF TEST EQUIPMENT AND TEST METHODOLOGY .................................. - 57 -
3.4 OPERATING INSTRUCTIONS AND CALCULATIONS .................................................... - 61 -
3.4.1 Density .......................................................................................................................... - 61 -
3.4.2 Dry Solids ...................................................................................................................... - 61 -
3.4.3 Cake Moisture ............................................................................................................... - 61 -
3.4.4 Cake Mass ..................................................................................................................... - 62 -
3.4.5 Dry Solids Capacity ...................................................................................................... - 62 -
3.5 TESTWORK DESIGN ............................................................................................................ - 62 -

ix
3.5.1 Parameters Recorded ..................................................................................................... - 62 -
3.5.2 Cycle Time .................................................................................................................... - 63 -
3.6 TESTS PERFORMED ............................................................................................................. - 64 -
3.6.1 pH Test – Testing the Impact of pH on Filtration Capacity .......................................... - 64 -
3.6.2 Impact of Using Different Acid Types for pH Adjustment .......................................... - 64 -
3.6.3 Impact of Flocculant Addition at pH 7.1 ....................................................................... - 65 -
3.6.4 Impact of Flocculant Addition at pH 11.5 ..................................................................... - 65 -
3.6.5 Standard Performance Tests .......................................................................................... - 65 -
3.6.6 Confirmation of Temperature Impacts on Vacuum Pressure ........................................ - 66 -
3.6.7 Evaluation of Cleaning Solution ................................................................................... - 66 -
CHAPTER 4 .................................................................................................................................... - 67 -
4.1 RESULTS AND DISCUSSION .............................................................................................. - 67 -
4.1.1 pH Tests ......................................................................................................................... - 67 -
4.1.2 pH adjustment with different acid types ....................................................................... - 69 -
4.1.3 Flocculant dosage testwork at pH 7.1 ........................................................................... - 74 -
4.1.4 Flocculant dosage testwork at pH 11.5 ......................................................................... - 77 -
4.1.5 Standard performance tests – pH 7.0 ............................................................................ - 80 -
4.1.6 Plate permeability and acid treatment for plate cleaning (acid regeneration) ............... - 84 -
CHAPTER 5 .................................................................................................................................... - 88 -
5.1 CONCLUSIONS ...................................................................................................................... - 88 -
5.2 RECOMMENDATIONS AND CONSIDERATIONS FOR FUTURE WORK ..................... - 91 -
REFERENCES ................................................................................................................................ - 93 -
APPENDIX A ............................................................................................................................... - 102 -
A: FILTER COMPARISONS ..................................................................................................... - 102 -
A1: Vacuum Filtration ........................................................................................................... - 102 -
A2: Pressure Filtration ........................................................................................................... - 102 -
A3: Capillary (Ceramic) Filtration ......................................................................................... - 102 -
A4: Comparison of efficiency and costs ................................................................................ - 103 -
APPENDIX B ................................................................................................................................ - 105 -
B: SUMMARY OF PRIOR STUDIES CONDUCTED BY ANGLO AMERICAN ................. - 105 -
B1: Anglo American Testwork Reference 1 - 2007 .............................................................. - 105 -
B2: Anglo American Testwork Reference 2 - September 2010 ............................................ - 106 -
B3: Anglo American Testwork Reference 3, 2012 - March 2011 Testwork ......................... - 107 -

x
B4: Anglo American Testwork Reference 3 - April 2012 Testwork ..................................... - 109 -
B5: Anglo American Testwork Reference 4 - July 2013 ...................................................... - 110 -
B6: Anglo American Testwork Reference 5- January 2014 .................................................. - 114 -
APPENDIX C ................................................................................................................................ - 116 -
C: STANDARD OPERATING PROCEDURE (Larox Operating Instructions, undated) ......... - 116 -
C1: Plate Permeability Check ................................................................................................ - 116 -
C2: Vacuum Level Determination ......................................................................................... - 116 -
C3: Dipping and Cake Forming ............................................................................................. - 116 -
C4: Cake Drying .................................................................................................................... - 117 -
C5: Cake Discharge ............................................................................................................... - 117 -
C6: Back Washing ................................................................................................................. - 117 -
C7: Repetitions ...................................................................................................................... - 117 -
APPENDIX D ............................................................................................................................... - 118 -
D: ANALYSIS AND CALCULATIONS (Larox Operating Instructions, undated) .................. - 118 -
D1: Density ............................................................................................................................ - 118 -
D2: Dry Solids (DS) ............................................................................................................... - 118 -
D3: Measurement of Cake Moisture ...................................................................................... - 119 -
D4: Calculation of Cake Mass ............................................................................................... - 119 -
D5: Calculation of Dry Solids Capacity ................................................................................ - 120 -
APPENDIX E ................................................................................................................................ - 121 -
E: TESTWORK RESULTS ........................................................................................................ - 121 -

xi
List of Tables
Table 2.1: A guide to filter selection (Sinnott, 1993). ..................................................................... - 26 -
Table 2.2: Advantages of a decanter centrifuge compared to other sedimentation centrifuges. ..... - 31 -
Table 2.3: Viscosity of water at different temperatures. ................................................................. - 47 -
Table 3.1: Pipe-loop test parameters ............................................................................................... - 55 -
Table 3.2: Impact of pH on filtration efficiency. ............................................................................. - 64 -
Table 3.3: Impact of different acid types for pH adjustment. .......................................................... - 64 -
Table 3.4: Impact of flocculant addition at pH 7.1. ......................................................................... - 65 -
Table 3.5: Impact of flocculant addition at pH 11.5. ....................................................................... - 65 -
Table 4.1: Testwork parameters for pH tests. .................................................................................. - 67 -
Table 4.2: Results from testwork to demonstrate impact of slurry pH on filtration capacity. ........ - 67 -
Table 4.3: Testwork parameters for acid type tests. ........................................................................ - 70 -
Table 4.4: Filtration results using different acid types to adjust slurry pH. .................................... - 70 -
Table 4.5: Testwork parameters for flocculation testwork at pH 7.1. ............................................. - 74 -
Table 4.6: Filtration results using different flocculant dosages at pH 7.1 (HNO3). ........................ - 75 -
Table 4.7: Testwork parameters for flocculation testwork at pH 11.5. ........................................... - 77 -
Table 4.8: Filtration results for flocculant tests at pH 11.5 (CaO). ................................................. - 77 -
Table 4.9: Testwork parameters for standard performance tests. .................................................... - 80 -
Table 4.10: Results from standard performance tests. ..................................................................... - 81 -
Table 4.11: Temperature, vacuum pressure and permeability test data. ......................................... - 83 -
Table 4.12: Plate permeability before and after testwork. ............................................................... - 85 -
Table A1: Operational costs per ton of dry solids (Anglo American Reference 3, 15/09/10). ..... - 103 -
Table B1: Criteria used for filter unit sizing. ................................................................................. - 105 -
Table B2: Testwork Parameters – March 2011. ............................................................................ - 108 -
Table B3: Testwork Parameters – April 2012. .............................................................................. - 109 -
Table B4: Testwork Parameters – July 2013. ................................................................................ - 110 -
Table B5: Four different scenarios considered for calculation of required filter units. ................ - 112 -
Table B6: Risk rating for the four different scenarios. .................................................................. - 113 -
Table B7: Ability of each scenario to meet production capacity. ................................................. - 114 -
Table B8: Testwork Parameters – January 2014. .......................................................................... - 115 -

xii
List of Figures
Figure 2.1: Friable iron-ore at the Minas-Rio operation. - 10 -
Figure 2.2: Friable, semi-compact and compact itabirite (Turrer et al., 2013; Turrer et al., 2015).- 10
-
Figure 2.3: Map showing the pipeline from Minas Gerais to Rio de Janeiro (Anglo American
Reference 2, 2009). - 11 -
Figure 2.4: Process flow diagram for Minas-Rio Iron Ore Project (Turrer et al., 2015). - 12 -
Figure 2.5: Jaw crusher (Astec Industries Inc, 2014). - 14 -
Figure 2.6: Cone crusher (Astec Industries Inc, 2014). - 14 -
Figure 2.7: Schematic of a typical HPGR (FLSmidth & Co., 2014). - 15 -
Figure 2.8: Ball mill located at the Minas-Rio operation. - 16 -
Figure 2.9: Grizzly scalper (Metso Corporation, undated). - 17 -
Figure 2.10: Multi-slope banana screen – Enestee (Enestee Engineering, undated). - 18 -
Figure 2.11: Hydrocyclone clusters located at the Minas-Rio operation. - 19 -
Figure 2.12: Flotation cells at the Minas-Rio operation during construction. - 21 -
Figure 2.13: Simplified diagram of a reverse flotation circuit. (Anglo American Reference 5,
undated) - 21 -
Figure 2.14: Verti mills at the Minas-Rio operation. - 22 -
Figure 2.15: Thickener before commissioning showing feedwell and rakes at the Minas-Rio
operation. - 23 -
Figure 2.16: Plate-and-frame press (Coulson & Richardson, 2002). - 27 -
Figure 2.17: “Verti-jet” pressure filter (Coulson & Richardson, 2002). - 28 -
Figure 2.18: Decanter centrifuge (numbers are discussed in text) (Lenntech, 1998-2014). - 30 -
Figure 2.19: Typical layout of a rotary drum filter installation (Komline-Sanderson, 2014). - 32 -
Figure 2.20: Schematic drawing of a rotary disc filter (Anglo American Reference 3, 15/09/10). - 33 -
Figure 2.21: Rigid belt filters installed at an Anglo American copper mine in Chile. - 34 -
Figure 2.22: Examples of ceramic filter plates (Larox Corporation, 2007). - 37 -
Figure 2.23: Cross-sectional structure of a ceramic filter plate (Larox Corporation, 2007). - 37 -
Figure 2.24: Diagrammatic illustration of parameters of the Young–Laplace Equation (Ekberg &
Hartti, 1993). - 38 -
Figure 2.25: Operating principle of Ceramic filtration (Larox Corporation, 2007). - 40 -
Figure 2.26: CC-144 ceramic filter unit with integrated attachments. - 41 -

xiii
Figure 2.27: Ceramic filter units at the Minas-Rio operation. - 42 -
Figure 2.28: Zeta potential as a function of pH plot adapted from Esumi et al. (1988) and cited by
(Haselhuhn et al., 2012). - 43 -
Figure 2.29: Filtration rate and specific cake resistance of concentrated hematite ore in relation to pH
(Haselhuhn, et al., 2012). - 44 -
Figure 2.30: Flocculant selection (Effect of pH on flocculant selection (adapted from Connelly and
Richardson, 1984) (CSIRO, 2011). - 46 -
Figure 2.31: Graphic illustration of the change in viscosity of water at different temperatures. - 48 -
Figure 3.1: Larox ceramic leaf tester (left) and actual leaf testing unit at the operation’s pilot facility
(right). - 57 -
Figure 3.2: P & I drawing of ceramic leaf tester configuration adapted from (Larox Operating
Instructions, undated). - 58 -
Figure 3.3: An operator mixing of slurry (left), and an operator about to dip the leaf tester into the
slurry (right). - 59 -
Figure 3.4: Cake drying. - 59 -
Figure 3.5: Cake discharge and measuring of cake thickness. - 60 -
Figure 3.6: Ultrasonic cleaning of the plate. - 60 -
Figure 4.1: Average filtration capacity and moisture results from pH testwork. - 68 -
Figure 4.2: Average filtration capacity and moisture results from acid type tests. - 71 -
Figure 4.3: Average filtration capacity and cake moisture - flocculation testwork at pH 7.1. - 75 -
Figure 4.4: Average filtration capacity and cake moisture - flocculant testwork at pH 11.5. - 78 -
Figure 4.5: Average filtration capacity and cake moisture – 4g/t dosage flocculant testwork at pH 7.1
and pH 11.5. - 79 -
Figure 4.6: Capacity and moisture results from standard performance tests. - 81 -
Figure 4.7: Impact of plate permeability and vacuum pressure at different temperatures. - 82 -
Figure 4.8: Impact of temperature on vacuum pressure and plate permeability. - 83 -
Figure 4.9: Plate permeability after overnight soaking using different acids. - 86 -
Figure 4.10: Relative change in plate permeability between different acid and water soakings. - 87 -

xiv
List of Abbreviations
DRI direct reduced iron
BIF banded iron formations
Ga giga-annum - 2.75 billion (109) years before present
Bt billion tonnes - (1 x 10⁹ tons)
Mt million tonnes
DS dry solids
JORC Joint Ore Reserves Committee
HPGR high pressure grinding rolls
PLC process logic control
P&I piping and instrumentation
DMTPY dry mass ton per year
Nomenclature
∆ρ bubble point pressure (bar)
T surface tension (N/m) [0.07 for H2O at 20℃]
Ɵ wetting angle (degrees) @ [00 (cos 𝜃 = 1)]
D pore diameter (µm)
C concentration (%)
V volume (ml)
C or (TUF) capacity or (taxa unitára de filtragem) (kg/m²h)
t time available (h)
F operating time for cleaning of ceramic plates (12 h)
nf number of filters (-)
area filtration area per filter (144 m2)
f (x) equation which reproduces the reduced productivity as a function of time,
derived from the slope of capacity versus operation time graph
106 factor to convert g to t
g gram
- 1 -
CHAPTER 1
1. INTRODUCTION
Iron ore provides an economically viable source of metallic iron (Fe) (Callaghan, 2014; Tuck, 2014).
It is estimated that the global iron-ore resource exceeds 800 billion tonnes, from which 230 billion
tonnes of contained iron can be extracted (Tuck, 2014). Iron ore is primarily used in the production
of steel and is mined in approximately fifty countries. Australia and Brazil each contribute one third
of the world’s total iron-ore exports (Callaghan, 2014).
Iron can be used directly as lump ore or after undergoing conversion to briquettes, concentrates,
pellets, iron nuggets, direct reduced iron (DRI) or sinter (Tuck, 2014). Of the ore minerals, the
primary forms are magnetite, Fe3O4 (72 % Fe), and haematite, Fe2O3 (70 % Fe), which form the bulk
of the available ore, while lesser forms are goethite, FeO(OH) (63 % Fe), and limonite, a mixture of
hydrated iron oxides (up to 60 %) (Callaghan, 2014; Gӧrres & Hindstrӧm, 2007). Metallic iron is
formed when iron ore is heated in the presence of a reductant, usually coal or coke (Callaghan, 2014).
Iron ore is one of Brazil’s principal commodities, with nearly 30 billion tonnes (Bt) of measured and
indicated reserves (Mining Leaders, 2013), giving this country the second-largest iron ore reserves in
the world, with Australia in first place and Russia, China and India following consecutively after
Brazil (US Geological Survey, 2015). Brazil’s itabirite mineralisation facilitates production of a high-
grade concentrate with very low impurity content (phosphorus, alumina and silica) (Sundance
Resources Ltd, 2014).
Crushing and screening of the itabirite ore form the first stage of size reduction in the processing of
iron ore (Sandgren et al., 2013). A subsequent grinding stage achieves liberation size and a reverse-
flotation process is used for beneficiation of the valuable mineral from the ore. Flotation tails report
to a tailings thickener while the concentrate undergoes regrinding before reporting to a concentrate
thickener. Further solid-liquid separation processes are employed to ensure that the concentrate is
sufficiently dewatered to achieve the required 8 % product moisture.
Solid-liquid separation is an important unit operation employed in various industries, including those
of chemicals, food and mining. The purpose of this operation is to separate solids from liquids in

- 2 -
order that the solids can be collected and concentrated for value use or disposal while the liquor can
be recovered for re-use or discard.
Solid-liquid separation is typically achieved using either sedimentation or filtration techniques.
Filtration can be achieved using gravity, vacuum, pressure or centrifugal force, with different modes
of filtration being best suited to different processes. Selection of the best available technology to
provide the most efficient and cost-effective solution to achieve specific process requirements is
critical for ensuring optimal operational success (Dempsey et al., 2013 - 2015).
Conventional vacuum filtration has generally been employed to dewater the iron-ore product for
beneficiation; but with changing product quality requirements and declining ore grades, compounded
by complex mineralogy and increased energy costs, alternative, more efficient dewatering solutions
are being sought. The development of large ceramic units with high filtration areas has led to a better
understanding of iron-ore dewatering and has allowed for the optimisation of ceramic filter units for
high capacity operations (Gӧrres & Hindstrӧm, 2007).
Pirkonen et al. (2010) describe ceramic filtration as a technology best suited to dewatering slurries
with high and consistent solids concentration and having a particle size range between 30 µm and
150 µm. Ceramic filtration is widely used for base metal concentrates, and for ferrochrome and iron-
ore products and thus has an industrial application (Pirkonen et al., 2010).
Ceramic filtration technology was introduced in the 1980s but was only applied in the iron-ore
industry in the 2000s (Gӧrres & Hindstrӧm, 2007). Ceramic filter discs are vacuum-disc filters that
comprise sintered alumina sector plates with uniform micro-pores. The micro-pores create suction
through capillary action and the filter medium allows only liquid to pass through during the filtration
process. A filter cake forms on the surface of the disc and is removed by a scraper. The mechanism
and operating principle of the technology are described in several papers (Ekberg & Hartti, 1993;
Gӧrres & Hindstrӧm, 2007; Larox Corporation, 2007; Pirkonen, et al., 2010). Significant energy
savings are achieved, owing to the lack of air penetrating the ceramic discs, and it is stated that an
equivalent traditional vacuum filter unit would require in the order of 10 % more energy to create a
similar high vacuum owing to high air leakage through the filter cake (Gӧrres & Hindstrӧm, 2007).
Other stated benefits include (Gӧrres & Hindstrӧm, 2007; Larox Corporation, 2007; Salmimies et al.,
2013):

- 3 -
Low capital investment;
Low operating costs;
High capacity;
Dry filter cake;
Stable moisture content;
Particle-free filtrate;
High filtration rates;
Simple installation, operation and maintenance of the filter unit;
Integrated filter and ancillary systems;
Continuous operation;
Automation features allowing independent cake forming and drying control;
High operational availability;
Extended plate life;
Inert media, resistant to most chemicals and slurry temperatures; and
No need for changing of filter cloth.
Ceramic filtration has been chosen for use in the final dewatering stage of the concentrate product at
the Anglo American-owned Minas-Rio iron-ore operation in Brazil. A friable itabirite with
approximately 40 % haematite in the feed is treated at a plant which comprises crushing, grinding
and flotation steps with thickening of the tails, slimes and concentrate. Concentrate is pumped over
500 km to the port facility where it undergoes thickening before reporting to ceramic filter units for
final product dewatering.
Initial bench-scale testwork was conducted in 2007 by the Minas-Rio operation to establish sizing
requirements to determine the number of filter units necessary to perform the required duty. These
testwork results, together with results from tests conducted at other operations and using several
assumptions regarding “capacity factors” and utilization, were used to determine the required
filtration capacity. The original conclusions indicated that 12 filtration units were required for the
given duty. Subsequent testwork performed in 2010, 2011 and 2012 however, indicated varying
filtration capacity needs and different numbers of filter units were required (Anglo American
Testwork Reference 1, 2007; Anglo American Testwork Reference 2, 15/09/10; Anglo American

- 4 -
Testwork Reference 3, 28/04/12; Anglo American Testwork Reference 4, 31/07/2013). Later
testwork was performed using Verti-mill product which had a smaller (-45 µm), and more
representative size fraction of the expected plant feed material.
While energy savings are a recognised benefit of the ceramic filtration technique compared with
conventional filtration (Gӧrres & Hindstrӧm, 2007; Larox Corporation, 2007; Salmimies et al.,
2013), there were concerns regarding the rate of loss of capacity of the filter unit owing to filter
blockages and scaling (Dempsey et al., 2013 - 2015). Questions were raised regarding the most
effective cleaning regime to maximise filter utilization and confirmation was required of realistic
filter capacity requirements to meet the required operational needs to ensure sustainable filter
performance that would prevent upstream bottlenecks.
The operating principle of ceramic filtration is well documented and there appears to be a good
understanding of the process (Ekberg & Hartti, 1993; Gӧrres & Hindstrӧm, 2007; Larox Corporation,
2007; Pirkonen et al., 2010). Investigation of various cleaning mechanisms that can be used to
maintain optimal plate efficiency have been conducted (Mänttäri et al., 1995; Pirkonen et al., 2010;
Salmimies et al., 2013) and flocculation effects and scaling have also been researched (Mänttäri et
al., 1995; Salmimies et al., 2013). It was necessary to identify specific engineering and/or operational
factors that may impact filter plate efficiencies so as to minimise the rate of capacity loss of the filter
units. The outcomes of this experimental work are expected to be ore-specific, rather than generic.
1.1 Problem Statement
The main problem statement or hypothesis for this study was:
Is Ceramic filtration a suitable technology for dewatering of a friable itabirite
iron-ore concentrate product?
The main aim of this project was intended to enhance the understanding of ceramic filtration
technology, specifically with regards to the suitability of such filter units for large-scale, operational
dewatering of iron-ore product. The project encompassed verification of stated benefits of this
technology, advancing our knowledge of unit capacity estimation, assisting in identifying factors that
positively and negatively impact filter efficiency, and evaluating mitigating measures that may be
considered to optimise productivity of the ceramic filtration units to ensure sustainability of
- 5 -
performance of the filter units to meet operational needs. Variables in this study included: pH value,
acid type used for pH adjustment, flocculant addition and type of acid required to clean the filter
units in the backwash cycle.
1.2 Aims and Objectives
For this project, the following objectives were:
1. Assessment of optimal operational conditions, as derived from previous bench-scale and
pilot-plant testwork data.
2. Evaluation of dry solids capacity of the ceramic filter. This was established using optimal
conditions for operating the bench-scale ceramic leaf-test filtration unit.
3. Evaluation of the impact of reagent addition and slurry modification on filtration capacity.
4. Evaluation of the impact on filtration efficiency when using alternative acids for slurry
neutralisation.
5. Investigation of the impact on filtration efficiency using different acids for cleaning and disc
regeneration regimes.
It would be also be important to establish how temperature changes affect filtration efficiencies and
the reasons for these changes.
1.3 Structure of Dissertation
This dissertation is divided into five chapters with Chapter 1 providing a high level overview of the
project, describing the challenges to be addressed in the study, and presenting the aims and objectives
as well as some ancillary research questions.
A literature review is presented in Chapter 2 where iron-ore is discussed both globally and also
specifically in Brazil, where the ceramic units for this study are located. The processing stages in
iron-ore beneficiation are described along with the two modes of dewatering used at the operation,
namely thickening and filtration. The different types of filtration and their uses are examined, with
ceramic filtration addressed in detail, describing the mechanism, operating principles and factors
affecting this mode of filtration. A review of previous testwork is given which includes the results of
a comparison of different filtration systems conducted by the Minas Rio Operation. Consideration of
operational testwork results and prior academic research work conducted in the ceramic filtration
field form the basis for testwork requirements for this study.

- 6 -
Chapter 3, the study design, describes the test methodology, including sample and reagent
preparation, test equipment, filtration operating instructions, calculations, testwork design, and
testwork performed.
Chapter 4 describes the testwork results with a discussion of the results, while Chapter 5 presents the
principal conclusions and recommendations. More detailed information of previous testwork and
studies, standard operating procedures for the ceramic filtration leaf-tests, calculations and detailed
testwork results comprise the appendix.

- 7 -
CHAPTER 2
2.1 LITERATURE REVIEW
2.1.1 Iron Ore Globally
Iron ore is a mineral that provides an economically viable source of metallic iron (Fe) (Callaghan,
2014; Tuck, 2014). It is estimated that the world iron-ore resource exceeds 800 Bt, from which 230
Bt of iron contained can be extracted (Tuck, 2014). Iron ore is used primarily in the production of
steel and is mined in approximately fifty countries, of which the seven largest producers are
responsible for three quarters of the total world production. The top iron ore-producing countries are
Australia, Brazil, Russia, China, India, Ukraine and South Africa (Alden, 2014; Riggs & Scott, 2014;
Tuck, 2014). Australia and Brazil are the top iron-ore exporters, each contributing one third of the
world’s total iron-ore exports (Callaghan, 2014; Crusador Resources Limited, 2014).
Most iron-ore resources occur in rocks known as banded-iron formations (BIF), which are chemically
precipitated sediments formed during the Archean Eon more than 2.5 billion years ago (Gӧrres &
Hindstrӧm, 2007). These BIF comprise vast, thin layers of sediment, formed as a result of the ferrous
iron present in the seas scavenging the oxygen produced as a waste product by the first blue-green
algae (cyanobacteria), to form solid mineral iron oxides (Alden, 2014).
The four main types of BIF distinguished are restricted to well-defined time intervals in the
Precambrian age (Gutzmer & Beukes, 2003):
1. Algoma-type BIF are found in the Archean greenstone belts and formed prior to 2.75 Giga
annum (Ga) (U.S. Department of the Interior US Geological Survey, 2007). This BIF type is
restricted and is always associated with mafic volcanic rocks. These deposits can be found in
Zimbabwe (Gutzmer & Beukes, 2003).
2. Hamersley-Transvaal-type BIF are very large and laterally extensive iron formations formed
between 2.0 and 2.75 Ga. They form the largest mineral deposits and are not associated with
penecontemporaneous volcanism. BIF-hosted ore deposits of most economic value are
restricted to this group. These deposits can be found in South Africa (Transvaal Group),
Brazil and Western Australia (Hamersley Group) (Gutzmer & Beukes, 2003).

- 8 -
3. Granular iron formations are closely related to, but younger than, the Hamersley-Transvaal
type, having being formed in 1.8 to 2.1 Ga. They differ in having a smaller lateral extent and
coarser banding, their typical composition comprising closely packed granules and oolites of
iron oxide or chert. These are found in the Lake Superior region of North America (Gutzmer
& Beukes, 2003).
4. Rapitan-type BIF are Neoprotozoic iron-ore formations deposited 0.8 to 0.6 Ga, and are
associated with glaciormarine sediments. These deposits are found in Canada (Rapitan-
group), Australia (Yudnamutare sub-group), Namibia (Chous formation) and Brazil (Jacadio
group) (Gutzmer & Beukes, 2003).
Iron ore comprises various iron-oxide minerals. The primary forms are magnetite, Fe3O4 (72 % Fe),
and haematite, Fe2O3 (70 % Fe). Lesser forms are goethite, FeO(OH) (63% Fe), and limonite, a
mixture of hydrated iron oxides (up to 60 %) (Callaghan, 2014; Gӧrres & Hindstrӧm, 2007).
Precambrian iron formations have similar major element compositions, with iron concentrations
ranging between 23 wt% and 34 wt% and Fe2+
/(Fe2+
+ Fe3+
) ratios between 0.05 % and 0.58 %. SiO2
occurs in concentrations of 43 wt % to 55 wt %. Minor elements comprise CaO, MgO, Al2O3, Mn,
Na2O, K2O and P (Gutzmer & Beukes, 2003).
Metallic iron is formed when iron ore is heated in the presence of a reductant (Callaghan, 2014). A
reductant is defined as a reactant that donates electrons to other reactants during a redox reaction
(Helmestine, 2014). The most common process used to produce metallic iron is by heating the iron
ore at high temperatures with a reductant, usually coke, in a blast furnace (Labrador Iron Mines
Holdings Limited, 2014). The iron-ore feed can be used directly as lump ore, or as fine ore, which
requires agglomeration via sintering (Tuck, 2014) or pelletising (Dempsey et al., 2013 - 2015).
High-grade haematite can be fed directly to blast furnaces. Haematite-based iron ore often requires
beneficiation, typically by dense medium separation (DMS) and gravity concentration, but is also
mined as direct shipping ore, i.e., no beneficiation is required. Magnetite is considered to be the
dominant economic iron mineral in low-grade iron ore deposits and beneficiation often comprises
wet-magnetic separation after initial fine grinding to produce a high-grade concentrate. This
concentrate can then be pelletized and the pellets indurated to produce a high-grade feed for blast

- 9 -
furnaces (Labrador Iron Mines Holdings Limited, 2014). Iron-ore formations that are metamorphosed
and later strongly weathered to a saprolite comprising coarse-grained iron oxides and quartz, such as
the itabirite found in Brazil, require beneficiation by various methods including reverse flotation and
dense medium separation (Gutzmer & Beukes, 2003).
2.1.2 Iron Ore in Brazil
Iron ore is one of Brazil’s principal commodities, with nearly 30 Bt of measured and indicated
resources, giving this country the second-largest iron-ore resources in the world. Large areas remain
unexplored and could potentially increase the resources prediction. Over 95 % of the iron ore is
produced in the state of Pará in the north of Brazil and in Minas Gerais in the east. Minas Gerais has
an area of +586 thousand square kilometres, with Belo Horizonte, the capital situated approximately
150 km south of the centre of the state of Minas Gerais. The 7200 square kilometre area, just south of
the state capital Belo Horizonte is the most developed mining region in the country. The state of
Bahiá, just north of Belo Horizonte, which has lower grade iron ore than the grades found in Pará and
Minas Gerais, is expected to become the third-largest iron-ore producing region in Brazil once
expected projects come on-line in 2014. (Mining Leaders, 2013). The percentage of iron present in
the iron ore defines the grade. An iron content of 60 % or more would constitute a high grade ore,
while Labrador Iron Mines Holdings Limited, 2012 state that low-grade ore is a term applied to iron-
rich rocks with cut-off grades in the range of 25-30 % iron. Grades of 40 % were previously
considered uneconomical to process, but higher iron ore prices allowed processing of these grades
possible. The grade of the haematite rich deposit at Minas Rio averages at 39.5 % and is relatively
low in impurities. The cut-off grade for a particular ore deposit would be dependent on the impurities
present in the ore, the amenability of the ore to beneficiation, and the final product grade achieved.
The cost of production could then be compared against the average iron ore price, to assess the
economic cut-off grade.
Itabirite is the name given in Brazil to metamorphosed BIFs, and the iron belt located in Minas
Gerais is known as the “Quadrilátero Ferrifero”, the Iron Ore Quadrilateral. The grade of iron ore
typically found in BIFs varies from 20 % to 35 %, but grades of 55 % and more can also sometimes
be found, as in the iron-ore deposits in Pará (Mining Leaders, 2013; Proactive Investors, 2012).
Figure 2.1 shows the Friable iron-ore type found at the Minas-Rio operation, and Figure 2.2 gives
examples of (a) friable, (b) semi-compact, and (c) compact itabirite.

- 10 -
Figure 2.1: Friable iron-ore at the Minas-Rio operation.
(a) Friable Itabirite (b) Semi-compact Itabirite (c) Compact (natural) Itabirite
Figure 2.2: Friable, semi-compact and compact itabirite (Turrer et al., 2013; Turrer et al.,
2015).
The Minas-Rio Iron-Ore Project is one of the largest iron-ore Greenfield projects currently under
development in the Minas Gerais region. The total mineral resource quoted by Joint Ore Reserves
(a)
(a) (b)
(b)
(c)
(c)
- 11 -
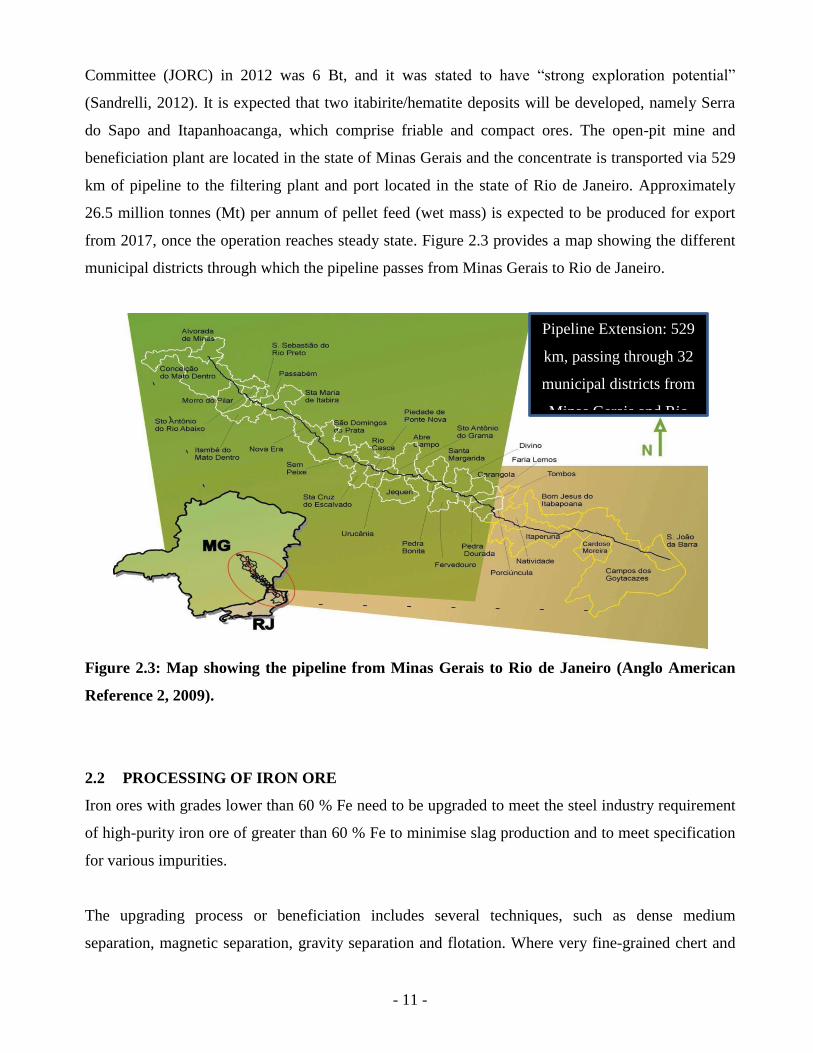
Committee (JORC) in 2012 was 6 Bt, and it was stated to have “strong exploration potential”
(Sandrelli, 2012). It is expected that two itabirite/hematite deposits will be developed, namely Serra
do Sapo and Itapanhoacanga, which comprise friable and compact ores. The open-pit mine and
beneficiation plant are located in the state of Minas Gerais and the concentrate is transported via 529
km of pipeline to the filtering plant and port located in the state of Rio de Janeiro. Approximately
26.5 million tonnes (Mt) per annum of pellet feed (wet mass) is expected to be produced for export
from 2017, once the operation reaches steady state. Figure 2.3 provides a map showing the different
municipal districts through which the pipeline passes from Minas Gerais to Rio de Janeiro.
Figure 2.3: Map showing the pipeline from Minas Gerais to Rio de Janeiro (Anglo American
Reference 2, 2009).
2.2 PROCESSING OF IRON ORE
Iron ores with grades lower than 60 % Fe need to be upgraded to meet the steel industry requirement
of high-purity iron ore of greater than 60 % Fe to minimise slag production and to meet specification
for various impurities.
The upgrading process or beneficiation includes several techniques, such as dense medium
separation, magnetic separation, gravity separation and flotation. Where very fine-grained chert and
Pipeline Extension: 529
km, passing through 32
municipal districts from
Minas Gerais and Rio
de Janeiro States
- 12 -
iron-rich layers occur in older BIF, very fine grinding is required to liberate the valuable iron ore to
allow for efficient beneficiation (Proactive Investors, 2012).
Brazil’s itabirite mineral deposits facilitate the production of high-grade concentrate with very low
impurity (phosphorus, alumina and silica) content. Beneficiation of this haematite-rich, ore type is
technically straightforward and does not require the use of new technology (Sundance Resources Ltd,
2014): “Friable itabirite has been extensively leached over millions of years which leads to a higher
Fe content, lower comminution energy consumption and simpler removal of contaminants.” (Anglo
American Reference 2, 2009).
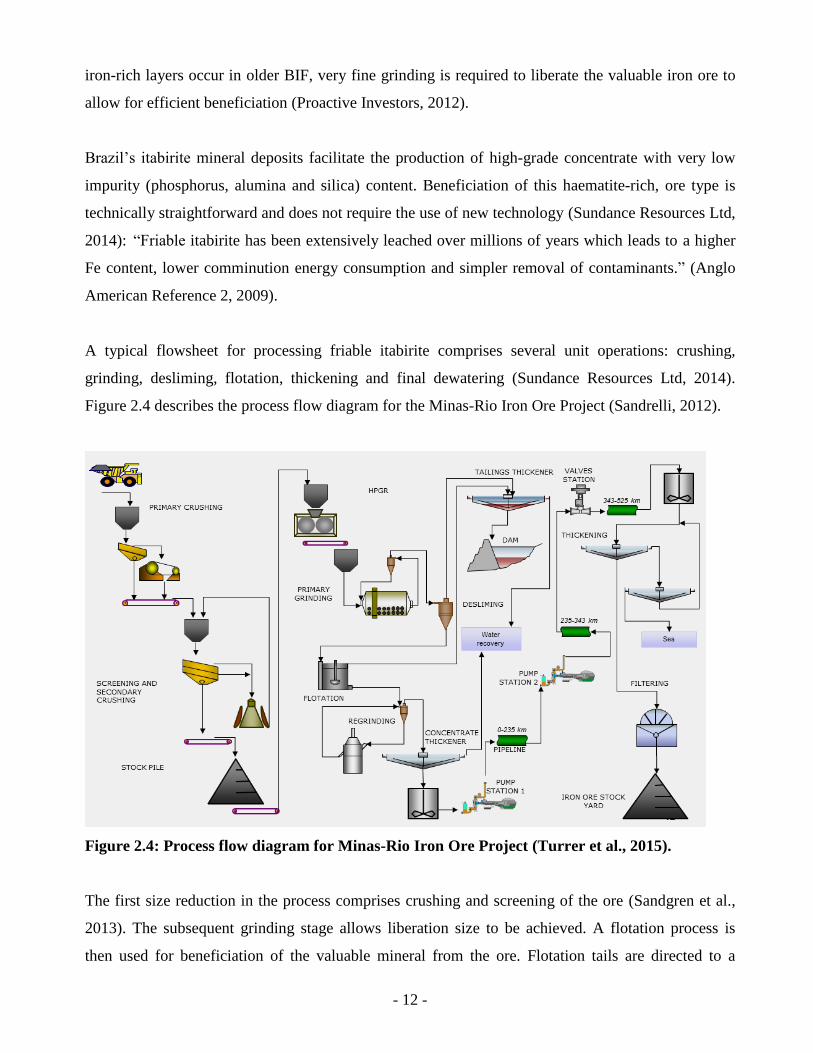
A typical flowsheet for processing friable itabirite comprises several unit operations: crushing,
grinding, desliming, flotation, thickening and final dewatering (Sundance Resources Ltd, 2014).
Figure 2.4 describes the process flow diagram for the Minas-Rio Iron Ore Project (Sandrelli, 2012).
Figure 2.4: Process flow diagram for Minas-Rio Iron Ore Project (Turrer et al., 2015).
The first size reduction in the process comprises crushing and screening of the ore (Sandgren et al.,
2013). The subsequent grinding stage allows liberation size to be achieved. A flotation process is
then used for beneficiation of the valuable mineral from the ore. Flotation tails are directed to a

- 13 -
tailings thickener while the concentrate undergoes a regrinding process before reporting to the
concentrate thickener. The pellet feed concentrate slurry is then pumped 529 km to a port facility
where the product is further dewatered before reporting to ceramic filtration units for final
dewatering to achieve the required 8 % wet mass moisture content for pelletising concentrate.
2.2.1 Comminution - Crushing and Grinding
Once the ore has been mined at Minas-Rio by means of opencast methods, it requires preparation for
beneficiation. This is achieved by comminution, in which ore is reduced to a particle size which
allows the haematite to be sufficiently liberated from the quartz ensuring the two minerals can be
separated by a suitable beneficiation process. The two principle processes in comminution are
crushing and grinding: crushing reduces ore to a minimum particle size of 7 mm; grinding further
reduces the particle size (Gilchrist, 1980). At the Minas-Rio operation, primary crushing reduces ore
from 850 mm to 150 mm. Banana-type vibrating screens screen the ore at 25 mm. The +25 mm
oversize reports to cone crushers which reduce this fraction to –25 mm. High pressure grinding rolls
are used to reduce the –25 mm undersize fraction to –3 mm. Ball mills are employed for final size
reduction to –0.15 mm.
2.2.1.1 Primary Crushing
Primary crushing of iron ore is usually carried out using jaw and gyratory crushers (Wills, 1997). Jaw
crushers operate on the principle of accepting ore into a wedge-shaped space between a fixed
crushing plate and an oscillating plate. The ore is nipped until it fractures, with fragments falling to a
narrower part of the wedge to repeat the process. This process continues until the ore escapes through
the pre-set gap at the bottom (Gilchrist, 1980).
The relative motion of the crushing faces in a gyratory crusher is caused by the gyration of an
eccentrically mounted cone, thus applying a tangential force in addition to the simple nip. In this
instance, ore is also broken against ore, resulting in fines and minimising wear on the facings.
Gyratory crushers are able to handle approximately ten times the throughput of jaw crushers, but can
only accept lump sizes of up to 2 m diameter, as opposed to the 3 m limit of jaw crushers. Gyratories
also handle hard, brittle materials best, while jaw crushers are most effective on soft or plastic
minerals, such as clays that pack together and hinder free flow of ore through the crusher (Gilchrist,
1980).

- 14 -
Jaw crushers are used in the primary crushing stage to reduce the oversize reporting from the grizzly
screens from 850 mm to 150 mm (Anglo American Reference 1, 2011). Figure 2.5 is an example of a
typical jaw crusher that would be used at full-scale operation.
Figure 2.5: Jaw crusher (Astec Industries Inc, 2014).
2.2.1.2 Secondary Crushing
Equipment used for secondary crushing can include cone crushers, rolls or hammer mills. The cone
crusher functions in a similar manner to the gyratory crusher, but is self-cleaning owing to the gap
widening to allow product to pass through after the nip has been made. These crushers have a high
capacity and are the preferred choice for iron ores. Cone crushers are used in the secondary crushing
stage at the Minas-Rio operation to reduce material to the –25 mm size fraction required to feed the
high pressure grinding rolls (Anglo American Reference 1, 2011). Figure 2.6 is an example of a cone
crusher.
Figure 2.6: Cone crusher (Astec Industries Inc, 2014).

- 15 -
2.2.1.3 Tertiary Crushing
High pressure grinding rolls (HPGR) are often used to debottleneck conventional crushing/milling
circuits and can replace or supplement conventional cone (tertiary) crushing capacity. The HPGR
comprises a pair of counter-rotating rolls: one roll is fixed in a sturdy frame while the other is
positioned using pneumo-hydraulic springs and allowed to float on rails. Feed is introduced into the
gap between the rolls and crushing is achieved by compression and inter-particle breakage. Operating
pressures typically range between 50 bar and 150 bar. Comminution performance is predominantly
determined by the pressure exerted by the hydraulic system on the floating roll (Morley, 2010).
Benefits of using HPGR technology include reduced energy demand in downstream comminution
processes and improved leaching and flotation performance owing to internal fracturing of the
particles known as micro-fracturing (Morley, 2010; Rosario & Hall, 2010). HPGR generally reduces
material to –3 mm size fraction (Dempsey et al., 2013 - 2015). Figure 2.7 is a schematic of a HPGR
taken from an FLSmidth product website.
Figure 2.7: Schematic of a typical HPGR (FLSmidth & Co., 2014).
2.2.1.4 Grinding
Grinding is the final stage of the comminution process and is primarily carried out in ball mills or
similar equipment. The particle size of the ore is reduced from between 5 mm and 50 mm to between
10 µm and 300 µm by a combination of impact, attrition and abrasion. Correct grinding is vital to
achieve the appropriate degree of liberation of the value mineral and also to increase the surface area.
Undergrinding will result in the product being too coarse and the extent of liberation insufficient for
- 16 -
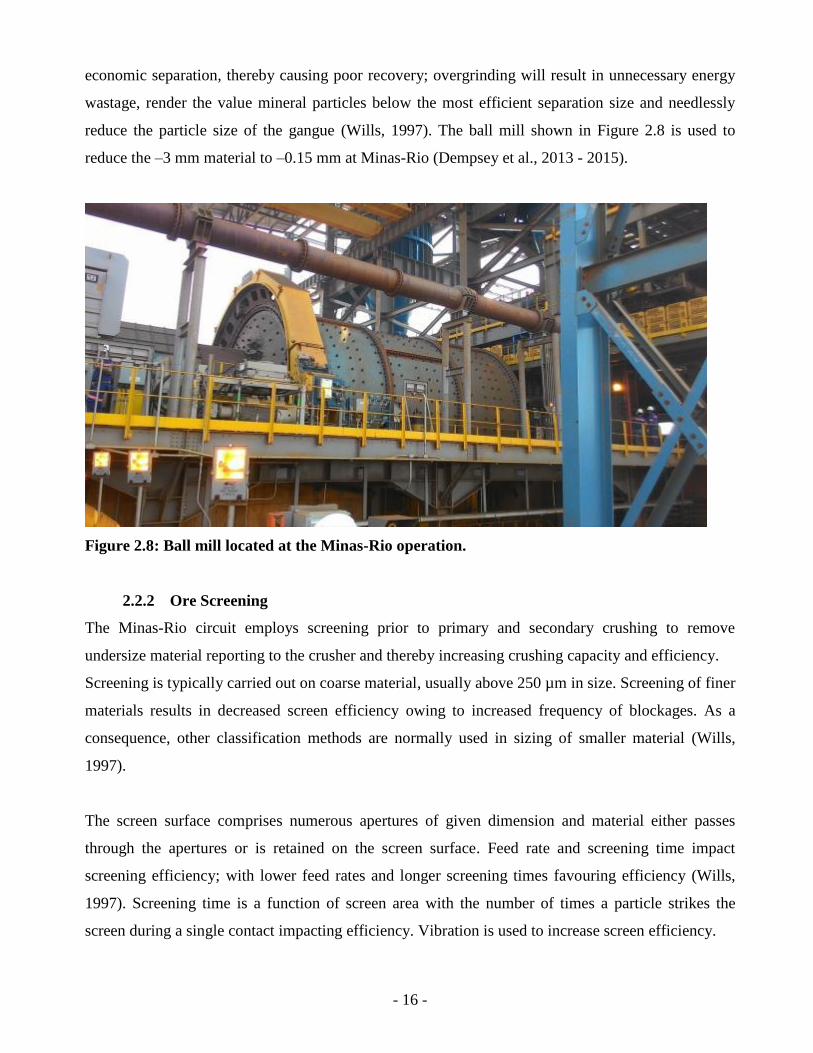
economic separation, thereby causing poor recovery; overgrinding will result in unnecessary energy
wastage, render the value mineral particles below the most efficient separation size and needlessly
reduce the particle size of the gangue (Wills, 1997). The ball mill shown in Figure 2.8 is used to
reduce the –3 mm material to –0.15 mm at Minas-Rio (Dempsey et al., 2013 - 2015).
Figure 2.8: Ball mill located at the Minas-Rio operation.
2.2.2 Ore Screening
The Minas-Rio circuit employs screening prior to primary and secondary crushing to remove
undersize material reporting to the crusher and thereby increasing crushing capacity and efficiency.
Screening is typically carried out on coarse material, usually above 250 µm in size. Screening of finer
materials results in decreased screen efficiency owing to increased frequency of blockages. As a
consequence, other classification methods are normally used in sizing of smaller material (Wills,
1997).
The screen surface comprises numerous apertures of given dimension and material either passes
through the apertures or is retained on the screen surface. Feed rate and screening time impact
screening efficiency; with lower feed rates and longer screening times favouring efficiency (Wills,
1997). Screening time is a function of screen area with the number of times a particle strikes the
screen during a single contact impacting efficiency. Vibration is used to increase screen efficiency.

- 17 -
Screens are classified into either static or moving screens. Stationary screens include the grizzly,
which is used for screening of very coarse material, sieve bends, which are used for very fine wet
screening purposes, and Hukki screens, which are used in grinding circuits and employ a
combination of classification and screening. Moving screens employ a vibrating mechanism and they
represent the vast majority of screens used as movement is required for increased efficiency (Wills,
1997).
At Minas-Rio, grizzly screens are used for primary screening and classify at 850 mm, while
secondary screening is carried out by vibrating banana screens which classify at 25 mm. Banana
screens are available as single or double decks and take their name from the banana-like arrangement
of the screen linings which enables sieving of larger quantities of material with a high component of
fine particles (Schenck Process, 2014). An example of a grizzly screen is given in Figure 2.9 and a
banana screen is shown in Figure 2.10.
Figure 2.9: Grizzly scalper (Metso Corporation, undated).

- 18 -
Figure 2.10: Multi-slope banana screen – Enestee (Enestee Engineering, undated).
2.2.3 Hydrocyclone classification and desliming
Grinding is generally in a closed circuit with a classification step where the mill product reports to a
hydrocyclone or clusters of hydrocyclones when high capacity is needed. The hydrocyclone
underflow, comprising coarser particles, is returned to the ball mills for further grinding. At Minas-
Rio the classification cyclone overflow, comprising correctly sized particles proceeds to desliming.
The hydrocyclone comprises a conical-shaped vessel, which is open at the axis, joined to a
cylindrical section, which has a tangential feed inlet. The hydrocyclone operates by utilizing
centrifugal force to accelerate the settling of particles and separates particles according to size and
specific gravity. Feed is introduced under pressure and the tangential entry imparts a swirling motion
to the pulp, resulting in a vortex being formed with a low pressure zone along the vertical axis. Two
opposing forces act on the particles: an outward centrifugal force and an inward drag force. The
centrifugal force, causes the faster moving particles to move to the area of lowest velocity, the wall of
the cyclone, and then they move up the wall and out through the apex opening; the inwardly acting
drag force results in the slower moving particles collecting in the low pressure zone, after which they
are carried up through the vortex finder to the overflow (Schenck Process, 2014). Desliming is
required at Minas-Rio to remove the –10 µm particles from the hydrocyclone overflow which reports
to the tailings thickener. This is necessary as flotation of –10 µm iron-ore particles is highly

- 19 -
inefficient and results in higher reagent consumption (Dempsey et al., 2013 - 2015). Underflow from
the desliming hydrocyclones reports to the flotation circuit via conditioning tanks. Figure 2.11 shows
the desliming hydrocyclone clusters at the Minas-Rio operation.
Figure 2.11: Hydrocyclone clusters located at the Minas-Rio operation.
2.2.4 Flotation
Flotation involves a selective process whereby specific mineral particles are separated from complex
ores by utilizing differences in the physicochemical surface properties of the various minerals (Wills,
1997). Flotation is a process in which ore minerals can be differentiated from gangue, and from one
another, by arranging conditions so that, upon agitation of the mineral pulp along with the
introduction of air bubbles into the system, certain minerals are rendered hydrophobic, whilst others
remain hydrophilic. The fine hydrophobic mineral particles attach themselves to the bubbles, and are
then floated out of the aqueous ore pulp in a froth, which is skimmed off, leaving the hydrophilic
gangue minerals behind (Gilchrist, 1980; Schultz & Cooke, 1953). Differences between surface
properties of ore and gangue minerals are amplified by selectively adsorbing organic compounds
called collectors onto the mineral that is required to float.
Collectors comprise three types, namely: oils, organic acids and their salts and organic bases. The
choice of collector is dependent on the nature of the minerals involved, their degree of oxidation and
the presence of other heavy metals in the pulp. “Conditioners” and “regulators” are reagents that are
mixed with the pulp primarily to control pH within narrow limits. Minerals display different critical
pH values with the same collector and controlling pH allows some degree of differentiation between
the minerals. Other reagents that might be added to render the mineral surface more or less amenable

- 20 -
to the action of the collector are “activators” and “depressors”, respectively. Activators render the
mineral surface more amenable to the collector, while depressors render a surface more inactive to a
collector or amplify the minerals natural hydrophilic affinity. Wetting agents can be added to ensure
proper wetting of gangue minerals thereby preventing them from floating. “Frothers” are generally
used to ensure a stable froth formation with sufficient buoyancy to carry the floated mineral load out
of the pulp (Gilchrist, 1980).
Flotation is typically used to concentrate ores in the smaller size fraction range (<149 µm) and, in the
case of iron ore, a number of flotation options exist, namely: reverse cationic flotation of quartz,
direct anionic flotation of iron oxides and reverse anionic flotation of activated quartz (Araujo et al.,
2005). Quartz represents the most common gangue mineral in iron ore and can be selectively
separated from hematite using a reverse flotation process (Dempsey et al., 2013 - 2015).
In normal or direct flotation, the valuable mineral is usually transferred to the froth, leaving the
gangue in the pulp or tailings. Reverse flotation works in the opposite way, in that the gangue reports
to the froth fraction and the valuable mineral reports to the “tails” (Vidyadhar & Singh, undated). A
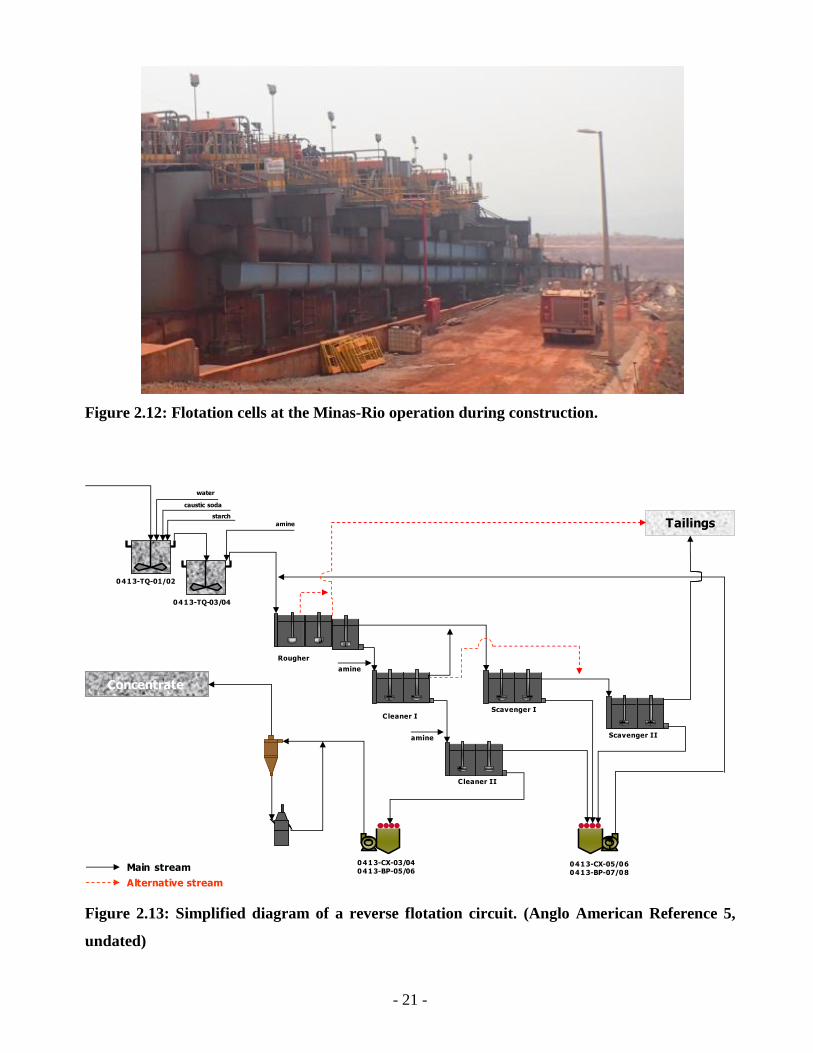
flotation circuit usually comprises rougher, cleaner and scavenger stages. A photograph of a bank of
flotation cells at the Minas-Rio operation is given in Figure 2.12. The Scavenger concentrates reports
to the tailings thickener, while the Scavenger tails are recycled to the Rougher feed. The Cleaner
concentrates report to the Scavenger feed, while the Cleaner tails are the final product reporting to the
Verti mills for further regrinding. A diagram of a reverse flotation circuit at Minas Rio is given in
Figure 2.13. The flotation circuit product or concentrate requires regrinding from –150 µm to –45 µm
to allow efficient concentrate slurry pumping to the port. A bank of four Verti mills, as well as the
internal structure of a Verti mill, is shown in Figure 2.14.
Lima et al. (2014), in their study of the effect of amine and starch dosages on reverse cationic
flotation of iron ores, found that reverse cationic flotation of quartz has successfully been employed
for particles below 150 µm that have previously been deslimed. This is the methodology employed at
Minas-Rio. Amine is used as the quartz collector, while starch is used as the iron-oxide depressant.
Metallurgical recoveries of 80 % are stated with ~ 47 % mass recovery (Sandrelli, 2012; Anglo
American Reference 5, undated).
- 21 -
Figure 2.12: Flotation cells at the Minas-Rio operation during construction.
Figure 2.13: Simplified diagram of a reverse flotation circuit. (Anglo American Reference 5,
undated)
water
caustic soda
starch
amine
0413-TQ-01/02
0413-TQ-03/04
Rougher
Cleaner I
Cleaner II
Scavenger I
Scavenger II
0413-CX-05/06
0413-BP-07/08
0413-CX-03/04
0413-BP-05/06
Tailings
Concentrate
Main stream
Alternative stream
amine
amine

- 22 -
Figure 2.14: Verti mills at the Minas-Rio operation.
2.3 DEWATERING – SOLID–LIQUID SEPARATION
2.3.1 Thickening
Following flotation both concentrate and tailings need to be dewatered. The overflow from re-
grinding classification reports to a concentrate thickener, while the slimes from the desliming circuit
and Scavenger concentrate from the flotation circuit report to a tailing thickener. The thickened
underflow material from the tailings thickener is pumped to a tailings facility while the overflow
from this and the concentrate thickener report to a water recovery tank. The concentrate is thickened
to approximately 68 % solids concentration and after pH adjustment and coagulant addition (added
for both rheology control and corrosion protection of the pipeline), the underflow is pumped 529 km
to the port facility where it is again thickened before reporting to ceramic filter units for final
dewatering of product.
Dewatering, or solid-liquid separation, is broadly classified into three groups, namely: sedimentation,
filtration and thermal drying. At Minas Rio, a sedimentation process is used to dewater the
concentrate and tailings material to produce thickened pulps. Thickening is a process whereby solid
particles in slurry are settled and a thickened underflow and clarified liquid overflow are produced.
This dewatering technique is most efficient when there is a large difference in density between the
solid and the liquid and the settling rates of particles are governed by either Newton’s Law or Stokes’
Law, depending on the particle size. Stokes’ Law assumes that the drag force on a spherical particle

- 23 -
falling under gravity is entirely due to viscous resistance and holds for particles below 50 µm in
diameter, while Newton’s Law assumes that the drag force is entirely due to turbulent resistance and
holds for particles larger than 0.5 cm. Both laws show that the terminal velocity of a particle in a
particular fluid is a function of only particle size and density (Wills, 1997).
A thickener comprises a cylindrical tank above a cone section that tapers to a single outlet. Feed
slurry, flocculant and, in certain applications coagulant are pumped into a feedwell which is located
within the thickener. The feedwell serves to dissipate energy and allow mixing of solid particles with
flocculant to form aggregated particles. The aggregated solids then exit the feedwell and settle out to
form a bed that is of much higher solids’ concentration than the feed. The thickened solids are
removed via the underflow take-off while the clarified liquor reports to the thickener overflow
(CSIRO, 2011). The overflow is directed to a clarifier for further clarification before re-use in other
processes. A photograph of a thickener at the Minas-Rio operation is shown in Figure 2.15.
Figure 2.15: Thickener before commissioning showing feedwell and rakes at the Minas-Rio
operation.
Slow settling rates require long residence times within a thickener and a chemical approach is often
used to induce aggregation of particles. This may involve addition of either a coagulant and/or a
flocculant to enhance the settling process. Coagulation is an electrostatic process; coagulants are salts
of multivalent cations that reduce the negative surface charge of the solid particles, thereby reducing
the repulsive potential of the electrostatic double later around a particle. By reducing the repulsive

- 24 -
potential the dispersed particles are able to move closer together, which increases the probability of
collisions and leads to aggregation. Flocculants are typically synthetic, water-soluble polymers that
are sufficiently large to form a physical bridge between two particles causing loose, porous, three-
dimensional structures to form (Wills, 1997). Flocculant acts to bring together dispersed particles,
thereby increasing the particle size and breaking the stability of the suspension, allowing water to be
released. Over-flocculation can result in the formation of a high proportion of large, strong
aggregates that can lead to strongly networked beds that are not easily compressed and thereby limit
the dewatering achieved. This, in turn, creates lower density underflows with higher yield stresses.
Flocculants are available in a range of ionic charge and molecular weight with either cationic or
anionic charge (Moss & Dymond, undated).
2.3.2 Filtration
Once the concentrate arrives at the port facility in the state of Rio de Janeiro, a second stage of
thickening commences, to ensure that underflow solids concentrations are no less than 68 % solids,
with solids percentages of 70 % or higher being desirable to achieve improved filtration efficiencies.
Filtration is used as the final dewatering stage to ensure that the final concentrate meets the required
8 % moisture specifications.
Filtration involves separating solids from liquids using a porous medium that is able to retain solids
but allow liquid to pass through. A filter cake is formed on the filter medium and resistance to flow
progressively increases, with increasing cake thickness. Factors affecting the rate of filtration include
(Wills, 1997):
The pressure drop from the feed to the far side of the filter medium;
The area of the filtering surface;
The viscosity of the filtrate;
The resistance of the filter cake; and
The resistance of the filter medium and the initial layers of cake.
Filtration is a mechanical operation that is less energy demanding than evaporation or drying
(Coulson & Richardson, 2002). Filtration equipment and media are designed to meet the needs of a
particular application and industrial filters typically use vacuum, pressure or centrifugal force to drive
the liquid through the deposited cake of solids (Sinnott, 1993). The filtration process can either be
continuous, discontinuous or batch. Discontinuous filtration methods, such as plate-and-frame

- 25 -
presses, require a shut-down to discharge the cake, while a continuous process, such as a rotating-
drum filter, requires periodic stoppages to change filter cloths. It is possible to couple batch filters to
a continuous plant if several units are used in parallel or if buffer storage capacity is available for the
feed and product. According to Sinnott (1993), the overriding factor to consider when selecting
filtration equipment is the filtration characteristics of the slurry. These can be determined at
laboratory or pilot-plant scale. Other important factors to consider also include:
The nature of the slurry and the cake formed;
The solids’ concentration in the feed;
The throughput required;
The nature and physical properties of the liquid;
If cake washing is required;
The cake dryness required;
The impact of filter aid contamination of solids; and
Whether the valuable product is the solid, the liquid or both.
2.3.2.1 Filter Selection
Filter selection relies on fulfilling a number of operational requirements which, amongst others,
include cost considerations, filtration efficiency, ease of discharge of filter cake and cake moisture
achievable. Batch filtration techniques are often employed where filter cakes show high resistance
and where high pressures are required which cannot be achieved with the reduced pressures used in
the operation of most continuous filters. The most common types of filters are filter presses, leaf
filters and continuous rotary filters (Coulson & Richardson, 2002). Rotary drum filters provide high
filtration capacity for their relative size and require minimal manual attention, rendering them
generally the most satisfactory units for free-filtering materials. Coulson and Richardson (2002) are
of the opinion that rotary drum filters are not suitable in instances where frequent dismantling of the
filter press becomes necessary owing to low solids content, in instances where frequent washing is
required or where small quantities of solids are present in a liquid. The authors also stress that, in all
occasions, it is necessary to conduct bench-scale laboratory tests to obtain filtration rates and specific
resistance information that can be scaled up to industrial filters, provided that compressibility of the
filter cake is taken into account. Caution is advised in using laboratory data without sufficient
practical experience in design of industrial units, owing to factors such as differing flow channels
observed in industrial units and the structure being significantly influenced by the manner in which
the cake is deposited. A “compressibility–permeability” test cell, developed by Ruth and Grace, is

- 26 -
recommended for testing slurry behaviour under various filtration conditions. A guide to filter
selection using slurry characteristics, provided by Sinnott (1993), is reproduced in Table 2.1
Table 2.1: A guide to filter selection (Sinnott, 1993).
Slurry Characteristics Fast
Filtering
Medium
Filtering
Slow
Filtering
Dilute Very Dilute
Cake formation rate cm/s mm/s 0.02 - 0.12
mm/s
0.02
mm/s No cake
Normal concentration 20 % 10 – 20 % 1 – 10 % 5 % < 0.1 %
Settling rate Very fast Fast Slow Slow -
Leaf test kg/h.m2 > 2500 250 – 2500 25 – 250 < 25 -
Filtrate rate m3/h.m
2 > 10 5 – 10
0.02 –
0.05 0.02 – 5 0.02 – 5
Filter application
Continuous vacuum filters
Multi-compartment drum x x x
Single compartment drum x
Top feed drum x
Scroll discharge drum x x
Tilting pan x x
Belt x x
Disc x x
Batch filters
Batch vacuum leaf x x x x
Batch Nutsche x x x x x
Batch pressure filters
Plate-and-frame x x x x
Vertical leaf x x x x
Horizontal plate x x x x x
Cartridge edge x

- 27 -
2.3.2.2 Pressure Filters - The Filter Press – Plate-and-Frame Press
Owing to the virtual incompressibility of solids, pressure filtration can be advantageous over vacuum
filtration due to higher flow rates and improved washing and drying as a result of the higher pressures
used. Most pressure filters do, however, operate as batch filters because of the difficulty of solids
removal from the pressure-filter chamber (Wills, 1997). Plate-and-frame presses are batch filters
which are operated using pressure and are constructed in a variety of materials. They are capable of
handling viscous liquids and cakes with high specific resistance (Sinnott, 1993). Plates and frames
are arranged alternately and supported on a pair of rails. The plates are ribbed with the carefully
machined edges standing slightly proud. A filter cloth separates the hollow frame from the plate and
the press is closed either hydraulically or by hand screw, thereby forming a chamber between each
successive pair of plates. Slurry is introduced through a port in each frame and filtrate passes through
the cloth on each side, simultaneously forming of two cakes, one in each chamber, which combine
when the frame is full. A schematic diagram of a plate-and-frame filter is shown in Figure 2.16,
where A, represents the inlet passage; B, the feed ports; C, the filtrate outlet; D, the frames, and F, the
plates (Coulson & Richardson, 2002).
Figure 2.16: Plate-and-frame press (Coulson & Richardson, 2002).
Advantages of this type of filter press include (Coulson & Richardson, 2002):
Versatility owing to the simplicity of the unit, allowing use for a wide range of slurries and
materials to be processed under varying operating conditions of cake thickness and pressure;

- 28 -
Low maintenance costs;
Small footprint with a large filtering area and few additional associated units required;
Leakages are easily detectable as a result of most joints being external;
High pressure operation is usually possible; and
Equally suitable in instances where the cake or the liquid are the main product.
Disadvantages of this filter press include:
Intermittent in operation and continual dismantling can cause high wear on the cloths; and
Fairly heavy on labour.
2.3.2.3 Pressure Filters – Pressure Leaf Filters
Leaf filters are used in similar applications to plate-and-frame presses, but operating costs are
generally lower. The leaves can be arranged either in horizontal or vertical rows (Figure 2.17) and
comprise metal frames which are draped with fabric or wire filter cloths. Filter cake is removed
mechanically or with water jets (Coulson & Richardson, 2002; Sinnott, 1993).
Figure 2.17: “Verti-jet” pressure filter (Coulson & Richardson, 2002).
These filters are designed for final discharge of dry or wet solids under totally enclosed conditions
and are fully automated. Slurry is introduced into the pressure vessel and solids are retained on the

- 29 -
leaf surface while the liquid passes out of the filter through the drainage circuit. Pressure, cake
quantity or batch capacity determine the cycle time. Pre-coat material, such as diatomaceous earth or
Perlite, can be used to coat the leaves to facilitate removal of very fine solids and cake washing can
be carried out prior to solids discharge (Coulson & Richardson, 2002).
Advantages of leaf filters:
Similar applications to plate-and-frame presses, but operating costs are generally lower; and
Available in a wide range of sizes and materials of construction.
2.3.2.4 Centrifugal Filters
The separation principle in centrifuges is similar to that in a gravity separation process, except that
separation is attained by accelerated gravitational force that is achieved by rapid rotation which
leverages forces from 1000 to 2000 times that of gravity. A motor drive is responsible for rotation.
Centrifuges used for sedimentation include hydrocyclones, tubular bowls, chamber bowls,
imperforate baskets, disc stack separators and decanters (Lenntech, 1998-2014). Sedimentation
centrifuges were initially invented for liquid-solid separation and the application was later broadened
to handling solids and separating solids from liquid. The decanter centrifuge, illustrated in Figure
2.18, is a sedimentation centrifuge that was designed for handling significant solid concentration in
the feed slurry and to achieve a good degree of clarification of the liquid concentrate. The decanter
centrifuge comprises a horizontal cylindrical bowl (1) which rotates at high speed. A helical
extraction screw (2) is placed coaxially, fitting perfectly into the contour of the bowl with only
sufficient clearance allowed between the bowl and the scroll. Solids accumulate at the bowl walls and
the differential speed between the screw and scroll provide the conveying motion necessary to collect
and remove the solids (Lenntech, 1998-2014).

- 30 -
Figure 2.18: Decanter centrifuge (numbers are discussed in text) (Lenntech, 1998-2014).
The slurry (3) is axially introduced into the unit by suitable distributer (4). A ring space (5) is formed
by the internal surface of the bowl and the body of the scroll and slurry is propelled into this area.
Separation takes place in the cylindrical section of the bowl (1) and settled product is pushed along
the bowl by the relative velocity of the scroll (6). Sediment is allowed to pass out of the clarified
liquid phase, enabled by the conveyance of the solids into the length of the cone. A liquid level (7) is
established in the unit as a result of the continuous feed and follows the cylindrical surface which
constitutes the internal surface of the liquid ring. The drying zone (8) allows final in the remaining
section of the cone, once the solids have passed out of the liquid ring. The clarified liquid (9) collects
at the opposite side of the bowl by flowing through an adjustable threshold (10) which restricts the
liquid ring of the unit. The rotor is protected by a cover which also enables collection of clarified
liquid and sediment. Advantages of a decanter centrifuge compared to other sedimentation
centrifuges are listed in Table 2.2 (Lenntech, 1998-2014).
Advantages of the decanter centrifuge include (Lenntech, 1998-2014):
Wide range of potential use;
Continuous operation;
Operates over a wide range of feed concentrations; and
Available in wide range of feed capacities.
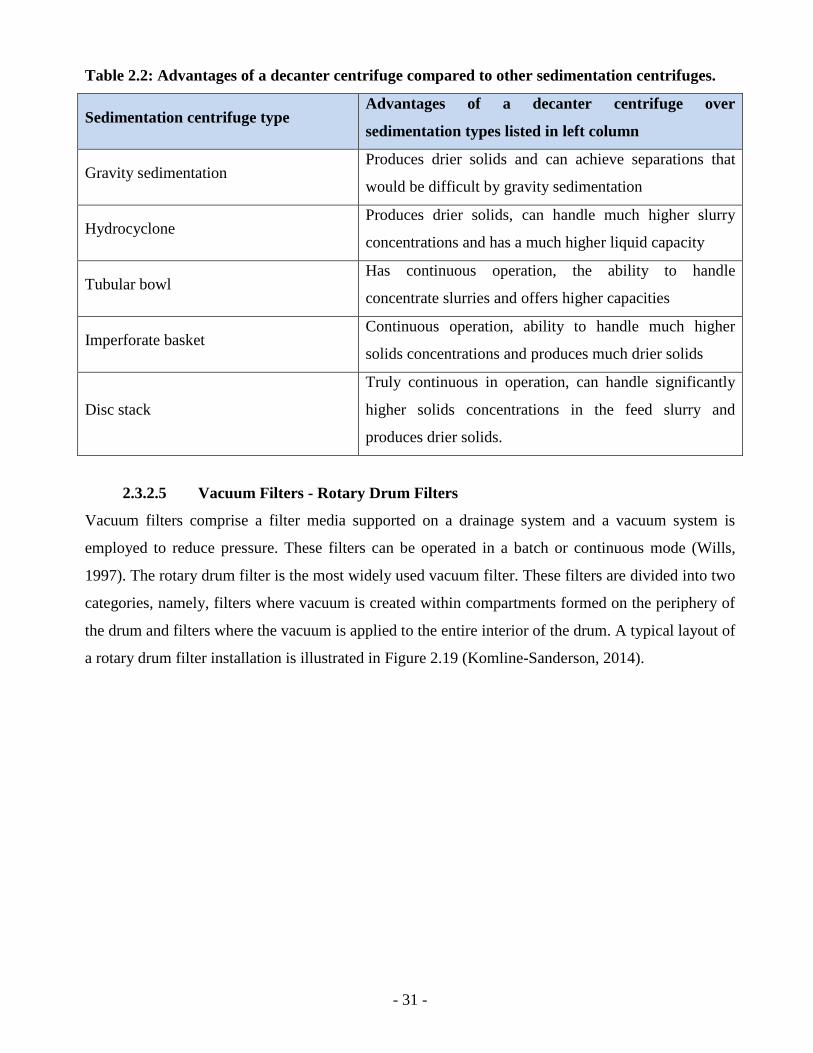
- 31 -
Table 2.2: Advantages of a decanter centrifuge compared to other sedimentation centrifuges.
Sedimentation centrifuge type Advantages of a decanter centrifuge over
sedimentation types listed in left column
Gravity sedimentation Produces drier solids and can achieve separations that
would be difficult by gravity sedimentation
Hydrocyclone Produces drier solids, can handle much higher slurry
concentrations and has a much higher liquid capacity
Tubular bowl Has continuous operation, the ability to handle
concentrate slurries and offers higher capacities
Imperforate basket Continuous operation, ability to handle much higher
solids concentrations and produces much drier solids
Disc stack
Truly continuous in operation, can handle significantly
higher solids concentrations in the feed slurry and
produces drier solids.
2.3.2.5 Vacuum Filters - Rotary Drum Filters
Vacuum filters comprise a filter media supported on a drainage system and a vacuum system is
employed to reduce pressure. These filters can be operated in a batch or continuous mode (Wills,
1997). The rotary drum filter is the most widely used vacuum filter. These filters are divided into two
categories, namely, filters where vacuum is created within compartments formed on the periphery of
the drum and filters where the vacuum is applied to the entire interior of the drum. A typical layout of
a rotary drum filter installation is illustrated in Figure 2.19 (Komline-Sanderson, 2014).

- 32 -
Figure 2.19: Typical layout of a rotary drum filter installation (Komline-Sanderson, 2014).
The drum filter comprises a filter medium fitted around a large hollow drum, which rotates on a
horizontal axis that is partially submerged in a trough where slurry is introduced. Agitators are used
to maintain the slurry in suspension. The drum periphery is divided into compartments, each
comprising several drain lines which pass through the inside of the drum to end as a ring of ports.
Vacuum is applied to a rotary valve which covers these ports. A vacuum serves to draw liquid
through the filter medium onto the drum surface which retains the solids (Komline-Sanderson, 2014).
A typical operation cycle includes; filtration, drying, and discharge, although other operations, such
as cake washing and cloth cleaning, can be included. Cycle time is dependent on the drum rotation
speed, level of slurry in the drum and valve arrangement. Solids can be discharged from the drum in
various ways, the most common of which employs a reversed blast of air which lifts the cake,
allowing removal with a suitable tool without touching the medium. A belt discharge system operates
by means of the filter medium detaching from the filter and passing over an external roller before
returning to the drum. This method is advantageous as it allows handling of much thinner cakes,
resulting in better washing and drier products due to increased filtration and draining rates. A further
advantage is that the filter cloth can be washed from both sides by means of sprays before it returns
to the drum, as opposed to the usual applications where sprays or weirs can cover only limited area at
the top of the drum. Vacuum pump capacity is determined primarily by the quantity of air sucked
through the cake during washing and drying. Variations on the standard drum filter allow filtration of
varying materials and hyperbaric filters have been developed to allow pressure filtration and
continuous operation (Coulson & Richardson, 2002; Sinnott, 1993; Wills, 1997).

- 33 -
Advantages of rotary drum filters include (Coulson & Richardson, 2002):
They are versatile and simple;
Multi-compartment drum types have low cost per unit area, and also allow a wide variation of
the respective time periods devoted to filtration, washing and drying; and
Continuous operation.
Disadvantages of rotary drum filters include:
Large units requiring large floor area which may not always be available; and
Filter cloths require regular washing and changing.
2.3.2.6 Vacuum Filters – Disc Filters
Disc filters work on the same principle as rotary drum filters. Circular discs are connected to a central
horizontal shaft and cake forms on both sides of the circular disc. As the discs rotate above the level
of the slurry, the cake is suction-dried and removed by pulsating air blow and a scraper. Several discs
are located along the central shaft, allowing a large filtration area in a relatively small contained
footprint, which makes the cost per unit area lower than that of drum filters (Wills, 1997). A picture
of a rotary disc filter is shown in Figure 2.20.
Figure 2.20: Schematic drawing of a rotary disc filter (Anglo American Reference 3, 15/09/10).
Advantages of rotary disc filters include (Wills, 1997):
Large filtration area that can be accommodated in a small floor space; and

- 34 -
Lower cost per unit area than drum filters.
Disadvantages of rotary disc filters include (Wills, 1997):
Cake washing is virtually impossible;
Excessively fine material clogs the filter medium; and
Filters must be stopped for cleaning.
2.3.2.7 Vacuum Filters – Horizontal Belt Filter
The horizontal belt filter comprises a perforated drainage deck which supports a filter cloth belt.
Vacuum is applied to suction boxes which are in contact with the underside of the drainage deck.
Slurry is introduced onto the belt by means of gravity and filtration commences immediately owing
to both gravity and the applied vacuum. Dewatering and drying occur as a result of the air being
drawn through the cake and discharge occurs as the belt reverses over a small-diameter roller. Cake
washing can be incorporated into this process. Belt filters are best suited to hydrometallurgical
processes where value metals are dissolved in alkali or acid and for concentrated slurries of fast-
settling products where efficient washing is necessary (Wills, 1997). A photograph of a rigid belt
filter is provided in Figure 2.21
Figure 2.21: Rigid belt filters installed at an Anglo American copper mine in Chile.
Advantages of horizontal belt filters include (Wills, 1997):
Low installed capital cost compared to drum, disc and press-type filters;

- 35 -
Cost-effective, reliable solution to filtration issues, particularly with low-value tailings
material; and
Coal slurries have been shown to produce lower cake moistures compared with rotary vacuum
filtration at lower cost per ton.
Disadvantages of horizontal belt filters include:
High energy requirement.
2.4 CERAMIC FILTRATION
Conventional vacuum filtration was previously used for dewatering of iron-ore product for
beneficiation. With changing product quality requirements, declining ore grades, increased
complexity of mineralogy and increased energy costs, alternative, or more efficient, dewatering
solutions are being sought. The development of larger ceramic units with more filtration area has led
to a better understanding of iron-ore dewatering and has allowed optimisation of ceramic filter units
for high-capacity operation (Gӧrres & Hindstrӧm, 2007).
Pirkonen et al. (2010) describe ceramic filtration as a technology best suited to dewatering slurries
with high and consistent solids concentration and with particles in a size ranging between 30 µm and
150 µm. This technology is already widely used industrially for base metal concentrates, ferrochrome
and iron-ore products (Pirkonen et al., 2010).
Ceramic filtration technology was introduced into the market in the 1980s but has only been applied
in the iron-ore industry since 2000 (Gӧrres & Hindstrӧm, 2007). Ceramic filter discs are vacuum disc
filters that comprise sintered alumina sector plates with uniform micro-pores. The micro-pores create
suction through capillary action where the filter medium allows only liquid to pass through during the
filtering process. The filter cake forms on the surface of the disc and is removed by a scraper. The
mechanism and operating principle of the technology are further described in several papers (Ekberg
& Hartti, 1993; Gӧrres & Hindstrӧm, 2007; Larox Corporation, 2007; Pirkonen et al., 2010).
Significant energy savings are claimed, owing to the lack of air penetrating the ceramic discs, and it
is stated that an equivalent traditional vacuum filter unit would require in the order of 10 % more
energy to create a similar high vacuum owing to high air leakage through the filter cake (Gӧrres &
Hindstrӧm, 2007). Other stated benefits include (Gӧrres & Hindstrӧm, 2007; Salmimies et al., 2013):
- 36 -
Low capital investment;
Low operating costs;
High capacity;
Dry filter cake;
Stable moisture content;
Particle-free filtrate;
High filtration rates;
Simple installation, operation and maintenance of the filter unit;
Integrated filter and ancillary systems;
Continuous operation;
Automation features allowing independent cake-forming and drying control;
High operational availability;
Extended plate life;
Inert media, resistant to most chemicals and slurry temperatures; and
No filter cloth changing.
Disadvantages include:
High capital investment;
High cost of acids for cleaning and regeneration; and
Expensive ceramic plate replacement.
The micro-pores of the sintered alumina membranes create strong capillary action when in contact
with water. The ceramic discs are immersed in a slurry bath and filtrate is drawn through the discs to
a central barrel. The filter medium allows only liquid through and a cake forms on the disc surface.
Diagrams taken from a Larox ceramic filtration information brochure (Larox Corporation, 2007)
provide a visual example of ceramic plates (Figure 2.22) and also provide a cross-sectional view of
the plate (Figure 2.23).

- 37 -
Figure 2.22: Examples of ceramic filter plates (Larox Corporation, 2007).
Figure 2.23: Cross-sectional structure of a ceramic filter plate (Larox Corporation, 2007).
The filter plate comprises a thin membrane over a coarser core. The outer membrane is the filtering
layer, while the core substrate acts as the membrane carrier and imparts mechanical strength to the
plate.
Membrane
Core Substrate

- 38 -
2.4.1 The Mechanism of Filtration
The principle mechanism by which a ceramic filter works is capillary action. The capillary
phenomenon is described by the Young–Laplace law, which can be used to quantify how pores of a
certain diameter cause a capillary effect owing to surface tension and contact angle of the liquid
(Ekberg & Hartti, 1993). The Young–Laplace equation is presented in Equation 2.1:
∆ρ =4T ∗ cos 𝜃℃
D (2.1)
where ∆ρ = bubble point pressure (bar)
T = surface tension (N/m) [0.07 for H2O at 20°C]
Ɵ = wetting angle (degrees) @ [0° (cos 𝜃 = 1)]
D = pore diameter (µm)
Ekberg and Hartti (1993) describe and illustrate the capillary phenomenon as shown in Figure 2.24,
where the level of water in a narrow tube rises to above the level of the surface of water (h) when the
tube is immersed water. Pressure is required to overcome the capillary force and empty the water-
filled capillary and this pressure difference (∆ρ) is known as the bubble point pressure. A highly
wettable material, such as aluminium oxide, has a wetting angle (Ɵ) of zero degrees, while Teflon
has a wetting angle of approximately ninety degrees. The larger wetting angle will result in almost no
capillary rise and thus not require any pressure to empty the capillary (Ekberg & Hartti, 1993; Gӧrres
& Hindstrӧm, 2007; Larox Corporation, 2007).
Figure 2.24: Diagrammatic illustration of parameters of the Young–Laplace Equation (Ekberg
& Hartti, 1993).
2.4.2 Operating Principle of Ceramic Filtration
A comprehensive description of the operating principles of ceramic filtration is provided by the
suppliers of ceramic units. The process is described by the supplier as having five distinct steps: cake
- 39 -
forming, cake drying, cake discharge, backflow washing and disc regeneration. These steps are
described below and illustrations are taken from the supplier brochure (Larox Corporation, 2007).
2.4.2.1 Cake Formation
The initial step is that of cake formation (Figure 2.25, number 1), which occurs as the discs rotate
through the slurry. An extremely high vacuum is created by capillary action which draws the liquid
through the ceramic filter discs into the uniform micro-porous filtrate lines. Solids build rapidly on
the external surface of the disc but the microporous structure prevents these from penetrating the disc
surface. Only a small vacuum is required to remove the filtrate from the micro-porous filtrate lines.
2.4.2.2 Cake Drying
Capillary action continues as the discs rotate until all free liquid is removed from the solids. The
microporous medium allows only liquid to flow through and, because of the capillary force that
keeps the pores full of water, air is prevented from penetrating the disc surface (Ekberg & Hartti,
1993). This results in an exceptionally dry cake being produced at a fraction of the energy that would
be required by conventional filtration techniques (Larox Corporation, 2007). Figure 2.25, number 2,
illustrates the cake-drying step on the surface of ceramic disc filter as it continues to draw liquid
through the capillary lines until all free water has disappeared (Ekberg & Hartti, 1993).
2.4.2.3 Cake Discharge
Scrapers are used to remove the cake from the disc, leaving a thin residue on the disc surface to
protect against mechanical abrasion. This serves to reduce maintenance and also extends the life of
the discs. No snap-and-blow-off cake-discharge system is required for continuous cake discharge, as
is typically required for rotary vacuum filters (Metso Corporation, 2014). Figure 2.25, number 3,
illustrates the cake-discharge step using a scraper.
2.4.2.4 Backflow Washing
Filtrate is used to flush the discs after cake discharge, thereby removing residual cake and cleaning
the microporous structure to help the discs to retain filtration efficiency (Larox Corporation, 2007).
Figure 2.25, number 4, illustrates the backflow washing step that occurs after every cycle.

- 40 -
2.4.2.5 Disc Regeneration
Disc regeneration is carried out periodically to maintain full permeability of the discs. Built-in
chemical and/or ultrasonic systems are employed. Cleaning frequency differs according to
application and can range from weekly to daily, with more frequent cleaning being required when
submicron fractions are higher. Cleaning is automated through the process logic control (PLC)
system and requires the tank to be filled with wash liquid/water during the process. Figure 2.25,
number 5, illustrates the disc regeneration process in which the tank is filled with wash liquid.
1 2 3
4 5
Figure 2.25: Operating principle of Ceramic filtration (Larox Corporation, 2007).
2.4.3 The Outotec CC-144 Unit
Outotec gained the title to all the Larox shares in 2010, allowing the Larox filtration technologies to
complement Outotec’s product portfolio. The patent name given to their ceramic filters is OUTOTEC
LAROX® CERAMIC FILTERS. They have a range of capillary action filters available that cover
differing process sizes and throughput requirements. Their range of ceramic filters includes the
following filters, with the number at the end indicating the square area (m2) of the filter.
Outotec Larox® CC-6
Outotec Larox® CC-15
Outotec Larox® CC-30

- 41 -
Outotec Larox® CC-45
Outotec Larox® CC-144
Outotec Larox® CC-240
The CC-144 unit forms part of Outotec’s HiFlow filter range, designed specifically for high-capacity
and high filtrate-flow applications and which allows a higher degree of automation and control. This
unit has 144 m2 filter area and has 12 to 15 sectors per disc with a disc diameter of 3800 mm. Control
of the cake-forming stage allows capacity control, while vacuum adjustment in the drying phase
controls residual cake moisture. The compact design includes the control panel, vacuum pump and
filtrate tank, drum and agitator drives and an ultrasonic cleaning unit in the filter unit, as illustrated in
Figure 2.26 (Minas-Rio Technical Team, undated).
Figure 2.26: CC-144 ceramic filter unit with integrated attachments.
Vacuum
Pump
Main Drive Agitator Drive
Filtrate Reservoir
Ultrasonic
Device
Control
Panel
Ceramic Discs
Drum
Distribution
valve

- 42 -
Figure 2.27: Ceramic filter units at the Minas-Rio operation.
2.4.4 Factors Affecting Ceramic Filtration
2.4.4.1 Zeta Potential
Görres and Hindstrӧm (2007) recognised that the presence of fines and other impurities in the feed to
a pelletizing plant significantly influences dewatering of iron ore slurries by causing membrane
fouling and blocking pores. The explanation given is that differing zeta potentials of particles at
different pH levels affect electrostatic interactions between the mineral and silica and/or other
impurities, which in turn impact filtration performance. These authors suggest that the different
rheologies resulting from different processes can be altered by changing the pH. This has been shown
to provide improved filtration performance.
Zeta potential is described in a Malvern product information brochure (Malvern, undated) as “a
measure of the magnitude of the electrostatic or charge repulsion/attraction between particles. It is
one of the fundamental parameters known to affect stability of a colloidal system. Its measurement
brings detailed insight into the causes of dispersion, aggregation, or flocculation.” In a Technical
Note, Malvern Instruments suggest that an indication of the stability of a colloidal system is given by
the zeta potential, with +30 mV or −30 mV taken as the general dividing line between stable and
unstable suspensions: values more positive than +30 mV and more negative than −30 mV are
considered stable. Particles in a suspension with large negative or positive zeta potentials will repel

- 43 -
each other while particles with low zeta potential or opposite zeta potential values will attract and
flocculate. The isoelectric point is the point on the plot of zeta potential as a function of pH that
passes through zero (i.e. zero zeta potential): it is at this point that a colloidal system is least stable
(Malvern Instruments, undated). At zero zeta potential, no net surface charge is carried for a
particular particle.
Haselhuhn et al. (2012) show a plot of zeta potential as a function of pH that illustrates the differing
zeta potentials of hematite and silica and mixed colloidal dispersions of these. The plot is reproduced
in Figure 2.28.
Figure 2.28: Zeta potential as a function of pH plot adapted from Esumi et al. (1988) and cited
by (Haselhuhn et al., 2012).
Testwork conducted by Haselhuhn et al. (2012) demonstrated how filtration rate and specific cake
resistance of a concentrated haematite ore was impacted by change in pH. Results obtained from their
testwork correlated with the filtration rate as a function of pH plot shown in Figure 2.29. This plot
shows an increase in filtration rate as specific cake resistance decreases at pH values below pH 9.5.
Results obtained were attributed to a decrease in zeta potential at lower pH values, with the silica
impurities responsible for shifting the isoelectric point of pure hematite to that of pure silica. The
authors’ explanation for the low filtration rates achieved at high pH values is that both silica and
hematite particles carry negative surface charges, resulting in repulsion between the particles causing
dispersion and resulting in low filtration rates. With a decrease in pH (below 9.5), the negative
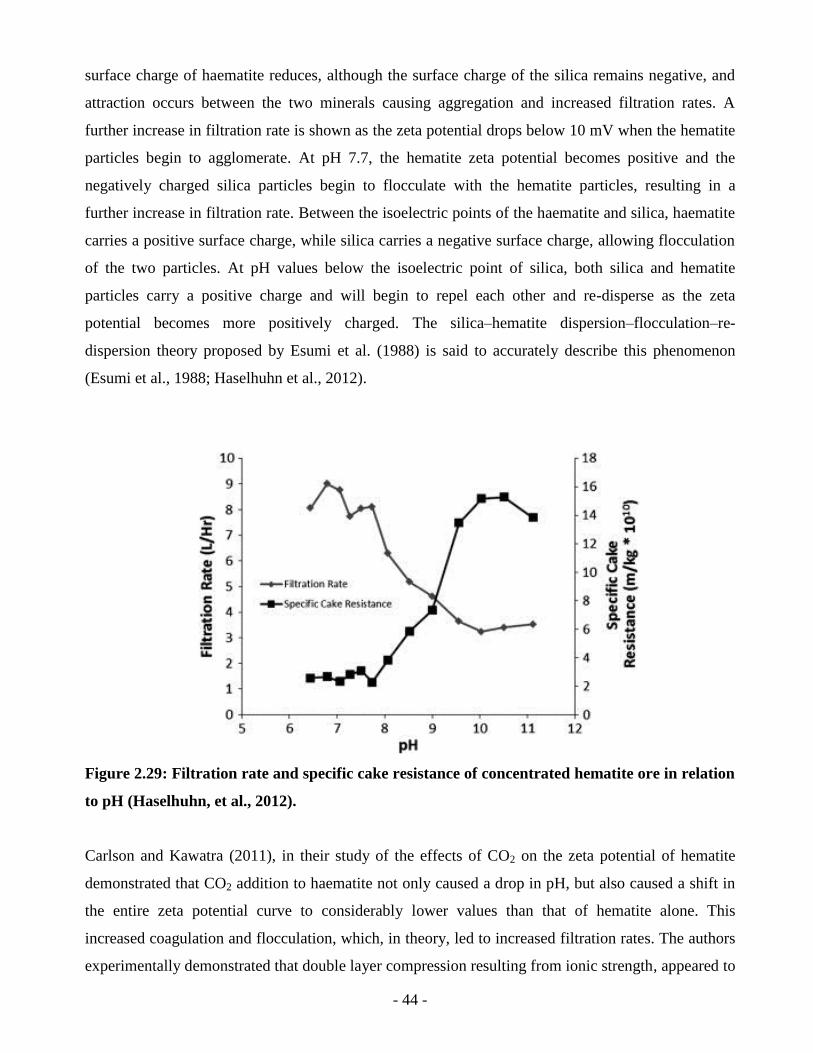
- 44 -
surface charge of haematite reduces, although the surface charge of the silica remains negative, and
attraction occurs between the two minerals causing aggregation and increased filtration rates. A
further increase in filtration rate is shown as the zeta potential drops below 10 mV when the hematite
particles begin to agglomerate. At pH 7.7, the hematite zeta potential becomes positive and the
negatively charged silica particles begin to flocculate with the hematite particles, resulting in a
further increase in filtration rate. Between the isoelectric points of the haematite and silica, haematite
carries a positive surface charge, while silica carries a negative surface charge, allowing flocculation
of the two particles. At pH values below the isoelectric point of silica, both silica and hematite
particles carry a positive charge and will begin to repel each other and re-disperse as the zeta
potential becomes more positively charged. The silica–hematite dispersion–flocculation–re-
dispersion theory proposed by Esumi et al. (1988) is said to accurately describe this phenomenon
(Esumi et al., 1988; Haselhuhn et al., 2012).
Figure 2.29: Filtration rate and specific cake resistance of concentrated hematite ore in relation
to pH (Haselhuhn, et al., 2012).
Carlson and Kawatra (2011), in their study of the effects of CO2 on the zeta potential of hematite
demonstrated that CO2 addition to haematite not only caused a drop in pH, but also caused a shift in
the entire zeta potential curve to considerably lower values than that of hematite alone. This
increased coagulation and flocculation, which, in theory, led to increased filtration rates. The authors
experimentally demonstrated that double layer compression resulting from ionic strength, appeared to
- 45 -
have minimal impact in the shift of the zeta potential curve and they were of the opinion that results
indicated a complexation of the hematite surface and carbonate/bicarbonate ions in solution, resulting
in neutralisation of the zeta potential and increase in filtration rate.
Eisele et al. (2005) state that reduction of pH using any other acid also caused a drop in the zeta
potential curve, increasing flocculation of particles and forming a more open structured filter cake,
which in turn facilitates removal of water from the cake.
2.4.4.2 Flocculant Addition
The effect of flocculant on filtration rates has also been investigated. Flocculation using high
molecular weight polymers generally result in faster sedimentation rates, although, the flocs formed
are relatively large with significant water trapped within the flocculated structure owing to the long
chain length; this leads to increased moisture content in the filter cake. Lower molecular weight
flocculants form smaller aggregates with a higher shear resistance. The lower molecular weight
flocculants produce smaller flocs and typically have shorter chain lengths with more branches, which
result in the formation of a filter cake with a more uniform porous structure that facilitates rapid
dewatering (Moss & Dymond, undated). Thus low molecular weight flocculants tend to be more
suited for use in improving filtration rates.
Moss and Dymond (undated), when describing the effects of polymer molecular weight on
flocculation, state that “two products with the same apparent overall molecular weight, might have
different molecular weight distributions.” The difference in performance of polymers having the
same average molecular weight and aqueous viscosity is as a result of one flocculant having a wide
molecular weight spread comprising both high and low fractions and the other flocculant having a
narrower spread with more intermediate interactions.
Moss and Dymond (undated) explain how solution pH not only controls the surface charge of the
particles but also the degree of ionisation of the polymer. “This varies the amount of charge on a
polymer chain and thus determines the degree of extension of the molecule, which impacts the degree
of bridging”. This means that flocculants can only function optimally over a specific pH range.
Forbes (undated), in his Theory of Flocculation, explains that the pH specificity of flocculants is as a
result of the pH controlling the degree of ionization of the polymer. The AMIRA P266 “Improving
Thickener Technology” on-line Thickener Expert Knowledge Base describes how choice of

- 46 -
flocculant is affected by surface properties of the solids and how suitable flocculants can be predicted
based on slurry pH and they state that “Anionic polymers are fully protonated at low pH and show a
similar solution configuration to that of a non-ionic polymer, although the non-ionic polymer does
have a higher fraction of functional groups that are able to participate in the adsorption process.
Carboxylate groups can generally only be directly involved in adsorption with positively charged
sites and at pH values above 4, while non-ionic polymers stay uncharged. Charge from the
deprotonation of some carboxylate groups gives rise to an extended solution conformation for
slightly anionic polymers which can help with polymer bridging and thus lower the flocculant dosage
required. At alkaline pH values of 10 and above, activity can be lost owing to competition between
amide hydrolysis and adsorption and, in this instance, highly anionic polymers are favoured”
(CSIRO, 2011). Figure 2.30 is a graphic representation of the effect of pH on flocculant selection
taken from the on-line Thickener Expert Knowledge Base (CSIRO, 2011) .
Figure 2.30: Flocculant selection (Effect of pH on flocculant selection (adapted from Connelly
and Richardson, 1984) (CSIRO, 2011).
Mänttäri et al. (1995), in their investigation of the impact on filtration capacity when using flocculant
to filter different types of copper concentrate, observed that small quantities of flocculant increased
filtration capacity and that optimal flocculant concentration was dependent on flocculant and slurry
type. Different copper concentrates achieved different filtration capacities and optimal flocculant
type appeared to be dependent on slurry type.
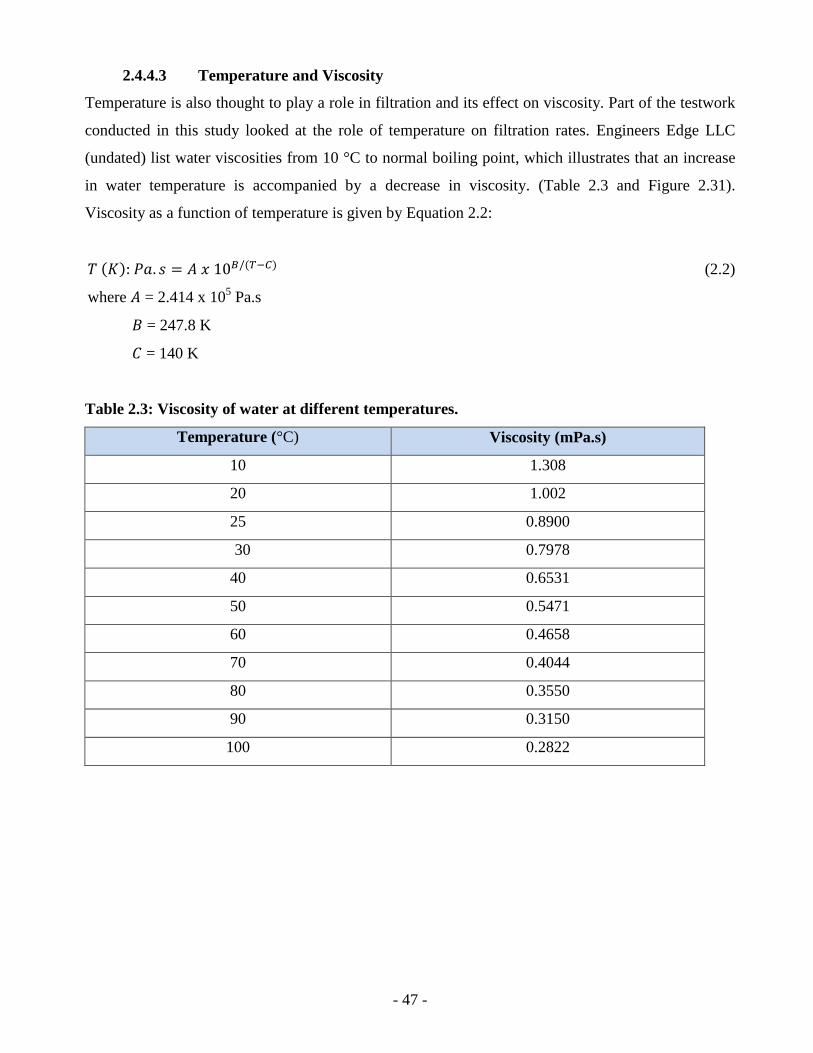
- 47 -
2.4.4.3 Temperature and Viscosity
Temperature is also thought to play a role in filtration and its effect on viscosity. Part of the testwork
conducted in this study looked at the role of temperature on filtration rates. Engineers Edge LLC
(undated) list water viscosities from 10 °C to normal boiling point, which illustrates that an increase
in water temperature is accompanied by a decrease in viscosity. (Table 2.3 and Figure 2.31).
Viscosity as a function of temperature is given by Equation 2.2:
𝑇 (𝐾): 𝑃𝑎. 𝑠 = 𝐴 𝑥 10𝐵/(𝑇−𝐶) (2.2)
where 𝐴 = 2.414 x 10⁵ Pa.s
𝐵 = 247.8 K
𝐶 = 140 K
Table 2.3: Viscosity of water at different temperatures.
Temperature (°C) Viscosity (mPa.s)
10 1.308
20 1.002
25 0.8900
30 0.7978
40 0.6531
50 0.5471
60 0.4658
70 0.4044
80 0.3550
90 0.3150
100 0.2822

- 48 -
Figure 2.31: Graphic illustration of the change in viscosity of water at different temperatures.
2.4.4.4 Ceramic Filter Media Blockage Mechanisms
Salmimies (2013), as part of her PhD thesis on acidic dissolution of iron oxides and regeneration of a
ceramic filter medium, found that, when dewatering haematite and magnetite concentrates, decreased
performance of ceramic filter media resulted from either particle blockage and/or scaling. Particle
blockage results from particles adhering to the filter media surface and this was shown to be the more
dominant blocking mechanism in haematite dewatering because significantly more fine particle
fractions are present in haematite concentrate. Scaling was found to be more prominent in dewatering
of magnetite concentrates, with the scale formed comprising mainly calcium oxalate. Scale, if formed
during haematite dewatering, comprised predominantly gypsum and calcium carbonate. Scale
formation was, however, found to be marginal and not considered to have any effect on plate
permeability in haematite dewatering. Blockage particles and scaling are removed by means of acid
washing.
When investigating scaling and regeneration of ceramic filter medium used in magnetite concentrate
dewatering, Salmimies et al. (2013) found that both hydrochloric and nitric acids were the most
effective in dissolving calcium carbonate scale, with hydrochloric acid being less desirable owing to
0.00
0.10
0.20
0.30
0.40
0.50
0.60
0.70
0.80
0.90
1.00
1.10
1.20
1.30
1.40
1.50
10 20 25 30 40 50 60 70 80 90 100
Vis
co
cit
y (
mP
a.s
)
Water Temperature (0C) Viscosity (mPa.s)

- 49 -
health, safety and environmental issues because of generation of chlorine gas and corrosion risks to
equipment. Two options for regeneration were recommended for consideration: either a longer, less-
frequent washing for up to six hours or a shorter, more-frequent wash cycle.
2.4.4.5 Acid Types
Nitric (HNO3) and hydrochloric (HCl) acids are inorganic or mineral acids, oxalic acid (C2H2O4) is
an organic acid, while carbon dioxide (CO2), when mixed with water, exists in equilibrium with
carbonic acid (CH2O3), an inorganic compound responsible for lowering the pH. Nitric and
hydrochloric acids are strong acids and are soluble in water, completely dissociating into protons and
anions when dissolved in water. Oxalic acid requires slightly elevated temperatures or addition of a
dilute base, such as sodium hydroxide, to enable solubility in water (DifferentBetween.com Team,
2011). According to the PubChem compound summary, carbonic acid is the hypothetical acid of
carbon dioxide and water which exists as its salts (carbonates), acid salts (hydrogen carbonates),
amines (carbamic acid, and acid chlorides (carbonyl chloride) (National Center for Biotechnology
Information. PubChem Compound Database, undated).
Use of oxalic acid requires sufficient hydrogen ions to ensure the dissolution of haematite to form an
oxalate complex. Significant uncomplexed oxalate is present at pH 5, and, at pH 6.6, most of the
oxalate in solution exists as the free anion, with limited iron complexation or haematite dissolution
occurring. At pH ≤1, a 1:1 iron:oxalate complex forms (Hay et al., 2010). The reaction with
additional hydrogen ions is shown in Equation 2.3:
Fe2O3 (s) + 2H2C2O4 (aq) + 4H+ (aq) → 2FeHC2O4
2+ (aq) + 3H (2.3)
2.5 COMPARISON OF DIFFERENT FILTRATION SYSTEMS
Anglo American initiated a study to compare operating costs of three different types of filtration
plants used for dewatering iron ore. Three iron-ore processing plants were included in the study,
namely: a vacuum filtration plant comprising twenty six filters, each with a filter area of 120 m2
, a
pressure filtration plant comprising ten filters with a total filter area of 1320 m2 and a ceramic
capillary filtration plant comprising three filter units, each with a surface area of 144 m2
. Further
detail of the filtration plants and results of the comparison are tabulated in APPENDIX A.

- 50 -
Of the filtration techniques compared, vacuum filtration had the highest operating cost, as a
consequence of the high energy costs associated with the vacuum pumps and compressors. Filter
presses, in contrast, demonstrated low operating costs with no vacuum pump requirements and no
need for supplies for cleaning of filter elements. Filter presses did, however, have high component
replacement costs and availability proved lower compared with other filtration technologies. Ceramic
filters demonstrated low operational costs due to their excellent energy efficiency. This benefit was,
however, offset by expensive ceramic sectors and acid requirements for cleaning. Overall, the
ceramic filters were chosen in preference to the other filter units owing to lower energy consumption,
lower manpower requirements for operation and maintenance and lower filtrate treatment costs. It
was noted that additional expense was incurred as ceramic filtrate plates were imported and the cost
of acids required for plate cleaning was relatively high: a recommendation was made that local
suppliers should be sought and that alternative methods for cleaning be investigated to reduce these
costs (Anglo American Reference 3, 15/09/10).
2.6 PRIOR TESTWORK CONDUCTED BY ANGLO AMERICAN
In 2010 Anglo American had conducted previous studies to assess optimal filtration conditions and
filter capacity requirements for final dewatering of an iron-ore concentrate, the findings of which
have guided this investigation. Experimental details and findings are presented in APPENDIX B.
Important points from the various studies are summarised.
Filter capacity varied significantly and was dependent on conditions and maintenance strategies
employed during testwork.
Testwork conducted in 2010 demonstrated that higher feed solids, neutralisation of pH and
coagulant addition improved filtration efficiency. The same test programme to establish optimal
filter unit operating conditions concluded that highest yield was achieved when using the
maximum vacuum level, highest disc rotation speed and greatest basin level, while the lowest cake
humidity was achieved at minimum vacuum and basin level but highest rotation speed. Moisture
content was shown to increase as the filter capacity increased. The only factor shown to reduce
humidity while increasing productivity was increased rotational speed of the filter disc, because
this decreases pie thickness and increases discharge (Anglo American Testwork Reference 2,
15/09/10).

- 51 -
Testwork conducted in 2011 demonstrated the benefits of coagulant addition to reduce pore
clogging and the benefits of using ultrasonic cleaning and backwashing to improve filtration
efficiency (Anglo American Testwork Reference 3, 28/04/12). Testwork in 2012 (Anglo American
Testwork Reference 3, 28/04/12) verified that improved product yield was achieved with
increased solids concentration and use of good quality filter plates.
The testwork programme conducted in 2013 included flocculant addition to the feed and
demonstrated good product yield. Various scenarios were considered to calculate filtration
efficiency and conclusions were made regarding actions required to ensure that capacity
requirements were met. These measures included increased time allocation to preventative and
corrective maintenance, shorter time intervals (7 hours) between acid washing and regeneration of
the filter plates and reduction of plate replacement intervals to 12 months. This report also
questioned whether productivity improvements could be achieved by reducing the 5 µm fraction
in the feed and by operating ultrasound during low productivity times (Anglo American Testwork
Reference 4, 31/07/2013).
Testwork conducted in January 2014 to evaluate the impact of particle size on the yield and
residual moisture showed that overdosing of synthetic polyDADMAC SNF 4540 coagulant
occurred at dosages of 150 g/t and higher. Good coagulation was achieved when using a 500 g/t
dosage of Ca(OH)2, which also facilitated good productivity and low moisture content in the final
product (Anglo American Testwork Reference 5, 14/02/2014).
2.7 CONSIDERATION OF FUTURE TEST REQUIREMENTS
Previous testwork and research have shown that ceramic filter efficiencies are dependent on a
number of conditions, which include, amongst others, slurry density, particle size, pH, coagulant and
flocculant addition.
Mänttäri et al. (1995) examined the impact of flocculant addition to a copper concentrate on ceramic
filters and established that flocculant addition was beneficial to achieving higher filtration flux. This
work also showed that the addition of flocculant in suitable concentrations necessary to achieve
optimal performance was dependent on several factors, including ore type, particle size and pH.

- 52 -
Careful selection of flocculant is required to ensure formation of aggregates of sufficient size that
will not cause undue blockages of the filter units. High molecular weight flocculants generally
produce larger aggregates that are less easily dewatered; in contrast, lower molecular weight
flocculants, while achieving slower settling rates, will produce smaller aggregates that are able to
achieve better filtration efficiencies. The impact of reagent choice on filtration efficiency needs to be
determined for iron-ore concentrates.
Salmimies et al. (2013), in their investigation of the long-term impact of media blockage during
magnetite concentrate dewatering, presented two typical causes of media blockage in acidic iron-ore
dewatering: “slurry particle fouling and in-situ crystallisation of calcium oxalate, of which the latter
originated from the combination of process water and process chemistry”. Options proposed for both
chemical and mechanical regeneration of ceramic filter media included ultrasonic treatment,
backwashing and chemical cleaning. Calcium scale predominated in the corners of the full-scale
elements, rather than at the centre of the elements where aluminium oxide from degradation of the
filter material, and magnetite, were found to occur.
The long-term impact of media blockage requires further investigation, as does the identification of
the cleaning regime for membrane regeneration. Leaf test methodology requires backwashing with
water after each filtration test and ultrasonic cleaning after testing for a particular filtration parameter
is complete (each filtration parameter test is typically carried out in triplicate). Previous in-house
pilot testwork considered the impact of various backwashing interval scenarios on filtration
efficiency. A comparison of the impact on filter efficiency of backwashing using water only, against
backwashing using different acids would be useful.
Slurry prepared for previous testwork programmes comprised ore that had been re-slurried to an
appropriate solids concentration and then agitated for a set time period to attempt to replicate pipeline
conditions during transportation of the slurry concentrate to the port facility. Recent pipe-loop studies
have been conducted on-site to establish optimal conditions for slurry transport and it was suggested
that this material, having been exposed to the shear conditions similar to those expected within a
pipeline, could provide better representation of the material reporting to the thickeners, the underflow
of which would then report to the ceramic filter units for final dewatering. Pipe-loop tests were
conducted using coagulant at pH 10.5. The choice of correct reagent addition for initial thickening of

- 53 -
the concentrate after pipe-line transportation is vital to achieving both optimal underflow solids
concentration and a slurry that is amenable to subsequent filtration.
Current practice in slurry handling includes adjustment to pH 10 using sodium hydroxide (NaOH)
with subsequent coagulant and flocculant addition. The slurry is then adjusted to pH 7 before
reporting to the filtration units. All testwork performed thus far has used carbon dioxide (CO2) for
slurry neutralisation. CO2 is a weak acid and therefore requires large quantities to achieve the
necessary pH adjustment. Use of a stronger acid, such as HCl or HNO3, would reduce the quantities
of acid required for neutralisation. The impact of using such acids on filtration efficiency requires
further investigation.
Within the context presented above, the research undertaken in this study was aimed at identifying
factors, such as pH value, flocculant dosage and acid type used for slurry pH adjustment and disc
cleaning, that would positively or negatively impact filter efficiency. The research also evaluated
mitigating measures that may be considered to optimise productivity of the ceramic filtration units
installed at Minas-Rio. The objectives of this research are explicitly presented in the next chapter.

- 54 -
CHAPTER 3
3.1 METHODOLOGY
3.1.1 Sample Preparation
Sample for this testwork was prepared at the Minas-Rio pilot-plant facilities at Conceição do Mato
Dentro, using concentrate material that had been passed through a pipe-loop for six hours in order to
achieve a haematite-rich slurry representative of that expected to report to the filtration plant
thickener in Rio de Janeiro after 96 hours of pumping through a 529 km pipeline from the operation
in Minas Gerais.
A pipe-loop is an “instrumented, closed circuit pipeline system which is used to provide essential
engineering data such as flowrate, pressure loss per unit length of pipe, shutdown and restart
capabilities and power consumption needed to design full-scale pipelines” (Clark et al., 1995). For
this testwork, slurry was passed through a pipe-loop in order to expose the slurry to conditions
similar to those expected during the pipeline transportation of the concentrate and thus to produce a
slurry representative of that expected to report to the filtration plant.
The pipe-loop test was conducted using 300 g/t of calcium hydroxide, Ca(OH)2 in place of the
organic coagulant, Flonex 4540, that had been used in previous testwork programmes. A 68 % solids
slurry solution was prepared by mixing 8 tons of concentrate with 5341 litres of process water and
adding 2.4 kg of Ca(OH)2 dry powder to achieve the 300 g/t dosage required. A 300 g/t dosage of
Ca(OH)2 was considered adequate to modify the rheology of the concentrate slurry sufficiently to
facilitate pumping over the 529 km distance to the port facility. The replacement with slaked lime
was made as it is expected that a changeover from organic coagulant to slaked lime will be made for
full-scale production in 2016. A slaked lime dosing system is currently being specified. After 6 hours
of mixing in the pipe-loop, the slurry was adjusted to pH 10 using a 50 % m/v solution of sodium
hydroxide (NaOH), and the final slurry density was verified and adjusted to 2.2 g/cm3. Pipe-loop test
conditions are tabulated in Table 3.1.

- 55 -
Table 3.1: Pipe-loop test parameters
Parameter Value
Solids concentration 68 % by mass
Slurry density 2.2 g/cm3
Coagulant 300 g/t of Ca(OH)2
Loop test run time 6 h
pH adjustment (sample preparation) pH 10.0 using 50% NaOH solution
3.2 REAGENT PREPARATION
3.2.1 Flocculant Preparation
Stock flocculant solution was made up by weighing 0.50 g dry flocculant powder SNF FA 920 SHR
into a clean and dry 100 ml bottle, to which 2.5 ml of reagent-grade ethanol was added to facilitate
wetting of the dry polyacrylamide flocculant bead and to prevent flocculant ageing by free radical
attack. The purpose of employing a reagent grade solvent was to prevent unwanted contamination of
the flocculant stock solution. The content was swirled until the polymer was completely hydrated.
On-site process water was immediately added to make the solution volume up to 100 ml, the bottle
top secured, and the bottle shaken vigorously until the polymer was fully dispersed in the solution
and had swelled sufficiently to prevent it sticking to itself or to the sides of the bottle. The solution
was shaken intermittently for the next 2 hours and left overnight before use. This 0.5 % solution
concentration stock can be used for up to one week. A lower concentration working flocculant
solution was freshly prepared daily. Working flocculant solution at 0.05 % concentration was
prepared by using a10x dilution of the stock solution: 25 ml of stock solution was added to 250 ml of
on-site process water and mixed gently.
3.2.2 Nitric Acid Preparation
To prepare 5 litres of 5 % v/v nitric acid (HNO3) from a 68 % nitric acid solution, the volume of 68
% acid required was calculated by substituting the known initial and final values into Equation 3.1:
C1V1 = C2V2 (3.1)
where C = concentration (%)
V= volume (ml)

- 56 -
A volume of 2500 ml of tap water was added to a 10 litre beaker and the calculated volume of 368 ml
of 68 % nitric acid was added to the water while stirring. Once mixed, the solution was topped up to
the 5000 ml mark and mixed to ensure a homogeneous solution. Tap water was used in the
preparation of all acid and alkaline solutions used for this testwork programme to ensure that these
solutions were representative of plant conditions.
3.2.3 Hydrochloric Acid Preparation
Equation 3.1 was similarly used to calculate the volume of 38 % hydrochloric acid (HCl) solution
required to prepare 5 litres of 5 % v/v HCl. A volume of 2500 ml of tap water was added to a 10 litre
beaker and the calculated volume of 658 ml of 38 % HCl added into the water while stirring. Once
mixed, the water was topped up to the 5000 ml mark and mixed to ensure a homogeneous solution.
3.2.4 Oxalic Acid Preparation
Five litres of 5 % w/v oxalic acid (C2H2O4) was prepared by dissolving 250 g of C2H2O4 powder in
tap water and making the volume up to 5000 ml.
3.2.5 Carbon Dioxide Preparation
The carbon dioxide (CO2) used for testwork was prepared by adding acetic acid to sodium
bicarbonate; the CO2 gas evolved from the reaction was used to adjust the pH of the slurry solution.
The reaction is given in Equation 3.2:
NaHCO3(s) + CH3COOH(l) → CO2(g) + H2O(l) + Na+
(aq) + CH3COO-
(aq) (3.2)
3.2.6 Sodium Hydroxide Preparation
One litre of 50 % w/v sodium hydroxide (NaOH) solution was prepared by adding 500 g of NaOH to
700 ml of tap water. The NaOH pellets were added and stirred a little at a time into the water. This
reaction is exothermic and generated a considerable amount of heat. Once the solution had cooled,
the final volume was made up to 1000 ml. Borosilicate glass was used and the glassware was
inspected prior to use to ensure that there are no cracks, scratches or chips that could weaken the
integrity of the glass. Safety goggles and gloves were worn to prevent injury from splashing.
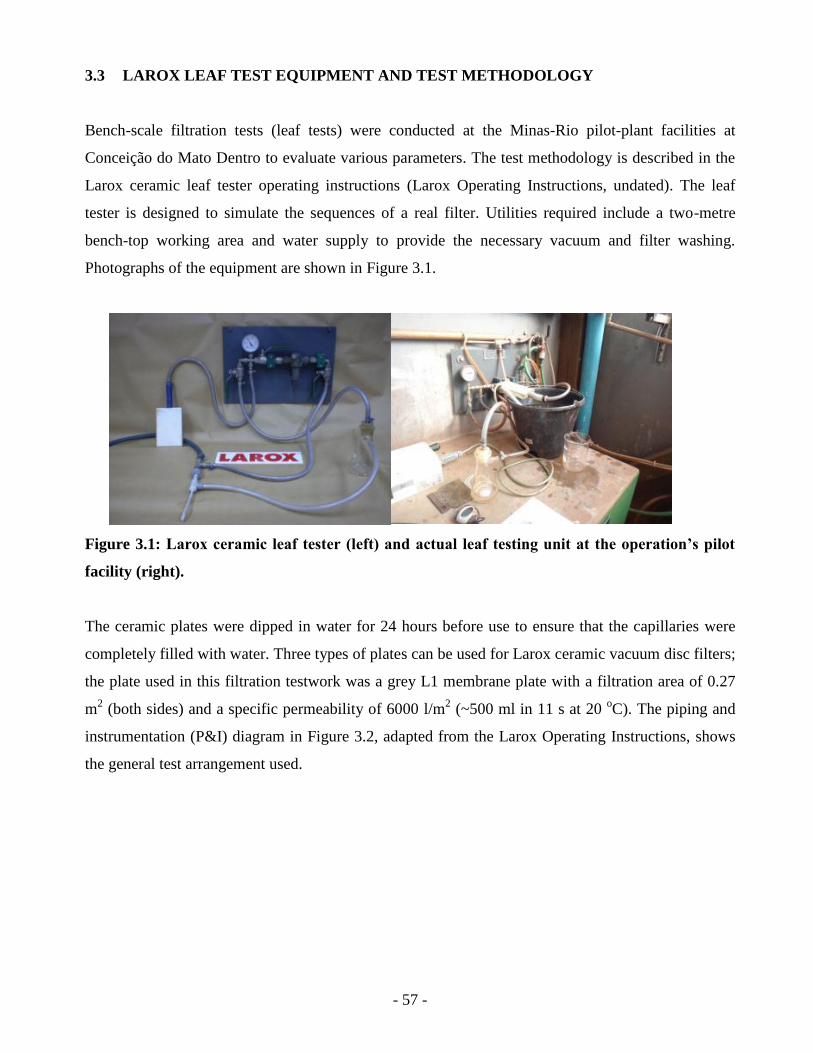
- 57 -
3.3 LAROX LEAF TEST EQUIPMENT AND TEST METHODOLOGY
Bench-scale filtration tests (leaf tests) were conducted at the Minas-Rio pilot-plant facilities at
Conceição do Mato Dentro to evaluate various parameters. The test methodology is described in the
Larox ceramic leaf tester operating instructions (Larox Operating Instructions, undated). The leaf
tester is designed to simulate the sequences of a real filter. Utilities required include a two-metre
bench-top working area and water supply to provide the necessary vacuum and filter washing.
Photographs of the equipment are shown in Figure 3.1.
Figure 3.1: Larox ceramic leaf tester (left) and actual leaf testing unit at the operation’s pilot
facility (right).
The ceramic plates were dipped in water for 24 hours before use to ensure that the capillaries were
completely filled with water. Three types of plates can be used for Larox ceramic vacuum disc filters;
the plate used in this filtration testwork was a grey L1 membrane plate with a filtration area of 0.27
m2 (both sides) and a specific permeability of 6000 l/m
2 (~500 ml in 11 s at 20
oC). The piping and
instrumentation (P&I) diagram in Figure 3.2, adapted from the Larox Operating Instructions, shows
the general test arrangement used.

- 58 -
Figure 3.2: P & I drawing of ceramic leaf tester configuration adapted from (Larox Operating
Instructions, undated).
Prior to commencing the filtration tests, the permeability (l/m2.h) of the plate was measured and the
vacuum level checked (this should be a minimum of 0.9 bar). A detailed standard operating
procedure is given in APPENDIX C. The following steps were then carried out for each test:
Ten litres of haematite-rich slurry were transferred to a 20-litre bucket and the sample was
continuously stirred to ensure sufficient homogenisation of the slurry.
The vacuum was then started and the leaf tester dipped into the slurry for precisely ten seconds to
allow cake formation. Figure 3.3 shows an operator mixing the slurry on the left and an operator
about to dip the leaf-tester into the slurry on the right.

- 59 -
Figure 3.3: An operator mixing of slurry (left), and an operator about to dip the leaf tester into
the slurry (right).
For the cake drying step, the leaf tester was removed from the mixing bucket and held upright for
sixteen seconds, as shown in Figure 3.4.
Figure 3.4: Cake drying.
The cake was discharged into a tray using a scraper and the cake thickness recorded as
demonstrated in Figure 3.5. The cake mass was also recorded.

- 60 -
Figure 3.5: Cake discharge and measuring of cake thickness.
Back washing and ultrasonic cleaning were undertaken between each test and the unit was rinsed
with water after use. Plate cleaning was implemented by overnight soaking of the plate in either a
solution of 5 % HNO3, 5% HCl or 5% C2H2O4 combined with ultrasonic cleaning. The plate was
rinsed well after cleaning (Larox Operating Instructions, undated). Figure 3.6 shows the ultrasonic
unit immersed with the plate for the cleaning stage.
Figure 3.6: Ultrasonic cleaning of the plate.
Each test parameter was replicated three times and the average result and standard deviation
calculated.

- 61 -
3.4 OPERATING INSTRUCTIONS AND CALCULATIONS
The test methodology and calculations are described in a Larox ceramic leaf tester operating
instructions document (Larox Operating Instructions, undated) and the data obtained from this
testwork were used to calculate the following parameters. These operating instructions are further
detailed in APPENDIX D.
3.4.1 Density
The slurry density was determined by first taring a 1000 ml measuring cylinder on a balance and then
filling the cylinder to the graduation mark with slurry and weighing the cylinder with the slurry. The
slurry density was calculated using Equation 3.3 and was reported in g/l:
𝑆𝑙𝑢𝑟𝑟𝑦 𝑑𝑒𝑛𝑠𝑖𝑡𝑦 = 𝑚𝑎𝑠𝑠 (𝑔)
𝑣𝑜𝑙𝑢𝑚𝑒 (𝑙) (3.3)
3.4.2 Dry Solids
The dry solids (DS) content was determined by recording the mass of a metal tray and then pouring
the slurry from the 1000 ml measuring cylinder into the tray. After drying at 105 oC for a minimum
of 12 hours, the mass of the tray with the dried solids was recorded. The mass of the tray was
subtracted from the final mass and the dry solids content calculated using Equation 3.4. Results are
reported as % (w/w).
𝐷𝑆 𝑐𝑜𝑛𝑡𝑒𝑛𝑡 𝑖𝑛 𝑠𝑙𝑢𝑟𝑟𝑦 (%) = 𝑑𝑟𝑦 𝑚𝑎𝑠𝑠
𝑤𝑒𝑡 𝑚𝑎𝑠𝑠∗ 100 (3.4)
3.4.3 Cake Moisture
The cake moisture content was determined by recording the mass of a metal tray and then placing the
cake that had been scraped from the filter plate into the tray and determining the mass of the tray and
the wet cake. The combined mass of the cake and the tray was again determined after drying for 12
hours at 105 oC. In both instances, the mass of the tray was subtracted to give the wet and dry cake
masses, respectively. The percentage cake moisture was calculated using Equation 3.5:
𝐶𝑎𝑘𝑒 𝑚𝑜𝑖𝑠𝑡𝑢𝑟𝑒 (%) = (𝑤𝑒𝑡 𝑚𝑎𝑠𝑠−𝑑𝑟𝑦 𝑚𝑎𝑠𝑠)
𝑤𝑒𝑡 𝑚𝑎𝑠𝑠∗ 100 (3.5)

- 62 -
3.4.4 Cake Mass
The cake mass was calculated by dividing the dry cake mass by the cake thickness and multiplying
this by the sum of the residual cake thickness subtracted from the cake thickness, as shown in
Equation 3.6. The residual thickness of the blue plate is 1 mm and if the cake breaks off completely,
then 0.0 mm should be used for iron concentrates. Various filtration plates are available and the blue
plate is the name given by the supplier, of the specific plate that was used for this testwork.
𝐶𝑎𝑘𝑒 𝑚𝑎𝑠𝑠 𝑖𝑛 𝑐𝑎𝑙𝑐𝑢𝑙𝑎𝑡𝑖𝑜𝑛𝑠 = 𝑐𝑎𝑘𝑒 𝑚𝑎𝑠𝑠
𝑐𝑎𝑘𝑒 𝑡ℎ𝑖𝑐𝑘𝑛𝑒𝑠𝑠∗ (𝑐𝑎𝑘𝑒 𝑡ℎ𝑖𝑐𝑘𝑛𝑒𝑠𝑠 − 𝑟𝑒𝑠𝑖𝑑𝑢𝑎𝑙 𝑐𝑎𝑘𝑒 𝑡ℎ𝑖𝑐𝑘𝑛𝑒𝑠𝑠) (3.6)
3.4.5 Dry Solids Capacity
The dry solids capacity (C or TUF) is the rate per unit area of filtering and is the primary indicator of
the productivity of a filtration system. This value was calculated using the dry solids mass and
reported as kg/m²h. The dry cake mass was converted to kg and multiplied by 60 to convert minutes
to hours, then was divided by the product of the filter area in m2 and the total cycle time in minutes.
The calculation is shown in Equation 3.7.
𝐶 =𝑐𝑎𝑘𝑒 𝑚𝑎𝑠𝑠(𝑘𝑔)∗60
𝑓𝑖𝑙𝑡𝑒𝑟 𝑎𝑟𝑒𝑎 (𝑚2)∗ 𝑐𝑦𝑐𝑙𝑒 𝑡𝑖𝑚𝑒 (𝑚𝑖𝑛) (3.7)
3.5 TESTWORK DESIGN
3.5.1 Parameters Recorded
Before commencing with each test, the following parameters were measured and recorded:
1. Permeability of plate (APPENDIX C).
2. Filtration area on the plate marked.
3. Solids concentration.
4. pH.
5. Temperature.
After each test cycle, the following parameters were determined and recorded:

- 63 -
1. The vacuum level during the drying time.
2. Cake mass once drying time was complete (APPENDIX C).
3. Cake thickness measured from the other side of the plate (APPENDIX C).
Tests were performed in triplicate with back washing undertaken between each test. Permeability was
determined at the end of each testwork series. Acid washing and ultrasonic cleaning were performed
overnight and plate permeability was recorded before commencing new testwork (APPENDIX C).
3.5.2 Cycle Time
A total cycle time of 30 s was used for each test, comprising the following steps:
Cake-forming time: 10 s
Cake-drying time: 16 s
Plate wash and dead time: 4 s
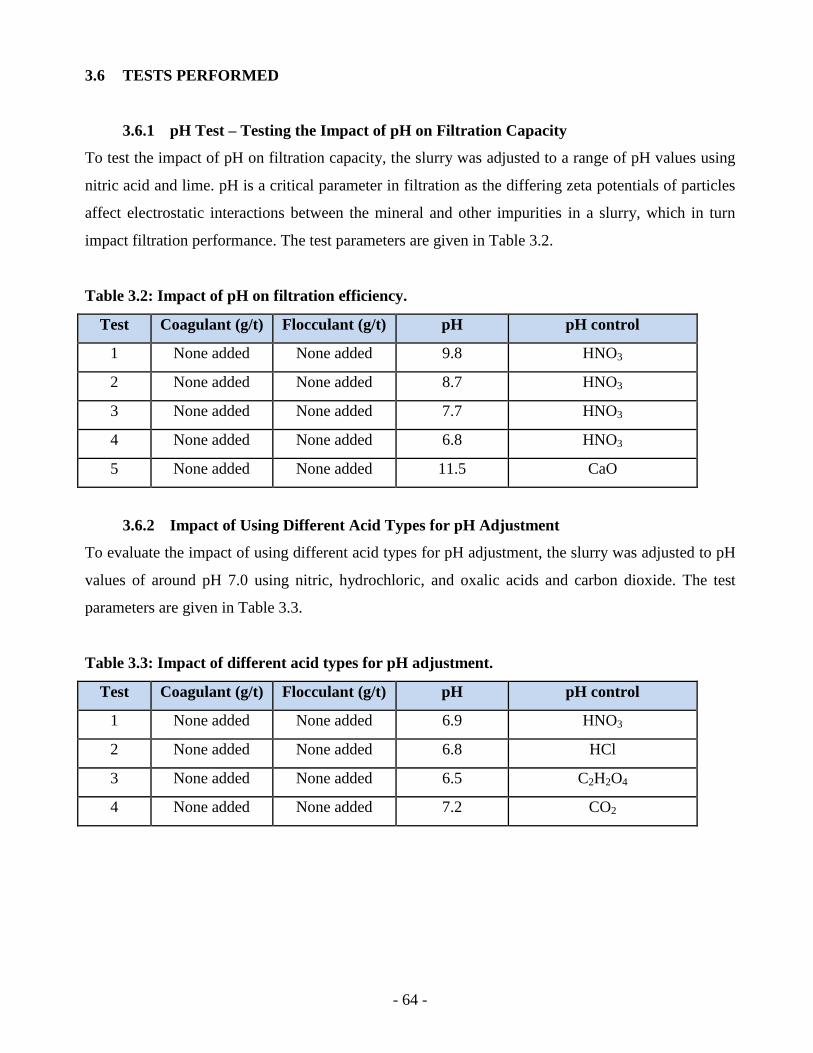
- 64 -
3.6 TESTS PERFORMED
3.6.1 pH Test – Testing the Impact of pH on Filtration Capacity
To test the impact of pH on filtration capacity, the slurry was adjusted to a range of pH values using
nitric acid and lime. pH is a critical parameter in filtration as the differing zeta potentials of particles
affect electrostatic interactions between the mineral and other impurities in a slurry, which in turn
impact filtration performance. The test parameters are given in Table 3.2.
Table 3.2: Impact of pH on filtration efficiency.
Test Coagulant (g/t) Flocculant (g/t) pH pH control
1 None added None added 9.8 HNO3
2 None added None added 8.7 HNO3
3 None added None added 7.7 HNO3
4 None added None added 6.8 HNO3
5 None added None added 11.5 CaO
3.6.2 Impact of Using Different Acid Types for pH Adjustment
To evaluate the impact of using different acid types for pH adjustment, the slurry was adjusted to pH
values of around pH 7.0 using nitric, hydrochloric, and oxalic acids and carbon dioxide. The test
parameters are given in Table 3.3.
Table 3.3: Impact of different acid types for pH adjustment.
Test Coagulant (g/t) Flocculant (g/t) pH pH control
1 None added None added 6.9 HNO3
2 None added None added 6.8 HCl
3 None added None added 6.5 C2H2O4
4 None added None added 7.2 CO2

- 65 -
3.6.3 Impact of Flocculant Addition at pH 7.1
To determine the impact of flocculant addition on filtration efficiency, the slurry was adjusted to pH
7.1 using nitric acid and plant flocculant, SNF FA 920 SHR, added at different dosages. The test
parameters are given in Table 3.4.
Table 3.4: Impact of flocculant addition at pH 7.1.
Test Coagulant (g/t) Flocculant (g/t) pH pH control
1 None added 4 7.1 HNO3
2 None added 0.5 7.1 HNO3
3 None added 0.25 7.1 HNO3
3.6.4 Impact of Flocculant Addition at pH 11.5
To determine the impact of flocculant addition on filtration efficiency at more alkaline pH values, the
slurry was adjusted to pH 11.5 using lime (CaO) and plant flocculant, SNF FA 920 SHR, added at
various dosages. The test parameters are tabulated in Table 3.5.
Table 3.5: Impact of flocculant addition at pH 11.5.
Test Coagulant (g/t) Flocculant (g/t) pH pH control
1 None added 4 11.5 CaO
2 None added 1 11.5 CaO
3 None added 0.5 11.5 CaO
4 None added 0.25 11.5 CaO
3.6.5 Standard Performance Tests
To understand and correlate the drop in filtration capacity results found between the pH 7.1 and pH
11.5 flocculation testwork, standard filtration tests were conducted immediately following the pH
11.5 flocculation testwork and also on the following morning. The same testwork procedure was
followed as for previous tests and in this instance, the slurry pH was adjusted to pH 7 using HNO3
and no flocculant was added.

- 66 -
3.6.6 Confirmation of Temperature Impacts on Vacuum Pressure
To confirm the inferred correlation between vacuum pressure and environmental temperature noted
during testwork, further tests were carried out in which the weather/atmospheric temperature, the
temperature of the water used to create the vacuum and the vacuum pressure were recorded over the
course of a day. The plate permeability was tested for each condition and the results recorded.
3.6.7 Evaluation of Cleaning Solution
To evaluate the effect of different acids and acid combinations for cleaning of the ceramic plate, the
plate was left to soak in acid overnight after the day’s testwork had been completed. The plate
permeability was checked before soaking and then again after soaking to establish the extent to which
permeability improved as a result of the acid soaking. The acids used as cleaning solution were 5 %
solutions were nitric, hydrochloric and oxalic acids.

- 67 -
CHAPTER 4
4.1 RESULTS AND DISCUSSION
4.1.1 pH Tests
Tests were conducted to establish optimal slurry pH conditions to achieve best filtration capacity for
the given slurry. Slurry was adjusted to various pH values using HNO3 and CaO. Testwork
parameters are given in Table 4.1, average results and standard deviations are presented in Table 4.2
and shown graphically in Figure 4.1. Detailed data are given in APPENDIX E.
Table 4.1: Testwork parameters for pH tests.
Parameter Value
Coagulant None
Flocculant None
Pulp pH Various pH values using HNO3 & CaO
Slurry temperature ~ 30 °C ± 3 °C
Filter area 0.0135 m2
Plate permeability before 31.8 ml/s
Plate permeability after 36.4 ml/s
Overnight acid soak 5 % C2H2O4
Table 4.2: Results from testwork to demonstrate impact of slurry pH on filtration capacity.
Test pH 11.5
(CaO)
pH 9.8
(HNO3)
pH 8.7
(HNO3)
pH 7.7
(HNO3)
pH 6.8
(HNO3)
Dry solids capacity (C)
(kg/m2.h) (Average)
3097 2712 2887 2427 2981
Standard deviation 142 163 168 133 203
Moisture (%) (Average) 8.49 9.60 8.54 7.99 8.33
Standard deviation 0.19 1.47 0.26 0.25 0.21

- 68 -
Figure 4.1: Average filtration capacity and moisture results from pH testwork.
Analysis of the results shows that, of the pH values tested, slurry adjusted to the highest and lowest
pH values, pH 11.5 and pH 6.8, respectively, gave the highest and second-highest filtration
capacities. Slurry adjusted to pH 7.7 produced the lowest filtration capacity and the lowest (best)
cake moisture content of 8 %.
Testwork results show that filtration capacity changed with differing pH value. Filtration capacity
increased between pH 9.8 to pH 8.7, which as discussed by Haselhuhn et al. (2012), this was as a
result of altering the zeta potential, where reduction of the zeta potential of the hematite is said to
facilitate agglomeration of hematite particles. The increase in filtration capacity at pH 6.8 is
attributed to flocculation of differently charged hematite and silicate particles. An explanation for the
increased filtration capacity at pH 11.5 is that the lime used for pH adjustment has the dual effect of
increasing the pH and neutralising the particles’ superficial charge. The dispersion state of the slurry
is changed by the calcium and calcium hydroxide ions which facilitate charge neutralisation. When
lime is mixed with water, calcium hydroxide, ((Ca(OH)2) forms, which then dissociates to Ca++
and
CaOH+. The Ca
++ ions facilitate electrostatic adsorption, while the CaOH
+ ions result in electrostatic
0.0
1.0
2.0
3.0
4.0
5.0
6.0
7.0
8.0
9.0
10.0
11.0
12.0
0
250
500
750
1000
1250
1500
1750
2000
2250
2500
2750
3000
3250
3500
pH 11.5 pH 9.8 pH 8.7 pH 7.7 pH 6.8
Av
era
ge
Ca
ke
Mo
istu
re (
%)
Av
era
ge
Dry
So
lid
s C
ap
ac
ity (
C)
(kg
/m2.h
)
Slurry pHDry Solids Capacity
Cake Moisture

- 69 -
and chemical adsorption of the particles (Araujo et al., 2009). The chemical reaction for the
formation of calcium hydroxide is shown in Equation 4.1:
CaO (s) + H2O (aq) ↔ Ca(OH)2 (s) (4.1)
The sharp drop in filtration capacity noted at pH 7.7 was not expected, suggesting the possibility of
another mechanism at play that we are not aware of. It should be noted that the lowest moisture
content was achieved at pH 7.7 which could be attributed to the decreased thickness of the filter cake
resulting from the lower filtration capacity. A student’s t-test conducted for the data obtained for
moisture content and dry solids capacity at pH 7.7 and the other pH values revealed that in all
instances, except for the difference in moisture value between pH 7.7 and pH 6.8, the differences
between the data were considered significantly different from one another. These results were
corroborated by an Analysis of Variance (ANOVA) test which showed that the difference between
the data achieved at the various pH values were significant for both moisture content and dry solids
capacity.
4.1.2 pH adjustment with different acid types
Testwork was conducted to assess the impact on filtration efficiency of using different acid types for
pH adjustment. A pH value of 6.8 was targeted for this testwork as this was the pH that achieved the
best filtration efficiency for the previous tests. Limited reagent availability in the test where pH
adjustment was made using CO2, resulted in this testwork being conducted at a higher pH than was
originally targeted. Nitric, hydrochloric and oxalic acids and carbon dioxide were used for pH
adjustment. Testwork parameters are summarised in Table 4.3 and average results and standard
deviations are given in Table 4.4 and graphically displayed in Figure 4.2. Detailed data are given in
APPENDIX E.

- 70 -
Table 4.3: Testwork parameters for acid type tests.
Parameter Value
Coagulant None
Flocculant None
Pulp pH using 5%: HNO3 - pH 6.9; HCl - pH 6.8;
H2C2O4 - pH 6.5; CO2 - pH 7.2
Slurry temperature ~ 36 °C ± 3 °C
Filter area 0.0135 m2
Plate permeability before 28.2 ml/s
Plate permeability after 27.3 ml/s
Overnight acid soak No overnight soak (tests conducted on the same day,
with a brief soak in water between the respective tests)
Table 4.4: Filtration results using different acid types to adjust slurry pH.
Test pH 6.9
(HNO3)
pH 6.8
(HCl)
pH 6.5
(C2H2O4)
pH 7.2
(CO2)
Dry solids capacity (C)
(kg/m2.h) (Average)
3655 3762 3289 2978
Standard deviation 113 75 239 146
Moisture (%) (Average) 9.00 9.10 10.16 8.49
Standard deviation 0.14 0.03 0.20 0.95

- 71 -
Figure 4.2: Average filtration capacity and moisture results from acid type tests.
Using the different acid types, slurry was adjusted to a range between pH 6.5 and pH 7.2. Filtration
testwork results indicated that pH adjustment using hydrochloric and nitric acids produced the
highest and second-highest filtration capacities, respectively, whilst pH adjustment using carbon
dioxide gave the lowest filtration capacity, while producing the lowest cake moisture content. Oxalic
acid and carbon dioxide produced significantly lower filtration capacities than the nitric and
hydrochloric acids. Exceptionally high (excessive) cake moisture content was achieved when using
oxalic acid. With the exception of oxalic acid, the moisture content appeared to increase as filtration
capacity increased.
A one-way ANOVA test was conducted to show if any statistically significant differences existed
between the data sets. ANOVA test results showed that there was a significant difference between the
dry solids capacity and moisture data obtained for the different acid types. Using a t-test to evaluate
the statistical significance of the results of the acids tested compared to the best performing acid,
hydrochloric acid, it was found that the difference in dry solids capacity data were not significant
between hydrochloric acid and nitric acid, but were significant between hydrochloric acid and both
0.0
1.0
2.0
3.0
4.0
5.0
6.0
7.0
8.0
9.0
10.0
11.0
0
250
500
750
1000
1250
1500
1750
2000
2250
2500
2750
3000
3250
3500
3750
4000
4250
pH 6.9 (Nitric) pH 6.8 (Hydrochloric) pH 6.5 (Oxalic) pH 7.2 (Carbon dioxide)
Avera
ge
Ca
ke
Mo
istu
re (
%)
Ave
rag
e D
ry S
olid
s C
ap
ac
ity (
C)
(kg
/m2.h
)
Acid Type
Dry Solids Capacity
Cake Moisture

- 72 -
oxalic acid and carbon dioxide. There was no significant difference between the oxalic acid and the
carbon dioxide dry solids capacity data. With regards to the moisture content, there was no
significant difference between the hydrochloric acid and nitric acid data, and also no significant
difference between the hydrochloric and carbon dioxide data. The difference between the
hydrochloric acid data and the oxalic acid moisture data were extremely significant.
The haematite-rich slurry used for this testwork was prepared by mixing haematite concentrate and
process water with 300 g/t calcium hydroxide, Ca(OH)2. The compounds formed from the chemical
reaction occurring between the calcium hydroxide and the carbon dioxide could provide a possible
explanation for the lower filtration capacities that were achieved when using carbon dioxide to adjust
the slurry pH.
Lime (CaO) combines with water to form calcium hydroxide Ca(OH)2, solution (Equation 4.1).
When carbon dioxide combines with calcium hydroxide solution, a calcium carbonate product is
formed, which is even less soluble than calcium hydroxide. The solution turns milky owing to the
calcium carbonate precipitate that forms in a process called carbonation. Formation of this precipitate
could increase blockages of the microporous filters, which would subsequently reduce filtration
capacity. The reaction and products formed are shown in Equation 4.2:
Ca(OH)2 (l) + CO2 (g) →CaCO3 (s) + H2O (l) (4.2)
The reaction of calcium hydroxide with oxalic acid results in the formation of calcium oxalate.
According to the well-known “solubility rules,” salts of carbonates and oxalate are generally
insoluble in water, with the exception of salts of NH4+
and of alkali metal cations (De Leon, 2001).
The reduced filtration capacity when using oxalic acid could be explained by the calcium carbonate
scale that is formed from the reaction between oxalic acid and calcium hydroxide, and which is
described by Salmimies (Salmimies et al., 2013), as one of the filtration media blockage mechanisms
responsible for reduction of plate permeability.
The chemical reaction between calcium hydroxide and oxalic acid is shown in Equation 4.3:
Ca(OH)2 + H2C2O4 → CaC2O4 (s) + 2H2O (4.3)

- 73 -
Nitric and hydrochloric acids are considered suitable acids to dissolve the calcium carbonate scale
and would thus contribute to improved filtration efficiencies.
The Gibbs free energy values indicate that the reactions between nitric and hydrochloric acids and
calcium hydroxide are extremely fast with no insoluble products formed. The nitric acid reaction
does occur marginally faster, with a ΔG of −156.744 kJ at 35 °C, than that of the hydrochloric acid,
with ΔG of −131.224 kJ at 35 °C. The reaction between carbon dioxide and calcium hydroxide is
somewhat slower, with a ΔG of −71.78 kJ at 35 °C. Reaction of haematite with nitric and
hydrochloric acids produces a metal nitrate or a metal chloride product and water, respectively, while
reaction with these acids and calcium hydroxide produces an aqueous calcium nitrate or calcium
chloride product. The balanced equations are shown in Equations 4.4 to 4.7. The increased filtration
capacities achieved when using nitric and hydrochloric acids can therefore also be attributed to fast
reaction rates and formation of small, soluble product molecules.
Fe2O3 (s) + 6HCl (aq) → 2FeCl3 (aq) + 3H2O (l) (4.4)
Ca(OH)2 + 2HCl → CaCl2 (aq) + H2O(l) (4.5)
Fe2O3 (s) + 6HNO3 (aq) → 2Fe(NO3)3 (aq) + 3H2O (l) (4.6)
Ca(OH)2 + 2HNO3 → Ca(NO3)2 + H2O (l) (4.7)
The lower cake moisture content achieved when using carbon dioxide, which also achieved the
lowest filtration capacity, and the higher cake moisture content of 9 % solids achieved when using
hydrochloric and nitric acids, were in line with previous bench-scale testwork that showed that
increased filtration capacity resulted in increased cake moisture as a result of the thicker cake layer
(APPENDIX B, B2: Anglo American Testwork Reference 2 - September 2010). Mänttäri et al.
(1995), in their paper describing the influence of flocculants on the performance of ceramic capillary
filters, also noted that “faster filtration rates usually caused higher cake moisture”.
The slurry temperature for this testwork series was slightly elevated from ambient, owing to the
slurry being agitated overnight, and was estimated to be between 35 and 37 °C. The final pH values

- 74 -
achieved for each acid type adjustment were similar but did differ slightly and could possibly have
impacted the results.
Caution was advised from the ceramic filtration supplier regarding the use of certain acids for
ceramic plate cleaning, with specific reference to chloride-containing acids that could potentially
react with filtration equipment materials. This should also be considered when choosing the best acid
for pH adjustment of the slurry. A student’s t-test was performed and showed that statistically the
nitric and hydrochloric acid data did not differ significantly from one another and as thus nitric acid
would always be recommended.
4.1.3 Flocculant dosage testwork at pH 7.1
The impact of flocculant addition on filtration efficiency was tested on slurry that had been adjusted
to a neutral pH using nitric acid. Previous testwork achieved best and second-best filtration
efficiencies at pH 11.5 and pH 6.8 respectively, and slurry was thus adjusted to similar pH regions
for flocculant testwork. To evaluate the impact of lower and higher flocculant dosages on filtration
efficiencies, plant flocculant, SNF FA 920 SHR, was added at three different dosages. Testwork
parameters for the neutral pH tests are given in Table 4.5, average results and standard deviations are
given in Table 4.6 and graphically displayed in Figure 4.3. Detailed data are given in APPENDIX E.
Table 4.5: Testwork parameters for flocculation testwork at pH 7.1.
Parameter Value
Coagulant None
Flocculant 0.25 g/t, 0.5 g/t and 4 g/t SNF FA 920 SHR
Pulp pH pH 7.1 with HNO3
Slurry temperature ~ 36 °C ± 3 °C
Filter area 0.0135 m2
Plate permeability before 36.4 ml/s
Plate permeability after 35.9 ml/s
Overnight acid soak 5 % HNO3 solution

- 75 -
Table 4.6: Filtration results using different flocculant dosages at pH 7.1 (HNO3).
Test pH 7.1
0.25 g/t
pH 7.1
0.5 g/t
pH 7.1
4 g/t
pH 6.9
(HNO3) (Ref
Table 4.4)
Dry solids capacity (C)
(kg/m2.h) (Average)
3582 3615 3850 3655
Standard deviation 112 224 147 113
Moisture (%)
(Average) 9.17 9.09 7.97 9.00
Standard deviation 0.23 0.08 2.57 0.14
Figure 4.3: Average filtration capacity and cake moisture - flocculation testwork at pH 7.1.
The highest flocculant dosage of 4 g/t achieved highest filter capacity and lowest cake moisture and
was the only dosage able to achieve the required 8 % cake moisture. Lower flocculant dosages
0.0
1.0
2.0
3.0
4.0
5.0
6.0
7.0
8.0
9.0
10.0
11.0
0
250
500
750
1000
1250
1500
1750
2000
2250
2500
2750
3000
3250
3500
3750
4000
4250
SNF 0.25 g/t SNF 0.5 g/t SNF 4 g/t
Ave
rag
e C
ak
e M
ois
ture
(%
)
Ave
rag
e D
ry S
olid
s C
ap
ac
ity (
C)
(kg
/m2.h
)
Flocculant Dosage at pH 7.1
Dry Solids Capacity
Cake Moisture

- 76 -
achieved lower filtration capacities and higher cake moistures. The slurry temperature for this
testwork was approximately 36 °C and the two lower flocculant dosages produced slightly lower
filtration capacities and similar moisture contents, compared with the results obtained for the
unflocculated slurry testwork at a similar temperature. To facilitate easy comparison of data, the pH
6.9 HNO3 data tabulated in Table 4.4 have also been included in Table 4.6, and shaded in grey for
easy reference.
A one-way ANOVA test showed that there was no significant difference between the dry solids
capacity and moisture content data at the different flocculant dosages. A student’s t-test was
performed on these data and found that there was no significant difference between the dry solids
capacity data for the 0.25 g/t and 0.50 g/t flocculant dosages and between the 0.5 g/t and the 4 g/t
flocculant dosage, with a “not quite significant difference” between the 0.25g/t and 0.4 g/t dry solids
capacity data. The moisture data values between the 0.25 g/t, the 0.50 g/t and the 4 g/t dosage showed
no statistically significant difference between one another.
Mänttäri et al. (1995) observed that small quantities of flocculant did increase filtration capacity of
different types of copper concentrate and that filtration capacity was dependent on flocculant and
slurry type. The flocculant used for this testwork, SNF FA 920 SHR, is a non-ionic synthetic polymer
that has a very high molecular weight, and, given that long-chained high molecular weight polymers
generally form large strong aggregates with increased moisture content, one would expect opposite
results to those achieved, and that the cake moisture content should increase as more flocculant was
added.
The unexpected results obtained as a result of using a high molecular weight flocculant could have
been as a consequence of the flocculant having a wide molecular weight spread, as explained by
Moss and Dymond (undated) when describing the effect of polymer molecular weight on
flocculation. The presence of lower molecular weight fractions would facilitate the creation of a cake
with more uniform porous structure which would allow better dewatering.
These results contradict earlier results where the higher filtration capacities achieved higher cake
moisture content. In this instance the addition of the flocculant may have played a role in the changed
observation. If the flocculant comprised a wide molecular weight spread, the presence of low

- 77 -
molecular weight fractions would facilitate the creation of a cake with more uniform porous structure
which would allow better dewatering and consequently lower cake moistures.
4.1.4 Flocculant dosage testwork at pH 11.5
The impact of flocculant addition on filtration efficiency at higher and lower dosages was also tested
at pH 11.5. Plant flocculant, SNF FA 920 SHR, was added to the slurry at various dosages. The
testwork parameters are given in Table 4.7, average results and standard deviations are given in Table
4.8 and graphically displayed in Figure 4.4. Detailed data are given in APPENDIX E.
Table 4.7: Testwork parameters for flocculation testwork at pH 11.5.
Parameter Value
Coagulant None
Flocculant 0.25 g/t, 0.5 g/t, 1 g/t and 4 g/t, SNF FA 920 SHR
Pulp pH pH 11.5 using CaO
Slurry temperature 32 °C – 33 °C
Filter pressure −0.92, −0.95, −0.95, −0.95 bar
Filter area 0.0135 m2
Plate permeability before 35.5 ml/s
Plate permeability after 34.5 ml/s
Overnight acid soak 5 % HCl solution
Table 4.8: Filtration results for flocculant tests at pH 11.5 (CaO).
Test pH 11.5
0.25 g/t
pH 11.5
0.50 g/t
pH 11.5
1.0 g/t
pH 11.5
4.0 g/t
Dry solids capacity (C)
(kg/m2.h) (Average)
2531 2547 2363 2674
Standard deviation 129 96 323 180
Moisture (%) (Average) 8.38 7.82 7.69 8.37
Standard deviation 0.68 0.65 0.32 0.31

- 78 -
Figure 4.4: Average filtration capacity and cake moisture - flocculant testwork at pH 11.5.
This testwork was conducted at approximately 5 °C lower than the flocculant testwork at pH 7.1, and
a significant drop in filtration capacity was observed. A comparison of the average filtration capacity
and moisture results achieved for pH 7.1 and pH 11.5 at a 4 g/t flocculant dosage are shown in Figure
4.5. As a result of the unexpectedly low filtration efficiencies achieved, the impact of temperature
and plate permeability were investigated. These outcomes are discussed in Section 4.1.5.
A one-way ANOVA test was conducted to show if any statistically significant differences existed
between the data sets. ANOVA test results indicated that there were no significant differences
between the dry solids capacity and moisture content data at the different flocculant dosages. A
student’s t-test was performed on these data and found that for the moisture and dry solids capacity
data, there were no significant differences between the different flocculant concentration data.
0.0
1.0
2.0
3.0
4.0
5.0
6.0
7.0
8.0
9.0
10.0
11.0
0
250
500
750
1000
1250
1500
1750
2000
2250
2500
2750
3000
SNF 0.25 g/t SNF 0.5 g/t SNF 1 g/t SNF 4 g/t
Avera
ge C
ake M
ois
ture
(%
)
Avera
ge D
ry S
olid
s C
ap
acit
y (
C)
(kg
/m2.h
)
Flocculant Dosage at pH 11.5
Dry Solids Capacity
Cake Moisture

- 79 -
Figure 4.5: Average filtration capacity and cake moisture – 4g/t dosage flocculant testwork at
pH 7.1 and pH 11.5.
Previous testwork conducted at a comparable temperature without flocculant addition, using lime to
adjust slurry to pH 11.5, achieved significantly higher filtration capacities compared with this
experiment. Similar to the pH 7.1 flocculant testwork, the highest filtration capacity was achieved at
the highest flocculant dosage of 4 g/t. This dosage did, however, produce the highest cake moisture
content, although it is very similar to the cake moisture produced from the 0.25 g/t dosage. Lower
flocculant dosages of 0.5 g/t and 1 g/t achieved lowest cake moisture content of all flocculation
testwork performed during this experimental programme, with moistures below 8 %.
Given that lime was used for pH adjustment and that lime has the ability of to neutralise superficial
particle charge (discussed in Section 0), one would have expected higher filtration capacities at pH
11.5 than those achieved at pH 7.1. Lower filtration capacities could have resulted from the
decreased temperature. Temperature differences were tested, see Section 4.6 where an explanation as
to the decreased filtration capacities is given regards to temperature effects.
0.0
1.0
2.0
3.0
4.0
5.0
6.0
7.0
8.0
9.0
10.0
11.0
0
250
500
750
1000
1250
1500
1750
2000
2250
2500
2750
3000
3250
3500
3750
4000
4250
SNF 4 g/t pH 7.1 SNF 4 g/t pH 11.5
Av
era
ge
Ca
ke
Mo
istu
re (
%)
Av
era
ge
Dry
So
lid
s C
ap
ac
ity (
C)
(kg
/m2.h
)
Flocculant Dosage at pH 7.1 & 11.5
Dry Solids Capacity
Cake Moisture

- 80 -
A further explanation for the lower filtration capacity results obtained is described by Moss &
Dymond (undated) as a result of flocculant specificity, with different flocculants functioning
optimally over a specific pH range. The AMIRA P266 “Improving Thickener Technology” on-line
Thickener Expert Knowledge Base recommends that highly anionic polymers would be favoured at
alkaline pH values of 10 and above, owing to activity loss resulting from competition between amide
hydrolysis and adsorption (CSIRO, 2011). This would suggest that the current plant flocculant, being
non-ionic in nature, was unsuitable for use at elevated pH values. A flocculant with a higher anionic
charge would be more suitable to achieve the necessary flocculation at pH 11.5 to facilitate better
filtration efficiencies and dewatering.
4.1.5 Standard performance tests – pH 7.0
To understand and correlate the significant drop in filtration capacity results noted between the pH
7.1 and pH 11.5 flocculation testwork, standard filtration tests were conducted on the same day as the
pH 11.5 flocculation testwork and also on the following day. Testwork parameters are given in Table
4.9, and average data and standard deviations given in Table 4.10 and shown graphically in Figure
4.6. The original findings at ~ 36 °C, (pH6.9 (HNO3)) from table 4.4 are also included in Table 4.10
Figure 4.6 for comparison. Detailed data are given in APPENDIX E.
Table 4.9: Testwork parameters for standard performance tests.
Parameter Value
Coagulant None
Flocculant None
Pulp pH pH 7 using HNO3
Slurry temperature 33 °C & 30 °C
Filter pressure −0.92 & −0.95 bar
Filter area 0.0135 m2
Plate permeability before 30.9 ml/s
Plate permeability after 29.5 ml/s
Overnight acid soak 50:50 mix of 5 % HCl : 5 % oxalic – heated to 50 °C

- 81 -
Table 4.10: Results from standard performance tests.
Test pH 7 0.95 bar
33 °C
pH 7 0.85 bar
30 °C
pH 6.9 (HNO3)
36 °C
(Ref. table 4.4)
Dry solids capacity (C)
(kg/m2.h) (Average)
2288 2297 3655
Standard deviation 60 31 113
Moisture (%) (Average) 8.06 8.24 9.00
Standard deviation 0.04 0.39 0.14
Figure 4.6: Capacity and moisture results from standard performance tests.
Similar filtration capacities and cake moisture content were achieved for the two tests. Slurry
temperatures were approximately 33 °C for the first test and 30 °C for the second test, and
approximately 5 °C lower than the slurry temperatures for both the acid testwork and for the
0.0
1.0
2.0
3.0
4.0
5.0
6.0
7.0
8.0
9.0
10.0
11.0
0
250
500
750
1000
1250
1500
1750
2000
2250
2500
2750
3000
3250
3500
3750
4000
36 °C 33 °C 30 °C
Av
era
ge
Ca
ke
Mo
istu
re (
%)
Av
era
ge
Dry
So
lid
s C
ap
ac
ity (
C)
(k
g/m
2.h
)
Slurry Temperature (oC) Dry Solids Capacity
Cake Moisture

- 82 -
flocculant testwork at pH 7.1, in which significantly higher filtration capacities were achieved. These
findings are in agreement with the conclusions of Häkkinen and Ekberg (undated) in their
investigation of process variables that influence performance of ceramic disc filters. These authors
established that filtration capacity increased and cake moisture decreased with increasing
temperature. This behaviour was mainly attributed to decreasing viscosity with increasing
temperature. Schaefer and Perlmutter (undated), in their paper on thin-cake filtration theory, state that
the higher the temperature, the lower the viscosity, and that decreased viscosity results in improved
filtration performance.
The vacuum pressure recorded for the second standard performance test was significantly lower than
that for the first test and plate permeability achieved for the second test at a lower temperature was
less than for the first test. These data are presented in Figure 4.7.
Figure 4.7: Impact of plate permeability and vacuum pressure at different temperatures.
These results suggest that temperature, vacuum pressure, and plate permeability are correlated with
lower vacuum pressure and plate permeability achieved at the lower temperatures.
24
26
28
30
32
34
36
24
26
28
30
32
34
36
-0.95 -0.85
Te
mp
era
ture
(0C
)
Pla
te P
erm
ea
bil
ity (
ml/
s)
Vacuum pressure (bar) Permeability (ml/s)
Temperature °C

- 83 -
Further tests were conducted to examine the correlation between vacuum pressure,
weather/atmospheric temperature, the temperature of the water used to create the vacuum, and the
subsequent impact on plate permeability. Results are summarized in Table 4.11 and shown
graphically in Figure 4.8.
Table 4.11: Temperature, vacuum pressure and permeability test data.
Time
(s)
Weather
Temperature
(°C)
Water
Temperature
(°C)
Vacuum
(bar)
Volume per
11 s
(ml)
Plate
permeability
(ml/s)
9:00 21.5 20.9 0.81 310 28.2
11:00 24.7 21.4 0.86 335 30.5
13:00 28.2 22.3 0.94 375 34.1
15:00 30.1 23.1 0.96 395 35.9
Figure 4.8: Impact of temperature on vacuum pressure and plate permeability.
20.921.4
22.323.1
0.40
0.45
0.50
0.55
0.60
0.65
0.70
0.75
0.80
0.85
0.90
0.95
1.00
20
22
24
26
28
30
32
34
36
38
21.5 24.7 28.2 30.1
Va
cu
um
pre
ss
ure
(b
ar)
Pla
te P
erm
ea
bilit
y (
ml/s
)
Water Temperature (0C)
Plate Permeability (ml/s)
Water T (°C)
Vacuum (bar)

- 84 -
Results indicate a direct correlation between increased weather/atmospheric temperature and
temperature of the water in the drum housing the vacuum pump. As the water temperature increased,
so the vacuum pressure increased. An increase in vacuum pressure was also accompanied by an
increase in plate permeability.
The vacuum for the leaf-test filter unit is created by running water through a venturi nozzle. An
increased volume of water passing through the venturi increases the vacuum pressure. Experimental
results show that vacuum pressure increased as temperature increased. We can assume that this is
owing to increased water flowing through the venturi which is, in turn, attributed to the reduced
viscosity of water at elevated temperatures, as shown in Table 2.31 where water viscosities from
10 °C to normal boiling point are listed by Engineers Edge LLC (undated).
4.1.6 Plate permeability and acid treatment for plate cleaning (acid regeneration)
To test the effectiveness of different acid types in regenerating the filtration plates, the plates were
soaked overnight using different acids and the plate permeability checked before and after plate
soaking. Results showed that, except for the initial permeability data at the start of the testwork
programme, initial and final plate permeability generally remained similar or decreased only slightly.
The lack of permeability loss after each test series is probably owing to the fact that the number of
filtration tests conducted for each series was not sufficient to cause any blockages of, or scaling on
the filter plate and thus did not impact the permeability of the plate. Differences in plate permeability
were more evident directly after a particular acid soak regime. Data are presented in Table 4.12 and
Figure 4.9.

- 85 -
Table 4.12: Plate permeability before and after testwork.
Parameter
Volume per 11
seconds
(ml/11 s)
Plate
permeability
(ml/s)
Slurry
temperature
(°C)
Plate permeability before pH tests -
26/08/14 350 31.8 ~ 30–33
Plate permeability after pH tests - 26/08/14 400 36.4 ~ 30–33
Plate immersed in in 5% oxalic solution overnight
Plate permeability before acid type tests -
27/08/14 - morning 310 28.2 ~ 36–39
Plate permeability after acid type tests -
27/08/14 - morning 300 27.3 ~ 36–39
Plate immersed in water between morning & afternoon tests
Plate permeability before pH 7.1 flocculant
tests - 27/08/14 - afternoon 400 36.4 ~ 36–39
Plate permeability after pH 7.1 flocculant
tests - 7/08/14 - afternoon 395 35.9 ~ 36–39
Plate immersed in in 5% HNO3 solution overnight
Plate permeability before pH 11.5
flocculant tests and standard performance
test 1 - 28/08/14
390 35.5 32
Plate permeability after pH 11.5 flocculant
tests and standard performance test 1 -
28/08/14
380 34.5 33
Plate immersed in in 5% HCl solution overnight
Plate permeability before standard
performance test 2 - 29/08/14 340 30.9 30
Plate permeability after standard
performance test 2 - 29/08/14 325 29.5 30
Plate immersed in 5 % HCl and 5% oxalic solution overnight – 50:50 mix heated to 50°C

- 86 -
Figure 4.9: Plate permeability after overnight soaking using different acids.
A decrease in permeability was noted after overnight soaking in oxalic acid. Previous testwork
showed that plate permeability generally increased with increased temperature (see Figure 4.8), so it
would be expected that plate permeability should increase with increased solution temperature. The
decreased plate permeability suggests that oxalic acid may have influenced the reduced permeability.
These data were in agreement with those of Salmimies (2013), who found that when dewatering
haematite and magnetite concentrates, decreased performance of ceramic filter media resulted from
either particle blockage and/or scaling. Scaling, which is more prominent in dewatering of magnetite
slurries, comprises predominantly calcium oxalate scale. The haematite-rich slurry prepared for this
testwork programme was mixed with 300 g/t calcium hydroxide which, when reacted with oxalic
acid, would result in the formation of calcium oxalate, as shown in Equation 4.2, which would
support the decreased permeability results observed.
Plate permeability between morning and afternoon testwork on the same day demonstrated an
increase in permeability after soaking in only water. In this instance, increase in plate permeability
was attributed to warmer atmospheric temperatures in the afternoon, which increased the temperature
of the water used to create the vacuum, with subsequent increased plate permeability, as described in
Section 4.1.5.
0
5
10
15
20
25
30
35
40
0
5
10
15
20
25
30
35
40
Slu
rry T
em
pe
ratu
re (
o C
)
Pla
te P
erm
ea
bilit
y (
ml/s
)
Soaking agent
Permeability before (ml/s)
Permeability after ( ml/s)
Temperature (°C)

- 87 -
After nitric acid treatment, the plate permeability showed only a marginal decline from the previous
permeability recorded, despite a significant drop in slurry temperature. This may indicate that
soaking the plate in nitric acid was potentially beneficial to improving permeability. Permeability
recorded after hydrochloric acid treatment was significantly lower than that recorded for the previous
day’s treatment with nitric acid. This could be due to the drop in atmospheric and slurry temperatures
from the previous afternoon, thereby impacting vacuum pressure with subsequent decline in plate
permeability. In addition, this effect may be a direct consequence of using hydrochloric acid or a
combination of both factors. The supplier has cautioned against the use of “chloride-containing”
acids, owing to the potential of hydrochloric acid to react with the ceramic filter materials. These data
are supported by Salmimies (2013) findings that both hydrochloric and nitric acids were the most
effective in dissolving calcium scale, with hydrochloric acid being less desirable owing to health,
safety and environmental issues. It is therefore recommended that further testwork does not include
hydrochloric acid. Figure 4.10 shows the relative change in plate permeability between acid/water
treatments. The largest decline in plate permeability was evident directly after oxalic acid treatment.
This would indicate that this acid should be avoided if slurry is treated with lime because the calcium
oxalate formed would result in a calcium scale coating the filter plate and decreasing plate
permeability which would lead to reduced filtration capacities.
Figure 4.10: Relative change in plate permeability between different acid and water soakings.
-22.22%
33.33%
-2.77%
-11.42%
-35
-30
-25
-20
-15
-10
-5
0
5
10
15
20
25
30
35
5 % Oxalic Acid Water 5 % HNO3 5 % HCl
Re
lati
ve
Pe
rme
ab
ilit
y L
os
s/G
ain
(%
)
Acid/water soak Permeability loss from soaking

- 88 -
CHAPTER 5
5.1 CONCLUSIONS
In Chapter 1; the following hypothesis was posited: “Ceramic filtration is a suitable technology for
dewatering of a friable itabirite iron-ore concentrate product”.
This hypothesis could not be disproved within this work. The following research objectives were
considered:
1. Assessment of optimal operational conditions, as derived from previous bench-scale and pilot-
plant testwork data.
An assessment of prior testwork programmes established that the optimal operational conditions for
achieving highest filtration capacity and lowest cake moisture included higher feed solids
concentration, neutral pH and coagulant addition. Highest product yields were achieved at maximum
vacuum level, maximum disc rotation speed and greatest basin level. Optimal (lowest) cake moisture
content was achieved when employing minimum vacuum and basin levels and highest rotation
speeds. The only factor shown to reduce moisture while increasing filtration capacity was increased
rotational speed of the filter disc as this decreases pie thickness and increases discharge. Testwork
also demonstrated that ultrasonic cleaning, backwashing and use of good quality filter plates
significantly improved filtration efficiencies. Controlled flocculant addition produced good filtration
capacities, while other factors, such as allocation of sufficient time for preventative and corrective
maintenance, shorter time intervals between acid washing, plate regeneration and plate replacement,
also contributed to improving filtration efficiency.
Conditions derived from previous testwork showed that best results for bench-scale tests were
achieved when using a cycle time of 30 s, comprising a cake formation time of 10 s, a cake drying
time of 16 s, and plate washing and dead time of 4 s. These conditions were used for all tests in this
study.
2. Evaluation of dry solids capacity of the ceramic filter. This was established using optimal
conditions for operating the bench-scale ceramic leaf-test filtration unit.

- 89 -
In this work, the highest dry solids capacity of 3850 kg/m2.h was achieved when adding a dosage of 4
g/t of flocculant SNF FA 920 SHR to slurry that had been adjusted to pH 7.1 using nitric acid. The
required cake moisture content of 8 % was also achieved using these conditions. Experimental work
with slurry adjusted to pH 11.5 using lime achieved marginally drier cake moisture values at lower
flocculant dosages than for the same flocculant dosages at pH 7.1; however filtration capacities
achieved under these conditions were considerably lower than those achieved at pH 7.1 testwork.
3. Evaluation of the impact of reagent addition and slurry modification on filtration capacity.
Investigation of the impact on filtration capacity of slurry modification by pH adjustment showed
that filtration capacity generally increased as the pH was reduced from pH 9.8 to pH 6.8. This was
attributed to reduction of the zeta potential as pH was reduced to more neutral values, which facilitate
coagulation of hematite particles, followed by flocculation of hematite and silica molecules, as pH
was further reduced. The high filtration capacities achieved at pH 11.5 without flocculant addition
are attributed to lime (used for pH adjustment) having the dual effect of changing the pH and
neutralising the particles’ superficial charge, thereby facilitating better particle aggregation and
subsequently improving filtration efficiencies. The sharp drop in filtration capacity noted at pH 7.7
was not expected, suggesting the possibility of another mechanism at play that we are not aware of. It
should be noted that the lowest moisture content was achieved at pH 7.7 which could be attributed to
the decreased thickness of the filter cake resulting from the lower filtration capacity.
Flocculant testwork at neutral pH demonstrated improved filtration capacities and driest cake
moisture at the highest dosages of flocculant tested, namely 4 g/t. This unexpected outcome is
explained as consequence of the SNF flocculant comprising a wide molecular weight spread and the
presence of lower molecular weight fractions facilitating the creation of a cake with more uniform
porous structure which, in turn, allows better dewatering.
Flocculant testwork at the more alkaline pH of 11.5 (adjusted with lime) demonstrated poor filtration
capacities, but with very low cake moisture content achieved at the lower flocculant dosages. This
was contrary to the improved filtration efficiencies expected as a result of the ability of lime to
neutralise superficial charge. A possible explanation invokes the pH dependence of flocculant
specificity.

- 90 -
4. Evaluation of the impact on filtration efficiency when using alternative acids for slurry
neutralisation.
Evaluation of different acid types for slurry pH neutralisation demonstrated that hydrochloric acid
produced the highest filtration capacity. Caution was advised by the ceramic filtration supplier in
using chloride-containing acids because of potential corrosion risks to equipment material. Salmimies
(2012) also cautioned that the possibility of producing chlorine gas posed significant health and
potential corrosion risks. Nitric acid performed similarly to hydrochloric acid, giving marginally
lower cake moisture values and a student’s t-test showed that statistically the nitric and hydrochloric
acid results did not differ from one another significantly. Given that all nitrate salts are soluble; this
acid is considered the best option for pH adjustment of the slurry.
5. Investigation of the impact on filtration efficiency using different acids for cleaning and disc
regeneration regimes.
Investigating the use of various acid types for filter plate regeneration showed that oxalic acid
negatively impacted plate permeability. This was probably due to scale formation resulting from the
calcium hydroxide (used in slurry preparation) forming a calcium oxalate precipitate when combined
with oxalic acid. The improved plate permeabilities achieved when using nitric and hydrochloric
acids for plate regeneration are explained by their effectiveness in dissolving calcium oxalate scale
(Salmimies, et al., 2013). Scale, if formed during haematite dewatering, comprised predominantly
gypsum and calcium carbonate. Scale formation was, however, found to be marginal and not
considered to have any effect on plate permeability in haematite dewatering. Blockage particles and
scaling are removed by means of acid washing.
6. Identification of factors that positively and negatively impact filtration efficiency.
Testwork demonstrated that reduction in vacuum pressure decreased plate permeability. Vacuum
pressure is dependent on the temperature of the water used to create the vacuum, which, in turn, is
dependent on atmospheric temperatures. These data highlight the need to monitor vacuum pressures
to ensure that these remain constant at all times.
Changes in slurry temperature, with associated viscosity changes, significantly affect filtration
capacities. Elevated slurry temperatures improved filter capacities by decreasing viscosity. Generally,
improved filtration capacities are accompanied by increased cake moisture content.

- 91 -
Prior testwork conducted by Minas-Rio in February 2014 achieved an average dry solids capacity
(productivity) of 2620 kg/m2.h with an average residual cake humidity of approximately 8 %.
Filtration capacity was still considered acceptable after the yield reduced to 2240 kg/m2.h after 12 h
continuous operation. Bench-scale testwork did not allow for the assessment of plate deterioration
over time and, to facilitate scale-up to industrial filters, the manufacturer’s conversion factor of 0.7
was applied to the filtration capacity data. Average filtration capacities similar to, or in excess, of the
reduced yield achieved in 2014, were achieved for tests conducted under optimal conditions,
demonstrating that, provided slurry and operational conditions are optimised and adequate
maintenance regimes followed, ceramic filtration is considered suitable for the metallurgical process
of dewatering of iron-ore concentrate.
5.2 RECOMMENDATIONS AND CONSIDERATIONS FOR FUTURE WORK
The leaf tests conducted to show the impact of pH adjustment on filtration capacity showed an
increase in filtration capacity as pH was lowered from pH 9.8 to pH 8.7. This was attributed to a drop
in zeta potential. The significant drop in filtration capacity noted at pH 7.7 does not follow this theory
and further testwork is needed to assess whether this unexpected result was due to experimental error
or whether other factors may be responsible for this behaviour.
To provide further insight into the mechanisms involved in the varying filtration capacity and
moisture results achieved when using different acids, an investigation of the impact on the zeta
potential curve and surface chemistry properties of hematite ore when using different acids would be
beneficial.
Comparing the use of a range of molecular weight anionic flocculant products on filtration
efficiencies as well as an assessment of a wider range of flocculant dosages at neutral and alkaline pH
would provide useful information to assist with optimising reagent addition to improve filtration
efficiencies.
Due to the impact of temperature and related viscosity changes, future filtration test work using the
bench-scale leaf test unit requires either rigorous control of the vacuum pump water temperature or
the installation of a higher capacity vacuum pump so as to maintain a constant vacuum pressure,
irrespective of the ambient and subsequent water temperature. The filtration supplier expected a

- 92 -
pressure of 0.9 bar to be achieved at sea level (where the industrial filters are located): all future
testwork should be therefore be conducted at this vacuum pressure.
It would be of interest to quantify the correlation between slurry viscosity and temperature, and their
subsequent impacts on mass and volumetric flows through the ceramic filter units. This would
facilitate optimisation of temperature conditions to provide ideal slurry viscosity that would ensure
maximum filtration efficiency.
The decline in plate permeability and filtration efficiencies observed when using oxalic acid for pH
adjustment and for plate cleaning would indicate that this acid should be avoided if the haematite
slurry were to be treated with lime in place of organic coagulant. The calcium oxalate formed would
result in a calcium scale coating the filter plate, with resultant decrease in plate permeability and
consequent reduction in filtration capacities. It may be of interest to determine the effectiveness of
plate cleaning with water at different temperatures as well as nitric acid at different temperatures.

- 93 -
REFERENCES
Alden, A., 2014. About Iron. [Online] Available at:
http://geology.about.com/od/iron/a/aa_033097_iron.htm [Accessed 27 April 2014].
Alden, A., 2014. Banded Iron Formation - Sedimentary Rock Types. [Online] Available at:
http://geology.about.com/od/rocks/ig/sedrockindex/rocpicbif.htm [Accessed 27 April 2014].
Anglo American Reference 1, 2011. Minas-Rio Optimised Phase 1 Study, Minas Gerais: Anglo
American.
Anglo American Reference 2, 2009. Anglo Ferrous Metals – Minas-Rio Project, Investor
presentation.
Anglo American Reference 3, 15/09/10. Estudo Copmarativo Entre Custos Operacionais de Plantas
de Filtragem.
Anglo American Reference 4, June, 2011. Optimised Phase 1 Study.
Anglo American Reference 5, undated. Process Flowsheet presentation.
Anglo American Testwork Reference 1, 2007. Larox Relatorio Teste Filtracao, s.l.: ANNEX III
Filtration Test no. Vinyard test no.15332T2.
Anglo American Testwork Reference 2, 15/09/10. Determination of Productive Capacity of Ceramic
Filters, MNS 0.
Anglo American Testwork Reference 3, 28/04/12. Mineracao Gerencia Geral de Operacoes -
Relatorio de Testes com Filtero Ceramica.
Anglo American Testwork Reference 4, 31/07/2013. Relatorio de Testes de Dimensionmento da
Planta de Filtragem.

- 94 -
Anglo American Testwork Reference 5, 14/02/2014. Test Report Outotec, Conceição do Mato
Dentro - MG: Outotec.
Anglo American Testwork Reference 6, 14/2/2014. Outotec Test Report,: Test Case No.104565_T2.
Araujo, J.A.M.; Peres, A.E.C.; H.D.G., Turrer; Fonseca, M.C.; Behring, R.S.; Doellinger, T.M.;
Passigati, V.P., 2009. Influéncia da CAL na Filtragem e Pelotamento. Gramado - Rio Grande do Su l
- Brasil, Volume 1.
Araujo, A., Viana, P. & Perez, A., 2005. Reagents in Iron Ores Flotation. Minerals Engineering 18,
pp. 219 - 224.
Astec Industries Inc, 2014. Cone crushers. [Online] Available at:
http://telsmith.com/products/crushing-equipment/cone-crushers.html [Accessed 15 November 2014].
Astec Industries Inc, 2014. Crushing Equipment - Jaw Crushers. [Online] Available at:
http://www.telsmith.com/products/crushing-equipment/jaw-crushers [Accessed 12 Movember 2014].
Callaghan, R., 2014. USGS Minerals Information:Iron Ore. [Online] Available at:
http://minerals.usgs.gov/minerals/pubs/commodity/iron_ore/index.html [Accessed 27 April 2014].
Carlson, J. & Kawatra, S., 2011. Effects of CO2 on the Zeta Potential of Hematite. International
Journal of Mineral Processing 98, pp. 8 - 14.
Clark, C.C.; Vickery, J.D.; Backer, R.R.; Transport of Total Tailings Paste Backfill: Results of Full-
Scale Pipe Test LoopPumping Tests. [Online] Available at:
http://www.cdc.gov/niosh/mining/userfiles/works/pdfs/ri9573.pdf [Accessed 22 September 2015].
Coulson, J. & Richardson, J., 2002. Chemical Engineering, Volume 2, 5th Edition, Particle
Technology and Separation Processes. Oxford: Butterworth-Heinemann.
Crusador Resources Limited, 2014. Cruasdor Resources/Iron Ore. [Online] Available at:
http://www.crusaderresources.com/minerals/iron-ore/ [Accessed 28 April 2014].

- 95 -
CSIRO, 2011. Thickener Expert Knowledge Base. [Online] Available at: www.p266project.com
[Accessed 09 June 2014].
De Leon, N., 2001. Solubility Rules. [Online] Available at:
http://www.iun.edu/~cpanhd/C101webnotes/chemical%20reactions/solubilityrules.html [Accessed
22 January 2015].
Dempsey, P.; Dworzanoski, M.; Hanmer, T.; Naik, S.; Plint, N., 2013 - 2015. Discussions with Anglo
American personnel.
DifferentBetween.com Team, 2011. Difference Between.com. [Online] Available at:
http://www.differencebetween.com/difference-between-organic-acid-and-vs-inorganic-acid/
[Accessed 6 January 2015].
Eisele, T., Katatra, S. & Ripke, S., 2005. Water Chemistry Effects on Iron Ore Concentrate
Agglomeration Feed. Mineral Processing and Extractive Metallurgy, Revision 26, pp. 295-305.
Ekberg, B. & Hartti, J., 1993. Capillary Filtration - The Harnessing of Natural Forces to Serve the
Process Industry.. s.l., s.n., pp. 23-28.
Enestee Engineering, undated. Multi-slope Bananna Screens. [Online] Available at:
http://enestee.com/i/banana-screen.html# [Accessed 2015 January 2012].
Engineers Edge, LLC, undated. Water- Density Viscosity specific weight - Engineers Edge. [Online]
Available at:
http://www.engineersedge.com/physics/water__density_viscosity_specific_weight_13146.htm
[Accessed 12 December 2014].
Esumi, K., Kawatra, S. & Ripke, S., 1988. Mixed Colloidal Dispersions of Silica and Hematite.
Bulleton Chemical Society, Japan 61 (7), pp. 295-305.

- 96 -
FLSmidth & Co., 2014. FLSmidth - HPGR - High pressure grinding roller. [Online] Available at:
http://www.flsmidth.com/en-US/Industries/Categories/Products/Grinding/HPGR/HPGR
[Accessed 15 November 2014].
Forbes, D., undated. WET USA.com. [Online] Available at:
http://www.wet usa.com/data/article/21.pdf [Accessed 22 January 2015].
Gilchrist, J. D., 1980. Extraction Metallurgy, 2nd Edition In SI metric Units. University of Newcastle
Upon Tyne, England: Pergamon Press.
Gutzmer, J. & Beukes, N. J., 2003. Geology Vol. IV - Iron and Manganese Ore Deposits:
Mineralogy, Geochemistry and Economic Geology. [Online] Available at:
http://www.eolss.net/sample-chapters/c01/e6-15-06-03.pdf [Accessed 30 April 2014].
Gӧrres, G. & Hindstrӧm, R., 2007. Some Experiences with Modern Dewatering Technologies in Fine
Iron Ore Application. Perth WA, 20-22 August.
Häkkinen, A. & Ekberg, B., undated. Dewatering of Iron Ore Slurry by a Ceramic Vacuum Disc
Filter. Lappeenranta, Finland.
Haselhuhn, H., Swanson, K. & Kwaatra, S., 2012. The Effect of CO2 Sparging on the Flocculation
and Filtration Rate of Concentrated Hamatite Slurries.. International Journal of Mineral Processing,
pp. 112-113.
Hay, M., King, W. & Martino, C., 2010. EM-21 Alternative Enhanced Chemical Cleaning Program
for Sludge Heel Removal. [Online] Available at:
http://www.wmsym.org/archives/2010/pdfs/10308.pdf [Accessed 9 January 2015].
Helmestine, A. M., 2014. Reductant Definition. [Online] Available at:
http://chemistry.about.com/od/chemistryglossary/g/Reductant-Definition.htm [Accessed 27 April
2014].

- 97 -
Komline-Sanderson, 2014. Komline-Sanderson Rotary Drum Vacuum Filters. [Online] Available at:
http://www.komline.com/docs/rotary_drum_vacuum_filter.html Accessed 12 November 2014].
Labrador Iron Mines Holdings Limited, 2014. Iron Ore Products & Markets. [Online] Available at:
http://www.labradorironmines.ca/invest_iron_ore_products_and_markets.php [Accessed 28 April
2014].
Larox Corporation, 2007. Larox Ceramic Filters Brochure.
Larox Operating Instructions, undated. Bench Unit, Ceramic Leaf Tester. Tukkikatu 1, P.O. Box 29:
Larox Oyj.
Lenntech, 1998-2014. Water treatment solutions Lenntech. [Online] Available at:
http://www.lenntech.com/library/clarification/clarification/centrifugation.htm
[Accessed 7 August 2014].
Lenntech, n.d. Calcium and water: reaction mechanisms, environmental impact and health effects.
[Online] Available at: http://www.lenntech.com/periodic/water/calcium/calcium-and-water.htm
[Accessed 8 January 2015].
Lima, N. P., Valadão, G. E. S. & Peres, A. E. C., 2014. Effect of Amine and Starch Dosages on the
Reverse Cationic Flotation of an Iron Ore. Elsevier Minerals Engineering, pp. 45, (180-184).
Malvern Instruments, undated. Zetasizer Nano series technical note. [Online] Available at:
http://www3.nd.edu/~rroeder/ame60647/slides/zeta.pdf [Accessed 15 December 2014].
Malvern, undated. Zeta potential, The benefits of using Zeta Potential measurements to improve
formulation and shelf-life and reduce formulation time and cost.. [Online] Available at:
http://www.malvern.com/en/products/measurement-type/zeta-
potential/default.aspx?gclid=COPm3LP9zMICFa_JtAodEnMA3Q [Accessed 17 December 2014].
Mänttäri, M., Nystrӧm, M. & Ekberg, B., 1995. Influence of Flocculants on the Performance of
Flocculants on the Performance of a Ceramic Capillary Filter. Minerals Engineering, 28 November
1995, pp. 419-428.

- 98 -
Metso Corporation, 2014. Metso Vacuum Filters Brochure.
Metso Corporation, undated. Metso Mining Screens. [Online] Available at:
http://www.metso.com/miningandconstruction/MaTobox7.nsf/DocsByID/EC086F367D5C86ED8525
76B900661CB9/$File/Metso%20mining%20screens%20range.pdf [Accessed 24 November 2014].
Minas-Rio Technical Team, undated. Presentation on Introduction Filters - Iron Ore, Belo
Horizonte.
Mining Leaders, 2013. Iron Ore To Be or Not to Be?. [Online] Available at: http://www.mining-
leaders.com/brazil12/brazil-iron-ore/ [Accessed 29 April 2014].
Morley, C., 2010. HPGR - FAQ.. Journal of the South African Institute of Mining and Metallurgy,
pp. Vo l 110, No.3, pp.107.
Moss, M. & Dymond, B., undated. Flocculation Theory and Application, Ciba Speciality Chemicals,
UK. [Online] Available at: http://www.siltstop.com/pdf/flocculation-theory_application.pdf
[Accessed 22 January 2015].
National Center for Biotechnology Information. PubChem Compound Database, undated. PubChem
Open Chemistry Database. [Online] Available at:
http://pubchem.ncbi.nlm.nih.gov/compound/carbonic_acid#section=Top [Accessed 6 January 2015].
Pirkonen, P., Grӧnroos, J., Heikkinen, J. & and Ekberg, B., 2010. Ultrasound Assisted Cleaning of
Ceramic Capillary Filter. Ultrasonics Sonochemistry, pp. 1060-1065.
Proactive Investors, 2012. Current Operations Iron Ore Brazil. [Online] Available at:
http://www.proactiveinvestors.com.au/sponsors/1906/brazilian-metals-group-1906.html [Accessed
29 April 2014].
Riggs, N. J. & Scott, S. B., 2014. Top 5 Iron Ore Producung Countries. [Online] Available at:
http://top5ofanything.com/index.php?h=cf80ee28 [Accessed 28 April 2014].

- 99 -
Rosario, P. & Hall, R., 2010. A Structured Approach to the Evaluation of Energy Requirements of
the HPGR and SAG mill Circuits in Hard Ore Applications.. Journal of the South African Institute of
Mining and Metallurgy, pp. Vol 110, No. 03, pp. 117. Salmimies, R.; Hakkinen, A.; Kallas, J.;
Ekberg, B.; , Andreassen, J.P.; and Beck, R., undated.
Characterisation of the long term scaling effects of ceramic filter media used in the dewatering of a
magnetite concentrate.. International Journal of Mineral Processing.
Salmimies, R., 2012. Acid Dissolution of Iron Oxides and Regeneration of a Ceramic Filter Medium,
Lappeenranta: Acta Universitatis Lappeenrantaenis 495.
Salmimies, R.; Kallas, J.; Ekberg, B.; Gӧrres, G.; Andreassen, J. P.; Häkkinen, A.; Beck, R., 2013.
The Scaling and Regeneration of Ceramic Filter Medium Used in the Dewatering of Magnetite
Concentrate.. International Journal of Mineral Processing 119, pp. 21-26.
Salmimies, R., Kallas, J., Ekberg, B. & Hakkinen, A., 2012. Oxalic Acid Regeneration of Ceramic
FilterMedium Used in the Dewatering of Iron Ore. ISRN Chemical Engineering, 23 October.pp.
Volume 2012, Article ID 921873, 6 pages.
Sandgren, P., Berglind, B. & Modigh, S., 2013. Basics in Minerals Processing Handbook.
Sandrelli, A., 2012. Iron Ore Brazil, Minas-Rio Project. [Online] Available at:
http://www.adimb.com.br/simexmin2012/wp-content/themes/simexmin/palestras/09
Projetos_%20Ferro/IX_7_Sandrelli_a.pdf [Accessed 30 April 2014].
Schaefer, M.; Perlmutter, B.A, undated. Thin-cake Filtration Theory. [Online] Available at:
http://www.bhs-filtration.com/technical/Thin-Cake%20Filtration%20Theory.pdf [Accessed 12
December 2014].
Schenck Process, 2014. LinaClass®-SLO-Babnana screen. [Online]

- 100 -
Available at: http://www.schenckprocess.com/products/Linaclass-SLO-Banana-screens [Accessed 10
May 2014].
Schultz, N. & Cooke, S., 1953. Froth Flotation of Iron Ores. Adsorption of Starch Products and
Laurylamine Acetate.. Industrial & Engineering Chemistry, pp. 45 (12), pp 2767–2772.
Sinnott, R. K., 1993. Coulson & Richardson's CHEMICAL ENGINEERING, Volume 6, second
Edition, Chemical Engineering Design. Oxford: Butterworth-Heinmann.
Sundance Resources Ltd, 2014. Hematite and Itabirite, World Class Iron Ore Resource. [Online]
Available at:http://www.sundanceresources.com.au/irm/content/hematite-and-itabirite.aspx?RID=219
[Accessed 30 April 2014].
Tuck, C. A., 2014. U.S.Geological Survey, Mineral Commodity Summaries. [Online] Available at:
http://minerals.usgs.gov/minerals/pubs/commodity/iron_ore/mcs-2014-feore.pdf [Accessed 27 April
2014].
Turrer, H.D.G.; Sawasato, E.Y.; Guimaraes, F. R.; Magalhaes, C.R.; Dias, G.S. Russo, J.C.;
Pimentel, D.A.; Mazzinghy, D.B.;, 2013. Avaliação do Consumo Energético na Moagem de Dois
Differentes Tipos Litológicos do Depósito da Serra do Sapo. Belo Horizonte, MG, Contribuição
technical ao 43 o Seminário de Redução de Minério de Ferro e Matérias-Primas & 14 o Simpósio
Brasileiro de Minerio de Ferro, 1 a 4 de Setembro de 2013.
Turrer, H.G.T.; Mazzinghy, D.B.; Nascimento, C.M.; Russo, J.F.C.; Dias, G.S.;, 2015. Desemphenho
no Processamento Mineral, de Dois Tipos de Itabiritos Da Serra do Sapo. Rio de Janeiro, 45 o
Seminário de Recução de Minério de Ferro e Matérias-Primas, 16 o Simpósio Brazileiro de Minério
de Ferro e 3 o Simpósio Brasileiro de Angloamerição de Minério de Ferro; abm week.
U.S. Department of the Interior US Geological Survey, 2007. Divisions of Geologic Time -Major
Chronostratigraphic and Geochronologic Units. [Online] Available at:
http://pubs.usgs.gov/fs/2007/3015/fs2007-3015.pdf [Accessed 3 November 2014].

- 101 -
U.S. Geological Survey, 2015. Iron Ore Statistics and Information. [Online] Available at:
http://minerals.usgs.gov/minerals/pubs/commodity/iron_ore/ [Accessed 10 September 2015].
Vidyadhar, a. & Singh, R., undated. Froth Flotation and its Application to Concentration of Low
Grade Iron Ores, Chapter 9. [Online] Available at: http://eprints.nmlindia.org/5908/1/103-114.PDF
[Accessed 2 June 2014].
Wills, B. A., 1997. Mineral Processing Technology, An Introduction to the Practical Aspects of Ore
Treatment and Mineral Recovery, Sixth Edition. Great Britain: Butterworth-Heinemann.

- 102 -
APPENDIX A
A: FILTER COMPARISONS
Anglo American initiated a study to compare operating costs of three different types of filtration
plants used for commercial use in dewatering iron ore. Vacuum, pressure and capillary filtration
plants were included in the study.
A1: Vacuum Filtration
The vacuum filtration plant comprises 26 filters, each with a filter area of 120 m2. Each filter
comprises 12 discs with 10 sectors each. The vacuum system comprises twenty 850 HP pumps
connected to a main pipe leading to the vacuum filters. A thin polyamide fabric, with an average life
of 300 h, is used to prevent clogging of the filters. Fifteen people, taking five turns each, are required
to exchange the damaged fabric on the 3120 installations, with a further team of five people required
for removal of the torn tissue, cleaning the sectors and fitting of new filter elements (Anglo American
Reference 3, 15/09/10).
A2: Pressure Filtration
The pressure filtration plant has 10 filters with a total filter area of 1320 m2. Pressure filtration
employs positive pressure, rather than vacuum, and works in a batch manner. The filtration units
comprise a large number of horizontal plates covered by a blanket that moves during each cycle.
Sealed separate chambers form the filter. Pulp is pumped into all the separate chambers
simultaneously where filter cake begins to form and the filtrate begins to flow. Highly pressurized
water fills the diaphragm automatically and compresses the cake to produce more filtrate. The high
pressures allow low permeability blankets to be used, which raise filtration efficiency. Compressed
air is then blown through the cake, further reducing the humidity. Cake moisture is controlled by
pressure control and air supply. Automatic opening of the filter plates occurs and the cake is
discharged as the blanket filtering progresses through rollers. The mat is automatically washed
(Anglo American Reference 3, 15/09/10).
A3: Capillary (Ceramic) Filtration
These units require lower throughput compared with vacuum disc filters and conventional vacuum
filtration, owing to the capillary effect created in the micro-pores which only allows the passage of
liquid through the ceramic filter media. Lower vacuum is required compared with conventional

- 103 -
vacuum filters, and ceramic discs have a vacuum pump built into the device. Compressed air
requirements are limited to instrument air as cake discharge is achieved by mechanical scraping.
Gland seal water is used in the vacuum pumps and also possibly for backwashing. Nitric acid is
delivered from a storage tank via dosing pumps to chemically regenerate the filters. A 60 % solution
concentration is diluted to 1 % concentration in the filter itself using water pumped from the
backwash system. Granulated solid oxalic acid is prepared to 3 % concentration by mass and
delivered to storage tanks before being pumped to the filters. Both acids are used for filter plate
cleaning (Anglo American Reference 3, 15/09/10). The concentrate at the magnetite plant, located in
Tierra Amarilla, is thickened to 65 % solids and conditioned at pH 11 before pipeline pumping of the
slurry for 120 miles to a port facility. After passing through sieves to remove any foreign matter, the
pulp concentrate reports to three ceramic filter units, each with a surface area 144 m2, to achieve a
cake humidity of 9 %. Normal operation only requires the use of two filters, allowing the third to be
washed and regenerated when not in use (Anglo American Reference 3, 15/09/10).
A4: Comparison of efficiency and costs
Table A1 presents a breakdown of the operational efficiency and operating costs of each filter type
(Anglo American Reference 3, 15/09/10).
Table A1: Operational costs per ton of dry solids (Anglo American Reference 3, 15/09/10).
Basic Data Vacuum filtration Pressure
filtration
Ceramic
filtration
Capacity (DMTPY) 16 517 611 7 284 816 3 481 574
Operation hours (h/y) 7 446 6 132 8059.20
Filtration rate (kg/m2.h) 711 900 1000
Cake moisture (% H2O) 10 10 9
Cycle time (min) 12.5
Utility Prices Vacuum filtration Pressure
filtration
Ceramic
filtration
Price of energy (EUR/kWh) 0.09 0.09 0.09
Price of water (EUR/m3) 0.05 0.05 0.05
Man-hour costs (EUR/h) 4 4 4
Price of nitric acid (EUR/l) 0.3
Price of oxalic acid (EUR/kg) 1.82

- 104 -
Energy Consumption Vacuum filtration Pressure
filtration
Ceramic
filtration
Filters (kWh/T DS) (EUR/t DS) 0.12 0.011 0.06 0.01 0.11 0.01
Vacuum & air compressor (kWh/t
DS) (EUR/t DS)
7.64 0.687 0.43 0.04 0.05 0.004
Other (kWh/t DS) (EUR/t DS) 0.32 0.029 2.77 0.25 0.39 0.035
Total (kWh/t DS) (EUR/t DS) 8.08 0.727 3.27 0.29 0.55 0.049
Other Consumptions (EUR/t
DS)
Vacuum filtration Pressure
filtration
Ceramic
filtration
Filter media wash water (m3/t
DS) (EUR/t DS)
0.006 0.0003 0.02 0.001 0.01 0.000
Filtrate (m3/t DS) (EUR/t DS) 0.07 0.003
Total (EUR/t DS) 0.0003 0.004 0.207
Spares & Wearing Parts Vacuum filtration Pressure
filtration
Ceramic
filtration
Wearing parts (EUR/t DS) 0.104 0.26 0.285
Unexpected breakdown 0.008 0.01 0.004
Total (EUR/t DS) 0.112 0.26 0.289
Maintenance (h/Y) (No. of man
hours) (EUR/t DS)
Vacuum filtration Pressure
filtration
Ceramic
filtration
Replace wearing parts 16491 15 0.060 1467 12 0.010 102 0 0.000
Preventive maintenance 54080 12 0.157 4160 15 0.034 1248 3 0.004
Unexpected break-down 1000 10 0.002 100 5 0.001
Operators 7446 10 0.018 8059 10 0.093
Total (EUR/t DS) 0.238 0.04 0.097
GRAND TOTAL (EUR/t DS) 1.08 0.61 0.64
The ceramic filtration was considered the most efficient to the other filtration systems compared
because of the reduced energy consumption, lower manpower requirements for operation and lower
filtrate treatment costs.

- 105 -
APPENDIX B
B: SUMMARY OF PRIOR STUDIES CONDUCTED BY ANGLO AMERICAN
Anglo American has conducted previous studies to assess optimal conditions to achieve filter
requirements for final dewatering of an iron-ore concentrate. A combination of bench-scale and pilot
testwork was performed to verify filtration conditions necessary to achieve optimal yield and
moisture content and to evaluate and verify filtration capacity requirements necessary to meet the
24.5 Mt/a operational requirement. Testwork programmes and outcomes are summarised below.
B1: Anglo American Testwork Reference 1 - 2007
Various bench-scale and pilot tests were conducted to assess filter capacity requirements for final
dewatering of an iron-ore concentrate. Testwork was initially conducted on a larger grind size using
ball-mill product (-150 µm) and later testwork employed more representative Verti-mill product (-45
µm). A Larox Ceramic CC-1 pilot filter unit was used for pilot-scale testwork and the impact of
differing feed solids concentrations was investigated. Parameters analysed included pulp density,
temperature, pH, cake moisture, cake mass, cake thickness and filter permeability. Results showed a
general increase in filtration rate (capacity) and moisture content as the slurry percent solids was
increased. Batch tests were run for short duration, necessitating a “capacity factor” value to be
applied to account for the potential loss of filter capacity over an extended time period. An estimated
“capacity factor” value of 0.862 (13.8 %), derived from an operating plant with similar process
material characteristics, was used in capacity calculations. Table B1 shows the criteria used for filter
sizing, which include production capacity in dry tonnes, required product moisture content, operating
hours accounting for the estimated “capacity factor”, unit availability and disc rotation speed (Anglo
American Testwork Reference 1, 2007).
Table B1: Criteria used for filter unit sizing.
Parameter Value
Capacity (t/a) dry basis 24 500 000
Capacity (t/h) 3040
Moisture (%) <8.2
Operating hours per year (h) 8060
Availability (%) 90
rpm (tested) 2.4

- 106 -
Testwork indicated that, at 71 % solids concentration, a filter area of 1610 m2 would be sufficient to
meet the required production of 24.5 Mt/a. This would necessitate installation of twelve CC-144
ceramic filtration units. An assumed utilization value of 90 % was deemed sufficient to accommodate
acid washing cycles and any other operational downtime needs (Anglo American Testwork
Reference 1, 2007).
B2: Anglo American Testwork Reference 2 - September 2010
Testwork was again conducted in 2010 to study the productive capacity of the Ceramic CC-144 filter
using a combination of laboratory tests (leaf test) and pilot filter tests using a pilot filter unit (DC-01).
Bench-scale leaf tests were conducted using a more representative sample that had been reground
using a Verti-mill. Optimal pH and solids concentration were initially determined using bench-scale
leaf tests. Optimal conditions were defined as: 70 % solids concentration, pH 7 and 90 g/t coagulant
addition. Subsequent pilot testwork to establish optimal rotation speed, vacuum pressure and pulp
level were performed using these optimised parameters.
Investigation of filter unit capacity relative to product moisture was conducted using an open-circuit
configuration. Filter capacity increased with increasing moisture content. Experiments conducted to
establish optimal pilot operating conditions demonstrated that the highest yield was achieved at
maximum vacuum level, highest disc rotation speed and greatest basin level, while the lowest cake
humidity was achieved at minimum vacuum and basin level but highest rotation speed. The only
factor shown to reduce humidity, while increasing productivity, was increased rotational speed of the
disc as this decreased pie thickness and increased discharge. These tests comprised short duration
batch tests (1.5 h), and so did not facilitate assessment of any decrease in productivity of the filter
with time.
Extended 12-hour testwork was then executed to evaluate productivity behaviour of the filter unit.
Three tonnes of iron-ore concentrate was prepared by passing the ore through a grinding and flotation
stage. The product was then re-pulped in an agitator tank to achieve a 70 % solids concentration at a
slurry density of 2.25 kg/l and pH of 7. A closed-circuit configuration was used. Experimental
conditions included a vacuum level of 0.8 bar, a disc rotation speed of 2.2 rpm and highest basin
level.

- 107 -
Testwork results showed a decrease in filter capacity of 14.4 % and an increase in cake moisture of
0.41 % over the 12-hour period, where Equation 18 was used to calculate the filter capacity and filter
area requirements.
𝑌𝑖𝑒𝑙𝑑 =𝑡
𝐹+1×
𝑛𝑓×𝑎𝑟𝑒𝑎
106× ∫ 𝑓(𝑥)𝑑𝑥
𝐹
0) (B1)
where:
t: Time available (8760 h/a, based on 100 % availability);
F: Operation time for cleaning of ceramic plates; (12 hours);
nf: Number of filters;
area: Filter area per filter (144 m2);
f (x): Equation that reproduces the reduced productivity as a function of time (derived from the slope
of capacity vs. operation time graph. In this instance −8.2797x + 1631.4 dx);
106: Factor to convert g to t.
Testwork showed that 12 filter units would only provide a filter capacity of 20.34 Mt/a, which was
significantly lower than the 24.5 Mt capacity required to meet operational requirements. The poor
filter productivity results in this testwork program were attributed to surface defects and aging of the
ceramic plates. The cake moisture content achieved was close to the expected 8 %.
Using the above data to calculate the required filter capacity to meet the 24.5 Mt/a production
requirements showed that 14 filter units would be necessary to meet the required operational filter
capacity of 24.5 Mt/a (Anglo American Testwork Reference 2, 15/09/10; Anglo American Reference
3, 15/09/10).
B3: Anglo American Testwork Reference 3, 2012 - March 2011 Testwork
Pilot testwork was conducted in March 2011 to confirm previous testwork data and to apply changes
deemed necessary after previous testwork evaluation. Testwork parameters are shown in Table B2.

- 108 -
Table B2: Testwork Parameters – March 2011.
Parameter Value
Solids concentration Increased from 70 % to 71 %
Filters Low productivity plates replaced
Coagulant 90 g/t of polyDADMAC
pH
To simulate pipeline pumping conditions the pH was
first adjusted to 10.5 to facilitate coagulant addition
with subsequent pH adjustment to pH 7.0
Vacuum 0.8 bar
Disc speed 2.2 rpm
Basin level Highest pulp level
Solids density 5.08 g/cm3
Slurry density 2.3 kg/L
Pulp pH 7.0
Blaine index 1840 cm2/g
Ultrasonic cleaning Every hour for 2 min
Backwash Every cycle
Testwork results showed an operating capacity decrease from 2316 kg/m².h to 1910 kg/m².h,
resulting in a 17.5 % decline in yield after 12 h continuous operation. Moisture content increased
marginally from 8.1 % to give a final moisture content of 8.4 %.
Factors attributed to achieving the good filter capacity and reduction of pore clogging included:
coagulant addition, which served to reduce fine particulates dispersed in the liquid medium, regular
ultrasonic cleaning at two minute intervals and backwashing after every cycle.
An increased yield of 26.8 Mt/a was calculated when substituting the new testwork results into
Equation 18, thereby reducing the total number of CC-144 filter units originally estimated to meet
production requirements from 14 to 11 units (Anglo American Testwork Reference 3, 28/04/12).
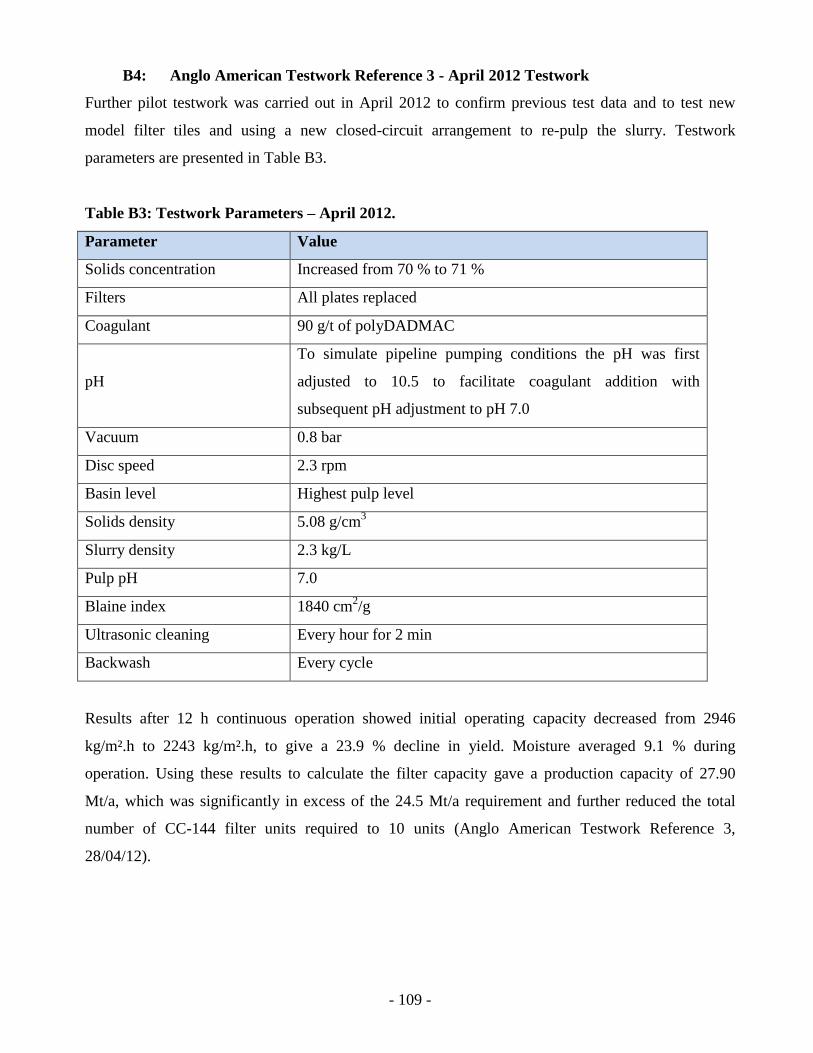
- 109 -
B4: Anglo American Testwork Reference 3 - April 2012 Testwork
Further pilot testwork was carried out in April 2012 to confirm previous test data and to test new
model filter tiles and using a new closed-circuit arrangement to re-pulp the slurry. Testwork
parameters are presented in Table B3.
Table B3: Testwork Parameters – April 2012.
Parameter Value
Solids concentration Increased from 70 % to 71 %
Filters All plates replaced
Coagulant 90 g/t of polyDADMAC
pH
To simulate pipeline pumping conditions the pH was first
adjusted to 10.5 to facilitate coagulant addition with
subsequent pH adjustment to pH 7.0
Vacuum 0.8 bar
Disc speed 2.3 rpm
Basin level Highest pulp level
Solids density 5.08 g/cm3
Slurry density 2.3 kg/L
Pulp pH 7.0
Blaine index 1840 cm2/g
Ultrasonic cleaning Every hour for 2 min
Backwash Every cycle
Results after 12 h continuous operation showed initial operating capacity decreased from 2946
kg/m².h to 2243 kg/m².h, to give a 23.9 % decline in yield. Moisture averaged 9.1 % during
operation. Using these results to calculate the filter capacity gave a production capacity of 27.90
Mt/a, which was significantly in excess of the 24.5 Mt/a requirement and further reduced the total
number of CC-144 filter units required to 10 units (Anglo American Testwork Reference 3,
28/04/12).
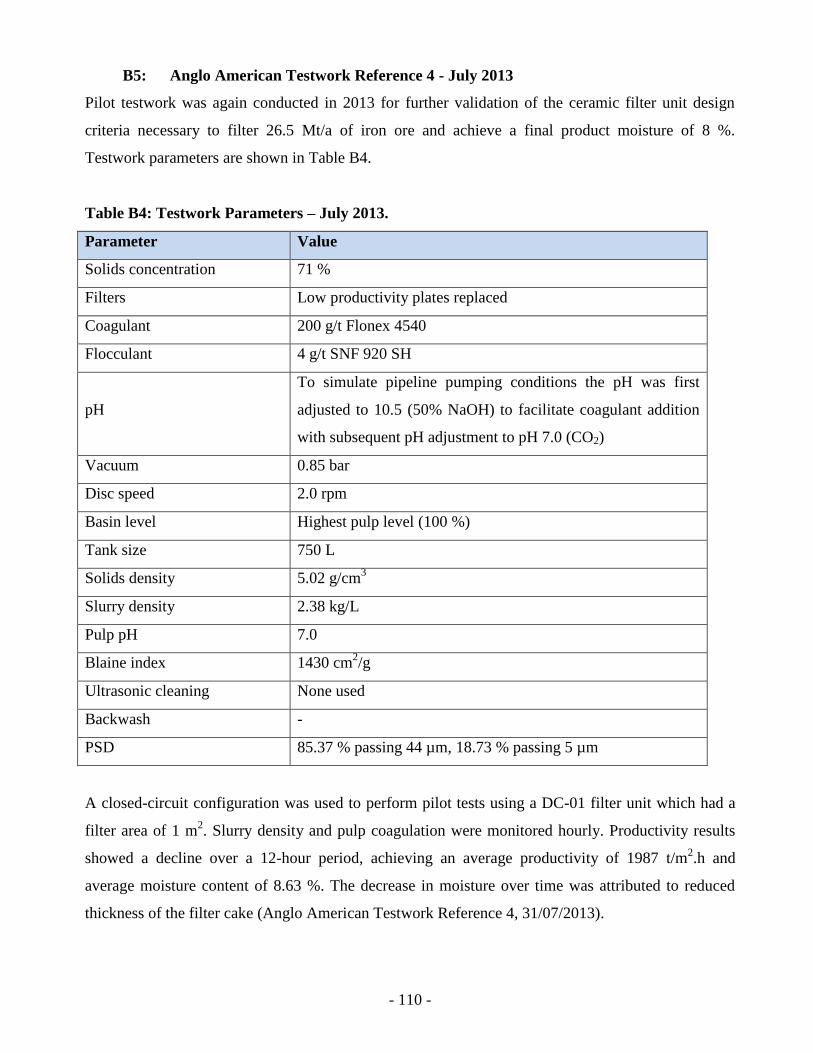
- 110 -
B5: Anglo American Testwork Reference 4 - July 2013
Pilot testwork was again conducted in 2013 for further validation of the ceramic filter unit design
criteria necessary to filter 26.5 Mt/a of iron ore and achieve a final product moisture of 8 %.
Testwork parameters are shown in Table B4.
Table B4: Testwork Parameters – July 2013.
Parameter Value
Solids concentration 71 %
Filters Low productivity plates replaced
Coagulant 200 g/t Flonex 4540
Flocculant 4 g/t SNF 920 SH
pH
To simulate pipeline pumping conditions the pH was first
adjusted to 10.5 (50% NaOH) to facilitate coagulant addition
with subsequent pH adjustment to pH 7.0 (CO2)
Vacuum 0.85 bar
Disc speed 2.0 rpm
Basin level Highest pulp level (100 %)
Tank size 750 L
Solids density 5.02 g/cm3
Slurry density 2.38 kg/L
Pulp pH 7.0
Blaine index 1430 cm2/g
Ultrasonic cleaning None used
Backwash -
PSD 85.37 % passing 44 µm, 18.73 % passing 5 µm
A closed-circuit configuration was used to perform pilot tests using a DC-01 filter unit which had a
filter area of 1 m2. Slurry density and pulp coagulation were monitored hourly. Productivity results
showed a decline over a 12-hour period, achieving an average productivity of 1987 t/m2.h and
average moisture content of 8.63 %. The decrease in moisture over time was attributed to reduced
thickness of the filter cake (Anglo American Testwork Reference 4, 31/07/2013).

- 111 -
Testwork data were used to calculate filter sizing requirements using four different scenarios (Anglo
American Testwork Reference 4, 31/07/2013):
Scenario 01 – Sizing was performed according to conceptual design of a new project to meet a 26.5
Mt/a capacity requirement. Parameters were agreed between Outotec and Anglo American, based on
dimensions from similar operations.
Scenario 02 – Sizing was performed using parameters agreed by filtering staff and maintenance
engineering teams.
Scenario 03 – Sizing was performed using parameters agreed by filtering staff and maintenance
engineering teams using pilot test productivity to determine optimal time to carry out cleaning of
filters (every 7 h).
Scenario 04 – Sizing was performed using parameters agreed by filtering staff and the maintenance
engineering teams using productivity to determine optimal time to carry out cleaning of filters and
reducing replacement intervals of the filters to every 12 months.
Filter unit capacity requirements, changes in operational performance and physical availability
associated with the different scenario options are tabulated in Table B5.

- 112 -
Table B5: Four different scenarios considered for calculation of required filter units.
Parameter Scenario 01 Scenario 02 Scenario 03 Scenario 04
Capacity (natural) (Mt/a) 26.5 26.5 26.5 26.5
Capacity (dry) (Mt/a) 24.5 24.5 24.5 24.5
Annual operation (h) 8760 8760 8760 8760
Filter area (m2) 144 144 144 144
TUF – productivity (t/m2.h) 1987 1987 22 204 22 204
Washing intervals (h) 12 12 7 7
Loss factor of washing time 0.92 0.92 0.88 0.88
TUF – corrected productivity
(t/m2.h)
1559 1651 1749 1846
Utilisation (%) 95 94.8 94.8 94.3
Physical availability (%) 90 93.3 -
Maintenance
93.3
93.3
Operational performance (%) 85 88 88 88
Loss of production (%/a) 15 10 10 5
Interval for exchange of plates (yr.) 3 2 2 1
Engineering factor (%) 20 0 0 0
No. of filters calculated 17.5 13.3 12. 6 12.0
No. of filters required 18 14 13 12
The four scenarios were also rated using the Anglo American 5 x 5 risk matrix and classified in terms
of severity of impact should preventative action not be taken to maintain optimal filter capacity. The
lower the number of filters, the greater the risk of not achieving the required production, and the
higher the probability and the greater the impact of not achieving the required production (Anglo
American Testwork Reference 4, 31/07/2013). Risk ratings in terms of the Anglo American risk
matrix associated with the different scenario options are given in Table B6.

- 113 -
Table B6: Risk rating for the four different scenarios.
Parameter Scenario 01 Scenario 02 Scenario 03 Scenario 04
Rating 1- Low -
sufficient filters
available
resulting in a low
impact on
production if
preventative
measures are not
taken.
3 - Significant -
fewer filters
available, resulting
in a more
significant impact
on production if
preventative
measures are not
taken.
4 - High -
even fewer filters
available,
resulting in a
high impact on
production if
preventative
measures are not
taken.
5 - Major -
fewest number of
filters available,
resulting in a
major impact on
production if
preventative
measures are not
taken.
Probability
& Impact
1- low & 1- low 3 - significant & 3
- significant
4 - high & 4 -
high
5 - major & 5 -
major
Filtering production curves were also analysed to establish whether the four scenarios would be able
to meet to required production capacity. The ability of each scenario to meet production capacity
with the additional filter units required to fulfil the requirement and justification of the numbers are
provided in Table B7.

- 114 -
Table B7: Ability of each scenario to meet production capacity.
Parameter Scenario 01 Scenario 02 Scenario 03 Scenario 04
Production
capacity
Insufficient to
meet ramp-up of
production from
the 9th
month.
Insufficient to
meet ramp-up of
production from
the 12th
month.
Insufficient to
meet ramp-up of
production from
the 17th
month.
Sufficient to meet
ramp-up of
production.
Number of
additional
filters units
required
6 2 1 0
Justification
for number
of
additional
filters
No maintenance
strategy in place
to reduce risk. 12
h washing
intervals with 3-
yearly
replacement of
ceramic plates.
Maintenance
strategy is in
place to reduce
risk. 12 h
washing intervals
with replacement
of ceramic plates
every 2 years.
Maintenance
strategy is in
place to reduce
risk. Washing
intervals reduced
to 7 h, with
replacement of
ceramic plates
every 2 years.
Maintenance
strategy is in
place to reduce
risk. Washing
intervals reduced
to 7 h, with
yearly
replacement of
ceramic plates.
B6: Anglo American Testwork Reference 5- January 2014
Pilot-scale testwork was conducted in January 2014 to evaluate the impact of particle size on the
yield and residual moisture achieved by the ceramic filter over a 12-hour continuous operation.
Testwork parameters are detailed in Table B8.

- 115 -
Table B8: Testwork Parameters – January 2014.
Parameter Condition 1 Condition 2
Solids concentration 71 % 71 %
Filters Not specified Not specified
Coagulant PolyDADMAC SNF 4540 200 g/t 500 g/t Ca(OH)2
Flocculant SNF FA 920 SHR 4 g/t None
Initial pH
To simulate pipeline pumping
conditions, the pH was first adjusted
to pH 10.5 using 50 % NaOH
To simulate pipeline pumping
conditions, the pH was first
adjusted to pH 10 using 50 %
NaOH
Agitation time (h) 18 h 18 h
Final pH pH 7 with CO2 pH 12
Vacuum 0.85 bar 0.85 bar
Disc speed (rpm) 2.0 2.0
Basin level Highest pulp level (100 %) Highest pulp level (100 %)
Tank size (L) 750 750
Solids density (g/cm3) 5.03 5.03
Slurry density (kg/L) 2.32 2.36
Pulp pH 10.5 12.1
Blaine index (cm2/g) 1026 1026
Ultrasonic cleaning None described None described
Backwash None described None described
PSD 77.8 % passing 44 µm, 16 % passing
10 µm
77.8 % passing 44 µm, 16 %
passing 10 µm
Tests showed that, at polyDADMAC SNF 4540 coagulant dosages of 150 g/t and higher, there was
increased dispersion of the pulp, indicating overdose. Good coagulation was achieved using 500 g/t
dosage of Ca(OH)2. An average productivity of 2620 kg/m2.h was achieved with an average residual
humidity of approximately 8 %. Yield reduced by 32.7 % after 12 h continuous operation, but
productivity was still considered good at 2240 kg/m2h. Outotec concluded that once the best factors
and criteria were defined by Anglo American and Outotec, testwork could be conducted to estimate
the production of an industrial filter (Anglo American Testwork Reference 5, 14/2/2014).

- 116 -
APPENDIX C
C: STANDARD OPERATING PROCEDURE (Larox Operating Instructions, undated)
C1: Plate Permeability Check
The permeability (l/m2.h) of the plate should be checked before use. This is measured by running
water through the plate for a defined time. The procedure is as follows:
1. Valve 1 is closed and valves 2 and 3 are opened (Refer Figure 3.2).
2. The tap water connection is fully opened.
3. The pressure is adjusted to 1 bar using the pressure reducing valve.
4. A stopwatch is started and water is collected in a volumetric flask.
The permeability of the L1 membrane plate, with water temperature at 20 °C, should be 500 ml in 11
s. This information should be recorded with the viscosity factor for different temperatures taken into
account.
C2: Vacuum Level Determination
The vacuum level should be a minimum of 0.9 bar and should be checked before the test. The
procedure is as follows:
1. Valve 1 is opened and valves 2 and 3 are closed (refer Figure 3.2).
2. The water tap is opened - air now flows inside the plate.
3. The vacuum level is read from the pressure gauge.
The filtration area is marked on the plate using a straight line, leaving 0.01 m2 free area for filtration.
The vacuum bottle is drained well before commencing testwork.
C3: Dipping and Cake Forming
1. The sample should be well stirred for the duration of the test.
2. The vacuum is switched on and the stopwatch started.
3. The leaf-tester is dipped into the mixing tank. It should be kept in an upright position and
submerged only up to the level marking.
4. Movement of the leaf-tester must be by hand and in the same manner as the disc sectors move
in the real size filter.

- 117 -
C4: Cake Drying
Once the cake-forming time is completed, the leaf tester is removed from the mixing tank. The
vacuum level is observed during the drying time and recorded. Figure 3.4 shows the leaf-tester being
held upright during the cake-drying stage.
C5: Cake Discharge
Once drying time is complete, the cake from one side of the plate is immediately discharged into a
tray with a scraper and the weight noted. The cake thickness should be measured from the other side
of the plate. The same side of the plate should always be used for each function.
C6: Back Washing
Back washing and ultrasonic cleaning should be undertaken between each test. Backwashing is
achieved in the same manner as the permeability check. The plate is placed into a vessel and water is
run through the plate. The ultrasonic cleaner is placed into the vessel filled with water and switched
on. After cleaning both sides of the plate, the permeability should be rechecked. The vacuum bottle
should be drained before commencing the next test. Figure 3.6 shows the ultrasonic unit immersed
with the plate for the cleaning stage.
C7: Repetitions
Each test parameter should be performed in triplicate and the average result taken.
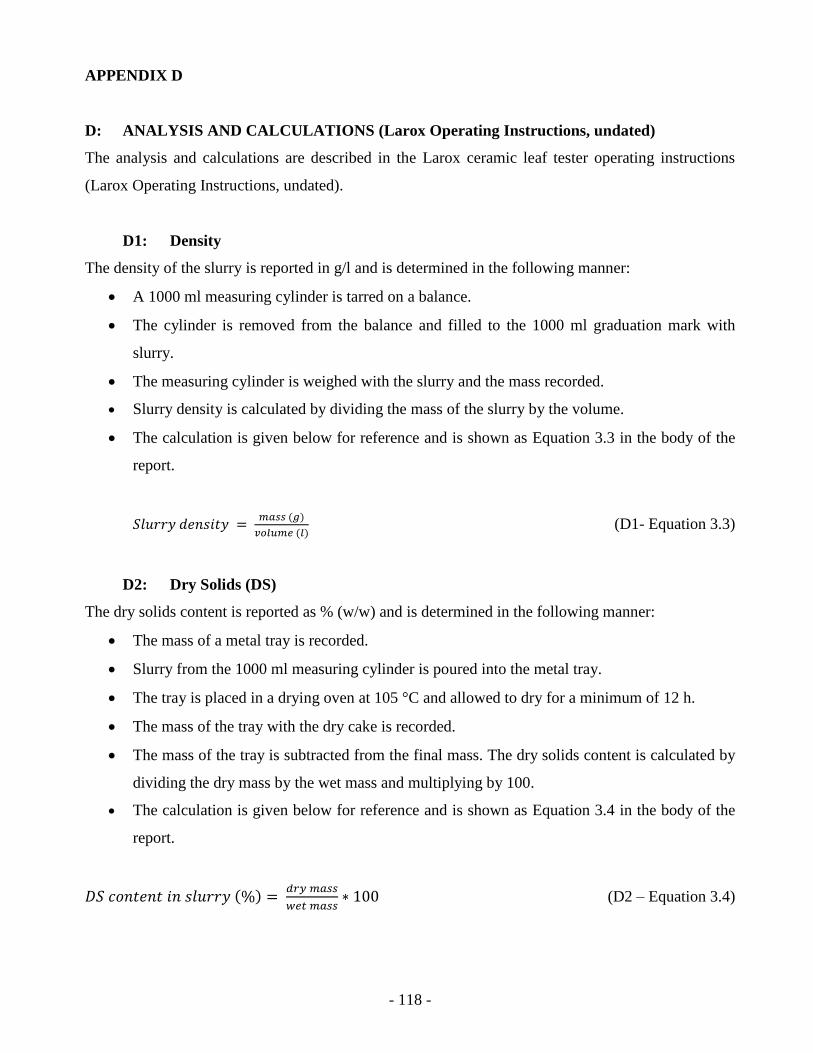
- 118 -
APPENDIX D
D: ANALYSIS AND CALCULATIONS (Larox Operating Instructions, undated)
The analysis and calculations are described in the Larox ceramic leaf tester operating instructions
(Larox Operating Instructions, undated).
D1: Density
The density of the slurry is reported in g/l and is determined in the following manner:
A 1000 ml measuring cylinder is tarred on a balance.
The cylinder is removed from the balance and filled to the 1000 ml graduation mark with
slurry.
The measuring cylinder is weighed with the slurry and the mass recorded.
Slurry density is calculated by dividing the mass of the slurry by the volume.
The calculation is given below for reference and is shown as Equation 3.3 in the body of the
report.
𝑆𝑙𝑢𝑟𝑟𝑦 𝑑𝑒𝑛𝑠𝑖𝑡𝑦 = 𝑚𝑎𝑠𝑠 (𝑔)
𝑣𝑜𝑙𝑢𝑚𝑒 (𝑙) (D1- Equation 3.3)
D2: Dry Solids (DS)
The dry solids content is reported as % (w/w) and is determined in the following manner:
The mass of a metal tray is recorded.
Slurry from the 1000 ml measuring cylinder is poured into the metal tray.
The tray is placed in a drying oven at 105 °C and allowed to dry for a minimum of 12 h.
The mass of the tray with the dry cake is recorded.
The mass of the tray is subtracted from the final mass. The dry solids content is calculated by
dividing the dry mass by the wet mass and multiplying by 100.
The calculation is given below for reference and is shown as Equation 3.4 in the body of the
report.
𝐷𝑆 𝑐𝑜𝑛𝑡𝑒𝑛𝑡 𝑖𝑛 𝑠𝑙𝑢𝑟𝑟𝑦 (%) = 𝑑𝑟𝑦 𝑚𝑎𝑠𝑠
𝑤𝑒𝑡 𝑚𝑎𝑠𝑠∗ 100 (D2 – Equation 3.4)

- 119 -
D3: Measurement of Cake Moisture
Once the filtration test is complete, the moisture of the cake is determined. This is reported as %
moisture. The procedure is as follows:
The cake is scraped off one side of the plate.
A metal tray is weighed and the mass recorded.
The cake is placed in the metal tray.
The tray is weighed with the cake. The mass of the tray is subtracted to obtain the wet mass of
the cake.
The tray is placed in a drying oven at 105 °C and allowed to dry for 12 h.
The tray is weighed with the dried solids. The mass of the tray is subtracted to obtain the mass
of the dry solids.
The residual moisture is calculated by subtracting the dry mass from the wet mass and
dividing the sum by the wet mass. This is converted to a percent value by multiplying by 100.
The calculation is given below for reference and is shown as Equation 3.5 in the body of the
report.
𝐶𝑎𝑘𝑒 𝑚𝑜𝑖𝑠𝑡𝑢𝑟𝑒 (%) = (𝑤𝑒𝑡 𝑚𝑎𝑠𝑠−𝑑𝑟𝑦 𝑚𝑎𝑠𝑠)
𝑤𝑒𝑡 𝑚𝑎𝑠𝑠∗ 100 (D3 – Equation 3.5)
D4: Calculation of Cake Mass
The residual thicknesses of the plates are as follows:
Blue plate = 1 mm
Grey plate = 2 mm
If the cake breaks off completely, then 0.0 mm should be used for iron concentrates.
The cake mass is calculated by dividing the cake mass by the cake thickness and multiplying
this by the sum of the residual cake thickness subtracted from the cake thickness.
The calculation is given below for reference and is shown as Equation 3.6 in the body of the
report.
𝐶𝑎𝑘𝑒 𝑚𝑎𝑠𝑠 𝑖𝑛 𝑐𝑎𝑙𝑐𝑢𝑙𝑎𝑡𝑖𝑜𝑛𝑠 = 𝑐𝑎𝑘𝑒 𝑚𝑎𝑠𝑠
𝑐𝑎𝑘𝑒 𝑡ℎ𝑖𝑐𝑘𝑛𝑒𝑠𝑠∗ (𝑐𝑎𝑘𝑒 𝑡ℎ𝑖𝑐𝑘𝑛𝑒𝑠𝑠 − 𝑟𝑒𝑠𝑖𝑑𝑢𝑎𝑙 𝑐𝑎𝑘𝑒 𝑡ℎ𝑖𝑐𝑘𝑛𝑒𝑠𝑠)(D4 - Equation 3.6)

- 120 -
D5: Calculation of Dry Solids Capacity
The dry solids capacity is calculated using the dry mass and is reported as C or (TUF)
[kg/m²h]. The dry cake mass is converted to kg and multiplied by 60 to convert minutes to
hours, this is divided by the product of the filter area in m2 and the cycle time in minutes.
(The cycle time is the total cycle time.) The residual cake thickness must be noted when
calculating the dry solids capacity. The calculation is given below for reference and is shown
as Equation 3.7 in the body of the report.
𝐶 =𝑐𝑎𝑘𝑒 𝑚𝑎𝑠𝑠(𝑘𝑔)∗60
𝑓𝑖𝑙𝑡𝑒𝑟 𝑎𝑟𝑒𝑎 (𝑚2)∗ 𝑐𝑦𝑐𝑙𝑒 𝑡𝑖𝑚𝑒 (𝑚𝑖𝑛) (D5 - Equation 3.7)

- 121 -
APPENDIX E
E: TESTWORK RESULTS
Table E1: Testwork to demonstrate the impact of slurry pH on filtration capacity – (Table 4.2).
Test
Pie
width
(mm)
Residual
pie
width
(mm)
Wet pie
mass (g)
Dry pie
mass (g)
Moisture
(%)
Dry solids
capacity
(kg/m2.h)
(TUF)
pH 11.5 (CaO)
10.78 1 430 393 8.60 3 169
11.48 1 430 393 8.60 3 189
10.16 1 399 366 8.27 2 933
Average 10.81 1 420 384 8.49 3097
Standard deviation 0.54 0 18 15 0.19 142
pH 9.8 (HNO3)
10.26 1 399 354 11.28 2 840
10.00 1 380 346 8.95 2 768
9.00 1 350 320 8.57 2 528
Average 9.75 1 376 340 9.60 2712
Standard deviation 0.67 0 25 17.78 1.47 163
pH 8.7 (HNO3)
10.20 1 396 361 8.84 2 894
10.10 1 416 381 8.41 3 051
10.10 1 370 339 8.38 2 715
Average 10.13 1 394 360 8.54 2887
Standard deviation 0.06 0 23 21.01 0.26 168
pH 7.7 (HNO3)
10.40 1 340 313 7.94 2 515
10.14 1 339 311 8.26 2 492
9.78 1 309 285 7.77 2 274
Average 10.11 1 329 303 7.99 2427
Standard deviation 0.31 0 18 16 0.25 133
pH 6.8 (HNO3)
11.24 1 432 397 8.10 3 215
10.00 1 393 360 8.40 2 880
10.30 1 388 355 8.51 2 849
Average 10.51 1 404 371 8.33 2981
Standard deviation 0.65 0 24 23 0.21 203

- 122 -
Table E2: Filtration results using different acid types to adjust slurry pH – (Table 4.4).
Test
Pie
width
(mm)
Residual
pie
width
(mm)
Wet pie
mass (g)
Dry pie
mass (g)
Moisture
(%)
Dry solids
capacity
(kg/m2.h)
(TUF)
pH 6.9 (HNO3)
12.22 1 503 457 9.15 3 730
12.10 1 500 455 9.00 3 710
12.20 1 474 432 8.86 3 525
Average 12.17 1 492 448 9.00 3655
Standard deviation 0.06 0 15.95 13.89 0.14 113
pH 6.8 (HCl)
12.90 1 515 468 9.13 3 838
12.74 1 505 459 9.11 3 760
12.48 1 496 451 9.07 3 688
Average 12.71 1 505 459 9.10 3762
Standard deviation 0.21 0 9.50 8.50 0.03 75
pH 6.5 (C2H2O4)
12.50 1 472 423 10.38 3 459
12.40 1 461 415 9.98 3 391
11.08 1 415 373 10.12 3 016
Average 11.99 1 449 404 10.16 3289
Standard deviation 0.79 0 30.24 26.86 0.20 239
pH 7.2 (CO2)
11.10 1 392 363 7.40 2 936
10.90 1 428 389 9.11 3 141
10.60 1 390 355 8.97 2 858
Average 10.87 1 403 369 8.49 2978
Standard deviation 0.25 0 21.39 18 0.95 146

- 123 -
Table E3: Filtration results using different flocculant dosages at pH 7.1 – (Table 4.6).
Test
Pie
width
(mm)
Residual
pie
width
(mm)
Wet pie
mass (g)
Dry pie
mass (g)
Moisture
(%)
Dry solids
capacity
(kg/m2.h)
(TUF)
pH 7.1 (HNO3) 0.25
g/t
12.42 1 500 453 9.40 3 702
11.78 1 470 428 8.94 3 481
12.40 1 480 436 9.17 3 563
Average 12.20 1 483 439 9.17 3582
Standard deviation 0.36 0 15.28 12.77 0.23 112
pH 7.1 (HNO3) 0.5 g/t
12.56 1 514 467 9.14 3 821
11.90 1 493 448 9.13 3 648
11.80 1 456 415 8.99 3 376
Average 12.09 1 488 443 9.09 3615
Standard deviation 0.41 0 29.37 26.31 0.08 224
pH 7.1 (HNO3) 4 g/t
13.28 1 493 452 8.32 3 715
13.10 1 515 488 5.24 4 007
12.58 1 522 468 10.34 3 829
Average 12.99 1 510 469 7.97 3850
Standard deviation 0.36 0.00 15.13 18 2.57 147

- 124 -
Table E4: Filtration results for flocculant tests at pH 11.5 – (Table 4.8).
Test
Pie
width
(mm)
Residual
pie
width
(mm)
Wet pie
mass (g)
Dry pie
mass (g)
Moisture
(%)
Dry solids
capacity
(kg/m2.h)
(TUF)
pH 11.5 (CaO) 0.25 g/t
9.10 1 371 338 8.89 2 674
9.00 1 336 307 8.63 2 426
8.90 1 342 316 7.60 2 493
Average 9.00 1 350 320 8.38 2531
Standard deviation 0.10 0 19 16 0.68 129
pH 11.5 (CaO) 0.5 g/t
9.10 1 358 329 8.10 2 603
9.28 1 353 328 7.08 2 601
8.64 1 338 310 8.28 2 437
Average 9.01 1 350 322 7.82 2547
Standard deviation 0.33 0 10 11 0.65 96
pH 11.5 (CaO) 1.0 g/t
9.70 1 372 342 8.06 2 727
7.00 1 320 296 7.50 2 255
8.00 1 293 271 7.51 2 108
Average 8.23 1 328 303 7.69 2363
Standard deviation 1.37 0 40 36 0.32 323
pH 11.5 (CaO) 4.0 g/t
10.40 1 391 358 8.44 2 876
8.90 1 349 321 8.02 2 533
9.60 1 359 328 8.64 2 612
Average 9.63 1 366 336 8.37 2674
Standard deviation 0.75 0 22 20 0.31 180

- 125 -
Table E5: Results from standard performance tests – (Table 4.10).
Test No
Pie
width
(mm)
Residual
pie
width
(mm)
Wet pie
mass (g)
Dry pie
mass (g)
Moisture
(%)
Dry solids
capacity
(kg/m2.h)
(TUF)
pH 7 28/08/14
0.95 bar – 33 oC
8.20 1 322 296 8.07 2 310
9.10 1 321 295 8.10 2 334
7.70 1 312 287 8.01 2 220
Average 8.33 1 318 293 8.06 2288
Standard deviation 0.71 0 6 5 0.04 60
pH 7 29/08/14
0.85 bar – 30 oC
8.40 1 325 297 8.62 2 326
8.34 1 319 294 7.84 2 300
8.45 1 315 289 8.25 2 265
Average 8.40 1 320 293 8.24 2297
Standard deviation 0.06 0 5 4 0.39 31


![Ceramic filtration and animal by products [kompatibilitetstilstand]](https://static.fdocuments.in/doc/165x107/55d587ddbb61ebae6c8b460f/ceramic-filtration-and-animal-by-products-kompatibilitetstilstand.jpg)
