
An approach for detecting, quantifying, and visualizing...
21
Journal of Informetrics 5 (2011) 146–166 Contents lists available at ScienceDirect Journal of Informetrics journal homepage: www.elsevier.com/locate/joi An approach for detecting, quantifying, and visualizing the evolution of a research field: A practical application to the Fuzzy Sets Theory field M.J. Cobo ∗ , A.G. López-Herrera, E. Herrera-Viedma, F. Herrera Dept. Computer Science and Artificial Intelligence, CITIC-UGR (Research Center on Information and Communications Technology), University of Granada, E-18071-Granada, Spain article info Article history: Received 26 April 2010 Received in revised form 3 October 2010 Accepted 6 October 2010 Keywords: Science mapping Co-word analysis Bibliometric studies Fuzzy Sets Theory Thematic evolution h-Index abstract This paper presents an approach to analyze the thematic evolution of a given research field. This approach combines performance analysis and science mapping for detecting and visualizing conceptual subdomains (particular themes or general thematic areas). It allows us to quantify and visualize the thematic evolution of a given research field. To do this, co- word analysis is used in a longitudinal framework in order to detect the different themes treated by the research field across the given time period. The performance analysis uses different bibliometric measures, including the h-index, with the purpose of measuring the impact of both the detected themes and thematic areas. The presented approach includes a visualization method for showing the thematic evolution of the studied field. Then, as an example, the thematic evolution of the Fuzzy Sets Theory field is analyzed using the two most important journals in the topic: Fuzzy Sets and Systems and IEEE Trans- actions on Fuzzy Systems. © 2010 Elsevier Ltd. All rights reserved. 1. Introduction Bibliometrics is usually used for the quantitative research assessment of academic output, and it is starting to be used for practice based research (for more information see Callon, Courtial, & Laville, 1991; Coulter, Monarch, & Konda, 1998; Henderson, Shurville, & Fernstrom, 2009; Ramos-Rodrguez & Ruz-Navarro, 2004; van Raan, 2005a). Concretely, bibliometrics is a set of methods used to study or measure texts and information, especially in big datasets. Many research fields use bibliometric methods to explore the impact of their field, the impact of a set of researchers, or the impact of a particular paper (Henderson et al., 2009; van Raan, 2005a). In bibliometrics, there are two main procedures: performance analysis and science mapping (Noyons, Moed, & Luwel, 1999; van Raan, 2005a). Performance analysis aims at evaluating groups of scientific actors (countries, universities, depart- ments, researchers) and the impact of their activity (Noyons, Moed, & van Raan, 1999; van Raan, 2005a) on the basis of bibliographic data. Science mapping aims at displaying the structural and dynamic aspects of scientific research (Börner, Chen, & Boyack, 2003; Noyons, Moed, & Luwel, 1999). A science map is used to represent the cognitive structure of a research field. Various types of techniques have been developed to build a science map (Small, 2006), the most commonly used being documents co-citation (Small, 1973) and co-word analysis (Callon, Courtial, Turner, & Bauin, 1983). Moreover, different ∗ Corresponding author. E-mail addresses: [email protected] (M.J. Cobo), [email protected] (A.G. López-Herrera), [email protected] (E. Herrera-Viedma), [email protected] (F. Herrera). 1751-1577/$ – see front matter © 2010 Elsevier Ltd. All rights reserved. doi:10.1016/j.joi.2010.10.002
Transcript of An approach for detecting, quantifying, and visualizing...

Journal of Informetrics 5 (2011) 146–166
Contents lists available at ScienceDirect
Journal of Informetrics
journa l homepage: www.e lsev ier .com/ locate / jo i
An approach for detecting, quantifying, and visualizing the evolution ofa research field: A practical application to the Fuzzy Sets Theory field
M.J. Cobo ∗, A.G. López-Herrera, E. Herrera-Viedma, F. HerreraDept. Computer Science and Artificial Intelligence, CITIC-UGR (Research Center on Information and Communications Technology), University of Granada,E-18071-Granada, Spain
a r t i c l e i n f o
Article history:Received 26 April 2010Received in revised form 3 October 2010Accepted 6 October 2010
Keywords:Science mappingCo-word analysisBibliometric studiesFuzzy Sets TheoryThematic evolutionh-Index
a b s t r a c t
This paper presents an approach to analyze the thematic evolution of a given researchfield. This approach combines performance analysis and science mapping for detecting andvisualizing conceptual subdomains (particular themes or general thematic areas). It allowsus to quantify and visualize the thematic evolution of a given research field. To do this, co-word analysis is used in a longitudinal framework in order to detect the different themestreated by the research field across the given time period. The performance analysis usesdifferent bibliometric measures, including the h-index, with the purpose of measuring theimpact of both the detected themes and thematic areas. The presented approach includesa visualization method for showing the thematic evolution of the studied field.
Then, as an example, the thematic evolution of the Fuzzy Sets Theory field is analyzedusing the two most important journals in the topic: Fuzzy Sets and Systems and IEEE Trans-actions on Fuzzy Systems.
© 2010 Elsevier Ltd. All rights reserved.
1. Introduction
Bibliometrics is usually used for the quantitative research assessment of academic output, and it is starting to be usedfor practice based research (for more information see Callon, Courtial, & Laville, 1991; Coulter, Monarch, & Konda, 1998;Henderson, Shurville, & Fernstrom, 2009; Ramos-Rodrguez & Ruz-Navarro, 2004; van Raan, 2005a). Concretely, bibliometricsis a set of methods used to study or measure texts and information, especially in big datasets. Many research fields usebibliometric methods to explore the impact of their field, the impact of a set of researchers, or the impact of a particularpaper (Henderson et al., 2009; van Raan, 2005a).
In bibliometrics, there are two main procedures: performance analysis and science mapping (Noyons, Moed, & Luwel,1999; van Raan, 2005a). Performance analysis aims at evaluating groups of scientific actors (countries, universities, depart-ments, researchers) and the impact of their activity (Noyons, Moed, & van Raan, 1999; van Raan, 2005a) on the basis ofbibliographic data. Science mapping aims at displaying the structural and dynamic aspects of scientific research (Börner,Chen, & Boyack, 2003; Noyons, Moed, & Luwel, 1999). A science map is used to represent the cognitive structure of a researchfield.
Various types of techniques have been developed to build a science map (Small, 2006), the most commonly used beingdocuments co-citation (Small, 1973) and co-word analysis (Callon, Courtial, Turner, & Bauin, 1983). Moreover, different
∗ Corresponding author.E-mail addresses: [email protected] (M.J. Cobo), [email protected] (A.G. López-Herrera), [email protected] (E. Herrera-Viedma),
[email protected] (F. Herrera).
1751-1577/$ – see front matter © 2010 Elsevier Ltd. All rights reserved.doi:10.1016/j.joi.2010.10.002
M.J. Cobo et al. / Journal of Informetrics 5 (2011) 146–166 147
methods have been proposed to address the problem of delimiting a research field, and quantifying and visualizing thedetected subfields by means of co-word or co-citation analysis (Börner et al., 2003; Callon et al., 1991; Chen, Ibekwe-SanJuan,& Hou, 2010; Coulter et al., 1998; Courtial & Michelet, 1994; Courtial, 1990; Kandylas, Upham, & Ungar, 2010; Leydesdorff& Rafols, 2009; Rip & Courtial, 1984; Small & Upham, 2009; Small, 1977, 2006; Upham & Small, 2010). The majority of thesemethods are mainly focused on measuring the performance of the scientific actors and little research has been carried out inorder to measure the performance of given research fields in a conceptual way (specific themes or whole thematic areas). Aperformance analysis of specific themes or whole thematic areas can measure (quantitatively and qualitatively) the relativecontribution of these themes and thematic areas to the whole research field, detecting the most prominent, productive, andhighest-impact subfields.
The main aim of this paper is to present a general approach to analyze the thematic evolution of a given research field.This approach combines performance analysis and science mapping for detecting and visualizing conceptual subdomains(particular themes or general thematic areas). It also allows us to quantify and visualize the thematic evolution of theresearch field. To do this, co-word analysis is used in a longitudinal framework (Garfield, 1994). For a better interpretationof the results, strategic diagrams are used in order to categorize the detected themes. Furthermore, thematic areas are usedto show conceptual evolution, proposing a visualization approach for graphically showing the thematic evolution of thestudied field. Additionally, we develop a performance analysis using different basic bibliometric indicators (the number ofpublished documents, the number of received citations, etc.,) and the h-index (Alonso, Cabrerizo, Herrera-Viedma, & Herrera,2009; Cabrerizo, Alonso, Herrera-Viedma, & Herrera, 2010; Hirsch, 2005). As an example, the proposed approach is appliedto analyze the thematic evolution of the Fuzzy Sets Theory (FST)1 research field (Zadeh, 1965, 2008) by only considering thedocuments published in the two most important journals on the topic: Fuzzy Sets and Systems and IEEE Transactions on FuzzySystems.
This paper is organized as follows. Section 2 gives a brief overview of the science mapping and longitudinal studies. Section3 introduces the approach to analyze the evolution of a research field. Section 4 uses the approach in order to analyze theFST research field. Finally, some conclusions are drawn in Section 5.
2. Science mapping and longitudinal studies
Science mapping or bibliometric mapping is a spatial representation of how disciplines, fields, specialities, and individualpapers or authors are related to one another (Small, 1999). It is focused on monitoring a scientific field and delimitingresearch areas to determine its cognitive structure and its evolution (Noyons, Moed, & van Raan, 1999).
Various types of techniques have been developed to build a science map (Small, 2006), the most commonly used beingdocuments co-citation and co-word analysis.
Co-citation analysis was proposed by Small (1973). This tool maps the structure of a research field through pairs ofdocuments that are commonly cited together (Coulter et al., 1998). Co-citation has been used in the literature to delimitresearch areas (Small, 2006), discover knowledge communities (Kandylas et al., 2010), research fronts (Upham & Small, 2010)and invisible colleges (Noma, 1984), and also to study different research fields such as the absorptive capacity field (Calero-Medina & Noyons, 2008), the organic thin film transistors (Small & Upham, 2009), to analyze the Strategic ManagementJournal (Ramos-Rodrguez & Ruz-Navarro, 2004) or to study the marrow of science (Moya-Anegón et al., 2007), among otherapplications.
Co-word analysis was proposed by Callon et al. (1983) as a content analysis technique that is effective in mapping thestrength of association between information items in textual data. It deals directly with sets of terms shared by documents,mapping the pertinent literature directly from the interactions of key terms. Co-word analysis has been used to analyze theinteractions between basic and technological research (Callon et al., 1991), study the software engineering field (Coulteret al., 1998), the information research field (Ding, Chowdhury, & Foo, 2001), the scientific area of physical chemistry ofsurfactants (Bailón-Moreno, Jurado-Alameda, & Ruz-Banos, 2006), the Spanish FST field (López-Herrera et al., 2009), tostudy the hybridization of the FST field with other computational intelligence techniques (and fields) (López-Herrera, Cobo,Herrera-Viedma, & Herrera, 2010), among others applications.
At the end of the co-word or co-citation analysis, a set of clusters is returned which can be understood as conglomeratesof different scientific aspects. In the case of co-citation analysis, the clusters represent groups of references that can beunderstood as the intellectual base of the different subfields. On the other hand, in the case of co-word analysis, the clustersrepresent groups of textual information that can be understood as semantic or conceptual groups of different topics treatedby the research field. So, the detected clusters can be used with several purposes such as:
• To analyze their evolution through measuring continuance across consecutive subperiods.• To quantify the research field by means of a performance analysis.
In some studies, co-citation and co-word analysis are used in a longitudinal framework (Garfield, 1994) in order to analyzeand track the evolution of a research field along consecutive time periods. One of the first longitudinal studies was that carried
1 The Fuzzy Sets Theory field was founded by Zadeh in 1965 (for more information see Zadeh, 1965, 2008).

148 M.J. Cobo et al. / Journal of Informetrics 5 (2011) 146–166
out by Price and Gürsey (1975), in which the transience, continuance and discontinuity of the authors of academic documentswere analyzed. There are different degrees of continuance that can be measured with various similarity measures. In thissense, the Stability Index (Braam, Moed, & van Raan, 1991; Small, 1977) has been used to measure continuance amongclusters. The stability of individual items in two consecutive periods can also be measured through the Stability Index.
Although the co-citation and the co-word techniques are able to analyze the evolution of a research field by meansof a longitudinal study, each one allows us to study a different evolution (Braam et al., 1991; van Raan, 2005a): while alongitudinal study based on co-word allows us to analyze the evolution of research topics, a longitudinal study based onco-citation allows us to analyze the continuity in the intellectual base.
A next step (Noyons, Moed, & Luwel, 1999; van Raan, 2005a) in bibliometrics is the integration of mapping and perfor-mance assessment in order to quantify a research field, its detected subfields (clusters) and its evolution. The performanceanalysis allows us to measure the importance of the research field and detected subfields, and to quantify the importanceof different scientific actors (van Raan, 2005a, 2005b). Indeed, performance analysis allows us to track, predict and buildpredictive models of the growth and shrinking of a research field and its detected subfields (Kandylas et al., 2010; Small,2003, 2006; Upham & Small, 2010).
Finally, we should point out that several visualization techniques have been proposed in the literature in order to providea way of exploring and suggesting the interpretation of the results (Börner et al., 2003; Small, 2006):
• Cluster string (Small, 2006; Small & Upham, 2009; Upham & Small, 2010), rolling clustering (Kandylas et al., 2010) andalluvial diagrams (Rosvall & Bergstrom, 2010) have been used to show the evolution of detected clusters in successive timeperiods. Other authors proposed to layout the graph of a given time period taking into account previous and subsequentones (Leydesdorff & Schank, 2008), or to pack synthesized temporal changes into a single graph (Chen, 2004; Chen et al.,2010).
• Strategic diagrams (Callon et al., 1991), self-organizing maps (Polanco, Francois, & Lamirel, 2001), heliocentric maps (Moya-Anegón et al., 2005), geometrical models (Skupin, 2009) and thematic networks (Bailón-Moreno, Jurado-Alameda, Ruiz-Banos, & Courtial, 2005; López-Herrera et al., 2009) have been proposed to show and layout the research field and itsdetected subfields.
3. An approach for analyzing a research field
In this section a general approach to carry out a complete analysis of the evolution of a specific research field is shown.The construction of maps from bibliometric information (Garfield, 1994) is a technique used to show the different themes
or topics treated by a scientific field in a given time. Different bibliometric information can be used in order to build abibliometric map. Depending on the information used, different aspects of the research field can be studied. Co-word analysisand co-citation analysis are tools widely used to do this.
Whereas co-citation is used to analyze the structure of a scientific research field, co-word analysis is used to analyzethe conceptual structure. That is, co-word analysis allows us to discover the main concepts treated by the field and it is apowerful technique for discovering and describing the interactions between different fields in scientific research. Althoughboth techniques are useful for mapping science, the aim of our approach is to discover the conceptual evolution of a researchfield, and, therefore, co-word analysis is more suitable.
Formally, the methodological foundation of co-word analysis is the idea that the co-occurrence of key terms describesthe content of the documents in a file (Callon et al., 1991). According to Krsul (1998) “this technique illustrates associationsbetween key words by constructing multiple networks that highlight associations between keywords, and where associationsbetween networks are possible” (p. 80). In this paper, these networks are associated to themes.
Each publication in the field can in turn be characterized by a sub-list of key terms which are like DNA fingerprints of thesepublished articles (Börner et al., 2003). According to Börner et al. (2003) “by matching keyword-based fingerprints, one canmeasure the similarity between a pair of publications. The more keywords two documents have in common, the more similar thetwo publications are, and the more likely they come from the same research field or research speciality at a higher level. Followingthe DNA metaphor, if two publications fingerprints’ are similar enough, they are bound to come from the same species” (p. 185).
With a list of the important keywords of the research field a graph can be built, where the keywords are the nodes, andthe edges between them represent their relationships. Two nodes (keywords) are connected if they are presented in thesame documents. We can add to each edge a weight representing how important the associated relationship in the wholecorpus is (i.e., the set of documents belonging to the research field under study.)
As result of the co-word analysis, a set of detected themes is obtained for each subperiod studied. In order to representthe results in a visual way, different visualization techniques can be used. In the proposed approach the results are visualizedby means of strategic diagrams and the conceptual evolution is shown through thematic areas.
To sum up, the stages carried out by our approach are:
1. To detect the themes treated by the research field by means of co-word analysis for each studied subperiod.2. To layout in a low dimensional space the results of the first step (themes).

M.J. Cobo et al. / Journal of Informetrics 5 (2011) 146–166 149
3. To analyze the evolution of the detected themes through the different subperiods studied, in order to detect the maingeneral thematic areas of the research field, their origins and their inter-relationships.
4. To carry out a performance analysis of the different periods, themes and thematic areas, by means of quantitative andimpact measures.
The following subsections describe each stage in more detail.
3.1. The process of detecting themes
The process of delimiting a research field (in both structural and conceptual ways) is usually split into several consecutivesteps (Börner et al., 2003; Callon et al., 1991; Chen et al., 2010; Coulter et al., 1998; Courtial & Michelet, 1994; Courtial, 1990;Kandylas et al., 2010; Leydesdorff & Rafols, 2009; Rip & Courtial, 1984; Small & Upham, 2009; Small, 1977, 2006; Upham &Small, 2010). In our proposal, the process is divided into five steps: (1) collection of raw data, (2) selection of the type of itemto analyze, (3) extraction of relevant information from the raw data, (4) calculation of similarities between items based onthe extracted information and (5) use of a clustering algorithm to detect the themes. In what follows we discuss the way inwhich these steps are implemented:
The first step is to collect the raw data. So, for example, to analyze a scientific research field, the raw data is collected forall the published documents on the topic. In order to collect these published documents, bibliographic sources such as the ISIWeb of Science2 (ISIWoS), Scopus,3 Google Scholar,4 among others, must be used. To do this, a query including descriptivekeywords in the topic must be built in order to collect as many documents as possible from the research field under study.Once the raw data has been collected, this can be divided into different partitions in order to analyze the evolution of theresearch field through the years. The different partitions are built selecting consecutive groups of years.
The second step consists of the selection of the type of item to analyze. As is pointed out in Börner et al. (2003), journals,papers, authors, and descriptive terms or words are most commonly selected as the type of item to analyze. In our casewe use the keywords (authors keywords, journals keywords, indexing keywords such as ISIWoS’ keywords Plus, or anycombination of them) presented in the selected documents.
The third step in the process is the extraction of relevant information from the raw data collected in the first step. Inthis proposed approach, the relevant information consists of the co-occurrence frequencies of keywords. The co-occurrencefrequency of two keywords is extracted from the corpus of documents by counting the number of documents in which thetwo keywords appear together.
The fourth step is based on the calculation of similarities between items based on the information extracted in thethird step. Similarities between items are calculated based on frequencies of keywords’ co-occurrences. Different similaritymeasures have been used in the literature, the most popular being Salton’s Cosine and the Jaccard index. In van Eck andWaltman (2009) an analysis of well-known direct similarity measures was made, concluding that the most appropriatemeasure for normalizing co-occurrence frequencies is the equivalence index (Callon et al., 1991; Michelet, 1988). This measureis also known as association strength (Coulter et al., 1998; van Eck & Waltman, 2007), proximity index (Peters & van Raan,1993; Rip & Courtial, 1984), or probabilistic affinity index (Zitt, Bassecoulard, & Okubo, 2000). The equivalence index, eij isdefined as: eij = c2
ij/cicj , where cij is the number of documents in which two keywords i and j co-occur and ci and cj represent
the number of documents in which each one appears. When the keywords always appear together, the equivalence indexequals unity; when they are never associated, it equals zero.
The fifth step is based on a process of clustering to locate subgroups of keywords that are strongly linked to eachother and which correspond to centers of interest or to research problems that are the object of significant investmentby researchers (Callon et al., 1991). Different clustering algorithms can be used to create a partition of the keywordsnetwork or graph. Recently, some authors have prosed different clustering algorithms to carry out this task: Streemer(Kandylas et al., 2010), spectral clustering (Chen et al., 2010), modularity maximization (Chen & Redner, 2010) and a boot-strap resampling with a significance clustering (Rosvall & Bergstrom, 2010). The proposed approach allows us to use anyclustering algorithm that performs with a similarity matrix and returns labelled groups. If the cluster algorithm doesnot give a label for each cluster, an automatic or manual post-process is required. As an example, we propose the useof the simple centers algorithm (Coulter et al., 1998). The simple centers algorithm is a simple and well-known algo-rithm in the context of co-word analysis, that has been used in many co-word studies (Bailón-Moreno et al., 2005, 2006;Coulter et al., 1998; Courtial, 1990; Courtial & Michelet, 1994; López-Herrera et al., 2009, 2010; He, 1999). Further-more, the simple centers algorithm automatically returns labelled clusters, so a post-process to label the clusters is notneeded.
As is described in Coulter et al. (1998), the simple centers algorithm uses two passes through the data to produce thedesired networks. The first pass (Pass-1) constructs the networks depicting the strongest associations, and links added in thispass are called internal links. The second pass (Pass-2) adds to these networks links of weaker strengths that form associations
2 An author is associated with the theme if he/she has published some document related to the theme.3 Other measures could be used such as citations.4 In order to get more information about this bibliometric index, visit the web site http://sci2s.ugr.es/hindex/.

150 M.J. Cobo et al. / Journal of Informetrics 5 (2011) 146–166
between networks. The links added during the second pass are called external links. The pseudo-code of the simple centersalgorithm contains the following steps (Coulter et al., 1998):
1. Select a minimum for the number of co-occurrences, cij , for keywords i and j, select maxima for the number of
Pass-1 links, and select maxima for the total (Pass-1 and Pass-2) links;
2. Start Pass-1;
3. Generate the highest eij value from all possible keywords to begin a Pass-1 network;
4. From that link, form other links in a breadth-first manner until no more links are possible due to the
co-occurrence minima or to Pass-1 link or node maxima. Remove all incorporated keywords from the list of
subsequent available Pass-1 keywords;
5. Repeat steps 3 and 4 until all Pass-1 networks are formed; i.e., until no two remaining keyword pairs
co-occur frequently enough to begin a network;
6. Start Pass-2;
7. Restore all Pass-1 keywords to the list of available keywords;
8. Start with the first Pass-1 network;
9. Generate all links to Pass-1 nodes in the current network to any Pass-1 nodes having at least the minimal
co-occurrences in descending order of eij value; stop when no remaining keyword pairs meet the co-occurrence
minima, or when the total link maxima is met. Do not remove any keyword from the available list;
10. Select the next succeeding Pass-1 network, and repeat step 9.
As was noted in (Coulter et al., 1998), two keywords that appear infrequently in the corpus but always appear togetherwill have larger strength values than keywords that appear many times in the corpus almost always together. Hence,possibly irrelevant or weak associations may dominate the network. The simple centers algorithm solves this problem byusing different parameters: minimum frequency and co-occurrence thresholds. Only the keyword pairs that exceed thesethresholds are considered potential links while building networks during the first pass of the algorithm. On the other hand,the algorithm has two parameters to limit the size of the detected themes: the minimum and maximum size of the networks.
Although the simple centers algorithm has only four parameters, the detected themes are highly dependent on them. Forthis reason a process for tuning the parameters is needed. A group of experts in the research field under study is useful inorder to carry out a feedback process to estimate the best parameter configuration that allows us to detect the main themesof the field.
Two measures can represent the detected networks: Callon’s centrality, and Callon’s density.Callon’s centrality, to be referred to as centrality henceforth, measures the degree of interaction of a network with other
networks (Callon et al., 1991) and it can be defined as: c = 10 ×∑ekh, with k a keyword belonging to the theme and h a
keyword belonging to other themes. Centrality measures the strength of external ties to other themes. We can understandthis value as a measure of the importance of a theme in the development of the entire research field analyzed.
Callon’s density, to be referred to as density henceforth, measures the internal strength of the network (Callon et al., 1991)and it can be defined as: d = 100(
∑eij/w), with i and j keywords belonging to the theme and w the number of keywords
in the theme. Density measures the strength of internal ties among all keywords describing the research theme. This valuecan be understood as a measure of the theme’s development.
3.2. Visualizing themes and thematic networks
When co-word analysis is used for mapping science, clusters of keywords (and their interconnections) are obtained.These clusters are considered as themes.
Each research theme obtained in this process is characterized by two parameters (“density” and “centrality”). Both medianand mean values for density and centrality can be used in classifying themes into four groups (Cahlik, 2000; Callon et al.,1991; Courtial & Michelet, 1994; Coulter et al., 1998; He, 1999). So a research field can be understood to be a set of researchthemes, mapped in a two-dimensional space.
A Strategic Diagram is a two-dimensional space built by plotting themes according to their centrality and density rankvalues (if we use median for classifying clusters) or values (if we use mean) along two axis, x-axis centrality, y-axis density.Strategic diagrams with rank values are used more commonly than ones with values, because of their legibility (Cahlik,2000). As an example, in Fig. 1a a strategic diagram is presented.
We can find four kinds of themes (Cahlik, 2000; Callon et al., 1991; Courtial & Michelet, 1994; Coulter et al., 1998; He,1999) according to the quadrant in which they are placed:
• Themes in the upper-right quadrant are both well developed and important for the structuring of a research field. They areknown as the motor-themes of the specialty, given that they present strong centrality and high density. The placement ofthemes in this quadrant implies that they are related externally to concepts applicable to other themes that are conceptuallyclosely related.
• Themes in the upper-left quadrant have well developed internal ties but unimportant external ties and so are of onlymarginal importance for the field. These themes are very specialized and peripheral in character.
• Themes in the lower-left quadrant are both weakly developed and marginal. The themes of this quadrant have low densityand low centrality, mainly representing either emerging or disappearing themes.

M.J. Cobo et al. / Journal of Informetrics 5 (2011) 146–166 151
Fig. 1. The strategic diagram and thematic network.
• Themes in the lower-right quadrant are important for a research field but are not developed. So, this quadrant groupstransversal and general, basic themes.
In a theme, the keywords and their interconnections draw a network graph, called a thematic network. Each thematicnetwork is labelled using the name of the most significant keyword in the associated theme (usually identified by themost central keyword of the theme). An example of a thematic network is drawn in Fig. 1b. Here, several keywords areinterconnected, where the volume of the spheres is proportional to the number of documents corresponding to each keyword,the thickness of the link between two spheres i and j is proportional to the equivalence index eij.
Together with the whole network of interconnected themes and keywords a second network is built, based on thedocuments linked to each thematic network. In this second network, documents with keywords associated with any detectedthematic network are linked to it. So, two kinds of documents can be considered: core documents and secondary documents.Given a thematic network, a document is called a “core document” if it has at least two keywords presented in the thematicnetwork. If a document has only one keyword associated with the thematic network, it is called a “secondary document”.Both core and secundary documents can belong to more than one thematic network.
Furthermore, the strategic diagrams can be enriched by adding a third dimension in order to show more information. So,for example, the themes can be represented as a sphere, its volume being proportional to different quantitative (or qualitative)data, for example: (i) the number of documents associated with the theme (core documents + secondary documents); (ii)the number of citations received of the documents associated with the theme; (iii) the number of authors5 researching inthe field of the theme.
3.3. Thematic areas: the evolution of themes
This subsection describes what the thematic areas are and how to detect and visualize them.If the raw data is divided into different consecutive groups of years (i.e., subperiods), the evolution of the research field
under study can be analyzed.Let Tt be the set of detected themes of the subperiod t, with U ∈ Tt representing each detected theme in the subperiod
t. Let V ∈ Tt+1 be each detected theme in the next subperiod t + 1. It is said that there is a thematic evolution from theme Uto theme V iff there are keywords presented in both associated thematic networks. So, V can be considered to be a themeevolved from U. Keywords k ∈ U ∩ V are considered to be a “thematic nexus” or “conceptual nexus”. Evolution bibliometricmaps can be built by linking themes in Tt with themes in Tt+1 through the “conceptual nexus”.
Thematic areas can be considered as a bipartite graph. A bipartite graph is a graph whose vertices can be divided intotwo disjoint sets U and V, and the edges can only connect elements from the set U to elements of the set V.
There will be an edge from themes in the subperiod t to themes in the subperiod t + 1 if there is a “thematic nexus” amongthem. In others word, if they have some elements in common.
The importance of a “thematic nexus” can be weighed by the elements that the two themes have in common. In ourapproach, the Inclusion Index is used to carry out this task:
Inclusion Index = #(U ∩ V)min(#U, #V)
.
5 The use of core and secondary documents implies that a document can belong to different themes, i.e., the sets of documents belonging to two themesare not disjoint.

152 M.J. Cobo et al. / Journal of Informetrics 5 (2011) 146–166
Fig. 2. Examples of evolution.
Although the weight of a thematic nexus can be measured with other similarity measures (e.g., the Jaccard index orSalton’s cosine), the inclusion index has the advantage of being more useful to measure similar sets, in comparison to theJaccard or cosine index, since it is not biased by the number of items as the latter are (Sternitzke & Bergmann, 2009). Theinclusion index has also been used as an overlap measure in the field of information retrieval (van Eck & Waltman, 2009).Furthermore, the inclusion index will be equal to 1 if the keywords of the theme V are fully contained in the theme U. Forthese reasons and due to the fact that the weight of the thematic nexus is a good measure of the overlapping betweenthemes, the inclusion index has been chosen.
So, a thematic area is defined as a group of evolved themes across different subperiods. Note that, depending on theinterconnections among them, one theme could belong to a different thematic area, or could not come from any.
For example, suppose that we have two different subperiods (period 1 and period 2) under study, with three detectedthemes in the first one and four in the second (together with their associated thematic networks). In Fig. 2a an exampleof a thematic evolution bibliometric map is shown. The solid lines (lines 1 and 2) mean that the linked themes share thesame name: both themes are labelled with the same keywords, or the label of one theme is part of the other theme (nameof theme ∈ {thematic nexuses}). A dotted line (line 3) means that the themes share elements that are not the name of thethemes (name of theme /∈ {thematic nexuses}). The thickness of the edges is proportional to the inclusion index, and thevolume of the spheres is proportional to the number of published documents associated with each theme.6 The vertical linesseparate the different subperiods.
In Fig. 2a we can observe two different thematic areas delimited by different color-shadows, one composed of themesTheme A1 and Theme A2, and the other composed of themes Theme B1, Theme B2 and Theme C2. Theme D1 is discontinued, andTheme D2 is considered to be a new theme.
As the themes have an associated set of documents (core documents, or secondary documents, or core docu-ments + secondary documents), the thematic areas could also have an associated collection of documents. In this case, thedocuments associated with each thematic area will be ascertained through the union of the documents associated with theset of themes belonging to each thematic area.
General overlapping between two consecutive subperiods can be measured through the Stability Index (Small, 1977)whose equation is similar to the Jaccard Index (itemsij/itemsi + itemsj − itemsij) for the case of two consecutive subperiods(Braam et al., 1991). General overlapping measures the number of shared keywords between successive subperiods. To show,in a graphical way, the “stability” across the different subperiods, a picture similar to that presented in Price and Gürsey(1975) is used.
Following the previous example, in Fig. 2b, the stability measures across the two consecutive periods is shown. Thecircles represent the periods and their number of associated keywords. The horizontal arrow represents the number ofkeywords shared by both periods and, in parentheses, the Similarity Index between them is shown. The upper-incomingarrow represents the number of new keywords in period 2, and the upper-outcoming arrow represents the keywords thatare present in period 1 but not in period 2.
3.4. Performance analysis
In the previous subsections, the processes of detecting themes and thematic areas were described. The analysis can befurther enriched by carrying out a performance analysis with different measures. These measures are divided into two
6 Other measures could be used such as citations.

M.J. Cobo et al. / Journal of Informetrics 5 (2011) 146–166 153
categories: quantitative and qualitative ones. By means of quantitative measures the productivity of the detected themesand thematic areas is analyzed, whereas qualitative measures show the (supposed) quality based on the bibliometric impactof those themes and thematic areas.
• Quantitative measures: number of documents, authors, journals and countries.• Qualitative or impact measures: number of received citations of the documents and bibliometric indices such as the
h-index7 (Alonso et al., 2009; Cabrerizo et al., 2010; Hirsch, 2005).
We should point out that both measures can be applied to different levels to help us to analyze the topics, themes,thematic areas, and different subperiods.
4. The research field of fuzzy sets theory
In this section the general approach described above is applied to analyze the research field of Fuzzy Sets Theory (FST)(Zadeh, 1965, 2008) using the publications that have appeared in the most important and prestigious journals of the topic:Fuzzy Sets and Systems and IEEE Transactions on Fuzzy Systems. The first one is the official publication of the InternationalFuzzy Systems Association (IFSA) and the second one is a publication of the IEEE Computational Intelligence Society for fuzzysystems. In comparison with other journals on FST, these present the highest IF, the highest number of publications and theyare the oldest ones (see Table 1).
The journal FSS is the oldest (it started in 1978) and the ISIWoS includes their publications from the year 1980. IEEE-TFSstarted in 1993, and ISIWoS includes their publications from 1994.
We fix our study from 1978 to 2009. In Fig. 3 the distribution of documents (Article, Letter, Proceeding Paper and Review)per year is shown, where FSS contains 5724 documents and IEEE-TFS 1169 documents.
We retrieve the necessary data from the ISIWoS for the years included in it. For the remaining years the data are retrievedfrom Scopus (for the year 1993 of the journal IEEE-TFS), and from Science Direct8 (for the years 1978 and 1979 of the journalFSS).
In this study the citations of the documents are also used; for this reason, the citations received will be considered upto January 15th 2010, the date when the data were downloaded. The citations that we take into account proceed from theISIWoS.
The data are divided into five consecutive subperiods: 1978–1989, 1990–1994, 1995–1999, 2000–2004 and 2005–2009.In Fig. 4 the distributions of the published documents per period are shown.
In order to avoid the smooth of the data, the best option would be to choose periods spanning only one year. In the caseof the FST research field, in a span of one year there are not enough data for a good performance of co-word analysis. For thisreason, the years are grouped in subperiods of time. Additionally, although it is common to use periods of the same timespan, we have fixed a first subperiod of twelve years (1978–1989). In this way, we provide a good input to the co-wordsanalysis in order to detect the main themes. At the beginning of the FST field, we find few researchers and publications, andwe observe that the fuzzy community tends to use an extremely low number of keywords in the publications (the averagenumber of keywords per document was 1, indeed, there are 117 documents with less than two keywords). The first twelveyears give us a good number of documents to be processed. We observe that in the next studied subperiod the FST researchfield begins to consolidate as a discipline. The time span of five years for the remaining subperiods is appropriate to providea good input.
The co-word analysis is done with the software CoPalRed (CoPalRed, 2005; López-Herrera et al., 2009). CoPalRed is basedon the simple center algorithm to detect the themes through different subperiods of years. The plotting of the themes inthe strategic diagram, the drawing of the thematic networks and the detecting of thematic areas were made with specificad hoc software.
As we said at the second step in Section 3.1, the keywords of the documents are used. Due to the data have beendownloaded from the ISIWoS, the author keywords and the Keywords Plus of the documents are jointly used. A normalizationprocess is carried out prior to this over the keywords, where the plural and singular forms of the keywords are joined. Theacronyms are also joined with the respective keywords.
In order to measure the performance and quality of the detected themes and thematic areas, a quantitative and impactanalysis is presented in each subperiod. To study the quantitative performance, the number of associated documents belong-ing to each theme and thematic area are analyzed. To study the quality and impact, the citations and h-index of each detectedtheme and thematic area are used.
In what follows we develop the visualizing of themes and thematic networks, the evolution of themes and the performanceanalysis.
7 In order to get more information about this bibliometric index, visit the web site http://sci2s.ugr.es/hindex/.8 http://www.sciencedirect.com/.

154 M.J. Cobo et al. / Journal of Informetrics 5 (2011) 146–166
Table 1Basic data on FST journals.
Journal IF 2008 IF 2007 IF 2006 Total documents Start year
IEEE TRANSACTIONS ON FUZZY SYSTEMS 3.624 2.137 1.803 1243 1993FUZZY SETS AND SYSTEMS 1.833 1.373 1.181 6309 1978INTERNATIONAL JOURNAL OF UNCERTAINTY
FUZZINESS AND KNOWLEDGE-BASED SYSTEMS1.000 0.376 0.406 756 1993
JOURNAL OF INTELLIGENT & FUZZY SYSTEMS 0.649 0.221 0.283 503 1993
Fig. 3. Documents published in the FST research field from 1978 to 2009.
764
1157
1680 17161576
0200400600800100012001400160018002000
1978-1989 1990-1994 1995-1999 2000-2004 2005-2009
Fig. 4. Published documents per subperiod.
Table 2Performance measures for the themes of the subperiod 1978–1989.
Theme name Number of documents Number of citations Average of citations h-Index
DECISION-MAKING 64 1131 17.67 14FUZZY-CONTROL 54 1648 30.52 18FUZZY-RELATIONAL-EQUATIONS 38 1229 32.34 19FUZZY-TOPOLOGY 36 382 10.61 13RELATIONS 21 1155 55.00 7FUZZY-MAPPING 19 407 21.42 11SUBGROUP 13 226 17.38 6
4.1. Visualization of themes of FST
In order to analyze the most highlighted themes of the FST field for each subperiod, two kinds of strategic diagrams arebuilt using the software CoPalRed (CoPalRed, 2005; López-Herrera et al., 2009): In the first one, the volume of the spheres isproportional to the number of published documents (core documents + secondary documents)9 associated with each theme;and in the second one, the volume of spheres is proportional to the number of citations received for each theme.
In what follows we show the strategic diagrams of each subperiod and some tables containing some quantitative andimpact measures to analyze each subperiod.
In the subperiod 1979–1989, the longest one, a total of 764 documents of the journal FSS are considered.According to these strategic diagrams (Fig. 5) and quantitative measures (Table 2) we can observe that (i) the motor-
themes, SUBGROUP and FUZZY-MAPPING received a few citations and did not have much impact (low h-index scores) later;
9 The use of core and secondary documents implies that a document can belong to different themes, i.e., the sets of documents belonging to two themesare not disjoint.

M.J. Cobo et al. / Journal of Informetrics 5 (2011) 146–166 155
Fig. 5. Strategic diagrams for the subperiod 1978–1989.
Fig. 6. Strategic diagrams for the subperiod 1990–1994.
(ii) the basic and transversal themes, FUZZY-CONTROL and DECISION-MAKING, received many citations and had a great impactlater; (iii) a specific topic, FUZZY-RELATIONAL-EQUATIONS also had many citations and a great impact.
In this subperiod, we should point out that just 230 documents (about 30% of the documents published in those years)were associated with some theme. It is a consequence of the low number of keywords per document during this subperiodthat makes co-word analysis and the association of documents with the themes difficult.
In the subperiod 1990–1994 a total of 1157 documents were published in the FST research field. Those years coincidewith the starting point of the journal IEEE-TFS, so the documents of this subperiod belong to both journals.
According to Fig. 6 and Table 3 we can observe that (i) the motor-theme NEIGHBORHOOD-SPACES is not cited very oftenand presents the lowest impact; (ii) the basic themes FUZZY-CONTROL and NEURO-FUZZY-SYSTEMS are the most cited andthey present the highest impact; (iii) two specific themes FUZZY-NUMBERS and T-NORM presented high citation scores and
Table 3Performance measures for the themes of the subperiod 1990–1994.
Theme name Number of documents Number of citations Average of citations h-Index
NEURO-FUZZY-SYSTEMS 205 4135 20.17 34FUZZY-NUMBERS 194 3518 18.13 31FUZZY-CONTROL 172 6076 35.33 40FUZZY-RELATION 134 1407 10.50 21T-NORM 127 3158 24.87 30LEVEL-SUBGROUPS 83 583 7.02 12NEIGHBORHOOD-SPACES 65 453 6.97 8COMPACTNESS 65 604 9.29 11
156 M.J. Cobo et al. / Journal of Informetrics 5 (2011) 146–166
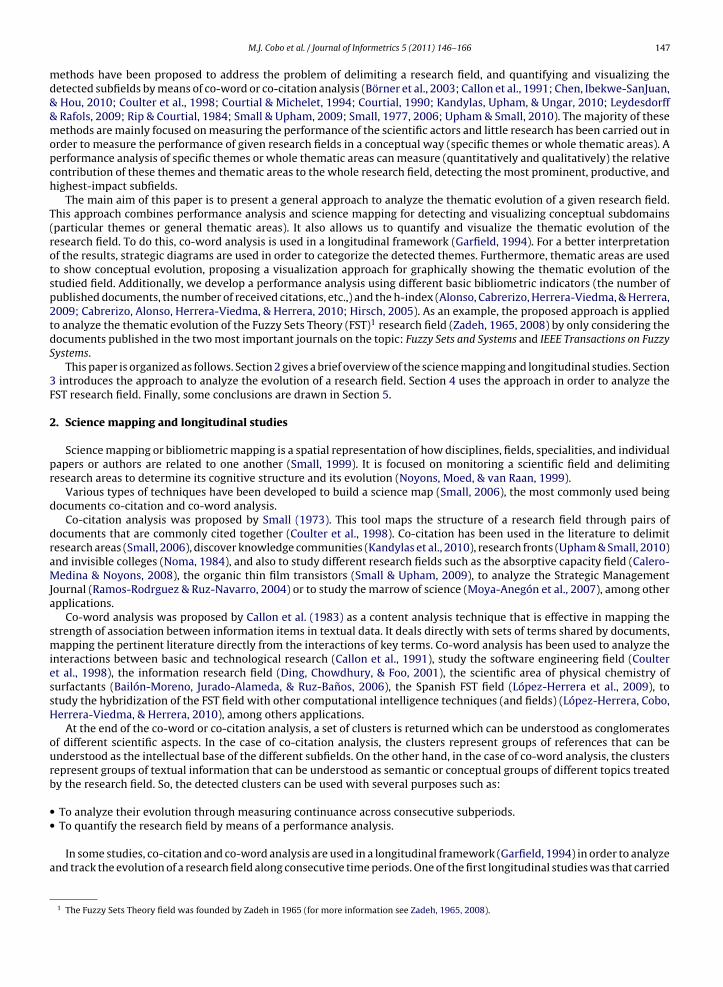
Fig. 7. Strategic diagrams for the subperiod 1995–1999.
impact. In this subperiod 67% of documents (774) are associated with some theme, which is due to the fact that in thissubperiod we find more keywords describing the content of the documents.
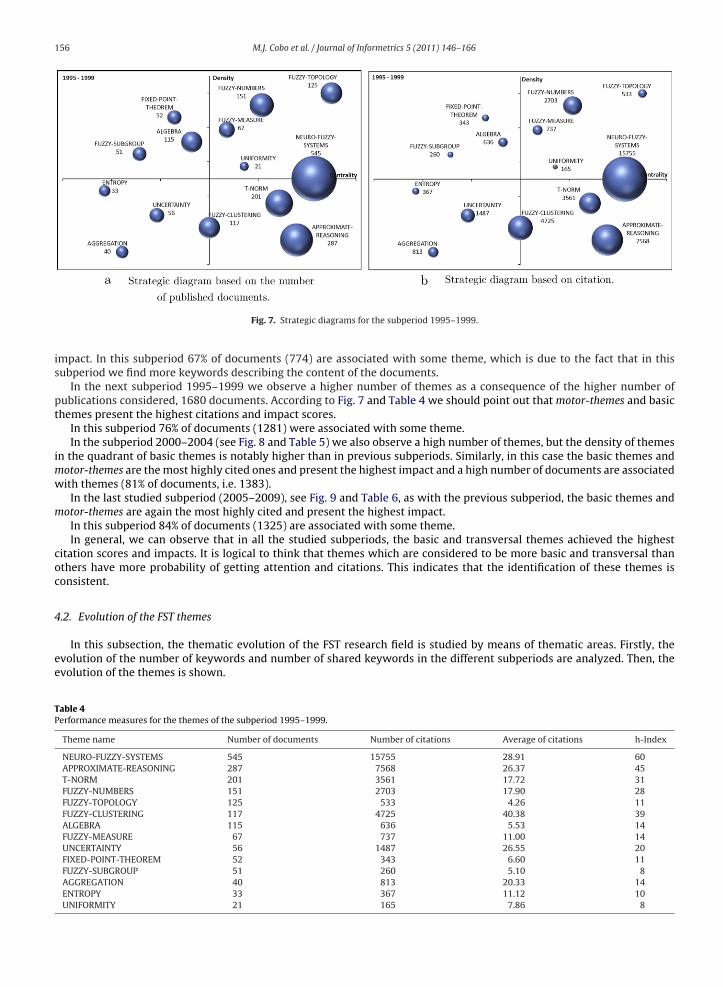
In the next subperiod 1995–1999 we observe a higher number of themes as a consequence of the higher number ofpublications considered, 1680 documents. According to Fig. 7 and Table 4 we should point out that motor-themes and basicthemes present the highest citations and impact scores.
In this subperiod 76% of documents (1281) were associated with some theme.In the subperiod 2000–2004 (see Fig. 8 and Table 5) we also observe a high number of themes, but the density of themes
in the quadrant of basic themes is notably higher than in previous subperiods. Similarly, in this case the basic themes andmotor-themes are the most highly cited ones and present the highest impact and a high number of documents are associatedwith themes (81% of documents, i.e. 1383).
In the last studied subperiod (2005–2009), see Fig. 9 and Table 6, as with the previous subperiod, the basic themes andmotor-themes are again the most highly cited and present the highest impact.
In this subperiod 84% of documents (1325) are associated with some theme.In general, we can observe that in all the studied subperiods, the basic and transversal themes achieved the highest
citation scores and impacts. It is logical to think that themes which are considered to be more basic and transversal thanothers have more probability of getting attention and citations. This indicates that the identification of these themes isconsistent.
4.2. Evolution of the FST themes
In this subsection, the thematic evolution of the FST research field is studied by means of thematic areas. Firstly, theevolution of the number of keywords and number of shared keywords in the different subperiods are analyzed. Then, theevolution of the themes is shown.
Table 4Performance measures for the themes of the subperiod 1995–1999.
Theme name Number of documents Number of citations Average of citations h-Index
NEURO-FUZZY-SYSTEMS 545 15755 28.91 60APPROXIMATE-REASONING 287 7568 26.37 45T-NORM 201 3561 17.72 31FUZZY-NUMBERS 151 2703 17.90 28FUZZY-TOPOLOGY 125 533 4.26 11FUZZY-CLUSTERING 117 4725 40.38 39ALGEBRA 115 636 5.53 14FUZZY-MEASURE 67 737 11.00 14UNCERTAINTY 56 1487 26.55 20FIXED-POINT-THEOREM 52 343 6.60 11FUZZY-SUBGROUP 51 260 5.10 8AGGREGATION 40 813 20.33 14ENTROPY 33 367 11.12 10UNIFORMITY 21 165 7.86 8

M.J. Cobo et al. / Journal of Informetrics 5 (2011) 146–166 157
Fig. 8. Strategic diagrams for the subperiod 2000–2004.
Table 5Performance measures for the themes of the subperiod 2000–2004.
Theme name Number of documents Number of citations Average of citations h-Index
FUZZY-RULE-BASED-SYSTEM 377 8259 21.91 43FUZZY-CONTROL 337 7736 22.96 46FUZZY-LOGIC 255 4204 16.49 31FUZZY-NUMBERS 243 3758 15.47 31FUZZY-MEASURE 157 2785 17.74 24LINEAR-MATRIX-INEQUALITY 132 4424 33.52 34FUZZY-TOPOLOGY 124 456 3.68 9T-NORM 124 1733 13.98 22FUZZY-RELATION 96 1068 11.13 18UNCERTAINTY 91 1235 13.57 20FUZZY-CLUSTERING 87 1792 20.60 23OWA-OPERATORS 55 1721 31.29 23LEAST-SQUARES 43 644 14.98 16FUZZY-MAPPING 36 195 5.42 9FUZZY-SUBGROUP 32 219 6.84 9INTERACTIVE-METHODS 27 938 34.74 12INTUITIONISTIC-FUZZY-SET 20 647 32.35 13NECESSITY-MEASURE 13 313 24.08 6L-FUZZY-TOPOLOGY 11 80 7.27 5
Fig. 9. Strategic diagrams for the subperiod 2005–2009.

158 M.J. Cobo et al. / Journal of Informetrics 5 (2011) 146–166
Table 6Performance measures for the themes of the subperiod 2004–2009.
Theme name Number of documents Number of citations Average of citations h-Index
FUZZY-CONTROL 346 2436 7.04 23FUZZY-LOGIC 267 1103 4.13 16CLASSIFICATION 242 1415 5.85 18UNCERTAINTY 239 1372 5.74 18H-INFINITY-CONTROL 221 1936 8.76 24FUZZY-NUMBERS 162 629 3.88 12T-NORM 152 547 3.60 11SYSTEM-IDENTIFICATION 136 744 5.47 14GROUP-DECISION-MAKING 124 630 5.08 13FUZZY-MEASURE 79 263 3.33 8FUZZY-RELATIONAL-EQUATIONS 64 339 5.30 9FUZZY-TOPOLOGY 62 185 2.98 6FUZZY-CLUSTERING 60 333 5.55 11FUZZY-REGRESSION 55 240 4.36 9FUZZY-ROUGH-SETS 43 394 9.16 10SIMILARITY-RELATIONS 35 148 4.23 8L-TOPOLOGY 31 62 2.00 4UNIVERSAL-APPROXIMATORS 28 137 4.89 7CAUCHY-PROBLEM 22 86 3.91 5PROBABILISTIC-METRIC-SPACE 21 46 2.19 4
In each subperiod the keywords are not the same, in a lexicographic sense or in number. That is, the FST terminologyevolves through the time period using different keywords to describe the content of the documents. New topics with theirassociated keywords appear and others disappear. On the other hand, there is a subset of keywords that have remainedunchanged during consecutive subperiods and a subset of keywords that has only been used in some subperiods. For example,the keywords fuzzy-control, fuzzy-topology and neuro-fuzzy-systems appear in all of the studied subperiods. By contrast, thekeyword multi-valued-logic only appears in the first studied subperiod (1978–1989).
Following the philosophy of Price and Gürsey (1975), in Fig. 10 the keywords’ evolution is shown. The circles representeach subperiod, and the number of keywords of the subperiod is represented inside. The arrows between consecutivesubperiods represent the number of keywords shared between them and, in parentheses the Similarity Index (overlapfraction) is shown. The upper-incoming arrows represent the number of new keywords of the subperiod, and finally, theupper-outcoming arrows represent the keywords that are not present (i.e., discontinued) in the next subperiod. For example,in the third studied subperiod (1995–1999) there are 3782 keywords, of which 1176 keywords remain in the next studiedsubperiod (2000–2004). The remainder of the keywords, 2606, are not kept in the next subperiod. The similarity indexbetween the third and fourth subperiod is 0.53.
The number of keywords is incremented drastically along the time period; in fact, in the last subperiod we find six timesmore than in the first one. Similarly, the number of shared keywords between successive subperiods grew (from 453 betweenthe first and second subperiod, to 1328 between the fourth and fifth subperiod), in fact, the similarity index grew across thesubperiods (from 0.25 between the first and second subperiod, to 0.55 between the fourth and fifth subperiod). This meansthat the FST community consolidates its terminology. On the other hand, the number of new and transient keywords is high,so there is a big quantity of transversal keywords that are only used in one subperiod and no more times. For example, inthe fourth subperiod (2000–2004) there are 3200 transient keywords from a total of 3352 new keywords.
Once the keywords’ evolution has been analyzed, we study the thematic evolution of the research FST field through thethematic areas.
In Fig. 11 the thematic evolution of the FST research field is shown. As mentioned before, the solid lines mean that thelinked themes share the name: both themes have the same name, or the name of one of the themes is part of the othertheme. A dotted line means that the themes share elements that are not the name of the theme. The thickness of the edgeis proportional to the inclusion index, and the volume of the spheres is proportional to the number of published documentsof each theme.
Although the graph of Fig. 11 is very dense (the themes are very interconnected) the different thematic areas can bedetected. In Fig. 11 the different colour-shadows group the themes which belong to the same thematic area. There arethemes that have more than one shadow, which implies that the theme belongs to more than one thematic area. On the
762
1978-1989
2787
1990-1994
3782
1995-1999
4528
2000-2004
5034
2005-2009
3091876
26063200
453 (0.25) 911 (0.49) 1176 (0.53) 1328 (0.55)
23342871
33523706
Fig. 10. Overlap fractions (incoming and outcoming keywords between successive subperiods).

M.J.Cobo
etal./JournalofInform
etrics5 (2011) 146–166
159
DECISION-MAKING
FUZZY-TOPOLOGY
FUZZY-RELATIONAL-EQUATIONS
FUZZY-CONTROL
SUBGROUP
FUZZY-MAPPING
RELATIONS
NEIGHBORHOOD-SPACES
FUZZY-CONTROL
T-NORM
FUZZY-NUMBERS
NEURO-FUZZY-SYSTEMS
LEVEL-SUBGROUPS
FUZZY-RELATION
COMPACTNESS
FUZZY-TOPOLOGY
NEURO-FUZZY-SYSTEMS
FUZZY-NUMBERS
T-NORM
APPROXIMATE-REASONING
ALGEBRA
FUZZY-MEASURE
FIXED-POINT-THEOREM
FUZZY-SUBGROUP
UNCERTAINTY
FUZZY-CLUSTERING
UNIFORMITY
ENTROPY
AGGREGATION
LINEAR-MATRIX-INEQUALITY
FUZZY-TOPOLOGY
T-NORM
FUZZY-RULE-BASED-SYSTEM
FUZZY-NUMBERS
FUZZY-CONTROL
FUZZY-LOGIC
FUZZY-MEASURE
FUZZY-CLUSTERING
FUZZY-RELATION
INTERACTIVE-METHODS
FUZZY-SUBGROUP
FUZZY-MAPPING
LEAST-SQUARES
UNCERTAINTY
L-FUZZY-TOPOLOGY
NECESSITY-MEASURE
INTUITIONISTIC-FUZZY-SET
OWA-OPERATORS
H-INFINITY-CONTROL
GROUP-DECISION-MAKING
FUZZY-CONTROL
T-NORM
SYSTEM-IDENTIFICATION
FUZZY-NUMBERS
CLASSIFICATION
FUZZY-LOGIC
UNCERTAINTY
FUZZY-TOPOLOGY
FUZZY-MEASURE
FUZZY-CLUSTERING
PROBABILISTIC-METRIC-SPACE
CAUCHY-PROBLEM
SIMILARITY-RELATIONS
FUZZY-REGRESSION
FUZZY-RELATIONAL-EQUATIONS
UNIVERSAL-APPROXIMATORS
L-TOPOLOGY
FUZZY-ROUGH-SETS
Fuzzy Sets and SystemsIEEE Transactions on Fuzzy Systems
1978 1990 1995 2000 20051989 1994 1999 90024002
Fig. 11. Thematic evolution of the FST research field (1978–2009).

160 M.J. Cobo et al. / Journal of Informetrics 5 (2011) 146–166
Table 7Quantitative and impact data for the detected thematic areas (1978–2009).
Theme name Number of documents Number of citations Average of citations h-Index
FUZZY-CONTROL 2461 49,726 20.21 92FUZZY-LOGIC 1217 24,477 20.11 69FUZZY-NUMBER 1008 13,896 13.79 50T-NORM 604 8999 14.90 44FUZZY-TOPOLOGY 581 3678 6.33 28FUZZY-RELATION 447 4679 10.47 33UNCERTAINTY 386 4094 10.61 29GROUP-DECISION-MAKING 219 3164 14.45 29FUZZY-SUBGROUP 166 1062 6.40 16FUZZY-MAPPING 128 991 7.74 16
other hand, there are themes that do not have a shadow, which implies that these themes do not belong to any thematicarea. In Table 7 we identify the main thematic areas and show their respective global quantitative and impact measures.
Then, analyzing Fig. 11 and Table 7 we should point out the following:
• If we observe the development of the FST research field according to its grouped thematic areas and themes, we canconclude that the FST field presents great cohesion, given that the most identified themes are grouped in some thematicarea and originate from a theme identified in a previous subperiod. Furthermore, when we find some theme that is not in athematic area, this is because (i) the theme is very recent and could be considered as the beginning of a new thematic area,for example as happens with the themes INTUITIONISTIC-FUZZY-SET or FUZZY-ROUGH-SET in the fourth and fifth subperiod,respectively; or (ii) the theme is connected with many thematic areas (it is a basic theme) and it is difficult to categorize it,for example, as happens with the theme DECISION-MAKING in the first subperiod; or (iii) the theme is not well described bykeywords and it is not possible to detect its connections with others, for example, as happens with the theme RELATIONSin the first subperiod.
• Most thematic areas evolve in a continuous and compact way from their beginning until the last studied subperiod(2005–2009), i.e., there are no gaps in their evolution. This means that they attract the fuzzy community members’ interestin all analyzed subperiods. An exception is in the case of the thematic area FUZZY-SUBGROUP, which disappears after thefourth subperiod.
• Regarding the evolution of the number of documents, looking at the volume of the spheres, most thematic areas evolve inan increasing way; that is, in each subperiod the number of documents increases in respect to the previous one. Therefore,we detect an increasing interest in the fuzzy community for these thematic areas represented by a progressive growth inwork on them. Again, the evolution of the thematic area FUZZY-SUBGROUP does not present this behaviour and neitherdoes the thematic area FUZZY-MAPPING.
• Regarding the evolution of the number of themes we find that there is only one thematic area that evolves in an increasingway, i.e, FUZZY-CONTROL (see its evolution in detail in Fig. 12). This thematic area is the origin of another importantthematic area FUZZY-LOGIC. The remainder evolve in a constant way such as T-NORM (see its evolution in detail in Fig. 14a)or GROUP-DECISION-MAKING (see Fig. 14b), or in a decreasing way such as FUZZY-LOGIC (see its evolution in detail inFig. 13).
• Furthermore, we should point out that there are only three thematic areas that are present or contain themes in all of thestudied subperiods: FUZZY-CONTROL, FUZZY-TOPOLOGY and FUZZY-RELATION. Therefore, we can affirm that these threethematic areas have maintained the fuzzy community’s interest in all the studied subperiods, but clearly, according toTable 7, the thematic area that is increasing in respect to the number of themes, FUZZY-CONTROL, presents the best qualityindicators.
• Regarding the thematic composition of each thematic area we find that there are:- Two solid thematic areas according to their thematic composition; that is, they are composed of motor or basic themes
in all subperiods: FUZZY-CONTROL, T-NORM.- Two important thematic areas that show exhaustion signs; that is, they are composed of motor or basic themes in most
subperiods but in the last one they present disappearing themes such as FUZZY-LOGIC and FUZZY-NUMBERS.- Two specific or peripheral thematic areas composed of peripheral themes in all subperiods: FUZZY-SUBGROUP and FUZZY-
MAPPING.- Two ascending thematic areas; that is, initially they present specific themes and in the last subperiod (2005–2009) they
begin to consolidate with motor and basic themes: FUZZY-RELATIONS, UNCERTAINTY and GROUP-DECISION-MAKING.- There is also one descending thematic area, FUZZY-TOPOLOGY.
• In short, we should point out the following:1. FUZZY-CONTROL is the most important thematic area in the FST research field, which presents the best evolution behavior
and the best quality indicators according to Table 7.2. T-NORM is another important and basic thematic area in the FST research field, which presents a solid evolution and
good impact indicators (h-index = 44) according to Table 7.

M.J. Cobo et al. / Journal of Informetrics 5 (2011) 146–166 1611978-1989
1990-1994
1995-1999
2000-2004
2005-2009
Fig.
12.
The
FUZZ
Y-C
ON
TRO
Lth
emat
icar
ea(1
978–
2009
).

162 M.J. Cobo et al. / Journal of Informetrics 5 (2011) 146–166
NEURO-FUZZY-SYSTEMS
FUZZY-LOGIC
FUZZY-CONTROLFUZZY-MODEL
SYSTEM-IDENTIFICATION
ARCHITECTURE
CLASSIFICATION
ADAPTIVE-CONTROL
LEARNING
PATTERN-RECOGNITION
EXPERT-SYSTEM
BACKPROPAGATION
FUZZY-INFERENCE
FUZZY-RULE-BASED-SYSTEM
LINGUISTIC-MODELING
APPROXIMATE-REASONING
DECISION-MAKING
POSSIBILITY-THEORY
POSSIBILITY-DISTRIBUTIONS
IMPLICATION-OPERATORS
PROCESS-CONTROL
SIMILARITY-MEASURES
ARTIFICIAL-INTELLIGENCE
ENGINEERING
OPERATORS
FUZZY-INFERENCE
FUZZY-LOGIC
COMPUTING-WITH-WORDS
ARCHITECTURE
APPROXIMATE-REASONING
PROPOSITIONAL-CALCULI
INFORMATION-GRANULATION
PRINCIPLE EXPERT-SYSTEM
FUZZY-MODEL-IDENTIFICATION
LOGIC-PROGRAMMING
FUZZY-INFERENCE
FUZZY-LOGIC
ARCHITECTURE
APPROXIMATION
RESIDUATED-LATTICE
PROPOSITIONAL-CALCULI
ALGEBRA
AUTOMATA
NON-CLASSICAL-LOGICS MANY-VALUED-LOGIC
MONOIDAL-T-NORM-BASED-LOGIC
LEFT-CONTINUOUS-T-NORMS
1995-1999
2000-2004
2005-2009
Fig. 13. The FUZZY-LOGIC thematic area (1978–2009).
3. FUZZY LOGIC and FUZZY-NUMBERS are also important thematic areas in the FST research field, with good impact indi-cators (h-index = 69 and h-index = 50, respectively), but that now present exhaustion signs.
4. FUZZY-RELATIONS, UNCERTAINTY and GROUP-DECISION-MAKING are three ascending thematic areas which present goodimpact indicators, h-index = 33, h-index = 29, h-index = 29, respectively.
5. FUZZY TOPOLOGY is not an important thematic area and presents a descending behavior with low impact indicators, i.e.,h-index = 28, although it has been present in all studied subperiods.
6. FUZZY-SUBGROUP and FUZZY-MAPPING are the peripheral thematic areas which present the lowest impact indicatorsaccording to Table 7.

M.J. Cobo et al. / Journal of Informetrics 5 (2011) 146–166 163
1990-1994
1995-1999
2000-2004
2005-2009
a T-NORM thematic area.
1995-1999
2000-2004
2005-2009
b GROUP-DECISION-MAKING thematic area.
Fig. 14. T-NORM and GROUP-DECISION-MAKING thematic areas (1978–2009).
164 M.J. Cobo et al. / Journal of Informetrics 5 (2011) 146–166
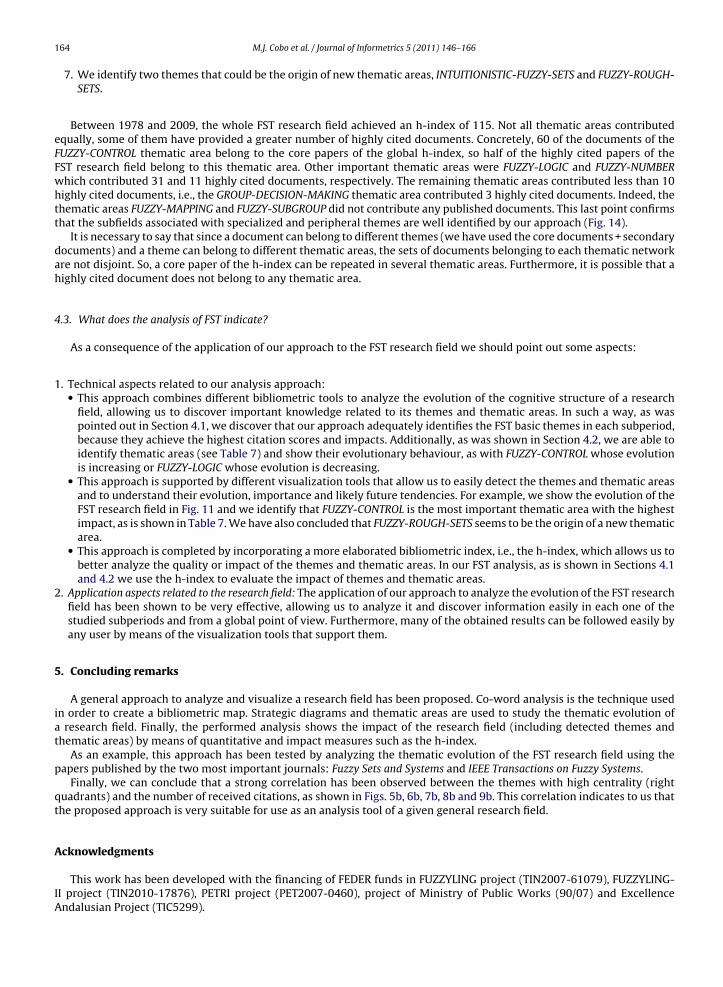
7. We identify two themes that could be the origin of new thematic areas, INTUITIONISTIC-FUZZY-SETS and FUZZY-ROUGH-SETS.
Between 1978 and 2009, the whole FST research field achieved an h-index of 115. Not all thematic areas contributedequally, some of them have provided a greater number of highly cited documents. Concretely, 60 of the documents of theFUZZY-CONTROL thematic area belong to the core papers of the global h-index, so half of the highly cited papers of theFST research field belong to this thematic area. Other important thematic areas were FUZZY-LOGIC and FUZZY-NUMBERwhich contributed 31 and 11 highly cited documents, respectively. The remaining thematic areas contributed less than 10highly cited documents, i.e., the GROUP-DECISION-MAKING thematic area contributed 3 highly cited documents. Indeed, thethematic areas FUZZY-MAPPING and FUZZY-SUBGROUP did not contribute any published documents. This last point confirmsthat the subfields associated with specialized and peripheral themes are well identified by our approach (Fig. 14).
It is necessary to say that since a document can belong to different themes (we have used the core documents + secondarydocuments) and a theme can belong to different thematic areas, the sets of documents belonging to each thematic networkare not disjoint. So, a core paper of the h-index can be repeated in several thematic areas. Furthermore, it is possible that ahighly cited document does not belong to any thematic area.
4.3. What does the analysis of FST indicate?
As a consequence of the application of our approach to the FST research field we should point out some aspects:
1. Technical aspects related to our analysis approach:• This approach combines different bibliometric tools to analyze the evolution of the cognitive structure of a research
field, allowing us to discover important knowledge related to its themes and thematic areas. In such a way, as waspointed out in Section 4.1, we discover that our approach adequately identifies the FST basic themes in each subperiod,because they achieve the highest citation scores and impacts. Additionally, as was shown in Section 4.2, we are able toidentify thematic areas (see Table 7) and show their evolutionary behaviour, as with FUZZY-CONTROL whose evolutionis increasing or FUZZY-LOGIC whose evolution is decreasing.
• This approach is supported by different visualization tools that allow us to easily detect the themes and thematic areasand to understand their evolution, importance and likely future tendencies. For example, we show the evolution of theFST research field in Fig. 11 and we identify that FUZZY-CONTROL is the most important thematic area with the highestimpact, as is shown in Table 7. We have also concluded that FUZZY-ROUGH-SETS seems to be the origin of a new thematicarea.
• This approach is completed by incorporating a more elaborated bibliometric index, i.e., the h-index, which allows us tobetter analyze the quality or impact of the themes and thematic areas. In our FST analysis, as is shown in Sections 4.1and 4.2 we use the h-index to evaluate the impact of themes and thematic areas.
2. Application aspects related to the research field: The application of our approach to analyze the evolution of the FST researchfield has been shown to be very effective, allowing us to analyze it and discover information easily in each one of thestudied subperiods and from a global point of view. Furthermore, many of the obtained results can be followed easily byany user by means of the visualization tools that support them.
5. Concluding remarks
A general approach to analyze and visualize a research field has been proposed. Co-word analysis is the technique usedin order to create a bibliometric map. Strategic diagrams and thematic areas are used to study the thematic evolution ofa research field. Finally, the performed analysis shows the impact of the research field (including detected themes andthematic areas) by means of quantitative and impact measures such as the h-index.
As an example, this approach has been tested by analyzing the thematic evolution of the FST research field using thepapers published by the two most important journals: Fuzzy Sets and Systems and IEEE Transactions on Fuzzy Systems.
Finally, we can conclude that a strong correlation has been observed between the themes with high centrality (rightquadrants) and the number of received citations, as shown in Figs. 5b, 6b, 7b, 8b and 9b. This correlation indicates to us thatthe proposed approach is very suitable for use as an analysis tool of a given general research field.
Acknowledgments
This work has been developed with the financing of FEDER funds in FUZZYLING project (TIN2007-61079), FUZZYLING-II project (TIN2010-17876), PETRI project (PET2007-0460), project of Ministry of Public Works (90/07) and ExcellenceAndalusian Project (TIC5299).

M.J. Cobo et al. / Journal of Informetrics 5 (2011) 146–166 165
References
Alonso, S., Cabrerizo, F., Herrera-Viedma, E., & Herrera, F. (2009). h-Index: A review focused in its variants, computation and standardization for differentscientific fields. Journal of Informetrics, 3, 273–289.
Bailón-Moreno, R., Jurado-Alameda, E., Ruiz-Banos, R., & Courtial, J. (2005). Analysis of the scientific field of physical chemistry of surfactants with theunified scienctometric model. Fit of relational and activity indicators. Scientometrics, 63, 259–276.
Bailón-Moreno, R, Jurado-Alameda, E., & Ruz-Banos, R. (2006). The scientific network of surfactants: Structural analysis. Journal of the American Society forInformation Science and Technology, 57, 949–960.
Börner, K., Chen, C., & Boyack, K. (2003). Visualizing knowledge domains. Annual Review of Information Science and Technology, 37, 179–255.Braam, R. R., Moed, H. F., & van Raan, A. F. J. (1991). Mapping of science by combined co-citation and word analysis. II: Dynamical aspects. Journal of the
American Society for Information Science, 42, 252–266.Cabrerizo, F. J., Alonso, S., Herrera-Viedma, E., & Herrera, F. (2010). q2-Index: Quantitative and qualitative evaluation based on the number and impact of
papers in the hirsch core. Journal of Informetrics, 4, 23–28.Cahlik, T. (2000). Comparison of the maps of science. Scientometrics, 49, 373–387.Calero-Medina, C., & Noyons, E. C. M. (2008). Combining mapping and citation network analysis for a better understanding of the scientific development:
The case of the absorptive capacity field. Journal of Informetrics, 2, 272–279.Callon, M., Courtial, J. P., Turner, W. A., & Bauin, S. (1983). From translations to problematic networks: An introduction to co-word analysis. Social Science
Information, 22, 191–235.Callon, M., Courtial, J. P., & Laville, F. (1991). Co-word analysis as a tool for describing the network of interactions between basic and technological
research—the case of polymer chemistry. Scientometrics, 22, 155–205.Chen, C. (2004). Searching for intellectual turning points: Progressive knowledge domain visualization. Proceedings of the National Academy of Sciences, 101,
5303–5310.Chen, P., & Redner, S. (2010). Community structure of the physical review citation network. Journal of Informetrics, 4, 278–290.Chen, C., Ibekwe-SanJuan, F., & Hou, J. (2010). The structure and dynamics of cocitation clusters: A multiple-perspective cocitation analysis. Journal of the
American Society for Information Science and Technology, 61, 1386–1409.CoPalRed. (2005). Research group Evaluación de la Ciencia y la Comunicación Cientfica. Universidad de Granada. (http://ec3.ugr.es/copalred/)Coulter, N., Monarch, I., & Konda, S. (1998). Software engineering as seen through its research literature: A study in co-word analysis. Journal of the American
Society for Information Science, 49, 1206–1223.Courtial, J. P. (1990). A mathematical model of development in a research field. Scientometrics, 19, 127–141.Courtial, J. P., & Michelet, B. (1994). A coword analysis of scientometrics. Scientometrics, 31, 251–260.Ding, Y., Chowdhury, G., & Foo, S. (2001). Bibliometric cartography of information retrieval research by using co-word analysis. Information Processing and
Management, 37, 817–842.Garfield, E. (1994). Scientography: Mapping the tracks of science. Current Contents: Social & Behavioural Sciences, 7, 5–10.He, Q. (1999). Knowledge discovery through co-word analysis. Library Trends, 48, 133–159.Henderson, M., Shurville, S., & Fernstrom, K. (2009). The quantitative crunch: The impact of bibliometric research quality assessment exercises on academic
development at small conferences. Campus-Wide Information Systems, 26, 149–167.Hirsch, J. (2005). An index to quantify an individuals scientific research out-put. Proceedings of the National Academy of Sciences, 102, 16569–16572.Kandylas, V., Upham, S. P., & Ungar, L. H. (2010). Analyzing knowledge communities using foreground and background clusters. ACM Transactions on
Knowledge Discovery from Data 4, art. no. 7.Krsul, I. (1998). Software vulnerability analysis. Ph.D. thesis. Purdue University.Leydesdorff, L., & Rafols, I. (2009). A global map of science based on the ISI subject categories. Journal of the American Society for Information Science and
Technology, 60, 348–362.Leydesdorff, L., & Schank, T. (2008). Dynamic animations of journal maps: Indicators of structural changes and interdisciplinary developments. Journal of
the American Society for Information Science and Technology, 591, 1810–1818.López-Herrera, A. G., Cobo, M. J., Herrera-Viedma, E., Herrera, F., Bailón-Moreno, R., & Jimenez-Contreras, E. (2009). Visualization and evolution of the
scientific structure of fuzzy sets research in spain. Information Research 14, paper 421. URL http://InformationR.net/ir/14-4/paper421.html.López-Herrera, A. G., Cobo, M. J., Herrera-Viedma, E., & Herrera, F. (2010). A bibliometric study about the research based on hybridating the fuzzy logic field
and the other computational intelligent techniques: A visual approach. Internacional Journal of Hybrid Intelligent Systems, 17, 17–32.Michelet, B. (1988). L’analyse des associations. Ph.D. thesis. University of Paris VII.Moya-Anegón, F., Vargas-Quesada, B., Chinchilla-Rodriguez, Z., Corera-Alvarez, E., Herrero-Solana, V., & Munoz-Fernández, F. (2005). Domain analysis and
information retrieval through the construction of heliocentric maps based on ISI-JCR category cocitation. Information Processing and Management, 41,1520–1533.
Moya-Anegón, F., Vargas-Quesada, B., Chinchilla-Rodríguez, Z., Corera-Álvarez, E., Munoz-Fernández, F., & Herrero-Solana, V. (2007). Visualizing the marrowof science. Journal of the American Society for Information Science and Technology, 58, 2167–2179.
Noma, E. (1984). Co-citation analysis and the invisible college. Journal of the American Society for Information Science, 35, 29–33.Noyons, E. C. M., Moed, H. F., & Luwel, M. (1999). Combining mapping and citation analysis for evaluative bibliometric purposes: A bibliometric study.
Journal of the American Society for Information Science, 50, 115–131.Noyons, E. C. M., Moed, H. F., & van Raan, A. F. J. (1999). Integrating research performance analysis and science mapping. Scientometrics, 46, 591–604.Peters, H. P. F., & van Raan, A. F. J. (1993). Co-word-based science maps of chemical engineering. Part i: Representations by direct multidimensional scaling.
Research Policy, 22, 23–45.Polanco, X., Francois, C., & Lamirel, J. C. (2001). Using artificial neural networks for mapping of science and technology: A multi-self-organizing-maps
approach. Scientometrics, 51, 267–292.Price, D., & Gürsey, S. (1975). Studies in scientometrics i: Transience and continuance in scientific authorship. Ci. Informatics Rio de Janeiro, 4, 27–40.Ramos-Rodrguez, A., & Ruz-Navarro, J. (2004). Changes in the intellectual structure of strategic management research: A bibliometric study of the Strategic
Management Journal, 1980–2000. Strategic Management Journal, 25, 981–1004.Rip, A., & Courtial, J. P. (1984). Co-word maps of biotechnology: An example of cognitive scientometrics. Scientometrics, 6, 381–400.Rosvall, M., & Bergstrom, C. T. (2010). Mapping change in large networks. PLoS ONE, 5, e8694.Skupin, A. (2009). Discrete and continuous conceptualizations of science: Implications for knowledge domain visualization. Journal of Informetrics, 3,
233–245.Small, H. (1973). Co-citation in the scientific literature: A new measure of the relationship between two documents. Journal of the American Society for
Information Science, 24, 265–269.Small, H. (1977). A co-citation model of a scientific specialty: A longitudinal study of collagen research. Social Studies of Science, 7, 139–166.Small, H. (1999). Visualizing science by citation mapping. Journal of the American Society for Information Science, 50, 799–813.Small, H. (2003). Paradigms, citations, and maps of science: A personal history. Journal of the American Society for Information Science and Technology, 54,
394–399.Small, H. (2006). Tracking and predicting growth areas in science. Scientometrics, 68, 595–610.Small, H., & Upham, S. P. (2009). Citation structure of an emerging research area on the verge of application. Scientometrics, 79, 365–375.Sternitzke, C., & Bergmann, I. (2009). Similarity measures for document mapping: A comparative study on the level of an individual scientist. Scientometrics,
78, 113–130.

166 M.J. Cobo et al. / Journal of Informetrics 5 (2011) 146–166
Upham, S. P., & Small, H. (2010). Emerging research fronts in science and technology: Patterns of new knowledge development. Scientometrics, 83, 15–38.van Eck, N. J., & Waltman, L. (2007). Bibliometric mapping of the computational intelligence field. International Journal of Uncertainty, Fuzziness and
Knowledge-Based Systems, 15, 625–645.van Eck, N. J., & Waltman, L. (2009). How to normalize cooccurrence data? An analysis of some well-known similarity measures. Journal of the American
Society for Information Science and Technology, 60, 1635–1651.van Raan, A. F. J. (2005a). Handbook of Quantitative Science and Technology Research. Chapter Measuring Science. Netherlands: Springer., pp. 19–50van Raan, A. F. J. (2005b). Measurement of central aspects of scientific research: Performance, interdisciplinarity, structure. Measurement, 3, 1–19.Zadeh, L. (1965). Fuzzy sets. Information and Control, 8, 338–353.Zadeh, L. (2008). Is there a need for fuzzy logic? Information Sciences, 178, 2751–2779.Zitt, M., Bassecoulard, E., & Okubo, Y. (2000). Shadows of the past in international cooperation: Collaboration profiles of the top five producers of science.
Scientometrics, 47, 627–657.


![Detecting Carbon Monoxide Poisoning Detecting Carbon ...2].pdf · Detecting Carbon Monoxide Poisoning Detecting Carbon Monoxide Poisoning. ... the patient’s SpO2 when he noticed](https://static.fdocuments.in/doc/165x107/5a78e09b7f8b9a21538eab58/detecting-carbon-monoxide-poisoning-detecting-carbon-2pdfdetecting-carbon.jpg)


![Detecting Carbon Monoxide Poisoning Detecting Carbon ...2].pdf · Detecting Carbon Monoxide Poisoning Detecting Carbon Monoxide Poisoning. Detecting Carbon Monoxide Poisoning C arbon](https://static.fdocuments.in/doc/165x107/5f551747b859172cd56bb119/detecting-carbon-monoxide-poisoning-detecting-carbon-2pdf-detecting-carbon.jpg)
