An Approach for Designing Thermal Management Systems for ... · An Approach for Designing Thermal...
18
An Approach for Designing Thermal Management Systems for Electric and Hybrid Vehicle Battery Packs Preprint January 1999 NREL/CP-540-25992 A.A. Pesaran, S. Burch, and M. Keyser To be presented at the Fourth Vehicle Thermal Management Systems Conference and Exhibition London, UK May 2427, 1999 National Renewable Energy Laboratory 1617 Cole Boulevard Golden, Colorado 80401-3393 NREL is a U.S. Department of Energy Laboratory Operated by Midwest Research Institute • Battelle • Bechtel Contract No. DE-AC36-98-GO10337
Transcript of An Approach for Designing Thermal Management Systems for ... · An Approach for Designing Thermal...
An Approach for Designing Thermal Management Systems for Electric and Hybrid Vehicle Battery Packs Preprint
January 1999 � NREL/CP-540-25992
A.A. Pesaran, S. Burch, and M. Keyser To be presented at the Fourth Vehicle Thermal Management Systems Conference and Exhibition London, UK May 24�27, 1999
National Renewable Energy Laboratory 1617 Cole Boulevard Golden, Colorado 80401-3393 NREL is a U.S. Department of Energy Laboratory Operated by Midwest Research Institute •••• Battelle •••• Bechtel
Contract No. DE-AC36-98-GO10337

NOTICE This report was prepared as an account of work sponsored by an agency of the United States government. Neither the United States government nor any agency thereof, nor any of their employees, makes any warranty, express or implied, or assumes any legal liability or responsibility for the accuracy, completeness, or usefulness of any information, apparatus, product, or process disclosed, or represents that its use would not infringe privately owned rights. Reference herein to any specific commercial product, process, or service by trade name, trademark, manufacturer, or otherwise does not necessarily constitute or imply its endorsement, recommendation, or favoring by the United States government or any agency thereof. The views and opinions of authors expressed herein do not necessarily state or reflect those of the United States government or any agency thereof.
Available to DOE and DOE contractors from: Office of Scientific and Technical Information (OSTI) P.O. Box 62 Oak Ridge, TN 37831
Prices available by calling 423-576-8401
Available to the public from: National Technical Information Service (NTIS) U.S. Department of Commerce 5285 Port Royal Road Springfield, VA 22161 703-605-6000 or 800-553-6847 or DOE Information Bridge http://www.doe.gov/bridge/home.html
Printed on paper containing at least 50% wastepaper, including 20% postconsumer waste

1
An Approach for Designing Thermal Management Systems for Electric and Hybrid Vehicle Battery
Packs
Ahmad A. Pesaran, Steve Burch, and Matthew Keyser National Renewable Energy Laboratory
1617 Cole Blvd. Golden, Colorado 80401 USA
for presentation at
The Fourth Vehicle Thermal Management Systems Conference and Exhibition 24-27 May 1999
London, UK
ABSTRACT If battery packs for electric vehicles (EVs) and hybrid electric vehicles (HEVs) are to operate effectively in all climates, thermal management of the packs is essential. In this paper, we will review a systematic approach for designing and evaluating battery pack thermal management systems. A thermal management system using air as the heat transfer medium is less complicated than a system using liquid cooling/heating. Generally, for parallel HEVs, an air thermal management system is adequate, whereas for EVs and series HEVs, liquid-based systems may be required for optimum thermal performance. Further information on battery thermal management can be found on the Web site www.ctts.nrel.gov/BTM. Keywords Hybrid electric vehicles, electric vehicles, batteries, battery packs, thermal analysis, thermal management 1 BACKGROUND The performance and life-cycle costs of electric vehicles (EVs) and hybrid electric vehicles (HEVs) depend inherently on energy storage systems such as batteries. Battery pack performance directly affects the all-electric range, power for acceleration, fuel economy, and charge acceptance during energy recovery from regenerative braking. Because the battery pack cost, durability, and life cycle also affect the cost and reliability of the vehicle, any parameter that affects the battery pack must be optimized.

2
Temperature and temperature uniformity in a pack are important factors for obtaining optimum performance from an EV or HEV battery pack. All the modules in a pack should operate within the optimum temperature range suitable for the particular electrochemical pair used. For example, the desired operating temperature for a lead acid battery is 25°C to 45°C. In addition, the modules need to be operated at uniform temperatures because uneven temperature distribution in a pack leads to different charge/discharge behavior, which, in turn, leads to electrically unbalanced modules and reduced pack performance (1). In the last couple of years, the EV/HEV battery and vehicle manufacturers have realized that a battery thermal management system (BTMS) is needed to achieve the desired performance, in any climate, from a pack. 2 INTRODUCTION As part of the cost-shared Hybrid Electric Vehicle Program sponsored by the U.S. Department of Energy (DOE), DOE's National Renewable Energy Laboratory (NREL) has been working with U.S. automobile manufacturers and their battery pack suppliers to identify and resolve thermal issues associated with battery packs for HEVs (2). To obtain information, evaluate designs, and provide solutions for battery thermal issues, we have used heat transfer and fluid flow principles, finite element thermal analysis, heat transfer and fluid flow experiments, thermal imaging techniques, and battery electric and calorimetry experiments. The goal of a thermal management system is to deliver a battery pack at an optimum average temperature with only small variations between the modules and within the pack. However, the pack thermal management system has to meet the requirements of the vehicleit must be compact and lightweight, easy to package, reliable, and readily accessible for maintenance. It must also have low parasitic power and be low in cost. An ideal thermal management system should be able to maintain the desired uniform temperature in a pack by rejecting heat in hot climates, adding heat in cold climates, and providing ventilation if the battery generates potentially hazardous gases. A thermal management system may use air for heat/cooling/ventilation, liquid for cooling/heating, insulation, thermal storage such as phase change materials, or a combination of these methods. The thermal management system may be passive (i.e., only the ambient environment is used) or active (i.e., a built-in source provides heating and/or cooling at extremely cold or extremely hot temperatures). In this paper, we will provide steps of a systematic approach for designing and evaluating thermal management systems for battery packs and will discuss non-proprietary results of some of our previous efforts. 3 APPROACH As with any system, there are several approaches to designing a battery thermal management system. In each approach, similar steps need to be performed. In the past few years, we have been performing some of these steps to different degrees of

3
sophistication and in various sequences depending on the availability of information and equipment, and on the timetable for a particular project. Based on our learning experience, we recommend a systematic approach to designing and evaluating a BTMS that consists of the following sequential steps. 1. Define the BTMS design objective and constraints
a. Identify specifications of the desired thermal performance for modules and packs under various climates (average T, ∆T in a module and between modules) and safety requirements such as the need for ventilation, based on the battery manufacturer�s requirements.
b. Identify the pack specifications such as geometry, dimensions, number of modules, and orientation, based on the vehicle integrator�s requirements. Establish pack lay-out alternatives based on packaging requirements.
2. Obtain module heat generation and heat capacity
a. Measure or estimate overall heat generation from the module under desired charge/discharge cycles and temperatures (3).
b. Measure or estimate the overall heat capacity of the module at various states of charge and temperatures.
3. Perform a first-order BTMS evaluation
a. Using heat transfer and energy balance principles, determine the transient or steady-state temperature of the modules/pack under anticipated operating conditions. This evaluation may be done with different heating/cooling fluids (air, liquid), different flow paths (direct or indirect, series or parallel), and different flow rates. As part of this step, the designer needs to estimate the fluid heat transfer coefficient as suggested in Step 4a.
b. Make a rough estimate of fan or pump parasitic power requirements. c. Make a preliminary selection of the heating/cooling fluid and the fluid flow rate
to maintain the pack within the specified temperature range. If the proper fluid choice is unclear, perform Step 4 with multiple fluids.
4. Predict the battery module and pack behavior
a. Obtain (measure or estimate) thermal conductivity of the overall modules or the module�s major components (such as the cell core and the case).
b. Using correlations, computational fluid dynamics (CFD), or testing, obtain the heat transfer rate between the heat transfer medium and the module.
c. Use finite element analysis (FEA) to obtain steady and transient thermal performance of modules, including temperature non-uniformity, for various conditions.
d. Use analysis (energy balance or FEA) to obtain steady and transient thermal performance of the pack, including temperature non-uniformity from module to module, for various conditions.
e. Using flow correlations, CFD, or testing, estimate the fan or pump parasitic power requirements.

4
f. Perform parametric FEA runs to identify optimum performance with the given restrictions and to conduct sensitivity analyses based on various BTMS control strategies (such as modulating flow rates and inlet fluid temperatures).
g. Evaluate the impact of the various designs on the battery pack performance (and life, if that information is available) and vehicle performance.
5. Design a preliminary BTMS (repeat Step 4 as needed)
a. Conduct an analysis and experiments to properly size the auxiliary components such as fans, pumps, and heat exchangers, along with active systems such as heaters and evaporator coils.
b. Devise a control strategy for operating the BTMS. c. Estimate the cost of the BTMS and its components. d. Consider and evaluate other factors such as maintenance, ease of operation, and
reliability. e. Compare alternative systems with respect to performance, energy need, cost,
complexity, and maintenance. Develop a preliminary BTMS design.
6. Build and test the BTMS a. Build a battery pack with an integrated BTMS. b. Conduct bench-top pack experiments to validate the FEA model, evaluate the
heat transfer and fluid flow performance, and fine tune the BTMS design such as fan or pump sizing needs (4).
c. Evaluate thermal control strategies based on the vehicle's operation strategy at various climates.
d. Install a prototype pack/BTMS in a vehicle and repeat Steps 6a-6c using a vehicle dynamometer.
7. Optimize the BTMS
To arrive at an optimum BTMS, the designer may need to repeat some of the above steps, considering several factors such as battery performance and life, impact on vehicle performance, cost, and ease of maintenance.
Generally, factors such as project requirements, time, or budget may necessitate either skipping one or more steps, or executing one or more of the steps at a low level of detail. However, we believe that following all steps of the approach will result in a fully optimized BTMS. 4 DISCUSSION In this section we provide a brief discussion of our experience with some of the steps, paying particular attention to those with a thermal emphasis. Providing details on each step would lengthen this paper and is beyond the scope of our objective. Most of the examples provided in this section are for a spirally wound, valve-regulated, lead acid, prototype HEV module fabricated by Optima Batteries, Inc., under the DOE/GM HEV program. Figure 1 shows the general construction of Optima spirally wound lead-acid battery. Although the image is from Optima�s sales literature on the company�s

5
production 12-V starting/lighting/ignition, it is very similar to Optima�s HEV prototype module. 4.1 BTMS design objective and constraints 4.1.1 Desired thermal performance The most important parameters for designing a BTMS are defining the required operating range, determining the desired operating range, and defining the level of acceptable temperature variation both for the modules and the pack. After performing a sufficient number of experiments, the battery manufacturer identifies the operating range based on energy/power performance, life, and safety issues. For example, a particular lithium-ion battery should be operated in the range of -20°C and +60°C. Below -20°C, the modules could not provide sufficient power or energy for the vehicle and their operation may cause internal module damage. Above 60°C, regenerative-braking charge acceptance could be poor or internal damage to the module may result in unsafe operation. The desired operating range is the temperature range that provides the optimum combination for performance and life and does not pose any safety issues. For example, the mentioned lithium-ion battery may have a desired operating range of 20°C to 40°C. Acceptable temperature variation in each module and from module to module in a pack also needs to be specified. Too much temperature variation in a module could lead to unbalanced utilization of the active material and potentially to lower performance and a shorter life. Temperature variation from module to module in a pack could lead to a different charging/discharging pattern and thus to an unbalanced pack with lower performance. Because this is a battery management issue, both the battery manufacturer and pack/vehicle integrator need to specify this temperature variation. 4.1.2 In-vehicle pack specifications The number of modules needed is dictated by the type of vehicle and battery energy/power requirements from the energy storage source (battery), the specifications of the selected module (energy, power, voltage, weight, volume, and orientation), and the desired pack voltage. Working with the battery manufacturer, the vehicle integrator needs to identify available spaces where the pack could fit and in what configurations. Next, they must identify the potential electrical and mechanical interfaces with the rest of the vehicle. During the preliminary vehicle design, the battery pack thermal designer may have some idea of the overall configuration of the pack and where it will be potentially placed in the vehicle; however, these constraints usually continue to evolve. 4.2 Heat generation and heat capacity The magnitude of overall heat generation rate from the modules in a pack affects the size and design of the thermal management system. It depends on the magnitude of module internal resistance and thermodynamic heat of the (electrochemical) reaction. Thus, the heat generation rate depends on the discharge/charge profile and the module�s state of charge and temperature. The heat generation could be estimated by measuring the internal resistance and enthalpy of the chemical reaction at the desired conditions. However, direct measurements could lead to more accurate values. One method is to charge/discharge a module with a cycle so the initial and final state of the charge (and temperature) of the battery remains the same. The difference between the electrical

6
energy in and electrical energy out of the module is the heat generated in the module. This approach is only good for cycles that do not change the state of charge of the battery. The other disadvantage of this method is that the module temperature changes with heat generation and one should estimate the energy stored in the module due to its thermal mass. The best method is to use a calorimeter. At NREL, we have been using a large custom-built calorimeter to measure the heat capacity and heat generation from cells/modules with various cycles, state of charge, and temperature (3). Table 1 shows some typical results with Optima 12-V HEV modules.
Table 1. Heat generation from a 12-V Optima HEV module using NREL�s calorimeter
Heat Generation (W) Cycle 25°°°°C 40°°°°C
16.5 A discharge, 80% to 20% State of Charge 7.7 2.1 16.5 A charge, 80% to 20% State of Charge 16.0 15.8 HEV 1.3 FUDS*, initial State of Charge of 75% 46.0 36.8
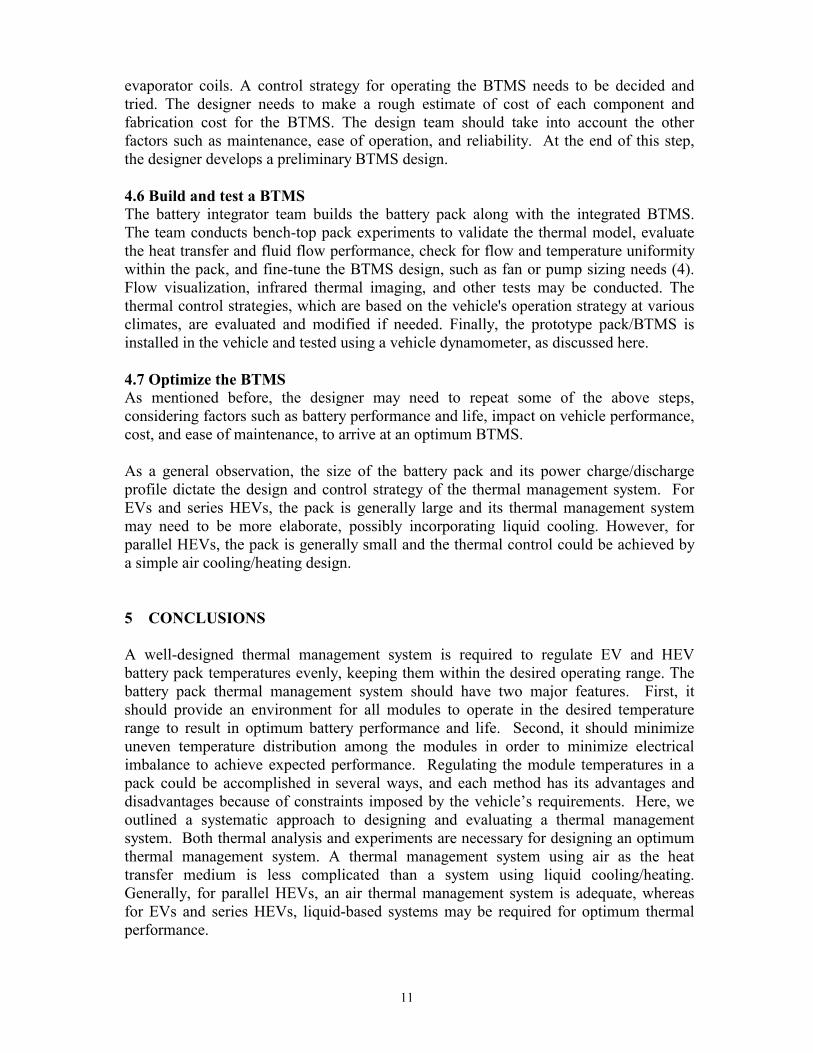
*FUDS = Federal Urban Driving Schedule It should be noted that the heat generation in a module may not be spatially uniform because of several factors: thermal conductivity of the case, placement of the positive and negative terminals, size and position of the cell interconnects within the module, and spatial variation of current density within a cell. Non-uniform heat generation could lead to non-uniform temperature distribution in the module. Infrared thermal imaging or a 3-D electrochemical model could provide some estimate of the spatial non-uniformity in heat generation. For example, an electrochemical model developed for Optima Batteries indicated a modest variation in heat generation in the Optima HEV module (5), as also indicated by NREL�s thermal imaging of the Optima modules (4). Figure 2 shows a typical axial variation of heat generation within an Optima HEV module. In order to do any reasonable transient or steady-state thermal analysis, the designer must know the heat capacity of the module. Overall or average heat capacity can either be measured in a calorimeter (3) or calculated from knowledge of heat capacity of individual components using a mass-weighted average of cell/module components. For example, using volume fraction, mass fraction, and densities provided by Optima, we estimated average density and heat capacity for the Optima HEV module to be ρeff = 4035 kg/m3 and cp,eff = 640 J/kgK, respectively. 4.3 First order evaluation 4.3.1 Analysis The designer uses heat transfer and energy balance principles to determine the transient or steady-state temperature of the modules/pack under anticipated operating conditions. Sub-steps are identified in Section 3.3 above with further details provided by Pesaran, et al. (1). This evaluation may be done with different heating/cooling fluids (air, liquid), different flow paths (such as direct or indirect, or series or parallel), and different flow rates. Estimates of heat transfer coefficient and flow-pressure drop relationships are needed. Approximate fan or pump parasitic power requirements must be estimated. The designer makes a preliminary selection of the heating/cooling fluid and, the fluid flow

7
rate to maintain the pack within the specified temperature range. This evaluation will identify the magnitude of the thermal problem in the pack/module and the type of BTMS needed. 4.3.2 Select heat transfer medium To continue the thermal analysis, the designer needs to select a medium to transfer heat to/from the modules. The heat transfer medium could be air, liquid, phase change material, or any combination. Heat transfer with air is achieved simply by blowing air across the modules. However, heat transfer with liquid could be achieved either through discrete tubing around each module, a jacket around the modules, submerging modules in a dielectric fluid for direct contact, or placing the modules on a liquid heated/cooled plate. If the liquid is not in direct contact with modules, such as in tube or jacket use, the heat transfer medium could be water-based automotive fluids. If modules are submerged in the heat transfer fluid, the fluid must be dielectric, such as silicon-based oils, to avoid any electrical shorts. In some cases, the side of the modules could be wrapped with a phase change material to control the temperature of the module. Using the air as the heat transfer medium may be the simplest approach, but it may not be as effective as heat transfer by liquid. The final selection of the heat transfer medium could be done after considering other factors such as added volume, mass, complexity, ease of maintenance, and cost. With liquid systems, an extra heat exchanger for heat rejection/addition is required. It should be noted that the thermophysical properties of the fluid are needed for further thermal analysis. 4.4 Predict battery module and pack behavior 4.4.1 Obtain module thermal conductivity It may be necessary to predict the 2-D or 3-D thermal behavior (temperature non-uniformity) of a module. Next, knowledge of thermal conductivity of the major module components is needed. Thermal conductivity estimation or measurement is somewhat complex. The simplest approach is to assume that a cell/module consists of a case and a homogenous core with effective thermal conductivity of components of the cell/module such as negative/positive electrodes, separators, electrolyte, and active material. Even in this case, one may need to obtain the thermal conductivity of the homogeneous core in different directions because of the orientation of the different components. The more complex and time-consuming approach is to analyze a geometric model of the cell/module with all internal details. Measuring the thermal conductivity of a cell/module in each direction is a challenging experimental task. As an example, we will summarize our efforts to calculate the thermal conductivity of the Optima prototype HEV module. The complex geometry of the cell includes a spiral wind of alternating layers of positive and negative paste/grid with glass separator paper between layers. Paste fills the rectangular voids of the grid, as well as coating both exterior grid faces. The case is polypropylene. The initial estimate of the effective thermal conductivity (keff) of the cell material (assuming a homogenous core) was keff = 7.7 W/mK for a 2-D finite element analysis (FEA) effort. This isotropic value was based on a volume-average of thermal
8
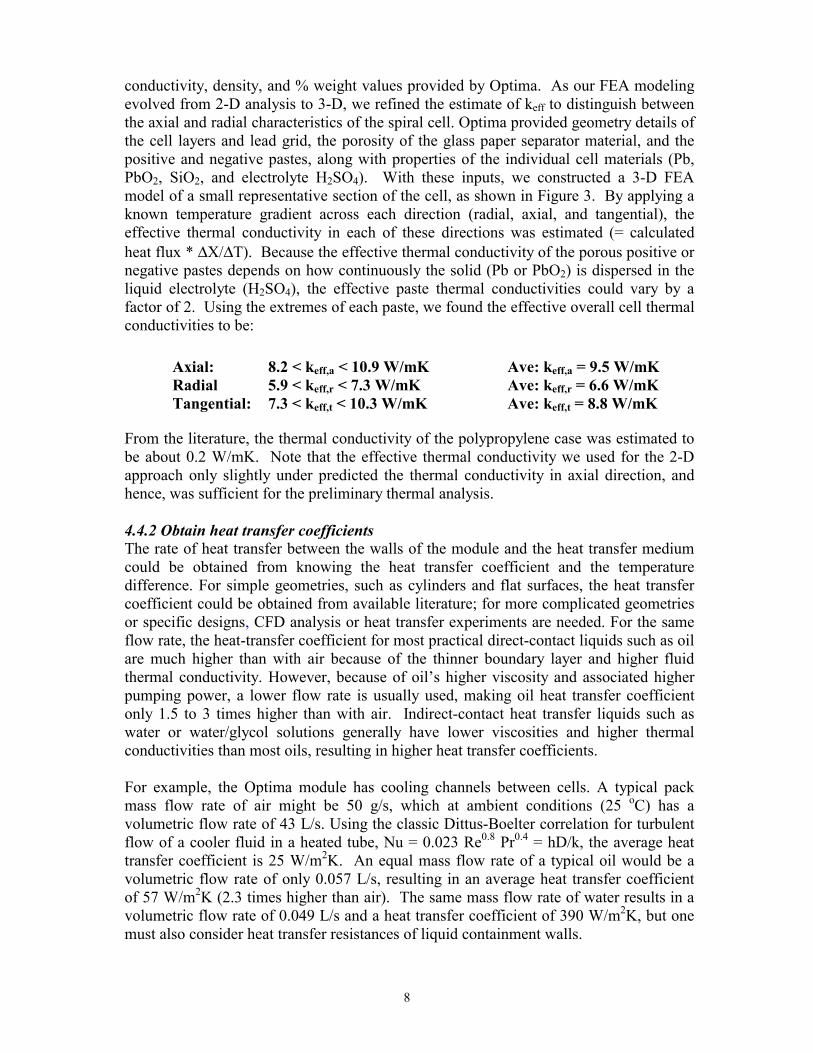
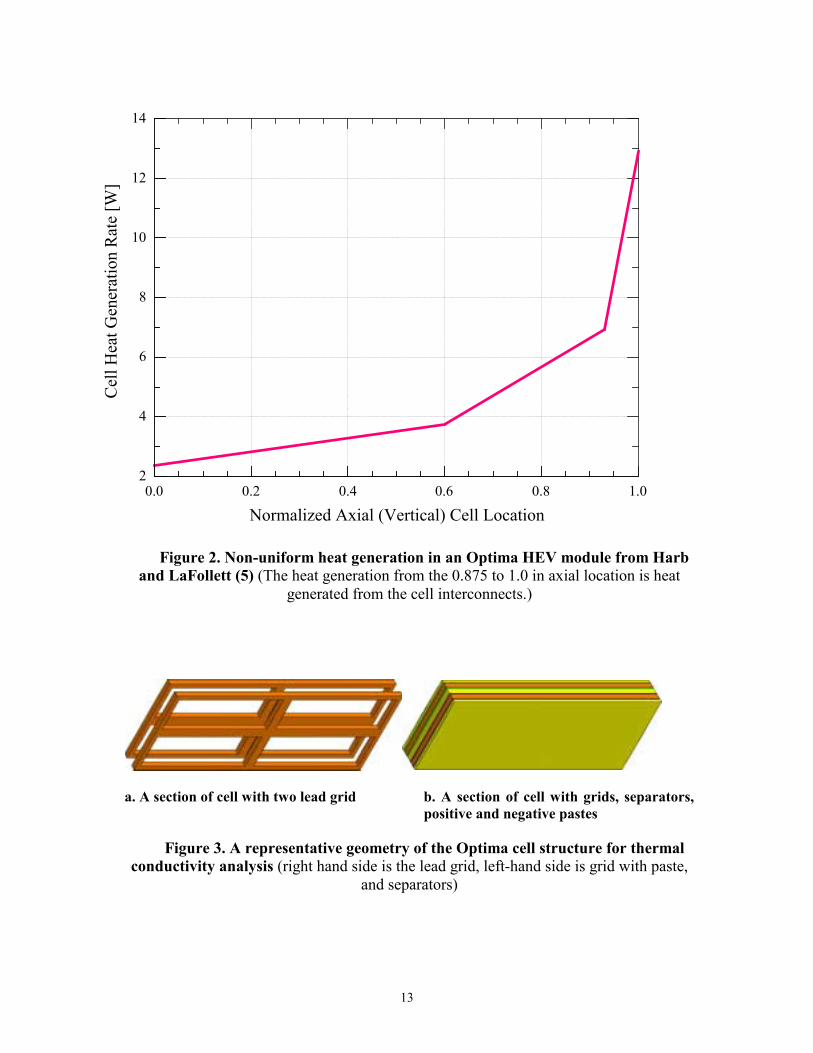
conductivity, density, and % weight values provided by Optima. As our FEA modeling evolved from 2-D analysis to 3-D, we refined the estimate of keff to distinguish between the axial and radial characteristics of the spiral cell. Optima provided geometry details of the cell layers and lead grid, the porosity of the glass paper separator material, and the positive and negative pastes, along with properties of the individual cell materials (Pb, PbO2, SiO2, and electrolyte H2SO4). With these inputs, we constructed a 3-D FEA model of a small representative section of the cell, as shown in Figure 3. By applying a known temperature gradient across each direction (radial, axial, and tangential), the effective thermal conductivity in each of these directions was estimated (= calculated heat flux * ∆X/∆T). Because the effective thermal conductivity of the porous positive or negative pastes depends on how continuously the solid (Pb or PbO2) is dispersed in the liquid electrolyte (H2SO4), the effective paste thermal conductivities could vary by a factor of 2. Using the extremes of each paste, we found the effective overall cell thermal conductivities to be:
Axial: 8.2 < keff,a < 10.9 W/mK Ave: keff,a = 9.5 W/mK Radial 5.9 < keff,r < 7.3 W/mK Ave: keff,r = 6.6 W/mK Tangential: 7.3 < keff,t < 10.3 W/mK Ave: keff,t = 8.8 W/mK From the literature, the thermal conductivity of the polypropylene case was estimated to be about 0.2 W/mK. Note that the effective thermal conductivity we used for the 2-D approach only slightly under predicted the thermal conductivity in axial direction, and hence, was sufficient for the preliminary thermal analysis. 4.4.2 Obtain heat transfer coefficients The rate of heat transfer between the walls of the module and the heat transfer medium could be obtained from knowing the heat transfer coefficient and the temperature difference. For simple geometries, such as cylinders and flat surfaces, the heat transfer coefficient could be obtained from available literature; for more complicated geometries or specific designs, CFD analysis or heat transfer experiments are needed. For the same flow rate, the heat-transfer coefficient for most practical direct-contact liquids such as oil are much higher than with air because of the thinner boundary layer and higher fluid thermal conductivity. However, because of oil�s higher viscosity and associated higher pumping power, a lower flow rate is usually used, making oil heat transfer coefficient only 1.5 to 3 times higher than with air. Indirect-contact heat transfer liquids such as water or water/glycol solutions generally have lower viscosities and higher thermal conductivities than most oils, resulting in higher heat transfer coefficients. For example, the Optima module has cooling channels between cells. A typical pack mass flow rate of air might be 50 g/s, which at ambient conditions (25 oC) has a volumetric flow rate of 43 L/s. Using the classic Dittus-Boelter correlation for turbulent flow of a cooler fluid in a heated tube, Nu = 0.023 Re0.8 Pr0.4 = hD/k, the average heat transfer coefficient is 25 W/m2K. An equal mass flow rate of a typical oil would be a volumetric flow rate of only 0.057 L/s, resulting in an average heat transfer coefficient of 57 W/m2K (2.3 times higher than air). The same mass flow rate of water results in a volumetric flow rate of 0.049 L/s and a heat transfer coefficient of 390 W/m2K, but one must also consider heat transfer resistances of liquid containment walls.
9
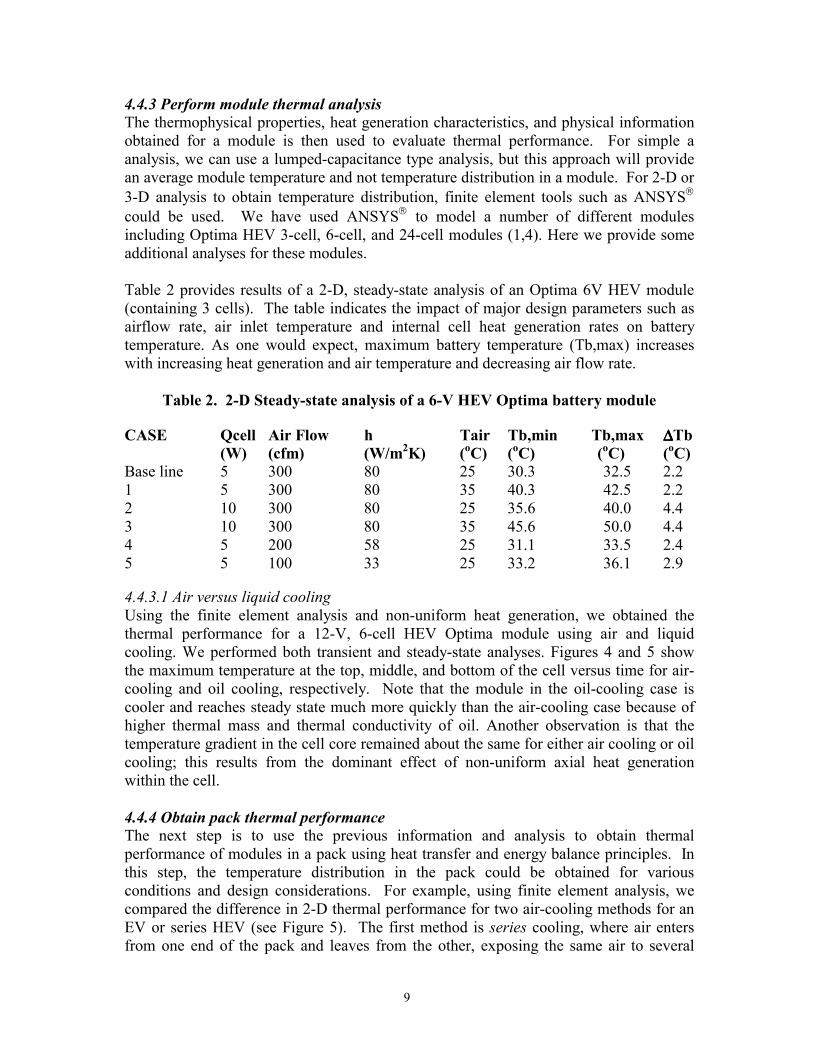
4.4.3 Perform module thermal analysis The thermophysical properties, heat generation characteristics, and physical information obtained for a module is then used to evaluate thermal performance. For simple a analysis, we can use a lumped-capacitance type analysis, but this approach will provide an average module temperature and not temperature distribution in a module. For 2-D or 3-D analysis to obtain temperature distribution, finite element tools such as ANSYS could be used. We have used ANSYS to model a number of different modules including Optima HEV 3-cell, 6-cell, and 24-cell modules (1,4). Here we provide some additional analyses for these modules. Table 2 provides results of a 2-D, steady-state analysis of an Optima 6V HEV module (containing 3 cells). The table indicates the impact of major design parameters such as airflow rate, air inlet temperature and internal cell heat generation rates on battery temperature. As one would expect, maximum battery temperature (Tb,max) increases with increasing heat generation and air temperature and decreasing air flow rate.
Table 2. 2-D Steady-state analysis of a 6-V HEV Optima battery module
CASE Qcell Air Flow h Tair Tb,min Tb,max ∆∆∆∆Tb (W) (cfm) (W/m2K) (oC) (oC) (oC) (oC)
Base line 5 300 80 25 30.3 32.5 2.2 1 5 300 80 35 40.3 42.5 2.2 2 10 300 80 25 35.6 40.0 4.4 3 10 300 80 35 45.6 50.0 4.4 4 5 200 58 25 31.1 33.5 2.4 5 5 100 33 25 33.2 36.1 2.9
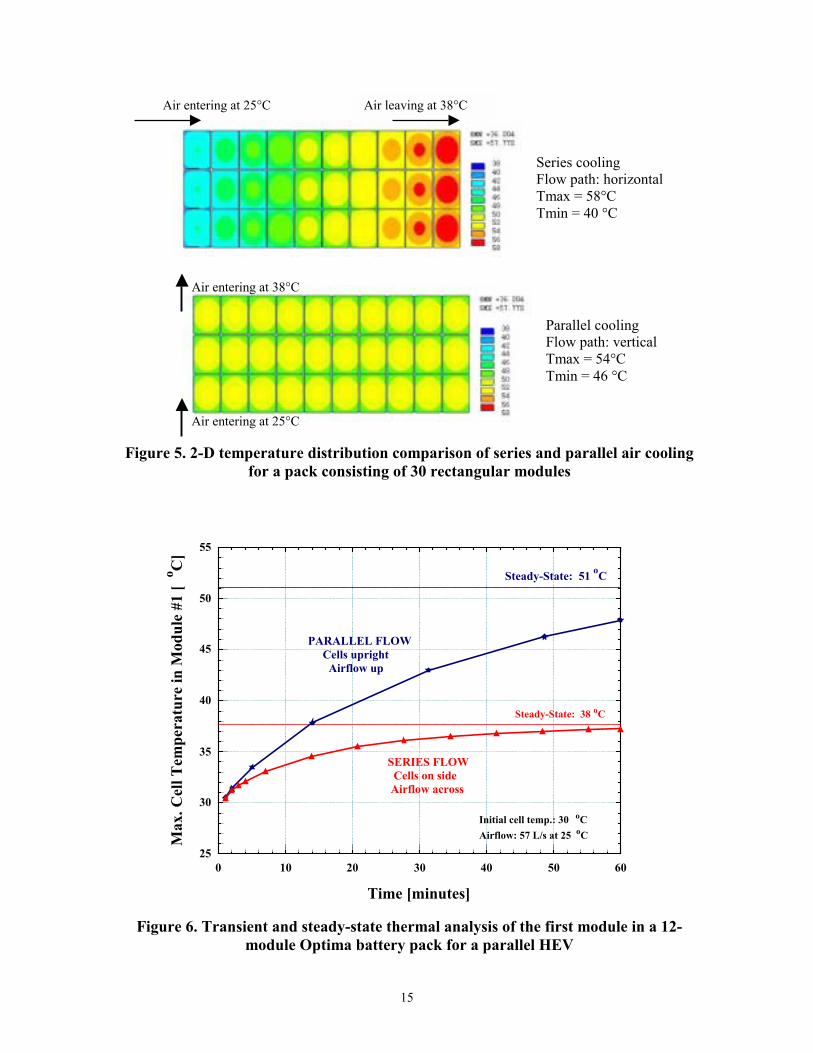
4.4.3.1 Air versus liquid cooling Using the finite element analysis and non-uniform heat generation, we obtained the thermal performance for a 12-V, 6-cell HEV Optima module using air and liquid cooling. We performed both transient and steady-state analyses. Figures 4 and 5 show the maximum temperature at the top, middle, and bottom of the cell versus time for air-cooling and oil cooling, respectively. Note that the module in the oil-cooling case is cooler and reaches steady state much more quickly than the air-cooling case because of higher thermal mass and thermal conductivity of oil. Another observation is that the temperature gradient in the cell core remained about the same for either air cooling or oil cooling; this results from the dominant effect of non-uniform axial heat generation within the cell. 4.4.4 Obtain pack thermal performance The next step is to use the previous information and analysis to obtain thermal performance of modules in a pack using heat transfer and energy balance principles. In this step, the temperature distribution in the pack could be obtained for various conditions and design considerations. For example, using finite element analysis, we compared the difference in 2-D thermal performance for two air-cooling methods for an EV or series HEV (see Figure 5). The first method is series cooling, where air enters from one end of the pack and leaves from the other, exposing the same air to several
10
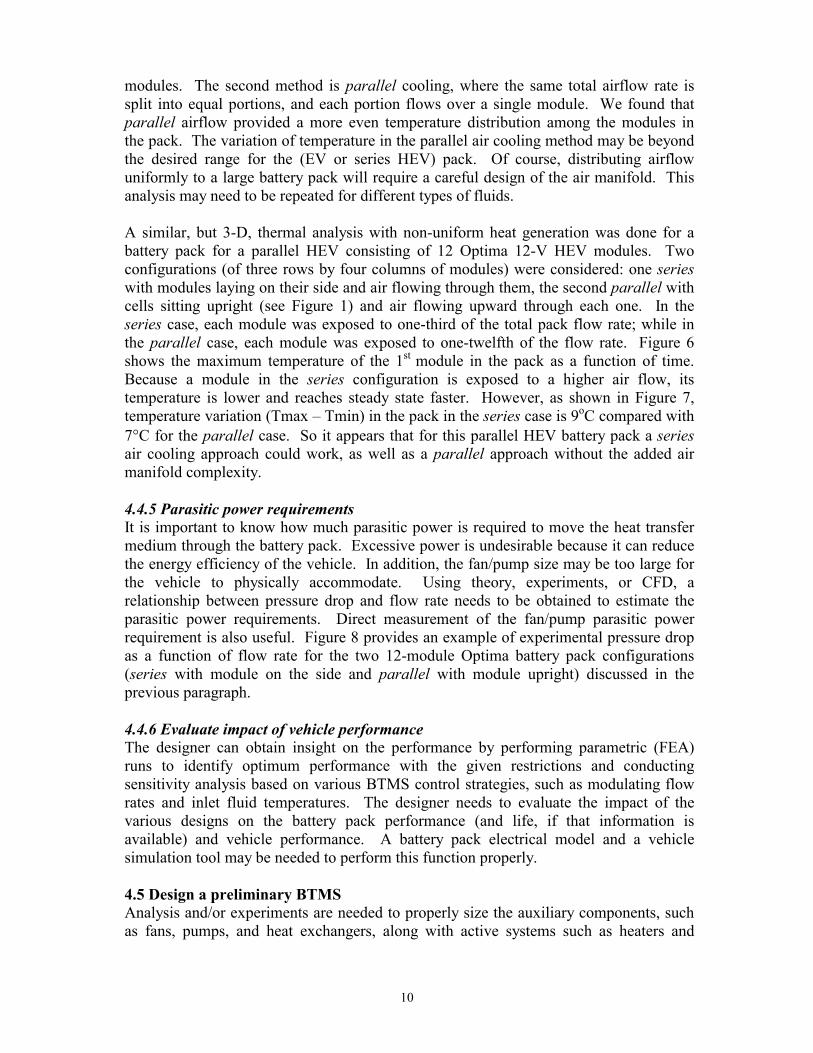
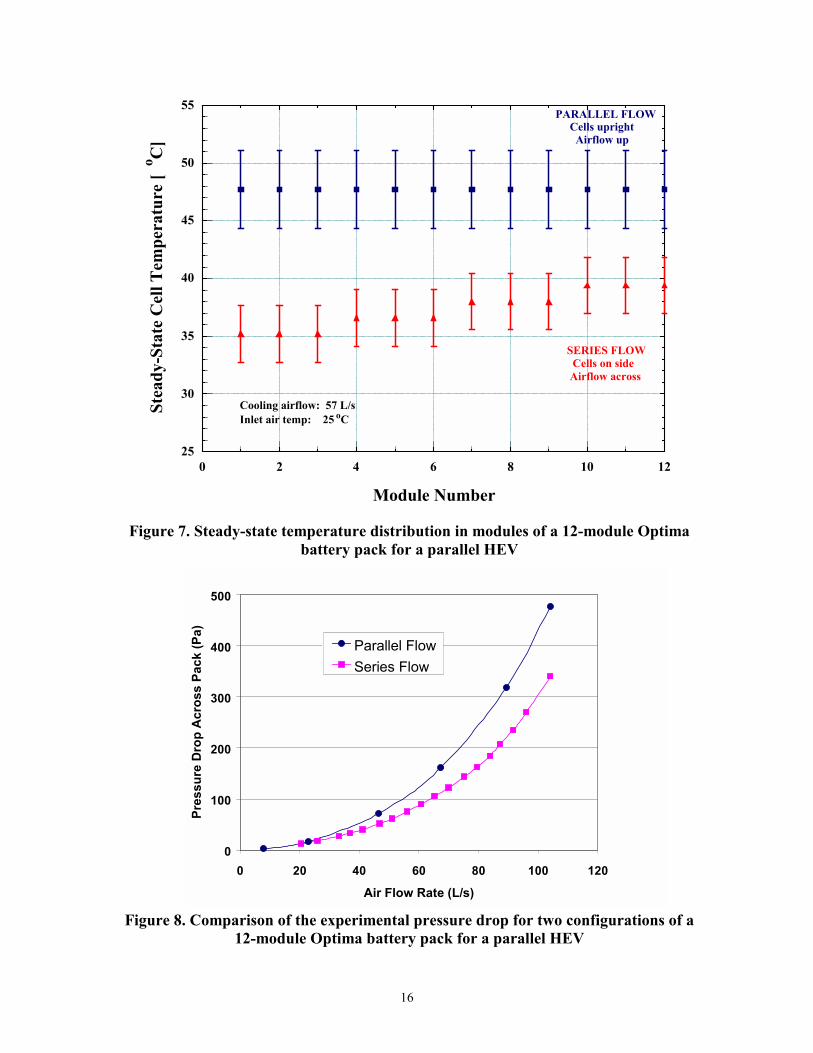
modules. The second method is parallel cooling, where the same total airflow rate is split into equal portions, and each portion flows over a single module. We found that parallel airflow provided a more even temperature distribution among the modules in the pack. The variation of temperature in the parallel air cooling method may be beyond the desired range for the (EV or series HEV) pack. Of course, distributing airflow uniformly to a large battery pack will require a careful design of the air manifold. This analysis may need to be repeated for different types of fluids. A similar, but 3-D, thermal analysis with non-uniform heat generation was done for a battery pack for a parallel HEV consisting of 12 Optima 12-V HEV modules. Two configurations (of three rows by four columns of modules) were considered: one series with modules laying on their side and air flowing through them, the second parallel with cells sitting upright (see Figure 1) and air flowing upward through each one. In the series case, each module was exposed to one-third of the total pack flow rate; while in the parallel case, each module was exposed to one-twelfth of the flow rate. Figure 6 shows the maximum temperature of the 1st module in the pack as a function of time. Because a module in the series configuration is exposed to a higher air flow, its temperature is lower and reaches steady state faster. However, as shown in Figure 7, temperature variation (Tmax � Tmin) in the pack in the series case is 9oC compared with 7°C for the parallel case. So it appears that for this parallel HEV battery pack a series air cooling approach could work, as well as a parallel approach without the added air manifold complexity. 4.4.5 Parasitic power requirements It is important to know how much parasitic power is required to move the heat transfer medium through the battery pack. Excessive power is undesirable because it can reduce the energy efficiency of the vehicle. In addition, the fan/pump size may be too large for the vehicle to physically accommodate. Using theory, experiments, or CFD, a relationship between pressure drop and flow rate needs to be obtained to estimate the parasitic power requirements. Direct measurement of the fan/pump parasitic power requirement is also useful. Figure 8 provides an example of experimental pressure drop as a function of flow rate for the two 12-module Optima battery pack configurations (series with module on the side and parallel with module upright) discussed in the previous paragraph. 4.4.6 Evaluate impact of vehicle performance The designer can obtain insight on the performance by performing parametric (FEA) runs to identify optimum performance with the given restrictions and conducting sensitivity analysis based on various BTMS control strategies, such as modulating flow rates and inlet fluid temperatures. The designer needs to evaluate the impact of the various designs on the battery pack performance (and life, if that information is available) and vehicle performance. A battery pack electrical model and a vehicle simulation tool may be needed to perform this function properly. 4.5 Design a preliminary BTMS Analysis and/or experiments are needed to properly size the auxiliary components, such as fans, pumps, and heat exchangers, along with active systems such as heaters and
11
evaporator coils. A control strategy for operating the BTMS needs to be decided and tried. The designer needs to make a rough estimate of cost of each component and fabrication cost for the BTMS. The design team should take into account the other factors such as maintenance, ease of operation, and reliability. At the end of this step, the designer develops a preliminary BTMS design.
4.6 Build and test a BTMS The battery integrator team builds the battery pack along with the integrated BTMS. The team conducts bench-top pack experiments to validate the thermal model, evaluate the heat transfer and fluid flow performance, check for flow and temperature uniformity within the pack, and fine-tune the BTMS design, such as fan or pump sizing needs (4). Flow visualization, infrared thermal imaging, and other tests may be conducted. The thermal control strategies, which are based on the vehicle's operation strategy at various climates, are evaluated and modified if needed. Finally, the prototype pack/BTMS is installed in the vehicle and tested using a vehicle dynamometer, as discussed here.
4.7 Optimize the BTMS As mentioned before, the designer may need to repeat some of the above steps, considering factors such as battery performance and life, impact on vehicle performance, cost, and ease of maintenance, to arrive at an optimum BTMS. As a general observation, the size of the battery pack and its power charge/discharge profile dictate the design and control strategy of the thermal management system. For EVs and series HEVs, the pack is generally large and its thermal management system may need to be more elaborate, possibly incorporating liquid cooling. However, for parallel HEVs, the pack is generally small and the thermal control could be achieved by a simple air cooling/heating design. 5 CONCLUSIONS A well-designed thermal management system is required to regulate EV and HEV battery pack temperatures evenly, keeping them within the desired operating range. The battery pack thermal management system should have two major features. First, it should provide an environment for all modules to operate in the desired temperature range to result in optimum battery performance and life. Second, it should minimize uneven temperature distribution among the modules in order to minimize electrical imbalance to achieve expected performance. Regulating the module temperatures in a pack could be accomplished in several ways, and each method has its advantages and disadvantages because of constraints imposed by the vehicle�s requirements. Here, we outlined a systematic approach to designing and evaluating a thermal management system. Both thermal analysis and experiments are necessary for designing an optimum thermal management system. A thermal management system using air as the heat transfer medium is less complicated than a system using liquid cooling/heating. Generally, for parallel HEVs, an air thermal management system is adequate, whereas for EVs and series HEVs, liquid-based systems may be required for optimum thermal performance.

12
6 ACKNOWLEDGMENTS This work was supported by DOE�s Hybrid Vehicle Propulsion Program, which is managed by the Office of Advanced Transportation Technologies. The authors wish to thank the DOE program manager, Bob Kost, the NREL HEV technology manager, Terry Penney, and NREL�s GM project manager, Bob Rehn. We also wish to thank Optima Batteries, Inc. and AeroVironment for their collaborations with NREL as part of the GM/DOE HEV program. 7 REFERENCES 1. Pesaran, A.A., Vlahinos, A., Burch, S.D., "Thermal Performance of EV and HEV
Battery Modules and Packs," Proceedings of the 14th International Electric Vehicle Symposium, Orlando, Florida, December 15�17, 1997.
2. Oswald, L.J. and Skellenger, G.D. "The GM/DOE Hybrid Vehicle Propulsion Systems Program: A Status Report,� Proceedings of the 14th International Electric Vehicle Symposium, Orlando, Florida, December 15�17, 1997.
3. Pesaran, A.A., Russell, D.J., Crawford, J.W., Rehn, R., and. Lewis, E.A., "A Unique Calorimeter-Cycler for Evaluating High-Power Battery Modules," Proceedings of the 13th Annual Battery Conference: Applications and Advances, Long Beach, California, January 13�16, 1998.
4. Pesaran, A.A., Swan, D., Olson, J., Guerin, J.T., Burch, S., Rehn, R., Skellenger, G.D., "Thermal Analysis and Performance of a Battery Pack for a Hybrid Electric Vehicle," Proceedings of the 15th International Electric Vehicle Symposium, Brussels, Belgium, October 1�October 3, 1998.
5. Harb, .J.N.; and LaFollette R.M., "Predictions of the Thermal Behavior of a Spirally-Wound Lead-Acid Battery Cell," Proceedings of the 33rd Intersociety Energy Conversion Engineering Conference 98-8, Colorado Springs, CO, Paper No. I-291 (1998).
Figure 1. General construction of an Optima battery
13
Figure 2. Non-uniform heat generation in an Optima HEV module from Harb
and LaFollett (5) (The heat generation from the 0.875 to 1.0 in axial location is heat generated from the cell interconnects.)
a. A section of cell with two lead grid b. A section of cell with grids, separators, positive and negative pastes
Figure 3. A representative geometry of the Optima cell structure for thermal
conductivity analysis (right hand side is the lead grid, left-hand side is grid with paste, and separators)
0.0 0.2 0.4 0.6 0.8 1.0
Normalized Axial (Vertical) Cell Location
2
4
6
8
10
12
Cel
l Hea
t Gen
erat
ion
Rat
e [W
]14

14
Figure 4. Transient and steady-sate (SS) comparison of cooling a module with liquid or air based on a similar parasitic pump/fan power (The top, middle, and
bottom refer to the vertical location of the modules.)
Ttop,SS = 45 oC
Top
Middle
Bottom
Oil CooledHeat generation = 30 W/moduleInitial module temp. = 30 oCInlet oil temp. = 25 oC
0 10 20 30 40 50 60Time [min]
30
35
40
45
50
55
Max
. Cel
l Tem
pera
ture
[o C
]
Air CooledHeat generation = 30 W/moduleInitial module temp. = 30 oC
Ttop,SS = 54 oC
Bottom
Middle
Top
Inlet air temp. = 25 oC
0 10 20 30 40 50 60Time [min]
30
35
40
45
50
55
Max
. Cel
l Tem
pera
ture
[o C]
15
Figure 5. 2-D temperature distribution comparison of series and parallel air cooling
for a pack consisting of 30 rectangular modules
Figure 6. Transient and steady-state thermal analysis of the first module in a 12-module Optima battery pack for a parallel HEV
Air entering at 25°C Air leaving at 38°C
Air entering at 25°C
Air entering at 38°C
Parallel cooling Flow path: verticalTmax = 54°C Tmin = 46 °C
Series cooling Flow path: horizontal Tmax = 58°C Tmin = 40 °C
Steady-State: 51 oC
Steady-State: 38 oC
PARALLEL FLOW Cells upright Airflow up
SERIES FLOW Cells on side Airflow across
Initial cell temp.: 30 oCAirflow: 57 L/s at 25 oC
25
30
35
40
45
50
55
Max
. Cel
l Tem
pera
ture
in M
odul
e #1
[o C
]
0 10 20 30 40 50 60
Time [minutes]
16
Figure 7. Steady-state temperature distribution in modules of a 12-module Optima battery pack for a parallel HEV
Figure 8. Comparison of the experimental pressure drop for two configurations of a 12-module Optima battery pack for a parallel HEV
25
30
35
40
45
50
55
Stea
dy-S
tate
Cel
l Tem
pera
ture
[o C
]
0 2 4 6 8 10 12
Module Number
Cooling airflow: 57 L/sInlet air temp: 25 oC
PARALLEL FLOW Cells upright Airflow up
SERIES FLOW Cells on side Airflow across
0
100
200
300
400
500
0 20 40 60 80 100 120
Air Flow Rate (L/s)
Pres
sure
Dro
p A
cros
s Pa
ck (P
a)
Parallel FlowSeries Flow