
An approach for classification of malignant and benign ...
18
An approach for classification of malignant and benign microcalcification clusters BIRMOHAN SINGH 1, * and MANPREET KAUR 2 1 Department of Computer Science and Engineering, Sant Longowal Institute of Engineering and Technology, Longowal 148106, India 2 Department of Electrical and Instrumentation Engineering, Sant Longowal Institute of Engineering and Technology, Longowal 148106, India e-mail: [email protected]; [email protected] MS received 8 February 2016; revised 7 March 2017; accepted 21 August 2017; published online 16 March 2018 Abstract. The only reliable and successful treatment of breast cancer is its detection through mammography at initial stage. Clusters of microcalcifications are important signs of breast cancer. Manual interpretation of mammographic images, in which the suspicious regions are indicated as areas of varying intensities, is not error free due to a number of reasons. These errors can be reduced by using computer-aided diagnosis systems that result in reduction of either false positives or true negatives. The purpose of the study in this paper is to develop a methodology for distinguishing malignant microcalcification clusters from benign microcalcification clusters. The proposed approach first enhances the region of interest by using morphological operations. Then, two types of features, cluster shape features and cluster texture features, are extracted. A Support Vector Machine is used for classification. A new set of shape features based on the recursive subsampling method is added to the feature set, which improves the classification accuracy of the system. It has been found that these features are capable of differentiating malignant and benign tissue regions. To investigate the performance of the proposed approach, mammogram images are taken from Digital Database for Screening Mammography database and an accuracy of 94.25% has been achieved. The experiments have shown that the proposed classification system minimizes the classification errors and is more efficient in correct diagnosis. Keywords. Microcalcifications; texture features; shape features; hierarchical centroid; Support Vector Machine. 1. Introduction Breast cancer is the second leading cause of female cancer mortality; 16% of all the cancer cases in women are the breast cancer cases. The breast cancer cases in developed countries are very high and it is a serious cause of concern while in case of less developed countries the numbers of cases are continuously rising. The mortality rate is very high in developing countries as compared with developed countries. The low survival rates in developing countries may be due to lack of awareness and early detection [1]. The detection of breast abnormalities at the initial stage is important to increase the survival rate since it restricts a women from entering into further stages of breast cancer. Amongst all the imaging modalities available, mammog- raphy is the most reliable imaging modality to detect breast abnormalities at the early stage [2]. It uses low-dose amplitude X-rays to examine the breast. Cancerous masses and calcium deposits appear brighter on the mammogram. Mammogram images give some indication to the radiolo- gist in detecting the abnormal growth of cells. Mammog- raphy has helped decrease the mortality rate by 25–30% [3]. However, unfortunately, the success rate in the manual screening of the mammogram images is not very high. A number of factors, like human factors, poor quality of imaging, the number of benign cases in comparison to number of malignant cases, number of mammograms in comparison to number of radiologists, etc., are some of the causes for incorrect manual diagnosis [4]; 43% of errors are due to overlooking signs in abnormal scans and 52% of the errors are due to misinterpretation of breast cancer signs [5]. Mass and microcalcifications are two main types of findings that indicate a possibility of cancer in the breast tissue at the early stage. Masses are lesions that may rep- resent a localizing sign of breast cancer. Masses are dense regions and described by location, size, shape and margin characteristics. Microcalcifications are the accumulations of calcium and may show up in clusters or in patterns. They *For correspondence 1 Sådhanå (2018) 43:39 Ó Indian Academy of Sciences https://doi.org/10.1007/s12046-018-0805-2
Transcript of An approach for classification of malignant and benign ...

An approach for classification of malignant and benignmicrocalcification clusters
BIRMOHAN SINGH1,* and MANPREET KAUR2
1Department of Computer Science and Engineering, Sant Longowal Institute of Engineering and Technology,
Longowal 148106, India2Department of Electrical and Instrumentation Engineering, Sant Longowal Institute of Engineering and
Technology, Longowal 148106, India
e-mail: [email protected]; [email protected]
MS received 8 February 2016; revised 7 March 2017; accepted 21 August 2017; published online 16 March 2018
Abstract. The only reliable and successful treatment of breast cancer is its detection through mammography
at initial stage. Clusters of microcalcifications are important signs of breast cancer. Manual interpretation of
mammographic images, in which the suspicious regions are indicated as areas of varying intensities, is not error
free due to a number of reasons. These errors can be reduced by using computer-aided diagnosis systems that
result in reduction of either false positives or true negatives. The purpose of the study in this paper is to develop
a methodology for distinguishing malignant microcalcification clusters from benign microcalcification clusters.
The proposed approach first enhances the region of interest by using morphological operations. Then, two types
of features, cluster shape features and cluster texture features, are extracted. A Support Vector Machine is used
for classification. A new set of shape features based on the recursive subsampling method is added to the feature
set, which improves the classification accuracy of the system. It has been found that these features are capable of
differentiating malignant and benign tissue regions. To investigate the performance of the proposed approach,
mammogram images are taken from Digital Database for Screening Mammography database and an accuracy of
94.25% has been achieved. The experiments have shown that the proposed classification system minimizes the
classification errors and is more efficient in correct diagnosis.
Keywords. Microcalcifications; texture features; shape features; hierarchical centroid; Support Vector
Machine.
1. Introduction
Breast cancer is the second leading cause of female cancer
mortality; 16% of all the cancer cases in women are the
breast cancer cases. The breast cancer cases in developed
countries are very high and it is a serious cause of concern
while in case of less developed countries the numbers of
cases are continuously rising. The mortality rate is very
high in developing countries as compared with developed
countries. The low survival rates in developing countries
may be due to lack of awareness and early detection [1].
The detection of breast abnormalities at the initial stage is
important to increase the survival rate since it restricts a
women from entering into further stages of breast cancer.
Amongst all the imaging modalities available, mammog-
raphy is the most reliable imaging modality to detect breast
abnormalities at the early stage [2]. It uses low-dose
amplitude X-rays to examine the breast. Cancerous masses
and calcium deposits appear brighter on the mammogram.
Mammogram images give some indication to the radiolo-
gist in detecting the abnormal growth of cells. Mammog-
raphy has helped decrease the mortality rate by 25–30%
[3].
However, unfortunately, the success rate in the manual
screening of the mammogram images is not very high. A
number of factors, like human factors, poor quality of
imaging, the number of benign cases in comparison to
number of malignant cases, number of mammograms in
comparison to number of radiologists, etc., are some of the
causes for incorrect manual diagnosis [4]; 43% of errors are
due to overlooking signs in abnormal scans and 52% of the
errors are due to misinterpretation of breast cancer signs
[5].
Mass and microcalcifications are two main types of
findings that indicate a possibility of cancer in the breast
tissue at the early stage. Masses are lesions that may rep-
resent a localizing sign of breast cancer. Masses are dense
regions and described by location, size, shape and margin
characteristics. Microcalcifications are the accumulations
of calcium and may show up in clusters or in patterns. They*For correspondence
1
Sådhanå (2018) 43:39 � Indian Academy of Sciences
https://doi.org/10.1007/s12046-018-0805-2Sadhana(0123456789().,-volV)FT3](0123456789().,-volV)

appear as bright spots on mammograms [6]. Detection of
microcalcifications is difficult as they contain a variable
number of glandular and fatty tissue that may decrease the
visibility of subtle microcalcifications [7, 8].
The most important aspect to differentiate malignant
microcalcifications from benign is the morphology,
including size of calcification, number of calcifications in a
cluster, etc. Large, coarse, round and smooth margin
microcalcifications are benign. Microcalcifications that are
fine, have linear boundaries and appear in clusters are
malignant. Microcalcifications that are found in clusters
have clinical significance [7]. Clustered microcalcifications
are important signs of breast cancer at an earlier stage and
appear in 30–50% of mammograms that are diagnosed.
Only 15–34% of cases sent for biopsy are malignant and
10–30% of actual malignant cases are missed by radiolo-
gists [8]. Double reading by second radiologists can
improve sensitivity of diagnosis, but the dearth of expert
radiologists in comparison with the number of mammo-
grams generated is the major problem.
Computer-aided diagnosis (CAD) systems are the feasi-
ble alternatives that can furnish a second opinion to radi-
ologists for reducing interpretation errors, increasing the
accuracy of diagnosis and improving the consistency of
diagnosis. Two types of system exist: one deals with
detecting and identifying the region of interest (ROI), while
the other deals with classification of abnormality into
benign or malignant [4, 9].
An efficient CAD system to classify microcalcifications
clusters from the breast mammogram images is needed that
can assist in correct identification of malignant clusters. In
this study, the goal is to propose an approach to develop a
system that identifies a ROI as malignant microcalcification
or benign microcalcification cluster since the classification
of microcalcification clusters is difficult due to their over-
lapping properties. The proposed methodology contributes
in preprocessing and use for enhancement, providing a
unique combination of features.
The rest of the paper is organized in sections. Section 2
presents literature review. Section 3 provides the details of
database and datasets employed. Section 4 presents pro-
posed methodology for classification of microcalcification
clusters in detail. Section 5 demonstrates experimental
results, related discussion and compares the classification
results to the work of other researchers. Section 6 draws the
conclusions of this work.
2. Literature review
The presence of microcalcification clusters in a mammo-
gram indicates the primary sign of breast cancer. Manual
screening by radiologists is difficult and time-consuming.
Hence, many researchers have contributed in the develop-
ment and the growth of CAD systems. The researchers who
have explored the area to distinguish malignant and benign
microcalcifications have either used only the texture fea-
tures [10–17], or a combination of texture and shape fea-
tures [4, 18–20]. For extracting the shape-based features,
some researchers have worked to extract shape and topol-
ogy of individual microcalcifications [21, 22]. These fea-
tures become ineffective and do not provide much useful
information when the microcalcifications are very small.
Also, the microcalcifications may have low contrast due to
their presence in the dense breast areas. This makes it
difficult to analyse the shape of individual microcalcifica-
tions. Moreover, it may not provide any distinct texture
features for such areas. Hence, some other researchers have
extracted the shape features for a cluster of microcalcifi-
cations [4, 19, 23].
Microcalcifications are characterized based on their
appearance, characteristics and distribution. Malignant
microcalcifications are generally smaller, denser and more
irregular than benign microcalcifications. A microcalcifi-
cation cluster is an area of 1 cm2 with no fewer than 5
microcalcifications [17]. The distribution of microcalcifi-
cations associated with a malignant structure is different
from that of a benign structure. Malignant microcalcifica-
tions are densely distributed than benign because they lie
within the milk ducts and associated structures. Hence,
these variations in the distribution and closeness of
microcalcifications within a cluster provide useful infor-
mation. Moreover, the tissue texture of microcalcification
cluster associated with a malignant region may be different
from that associated with a benign region. Considering this
as motivation, many texture models in combination with
shape-based feature models have been studied and analysed
so that a better combination of these features may improve
the classification rate to discriminate malignant and benign
microcalcification clusters.
3. Database
To evaluate and test the proposed system the images col-
lected from Image Retrieval in Medical Applications
(IRMA) version of Digital Database for Screening Mam-
mography (DDSM) dataset have been used. One of the four
scanners, DBA M2100 ImageClear (42 lm per pixel, 16
bits), Howtek 960 (43.5 lm per pixel, 12 bits), Lumisys
200 Laser (50 lm per pixel, 12 bits) and Howtek Mul-
tiRad850 (43.5 lm per pixel, 12 bits), was used to digitize a
mammograms image from DDSM database [24].
For classification of microcalcifications, 273 malignant
and 155 benign image patches are taken. These patches
have been manually identified and are annotated by expert
radiologists. Three set of images are constituted. Set1
consists of 80 mammogram regions of interest of size
256 9 256 pixels with 40 malignant and 40 benign
microcalcifications. Set2 contains 130 (79 malignant and 51
39 Page 2 of 18 Sådhanå (2018) 43:39

benign) square regions of 256 9 256 pixels and Set3 con-
tains 218 (154 malignant and 64 benign) rectangular
regions of different sizes. Set1 is used for training purpose
and other sets are used for testing the proposed methodol-
ogy. The details of these sets are given in table 1.
4. Proposed methodology
A system has been proposed to classify microcalcification
clusters into malignant or benign. The proposed system is
based on two types of features: cluster shape features and
cluster texture features. The block diagram of the proposed
system is shown in figure 1. A region of suspicion for
microcalcifications is extracted manually from a mammo-
gram image. This region is enhanced by using morpho-
logical operations. Individual microcalcifications are
identified and cluster is marked. For this cluster region, the
shape of the cluster is identified and based on this shape, the
cluster features are extracted. In order to extract texture
features, a minimum region corresponding to cluster shape
is used. A feature matrix is formed for these features that
are reduced and input to a classifier to distinguish benign
and malignant microcalcification clusters.
One of the suspicious regions with microcalcification
cluster is extracted from Mammogram image
D_4118_1.RIGHT_MLO (figure 2a). This region is further
enhanced by the enhancement procedure discussed in the
next section. Some of the regions enhanced with the pro-
posed methodology are shown in figure 3. To identify a
cluster, the region is converted into a binary image (fig-
ure 2b) and the boundary of the cluster is marked as shown
in figure 2c. The corresponding shape of the cluster is
shown in figure 2d, which is used for extracting the shape-
based features. For extracting the texture features, a mini-
mum cluster area is marked (figure 2e) and this region is
selected for texture features.
4.1 Enhancement of microcalcifications
Microcalcifications are difficult to detect if they are present
in the dense breast area. A proper enhancement method can
remove noise and improve contrast of an image. Various
techniques have been proposed and adopted to enhance
mammogram images by researchers. Most commonly used
techniques are histogram equalization, unsharp masking,
wavelet decomposition, region-based methods, fuzzy set
methods and fractal modelling [4].
The purpose of enhancement is to improve contrast of
microcalcifications clusters with respect to the background.
Histogram modification methods, spatial domain and fre-
quency domain filtering, and mathematical morphology-
based methods are the most common enhancement tech-
niques for mammogram images. However, these methods
Figure 1. Block diagram of proposed computer aided classifi-
cation system for microcalcifications.
Table 1. Set of images for classification of microcalcification
clusters.
Image set Total Malignant Benign
Set1 80 40 40
Set2 130 79 51
Set3 218 154 64
Sådhanå (2018) 43:39 Page 3 of 18 39
enhance the entire image without discrimination, whereas
for effective detection of region, it is necessary to enhance
only specific target regions and not the surrounding tissues
[25]. Researchers have used several morphological contrast
enhancement methods for enhancement of microcalcifica-
tions in mammograms [26–29]. The proposed method
improves the contrast of microcalcification regions solely,
while the background region is suppressed.
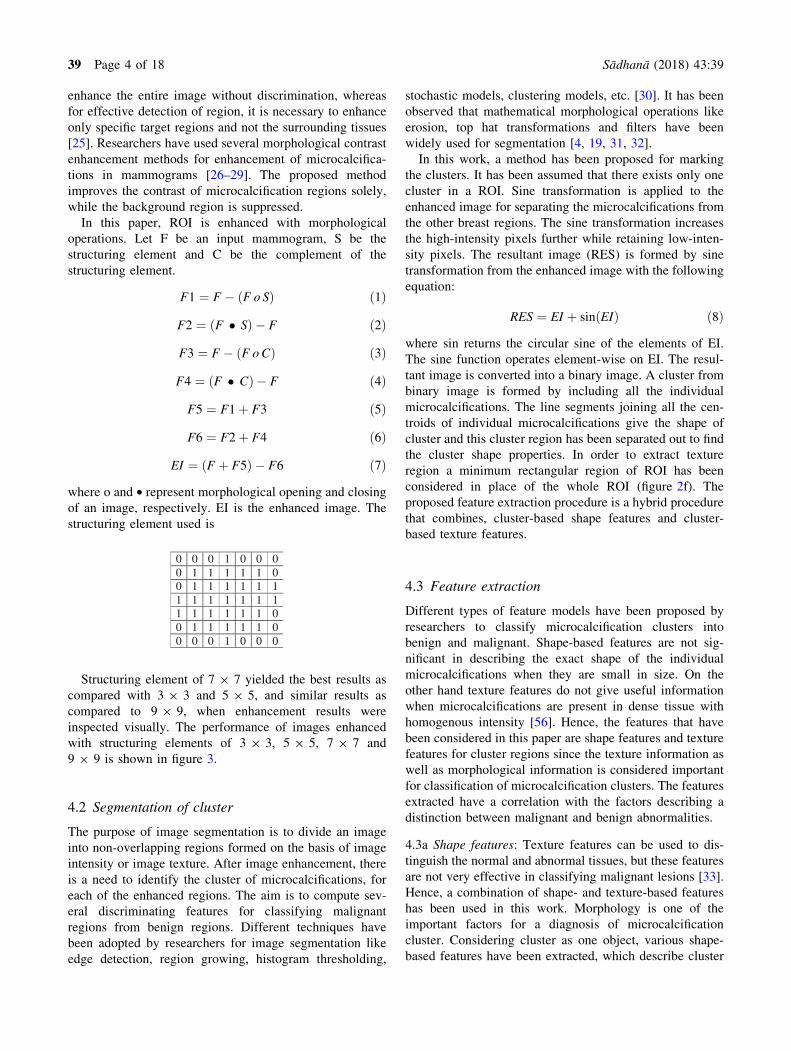
In this paper, ROI is enhanced with morphological
operations. Let F be an input mammogram, S be the
structuring element and C be the complement of the
structuring element.
F1 ¼ F � F o Sð Þ ð1Þ
F2 ¼ F � Sð Þ � F ð2Þ
F3 ¼ F � F oCð Þ ð3Þ
F4 ¼ F � Cð Þ � F ð4Þ
F5 ¼ F1þ F3 ð5Þ
F6 ¼ F2þ F4 ð6Þ
EI ¼ F þ F5ð Þ � F6 ð7Þ
where o and • represent morphological opening and closing
of an image, respectively. EI is the enhanced image. The
structuring element used is
0 0 0 1 0 0 00 1 1 1 1 1 00 1 1 1 1 1 11 1 1 1 1 1 11 1 1 1 1 1 00 1 1 1 1 1 00 0 0 1 0 0 0
Structuring element of 7 9 7 yielded the best results as
compared with 3 9 3 and 5 9 5, and similar results as
compared to 9 9 9, when enhancement results were
inspected visually. The performance of images enhanced
with structuring elements of 3 9 3, 5 9 5, 7 9 7 and
9 9 9 is shown in figure 3.
4.2 Segmentation of cluster
The purpose of image segmentation is to divide an image
into non-overlapping regions formed on the basis of image
intensity or image texture. After image enhancement, there
is a need to identify the cluster of microcalcifications, for
each of the enhanced regions. The aim is to compute sev-
eral discriminating features for classifying malignant
regions from benign regions. Different techniques have
been adopted by researchers for image segmentation like
edge detection, region growing, histogram thresholding,
stochastic models, clustering models, etc. [30]. It has been
observed that mathematical morphological operations like
erosion, top hat transformations and filters have been
widely used for segmentation [4, 19, 31, 32].
In this work, a method has been proposed for marking
the clusters. It has been assumed that there exists only one
cluster in a ROI. Sine transformation is applied to the
enhanced image for separating the microcalcifications from
the other breast regions. The sine transformation increases
the high-intensity pixels further while retaining low-inten-
sity pixels. The resultant image (RES) is formed by sine
transformation from the enhanced image with the following
equation:
RES ¼ EI þ sin EIð Þ ð8Þ
where sin returns the circular sine of the elements of EI.
The sine function operates element-wise on EI. The resul-
tant image is converted into a binary image. A cluster from
binary image is formed by including all the individual
microcalcifications. The line segments joining all the cen-
troids of individual microcalcifications give the shape of
cluster and this cluster region has been separated out to find
the cluster shape properties. In order to extract texture
region a minimum rectangular region of ROI has been
considered in place of the whole ROI (figure 2f). The
proposed feature extraction procedure is a hybrid procedure
that combines, cluster-based shape features and cluster-
based texture features.
4.3 Feature extraction
Different types of feature models have been proposed by
researchers to classify microcalcification clusters into
benign and malignant. Shape-based features are not sig-
nificant in describing the exact shape of the individual
microcalcifications when they are small in size. On the
other hand texture features do not give useful information
when microcalcifications are present in dense tissue with
homogenous intensity [56]. Hence, the features that have
been considered in this paper are shape features and texture
features for cluster regions since the texture information as
well as morphological information is considered important
for classification of microcalcification clusters. The features
extracted have a correlation with the factors describing a
distinction between malignant and benign abnormalities.
4.3a Shape features: Texture features can be used to dis-
tinguish the normal and abnormal tissues, but these features
are not very effective in classifying malignant lesions [33].
Hence, a combination of shape- and texture-based features
has been used in this work. Morphology is one of the
important factors for a diagnosis of microcalcification
cluster. Considering cluster as one object, various shape-
based features have been extracted, which describe cluster
39 Page 4 of 18 Sådhanå (2018) 43:39

Figure 2. For ROI from D_4118_1.RIGHT_MLO (a) Original region. (b) Binary region. (c) Boundary of microcalcification cluster.
(d) Shape of cluster for shape features. (e) Region corresponding to cluster. (f) Extracted corresponding region for texture features.
Sådhanå (2018) 43:39 Page 5 of 18 39

morphology. Shape features provide additional information
about the object; hence, some geometrical features have
been considered [4].
Malignant or benign microcalcification clusters are not
described by some predefined shape patterns. Shape, cur-
vature and size are part of the basic characteristics that can
help in classifying clusters. Malignant clusters are more
likely to be irregular, granular, fine linear and are of small
size. Benign clusters have smooth boundary popcorn-like,
large rod-like, round, lucent-centred and eggshell, and are
of large size [18].
In all, 14 shape-based features have been extracted for
each cluster as listed in table 2 (which shows features
extracted and features selected). The feature reduction
using Differential-Evolution-based Feature Selection
(DEFS) method has been discussed in section 4.4. These
features include number of microcalcifications in a cluster,
area of cluster measured as number of pixels in that region,
maximum diameter measured as length of the major axis of
the ellipse that has the same normalized second central
moments as those of the region, minimum diameter of
cluster measured as length of the minor axis of the ellipse
that has the same normalized second central moments as
those of the region, perimeter measured as distance
between each adjoining pair of pixels around the border of
the region, extent computed as ratio of pixels in the region
to pixels in the total bounding box, eccentricity calculated
as ratio of the distance between the foci of the ellipse (that
has the same second moments as those of the region) to its
major axis length, orientation measured as angle (in
degrees ranging from –90� to 90�) between the x-axis and
the major axis of the ellipse that has the same second
moments as those of the region, solidity, which specifies the
proportion of the pixels in the convex hull that are also in
the region, equivalent diameter, which is specified as the
diameter of a circle with the same area as that of the region,
density computed as ratio of area of microcalcifications to
total area of the cluster, compactness computed as square of
perimeter to area of cluster, mean and standard deviation of
distances of pixels in the cluster from the centre.
Apart from these features, 28 new shape features
extracted by the hierarchical centroid method [34], which is
based on the recursive subsampling method [35] of image,
have been proposed to be added to other shape-based
features.
For a binary image of size m 9 n, subsampling of the
image is performed by iterative subdivision of the image in
such a way that in each subdivision the numbers of fore-
ground and background pixels are approximately balanced.
The original image is first subdivided into sub-images by a
vertical line that further results into four image segments by
a line drawn horizontally in such a way that the absolute
Figure 3. (a) Original image and enhanced images with structuring element of (b) 3 9 3, (c) 5 9 5, (d) 7 9 7, and (e) 9 9 9.
39 Page 6 of 18 Sådhanå (2018) 43:39

difference in the foreground and background pixels is
minimum in each of the subdivisions either horizontally or
vertically. The pixel at the intersection of the two lines is
referred to as the division point (DP). At each iteration step,
sub-image obtained in the previous step is further divided
into four sub-images using the same procedure. Iterations
are levels of granularity (L), and at level L, the co-ordinates
of all DPs are stored as features.
Hence, for every L, the dimensional feature vector is
extracted. The larger the L, the better the representation of
the region obtained, but this increases computation over-
heads [35]. Thus, 28 features based on the hierarchical
centroid method are extracted. Best results for the hierar-
chical centroid method are achieved with values of granu-
larity (L) considered equal to 4.
4.3b Texture features: Texture is a major component to
represent the properties to distinguish the texture and it
exists for a region rather than a pixel or a point. Analysis of
texture proves to be important in many applications, espe-
cially medical imaging, and medical image processing [36].
To distinguish benign and malignant microcalcifications,
various researchers have proposed different approaches to
compute texture features extracted from a region that
contains microcalcifications. The most commonly used
texture features are GLCM-based texture features
[10, 13, 19], SGLD-based texture features [11], GLRLM-
based texture features [10], LBP-based texture features
[15], Gabor texture features [9, 14] and wavelet-based
texture features [19, 20].
In this paper different texture features are extracted and
evaluated for each cluster region. The texture features that
have been extracted in this work are Haralick texture, Laws
texture, fractal texture, Adaptive Local Binary Patterns
(ALBP) features and Statistical Feature Matrix (SFM)
texture.
Haralick texture [37] measures are based on second-
order statistics of grey level histograms, which is accom-
plished with the help of GLCM. The features are calculated
for distance (d) 1–4 and orientation 0�, 45�, 90� and 135�.Thus, for each suspected region, 208 texture features have
been extracted. Haralick features 1–52 correspond to the
features for d=1 and orientation 0�, 45�, 90� and 135�.Haralick features 53–104 correspond to features for d=2
and orientation 0�, 45�, 90� and 135�, and similarly the
features 105–156 for d=3 and features 157–208 for d=4. To
decrease the computational complexity, the performance of
these features has been checked by considering distances
separately; it has been observed experimentally that d=1
gives better performance than d=2, d=3 and d=4. Thus, 52
features have been extracted for d=1 and orientations 0�,45�, 90� and 135�. The details of Haralick features
extracted and the corresponding features selected for the
angles mentioned for d=1 have been shown in table 3.
Laws texture features [38] are used in many applica-
tions and are computed by convolving the image with a
number of small masks. To detail the microstructures of
textures, Laws texture features are extracted with convo-
lution masks of 5 9 5, where masks are a combination of
basic mnemonics corresponding to Level (L5), Edge (E5),
Spot (S5), Wave (W5) and Ripple (R5). Texture features
have been extracted by filtering the images with each one
of 25 Laws masks or kernels (table 4). Averaging the
filtered images, 14 texture energy (TE) images are
formed. For these 14 TE images, one first-order statistic
that is the average intensity of image has been considered,
thereby resulting in 14 Laws texture features. Laws tex-
ture array contains 14 output values in the sequence EE,
SS, WW, RR, EL, SL, WL, RL, SE, WE, RE, WS, RS
and RW.
Fractals measure geometric complexity to describe spa-
tial patterns of texture. Fractals refer to complex patterns
that occur at various scales. Fractal dimensions and fractal
signatures are significant in texture analysis [39]. Based on
the multi-resolution fractal dimensions, a new set of fea-
tures has been proposed by authors of [40], which is also
been called a set of fractal features (FF). Using this, two
Hurst coefficients have been extracted for each cluster
region.
Local Binary Patterns (LBP) are greyscale-invariant
texture measures derived from a general definition of tex-
ture in a local neighbourhood. LBP combines characteris-
tics of statistical and structural texture analysis. Estimation
errors of local differences have been reduced in ALBP and
are relatively insensitive to variations in illuminations [41].
ALBP texture features have been extracted for each cluster
region.
Apart from this, features based on SFM [36] have been
extracted. Four visual-perceptual features, coarseness,
contrast, periodicity and roughness have been extracted for
each cluster region.
Table 2. Details of shape features.
Sl.
no. Shape features extracted Selected
1 Number of calcifications Yes
2 Area of cluster Yes
3 Compactness Yes
4 Density No
5 Maximum diameter of cluster Yes
6 Minimum diameter of cluster No
7 Perimeter Yes
8 Mean of all calcification distances from center No
9 Std. dev. of all calcification distances from
center
Yes
10 Extent Yes
11 Eccentricity No
12 Orientation Yes
13 Solidity Yes
14 Equivalent diameter No
Sådhanå (2018) 43:39 Page 7 of 18 39

4.4 Feature reduction
Feature reduction is to remove redundant features from
high-dimensional feature sets. A good feature selection
method reduces computational cost, increases its classifi-
cation accuracy and improves result comprehensibility
[42]. Generally, Genetic Algorithms (GA), Sequential
Forward Selection (SFS) Method, Sequential Backward
Selection (SBS) Method, Principal Component Analysis
(PCA), Independent Component Analysis (ICA) and Fisher
Discriminant Analysis (FDA) are some of the techniques
used by researchers.
A feature set is prepared by collecting all cluster shape
and cluster texture features. Some of these features may be
redundant, which may affect the performance of classifier
as well as increase the complexity. In this paper, the DEFS
method has been used for dimensionality reduction and 145
features have been selected, which yield the best output.
Differential-evolution-based algorithms do global opti-
mized searching and do lead to nesting effects. These
algorithms do better optimal optimization than the other
methods [43]. The numbers of control parameters, in dif-
ferential-evolution-based methods, are very few and space
complexity is also less [44]. DEFS is a relatively novel
optimization technique to solve numerical optimization
problems and has been used by various researchers in dif-
ferent types of problems [45–47].
In the DEFS method, the researchers presented a pro-
cedure to overcome the problem of dimensionality. They
presented a selection method that utilized a combination of
the differential evolution optimization and proposed a
repair mechanism based on feature distribution measures.
The probabilities of a combination of features were
checked to give an optimum set. This was used to help the
selection of the wavelet packet transform that was best
suited for classification [48].
The DEFS method does not select the appropriate num-
ber of features automatically, so the number of suit-
able features has to be selected. The approach that has been
adopted is based on selection of minimum and maximum
number of features. Features are extracted from minimum
to maximum range with a fixed step. The features that yield
better accuracy are selected. Again, accuracy is checked for
these features to finalize those features that result in the best
accuracy. A pseudo-code for procedure to select features
with DEFS method is shown here:
Input: Training and test data, No. of features, Desired no.
of features, Population Size
Output: Selected No. of features
a) Set MIN, for minimum number of features
b) Set MAX, for maximum number of features
c) Repeat for set = MIN to MAX step 10
i. Select feature[set] with DEFS method
ii. Compute accuracy [set] with SVM for feature[set]
d) Select highest value of accuracy[k] and corresponding
feature[k] such that k [ set and MIN B k B MAX
e) Repeat for subset = k-10 to k?10 step 1
i. Select feature[subset] with DEFS method
ii. Compute accuracy [subset] with SVM for
feature[subset]
f) Select feature [m] with the highest value of accu-
racy[m] such that k-10 B m B k?10
In this work, 115 features have been extracted for each
suspicious region. The desired numbers of features are
selected for this feature set in a two-phase process using the
DEFS method. In the first phase, features are computed
from 25 to 95 with a gap of 10 with the Naıve Bayes
method and for 100 iterations. Classification accuracy has
been computed for all these 8 sets of features. A set with 70
features gave the best performance out of these 8 sets.
Hence, in the next phase, all the features are computed from
66 to 74. From this new subset, a feature set with 71 fea-
tures yielded the best accuracy. The summary of features
extracted and features selected are given in table 5.
From a set of 14 shape-based features, 9 features have
been selected. Apart from these, 15 features have been
selected from hierarchical centroid features. These features
Table 3. Details of Haralick features.
Sl. no. Extracted Haralick features Features selected
1. Energy 0�, 45�, 135�2. Contrast 45�, 135�3. Correlation 90�, 135�4. Sum of variance 0�, 45�5. Inverse difference moment 0�, 45�, 90�6. Sum average 0�, 135�7. Sum variance 45�, 90�8. Sum entropy 0�, 45�9. Entropy 0�, 45�, 90�, 135�10. Difference variance 0�, 90�11. Entropy difference 0�, 45�, 90�, 135�12. Info measure of correlation I 0�, 90�13. Info measure of correlation II 90�, 135�
Table 4. Details of Law’s texture features.
Sl.
no. Law’s texture features extracted Features selected
1. Average intensity of the image with
EE, SS, WW, RR, EL, SL, WL, RL,
SE, WE, RE, WS, RS and RW
Average intensity
of the image
with
EE, WW, EL, SL,
WL, RL, RS and
RW
39 Page 8 of 18 Sådhanå (2018) 43:39

are in correlation with the shape and morphology of clus-
ters. Out of the 52 Haralick-based texture features, 32
features have been selected. These features have been used
by most of the researchers in detection as well as classifi-
cation of microcalcifications [13, 19]. In all, 8 Laws texture
features have been selected. These features measure
intensity of TE images formed, which is different for
malignant and benign clusters. Hurst coefficients give
approximation of fractal dimension for mammogram ima-
ges. Hurst coefficients in fractal features discriminate tex-
ture surface on the basis of roughness. Roughness is
different for malignant and benign microcalcification
regions. Hurst’s coefficients are more useful in fatty
regions. LBP performs better in dense breasts. There are
variations in continuity of benign and malignant micro-
calcifications. Benign regions represent uniform LBP pat-
terns, which have limited discontinuity as compared with
malignant regions. SFM texture model is useful to describe
surface textures. These features are very sensitive to the
grey level variations in the image. Small variations in the
texture of benign and malignant regions have reflections on
these features.
4.5 Classification
Various classifiers have been proposed for classification of
microcalcification clusters into malignant and benign. Most
of these classifiers are of supervised type. Support Vector
Machines (SVMs) [4, 5, 8], Artificial Neural Networks
[14], K-Nearest Neighbours [11], Bayesian classifiers [49],
decision tree [5], Self-Adaptive Resource Allocation Net-
work (SRAN) [9], etc. are some of the classifiers used in
detection and diagnosis. The classification problem con-
sidered in this research is a two-class pattern classification
that the output is either malignant or benign. Performance
of SVM for unknown data is satisfactory as shown by many
researchers and hence selected. SVM is a procedure based
on structural learning theory that minimizes generalization
error. The performance of SVM was evaluated for linear,
Gaussian and polynomial kernels with testing variations of
cost parameter C and kernel parameters. The best output is
yielded by SVM with linear kernel function and Sequential
Minimal Optimization (SMO) method.
5. Results and discussion
For training and testing, the proposed diagnosis system
mammogram images are taken from DDSM database. The
region of suspicion is manually extracted from a mammo-
gram image. The region extracted from the mammogram is
enhanced with morphological operations.
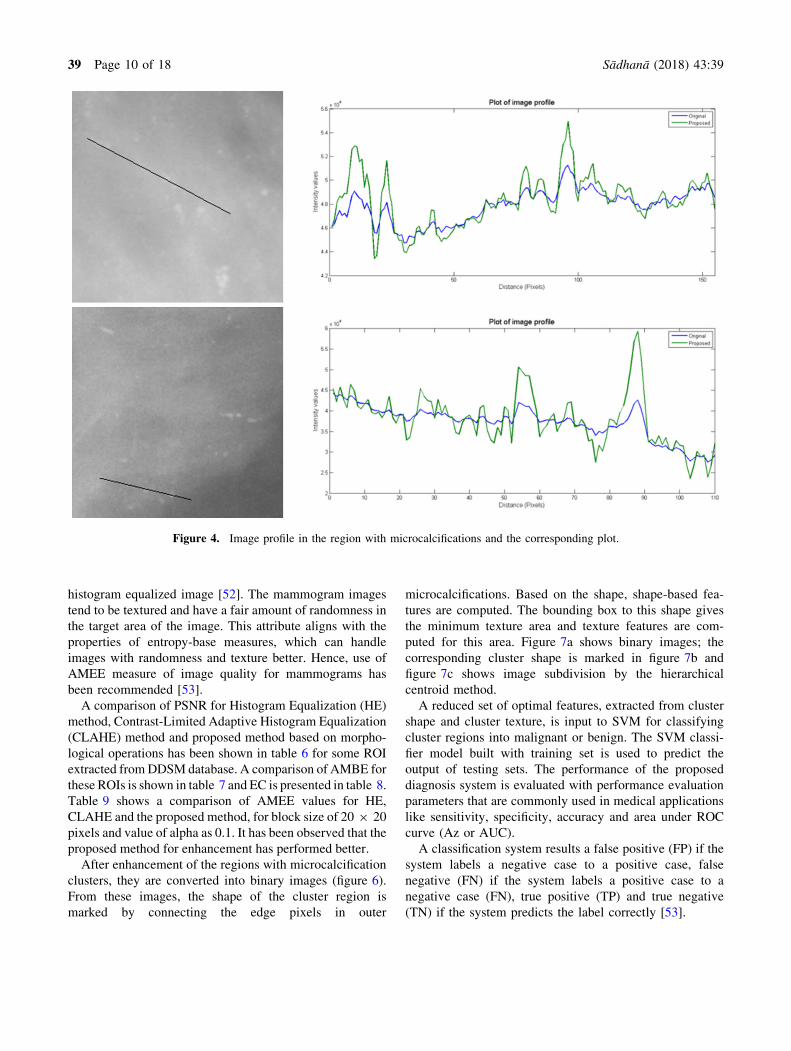
It has been observed that microcalcifications are difficult
to detect due to complex background. Enhancement algo-
rithms may enhance undesired objects in the background
like vessels or glands. The procedure proposed improves
the contrast of microcalcifications but removes undesired
objects as well. The image profile method [29] has been
used to check the improvement of foreground objects. For a
region, image profile along a straight line has been taken
from two places: one where there exists more number of
microcalcifications, and the other where there is less
probability of microcalcifications. Figure 4 shows two
regions for which profiles are taken along the line indicated
and are plotted. The plot of image profile shows original
intensity values as well as intensity values after enhance-
ment by the proposed method. It is shown that enhancement
highlights probable microcalcification locations and
increases the contrast of these locations while there is no
enhancement of the background region and the contrast of
such areas remains approximately the same after
enhancement.
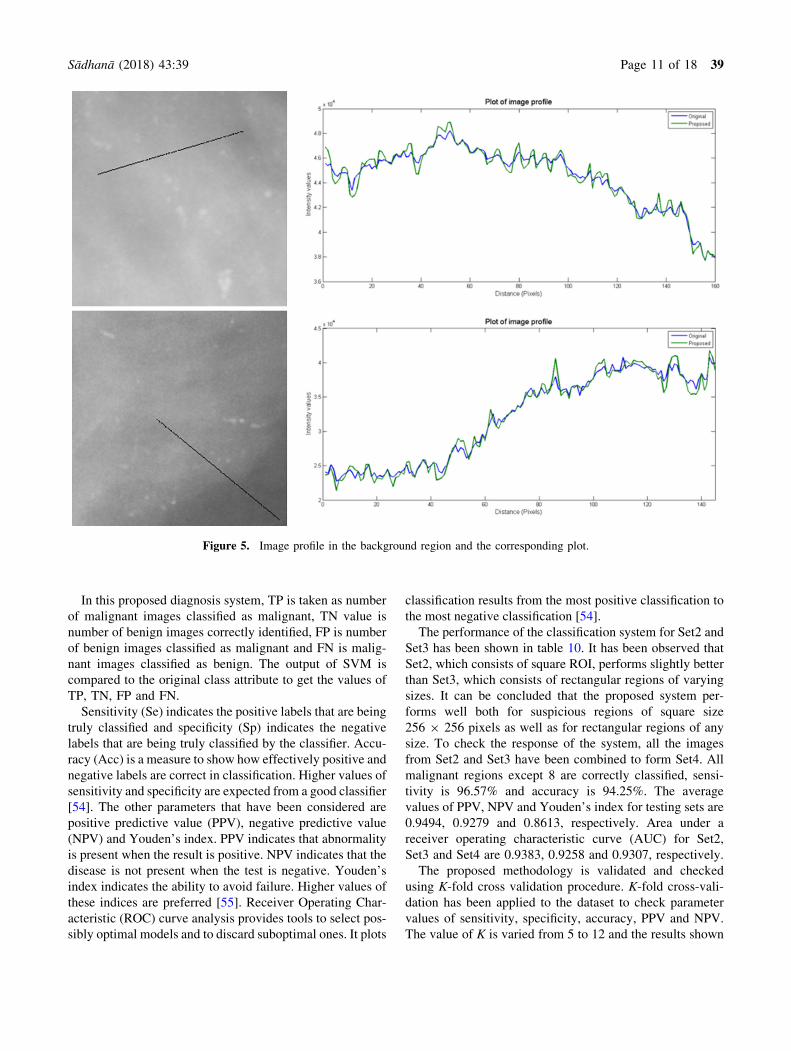
Similarly, another profile along the region of normal area
is taken for these two images. Plots of image profile
showing original intensity values and intensity values after
enhancement are shown in figure 5. It is shown that there is
no enhancement of the background region and the contrast
of such areas remains more or less the same after
enhancement.
Further, the quantitative performance analysis was per-
formed based on metrics of contrast evaluation, Peak Signal
to Noise Ratio (PSNR), Absolute Mean Brightness Error
(AMBE), Edge-Content-based contrast metric (EC) and
Michelson law measure of enhancement by entropy
(AMEE).
PSNR indicates a smaller difference between the original
and enhanced image. This metric is the most widely used to
measure quality of resultant image [50, 51]. AMBE is a
measure of change in the global appearance of the image by
computing the deviation of the mean intensity of the
enhanced image from the mean intensity of the original
image. For better results, lower values of AMBE are
desired [52]. EC accumulates the contrast changes, giving a
quantitative measure for enhancement of the contrast
achieved. This gives an objective measure of detail
enhancements and their higher value corresponds to the
Table 5. Set of features used in classification.
Sl. no. Feature Total features Features selected
1 Shape based 14 9
2 Hierarchical centroid 28 15
3 Haralick texture 52 32
4 Laws texture 14 08
5 Fractal texture 02 02
6 ALBP texture 01 01
7 SFM texture 04 04
Sådhanå (2018) 43:39 Page 9 of 18 39
histogram equalized image [52]. The mammogram images
tend to be textured and have a fair amount of randomness in
the target area of the image. This attribute aligns with the
properties of entropy-base measures, which can handle
images with randomness and texture better. Hence, use of
AMEE measure of image quality for mammograms has
been recommended [53].
A comparison of PSNR for Histogram Equalization (HE)
method, Contrast-Limited Adaptive Histogram Equalization
(CLAHE) method and proposed method based on morpho-
logical operations has been shown in table 6 for some ROI
extracted fromDDSM database. A comparison of AMBE for
these ROIs is shown in table 7 and EC is presented in table 8.
Table 9 shows a comparison of AMEE values for HE,
CLAHE and the proposed method, for block size of 20 9 20
pixels and value of alpha as 0.1. It has been observed that the
proposed method for enhancement has performed better.
After enhancement of the regions with microcalcification
clusters, they are converted into binary images (figure 6).
From these images, the shape of the cluster region is
marked by connecting the edge pixels in outer
microcalcifications. Based on the shape, shape-based fea-
tures are computed. The bounding box to this shape gives
the minimum texture area and texture features are com-
puted for this area. Figure 7a shows binary images; the
corresponding cluster shape is marked in figure 7b and
figure 7c shows image subdivision by the hierarchical
centroid method.
A reduced set of optimal features, extracted from cluster
shape and cluster texture, is input to SVM for classifying
cluster regions into malignant or benign. The SVM classi-
fier model built with training set is used to predict the
output of testing sets. The performance of the proposed
diagnosis system is evaluated with performance evaluation
parameters that are commonly used in medical applications
like sensitivity, specificity, accuracy and area under ROC
curve (Az or AUC).
A classification system results a false positive (FP) if the
system labels a negative case to a positive case, false
negative (FN) if the system labels a positive case to a
negative case (FN), true positive (TP) and true negative
(TN) if the system predicts the label correctly [53].
Figure 4. Image profile in the region with microcalcifications and the corresponding plot.
39 Page 10 of 18 Sådhanå (2018) 43:39
In this proposed diagnosis system, TP is taken as number
of malignant images classified as malignant, TN value is
number of benign images correctly identified, FP is number
of benign images classified as malignant and FN is malig-
nant images classified as benign. The output of SVM is
compared to the original class attribute to get the values of
TP, TN, FP and FN.
Sensitivity (Se) indicates the positive labels that are being
truly classified and specificity (Sp) indicates the negative
labels that are being truly classified by the classifier. Accu-
racy (Acc) is a measure to show how effectively positive and
negative labels are correct in classification. Higher values of
sensitivity and specificity are expected from a good classifier
[54]. The other parameters that have been considered are
positive predictive value (PPV), negative predictive value
(NPV) and Youden’s index. PPV indicates that abnormality
is present when the result is positive. NPV indicates that the
disease is not present when the test is negative. Youden’s
index indicates the ability to avoid failure. Higher values of
these indices are preferred [55]. Receiver Operating Char-
acteristic (ROC) curve analysis provides tools to select pos-
sibly optimal models and to discard suboptimal ones. It plots
classification results from the most positive classification to
the most negative classification [54].
The performance of the classification system for Set2 and
Set3 has been shown in table 10. It has been observed that
Set2, which consists of square ROI, performs slightly better
than Set3, which consists of rectangular regions of varying
sizes. It can be concluded that the proposed system per-
forms well both for suspicious regions of square size
256 9 256 pixels as well as for rectangular regions of any
size. To check the response of the system, all the images
from Set2 and Set3 have been combined to form Set4. All
malignant regions except 8 are correctly classified, sensi-
tivity is 96.57% and accuracy is 94.25%. The average
values of PPV, NPV and Youden’s index for testing sets are
0.9494, 0.9279 and 0.8613, respectively. Area under a
receiver operating characteristic curve (AUC) for Set2,
Set3 and Set4 are 0.9383, 0.9258 and 0.9307, respectively.
The proposed methodology is validated and checked
using K-fold cross validation procedure. K-fold cross-vali-
dation has been applied to the dataset to check parameter
values of sensitivity, specificity, accuracy, PPV and NPV.
The value of K is varied from 5 to 12 and the results shown
Figure 5. Image profile in the background region and the corresponding plot.
Sådhanå (2018) 43:39 Page 11 of 18 39

in table 11 are averages of 10 iterations. Best results are
achieved at K=10, having an accuracy of 94.48% with
sensitivity 95.76% and specificity 93.75% for Set4.
The analysis of features proposed is also presented. The
hierarchical centroid-based features have been proposed to
be added in the cluster shape features set. ALBP features
are included in the texture feature set. The performance of
features is evaluated separately for all the ROIs and is
summarized in table 12.
From the experimental results, it has been observed that
only cluster shape or only Haralick texture features or their
combination are not sufficient for effective classification
results. The accuracy of the system has increased from
72.70% to 87.36% when Laws, fractal and other texture
features (coarseness, contrast, periodicity and roughness)
Figure 6. (a) Original image. (b) Enhanced image. (c) Binary image.
Table 6. PSNR for some regions extracted from DDSM.
Image HE CLAHE Proposed
C_0106_1.LEFT_MLO 58.4803 75.6056 79.5648
A_1850_1.RIGHT_CC 60.0497 74.7241 80.9637
A_1894_1.RIGHT_MLO 58.9177 77.7478 83.6822
A_1906_1.LEFT_CC 57.1266 77.4348 84.3075
A_2000_1.RIGHT_MLO 59.7120 74.6883 82.0559
B_3060_1.RIGHT_CC 59.1082 73.3462 79.7949
D_4117_1.LEFT_CC 58.6364 76.4780 81.9159
D_4147_1.LEFT_CC 59.5113 77.4472 85.1725
D_4158_1.LEFT_MLO 58.4538 76.5753 82.9423
D_4190_1.RIGHT_CC 59.1168 76.9143 81.6329
D_4193_1.LEFT_MLO 62.9104 73.3570 82.2182
D_4200_1.RIGHT_CC 58.9035 77.0496 83.7920
39 Page 12 of 18 Sådhanå (2018) 43:39

are included in texture features. The ALBP feature, which
has been added to texture features, improves the accuracy
to 1.3%. There is an improvement of 6.1% when the pro-
posed hierarchical centroid features are added to cluster
shape features. The overall sensitivity and specificity of the
system are, respectively, 96.57% and 89.57%. The perfor-
mance of ALBP and hierarchical centroid features is shown
in figure 8.
A comparison of the proposed work is done with earlier
work carried out by other researchers. A direct comparison
however is not a simple task since different researchers
have used different mammography databases, datasets,
features and classifiers. Hence, a comparison on the basis of
sensitivity, specificity, accuracy and AUC is prepared for
the authors who have worked on the DDSM dataset, in
table 13.
In 2007, authors of [10] suggested that texture analysis of
tissues surrounding microcalcifications contributes in CAD
of breast cancer. They extracted textural features (first-
order statistics, co-occurrence matrices features, run length
matrices features and Laws’ TE measures) and they
achieved sensitivity 94.4% and specificity 80.0% for the
mammograms collected from DDSM database. In 2013,
authors of paper [20] used mammograms from MIAS as
well as from DDSM database. They extracted seven fea-
tures based on cluster shape (cluster maximum diameter,
the cluster minimum diameter, the number of microcalci-
fications, the cluster area, the cluster perimeter, the cluster
compactness and eccentricity). The sensitivity achieved
was 93.5% and accuracy was 94.2%. In 2014, authors of
work [12] proposed a method based on mereotopological
barcode analysis and achieved an accuracy of 80%. In
2015, authors of [56] proposed a method based on topo-
logical structures and achieved an accuracy of 86% and
area under ROC curve of 0.91.
Shape-based features do not successfully describe the
morphological properties when the size of individual
microcalcifications is only a few pixels. When microcalci-
fications are present in dense breast tissue areas, where
intensity is homogenous and contrast is low, texture fea-
tures do not provide much useful information. Hence, a
combination of shape and texture features has been pro-
posed and it has improved the classification performance of
the system. The overall accuracy achieved is 94.25% and
AUC is 0.9307. The results achieved with the proposed
system show an improvement in classification performance
over that of the other researchers.
6. Conclusions
In this paper, the objective is to propose an approach for
classification of ROI that contains microcalcification
cluster as malignant or benign and then to compare the
performance with that of the work of other researchers,
since the microcalcifications are difficult to detect, from
the complex background. In the first step, ROI is enhanced
Table 7. AMBE for some regions extracted from DDSM.
Image HE CLAHE Proposed
C_0106_1.LEFT_MLO 0.1530 0.0155 0.0005
A_1850_1.RIGHT_CC 0.0040 0.0102 0.0002
A_1894_1.RIGHT_MLO 0.1515 0.0093 0.0001
A_1906_1.LEFT_CC 0.2325 0.0151 0.0001
A_2000_1.RIGHT_MLO 0.1399 0.0213 0.0004
B_3060_1.RIGHT_CC 0.1523 0.0266 0.0001
D_4117_1.LEFT_CC 0.1377 0.0134 0.0002
D_4147_1.LEFT_CC 0.0970 0.0060 0.0002
D_4158_1.LEFT_MLO 0.1625 0.0179 0.0003
D_4190_1.RIGHT_CC 0.0633 0.0077 0.0005
D_4193_1.LEFT_MLO 0.0314 0.0239 0.0003
D_4200_1.RIGHT_CC 0.1036 0.0200 0.0001
Table 8. EC for some regions extracted from DDSM.
Image HE CLAHE Proposed
C_0106_1.LEFT_MLO 58.8118 96.3811 120.2692
A_1850_1.RIGHT_CC 57.5173 86.4948 108.9398
A_1894_1.RIGHT_MLO 75.4928 106.8939 139.2245
A_1906_1.LEFT_CC 55.1244 111.0340 135.1656
A_2000_1.RIGHT_MLO 84.1668 96.4676 125.4928
B_3060_1.RIGHT_CC 75.8328 92.6799 119.2417
D_4117_1.LEFT_CC 55.0442 94.1932 119.5227
D_4147_1.LEFT_CC 70.0381 110.5149 139.0193
D_4158_1.LEFT_MLO 59.4270 92.8542 117.0755
D_4190_1.RIGHT_CC 54.2252 98.6233 116.6115
D_4193_1.LEFT_MLO 113.6033 98.2050 136.6367
D_4200_1.RIGHT_CC 55.2444 116.5465 139.4533
Table 9. AMEE for some regions extracted from DDSM.
Image Original HE CLAHE Proposed
C_0106_1.LEFT_MLO 0.0851 0.0199 0.0590 0.0610
A_1850_1.RIGHT_CC 0.0770 0.0224 0.0502 0.0550
A_1894_1.RIGHT_MLO 0.0884 0.0333 0.0645 0.0696
A_1906_1.LEFT_CC 0.0945 0.0260 0.0704 0.0754
A_2000_1.RIGHT_MLO 0.0829 0.0343 0.0591 0.0648
B_3060_1.RIGHT_CC 0.0824 0.0291 0.0555 0.0595
D_4117_1.LEFT_CC 0.0864 0.0173 0.0602 0.0657
D_4147_1.LEFT_CC 0.0883 0.0345 0.0652 0.0712
D_4158_1.LEFT_MLO 0.0885 0.0224 0.0635 0.0688
D_4190_1.RIGHT_CC 0.0864 0.0109 0.0606 0.0627
D_4193_1.LEFT_MLO 0.0733 0.0479 0.0515 0.0557
D_4200_1.RIGHT_CC 0.0924 0.0230 0.0695 0.0711
Sådhanå (2018) 43:39 Page 13 of 18 39

Figure 7. (a) Binary image. (b) Cluster shape. (c) Image subdivision with hierarchical centroid.
Table 10. Performance evaluation parameters of image sets.
Image sets TP TN FP FN Sensitivity Specificity Accuracy PPV NPV Youden’s index
Set 2 77 46 5 2 0.9747 0.9020 0.9462 0.9390 0.9583 0.8766
Set 3 148 57 7 6 0.9610 0.8906 0.9404 0.9548 0.9048 0.8517
Set 4 225 103 12 8 0.9657 0.8957 0.9425 0.9494 0.9279 0.8613
39 Page 14 of 18 Sådhanå (2018) 43:39

with morphological operations. A visual as well as para-
metric evaluation of enhanced regions shows encouraging
results. The parameters that have been used for evaluation
are PSNR, AMBE, EC and AMEE. In the next step, for
these regions, features based on cluster shape and cluster
texture have been extracted. A new set of features, based
on recursive subsampling method, has been used in
combination with the other shape-based features. These
features have been reduced with the DEFS method and
SVM has been used for classification based on these
reduced features. The performance of the shape-based and
texture-based features has been analysed. It has been
concluded that a combination of shape-based and texture-
based features performs better than either shape-based or
texture-based features alone. It has been observed that
hierarchical centroid-based features improve the classifi-
cation performance of the system (sensitivity from 90.99%
to 96.57%, specificity from 83.48% to 89.57% and accu-
racy from 88.51% to 94.25%). The overall accuracy of
classification system is 94.25% and AUC is 0.9307. The
unique combination of features extracted has a correlation
with the factors describing a distinction between malig-
nant and benign cluster regions. The performance of the
system is validated by comparing the performance
parameters of the proposed system with earlier work of the
other researchers. A substantial fraction of malignant
cases is diagnosed correctly and thereby proposed
methodology increases the probability of a correct diag-
nosis and thus helps in reducing the number of unneces-
sary biopsies. In continuation of this work, in future,
emphasis will also be given on individual microcalcifi-
cation features along with the cluster shape features to
improve the performance of the system.
Table 13. The proposed system in comparison with other classification systems.
Paper and
author Year Database Features used Classifier
Sensitivity
(%)
Specificity
(%)
Accuracy
(%) AUC
Karahaliou
et al
2007 DDSM Textural KNN 94.40 80.00
D’Aloia et al 2013 MIAS and
DDSM
Cluster shape SVM 93.50 94.20
Strange et al 2014 DDSM Discrete
mereotopology
Mereotopological
barcodes
80.00 0.82
Chen et al 2015 DDSM Graph theoretical KNN 86.00 0.91
Proposed
method
2016 DDSM Shape and texture SVM 96.57 89.57 94.25 0.93
Table 12. Performance of different features.
Features Sensitivity Specificity Accuracy PPV NPV
Youden’s
index
Shape (without hierarchical centroid) 0.5279 0.8696 0.6408 0.8913 0.4762 0.3975
Haralick 0.7210 0.7478 0.7299 0.8528 0.5695 0.4689
Shape (without hierarchical centroid), Haralick 0.6481 0.8870 0.7270 0.9207 0.5543 0.5350
Texture (without ALBP) 0.7940 0.8174 0.8017 0.8981 0.6620 0.6114
Shape (without hierarchical centroid), texture (without ALBP) 0.8970 0.8261 0.8736 0.9127 0.7983 0.7231
Shape(without hierarchical centroid), texture 0.9099 0.8348 0.8851 0.9177 0.8205 0.7447
All shape and all texture 0.9657 0.8957 0.9425 0.9494 0.9279 0.8613
Table 11. Performance evaluation parameters using K-fold
cross-validation.
K value
of cross-
validation Sensitivity Specificity Accuracy PPV NPV
5 0.9190 0.9286 0.9251 0.8808 0.9534
6 0.9192 0.9380 0.9312 0.8934 0.9537
7 0.9149 0.9510 0.9379 0.9140 0.9516
8 0.9310 0.9368 0.9347 0.8944 0.9597
9 0.9346 0.9485 0.9434 0.9110 0.9628
10 0.9576 0.9375 0.9448 0.8979 0.9751
11 0.9169 0.9402 0.9317 0.8990 0.9515
12 0.8811 0.9510 0.9257 0.9110 0.9339
Sådhanå (2018) 43:39 Page 15 of 18 39

Acknowledgement
Our thanks to Dr. Thomas Deserno, Department of Medical
Informatics, Aachen University of Technology, Aachen,
North Rhine-Westphalia, Germany, for providing the
IRMA (Image Retrieval in Medical Applications) version
of DDSM Database.
References
[1] Acharya U R, Ng E Y K, Tan J H and Sree S V 2012
Thermography based breast cancer detection using texture
features and support vector machine. J. Med. Syst. 36:
1503–1510
[2] Cheng H D, Shi X J, Min R, Hu L M, Cai X P and Du H N
2006 Approaches for automated detection and classification
of masses in mammograms. Pattern Recogn. 39(4): 646–668
[3] Sree S V, Ng E Y K, Acharya U R and Faust O 2011 Breast
imaging: a survey. World J. Clin. Oncol. 2(4): 171–178
[4] Papadopoulos A, Fotiadis D I and Likas A 2005 Character-
ization of clustered microcalcifications in digitized mam-
mograms using neural networks and support vector
machines. Artif. Intell. Med. 34(2): 141–150
[5] Ganesan K, Acharya U R, Chua C K, Min L C, Mathew B
and Thomas A K 2013 Decision support system for breast
cancer detection using mammograms. Proc. Inst. Mech. Eng.
Part H: J. Eng. Med. 227(7): 721–732
[6] Tiedeu A, Daul C, Kentsop A, Graebling P and Wolf D 2012
Texture-based analysis of clustered microcalcifications detec-
ted on mammograms. Digit. Signal Process. 22(1): 124–132
[7] Muttarak M, Kongmebhol P and Sukhamwang N 2009
Breast calcifications: which are malignant? Singapore Med.
J. 50(9): 907–913
[8] Wei L, Yang Y, Nishikawa R M and Jiang Y 2005 A study
on several machine learning methods for classification of
malignant and benign clustered microcalcifications. IEEE
Trans. Med. Imag. 24(3): 371–380
[9] Shanthi S and Bhaskaran V M 2014 A novel approach for
classification of abnormalities in digitized mammograms.
Sadhana 39(5): 1141–1150
[10] Karahaliou A, Skiadopoulos S, Boniatis I, Sakellaropoulos P,
Likaki E, Panayiotakis G and Costaridou L 2007 Texture
analysis of tissue surrounding microcalcifications on mam-
mograms for breast cancer diagnosis. Br. J. Radiol. 80(956):
648–656
[11] Hamdi N, Auhmani K and Hassani M M R 2008 Design of a
high-accuracy classifier based on Fisher discriminant analy-
sis: application to computer-aided diagnosis of microcalci-
fications. In: Proceedings of the IEEE International
Conference on Computational Sciences and its Applications
(ICCSA’08), June 30–July 3, Perugia, pp. 267–273
[12] Tirtajaya A and Santika D D 2010 Classification of micro-
calcification using dual-tree complex wavelet transform and
support vector machine. In: Proceedings of the IEEE 2nd
International Conference on Advances in Computing, Con-
trol and Telecommunication Technologies (ACT 2010), 2–3
December, Jakarta, pp. 164–166
[13] Zyout I and Abdel-Qader I 2011 Classification of microcal-
cification clusters via PSO-KNN Heuristic parameter selec-
tion and GLCM features. Int. J. Comput. Appl. 31(2): 34–39
[14] Farzana N and Rathnakara S 2011 Detection of micro-cal-
cifications in mammogram images using probabilistic neural
network. Elixir Comput. Sci. Eng. 38: 4404–4408
[15] Bhanumathi R and Suresh G R 2013 Detection of micro-
calcification in mammogram images using support vector
machine based classifier. ITSI Trans. Electr. Electron. Eng.
1(2): 27–32
[16] Jenifer S, Parasuraman S and Kadirvel A 2014 An efficient
biomedical imaging technique for automatic detection of
abnormalities in digital mammograms. J. Med. Imag. Health
Informat. 4(2): 291–296
[17] Strange H, Chen Z, Denton E R and Zwiggelaar R 2014
Modelling mammographic microcalcification clusters using
persistent mereotopology. Pattern Recogn. Lett. 47: 157–163
[18] Lee S K, Chung P C, Chang C I, Lo C S, Lee T, Hsu G C and
Yang C W 2003 Classification of clustered
0
10
20
30
40
50
60
70
80
90
100
Hara
lick
Shap
e &
Hara
lick
Text
ure
Shap
e &
Text
ure
Shap
e,Te
xtur
e, A
LBP
shap
e,Te
xtur
e, A
LBP,
Hier
arch
ical
Cent
roid
Perc
enta
ge
Features
Sensi�vity Specificity Accuracy
Figure 8. Contribution of the proposed features for the system.
39 Page 16 of 18 Sådhanå (2018) 43:39
microcalcifications using a shape cognitron neural network.
Neural Netw. 16(1): 121–132
[19] Soltanian-Zadeh H, Rafiee-Rad F and Pourabdollah-Nejad D
S 2004 Comparison of multiwavelet, wavelet, Haralick, and
shape features for microcalcification classification in mam-
mograms. Pattern Recogn. 37(10): 1973–1986
[20] D’Aloia M, Rizzi M and Bari P D 2013 A second opinion
system for microcalcification diagnosis. World Appl. Sci. J.
23(3): 289–295
[21] Karssemeijer N 1993 Recognition of microcalcification
clusters in mammograms. Int. J. Pattern Recogn. Artif. Intell.
7(6): 1357–1376
[22] Zhang L, Qian W, Sankar R, Song D and Clark R 2001 A
new false positive reduction method for MCCs detection in
digital mammography. In: Proceedings of the IEEE Inter-
national Conference on Acoustics, Speech and Signal Pro-
cessing, 7–11 May, Salt Lake City, UT, pp. 1033–1036
[23] Cordella L P, Tortorella F and Vento M 2000 Combing
experts with different features for classifying clustered
microcalcifications in mammograms. In: Proceedings of the
IEEE 15th International Conference on Patten Recognition,
3–7 September, Barcelona, Spain, pp. 324–327
[24] De Oliveira J E, Deserno T M and Araujo A D A 2008 Breast
lesions classification applied to a reference database. In:
Proceedings of the 2nd International Conference on E-Med-
ical Systems, 29–31 October, Tunisia, pp. 1–7
[25] Kimori Y 2011 Mathematical morphology-based approach to
the enhancement of morphological features in medical ima-
ges. J. Clin. Bioinformat. 1(1): 1–10
[26] Stojic T and Reljin B 2010 Enhancement of microcalcifica-
tions in digitized mammograms: multifractal and mathe-
matical morphology approach. FME Trans. 38(1): 1–9
[27] Vega-Corona A, Quintanilla-Domınguez J, Ojeda-Magana B,
Cortina-Januchs M G, Marcano-Cedeno A, Ruelas R and
Andina D 2011 Microcalcifications detection using PFCM
and ANN. In: Pattern Recognition. Berlin–Heidelberg:
Springer, pp. 260–268
[28] Mustra M, Grgic M and Delac K 2012 Enhancement of
microcalcifications in digital mammograms. In: Proceedings
of the IEEE 19th International Conference on Systems, Sig-
nals and Image Processing (IWSSIP), 11–13 April, Vienna,
pp. 248–251
[29] Zhang X, Homma N, Goto S, Kawasumi Y, Ishibashi T, Abe M,
SugitaN andYoshizawaM2013Ahybrid image filteringmethod
for computer-aided detection of microcalcification clusters in
mammograms. J. Med. Eng. Article ID 615254, pp. 1–8
[30] Quintanilla-Dominguez J, Ojeda-Magana B, Cortina-Januchs
M C, Ruelas R, Vega-Corona A and Andina D 2011 Image
segmentation by fuzzy and possibilistic clustering algorithms
for identification of microcalcifications. Sci. Iran. 18(3):
580–589
[31] Nishikawa R M, Jiang Y, Giger M L, Doi K, Vyborny C J
and Schmidt R A 1992 Computer-aided detection of clus-
tered microcalcifications. In: Proceedings of the IEEE
International Conference on Systems, Man and Cybernetics,
18–21 October, Chicago, pp. 1375–1378
[32] Mossi J M and Albiol A 1999 Improving detection of clus-
tered microcalcifications using morphological connected
operators. In: Proceedings of the IEEE 7th International
Conference on Image Processing and its Applications, 13–15
July, Manchester, pp. 498–501
[33] Pereira Jr R R, Marques P M A, Honda M O, Kinoshita S K,
Engelmann R, Muramatsu C and Doi K 2007 Usefulness of
texture analysis for computerized classification of breast
lesions on mammograms. J. Digit. Imag. 20(3): 248–255
[34] Armon S 2011 Handwriting recognition and fast retrieval for
Hebrew historical manuscripts. MTech Thesis, The Hebrew
University of Jerusalem
[35] Vamvakas G, Gatos B and Perantonis S J 2010 Handwritten
character recognition through two-stage foreground sub-
sampling. Pattern Recogn. 43(8): 2807–2816
[36] Wu C M and Chen Y C 1992 Statistical feature matrix for
texture analysis. CVGIP: Graph. Models Image Process.
54(5): 407–419
[37] Haralick R M, Shanmugam K and Dinstein I 1973 Textural
features for image classification. IEEE Trans. Syst. Man
Cybern. SMC-3: 610–621
[38] Laws K I 1980 Textured image segmentation. PhD Thesis,
University of Southern California, Electrical Engineering
[39] Mavroforakis M E, Georgiou H V, Dimitropoulos N,
Cavouras D and Theodoridis S 2006 Mammographic masses
characterization based on localized texture and dataset fractal
analysis using linear, neural and support vector machine
classifiers. Artif. Intell. Med. 37(2): 145–162
[40] Wu C M, Chen Y C and Hsieh K S 1992 Texture features for
classification of ultrasonic liver images. IEEE Trans. Med.
Imag. 11(2): 141–152
[41] Guo Z, Zhang I, Zhang D and Zhang S 2010 Rotation
invariant texture classification using adaptive LBP with
directional statistical features. In: Proceedings of the IEEE
17th International Conference on Image Processing, 26–29
September, Hong Kong, pp. 285–288
[42] Thangavel K and Velayutham C 2012 Rough set based
unsupervised feature selection in mammogram image clas-
sification using entropy measure. J. Med. Imag. Health
Informat. 2(3): 320–326
[43] Wang J and Zhao Y 2011 Differential evolution algorithm
based one dimension real valued searching for feature
selection. In: Future intelligent information systems. Berlin–
Heidelberg: Springer, 127–134
[44] Das S and Suganthan P N 2011 Differential evolution: a
survey of the state-of-the-art. IEEE Trans. Evol. Comput.
15(1): 4–31
[45] Mala S and Latha K 2014 Feature selection in classification of
eye movements using electrooculography for activity recogni-
tion. Comput. Math. Methods Med. Article ID 713818, pp. 1–9
[46] Bharathi P T and Subashini P 2014 Optimal feature subset
selection using differential evolution and extreme learning
machine. Int. J. Sci. Res. 3(7): 1898–1905
[47] Singh B, Jain V K and Singh S 2014 Mammogram mass
classification using support vector machine with texture,
shape features and hierarchical centroid method. J. Med.
Imag. Health Inf. 4(5): 687–696
[48] Khushaba R N, Al-Ani A and Al-Jumaily A 2011 Feature
subset selection using differential evolution and a statistical
repair mechanism. Expert Syst. Appl. 38(9): 11515–11526
[49] Zyout I, Abdel-Qader I and Jacobs C 2009 Bayesian classi-
fier with simplified learning phase for detecting microcalci-
fications in digital mammograms. Int. J. Biomed. Imag.
Article ID 767805, pp. 1–13
[50] Bhateja V and Devi S 2010 Mammographic image
enhancement using double sigmoid transformation function.
Sådhanå (2018) 43:39 Page 17 of 18 39

In: Proceedings of the International Conference on Com-
puter Applications (ICCA-2010), 24–27 December, Pondi-
cherry, India, pp. 259–264
[51] Singh S, Yadav A and Singh B K 2011 Performance analysis
of mammographic image enhancement techniques for early
detection of breast cancer. In: Advances in parallel distributed
computing. Berlin–Heidelberg: Springer, pp. 439–448
[52] Saleem A, Beghdadi A and Boashash B 2012 Image fusion-
based contrast enhancement. EURASIP J. Image Video
Process. 2012(1): 1–17
[53] Panetta K, Samani A and Agaian S 2014 Choosing the
optimal spatial domain measure of enhancement for mam-
mogram images. J. Biomed. Imag. Article ID 937849,
pp. 1–8
[54] Gorgel P, Sertbas A, Kilic N and Ucan O N 2013 Mam-
mographical mass detection and classification using local
seed region growing-spherical wavelet transform hybrid
scheme. Comput. Biol. Med. 43(6): 765–774
[55] Tang X, Ding H, Yuan Y E and Wang Q 2008 Morphological
measurement of localized temperature increase amplitudes in
breast infrared thermograms and its clinical application.
Biomed. Signal Process. Control 3(4): 312–318
[56] Chen Z, Strange H, Oliver A, Denton E R, Boggis C and
Zwiggelaar R 2015 Topological modeling and classification
of mammographic microcalcification clusters. IEEE Trans.
Biomed. Eng. 62(4): 1203–1214
39 Page 18 of 18 Sådhanå (2018) 43:39