An analytical study on the impact of hollow shapes in bi ...framcos.org/FraMCoS-7/14-04.pdf · An...
8
An analytical study on the impact of hollow shapes in bi-axial hollow slabs J. H. Chung & J. H. Park Hanyang University, Seoul, Korea H. K. Choi Hanyang University, Seoul, Korea S. C. LEE SAMSUNG C&T Corporation, Korea C. S. CHOI Hanyang University, Seoul, Korea ABSTRACT: This paper presents optimal hollow sphere shapes in a biaxial hollow slab. To derive optimal hol- low shapes, numerical simulations using nonlinear Finite Element Methods were executed by the nonlinear fi- nite element program ‘LUSAS’. Recently, various types of slab systems which can reduce self-weight of slabs have been studied as the height and width of building structures rapidly increase. A biaxial hollow slab system is widely known as one of the effective slab system which can reduce self-weight of slab. A biaxial hollow slab has hollow spheres within slab in order to reduce self-weight of slab. Because of reducing self-weight of slab by hollow spheres, size of vertical elements like walls and columns can be smaller and slabs span can be longer. A capacity of biaxial hollow slabs is influenced by the shape and volume of hollow spheres. Therefore, in this study, several biaxial hollow slabs which have different shapes of hollow spheres were analyzed by using the fi- nite element method program in order to derive optimal hollow sphere shapes. 1 INTRODUCTION 1.1 Preface In building, the slab is very important structural member to make a space. And Slab is one of the largest member consuming concrete. In a general way, the slab was designed only to resist vertical load. However, deflection and vibration of slab are also considered recently because people are getting more interest of residential environment. In addition, when span of the building is increasing, deflection of slab is more important. Therefore, the slab thickness is on the increase. The increasing of slab thickness makes slab heavier, and it leads to increase column and base size. Thus, it makes building consume more materials such as concrete and steel. Moreover, the increasing of weight is harmful for building when earthquake occur. To avoid these disadvantages which were caused by increasing of self-weight of slabs, the biaxial hol- low slab system, also known as void slab, was sug- gested. This slab system could optimize the size of vertical members like walls and columns by lighten- ing the weight of slabs. Therefore, it got attention because it made efficient and economical building de- sign possible. A capacity of biaxial hollow slab is in- fluenced by hollow sphere shapes. However, the re- searches about hollow sphere shape have been insufficient. So, in this study, several kinds of hollow slabs which have different hollow sphere shapes were analyzed by using finite element method program in order to derive the optimal hollow sphere shapes and to verify the impact of hollow shapes in biaxial hol- low slabs. 1.2 Literature review A biaxial hollow slab system was developed in 1990s. In 21C, hollow slab systems which have same con- cept and different hollow shapes were invented over USA, Europe and Japan. (See Table 1.) According to existing hollow slab systems, self- weight reduction ratio of slab was 25~30%. And their flexural strength was similar to solid slab. 1.3 Research objective The aims of this research were to grasp the relation- ship between hollow sphere shapes and slab’s Fracture Mechanics of Concrete and Concrete Structures - High Performance, Fiber Reinforced Concrete, Special Loadings and Structural Applications- B. H. Oh, et al. (eds) ⓒ 2010 Korea Concrete Institute, ISBN 978-89-5708-182-2
-
Upload
trinhhuong -
Category
Documents
-
view
213 -
download
0
Transcript of An analytical study on the impact of hollow shapes in bi ...framcos.org/FraMCoS-7/14-04.pdf · An...

An analytical study on the impact of hollow shapes in bi-axial hollow slabs
J. H. Chung & J. H. Park Hanyang University, Seoul, Korea
H. K. Choi Hanyang University, Seoul, Korea
S. C. LEE SAMSUNG C&T Corporation, Korea
C. S. CHOI Hanyang University, Seoul, Korea ABSTRACT: This paper presents optimal hollow sphere shapes in a biaxial hollow slab. To derive optimal hol-low shapes, numerical simulations using nonlinear Finite Element Methods were executed by the nonlinear fi-nite element program ‘LUSAS’. Recently, various types of slab systems which can reduce self-weight of slabs have been studied as the height and width of building structures rapidly increase. A biaxial hollow slab system is widely known as one of the effective slab system which can reduce self-weight of slab. A biaxial hollow slab has hollow spheres within slab in order to reduce self-weight of slab. Because of reducing self-weight of slab by hollow spheres, size of vertical elements like walls and columns can be smaller and slabs span can be longer. A capacity of biaxial hollow slabs is influenced by the shape and volume of hollow spheres. Therefore, in this study, several biaxial hollow slabs which have different shapes of hollow spheres were analyzed by using the fi-nite element method program in order to derive optimal hollow sphere shapes.
1 INTRODUCTION
1.1 Preface In building, the slab is very important structural member to make a space. And Slab is one of the largest member consuming concrete. In a general way, the slab was designed only to resist vertical load. However, deflection and vibration of slab are also considered recently because people are getting more interest of residential environment. In addition, when span of the building is increasing, deflection of slab is more important. Therefore, the slab thickness is on the increase. The increasing of slab thickness makes slab heavier, and it leads to increase column and base size. Thus, it makes building consume more materials such as concrete and steel. Moreover, the increasing of weight is harmful for building when earthquake occur.
To avoid these disadvantages which were caused by increasing of self-weight of slabs, the biaxial hol-low slab system, also known as void slab, was sug-gested. This slab system could optimize the size of vertical members like walls and columns by lighten-ing the weight of slabs. Therefore, it got attention
because it made efficient and economical building de-sign possible. A capacity of biaxial hollow slab is in-fluenced by hollow sphere shapes. However, the re-searches about hollow sphere shape have been insufficient. So, in this study, several kinds of hollow slabs which have different hollow sphere shapes were analyzed by using finite element method program in order to derive the optimal hollow sphere shapes and to verify the impact of hollow shapes in biaxial hol-low slabs.
1.2 Literature review A biaxial hollow slab system was developed in 1990s. In 21C, hollow slab systems which have same con-cept and different hollow shapes were invented over USA, Europe and Japan. (See Table 1.)
According to existing hollow slab systems, self-weight reduction ratio of slab was 25~30%. And their flexural strength was similar to solid slab.
1.3 Research objective The aims of this research were to grasp the relation-ship between hollow sphere shapes and slab’s
Fracture Mechanics of Concrete and Concrete Structures -High Performance, Fiber Reinforced Concrete, Special Loadings and Structural Applications- B. H. Oh, et al. (eds)
ⓒ 2010 Korea Concrete Institute, ISBN 978-89-5708-182-2

Table 1. The existing Hollow slab systems. Void Strength
Name Sys-tem Material Shape
Weight reduc-tion FlexureShear
Cobiax Sphere Ellipse 30% 100% 50% Europe
U-Boot 35% 100% 45%
USA
Fili-gree wide slab
Plastic Cuboid 25% 100% 65%
Mom-slab 30% 100% 50%
Japan EJ Void
Void Slab
Styro-foam
Sphere Ellipse 30% 100% 50%
* Compared to Solid slab
capacities. And development of the optimal hollow sphere shape was another aim of this research.
To do these, 3 stages of analytical research proc-ess were performed by using finite element method program named ‘LUSAS’.
1) Finding out the parameters of hollow shape. 2) Grasping the impact of hollow sphere shapes in
biaxial hollow slabs. 3) Developing the optimal hollow sphere shape.
2 THE PARAMETERS OF HOLLOW SPHERE SHAPE
For finding out the parameters of hollow shape, the existing hollow shapes were compared and analyzed each other. As a result, three parameters were de-rived such as typical shapes, corner radius and hole diameter. (Fig. 1)
a ) Typical shapes of hollow sphere (Hollow volume)
b) Corner radius of hollow sphere
c) Hole diameter of hollow sphere
Figure 1. The Parameters of hollow sphere shape. The section geometries of hollow spheres were
studied to limit the field of the three-dimensional hol-low sphere shapes, before the derivation of the three-dimensional hollow sphere shapes. To do this, the hollow slabs were modeled in two-dimensional plane, changing 3 parameters such as typical shapes, corner
radius and hole diameter. And numerical simulations of two-dimensional hollow slab model were per-formed. It is meaningless to perform quantitative analysis of two-dimensional hollow slab model about above parameters. Because it cannot consider change of hollow shapes and concrete web parts between hollow spheres. But it is meaningful to qualitative analysis of two-dimensional hollow slab model about the parameters to find qualitative effects on hollow slab such as crack propagation or concentration.
a )Typical shape : Load-Deflection Curve (Flexural/Shear)
b ) Corner radius : Load-Deflection Curve (Flexural/Shear)
c ) Hole diameter : Load-Deflection Curve (Flexural/Shear)
Figure 2. 2D FEM Load-Deflection Curve.
a) 0 mm e) 40 mm
b) 10 mm f) 50 mm
c) 20 mm g) 60 mm
d) 30 mm h) 70 mm
Figure 3. Crack pattern by corner radius.
Proceedings of FraMCoS-7, May 23-28, 2010
hThD ∇−= ),(J (1)
The proportionality coefficient D(h,T) is called moisture permeability and it is a nonlinear function of the relative humidity h and temperature T (Bažant & Najjar 1972). The moisture mass balance requires that the variation in time of the water mass per unit volume of concrete (water content w) be equal to the divergence of the moisture flux J
J•∇=∂
∂−
t
w (2)
The water content w can be expressed as the sum
of the evaporable water we (capillary water, water vapor, and adsorbed water) and the non-evaporable (chemically bound) water wn (Mills 1966, Pantazopoulo & Mills 1995). It is reasonable to assume that the evaporable water is a function of relative humidity, h, degree of hydration, αc, and degree of silica fume reaction, αs, i.e. we=we(h,αc,αs) = age-dependent sorption/desorption isotherm (Norling Mjonell 1997). Under this assumption and by substituting Equation 1 into Equation 2 one obtains
nscw
s
ew
c
ew
hh
Dt
h
h
ew
&&& ++∂
∂
∂
∂
=∇•∇+∂
∂
∂
∂
− αα
αα
)(
(3)
where ∂we/∂h is the slope of the sorption/desorption isotherm (also called moisture capacity). The governing equation (Equation 3) must be completed by appropriate boundary and initial conditions.
The relation between the amount of evaporable water and relative humidity is called ‘‘adsorption isotherm” if measured with increasing relativity humidity and ‘‘desorption isotherm” in the opposite case. Neglecting their difference (Xi et al. 1994), in the following, ‘‘sorption isotherm” will be used with reference to both sorption and desorption conditions. By the way, if the hysteresis of the moisture isotherm would be taken into account, two different relation, evaporable water vs relative humidity, must be used according to the sign of the variation of the relativity humidity. The shape of the sorption isotherm for HPC is influenced by many parameters, especially those that influence extent and rate of the chemical reactions and, in turn, determine pore structure and pore size distribution (water-to-cement ratio, cement chemical composition, SF content, curing time and method, temperature, mix additives, etc.). In the literature various formulations can be found to describe the sorption isotherm of normal concrete (Xi et al. 1994). However, in the present paper the semi-empirical expression proposed by Norling Mjornell (1997) is adopted because it
explicitly accounts for the evolution of hydration reaction and SF content. This sorption isotherm reads
( ) ( )( )
( ) ( )⎥⎥
⎦
⎤
⎢⎢
⎣
⎡
⎥⎥⎥
⎦
⎤
⎢⎢⎢
⎣
⎡
−
−∞
+
−∞
−=
1110
,1
110
11,
1,,
hcc
ge
scK
hcc
ge
scG
sch
ew
αα
αα
αα
αααα
(4)
where the first term (gel isotherm) represents the physically bound (adsorbed) water and the second term (capillary isotherm) represents the capillary water. This expression is valid only for low content of SF. The coefficient G1 represents the amount of water per unit volume held in the gel pores at 100% relative humidity, and it can be expressed (Norling Mjornell 1997) as
( ) ss
s
vgkc
c
c
vgk
scG αααα +=,1
(5)
where k
cvg and k
svg are material parameters. From the
maximum amount of water per unit volume that can fill all pores (both capillary pores and gel pores), one can calculate K1 as one obtains
( )1
110
110
11
22.0188.00
,1
−⎟⎠
⎞⎜⎝
⎛−∞
⎥⎥⎥
⎦
⎤
⎢⎢⎢
⎣
⎡⎟⎠
⎞⎜⎝
⎛−∞
−−+−
=
hcc
ge
hcc
geGs
ssc
w
scK
αα
αα
αα
αα
(6)
The material parameters k
cvg and k
svg and g1 can
be calibrated by fitting experimental data relevant to free (evaporable) water content in concrete at various ages (Di Luzio & Cusatis 2009b).
2.2 Temperature evolution
Note that, at early age, since the chemical reactions associated with cement hydration and SF reaction are exothermic, the temperature field is not uniform for non-adiabatic systems even if the environmental temperature is constant. Heat conduction can be described in concrete, at least for temperature not exceeding 100°C (Bažant & Kaplan 1996), by Fourier’s law, which reads
T∇−= λq (7)
where q is the heat flux, T is the absolute temperature, and λ is the heat conductivity; in this

a) 0 mm e) 40 mm
b) 20 mm f) 50 mm
c) 30 mm
Figure 4. Crack pattern by hole diameter. The results of 2D FEM analysis were shown in
Figure 2, 3 and 4. As shown Figure 2, the parameters of two-
dimensional hollow slab model does not affect bend-ing strength and stiffness of slab.
However, Figure 2 shows that the parameters af-fect shear strength and stiffness. And Figure 3 shows that the corner radius becomes smaller, the cracks are concentrated more. Because of that, the early de-struction occurs by the progress of cracks in shear failure mode. And Figure 4 shows that the hole di-ameter becomes larger, the shear cracks are pre-vented.
3 SETTING UP THE HOLLOW SPHERE SHAPE
3.1 Target structure The hollow slab system is effective when self-weight of slab is a high rate. In other words, this system is most effective when it is applied to thick flat plate slabs. Therefore, target structure system was set up ‘wall + flat plate slab’ system which had 250mm thick slab. (See Fig. 5.)
Figure 5. Target structure system (wall + flat plate slab).
3.2 Size of hollow sphere The height of hollow sphere was set up, according to height of compressive stress block in target structure slab. As assuming hollow shape was pipe type, the height of compressive stress block derived by using strain compatibility method.
The strain compatibility method is the rigorous
method of estimating the flexural strength. Concrete section is based on the compatibility of strains and equilibrium of forces acting on the section at the stage of failure such as reinforced bar strain reaches 0.002 or concrete strain reaches 0.003. Strain of con-crete and reinforced bar could be derived by using equations (1) ~ (4).
(0.003) 0.003sd pc
ε −= (1)
s sf Esε= (2)
fs uAT = (3)
'10.85 cbcC f β= (4)
In target structure, the height of compressive
stress block was changed by location. As shown Fig-ure 6, the height of hollow sphere had to be less than 160mm to avoid development of compressive stress block in hollow parts. However, as considered an-chorage of reinforced bar, 140mm was adequate height of hollow sphere in 250mm thick flat plate slabs. Considered architectural module, adequate width of hollow sphere was 270mm.
Figure 6. The height of compressive stress block.
3.3 Hollow sphere shape The hollow sphere shapes varied with the limitation of size. And the range of hollow volume was set up 20% to 45% of one slab module volume (300mm x 300mm x 250mm). Considered the height of hollow sphere, a range of corner radius of hollow sphere was set up 0mm to 70mm. And a range of hole diameter was set up more than 30mm, as considered concrete construction.
As compared the 3 parameters of hollow shape, 8 types of hollow spheres which were divided into 3 classes. The first group varied with the typical sphere
Proceedings of FraMCoS-7, May 23-28, 2010
hThD ∇−= ),(J (1)
The proportionality coefficient D(h,T) is called moisture permeability and it is a nonlinear function of the relative humidity h and temperature T (Bažant & Najjar 1972). The moisture mass balance requires that the variation in time of the water mass per unit volume of concrete (water content w) be equal to the divergence of the moisture flux J
J•∇=∂
∂−
t
w (2)
The water content w can be expressed as the sum
of the evaporable water we (capillary water, water vapor, and adsorbed water) and the non-evaporable (chemically bound) water wn (Mills 1966, Pantazopoulo & Mills 1995). It is reasonable to assume that the evaporable water is a function of relative humidity, h, degree of hydration, αc, and degree of silica fume reaction, αs, i.e. we=we(h,αc,αs) = age-dependent sorption/desorption isotherm (Norling Mjonell 1997). Under this assumption and by substituting Equation 1 into Equation 2 one obtains
nscw
s
ew
c
ew
hh
Dt
h
h
ew
&&& ++∂
∂
∂
∂
=∇•∇+∂
∂
∂
∂
− αα
αα
)(
(3)
where ∂we/∂h is the slope of the sorption/desorption isotherm (also called moisture capacity). The governing equation (Equation 3) must be completed by appropriate boundary and initial conditions.
The relation between the amount of evaporable water and relative humidity is called ‘‘adsorption isotherm” if measured with increasing relativity humidity and ‘‘desorption isotherm” in the opposite case. Neglecting their difference (Xi et al. 1994), in the following, ‘‘sorption isotherm” will be used with reference to both sorption and desorption conditions. By the way, if the hysteresis of the moisture isotherm would be taken into account, two different relation, evaporable water vs relative humidity, must be used according to the sign of the variation of the relativity humidity. The shape of the sorption isotherm for HPC is influenced by many parameters, especially those that influence extent and rate of the chemical reactions and, in turn, determine pore structure and pore size distribution (water-to-cement ratio, cement chemical composition, SF content, curing time and method, temperature, mix additives, etc.). In the literature various formulations can be found to describe the sorption isotherm of normal concrete (Xi et al. 1994). However, in the present paper the semi-empirical expression proposed by Norling Mjornell (1997) is adopted because it
explicitly accounts for the evolution of hydration reaction and SF content. This sorption isotherm reads
( ) ( )( )
( ) ( )⎥⎥
⎦
⎤
⎢⎢
⎣
⎡
⎥⎥⎥
⎦
⎤
⎢⎢⎢
⎣
⎡
−
−∞
+
−∞
−=
1110
,1
110
11,
1,,
hcc
ge
scK
hcc
ge
scG
sch
ew
αα
αα
αα
αααα
(4)
where the first term (gel isotherm) represents the physically bound (adsorbed) water and the second term (capillary isotherm) represents the capillary water. This expression is valid only for low content of SF. The coefficient G1 represents the amount of water per unit volume held in the gel pores at 100% relative humidity, and it can be expressed (Norling Mjornell 1997) as
( ) ss
s
vgkc
c
c
vgk
scG αααα +=,1
(5)
where k
cvg and k
svg are material parameters. From the
maximum amount of water per unit volume that can fill all pores (both capillary pores and gel pores), one can calculate K1 as one obtains
( )1
110
110
11
22.0188.00
,1
−⎟⎠
⎞⎜⎝
⎛−∞
⎥⎥⎥
⎦
⎤
⎢⎢⎢
⎣
⎡⎟⎠
⎞⎜⎝
⎛−∞
−−+−
=
hcc
ge
hcc
geGs
ssc
w
scK
αα
αα
αα
αα
(6)
The material parameters k
cvg and k
svg and g1 can
be calibrated by fitting experimental data relevant to free (evaporable) water content in concrete at various ages (Di Luzio & Cusatis 2009b).
2.2 Temperature evolution
Note that, at early age, since the chemical reactions associated with cement hydration and SF reaction are exothermic, the temperature field is not uniform for non-adiabatic systems even if the environmental temperature is constant. Heat conduction can be described in concrete, at least for temperature not exceeding 100°C (Bažant & Kaplan 1996), by Fourier’s law, which reads
T∇−= λq (7)
where q is the heat flux, T is the absolute temperature, and λ is the heat conductivity; in this

shapes such as Sphere, Mushroom, Ellipse and Round Rect(R=70mm). The second group varied with the corner radius such as Square, Round Rect(R=50mm) and Round Rect(R=70mm). And the last group varied with the hole diameter such as Round Rect(R=70mm), Rect Donuts(D=50mm) and Rect Donuts(D=30mm). Further information and properties of the hollow spheres are shown Table 2.
4 3D FEM ANALYSIS OF HOLLOW SLAB
4.1 Modeling To derive the optimal hollow shape, numerical simu-lations using nonlinear Finite Element Methods were performed by the nonlinear finite element program LUSAS. To perform numerical simulations of the slabs by using finite element method, two dimen-sional model was often used when slabs were uni-form in transverse axis. However, in the case of biax-ial hollow slabs, it was impossible to use two-dimensional model because of the unequally section geometry along the longitudinal and transverse axis by extraordinary hollow sphere shape. So, it was modeled using three-dimensional model which could be considered concrete web parts between hollow spheres like Figure 7. And to generate a finite ele-ment mesh of the hollow slab which has extraordi-nary shapes of hollow sphere inside, tetrahedral ele-ments which have four nodes were used because other mesh elements such as Pentahedral or Hexahe-dral were not able to generate the geometry of the hollow slab.
Two material models were used to perform nonli-near finite element method analysis. The one, which was used reinforced steel bar, is bi-linear model of steel. It is assumed that steel behavior will be totally elasto-plastic in tensile and compressive loading con-dition. (See Fig. 8-a) And another material model, which was used concrete, is ‘LUSAS concrete model 94’. It can consider multi-cracks of concrete and strength softening of concrete.(Fig. 8-b)
The convergence study was performed about mesh size ranged 20mm~150mm to verify the nu-merical simulation result. The result converged when
mesh size was 30mm into 27.1kN. This is theoretical value by using equations (5), (6).
' ' ' ' ')( ) ( )
2(n
aM f f d f d ds y s s s sA A A− − + −=
(5)
2n
MnPl
= (6) In this study, the hollow slab model was generated
Figure 7. Finite element mesh modeling (In the view of the cross-section).
σ
σy
εεuεy
a) Bi-linear model b) LUSAS Concrete Model 94
Figure 8. Nonlinear material model.
160 140 120 100 80 60 40 2025
2627
2829
3031
3233
3435
3637
3839
40
Pn
Load
(kN
)
Mesh Size (mm)
Figure 9. Nonlinear material model.
Table 2. The properties of hollow spheres.
Solid Sphere Mushroom Ellipse Rect Donuts(D=50mm)
Rect Donuts(D=30mm)
Round Rect (R=70mm)
Round Rect(R=50mm) Square
Shape -
Volume(cm3) - 1436 5625 6300 7380 7650 7785 8910 10125 Diameter(cm) - 14 27 27 27 27 27 27 27 Height(cm) - 14 14 14 14 14 14 14 14 Weight reduc-tion (%) 0% 20% 25% 28% 32.8% 34% 34.6% 39.6% 45%
Proceedings of FraMCoS-7, May 23-28, 2010
hThD ∇−= ),(J (1)
The proportionality coefficient D(h,T) is called moisture permeability and it is a nonlinear function of the relative humidity h and temperature T (Bažant & Najjar 1972). The moisture mass balance requires that the variation in time of the water mass per unit volume of concrete (water content w) be equal to the divergence of the moisture flux J
J•∇=∂
∂−
t
w (2)
The water content w can be expressed as the sum
of the evaporable water we (capillary water, water vapor, and adsorbed water) and the non-evaporable (chemically bound) water wn (Mills 1966, Pantazopoulo & Mills 1995). It is reasonable to assume that the evaporable water is a function of relative humidity, h, degree of hydration, αc, and degree of silica fume reaction, αs, i.e. we=we(h,αc,αs) = age-dependent sorption/desorption isotherm (Norling Mjonell 1997). Under this assumption and by substituting Equation 1 into Equation 2 one obtains
nscw
s
ew
c
ew
hh
Dt
h
h
ew
&&& ++∂
∂
∂
∂
=∇•∇+∂
∂
∂
∂
− αα
αα
)(
(3)
where ∂we/∂h is the slope of the sorption/desorption isotherm (also called moisture capacity). The governing equation (Equation 3) must be completed by appropriate boundary and initial conditions.
The relation between the amount of evaporable water and relative humidity is called ‘‘adsorption isotherm” if measured with increasing relativity humidity and ‘‘desorption isotherm” in the opposite case. Neglecting their difference (Xi et al. 1994), in the following, ‘‘sorption isotherm” will be used with reference to both sorption and desorption conditions. By the way, if the hysteresis of the moisture isotherm would be taken into account, two different relation, evaporable water vs relative humidity, must be used according to the sign of the variation of the relativity humidity. The shape of the sorption isotherm for HPC is influenced by many parameters, especially those that influence extent and rate of the chemical reactions and, in turn, determine pore structure and pore size distribution (water-to-cement ratio, cement chemical composition, SF content, curing time and method, temperature, mix additives, etc.). In the literature various formulations can be found to describe the sorption isotherm of normal concrete (Xi et al. 1994). However, in the present paper the semi-empirical expression proposed by Norling Mjornell (1997) is adopted because it
explicitly accounts for the evolution of hydration reaction and SF content. This sorption isotherm reads
( ) ( )( )
( ) ( )⎥⎥
⎦
⎤
⎢⎢
⎣
⎡
⎥⎥⎥
⎦
⎤
⎢⎢⎢
⎣
⎡
−
−∞
+
−∞
−=
1110
,1
110
11,
1,,
hcc
ge
scK
hcc
ge
scG
sch
ew
αα
αα
αα
αααα
(4)
where the first term (gel isotherm) represents the physically bound (adsorbed) water and the second term (capillary isotherm) represents the capillary water. This expression is valid only for low content of SF. The coefficient G1 represents the amount of water per unit volume held in the gel pores at 100% relative humidity, and it can be expressed (Norling Mjornell 1997) as
( ) ss
s
vgkc
c
c
vgk
scG αααα +=,1
(5)
where k
cvg and k
svg are material parameters. From the
maximum amount of water per unit volume that can fill all pores (both capillary pores and gel pores), one can calculate K1 as one obtains
( )1
110
110
11
22.0188.00
,1
−⎟⎠
⎞⎜⎝
⎛−∞
⎥⎥⎥
⎦
⎤
⎢⎢⎢
⎣
⎡⎟⎠
⎞⎜⎝
⎛−∞
−−+−
=
hcc
ge
hcc
geGs
ssc
w
scK
αα
αα
αα
αα
(6)
The material parameters k
cvg and k
svg and g1 can
be calibrated by fitting experimental data relevant to free (evaporable) water content in concrete at various ages (Di Luzio & Cusatis 2009b).
2.2 Temperature evolution
Note that, at early age, since the chemical reactions associated with cement hydration and SF reaction are exothermic, the temperature field is not uniform for non-adiabatic systems even if the environmental temperature is constant. Heat conduction can be described in concrete, at least for temperature not exceeding 100°C (Bažant & Kaplan 1996), by Fourier’s law, which reads
T∇−= λq (7)
where q is the heat flux, T is the absolute temperature, and λ is the heat conductivity; in this

a finite element mesh with 30mm-sized. Because the use of small mesh size less than 30mm did not change the results significantly, but led to an increased com-putation time. The relationship between mesh size and convergent tendency in this hollow slab model is shown Figure 9.
4.2 Hollow slab analysis model To perform 3D nonlinear FEM analysis, the proper-ties of hollow slab model was idealized. It had 8.9m length, 300mm width. The reasons of performing idealize process are like this
It was possible to estimate the whole capacity of slab with the capacity of one module slab model be-cause hollow spheres were located with uniform gap toward width direction of slab.
So, to compare the impact of hollow shapes on flexural capacity of slabs, it was enough to perform FEM analysis with one module model of slab. And this way was time-efficient than using whole slab model.
Table 2. Properties of hollow slab model. Width 300 mm Height 250 mm Length 8900 mm
Upper D10 x 2 Reinforced bar Lower D13 x 2
Boundary condition Fixed end Self-weight 330~600kg/m2 Dead load 185kg/m2
Load Live load 200kg/m2 ~ fck 24 MPa Fy 400 MPa
The conditions of support were fixed. Because, In FEM Analysis, simple supported condition might bring about error such as stress concentration. The reason of using distributed load was the same. Loads were imposed on slabs in order likes self-weight, dead load and live load until the slab was destroyed.
Further information and properties of hollow sphere is shown Table 3.
5 RESULTS AND ANALYSIS
5.1 Results of numerical simulations The 3D hollow slab models, applied above hollow spheres (Table 2), were analyzed by numerical simu-lations using nonlinear Finite Element Method pro-gram.
Table 4 is shown that results of computation about 8 cases of hollow slabs which can be distin-guished by hollow sphere shapes and 1 case of solid slab.
In the results of computation, 8 cases of hollow slabs were judged safe in design load. And some of hollow slabs show a good load bearing capacity and stiffness, compared with solid slab,
The results, analyzed more concretely, are as fol-lows:
As compared difference design load and ultimate load, hollow slab applied 'Rect Donuts(D=50mm)' was shown the largest difference, 26.24kN. It means additional load bearing capacity of slab after dead load. Because a dead load varied with hollow vol-ume, it was reasonable to compare real capacity of hollow slab.
The deflections in design load were varied with weight reduction of slabs. Round Rect(R=50mm)
Table 4. Numerical simulation result of three-dimensional hollow slab model.
Solid Sphere Mushroom Ellipse Rect Donuts (D=50)
Rect Donuts (D=30)
Round Rect(R=70)
Round Rect(R=50) Square
Self-weight (kN/m2) 5.9 4.7 4.4 4.2 3.9 3.9 3.8 3.5 3.2
Dead Load (kN/m2) 9.7 8.5 8.2 8 7.7 7.7 7.6 7.3 7
Ultimate Load (kN/m2) 34.36 33.80 33.35 33.97 33.94 33.50 33.12 32.08 28.50
Dead LoadUltimate Load
−− 28.2% 25.1% 24.6% 23.6% 22.7% 23.0% 22.9% 22.8% 24.6%
Deflection at D.L (mm) 2.16 1.86 1.72 1.68 1.57 1.58 1.61 1.56 1.61
Deflection at U.L (mm) 22.42 21.32 22.60 23.71 23.33 24.02 24.23 24.68 22.30
Failure mode at Design Load F F F F F F F F F
Failure mode at U.L F F F F F F F F F+S
* F : Flexural Crack Occur, S : Shear Crack Occur
Proceedings of FraMCoS-7, May 23-28, 2010
hThD ∇−= ),(J (1)
The proportionality coefficient D(h,T) is called moisture permeability and it is a nonlinear function of the relative humidity h and temperature T (Bažant & Najjar 1972). The moisture mass balance requires that the variation in time of the water mass per unit volume of concrete (water content w) be equal to the divergence of the moisture flux J
J•∇=∂
∂−
t
w (2)
The water content w can be expressed as the sum
of the evaporable water we (capillary water, water vapor, and adsorbed water) and the non-evaporable (chemically bound) water wn (Mills 1966, Pantazopoulo & Mills 1995). It is reasonable to assume that the evaporable water is a function of relative humidity, h, degree of hydration, αc, and degree of silica fume reaction, αs, i.e. we=we(h,αc,αs) = age-dependent sorption/desorption isotherm (Norling Mjonell 1997). Under this assumption and by substituting Equation 1 into Equation 2 one obtains
nscw
s
ew
c
ew
hh
Dt
h
h
ew
&&& ++∂
∂
∂
∂
=∇•∇+∂
∂
∂
∂
− αα
αα
)(
(3)
where ∂we/∂h is the slope of the sorption/desorption isotherm (also called moisture capacity). The governing equation (Equation 3) must be completed by appropriate boundary and initial conditions.
The relation between the amount of evaporable water and relative humidity is called ‘‘adsorption isotherm” if measured with increasing relativity humidity and ‘‘desorption isotherm” in the opposite case. Neglecting their difference (Xi et al. 1994), in the following, ‘‘sorption isotherm” will be used with reference to both sorption and desorption conditions. By the way, if the hysteresis of the moisture isotherm would be taken into account, two different relation, evaporable water vs relative humidity, must be used according to the sign of the variation of the relativity humidity. The shape of the sorption isotherm for HPC is influenced by many parameters, especially those that influence extent and rate of the chemical reactions and, in turn, determine pore structure and pore size distribution (water-to-cement ratio, cement chemical composition, SF content, curing time and method, temperature, mix additives, etc.). In the literature various formulations can be found to describe the sorption isotherm of normal concrete (Xi et al. 1994). However, in the present paper the semi-empirical expression proposed by Norling Mjornell (1997) is adopted because it
explicitly accounts for the evolution of hydration reaction and SF content. This sorption isotherm reads
( ) ( )( )
( ) ( )⎥⎥
⎦
⎤
⎢⎢
⎣
⎡
⎥⎥⎥
⎦
⎤
⎢⎢⎢
⎣
⎡
−
−∞
+
−∞
−=
1110
,1
110
11,
1,,
hcc
ge
scK
hcc
ge
scG
sch
ew
αα
αα
αα
αααα
(4)
where the first term (gel isotherm) represents the physically bound (adsorbed) water and the second term (capillary isotherm) represents the capillary water. This expression is valid only for low content of SF. The coefficient G1 represents the amount of water per unit volume held in the gel pores at 100% relative humidity, and it can be expressed (Norling Mjornell 1997) as
( ) ss
s
vgkc
c
c
vgk
scG αααα +=,1
(5)
where k
cvg and k
svg are material parameters. From the
maximum amount of water per unit volume that can fill all pores (both capillary pores and gel pores), one can calculate K1 as one obtains
( )1
110
110
11
22.0188.00
,1
−⎟⎠
⎞⎜⎝
⎛−∞
⎥⎥⎥
⎦
⎤
⎢⎢⎢
⎣
⎡⎟⎠
⎞⎜⎝
⎛−∞
−−+−
=
hcc
ge
hcc
geGs
ssc
w
scK
αα
αα
αα
αα
(6)
The material parameters k
cvg and k
svg and g1 can
be calibrated by fitting experimental data relevant to free (evaporable) water content in concrete at various ages (Di Luzio & Cusatis 2009b).
2.2 Temperature evolution
Note that, at early age, since the chemical reactions associated with cement hydration and SF reaction are exothermic, the temperature field is not uniform for non-adiabatic systems even if the environmental temperature is constant. Heat conduction can be described in concrete, at least for temperature not exceeding 100°C (Bažant & Kaplan 1996), by Fourier’s law, which reads
T∇−= λq (7)
where q is the heat flux, T is the absolute temperature, and λ is the heat conductivity; in this
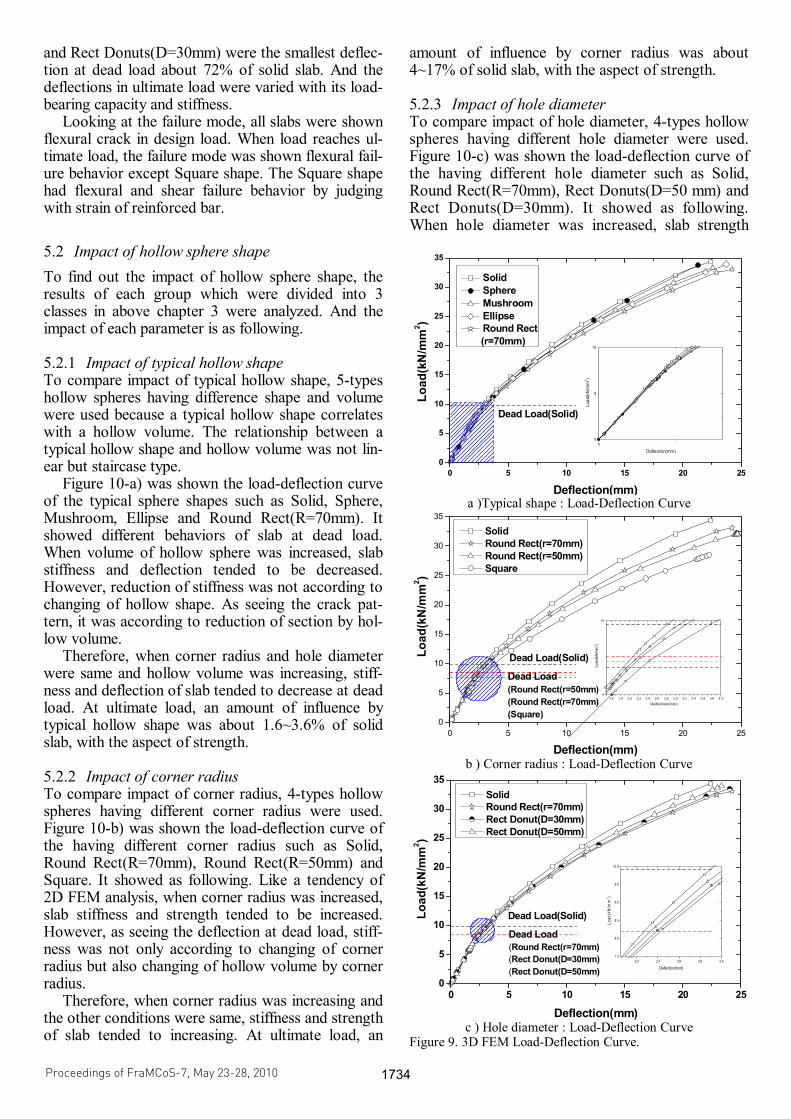
and Rect Donuts(D=30mm) were the smallest deflec-tion at dead load about 72% of solid slab. And the deflections in ultimate load were varied with its load-bearing capacity and stiffness.
Looking at the failure mode, all slabs were shown flexural crack in design load. When load reaches ul-timate load, the failure mode was shown flexural fail-ure behavior except Square shape. The Square shape had flexural and shear failure behavior by judging with strain of reinforced bar.
5.2 Impact of hollow sphere shape To find out the impact of hollow sphere shape, the results of each group which were divided into 3 classes in above chapter 3 were analyzed. And the impact of each parameter is as following.
5.2.1 Impact of typical hollow shape To compare impact of typical hollow shape, 5-types hollow spheres having difference shape and volume were used because a typical hollow shape correlates with a hollow volume. The relationship between a typical hollow shape and hollow volume was not lin-ear but staircase type.
Figure 10-a) was shown the load-deflection curve of the typical sphere shapes such as Solid, Sphere, Mushroom, Ellipse and Round Rect(R=70mm). It showed different behaviors of slab at dead load. When volume of hollow sphere was increased, slab stiffness and deflection tended to be decreased. However, reduction of stiffness was not according to changing of hollow shape. As seeing the crack pat-tern, it was according to reduction of section by hol-low volume.
Therefore, when corner radius and hole diameter were same and hollow volume was increasing, stiff-ness and deflection of slab tended to decrease at dead load. At ultimate load, an amount of influence by typical hollow shape was about 1.6~3.6% of solid slab, with the aspect of strength.
5.2.2 Impact of corner radius To compare impact of corner radius, 4-types hollow spheres having different corner radius were used. Figure 10-b) was shown the load-deflection curve of the having different corner radius such as Solid, Round Rect(R=70mm), Round Rect(R=50mm) and Square. It showed as following. Like a tendency of 2D FEM analysis, when corner radius was increased, slab stiffness and strength tended to be increased. However, as seeing the deflection at dead load, stiff-ness was not only according to changing of corner radius but also changing of hollow volume by corner radius.
Therefore, when corner radius was increasing and the other conditions were same, stiffness and strength of slab tended to increasing. At ultimate load, an
amount of influence by corner radius was about 4~17% of solid slab, with the aspect of strength.
5.2.3 Impact of hole diameter To compare impact of hole diameter, 4-types hollow spheres having different hole diameter were used. Figure 10-c) was shown the load-deflection curve of the having different hole diameter such as Solid, Round Rect(R=70mm), Rect Donuts(D=50 mm) and Rect Donuts(D=30mm). It showed as following. When hole diameter was increased, slab strength
0 5 10 15 20 250
5
10
15
20
25
30
35
Solid Sphere Mushroom Ellipse Round Rect
(r=70mm)
00
5
10
Load
(kN
/mm
2 )
Deflection(mm)
Load
(kN
/mm
2 )
Deflection(mm)
Dead Load(Solid)
a )Typical shape : Load-Deflection Curve
0 5 10 15 20 250
5
10
15
20
25
30
35
Dead Load(Round Rect(r=50mm)(Round Rect(r=70mm)(Square)
Solid Round Rect(r=70mm) Round Rect(r=50mm) Square
1.6 1.8 2.0 2.2 2.4 2.6 2.8 3.0 3.2 3.4 3.6 3.8 4.05
10
Load
(kN
/mm
2 )
Deflection(mm)
Load
(kN
/mm
2 )
Deflection(mm)
Dead Load(Solid)
b ) Corner radius : Load-Deflection Curve
0 5 10 15 20 250
5
10
15
20
25
30
35 Solid Round Rect(r=70mm) Rect Donut(D=30mm) Rect Donut(D=50mm)
Dead Load(Solid)
2.2 2.4 2.6 2.8 3.07.5
8.0
8.5
9.0
9.5
10.0
Load
(kN
/mm
2 )
Deflection(mm)
Load
(kN
/mm
2 )
Deflection(mm)
Dead Load(Round Rect(r=70mm)(Rect Donut(D=30mm)(Rect Donut(D=50mm)
c ) Hole diameter : Load-Deflection Curve
Figure 9. 3D FEM Load-Deflection Curve.
Proceedings of FraMCoS-7, May 23-28, 2010
hThD ∇−= ),(J (1)
The proportionality coefficient D(h,T) is called moisture permeability and it is a nonlinear function of the relative humidity h and temperature T (Bažant & Najjar 1972). The moisture mass balance requires that the variation in time of the water mass per unit volume of concrete (water content w) be equal to the divergence of the moisture flux J
J•∇=∂
∂−
t
w (2)
The water content w can be expressed as the sum
of the evaporable water we (capillary water, water vapor, and adsorbed water) and the non-evaporable (chemically bound) water wn (Mills 1966, Pantazopoulo & Mills 1995). It is reasonable to assume that the evaporable water is a function of relative humidity, h, degree of hydration, αc, and degree of silica fume reaction, αs, i.e. we=we(h,αc,αs) = age-dependent sorption/desorption isotherm (Norling Mjonell 1997). Under this assumption and by substituting Equation 1 into Equation 2 one obtains
nscw
s
ew
c
ew
hh
Dt
h
h
ew
&&& ++∂
∂
∂
∂
=∇•∇+∂
∂
∂
∂
− αα
αα
)(
(3)
where ∂we/∂h is the slope of the sorption/desorption isotherm (also called moisture capacity). The governing equation (Equation 3) must be completed by appropriate boundary and initial conditions.
The relation between the amount of evaporable water and relative humidity is called ‘‘adsorption isotherm” if measured with increasing relativity humidity and ‘‘desorption isotherm” in the opposite case. Neglecting their difference (Xi et al. 1994), in the following, ‘‘sorption isotherm” will be used with reference to both sorption and desorption conditions. By the way, if the hysteresis of the moisture isotherm would be taken into account, two different relation, evaporable water vs relative humidity, must be used according to the sign of the variation of the relativity humidity. The shape of the sorption isotherm for HPC is influenced by many parameters, especially those that influence extent and rate of the chemical reactions and, in turn, determine pore structure and pore size distribution (water-to-cement ratio, cement chemical composition, SF content, curing time and method, temperature, mix additives, etc.). In the literature various formulations can be found to describe the sorption isotherm of normal concrete (Xi et al. 1994). However, in the present paper the semi-empirical expression proposed by Norling Mjornell (1997) is adopted because it
explicitly accounts for the evolution of hydration reaction and SF content. This sorption isotherm reads
( ) ( )( )
( ) ( )⎥⎥
⎦
⎤
⎢⎢
⎣
⎡
⎥⎥⎥
⎦
⎤
⎢⎢⎢
⎣
⎡
−
−∞
+
−∞
−=
1110
,1
110
11,
1,,
hcc
ge
scK
hcc
ge
scG
sch
ew
αα
αα
αα
αααα
(4)
where the first term (gel isotherm) represents the physically bound (adsorbed) water and the second term (capillary isotherm) represents the capillary water. This expression is valid only for low content of SF. The coefficient G1 represents the amount of water per unit volume held in the gel pores at 100% relative humidity, and it can be expressed (Norling Mjornell 1997) as
( ) ss
s
vgkc
c
c
vgk
scG αααα +=,1
(5)
where k
cvg and k
svg are material parameters. From the
maximum amount of water per unit volume that can fill all pores (both capillary pores and gel pores), one can calculate K1 as one obtains
( )1
110
110
11
22.0188.00
,1
−⎟⎠
⎞⎜⎝
⎛−∞
⎥⎥⎥
⎦
⎤
⎢⎢⎢
⎣
⎡⎟⎠
⎞⎜⎝
⎛−∞
−−+−
=
hcc
ge
hcc
geGs
ssc
w
scK
αα
αα
αα
αα
(6)
The material parameters k
cvg and k
svg and g1 can
be calibrated by fitting experimental data relevant to free (evaporable) water content in concrete at various ages (Di Luzio & Cusatis 2009b).
2.2 Temperature evolution
Note that, at early age, since the chemical reactions associated with cement hydration and SF reaction are exothermic, the temperature field is not uniform for non-adiabatic systems even if the environmental temperature is constant. Heat conduction can be described in concrete, at least for temperature not exceeding 100°C (Bažant & Kaplan 1996), by Fourier’s law, which reads
T∇−= λq (7)
where q is the heat flux, T is the absolute temperature, and λ is the heat conductivity; in this

tended to be increased a little, 1.3~4% of solid slab. However, as seeing the deflection and stiffness,
hollow slabs, applied Rect Donuts(D=50mm) and Rect Donuts(D=30mm), showed bigger stiffness and smaller deflection than hollow slab, applied Round Rect(R=70mm) which had no hole. In addition, vol-ume of Round Rect(R=70mm) was more than vol-ume of Rect Donuts(D=50mm) and Rect Donuts (D=30mm). Therefore, the hole of hollow sphere functions as preventing a deflection of slab.
5.3 Parametric analysis Based on the results of impact of hollow shape (chapter 5.2), parametric analysis was performed. The unknown results, which were not performed numerical simulations, were assumed by linear inter-polation.
A parametric analysis was performed as following conditions. The typical shape parameters were fix and the other parameters such as corner radius and hole diameter were changing. As compared the ulti-mate load-bearing capacity, the effects of corner ra-dius and hole diameter were evaluated in combina-tion. Figure 10 was shown the tendency of the each parameter in combination as following.
1) When the typical hollow shape is same, and the
corner radius or the hole diameter is increasing, the capacities of hollow slab is increasing.
2) When the typical hollow shape is cuboid type, the increase by corner radius or hole diameter will be larger than the other typical hollow shape.
6 DEVELOPMENT OF THE OPTIMAL HOLLOW SPHEAR SHAPE
Based on the results of numerical simulation, the op-timal hollow sphere shape was derived. To derive the optimal hollow sphere shape, three aspects of criteri-ons which were safety, strength (additional load bearing capacity of slab after dead load) and deflec-
tion (at same loading condition) were considered. 1) Safety Judged from safety, all hollow slabs were safe in
design load. However, failure mode of square type hollow slab was shear in ultimate load. The shear failure mode is dangerous because it is very sudden and brittle. Therefore square shape hollow sphere is not suitable for the hollow slab system.
2) Strength As Compared to solid slab, merely 3 cases of hol-
low sphere shapes, 'Rect Donuts(D=50mm)', 'Rect Donuts(D=30mm)' and 'Round Rect(R=70mm)' were good load-bearing capacity without decreasing of weight reduction ratio. (See Fig. 11-a)
3) Deflection The hollow slab stiffness tended to decrease be-
cause of reduction of section area. So, as comparing
a ) Ultimate Load-Dead Load capacity
b ) Deflection at same load
Figure 11. Derivation of the optimal hollow sphere shape.
a )Typical shape : Sphere b ) Typical shape : Elliptical Sphere c ) Typical shape : Cuboid
Figure 10. Parametric analysis.
Proceedings of FraMCoS-7, May 23-28, 2010
hThD ∇−= ),(J (1)
The proportionality coefficient D(h,T) is called moisture permeability and it is a nonlinear function of the relative humidity h and temperature T (Bažant & Najjar 1972). The moisture mass balance requires that the variation in time of the water mass per unit volume of concrete (water content w) be equal to the divergence of the moisture flux J
J•∇=∂
∂−
t
w (2)
The water content w can be expressed as the sum
of the evaporable water we (capillary water, water vapor, and adsorbed water) and the non-evaporable (chemically bound) water wn (Mills 1966, Pantazopoulo & Mills 1995). It is reasonable to assume that the evaporable water is a function of relative humidity, h, degree of hydration, αc, and degree of silica fume reaction, αs, i.e. we=we(h,αc,αs) = age-dependent sorption/desorption isotherm (Norling Mjonell 1997). Under this assumption and by substituting Equation 1 into Equation 2 one obtains
nscw
s
ew
c
ew
hh
Dt
h
h
ew
&&& ++∂
∂
∂
∂
=∇•∇+∂
∂
∂
∂
− αα
αα
)(
(3)
where ∂we/∂h is the slope of the sorption/desorption isotherm (also called moisture capacity). The governing equation (Equation 3) must be completed by appropriate boundary and initial conditions.
The relation between the amount of evaporable water and relative humidity is called ‘‘adsorption isotherm” if measured with increasing relativity humidity and ‘‘desorption isotherm” in the opposite case. Neglecting their difference (Xi et al. 1994), in the following, ‘‘sorption isotherm” will be used with reference to both sorption and desorption conditions. By the way, if the hysteresis of the moisture isotherm would be taken into account, two different relation, evaporable water vs relative humidity, must be used according to the sign of the variation of the relativity humidity. The shape of the sorption isotherm for HPC is influenced by many parameters, especially those that influence extent and rate of the chemical reactions and, in turn, determine pore structure and pore size distribution (water-to-cement ratio, cement chemical composition, SF content, curing time and method, temperature, mix additives, etc.). In the literature various formulations can be found to describe the sorption isotherm of normal concrete (Xi et al. 1994). However, in the present paper the semi-empirical expression proposed by Norling Mjornell (1997) is adopted because it
explicitly accounts for the evolution of hydration reaction and SF content. This sorption isotherm reads
( ) ( )( )
( ) ( )⎥⎥
⎦
⎤
⎢⎢
⎣
⎡
⎥⎥⎥
⎦
⎤
⎢⎢⎢
⎣
⎡
−
−∞
+
−∞
−=
1110
,1
110
11,
1,,
hcc
ge
scK
hcc
ge
scG
sch
ew
αα
αα
αα
αααα
(4)
where the first term (gel isotherm) represents the physically bound (adsorbed) water and the second term (capillary isotherm) represents the capillary water. This expression is valid only for low content of SF. The coefficient G1 represents the amount of water per unit volume held in the gel pores at 100% relative humidity, and it can be expressed (Norling Mjornell 1997) as
( ) ss
s
vgkc
c
c
vgk
scG αααα +=,1
(5)
where k
cvg and k
svg are material parameters. From the
maximum amount of water per unit volume that can fill all pores (both capillary pores and gel pores), one can calculate K1 as one obtains
( )1
110
110
11
22.0188.00
,1
−⎟⎠
⎞⎜⎝
⎛−∞
⎥⎥⎥
⎦
⎤
⎢⎢⎢
⎣
⎡⎟⎠
⎞⎜⎝
⎛−∞
−−+−
=
hcc
ge
hcc
geGs
ssc
w
scK
αα
αα
αα
αα
(6)
The material parameters k
cvg and k
svg and g1 can
be calibrated by fitting experimental data relevant to free (evaporable) water content in concrete at various ages (Di Luzio & Cusatis 2009b).
2.2 Temperature evolution
Note that, at early age, since the chemical reactions associated with cement hydration and SF reaction are exothermic, the temperature field is not uniform for non-adiabatic systems even if the environmental temperature is constant. Heat conduction can be described in concrete, at least for temperature not exceeding 100°C (Bažant & Kaplan 1996), by Fourier’s law, which reads
T∇−= λq (7)
where q is the heat flux, T is the absolute temperature, and λ is the heat conductivity; in this

the deflection at same load, the optimal hollow sphere shape was derived. (See Fig. 11-b)
After all the analysis, 'Rect Donuts(D=50mm)'
shape which had hole inside was judged as the opti-mal hollow sphere shape.
7 CONCLUSION
In this study, several hollow slabs which had different hollow sphere shapes were analyzed to compare with structure capacity and failure mode by using finite element method program. Based on the results of numerical simulation, the impacts of hollow sphere and the optimal hollow sphere shape could be de-rived. There are conclusions about this study.
1) Capacity of hollow slab and failure mode was related with hollow sphere shape. Especially, these are proved that corner radius, hole diameter and vol-ume of hollow sphere were closely related with them.
2) As corner radius of hollow sphere was smaller, crack caused by concentrated stress was developed earlier. The hollow sphere shapes having corner ra-dius more than 50mm was appropriate in 250mm thick hollow slab.
3) The hole of hollow sphere functions as prevent-ing a deflection of slab. And as hole diameter of hol-low sphere was smaller, the deflection of slab was bigger.
4) The hollow slab having optimal hollow sphere, Rect donuts(D=50mm), that demonstrated in this study showed more than 99% of load resisting capac-ity and less than 72% deflection at design load which compared normal slab. Therefore, it is proved that the Rect donuts(D=50mm) is optimal hollow sphere shape in 250mm thick hollow slab.
ACKNOWLEDGMENTS
This work was supported by Samsung Construction and Trade Inc, 2009
REFERENCES
Aldejohann. M. & Schnellenbach-Held. 2003. Investigations on the Shear Capacity of Biaxial Hollow Slabs - Test Re-sults and Evaluation. Darmstadt Concrete V. 18
ACI Committe 318. 2005. Building Code Requirement for Structural Concrete. American Concrete Institute.
J.H. Chung, N.K. Ahn, H.K. Choi. & C.S. Chang. 2009. An analytical study of optimal hollow sphere shapes in hollow slab. Journal of the korea institute for structural mainte-nance. 159-162
J.H. Chung, H.K. CHOI, S.C. LEE, J.K. Oh. & C.S. CHOI. 2009. An Analytical Study of the Impact of Hollow Sphere on Biaxial Hollow slab. Proceeding of annual conference of the architectural institute of korea. 475-478
J.H. Chung, H.K. CHOI, S.C. LEE & C.S.CHOI. 2009. An analytical study of optimal hollow sphere shapes in hollow Slabs. Computational Design in Engineering.
LUSAS Co. 1985. LUSAS : Modeller Reference Manual. LU-SAS Corporation.
Schnellenbach-Held & Karsten Pfeffer. 2002. Punching behav-ior of biaxial hollow slabs. Cement & Concrete Compos-ites. V. 24. I. 6. 551-556
Z. Lounis. & M.Z. Cohn. 1993. Optimization of precast prestressed concrete bridge girder systems. PCI J. 123 (3) 60– 77.
Proceedings of FraMCoS-7, May 23-28, 2010
hThD ∇−= ),(J (1)
The proportionality coefficient D(h,T) is called moisture permeability and it is a nonlinear function of the relative humidity h and temperature T (Bažant & Najjar 1972). The moisture mass balance requires that the variation in time of the water mass per unit volume of concrete (water content w) be equal to the divergence of the moisture flux J
J•∇=∂
∂−
t
w (2)
The water content w can be expressed as the sum
of the evaporable water we (capillary water, water vapor, and adsorbed water) and the non-evaporable (chemically bound) water wn (Mills 1966, Pantazopoulo & Mills 1995). It is reasonable to assume that the evaporable water is a function of relative humidity, h, degree of hydration, αc, and degree of silica fume reaction, αs, i.e. we=we(h,αc,αs) = age-dependent sorption/desorption isotherm (Norling Mjonell 1997). Under this assumption and by substituting Equation 1 into Equation 2 one obtains
nscw
s
ew
c
ew
hh
Dt
h
h
ew
&&& ++∂
∂
∂
∂
=∇•∇+∂
∂
∂
∂
− αα
αα
)(
(3)
where ∂we/∂h is the slope of the sorption/desorption isotherm (also called moisture capacity). The governing equation (Equation 3) must be completed by appropriate boundary and initial conditions.
The relation between the amount of evaporable water and relative humidity is called ‘‘adsorption isotherm” if measured with increasing relativity humidity and ‘‘desorption isotherm” in the opposite case. Neglecting their difference (Xi et al. 1994), in the following, ‘‘sorption isotherm” will be used with reference to both sorption and desorption conditions. By the way, if the hysteresis of the moisture isotherm would be taken into account, two different relation, evaporable water vs relative humidity, must be used according to the sign of the variation of the relativity humidity. The shape of the sorption isotherm for HPC is influenced by many parameters, especially those that influence extent and rate of the chemical reactions and, in turn, determine pore structure and pore size distribution (water-to-cement ratio, cement chemical composition, SF content, curing time and method, temperature, mix additives, etc.). In the literature various formulations can be found to describe the sorption isotherm of normal concrete (Xi et al. 1994). However, in the present paper the semi-empirical expression proposed by Norling Mjornell (1997) is adopted because it
explicitly accounts for the evolution of hydration reaction and SF content. This sorption isotherm reads
( ) ( )( )
( ) ( )⎥⎥
⎦
⎤
⎢⎢
⎣
⎡
⎥⎥⎥
⎦
⎤
⎢⎢⎢
⎣
⎡
−
−∞
+
−∞
−=
1110
,1
110
11,
1,,
hcc
ge
scK
hcc
ge
scG
sch
ew
αα
αα
αα
αααα
(4)
where the first term (gel isotherm) represents the physically bound (adsorbed) water and the second term (capillary isotherm) represents the capillary water. This expression is valid only for low content of SF. The coefficient G1 represents the amount of water per unit volume held in the gel pores at 100% relative humidity, and it can be expressed (Norling Mjornell 1997) as
( ) ss
s
vgkc
c
c
vgk
scG αααα +=,1
(5)
where k
cvg and k
svg are material parameters. From the
maximum amount of water per unit volume that can fill all pores (both capillary pores and gel pores), one can calculate K1 as one obtains
( )1
110
110
11
22.0188.00
,1
−⎟⎠
⎞⎜⎝
⎛−∞
⎥⎥⎥
⎦
⎤
⎢⎢⎢
⎣
⎡⎟⎠
⎞⎜⎝
⎛−∞
−−+−
=
hcc
ge
hcc
geGs
ssc
w
scK
αα
αα
αα
αα
(6)
The material parameters k
cvg and k
svg and g1 can
be calibrated by fitting experimental data relevant to free (evaporable) water content in concrete at various ages (Di Luzio & Cusatis 2009b).
2.2 Temperature evolution
Note that, at early age, since the chemical reactions associated with cement hydration and SF reaction are exothermic, the temperature field is not uniform for non-adiabatic systems even if the environmental temperature is constant. Heat conduction can be described in concrete, at least for temperature not exceeding 100°C (Bažant & Kaplan 1996), by Fourier’s law, which reads
T∇−= λq (7)
where q is the heat flux, T is the absolute temperature, and λ is the heat conductivity; in this