An analysis of Threats to World Heritage Sites 1994-2004 of Threats 1994-2004... · Threats to...
21
ICOMOS Threats to World Heritage Sites 1994-2004: An Analysis May 2005
Transcript of An analysis of Threats to World Heritage Sites 1994-2004 of Threats 1994-2004... · Threats to...

ICOMOS
Threats to World Heritage Sites 1994-2004: An Analysis
May 2005
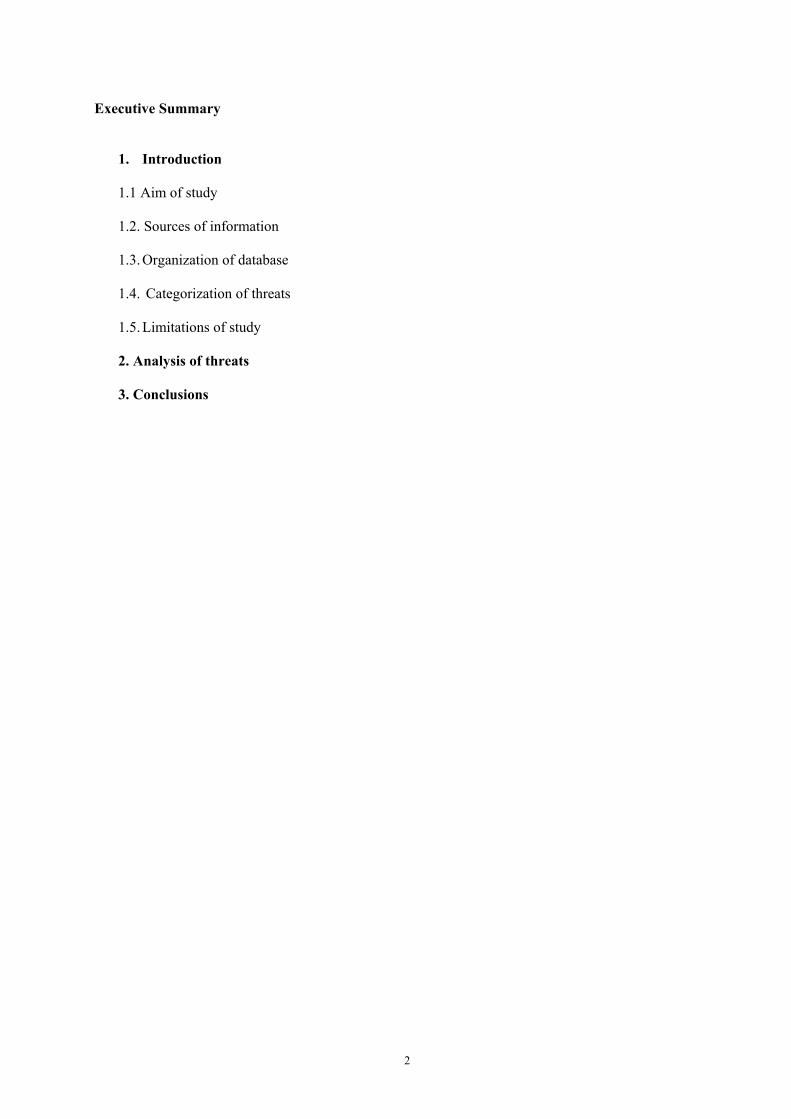
Executive Summary
1. Introduction
1.1 Aim of study 1.2. Sources of information 1.3. Organization of database
1.4. Categorization of threats
1.5. Limitations of study
2. Analysis of threats 3. Conclusions
2
Executive Summary This paper presents the results of an analysis of threats to cultural and mixed World Heritage sites (WHSs) from information presented to the World Heritage Bureau and World Heritage (WH) Committee, and within ICOMOS Mission and Evaluation Reports, between 1994 and 2004. The analysis covers 1570 threats reported for 614 sites, (617 cultural and 24 mixed). These sites account for 29% of the total of all cultural and mixed sites. The analysis was carried out on a site by site basis and the sites were grouped into UNESCO Regions for analysis. The survey was initiated to substantiate whether developmental threats to these sites were increasing – as they were perceived to be. This trend was confirmed in four out of five Regions. It was most pronounced in Europe and North America where for the last 5 years of the survey there were developmental threats reported at 57 sites compared to 23 sites in the first six years. In Latin America the figures were 27 and 6; in Asia Pacific 33 and 20; and the Arab States 19 and 16. Only in Africa was the trend reversed: the numbers were 2 and 6. If the last two years are compared with the first six, the trend was even more pronounced: for Europe and North America 34 sites compared to 23 and for Latin America and 16 and 6. Overall for all Regions in 2004 there were 42 sites, more than double the 17 reported on in 2000. The other major finding of the analysis was that overall the two main threats with the highest percentages were management deficiencies and development. Failures in management taken as a whole form the largest threat in all Regions and all sites. 95% of sites in Africa are affected by management issues. 88% in Asia/ Pacific; 77% in Latin America; 77% in Arab States and 41% in Europe. 67% of Arab States are affected by development, 49% in Europe & North America; 47% in Latin /America; 40% in Asia Pacific and 42% in Africa. The other high figures are associated with major natural disasters. These particularly affect Latin America, 67%, and to a lesser extent Europe & North America, 26% and Africa, 21%. What might be called traditional threats: lack of conservation, threats to authenticity, environmental pressure, and over-visiting, by contrast, came out with quite low percentages. One clear lesson to come out of this analysis is the need to focus resources on promoting adequate management arrangements as these in turn could impact on the way development threats are countered. A second lesson is the need to ask for specific information in nomination documents on development pressures through the detailed documentation of proposed plans, and to press for a sustainable system of management to be in place for sites inscribed on the WH List. Thirdly risk preparedness could be a helpful instrument in dealing with natural disasters. Having established this database, it would be helpful to keep it up to date and to try and monitor over a longer period of time shifts in emphasis and changing trends.
3
1. Introduction This study was prompted by the perceived increase in the number of cultural and mixed sites being threatened by development projects. No data existed to establish whether or not this increase was real or otherwise or to quantify the increase. In order to set development threats into context, the study considered all major threats to cultural and mixed world heritage sites which had been identified in papers to the WH Bureau and WH Committee, and in ICOMOS mission and evaluation reports, between 1994 and 2004. As not all threats get reported to the WH Committee, the data considered is thus not exhaustive. State of Conservation Reports are only submitted for properties where the WH Centre has been made aware of a particular threat. Although in the Operational Guidelines, State Parties are asked to notify the WH Centre of major projects or development that might impact on the outstanding universal value of WHSs, this does not always happen as firstly there is no agreed definition of major and secondly, in some instances, the State Party might not consider that the proposals are a threat. Many of the State of Conservation Reports are prompted by comments from outside the country concerned. Given the very large number of sites now inscribed in the WH list only the most serious threats can now be considered by the WH Committee. This study seeks to complement the IUCN study on threats to natural sites between 1993 and 2002 with a different set of parameters. It is also carried out within a different framework, as threats to cultural heritage have not been subject to a similar degree of research and analysis around the world as has been the case with threats to natural heritage. ICOMOS considers that this is the first quantative global appraisal of threats to cultural and mixed heritage sites of international importance. It builds on the substantial volumes on Heritage at Risk published by ICOMOS between 2000 and 2004 that highlight thematic and regional case studies from around the world on a qualitative basis.
1.1. Aim of study
The aim of the study is to analyse threats to inscribed WHSs in order to identify the main threats impacting on cultural and mixed sites and to provide information on trends: whether or not certain types of threats are increasing, and whether threats are related to high visitor numbers, lack of visitors, lack of funds for management or lack of adequate management or legislative controls. In concordance with the World Heritage Convention, the study focused on identifying threats that could jeopardize the outstanding universal values for which the properties had been inscribed. The study aimed to provides both qualitative and quantitative data on threats.
1.2 Sources of information The following sources of information were used: - State of conservation reports from the World Heritage Bureau (annual reports (Doc 1) and reports of the rapporteur (Doc 3)). - State of conservation reports from the World Heritage Committee (annual reports (Doc 2) and reports of the rapporteur (Doc 4)). - ICOMOS evaluations included in Doc 1 and/or 3 but coded as Doc 5. - ICOMOS Mission reports (code Doc 6). - Extraordinary Session reports of the World Heritage Bureau (Doc 1(SE)).
4
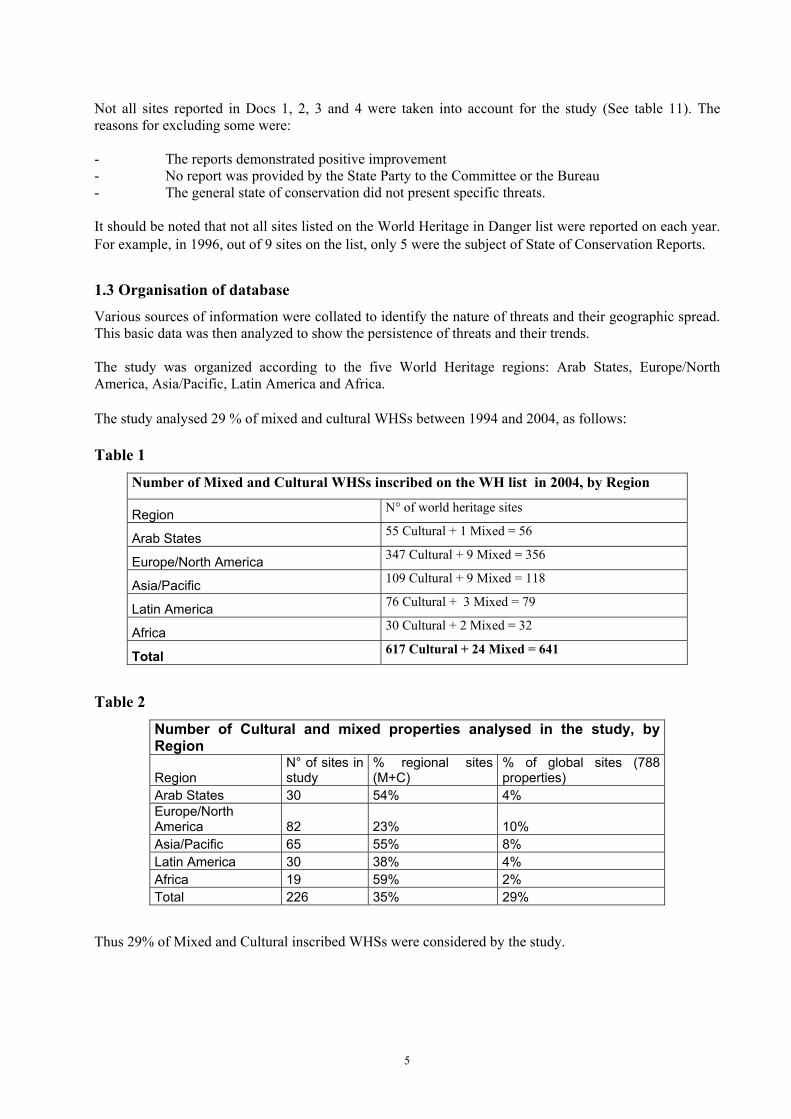
Not all sites reported in Docs 1, 2, 3 and 4 were taken into account for the study (See table 11). The reasons for excluding some were: - The reports demonstrated positive improvement - No report was provided by the State Party to the Committee or the Bureau - The general state of conservation did not present specific threats. It should be noted that not all sites listed on the World Heritage in Danger list were reported on each year. For example, in 1996, out of 9 sites on the list, only 5 were the subject of State of Conservation Reports.
1.3 Organisation of database Various sources of information were collated to identify the nature of threats and their geographic spread. This basic data was then analyzed to show the persistence of threats and their trends. The study was organized according to the five World Heritage regions: Arab States, Europe/North America, Asia/Pacific, Latin America and Africa. The study analysed 29 % of mixed and cultural WHSs between 1994 and 2004, as follows: Table 1
Number of Mixed and Cultural WHSs inscribed on the WH list in 2004, by Region
Region N° of world heritage sites
Arab States 55 Cultural + 1 Mixed = 56
Europe/North America 347 Cultural + 9 Mixed = 356
Asia/Pacific 109 Cultural + 9 Mixed = 118
Latin America 76 Cultural + 3 Mixed = 79
Africa 30 Cultural + 2 Mixed = 32
Total 617 Cultural + 24 Mixed = 641
Table 2
Number of Cultural and mixed properties analysed in the study, by Region
Region N° of sites in study
% regional sites (M+C)
% of global sites (788 properties)
Arab States 30 54% 4% Europe/North America 82 23% 10% Asia/Pacific 65 55% 8% Latin America 30 38% 4% Africa 19 59% 2% Total 226 35% 29%
Thus 29% of Mixed and Cultural inscribed WHSs were considered by the study.
5
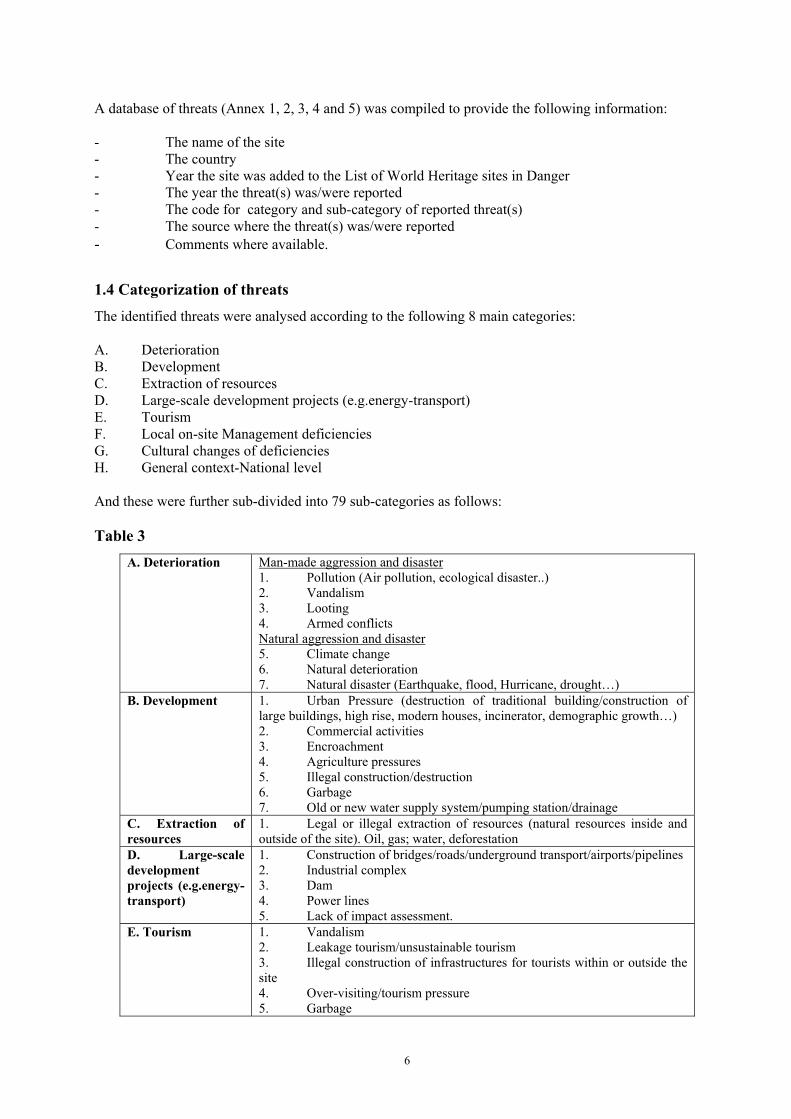
A database of threats (Annex 1, 2, 3, 4 and 5) was compiled to provide the following information: - The name of the site - The country - Year the site was added to the List of World Heritage sites in Danger - The year the threat(s) was/were reported - The code for category and sub-category of reported threat(s) - The source where the threat(s) was/were reported - Comments where available.
1.4 Categorization of threats The identified threats were analysed according to the following 8 main categories: A. Deterioration B. Development C. Extraction of resources D. Large-scale development projects (e.g.energy-transport) E. Tourism F. Local on-site Management deficiencies G. Cultural changes of deficiencies H. General context-National level And these were further sub-divided into 79 sub-categories as follows: Table 3
A. Deterioration Man-made aggression and disaster 1. Pollution (Air pollution, ecological disaster..) 2. Vandalism 3. Looting 4. Armed conflicts Natural aggression and disaster 5. Climate change 6. Natural deterioration 7. Natural disaster (Earthquake, flood, Hurricane, drought…)
B. Development 1. Urban Pressure (destruction of traditional building/construction of large buildings, high rise, modern houses, incinerator, demographic growth…) 2. Commercial activities 3. Encroachment 4. Agriculture pressures 5. Illegal construction/destruction 6. Garbage 7. Old or new water supply system/pumping station/drainage
C. Extraction of resources
1. Legal or illegal extraction of resources (natural resources inside and outside of the site). Oil, gas; water, deforestation
D. Large-scale development projects (e.g.energy-transport)
1. Construction of bridges/roads/underground transport/airports/pipelines 2. Industrial complex 3. Dam 4. Power lines 5. Lack of impact assessment.
E. Tourism 1. Vandalism 2. Leakage tourism/unsustainable tourism 3. Illegal construction of infrastructures for tourists within or outside the site 4. Over-visiting/tourism pressure 5. Garbage
6
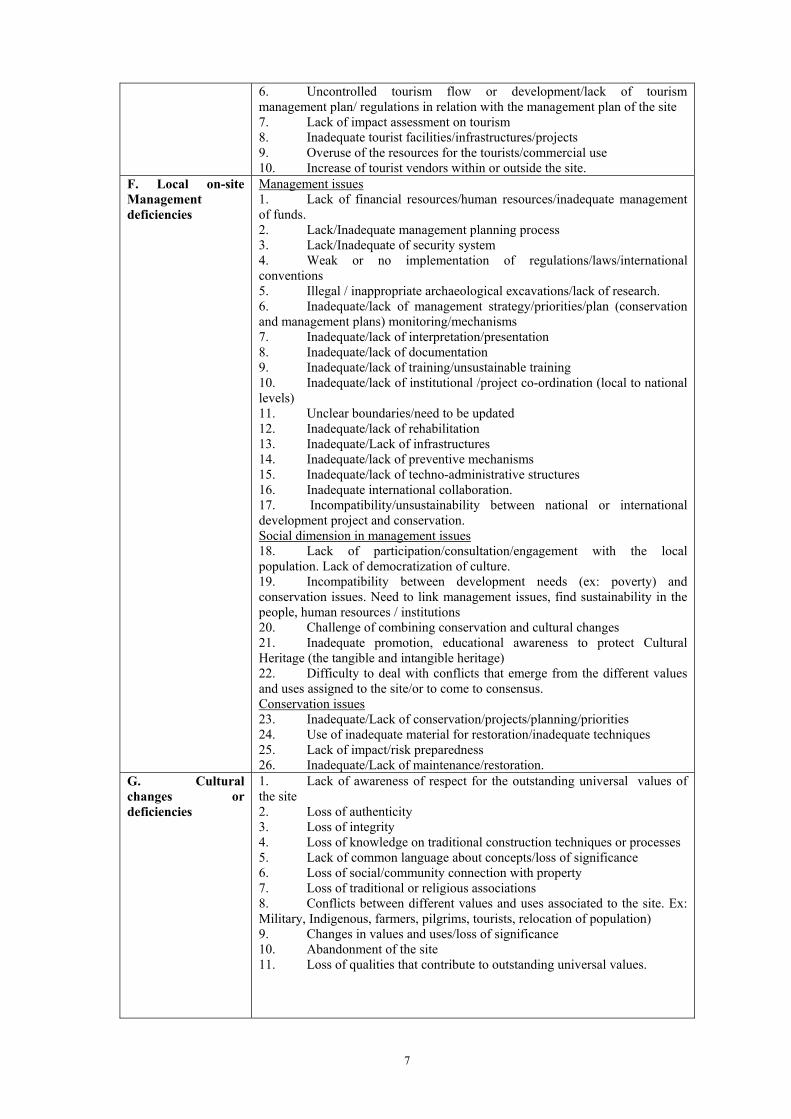
6. Uncontrolled tourism flow or development/lack of tourism management plan/ regulations in relation with the management plan of the site 7. Lack of impact assessment on tourism 8. Inadequate tourist facilities/infrastructures/projects 9. Overuse of the resources for the tourists/commercial use 10. Increase of tourist vendors within or outside the site.
F. Local on-site Management deficiencies
Management issues 1. Lack of financial resources/human resources/inadequate management of funds. 2. Lack/Inadequate management planning process 3. Lack/Inadequate of security system 4. Weak or no implementation of regulations/laws/international conventions 5. Illegal / inappropriate archaeological excavations/lack of research. 6. Inadequate/lack of management strategy/priorities/plan (conservation and management plans) monitoring/mechanisms 7. Inadequate/lack of interpretation/presentation 8. Inadequate/lack of documentation 9. Inadequate/lack of training/unsustainable training 10. Inadequate/lack of institutional /project co-ordination (local to national levels) 11. Unclear boundaries/need to be updated 12. Inadequate/lack of rehabilitation 13. Inadequate/Lack of infrastructures 14. Inadequate/lack of preventive mechanisms 15. Inadequate/lack of techno-administrative structures 16. Inadequate international collaboration. 17. Incompatibility/unsustainability between national or international development project and conservation. Social dimension in management issues 18. Lack of participation/consultation/engagement with the local population. Lack of democratization of culture. 19. Incompatibility between development needs (ex: poverty) and conservation issues. Need to link management issues, find sustainability in the people, human resources / institutions 20. Challenge of combining conservation and cultural changes 21. Inadequate promotion, educational awareness to protect Cultural Heritage (the tangible and intangible heritage) 22. Difficulty to deal with conflicts that emerge from the different values and uses assigned to the site/or to come to consensus. Conservation issues 23. Inadequate/Lack of conservation/projects/planning/priorities 24. Use of inadequate material for restoration/inadequate techniques 25. Lack of impact/risk preparedness 26. Inadequate/Lack of maintenance/restoration.
G. Cultural changes or deficiencies
1. Lack of awareness of respect for the outstanding universal values of the site 2. Loss of authenticity 3. Loss of integrity 4. Loss of knowledge on traditional construction techniques or processes 5. Lack of common language about concepts/loss of significance 6. Loss of social/community connection with property 7. Loss of traditional or religious associations 8. Conflicts between different values and uses associated to the site. Ex: Military, Indigenous, farmers, pilgrims, tourists, relocation of population) 9. Changes in values and uses/loss of significance 10. Abandonment of the site 11. Loss of qualities that contribute to outstanding universal values.
7
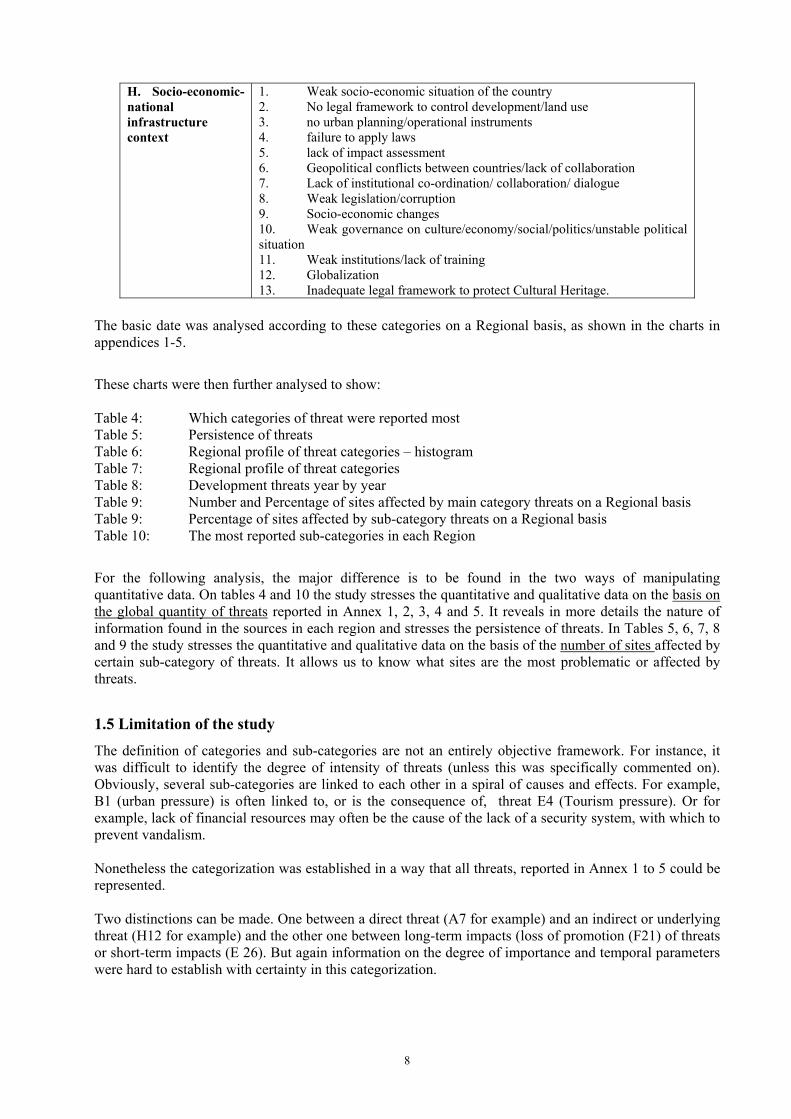
H. Socio-economic-national infrastructure context
1. Weak socio-economic situation of the country 2. No legal framework to control development/land use 3. no urban planning/operational instruments 4. failure to apply laws 5. lack of impact assessment 6. Geopolitical conflicts between countries/lack of collaboration 7. Lack of institutional co-ordination/ collaboration/ dialogue 8. Weak legislation/corruption 9. Socio-economic changes 10. Weak governance on culture/economy/social/politics/unstable political situation 11. Weak institutions/lack of training 12. Globalization 13. Inadequate legal framework to protect Cultural Heritage.
The basic date was analysed according to these categories on a Regional basis, as shown in the charts in appendices 1-5.
These charts were then further analysed to show: Table 4: Which categories of threat were reported most Table 5: Persistence of threats Table 6: Regional profile of threat categories – histogram Table 7: Regional profile of threat categories Table 8: Development threats year by year Table 9: Number and Percentage of sites affected by main category threats on a Regional basis Table 9: Percentage of sites affected by sub-category threats on a Regional basis Table 10: The most reported sub-categories in each Region
For the following analysis, the major difference is to be found in the two ways of manipulating quantitative data. On tables 4 and 10 the study stresses the quantitative and qualitative data on the basis on the global quantity of threats reported in Annex 1, 2, 3, 4 and 5. It reveals in more details the nature of information found in the sources in each region and stresses the persistence of threats. In Tables 5, 6, 7, 8 and 9 the study stresses the quantitative and qualitative data on the basis of the number of sites affected by certain sub-category of threats. It allows us to know what sites are the most problematic or affected by threats.
1.5 Limitation of the study
The definition of categories and sub-categories are not an entirely objective framework. For instance, it was difficult to identify the degree of intensity of threats (unless this was specifically commented on). Obviously, several sub-categories are linked to each other in a spiral of causes and effects. For example, B1 (urban pressure) is often linked to, or is the consequence of, threat E4 (Tourism pressure). Or for example, lack of financial resources may often be the cause of the lack of a security system, with which to prevent vandalism. Nonetheless the categorization was established in a way that all threats, reported in Annex 1 to 5 could be represented. Two distinctions can be made. One between a direct threat (A7 for example) and an indirect or underlying threat (H12 for example) and the other one between long-term impacts (loss of promotion (F21) of threats or short-term impacts (E 26). But again information on the degree of importance and temporal parameters were hard to establish with certainty in this categorization.
8
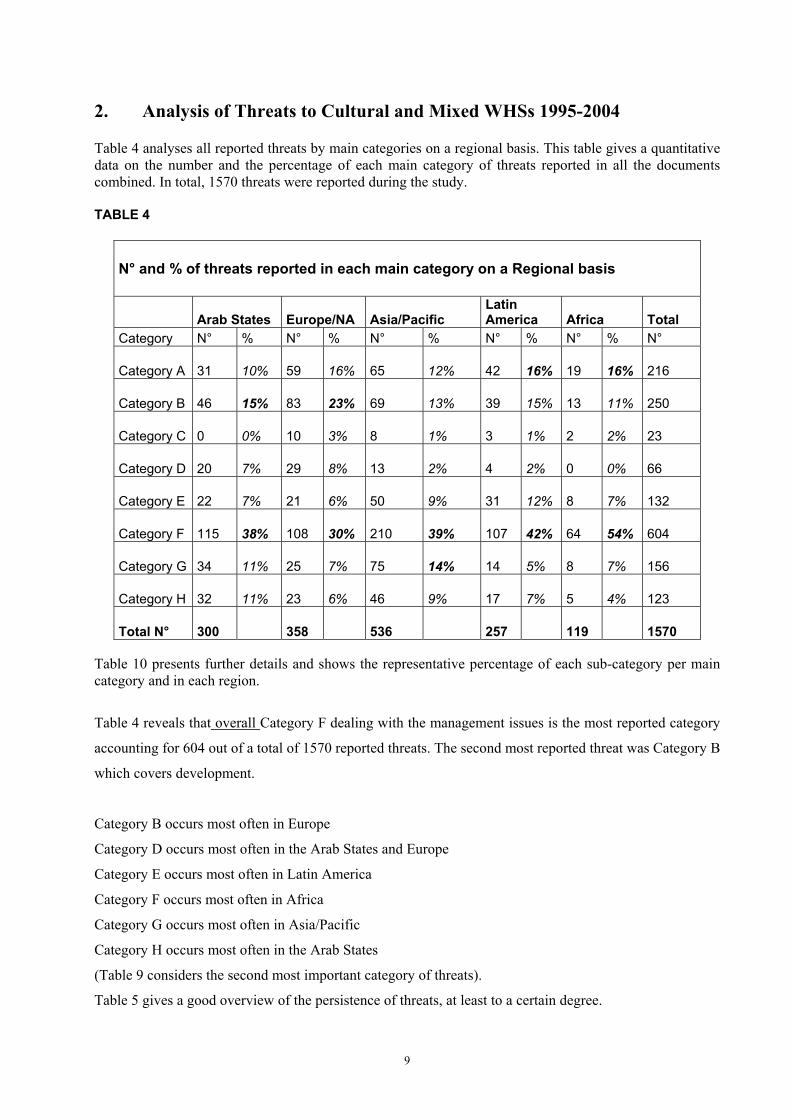
2. Analysis of Threats to Cultural and Mixed WHSs 1995-2004 Table 4 analyses all reported threats by main categories on a regional basis. This table gives a quantitative data on the number and the percentage of each main category of threats reported in all the documents combined. In total, 1570 threats were reported during the study. TABLE 4
N° and % of threats reported in each main category on a Regional basis
Arab States Europe/NA Asia/Pacific Latin America Africa Total
Category N° % N° % N° % N° % N° % N°
Category A 31 10% 59 16% 65 12% 42 16% 19 16% 216
Category B 46 15% 83 23% 69 13% 39 15% 13 11% 250
Category C 0 0% 10 3% 8 1% 3 1% 2 2% 23
Category D 20 7% 29 8% 13 2% 4 2% 0 0% 66
Category E 22 7% 21 6% 50 9% 31 12% 8 7% 132
Category F 115 38% 108 30% 210 39% 107 42% 64 54% 604
Category G 34 11% 25 7% 75 14% 14 5% 8 7% 156
Category H 32 11% 23 6% 46 9% 17 7% 5 4% 123
Total N° 300 358 536 257 119 1570 Table 10 presents further details and shows the representative percentage of each sub-category per main category and in each region.
Table 4 reveals that overall Category F dealing with the management issues is the most reported category
accounting for 604 out of a total of 1570 reported threats. The second most reported threat was Category B
which covers development.
Category B occurs most often in Europe
Category D occurs most often in the Arab States and Europe
Category E occurs most often in Latin America
Category F occurs most often in Africa
Category G occurs most often in Asia/Pacific
Category H occurs most often in the Arab States
(Table 9 considers the second most important category of threats).
Table 5 gives a good overview of the persistence of threats, at least to a certain degree.
9
For Africa, the fact that only 16% of the sites are affected by threats during 5 or more years could be the result of two causes. One is that, evidently, sites in Africa are less affected by category B, diminishing the velocity of consequences from development issues (if compared to sites in Europe). A second cause might be that, as reported in table 11, states of conservation and other reports in Africa seem to be undertaken in “waves” which consequently creates a non-continuity in the assessment of threats. Annex 5 sets out the degree of persistence of threats in each site during the decade.
10
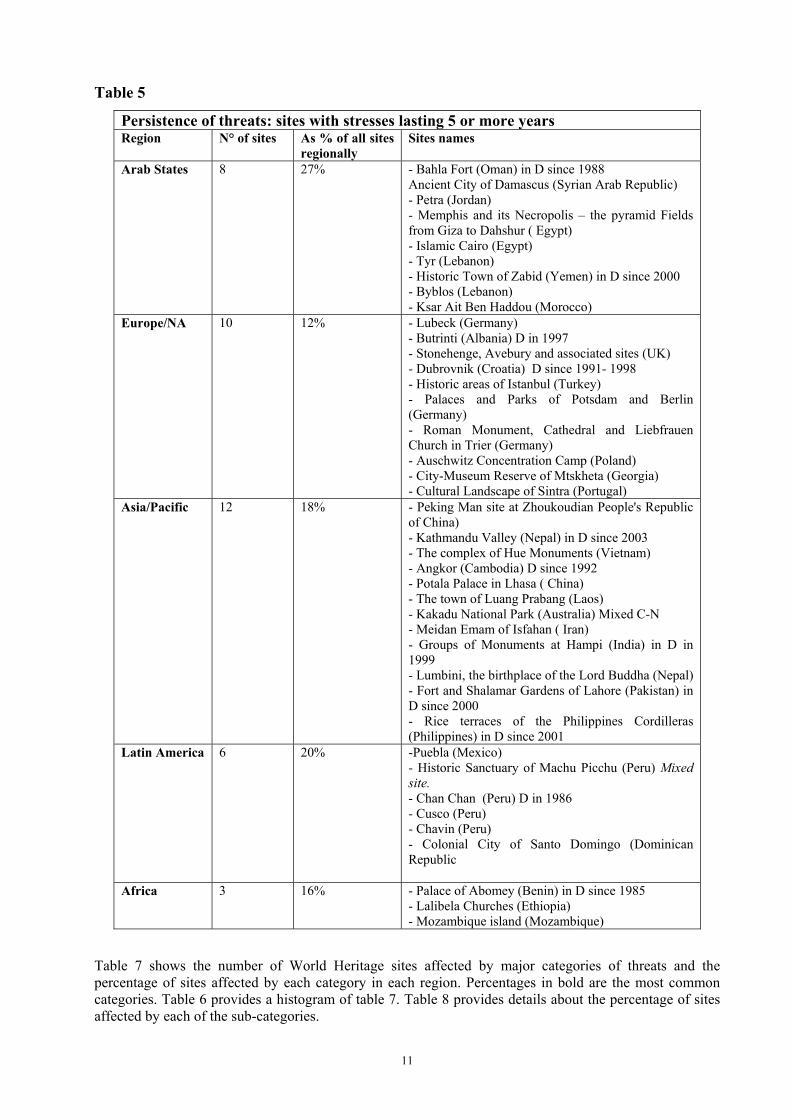
Table 5
Persistence of threats: sites with stresses lasting 5 or more years Region N° of sites As % of all sites
regionally Sites names
Arab States 8 27% - Bahla Fort (Oman) in D since 1988 Ancient City of Damascus (Syrian Arab Republic) - Petra (Jordan) - Memphis and its Necropolis – the pyramid Fields from Giza to Dahshur ( Egypt) - Islamic Cairo (Egypt) - Tyr (Lebanon) - Historic Town of Zabid (Yemen) in D since 2000 - Byblos (Lebanon) - Ksar Ait Ben Haddou (Morocco)
Europe/NA 10 12% - Lubeck (Germany) - Butrinti (Albania) D in 1997 - Stonehenge, Avebury and associated sites (UK) - Dubrovnik (Croatia) D since 1991- 1998 - Historic areas of Istanbul (Turkey) - Palaces and Parks of Potsdam and Berlin (Germany) - Roman Monument, Cathedral and Liebfrauen Church in Trier (Germany) - Auschwitz Concentration Camp (Poland) - City-Museum Reserve of Mtskheta (Georgia) - Cultural Landscape of Sintra (Portugal)
Asia/Pacific 12 18% - Peking Man site at Zhoukoudian People's Republic of China) - Kathmandu Valley (Nepal) in D since 2003 - The complex of Hue Monuments (Vietnam) - Angkor (Cambodia) D since 1992 - Potala Palace in Lhasa ( China) - The town of Luang Prabang (Laos) - Kakadu National Park (Australia) Mixed C-N - Meidan Emam of Isfahan ( Iran) - Groups of Monuments at Hampi (India) in D in 1999 - Lumbini, the birthplace of the Lord Buddha (Nepal) - Fort and Shalamar Gardens of Lahore (Pakistan) in D since 2000 - Rice terraces of the Philippines Cordilleras (Philippines) in D since 2001
Latin America 6 20% -Puebla (Mexico) - Historic Sanctuary of Machu Picchu (Peru) Mixed site. - Chan Chan (Peru) D in 1986 - Cusco (Peru) - Chavin (Peru) - Colonial City of Santo Domingo (Dominican Republic
Africa 3 16% - Palace of Abomey (Benin) in D since 1985 - Lalibela Churches (Ethiopia) - Mozambique island (Mozambique)
Table 7 shows the number of World Heritage sites affected by major categories of threats and the percentage of sites affected by each category in each region. Percentages in bold are the most common categories. Table 6 provides a histogram of table 7. Table 8 provides details about the percentage of sites affected by each of the sub-categories.
11

These data should be compared with data from table 4. They more or less divulge the same information. The changes lie in the fact that the category F is no longer the most important in the Europe/NA region and in the Asia/Pacific region, Category A has taken over Category G. Table 7 shows that 67% of sites mentioned in reports had development threats in the Arab States and in Europe 49% of sites reported had development threats. In the management Category F, 95% of sites mentioned in Africa had management threats, 88% in Asia Pacific and 77% in Arab States and Latin America. Category A, deterioration, affected 68% of sites in Africa and 67% in Latin America. Table7
N° and % of sites by Region where the categories of threat were reported
Arab States Europe/NA Asia/Pacific Latin America Africa Total
Category N° % N° % N° % N° % N° % N°
Category A 17 57% 36 44% 29 45% 20 67% 13 68%
Category B 20 67% 40 49% 26 40% 14 47% 8 42%
Category C 0 0% 4 5% 3 5% 2 7% 3 16%
Category D 13 43% 15 18% 8 12% 5 17% 0 0%
Category E 13 43% 14 17% 28 43% 10 33% 4 21%
Category F 23 77% 34 41% 57 88% 23 77% 18 95%
Category G 16 53% 17 21% 27 42% 7 23% 7 37%
Category H 13 43% 17 21% 20 31% 11 37% 4 21%
Importance of Major Categories of threat in each region
0%20%40%60%80%
100%
Cat. A
Cat.B
Cat. C
Cat. D
Cat.E
Cat. F
Cat. G
Cat. H
Major category of threats
%of
site
s re
port
ing
thre
ats
Arab States
Europe/NA
Asia/Pacific
Latin America
Africa
12
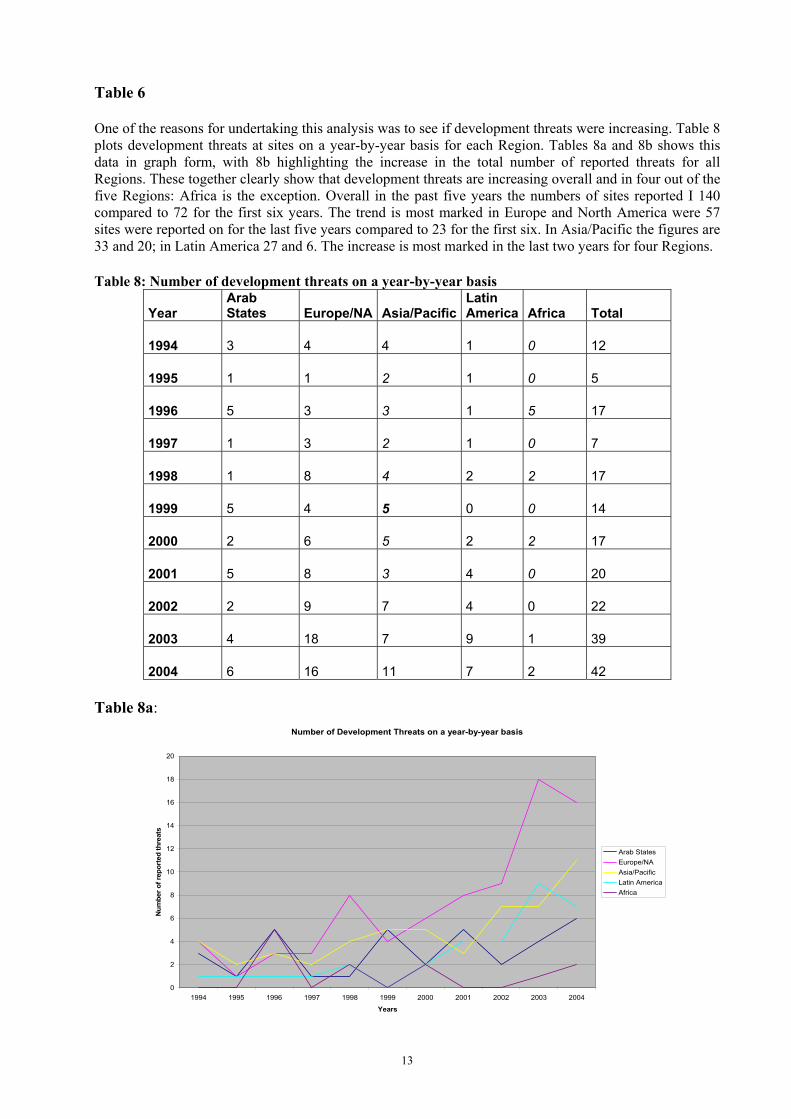
Table 6 One of the reasons for undertaking this analysis was to see if development threats were increasing. Table 8 plots development threats at sites on a year-by-year basis for each Region. Tables 8a and 8b shows this data in graph form, with 8b highlighting the increase in the total number of reported threats for all Regions. These together clearly show that development threats are increasing overall and in four out of the five Regions: Africa is the exception. Overall in the past five years the numbers of sites reported I 140 compared to 72 for the first six years. The trend is most marked in Europe and North America were 57 sites were reported on for the last five years compared to 23 for the first six. In Asia/Pacific the figures are 33 and 20; in Latin America 27 and 6. The increase is most marked in the last two years for four Regions. Table 8: Number of development threats on a year-by-year basis
Year Arab States Europe/NA Asia/Pacific
Latin America Africa Total
1994 3 4 4 1 0 12
1995 1 1 2 1 0 5
1996 5 3 3 1 5 17
1997 1 3 2 1 0 7
1998 1 8 4 2 2 17
1999 5 4 5 0 0 14
2000 2 6 5 2 2 17
2001 5 8 3 4 0 20
2002 2 9 7 4 0 22
2003 4 18 7 9 1 39
2004 6 16 11 7 2 42 Table 8a:
Number of Development Threats on a year-by-year basis
0
2
4
6
8
10
12
14
16
18
20
1994 1995 1996 1997 1998 1999 2000 2001 2002 2003 2004
Years
Num
ber o
f rep
orte
d th
reat
s
Arab StatesEurope/NAAsia/PacificLatin AmericaAfrica
13
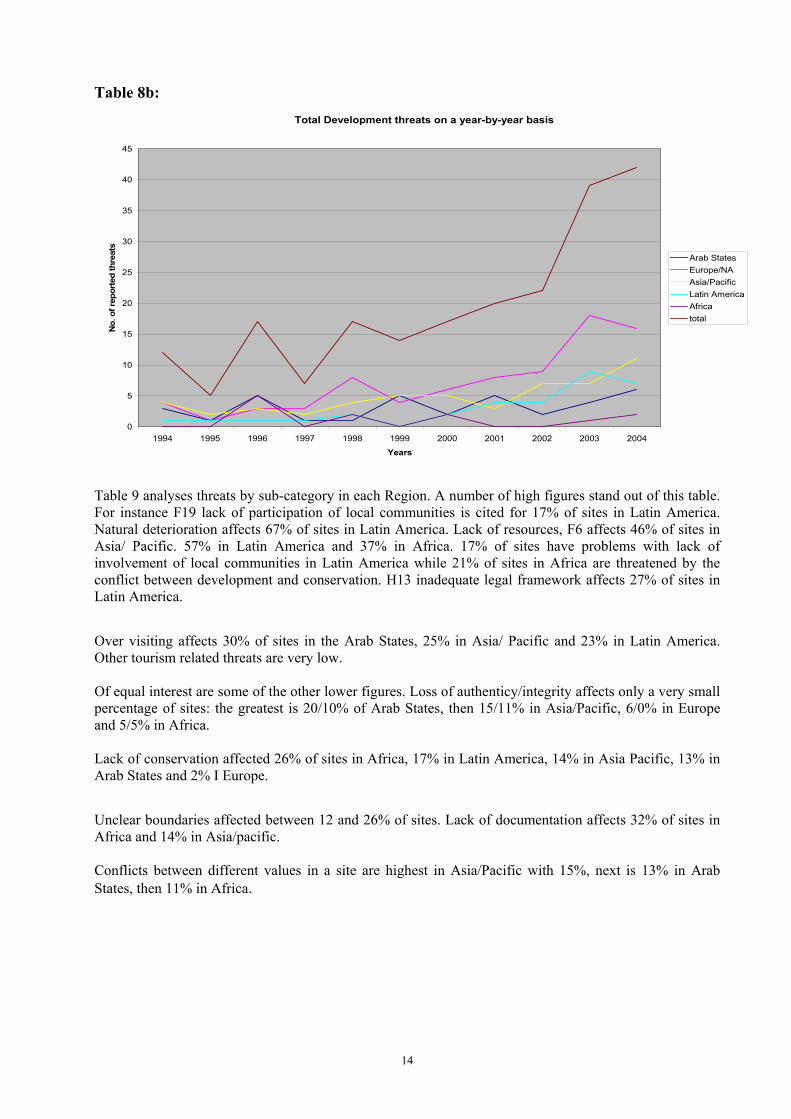
Table 8b: Total Development threats on a year-by-year basis
0
5
10
15
20
25
30
35
40
45
1994 1995 1996 1997 1998 1999 2000 2001 2002 2003 2004
Years
No.
of r
epor
ted
thre
ats
Arab StatesEurope/NAAsia/PacificLatin AmericaAfricatotal
Table 9 analyses threats by sub-category in each Region. A number of high figures stand out of this table. For instance F19 lack of participation of local communities is cited for 17% of sites in Latin America. Natural deterioration affects 67% of sites in Latin America. Lack of resources, F6 affects 46% of sites in Asia/ Pacific. 57% in Latin America and 37% in Africa. 17% of sites have problems with lack of involvement of local communities in Latin America while 21% of sites in Africa are threatened by the conflict between development and conservation. H13 inadequate legal framework affects 27% of sites in Latin America.
Over visiting affects 30% of sites in the Arab States, 25% in Asia/ Pacific and 23% in Latin America. Other tourism related threats are very low. Of equal interest are some of the other lower figures. Loss of authenticy/integrity affects only a very small percentage of sites: the greatest is 20/10% of Arab States, then 15/11% in Asia/Pacific, 6/0% in Europe and 5/5% in Africa. Lack of conservation affected 26% of sites in Africa, 17% in Latin America, 14% in Asia Pacific, 13% in Arab States and 2% I Europe.
Unclear boundaries affected between 12 and 26% of sites. Lack of documentation affects 32% of sites in Africa and 14% in Asia/pacific. Conflicts between different values in a site are highest in Asia/Pacific with 15%, next is 13% in Arab States, then 11% in Africa.
14
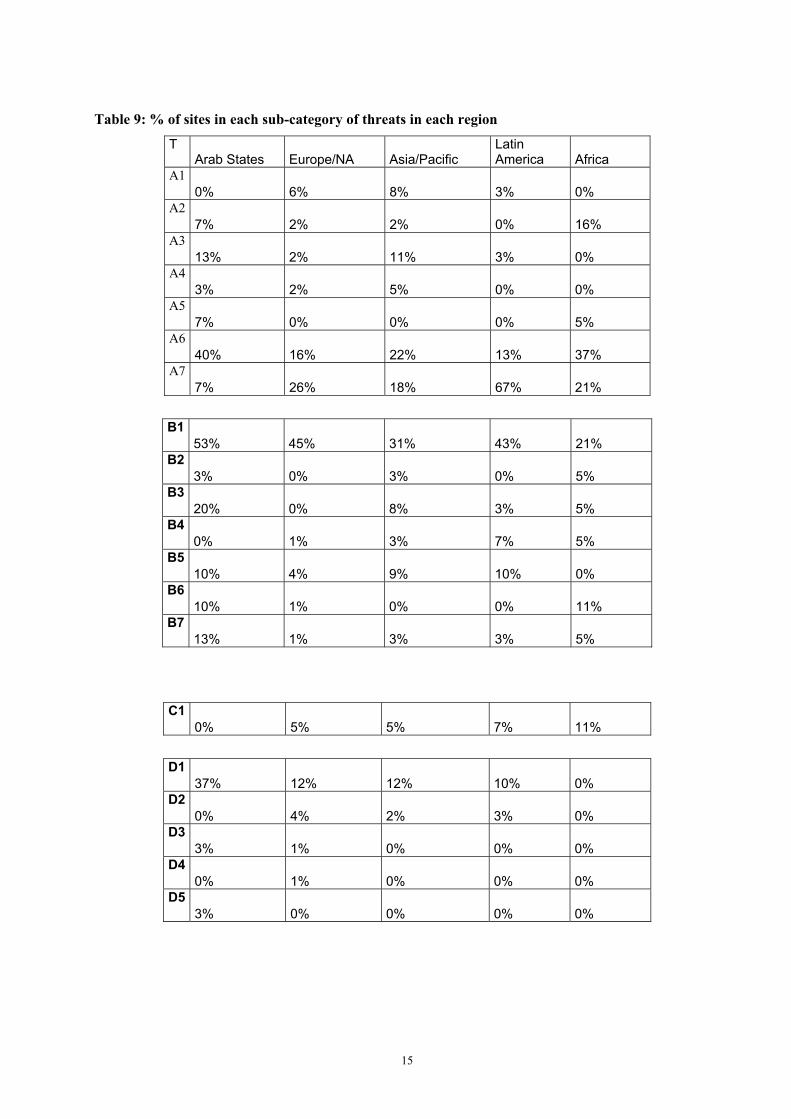
Table 9: % of sites in each sub-category of threats in each region
T Arab States Europe/NA Asia/Pacific
Latin America Africa
A1 0% 6% 8% 3% 0%
A2 7% 2% 2% 0% 16%
A3 13% 2% 11% 3% 0%
A4 3% 2% 5% 0% 0%
A5 7% 0% 0% 0% 5%
A6 40% 16% 22% 13% 37%
A7 7% 26% 18% 67% 21%
B1 53% 45% 31% 43% 21%
B2 3% 0% 3% 0% 5%
B3 20% 0% 8% 3% 5%
B4 0% 1% 3% 7% 5%
B5 10% 4% 9% 10% 0%
B6 10% 1% 0% 0% 11%
B7 13% 1% 3% 3% 5%
C1 0% 5% 5% 7% 11%
D1 37% 12% 12% 10% 0%
D2 0% 4% 2% 3% 0%
D3 3% 1% 0% 0% 0%
D4 0% 1% 0% 0% 0%
D5 3% 0% 0% 0% 0%
15
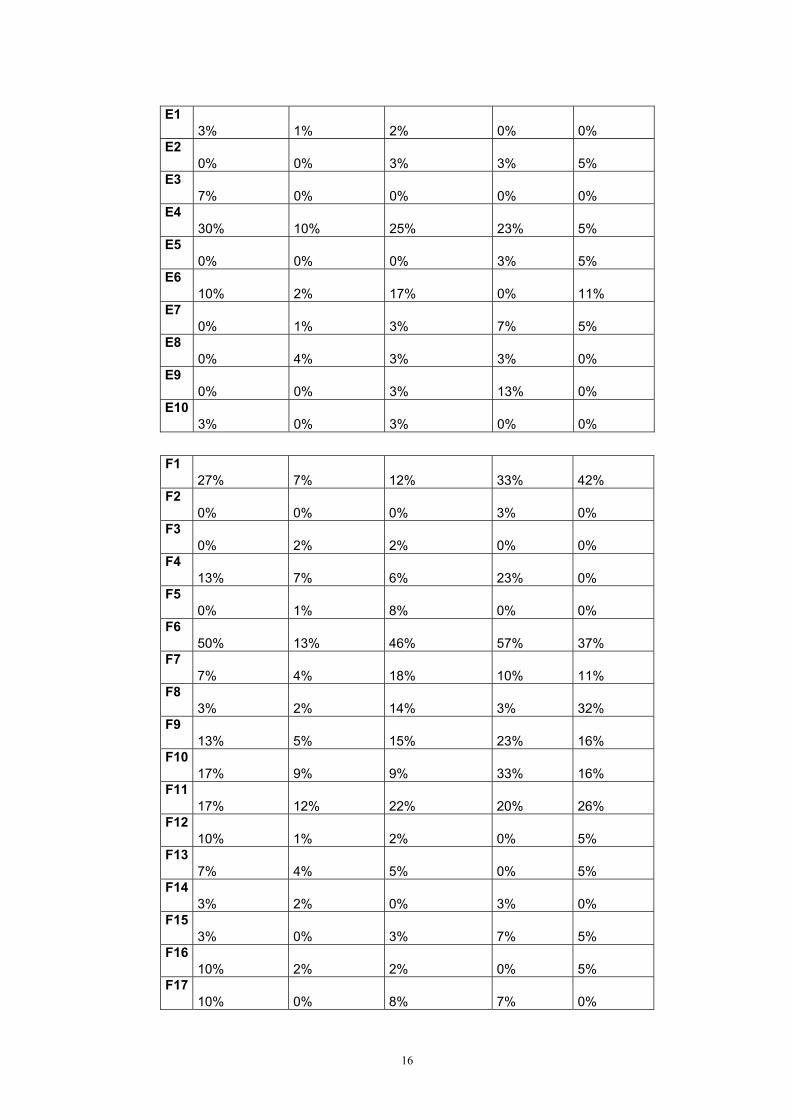
E1 3% 1% 2% 0% 0%
E2 0% 0% 3% 3% 5%
E3 7% 0% 0% 0% 0%
E4 30% 10% 25% 23% 5%
E5 0% 0% 0% 3% 5%
E6 10% 2% 17% 0% 11%
E7 0% 1% 3% 7% 5%
E8 0% 4% 3% 3% 0%
E9 0% 0% 3% 13% 0%
E10 3% 0% 3% 0% 0%
F1 27% 7% 12% 33% 42%
F2 0% 0% 0% 3% 0%
F3 0% 2% 2% 0% 0%
F4 13% 7% 6% 23% 0%
F5 0% 1% 8% 0% 0%
F6 50% 13% 46% 57% 37%
F7 7% 4% 18% 10% 11%
F8 3% 2% 14% 3% 32%
F9 13% 5% 15% 23% 16%
F10 17% 9% 9% 33% 16%
F11 17% 12% 22% 20% 26%
F12 10% 1% 2% 0% 5%
F13 7% 4% 5% 0% 5%
F14 3% 2% 0% 3% 0%
F15 3% 0% 3% 7% 5%
F16 10% 2% 2% 0% 5%
F17 10% 0% 8% 7% 0%
16
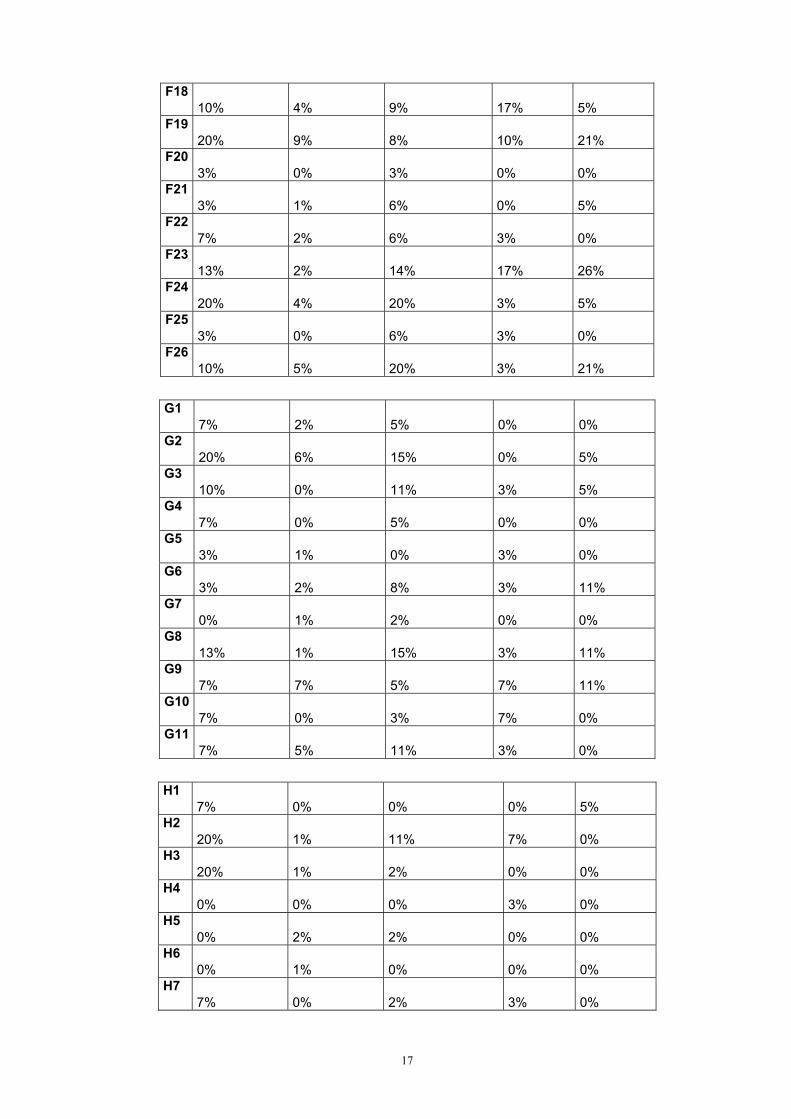
F18 10% 4% 9% 17% 5%
F19 20% 9% 8% 10% 21%
F20 3% 0% 3% 0% 0%
F21 3% 1% 6% 0% 5%
F22 7% 2% 6% 3% 0%
F23 13% 2% 14% 17% 26%
F24 20% 4% 20% 3% 5%
F25 3% 0% 6% 3% 0%
F26 10% 5% 20% 3% 21%
G1 7% 2% 5% 0% 0%
G2 20% 6% 15% 0% 5%
G3 10% 0% 11% 3% 5%
G4 7% 0% 5% 0% 0%
G5 3% 1% 0% 3% 0%
G6 3% 2% 8% 3% 11%
G7 0% 1% 2% 0% 0%
G8 13% 1% 15% 3% 11%
G9 7% 7% 5% 7% 11%
G10 7% 0% 3% 7% 0%
G11 7% 5% 11% 3% 0%
H1 7% 0% 0% 0% 5%
H2 20% 1% 11% 7% 0%
H3 20% 1% 2% 0% 0%
H4 0% 0% 0% 3% 0%
H5 0% 2% 2% 0% 0%
H6 0% 1% 0% 0% 0%
H7 7% 0% 2% 3% 0%
17
H8 0% 0% 0% 3% 0%
H9 10% 0% 2% 0% 0%
H10 7% 6% 6% 3% 0%
H11 7% 1% 5% 10% 0%
H12 0% 0% 0% 0% 5%
H13 17% 11% 18% 27% 16%
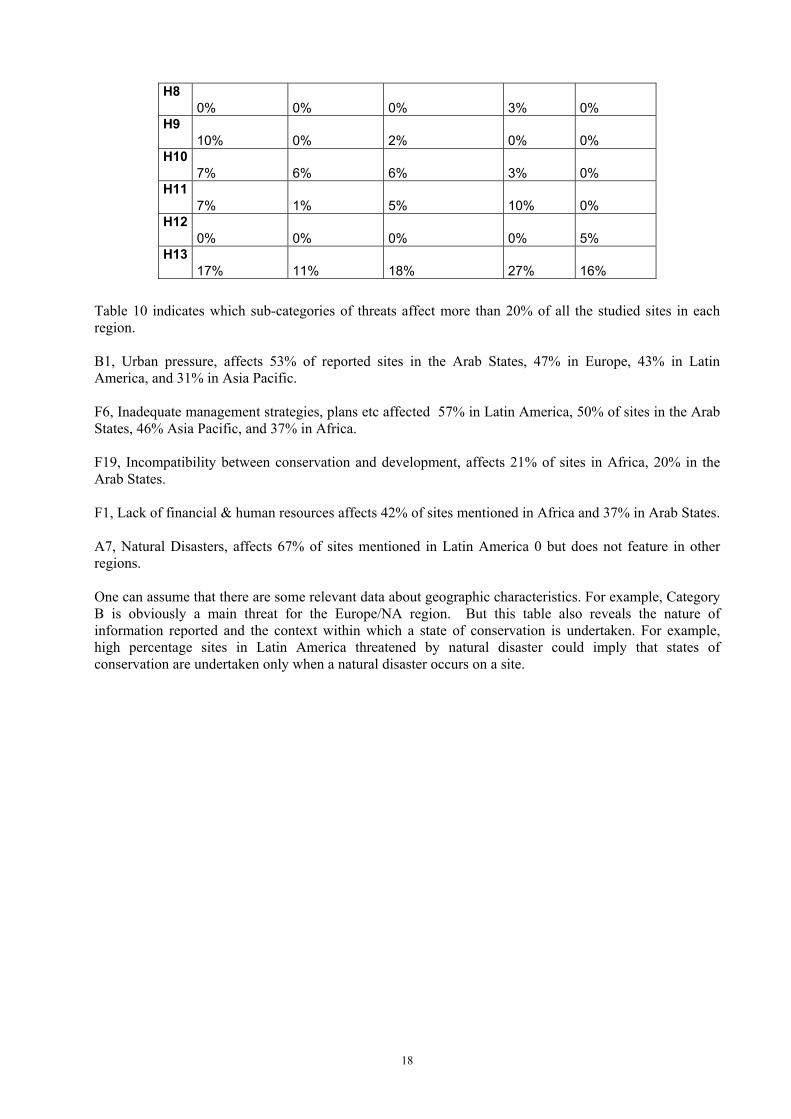
Table 10 indicates which sub-categories of threats affect more than 20% of all the studied sites in each region. B1, Urban pressure, affects 53% of reported sites in the Arab States, 47% in Europe, 43% in Latin America, and 31% in Asia Pacific. F6, Inadequate management strategies, plans etc affected 57% in Latin America, 50% of sites in the Arab States, 46% Asia Pacific, and 37% in Africa. F19, Incompatibility between conservation and development, affects 21% of sites in Africa, 20% in the Arab States. F1, Lack of financial & human resources affects 42% of sites mentioned in Africa and 37% in Arab States. A7, Natural Disasters, affects 67% of sites mentioned in Latin America 0 but does not feature in other regions. One can assume that there are some relevant data about geographic characteristics. For example, Category B is obviously a main threat for the Europe/NA region. But this table also reveals the nature of information reported and the context within which a state of conservation is undertaken. For example, high percentage sites in Latin America threatened by natural disaster could imply that states of conservation are undertaken only when a natural disaster occurs on a site.
18
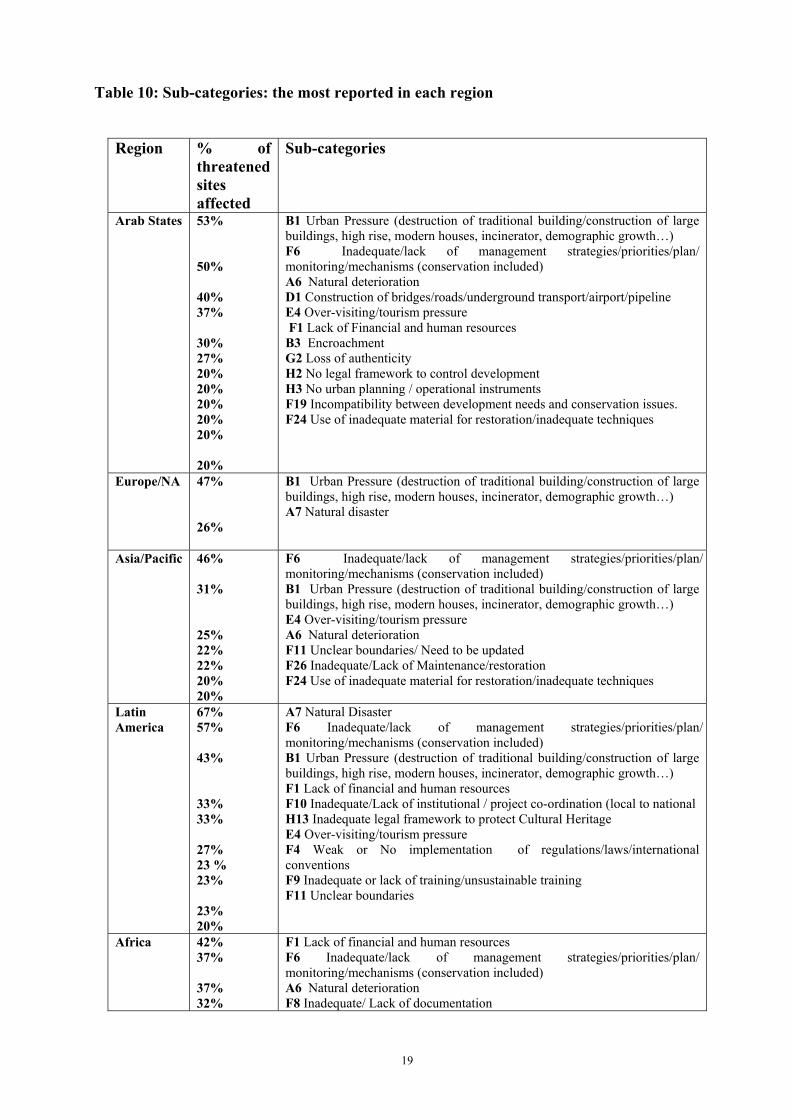
Table 10: Sub-categories: the most reported in each region
Region % of threatened sites affected
Sub-categories
Arab States 53% 50% 40% 37% 30% 27% 20% 20% 20% 20% 20% 20%
B1 Urban Pressure (destruction of traditional building/construction of large buildings, high rise, modern houses, incinerator, demographic growth…) F6 Inadequate/lack of management strategies/priorities/plan/ monitoring/mechanisms (conservation included) A6 Natural deterioration D1 Construction of bridges/roads/underground transport/airport/pipeline E4 Over-visiting/tourism pressure F1 Lack of Financial and human resources B3 Encroachment G2 Loss of authenticity H2 No legal framework to control development H3 No urban planning / operational instruments F19 Incompatibility between development needs and conservation issues. F24 Use of inadequate material for restoration/inadequate techniques
Europe/NA 47% 26%
B1 Urban Pressure (destruction of traditional building/construction of large buildings, high rise, modern houses, incinerator, demographic growth…) A7 Natural disaster
Asia/Pacific 46% 31% 25% 22% 22% 20% 20%
F6 Inadequate/lack of management strategies/priorities/plan/ monitoring/mechanisms (conservation included) B1 Urban Pressure (destruction of traditional building/construction of large buildings, high rise, modern houses, incinerator, demographic growth…) E4 Over-visiting/tourism pressure A6 Natural deterioration F11 Unclear boundaries/ Need to be updated F26 Inadequate/Lack of Maintenance/restoration F24 Use of inadequate material for restoration/inadequate techniques
Latin America
67% 57% 43% 33% 33% 27% 23 % 23% 23% 20%
A7 Natural Disaster F6 Inadequate/lack of management strategies/priorities/plan/ monitoring/mechanisms (conservation included) B1 Urban Pressure (destruction of traditional building/construction of large buildings, high rise, modern houses, incinerator, demographic growth…) F1 Lack of financial and human resources F10 Inadequate/Lack of institutional / project co-ordination (local to national H13 Inadequate legal framework to protect Cultural Heritage E4 Over-visiting/tourism pressure F4 Weak or No implementation of regulations/laws/international conventions F9 Inadequate or lack of training/unsustainable training F11 Unclear boundaries
Africa 42% 37% 37% 32%
F1 Lack of financial and human resources F6 Inadequate/lack of management strategies/priorities/plan/ monitoring/mechanisms (conservation included) A6 Natural deterioration F8 Inadequate/ Lack of documentation
19

26% 26% 21% 21% 21% 21%
F11 Unclear Boundaries F23 Inadequate / Lack of conservation projects/ planning/priorities A7 Natural disaster B1 Urban Pressure (destruction of traditional building/construction of large buildings, high rise, modern houses, incinerator, demographic growth…) F26 Inadequate/Lack of Maintenance/restoration F19 Incompatibility between development needs and conservation issues.
Conclusions The survey was undertaken to assess whether the perception that developmental threats were increasing could be substantiated: this was clearly found to be the case. There was a marked increase in the number of developmental threats for four out of five Regions, comparing the first six years with the last five years of the survey. This trend was even more marked when the last two years were compared with the first six: for Europe 34 sites in 2003-4 compared to 23 for the first five years of the survey. For Latin America the figures are 16 and 6; for Asia Pacific 18 and 20. Considering all categories of threats, the highest percentages are for management and development issues at sites. Failures in management taken as a whole forms the largest threat to all Regions and all sites. 95% of sites in Africa are affected by management issues. 88% in Asia/ Pacific. 77% in Latin America, 77% in Arab States and 41% in Europe. 67% of Arab States are affected by development, 49% in Europe, 47% in Latin /America, 40% in Asia Pacific and 42% in Africa.
The other high figures are associated with major natural disasters. These particularly affect Latin America, 67%, and to a lesser extent Europe, 26% and Africa, 21%. Stresses persisting for five years or more appear to occur more frequently in Arab States and Latin America and Asia/Pacific. However this could be because monitoring of African sites seemed to take place in “waves”.
As well as what threats get a high percentage, those that get a low percentage are also of interest. Some of what might be called the traditional threats – lack of conservation, loss of authenticity, and over-visiting, – headings which appear under threats in the nomination documents – tended to get quite low percentages. Lack of conservation is highest in Africa – 26%, other regions are between 2% and 17%. Loss of authenticity is between 0% and 20%. Over-visiting is between 5% and 30% (the highest percentage is for the Arab States). Major environmental disasters, though, are high: 7%, 18%, 21%, 26% and 67% - the latter for South America. What conclusions can be drawn? This analysis in many ways is a blunt tool as it relies on records of major problems on a fairly selective basis. Nevertheless some trends are strong. The marked increase in the number of developmental threats for four of five Regions is significant.
20
The lack of adequate management and development pressures are clearly the strongest threats. This is in contrast to what have been seen as more traditional threats such as lack of authenticity, tourism pressure, environmental degradation etc. The third highest figure is for natural disasters in certain regions. One clear lesson to come out of this analysis is the need to focus resources on promoting adequate management arrangements as these in turn could impact on the way development threats are countered. A second lesson is the need to ask for specific information in nomination documents on development pressures through the detailed documentation of proposed plans, and to press for a sustainable system of management to be in place for sites inscribed on the WH List. Thirdly risk preparedness could be a helpful instrument in dealing with natural disasters. Having established this database, it would be helpful to keep it up to date and to try and monitor over a longer period of time shifts in emphasis and changing trends.
ICOMOS, Paris
May 2005
21