AN ANALYSIS OF THE RELATION BETWEEN WINE CONSUMPTION …ageconsearch.umn.edu/bitstream/200522/2/14...
23
207 EP 2015 (62) 1 (207-227) Economics of Agriculture 1/2015 UDC: 663.2:316.722/.728 Review Article AN ANALYSIS OF THE RELATION BETWEEN WINE CONSUMPTION AND CULTURAL MODELS AN ANALYSIS OF THE RELATION BETWEEN WINE CONSUMPTION AND CULTURAL MODELS 1 Adrian Stancu 2 Summary The paper describes the correlation among grape-bearing areas, grape production, wine production, wine consumption and population figure for various countries. Secondly, it explains the correlation among wine consumption, wine consumer expenditure and a country’s cultural model with reference to the population’s religion in some countries. The statistical method used in testing these connections was the Bravais-Pearson correlation coefficient. An additional analysis of the distribution of grape production, wine production, and wine consumption for the world’s top ten countries was made. Although wine consumption is banned by Islam, Buddhism and Hinduism, there are some Muslim, Buddhist and Hindu majority countries with a high level of wine consumption per capita. This high level is determined neither by the other religion population nor by foreign tourists, but rather by the way in which religion is understood and practiced by individuals. Key words: grape, wine consumption, wine consumer expenditure, cultural models, religion. JEL: C10, E21, L66, Q02 Introduction Wine has been produced by people ever since the Neolithic period, between 8,000 and 3,500 BC, by crushing both grapes and date palm and allowing the resulting juice to ferment. Even today it is not clear in which part of the world the first wine was produced, either in China, Iran, Turkey, Armenia, Azerbaijan, Macedonia, or in Greece etc. Nowadays, the wine production in some European countries such as France, Germany, Austria, etc. is the result of the propagation of the wine technology by the Roman Empire (Hames, 2014; Vlahović et al., 2012). 1 This paper is supported by the Sectorial Operational Programme Human Resources Development (SOP HRD), financed from the European Social Fund and by the Romanian Government under the contract number SOP HRD/159/1.5/S/136077. 2 Adrian Stancu, Ph.D., Associate Professor, Petroleum-Gas University of Ploiesti, Faculty of Economic Sciences, Bucharest Avenue no. 39, 100680 Ploiesti, Prahova, Romania, Phone: +40 721 370 367, E-mail: [email protected]
Transcript of AN ANALYSIS OF THE RELATION BETWEEN WINE CONSUMPTION …ageconsearch.umn.edu/bitstream/200522/2/14...

207EP 2015 (62) 1 (207-227)
Economics of Agriculture 1/2015UDC: 663.2:316.722/.728
Review Article
AN ANALYSIS OF THE RELATION BETWEEN WINE CONSUMPTION AND CULTURAL MODELS
AN ANALYSIS OF THE RELATION BETWEEN WINE CONSUMPTION AND CULTURAL MODELS1
Adrian Stancu2
Summary
The paper describes the correlation among grape-bearing areas, grape production, wine production, wine consumption and population figure for various countries. Secondly, it explains the correlation among wine consumption, wine consumer expenditure and a country’s cultural model with reference to the population’s religion in some countries. The statistical method used in testing these connections was the Bravais-Pearson correlation coefficient. An additional analysis of the distribution of grape production, wine production, and wine consumption for the world’s top ten countries was made. Although wine consumption is banned by Islam, Buddhism and Hinduism, there are some Muslim, Buddhist and Hindu majority countries with a high level of wine consumption per capita. This high level is determined neither by the other religion population nor by foreign tourists, but rather by the way in which religion is understood and practiced by individuals.
Key words: grape, wine consumption, wine consumer expenditure, cultural models, religion.
JEL: C10, E21, L66, Q02
Introduction
Wine has been produced by people ever since the Neolithic period, between 8,000 and 3,500 BC, by crushing both grapes and date palm and allowing the resulting juice to ferment. Even today it is not clear in which part of the world the first wine was produced, either in China, Iran, Turkey, Armenia, Azerbaijan, Macedonia, or in Greece etc. Nowadays, the wine production in some European countries such as France, Germany, Austria, etc. is the result of the propagation of the wine technology by the Roman Empire (Hames, 2014; Vlahović et al., 2012).
1 This paper is supported by the Sectorial Operational Programme Human Resources Development (SOP HRD), financed from the European Social Fund and by the Romanian Government under the contract number SOP HRD/159/1.5/S/136077.
2 Adrian Stancu, Ph.D., Associate Professor, Petroleum-Gas University of Ploiesti, Faculty of Economic Sciences, Bucharest Avenue no. 39, 100680 Ploiesti, Prahova, Romania, Phone: +40 721 370 367, E-mail: [email protected]

208 EP 2015 (62) 1 (207-227)
Adrian Stancu
Although alcohol became a part of human consumption long ago, its adverse and beneficial health effects have only been recently highlighted (Ene, 2009). Therefore, numerous studies on vineyard soil, grape and wine quality were undertaken to identify if certain substances content (e.g. copper, zinc, manganese, etc.) does not exceed the allowable limits (Calin et al., 2012) or if new potential dangerous substances for human health become manifest.
The importance of wine for human consumption, along with other economic, social and technical factors, determined the appearance of wine tourism in the middle of the 19th century, even if testing wine and visiting vineyards as parts of an organized trip has been known since ancient Rome and Greece. Nowadays, there is no clear statistical data by country concerning wine tourism. The countries with wine tourism supply are considered the ones with the highest wine production, and are clustered into the ‘Old World’ (France, Italy, Germany, Spain, etc.) and the ‘New Word’ (New Zeeland, Australia, United States, South Africa, etc.) wine regions (Hall et al., 2002; Scutariu, 2013).
Goals, data sources and methodology
The first goal of the paper is to identify the type of correlation among grape-bearing areas, grape production, wine production, wine consumption, and population figures. The second goal is to test the way in which wine consumption, wine consumer expenditure, and cultural models, as determined by the population’s religion, correlate.
Given these goals, a data set was built, which includes the grape-bearing areas, grape production, wine production, wine consumption, population figures, Muslim, Buddhist and Hindu population figures, and wine consumer expenditure by country in 2012 (Appendix 1).
Exhaustive data was included in Appendix 1 so as to guarantee the objectivity of the results. Although ten different sources were used to collect data, it was impossible to establish a complete database, because some countries did not report data, so it was recorded as not available (n/a).
Initially, Appendix 1 contained 242 countries. After double-checking the scientific references available, only 109 countries remained therein (from Afghanistan to Zimbabwe). This reduction was due to the lack of data, since some countries had data only for wine consumption and population figure, which was not enough to achieve the two above mentioned goals of the paper.
However, a further list of 43 countries’ data (from Bangladesh to Uganda) was introduced at the end of the Appendix 1 in order to be used only in testing some correlations along with the existing 109 countries’ data, to ensure more exhaustive data for analytical purposes.
In Appendix 1 it can be noticed that the wine consumption values expressed in liters per capita were calculated with four decimal places instead of two decimal places, which was used for wine consumption in liters per capita. The reason was to emphasize the low level of wine consumption in liters per capita in some countries (e.g. Iran) and to ensure the correctness of the data needed for analysis – otherwise, the reported values included in the Appendix 1 should have been zero.

209EP 2015 (62) 1 (207-227)
AN ANALYSIS OF THE RELATION BETWEEN WINE CONSUMPTION AND CULTURAL MODELS
As regards the statistical method, the Bravais-Pearson correlation coefficient was used to highlight the presence or absence of the correlations among grape-bearing areas, grape production, wine production, wine consumption, population figure, Muslim, Buddhist and Hindu population figures, and wine consumer expenditure.
The relation among grape-bearing areas, grape production, wine production, wine consumption and population figure
First of all, it is important to test the correlation between grape-bearing areas and grape production to point up the influence of atmospheric and economic factors on grape production (Table 1).
Table 1. Correlation between grape-bearing areas and grape productionGrape-bearing areas
Grape productionPearson Correlation .899**
Sig. (2-tailed) .000N 109
Source: Author’s own calculation based on data in Appendix 1.
Note: **. Correlation is significant at the 0.01 level (2-tailed).
The data in Table 1 show the presence of a strong and positive correlation grape-bearing areas and grape production. Thus, the higher the grape-bearing areas, the higher the grape production. The value of this correlation is not perfect (it should equal 1) due to the difference among the surveyed countries’ grape production level, which is influenced both by independent factors (air temperature, atmospheric humidity, sunlight, rainfall, soil composition, etc.) and dependent factors (economic efficiency, harvest planning, etc.).
Secondly, it is useful to establish if all the countries that produce grapes are also wine producers (Table 2).
Table 2. Correlation between grape production and wine productionGrape production
Wine productionPearson Correlation .798**
Sig. (2-tailed) .000N 109
Source: Author’s own calculation based on data in Appendix 1.
Note: **. Correlation is significant at the 0.01 level (2-tailed).
Due to the fact that the correlation coefficient value in Table 2 belongs to the interval [0.5; 0.8), (Lunau et al., 2013), there is a moderate and positive correlation between grape production and wine production. The correlation is not strong or perfect because, even though some countries produce grapes, these countries do not report wine production. The following cases have been identified:

210 EP 2015 (62) 1 (207-227)
Adrian Stancu
- some countries have a Muslim majority population, e.g. Afghanistan (99.7%), Iran (99.5%), Yemen (99.1%), Iraq (99%), Occupied Palestinian Territory (97.6%), Libya (96.6%), Pakistan (96.4%), and Saudi Arabia (93%) (Pew Research Center, 2012). Hussain (2011) states that Islamic law prohibits alcohol consumption and that practicing Muslims do not drink alcohol irrespective of the type of drink and the time of day. This might be one of the many explanations for which these countries did not give details about their wine production. Instead, other countries that have a Muslim majority population as well, e.g. Morocco (99.9%), Turkey (98%), Jordan (97.2%), Azerbaijan (96.9%), Tajikistan (96.7%), Uzbekistan (96.7%), Egypt (94.9%), Turkmenistan (93%), Syria (92.8%), Kyrgyzstan (88%), Albania (80.3%), Kazakhstan (70.4%) and Lebanon (61.3%), (Pew Research Center, 2012) did report their wine production.
- some countries have both a Muslim majority population, e.g. United Arab Emirates (76.9%) Kuwait (74.1%), Bahrain (70.3%), and Qatar (67.7%), (Pew Research Center, 2012), and maybe a low quantity of wine production due to a low quantity of grape production, e.g. United Arab Emirates (55 tonnes), Kuwait (45 tonnes), Bahrain (145 tonnes), and Qatar (8 tonnes), (Food and Agriculture Organization of the United Nations Statistics Division, 2012b);
- some countries have a Muslim minority population, e.g. Tanzania (35.2%), Thailand (5.5%), Vietnam (0.2%), (Pew Research Center, 2012), and a slightly higher grape production, e.g. Tanzania (18,000 tonnes), Thailand (80,000 tonnes), Vietnam (15,308 tonnes), (Food and Agriculture Organization of the United Nations Statistics Division, 2012b);
- some countries have a Muslim minority population, e.g. Netherlands (6%) and the Philippines (5.5%), (Pew Research Center, 2012), and a low grape production, e.g. Netherlands (1,200 tonnes) and the Philippines (169 tonnes), (Food and Agriculture Organization of the United Nations Statistics Division, 2012b) and perhaps they do not produce wine;
- some countries have a very low Muslim population level, e g. Namibia (0.3%), Taiwan (0.1%), Venezuela (0.3%), Colombia (0.1%), and Guatemala (0.1%), (Pew Research Center, 2012), but they have a rather high grape production, e.g. Namibia (23,000 tonnes), Taiwan (99,267 tonnes), Venezuela (20,000 tonnes), Colombia (24,701 tonnes), and Guatemala (18,500 tonnes), (Food and Agriculture Organization of the United Nations Statistics Division, 2012b);
- some countries have a very low Muslim population level, e.g. Ecuador (0.1%) and Honduras (0.1%), (Pew Research Center, 2012), but they have a low grape production level, e.g. Ecuador (400 tonnes) and Honduras (182 tonnes), (Food and Agriculture Organization of the United Nations Statistics Division, 2012b);
- for some countries the economic efficiency of raisin production might be much higher than wine production (Subic et al., 2010), taking into account that these countries reported raisin production, e.g. Afghanistan (32,000 tonnes) and Iran (150,000 tonnes), (USDA, 2015).

211EP 2015 (62) 1 (207-227)
AN ANALYSIS OF THE RELATION BETWEEN WINE CONSUMPTION AND CULTURAL MODELS
The strong correlation between grape production and wine production is underscored by the following analysis of the distribution of grape production and wine production for the world’s top ten countries as well (Figure 1).
In 2012 the main grape producers were China, United States, Italy, France and Spain and the main wine producers were Italy, France, Spain, United States and China.
Figure 1. Distribution of grape production and wine production for the world’s top ten countries in 2012
Source: Author’s own elaboration based on data in Appendix 1.
Although the hierarchy of the world’s top ten countries is slightly different for both grape production and wine production, there are 8 out of 10 countries that take part in the two rankings at the same time, i.e. China, Italy, United States, France, Spain, Chile, Argentina and South Africa.
Turkey and Iran as major grape producers are no longer in the top ten of the most important wine producers. Their places were taken by Argentina and Germany.
Thirdly, the correlation between wine production and wine consumption was surveyed so as to emphasize if the countries that produce wine are the same with the ones that consume wine (Table 3).
Table 3. Correlation between wine production and wine consumptionWine production
Wine consumptionPearson Correlation .854**
Sig. (2-tailed) .000N 109
Source: Author’s own calculation based on data in Appendix 1.
Note: **. Correlation is significant at the 0.01 level (2-tailed).
The Bravais-Pearson correlation coefficient in Table 3 is higher than .8, which means that there is a strong and positive correlation between wine production and wine consumption.

212 EP 2015 (62) 1 (207-227)
Adrian Stancu
This indicates that most of the analyzed countries share both the culture of producing and that of consuming wine. According to the data in Appendix 1, there are 39 out of 109 countries that do not produce wine but consume wine instead, one (Réunion) out of 109 countries that does not consume wine but produces both grapes and wine, and one (Occupied Palestinian Territory) out of 109 countries that neither consumes nor produces wine, but instead produces grapes.
The strong correlation between wine production and consumption is also highlighted by the analysis of wine production and consumption for the world’s top ten countries (Figure 2).
Figure 2. Distribution of wine production and consumption for the world’s top ten countries in 2012
Source: Author’s own elaboration based on data in Appendix 1.
The data in Figure 2 show a similar situation to the one described in Figure 1, i.e. that the hierarchy of the world’s top ten countries is somewhat different for both wine production and consumption, but there are 7 out of 10 countries that belong to both rankings, such as the United States, France, Italy, Germany, China, Spain, and Argentina.
Instead, a significant disparity emerges between the hierarchies of the world’s top ten countries concerning wine consumption expressed in liters and wine consumption expressed in liters per capita. Only France and Italy were present in both top ten countries hierarchies, which means that in these countries wine consumption has a relatively homogenous distribution among people from different categories defined by gender, age, disposable income, etc.
The main countries with the highest wine consumption per capita were Sint Maarten (Dutch part), (57.4089 liters per capita), Croatia (44.7094 liters per capita), France (44.1557 liters per capita), Slovenia (41.9997 liters per capita), and Portugal (41.9692 liters per capita). The explanation for Sint Maarten’s (Dutch part) first place is that this country had a low population figure, but reported a rather high wine consumption, i.e. 2,244,000 liters.
213EP 2015 (62) 1 (207-227)
AN ANALYSIS OF THE RELATION BETWEEN WINE CONSUMPTION AND CULTURAL MODELS
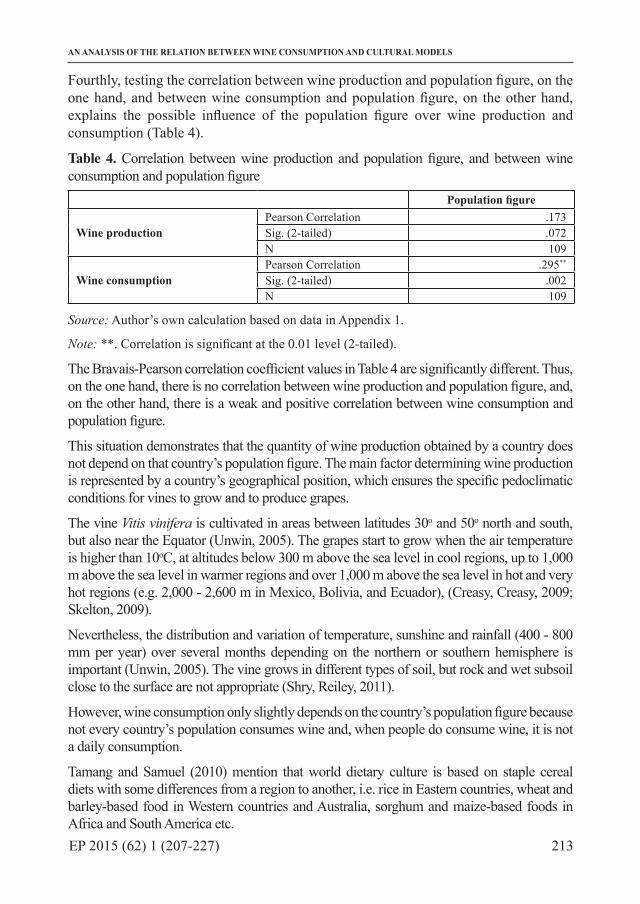
Fourthly, testing the correlation between wine production and population figure, on the one hand, and between wine consumption and population figure, on the other hand, explains the possible influence of the population figure over wine production and consumption (Table 4).
Table 4. Correlation between wine production and population figure, and between wine consumption and population figure
Population figure
Wine productionPearson Correlation .173Sig. (2-tailed) .072N 109
Wine consumptionPearson Correlation .295**
Sig. (2-tailed) .002N 109
Source: Author’s own calculation based on data in Appendix 1.
Note: **. Correlation is significant at the 0.01 level (2-tailed).
The Bravais-Pearson correlation coefficient values in Table 4 are significantly different. Thus, on the one hand, there is no correlation between wine production and population figure, and, on the other hand, there is a weak and positive correlation between wine consumption and population figure.
This situation demonstrates that the quantity of wine production obtained by a country does not depend on that country’s population figure. The main factor determining wine production is represented by a country’s geographical position, which ensures the specific pedoclimatic conditions for vines to grow and to produce grapes.
The vine Vitis vinifera is cultivated in areas between latitudes 30o and 50o north and south, but also near the Equator (Unwin, 2005). The grapes start to grow when the air temperature is higher than 10oC, at altitudes below 300 m above the sea level in cool regions, up to 1,000 m above the sea level in warmer regions and over 1,000 m above the sea level in hot and very hot regions (e.g. 2,000 - 2,600 m in Mexico, Bolivia, and Ecuador), (Creasy, Creasy, 2009; Skelton, 2009).
Nevertheless, the distribution and variation of temperature, sunshine and rainfall (400 - 800 mm per year) over several months depending on the northern or southern hemisphere is important (Unwin, 2005). The vine grows in different types of soil, but rock and wet subsoil close to the surface are not appropriate (Shry, Reiley, 2011).
However, wine consumption only slightly depends on the country’s population figure because not every country’s population consumes wine and, when people do consume wine, it is not a daily consumption.
Tamang and Samuel (2010) mention that world dietary culture is based on staple cereal diets with some differences from a region to another, i.e. rice in Eastern countries, wheat and barley-based food in Western countries and Australia, sorghum and maize-based foods in Africa and South America etc.

214 EP 2015 (62) 1 (207-227)
Adrian Stancu
Wine is not a staple food due to the low weight of wine consumer expenditure in the disposable income for most of the world countries (Appendix 2). Thus, in 2011 the top ten countries with the highest weight of wine consumer expenditure in the disposable income were Latvia (1.524%), Hungary (1.453%), Estonia (1.392%), Belarus (1.114%), Switzerland (1.092%), Argentina (1.024%), Sweden (0.995%), Belgium (0.946%), Poland (0.909%), and Czech (0.883%). By contrast, the countries with the lowest weight were Pakistan (0%), India (0.003%), Turkey (0.005%), Indonesia (0.005%), United Arab Emirates (0.007%), Egypt (0.008%), Ecuador (0.023%), China (0.036%), Vietnam (0.042%) and Nigeria (0.042%).However, the data in Appendix 2 underscore something different about the weight of wine consumer expenditure in the alcoholic beverages consumer expenditure. For four countries the weight of wine consumer expenditure exceeded two thirds of the alcoholic beverages consumer expenditure, i.e. Switzerland (78.18%), Italy (69.87%), Portugal (69.37%), Belgium (68.95%), and for three other countries the weight of wine consumer expenditure was between a half and two thirds of the alcoholic beverages consumer expenditure, i.e. France (58.88%), Denmark (54.81%) and Tunisia (53.49%).For 15 countries the weight of wine consumer expenditure was between one third and a half of the alcoholic beverages consumer expenditure, i.e. Sweden (49.15%), Netherlands (48.08%), United Kingdom (47.87%), Algeria (47.03%), Croatia (46.24%), Argentina (45.41%), Spain (44.23%), Greece (38.07%), Germany (37.31%), New Zealand (37.15%), Ireland (36.82%), Norway (36.49%), Singapore (36.26%), Australia (34.85%) and Hong Kong (34.69%).Instead, Pakistan (0%), India (0.56%), Turkey (2.76%), Thailand (2.92%), Colombia (3.10%), Venezuela (3.19%), Bolivia (3.98%), Jordan (4.22%), Vietnam (4.45%) and Ecuador (4.67%) had the lowest weight of wine consumer expenditure in the alcoholic beverages consumer expenditure.
The relation among wine consumption, wine consumer expenditure and cultural models
It is helpful to find out how wine consumption per capita and wine consumer expenditure per capita correlate for a better understanding of the amount of money used to buy wine and the wine quantity that is consumed (Table 5).
Table 5. Correlation between wine consumption per capita and wine consumer expenditure per capita
Wine consumption per capita
Wine consumer expenditure per capita
Pearson Correlation .454**
Sig. (2-tailed) .000N 109
Source: Author’s own calculation based on data in Appendix 1Note: **. Correlation is significant at the 0.01 level (2-tailed).
The Bravais-Pearson correlation coefficient value in Table 5 belongs to the interval [0.1; 0.5), (Lunau et al., 2013). Thus, there is a weak and positive correlation (but very close to a moderate correlation because the value is near .5) between wine consumption per capita and

215EP 2015 (62) 1 (207-227)
AN ANALYSIS OF THE RELATION BETWEEN WINE CONSUMPTION AND CULTURAL MODELS
wine consumer expenditure per capita. So, in the case of some countries, the more people consume wine, the more they spend money on buying wine.
The reason for a weak correlation between wine consumption per capita and wine consumer expenditure per capita is that, even if some countries had very close values of wine consumption per capita, e.g. Lithuania (0.1195 liters per capita), Vietnam (0.1407 liters per capita), they recorded substantial differences between their wine consumer expenditure per capita, e.g. Lithuania (118.32 US$ per capita), Vietnam (0.22 US$ per capita), (Euromonitor International Ltd., 2013b).
There are at least two essential factors that generated these disparities:
- the consumer’s buying price for wine is significantly different from a country to another;- wine consumption does not have a normal distribution among all the people in a country.
There are people who belong to some social categories that consume and spend more money on wine than others.
One of the many influential factors of wine consumption is the country’s cultural model which is determined by religion. Alcohol consumption is banned according to the holy books of some religions.
Alcohol or wine consumption represents a vice for the following sacred writings (Kalman, 2009; Robertson, 2004; Worden, 2003):
- in the Qur’an of Islam it is written that “Surely wine and gambling and stone pillars and divining arrows are an abomination of the work of Satan” (Fuller, 1996);
- in the Tipitaka (Pali Canon) of the Buddhist religion, the fifth rule of the Novices’ ten Abstentions (known as Sikkhāpadas) stipulates the “abstinence from drinking wines and spirits” (Allen, 2008);
- in the Bhagavad-Gita of Hinduism it is asserted that “Such demoniac people are only attracted by wine, women, gambling and meat-eating” (Bhaktivedanta Swami Prabhupada, 2004).
Taking into account the wine consumption restriction in Islam, Buddhism and Hinduism, it is useful to identify how the wine consumption per capita and the country’s weight of Muslim, Buddhist and Hindu population correlate (Table 6). The 152 countries’ data were used in testing this correlation made by the standard 109 countries’ data in the Appendix 1 and the 43 additional countries’ data at the end of Appendix 1 which contain data only to be used in testing this correlation (wine consumption per capita and the country’s weight of Muslim, Buddhist and Hindu population) and the next correlation (wine consumer expenditure per capita and the country’s weight of Muslim, Buddhist and Hindu population) in order to ensure exhaustive data for analysis.

216 EP 2015 (62) 1 (207-227)
Adrian Stancu
Table 6. Correlation between wine consumption per capita and the country’s weight of Muslim, Buddhist and Hindu population
Country’s weight of Muslin population
Country’s weight of Buddhist population
Country’s weight of Hindu population
Wine consumption per capita
Pearson Correlation -.352** -.155 -.141Sig. (2-tailed) .000 .057 .083N 152 152 152
Source: Author’s own calculation based on data in Appendix 1.
Note: **. Correlation is significant at the 0.01 level (2-tailed).
Firstly, the value of the Bravais-Pearson correlation coefficient shows a weak and negative correlation between wine consumption per capita and the country’s weight of Muslin population. Hence, the higher the country’s weight of Muslim population, the lower the wine consumption per capita.
This correlation is weak due to the fact that some Muslim majority countries have relatively high levels of wine consumption per capita. Thus, in Figure 3 is displayed the distribution of wine consumption per capita and the weight of the Muslim population for the world countries (46 countries according to Appendix 1) that have over 50% Muslim population.
Figure 3. Distribution of wine consumption per capita and weight of the Muslim population for the Muslim majority countries in 2012
Source: Author’s own elaboration based on data in Appendix 1.
Countries such as Azerbaijan (96.9% Muslim population and 10.4564 liters per capita), Tunisia (99.5% Muslim population and 7.7662 liters per capita), Albania (80.3% Muslim population and 7.6383 liters per capita), Lebanon (61.3% Muslim population and 4.2623 liters per capita), Uzbekistan (96.7% Muslim population and 3.7012 liters per capita), Maldives (98.4% Muslim population and 3.3595 liters per capita), Kazakhstan (70.4%

217EP 2015 (62) 1 (207-227)
AN ANALYSIS OF THE RELATION BETWEEN WINE CONSUMPTION AND CULTURAL MODELS
Muslim population and 2.1320 liters per capita), Kyrgyzstan (88% Muslim population and 2.0586 liters per capita), Algeria (97.9% Muslim population and 1.9984 liters per capita), United Arab Emirates (76.9% Muslim population and 1.9560 liters per capita), Morocco (99.9% Muslim population and 1.2238 liters per capita), Gambia (95.1% Muslim population and 0.9999 liters per capita), Turkmenistan (93% Muslim population and 0.8794 liters per capita), etc. contribute to the weak correlation between wine consumption per capita and the country’s weight of Muslin population.
The situation in the previously mentioned countries is the opposite of that in Occupied Palestinian Territory (97.6% Muslim population and 0 liters per capita), Iran (99.5% Muslim population and 0.0004 liters per capita), Yemen (99.1% Muslim population and 0.004 liters per capita), Pakistan (96.4% Muslim population and 0.0004 liters per capita), Bangladesh (89.8% Muslim population and 0.0005 liters per capita), Syria (92.8% Muslim population and 0.011 liters per capita), Tajikistan (96.7% Muslim population and 0.0012 liters per capita), Sudan (90.7% Muslim population and 0.0023 liters per capita), Saudi Arabia (93% Muslim population and 0.0029 liters per capita), Afghanistan (99.7% Muslim population and 0.0050 liters per capita), Mauritania (99.1% Muslim population and 0.0076 liters per capita), Kuwait (74.1% Muslim population and 0.0111 liters per capita), Indonesia (87.2% Muslim population and 0.0113 liters per capita), Iraq (99% Muslim population and 0.0130 liters per capita), etc.
Secondly, according to the values of the Bravais-Pearson coefficient in Table 6, which are statistically significant up to .05 level, there is no correlation between wine consumption per capita and the country’s weight of Buddhist population, on the one hand, and between wine consumption per capita and the country’s weight of Hindu population, on the other hand.
If a .1 level of significance is admitted, then the Bravais-Pearson coefficient in Table 6 shows a weak and negative correlation between wine consumption per capita and the country’s weight of Buddhist population. The same strength and direction of the correlation is between wine consumption per capita and the country’s weight of Hindu population.
The absence of any correlation for .05 level or the weak correlation for .1 level is explained in some way by the distribution of wine consumption per capita and the weight of the Buddhist and Hindu population for the Buddhist and Hindu majority countries (Figure 4). The seven countries that have over 50% Buddhist population and the three countries that have over 50% Hindu population alone cannot counterbalance the other world countries’ high wine consumption.
In the case of the Buddhist majority countries, there are countries with both a low weight of Buddhist population and a low wine consumption per capita level, e.g. Burma (80.1% Buddhist population and 0.0130 liters per capita), Bhutan (74.7% Buddhist population and 0.0391 liters per capita), Sri Lanka (69.3% Buddhist population and 0.0543 liters per capita), and Laos (66% Buddhist population and 0.0667 liters per capita), that are opposed to others that have both a high weight of Buddhist population and a high wine consumption per capita level, e.g. Thailand (93.2% Buddhist population and 0.2355 liters per capita).

218 EP 2015 (62) 1 (207-227)
Adrian Stancu
A similar situation is encountered in the Hindu majority countries, in which even though Nepal has a higher weight of Hindu population (80.7%) than India (79.5%), it also has a higher wine consumption per capita than India, i.e. 0.0222 liters per capita against 0.0116 liters per capita.
Figure 4. Distribution of wine consumption per capita and the weight of Buddhist (a) and Hindu (b) population for the Buddhist and Hindu majority countries in 2012
Source: Author’s own elaboration based on data in Appendix 1.Another important correlation which can be tested is between wine consumer expenditure per capita and the country’s weight of Muslim, Buddhist and Hindu population (Table 7). Both the 109 and the 152 countries’ data were selected to analyze this correlation by simultaneously using only the existing data for wine consumer expenditure per capita and still offering the possibility to compare the results with the previous correlation.
Table 7. Correlation between wine consumer expenditure per capita and the country’s weight of Muslim, Buddhist and Hindu population
Country’s weight of Muslim population
Country’s weight of Buddhist population
Country’s weight of Hindu population
Wine consumer expenditure per capita
Pearson Correlation -.358** -.077 -.074Sig. (2-tailed) .000 .426 .445N 109 109 109
Wine consumer expenditure per capita
Pearson Correlation -.333** -.105 -.105Sig. (2-tailed) .000 .196 .196N 152 152 152
Source: Author’s own calculation based on data in Appendix 1.Note: **. Correlation is significant at the 0.01 level (2-tailed).

219EP 2015 (62) 1 (207-227)
AN ANALYSIS OF THE RELATION BETWEEN WINE CONSUMPTION AND CULTURAL MODELS
The values of the Bravais-Pearson coefficient in Table 7 for both the 109 and the 152 countries’ data show, on the one hand, a weak and negative correlation between wine consumer expenditure per capita and the country’s weight of Muslin population. Thus, the higher the country’s weight of Muslim population, the lower the wine consumer expenditure per capita. The same strength and direction of the correlation is noticeable in the case of the wine consumption per capita and the country’s weight of Muslin population.
There is no correlation between wine consumer expenditure per capita and the country’s weight of Buddhist population for both the 109 and the 152 countries’ data because the significance level (.426 and .196) considerably exceeds .05 or .1. The same absence of correlation is evident between the wine consumer expenditure per capita and the country’s weight of Hindu population and is due to the high (.445 and .196) significance level.
Conclusions
There is a strong connection between the top ten countries with grape-bearing areas and the top ten countries with grape production. Countries such as Spain, France, Italy, China, Turkey, United States, Argentina, Iran and Chile are present in both hierarchies. Only Portugal which occupies the 10th place in the ranking of countries with the largest grape-bearing areas was replaced by South Africa in the ranking of countries with the highest grape production.
The weight of wine consumer expenditure in the alcoholic beverages consumer expenditure is higher than the weight of wine consumer expenditure in disposable income for most of the world countries. Thus, for consumers wine occupies an important place in the alcohol beverages category.
Six countries of the top ten countries with the highest wine consumer expenditure per capita were in the same top ten of the countries with the highest weight of wine consumer expenditure in the alcoholic beverages consumer expenditure, i.e. Switzerland, Sweden, Belgium, Denmark, France, and United Kingdom. Instead, only three countries of the top ten countries with the highest wine consumer expenditure per capita were present in the same top ten countries with the highest weight of wine consumer expenditure in disposable income, i.e. Switzerland, Sweden, and Belgium.
Switzerland and France were the only countries that belong to both the top ten countries with the highest wine consumption per capita and the highest wine consumer expenditure per capita. Thus, these states’ populations spend more money on buying wine than others, if one takes into account that they consumed less wine than other countries’ populations (e.g. France versus Sint Maarten - Dutch part and Croatia, on the one hand, and Switzerland versus Sint Maarten - Dutch part, Croatia, Slovenia, Portugal and Macedonia, on the other hand).
Even though wine consumption is prohibited by religions such as Islam, Buddhism and Hinduism, some Muslim majority countries (e.g. Morocco, Tunisia, Maldives, Algeria, Azerbaijan, Uzbekistan, Kyrgyzstan, Albania, United Arab Emirates, Kazakhstan, and Lebanon) reported over 1 liter per capita wine consumption. This unusual situation is because there are countries with both a higher weight of Muslin population and a higher wine

220 EP 2015 (62) 1 (207-227)
Adrian Stancu
consumption per capita level than others with slightly lower weights of Muslin population and with a lower wine consumption per capita, e.g. Morocco, Tunisia, Maldives, Algeria, Azerbaijan, Uzbekistan, Kyrgyzstan, etc. against Indonesia, Oman, Guinea, Brunei, Kuwait, Malaysia, Chad etc.
The same situation is encountered in the Buddhist majority countries but to a lesser extent, i.e. only Thailand had a higher wine consumption per capita level and a lower weight of Buddhist population than Cambodia. Only one similar exception is found in the Hindu majority countries, i.e. India, which had a higher wine consumption per capita level and a lower weight of Hindu population than Nepal.
Supposing that only all the tourists that visited Muslim majority countries (World Tourism Organization, 2014) consumed wine, then the figures calculated by dividing the whole country’s wine consumption by the total arrivals (i.e. tourists) would result in improbable data (very high wine consumption per capita) for some countries, e.g. Burkina Faso (58.9538 liters per capita), Azerbaijan (39.1304 liters per capita), Algeria (29.1951 liters per capita), Niger (16.1341 liters per capita), Tunisia (14.0672 liters per capita), Lebanon (13.8067 liters per capita), Gambia (11.4076 liters per capita), Sierra Leone (9.56 liters per capita), Comoros (7.7660 liters per capita), Senegal (6.7915 liters per capita), Albania (6.0899 liters per capita), Kazakhstan (5.8089 liters per capita), Kyrgyzstan (4.7976 liters per capita), Morocco (4.0488 liters per capita), if one takes into account the tourists’ short stay.
For the Buddhist majority countries, the tourists’ wine consumption level was slightly higher than the country’s wine consumption, i.e. Laos (0.1330 against 0.0667 liters per capita), Cambodia (0.4528 against 0.1092 liters per capita), Thailand (0.7037 against 0.2355 liters per capita), etc. But there is one exception, i.e. Mongolia (4.6074 against 1.0281 liters per capita). In the case of the Hindu majority countries, in both Nepal and India the tourists’ wine consumption level was considerably higher than the country’s wine consumption, i.e. 0.7609 against 0.0222 liters per capita, and 2.1739 against 0.0116 liters per capita, respectively.
It is obvious that some Muslim, Buddhist and Hindu people in the Muslim majority countries consume wine because, by assuming that only their Christian, Unaffiliated, Folk Religion, Jewish, and other religion populations consume wine and calculating for this population the wine consumption per capita by dividing the whole country’s wine consumption by the total number of Christian, Unaffiliated, Folk Religion, Jewish, and other religion population, unrealistic data were obtained, e.g. Morocco (1,223 liters per capita), Tunisia (1,553 liter per capita), Maldives (479 liters per capita), Algeria (95 liters per capita), Azerbaijan (337 liters per capita), Uzbekistan (112 liters per capita), etc. These values are much higher that the world highest level of wine consumption per capita, i.e. 57.4089 liters per capita.
Applying the same principle for the Buddhist majority countries, similar data were obtained but only for four countries with a high gap versus the initial level, i.e. Cambodia (9.9259 against 0.1092 liters per capita), Thailand (18.1178 against 0.2355 liters per capita), Bhutan (1.5637 against 0.0391 liters per capita), and Singapore (12.3094 against 5.7362 liters per capita). An identical situation occurred in the case of the Hindu majority countries, Nepal

221EP 2015 (62) 1 (207-227)
AN ANALYSIS OF THE RELATION BETWEEN WINE CONSUMPTION AND CULTURAL MODELS
(0.5054 against 0.0222 liters per capita), India (0.2182 against 0.0116 liters per capita), and Mauritius (7.3937 against 19889 liters per capita).
The differences between countries with the same majority religion population (Muslim, Buddhist or Hindu) related to wine consumption are explained by the importance of religion in the country’s cultural model and the way it is understood and practiced by each person.
As for future research, it can focus on identifying some other correlation between a country’s cultural model and the consumption of different food products as well as on analyzing the data by using additional statistical methods.
Literature
1. Allen, G. F. (2008): The Buddha’s Philosophy: Selections from the Pali Canon and an Introductory Essay, vol. 1, Abingdon, UK, Routledge, p. 153.
2. Bhaktivedanta Swami Prabhupada, A. C. (2004): Bhagavad-gita As It Is, 2nd Edition, the Bhaktivedanta Book Trust International Inc., Los Angeles, USA, p. 668.
3. Calin, C., Scaeteanu, G., Pele, M., Ilie, L., Pantea, O., Bombos, D. (2012): Assessment of Copper Content in Wines from Tohani-Dealu Mare by Flame Atomic Absorption Spectrometry, Revista de Chimie, vol. 63, no. 10, pp. 1062-1064, SC Biblioteca Chimiei SA, Bucuresti, Romania, available at: www.revistadechimie.ro/pdf/CALIN%20C.pdf%2010%2012.pdf
4. Creasy, G. L., Creasy, L. L. (2009): Grapes, Corp production science in horticulture series: 16, CABI, Wallingford, UK, p. 4.
5. Ene, C. (2009): Securitatea alimentară – coordonate şi implicaţii, Editura Universităţii Petrol-Gaze din Ploieşti, Romania, p. 148.
6. Euromonitor International Ltd. (2013a): World Consumer Income and Expenditure Patterns 2013, 13th Edition. London, UK, Western and Southern Europe Euromonitor International Ltd., p. 77, 183.
7. Euromonitor International Ltd. (2013b): World Consumer Lifestyles Databook 2013, 12th Edition. London, UK, Western and Southern Europe Euromonitor International Ltd., p. 119.
8. FAO/INFOODS Databases (2012): Density Database Version 2.0, p. 9, available at: www.fao.org/docrep/017/ap815e/ap815e.pdf
9. Food and Agriculture Organization of the United Nations Statistics Division (2012a): Grapes, Area harvested, World (List), available at: http://faostat3.fao.org/download/Q/QC/E
10. Food and Agriculture Organization of the United Nations Statistics Division (2012b): Grapes, Production Quantity, World (List), available at: http://faostat3.fao.org/download/Q/QC/E
11. Food and Agriculture Organization of the United Nations Statistics Division (2012c): Annual population, World (List), available at: http://faostat3.fao.org/download/Q/QC/E

222 EP 2015 (62) 1 (207-227)
Adrian Stancu
12. Food and Agriculture Organization of the United Nations Statistics Division (2012d), Crops processed, Wine, World (List), available at: http://faostat3.fao.org/download/Q/QC/E
13. Fuller, R. C. (1996): Religion and Wine: A Cultural History of Wine Drinking in the United States, the University of Tennessee Press, Knoxville USA, pp. 2-8.
14. Hall, C. M., Johnson, G., Cambourne, B., Macionis, N., Mitchell, R., Sharples, L. (2002): Wine tourism: an introduction, pp. 1-23, In: Hall, C. M., Sharples, L., Cambourne, B., Macionis, N. (Ed.), Wine Tourism Around the World: Development Management and Markets, Routledge, Abingdon, UK.
15. Hames, G. (2014): Alcohol in World History, Routledge, Abingdon, UK, pp. 5-7.16. Hussain, J. (2011): Islam - Its law and society, 3rd Edition, Federation Press, Sydney,
Australia, p. 6.17. Kalman, B. (2009): What is Religion?, Crabtree Publishing Company, St. Catharines,
Canada, p. 8.18. Lunau, S. (Ed.), Meran, R., John, A., Roenpage, O., Staudter, C. (2013): Six Sigma + Lean
Toolset: Mindset for Successful Implementation of Improvement Projects, 2nd Edition, Springer-Verlag Berlin Heidelberg, Berlin, Germany, p. 226.
19. Pew Research Center, the Pew Forum on Religion & Public Life (2012): The Global Religious Landscape. A Report on the Size and Distribution of the World’s Major Religious Groups as of 2010, pp. 45-50, available at: www.pewforum.org/files/2014/01/global-religion-full.pdf
20. Robertson, C. K. (2004): Mixed Drinks or Mixed Messages? An Introduction, pp. 1-8, In: Robertson, C. K. (Ed.), Religion & Alcohol: Sobering Thoughts, Peter Lang Publishing, New York, USA.
21. Scutariu, A. L. (2013): The place of E.U. tourism within the frame of world tourism, the USV Annals of Economics and Public Administration, vol. 13, no. 2(18), pp. 48-55, Stefan cel Mare University of Suceava, Romania, available at: http://annals.seap.usv.ro/index.php/annals/article/view/619/616
22. Shry, C. L., Reiley, H. E. (2011): Introductory Horticulture, 8th Edition, Cengage Learning, New York, USA, p. 568.
23. Skelton, S. (2009): Viticulture: An Introduction to Commercial Grape Growing for Wine Production, Lulu.com, London, UK, p. 58.
24. Stoker, S. H. (2013): General, Organic, and Biological Chemistry, 6th Edition, Cengage Learning, Belmont, USA, pp. 43.
25. Subic, J., Done, I., Vasiljevic, Z., Dusmanescu, D., Andrei, J. (2010): The Evaluation of Economic Investments’ Efficiency in the Context of a Green Economy. A Case Study for Apple Trees Plantation, Bulletin of University of Agricultural Sciences and Veterinary Medicine Cluj-Napoca, Horticulture, vol. 67, no. 2, pp. 245-252, University of Agricultural Sciences and Veterinary Medicine Cluj-Napoca, Romania, available at: http://journals.usamvcluj.ro/index.php/horticulture/article/view/5167/4672

223EP 2015 (62) 1 (207-227)
AN ANALYSIS OF THE RELATION BETWEEN WINE CONSUMPTION AND CULTURAL MODELS
26. Tamang, J. P., Samuel, D. (2010): Dietary Cultures and Antiquity of Fermented Foods and Beverages, pp. 1-40, In: Tamang, J. P., Kailasapathy, K. (Ed.), Fermented Foods and Beverages of the World, CRC Press, New York, USA.
27. The Wine Institute (2012a): World Wine Production by Country 2012, Published Statistics, available at: www.wineinstitute.org/files/2012_Wine_Production_by_Country_cCalifornia_Wine_Institute.pdf
28. The Wine Institute (2012b): World Wine Consumption by Country 2012, Published Statistics, available at: www.wineinstitute.org/files/2012_World_Consumption_by_Country_cCalifornia_Wine_Institute.pdf
29. The World Bank (2015): Population, total in 2012, available at: http://data.worldbank.org/indicator/SP.POP.TOTL
30. Unwin, T. (2005): Wine and the Vine: An Historical Geography of Viticulture and the Wine Trade, Routledge, London, UK, p. 34, 42-44.
31. USDA (2012): Foreign Agricultural Service, Global Agricultural Information Network Report, India, Wine Market Update 2012, available at: http://gain.fas.usda.gov/Recent%20GAIN%20Publications/Wine%20Market%20Update%202012_New%20Delhi_India_12-14-2012.pdf
32. USDA (2015): Foreign Agricultural Service, Raisin Production, Supply and Distribution for Select Countries 2011/2012, available at: http://apps.fas.usda.gov/psdonline/
33. Vlahović, B., Potrebić, V., Jeločnik, M. (2012): Preferences of wine consumers on Serbian market, Journal Economics of Agriculture, vol. 59, no. 1, pp. 37-49, BSAAE, IAE, Belgrade, AES, Bucharest, available at: www.ea.bg.ac.rs/images/Arhiva/2012/Broj%201%20-%202012_Issue%201%20-%202012/3%20-%20Vlahovic,%20Potrebic,%20Jelocnik.pdf
34. Worden, D. (2003): Truth, Spirituality and Contemporary Issues, Heinemann Educational Publishers, Oxford, UK, p. 8.
35. World Tourism Organization (UNWTO), (2014): Compendium of Tourism Statistics, Data 2008 – 2012, pp. 3-446, available at: http://www2.unwto.org/publication/compendium-tourism-statistics-data-2008-2012-2014-edition

224 EP 2015 (62) 1 (207-227)
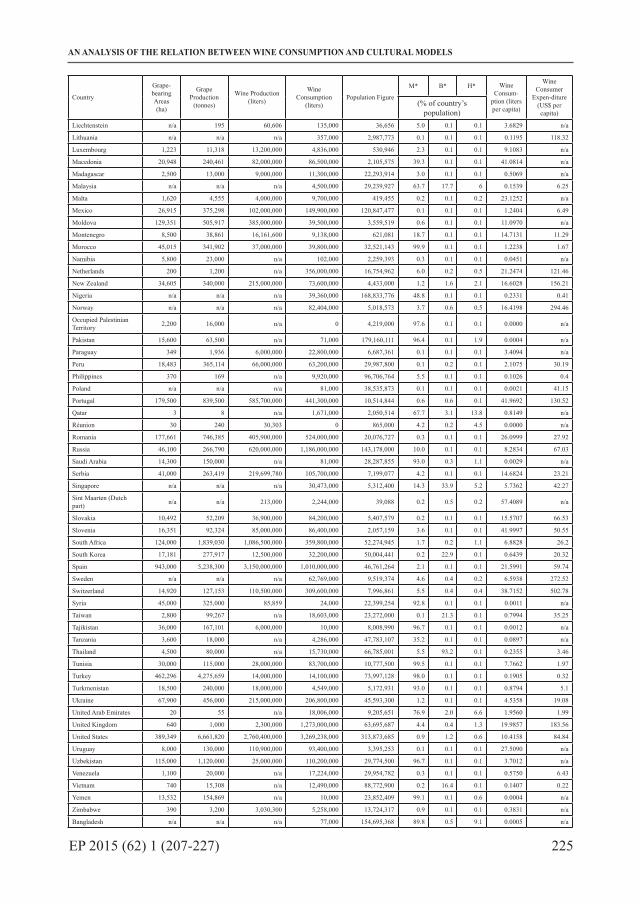
Adrian Stancu
Appendix 1. Grape-bearing areas, grape production, wine production, wine consumption, population figures, Muslim, Buddhist and Hindu population figures, and wine consumer expenditure by country in 2012
Country
Grape-bearing Areas (ha)
Grape Production
(tonnes)
Wine Production (liters)
Wine Consumption
(liters)Population Figure
M* B* H* Wine Consum-
ption (liters per capita)
Wine Consumer
Expen-diture (US$ per capita)
(% of country’s population)
Afghanistan 61,690 590,065 n/a 149,000 29,824,536 99.7 0.1 0.1 0.0050 n/a
Albania 10,000 197,000 17,000,000 21,400,000 2,801,681 80.3 0.1 0.1 7.6383 n/a
Algeria 68,669 543,169 75,000,000 76,900,000 38,481,705 97.9 0.1 0.1 1.9984 3.49
Argentina 220,000 2,800,000 1,177,800,000 964,000,000 41,086,927 1.0 0.1 0.1 23.4625 67.97
Armenia 15,723 241,429 5,000,000 26,300,000 2,969,081 0.1 0.1 0.1 8.8580 n/a
Australia 148,489 1,656,621 1,155,000,000 521,400,000 22,723,900 2.4 2.7 1.4 22.9450 218.9
Austria 43,615 287,301 281,500,000 262,000,000 8,429,991 5.4 0.2 0.1 31.0795 106.22
Azerbaijan 12,443 150,987 5,000,000 97,200,000 9,295,784 96.9 0.1 0.1 10.4564 2.04
Bahrain 47 145 n/a 871,000 1,317,827 70.3 2.5 9.8 0.6609 n/a
Belarus 1,200 7,000 13,000,000 63,200,000 9,464,000 0.2 0.1 0.1 6.6779 58.76
Belgium 10 100 2,892,926 250,500,000 11,128,246 5.9 0.2 0.1 22.5103 252.25
Bolivia 4,300 28,000 7,000,000 9,500,000 10,496,285 0.1 0.1 0.1 0.9051 0.93
Bosnia and Herzegovina 5,500 25,931 5,000,000 49,500,000 3,833,916 45.2 0.1 0.1 12.9111 n/a
Brazil 82,603 1,514,768 194,000,000 382,000,000 198,656,019 0.1 0.1 0.1 1.9229 12.15
Bulgaria 77,341 260,673 123,600,000 142,000,000 7,305,888 13.7 0.1 0.1 19.4364 17.91
Canada 11,308 94,541 65,500,000 428,800,000 34,754,312 2.1 0.8 1.4 12.3380 176.6
Chile 204,000 3,200,000 1,001,000,000 248,400,000 17,464,814 0.1 0.1 0.1 14.2229 38.47
China 600,000 9,600,000 1,381,600,000 1,773,700,000 1,350,695,000 1.8 18.2 0.1 1.3132 1.23
Colombia 2,313 24,701 n/a 16,227,000 47,704,427 0.1 0.1 0.1 0.3402 5.28
Congo, Dem. Rep. n/a n/a n/a 2,962,000 65,705,093 1.5 0.1 0.1 0.0451 n/a
Croatia 29,300 183,500 183,500,000 190,800,000 4,267,558 1.4 0.1 0.1 44.7094 65.64
Cuba 1,700 22,000 12,525,240 5,885,000 11,270,957 0.1 0.1 0.2 0.5221 n/a
Cyprus 9,262 47,006 8,400,000 15,900,000 1,128,994 25.3 0.2 0.1 14.0833 n/a
Czech 15,667 59,990 65,000,000 199,400,000 10,510,785 0.1 0.1 0.1 18.9710 89.24
Denmark n/a n/a n/a 67,722,000 5,591,572 4.1 0.2 0.4 12.1114 242.78
Ecuador 62 400 n/a 5,154,000 15,492,264 0.1 0.1 0.1 0.3327 0.85
Egypt 66,262 1,378,815 3,000,000 2,000,000 80,721,874 94.9 0.1 0.1 0.0248 0.21
Estonia n/a n/a n/a 3,731,000 1,325,016 0.2 0.1 0.1 2.8158 115.08
Ethiopia 2,200 5,000 1,264,898 616,000 91,728,849 34.6 0.1 0.1 0.0067 n/a
Finland n/a n/a n/a 23,897,000 5,413,971 0.8 0.1 0.1 4.4140 217.27
France 760,805 5,338,512 4,047,700,000 2,900,000,000 65,676,758 7.5 0.5 0.1 44.1557 206.66
Georgia 45,000 144,000 95,000,000 75,900,000 4,490,700 10.7 0.1 0.1 16.9016 n/a
Germany 99,584 1,225,950 890,300,000 1,950,000,000 80,425,823 5.8 0.3 0.1 24.2459 122.22
Greece 99,200 978,200 315,000,000 303,100,000 11,092,771 5.3 0.1 0.1 27.3241 90.35
Guatemala 2,700 18,500 n/a 2,720,000 15,082,831 0.1 0.1 0.1 0.1803 n/a
Honduras 42 182 n/a 1,256,000 7,935,846 0.1 0.1 0.1 0.1583 n/a
Hong Kong n/a n/a n/a 66,398,000 7,154,600 1.8 13.2 0.4 9.2805 40.27
Hungary 72,324 356,363 187,400,000 201,000,000 9,920,362 0.1 0.1 0.1 20.2614 74.86
India 112,000 1,240,000 11,500,000 14,300,000 1,236,686,732 14.4 0.8 79.5 0.0116 0.05
Indonesia n/a n/a n/a 2,783,000 246,864,191 87.2 0.7 1.7 0.0113 0.16
Iran 215,000 2,150,000 n/a 30,000 76,424,443 99.5 0.1 0.1 0.0004 n/a
Iraq 11,000 226,718 n/a 425,000 32,578,209 99.0 0.1 0.1 0.0130 n/a
Ireland n/a n/a n/a 25,601,000 4,586,897 1.1 0.2 0.2 5.5813 193.22
Israel 7,780 93,989 27,000,000 27,000,000 7,910,500 18.6 0.3 0.1 3.4132 34.77
Italy 696,756 5,819,010 4,082,900,000 2,300,000,000 59,539,717 3.7 0.2 0.1 38.6297 113.65
Japan 17,600 198,300 80,000,000 347,900,000 127,561,489 0.2 36.2 0.1 2.7273 33.62
Jordan 3,952 35,688 656,565 498,000 6,318,000 97.2 0.4 0.1 0.0788 0.02
Kazakhstan 10,000 71,700 20,000,000 35,800,000 16,791,425 70.4 0.2 0.1 2.1320 6.57
Kuwait 44 45 n/a 36,000 3,250,496 74.1 2.8 8.5 0.0111 n/a
Kyrgyzstan 5,498 7,850 2,000,000 11,543,000 5,607,200 88.0 0.1 0.1 2.0586 n/a
Latvia n/a n/a n/a 57,760,000 2,034,319 0.1 0.1 0.1 28.3928 158.45
Lebanon 10,500 92,000 15,000,000 18,860,000 4,424,888 61.3 0.2 0.1 4.2623 n/a
Libya 8,300 33,000 n/a 438,000 6,154,623 96.6 0.3 0.1 0.0712 n/a
225EP 2015 (62) 1 (207-227)
AN ANALYSIS OF THE RELATION BETWEEN WINE CONSUMPTION AND CULTURAL MODELS
Country
Grape-bearing Areas (ha)
Grape Production
(tonnes)
Wine Production (liters)
Wine Consumption
(liters)Population Figure
M* B* H* Wine Consum-
ption (liters per capita)
Wine Consumer
Expen-diture (US$ per capita)
(% of country’s population)
Liechtenstein n/a 195 60,606 135,000 36,656 5.0 0.1 0.1 3.6829 n/a
Lithuania n/a n/a n/a 357,000 2,987,773 0.1 0.1 0.1 0.1195 118.32
Luxembourg 1,223 11,318 13,200,000 4,836,000 530,946 2.3 0.1 0.1 9.1083 n/a
Macedonia 20,948 240,461 82,000,000 86,500,000 2,105,575 39.3 0.1 0.1 41.0814 n/a
Madagascar 2,500 13,000 9,000,000 11,300,000 22,293,914 3.0 0.1 0.1 0.5069 n/a
Malaysia n/a n/a n/a 4,500,000 29,239,927 63.7 17.7 6 0.1539 6.25
Malta 1,620 4,555 4,000,000 9,700,000 419,455 0.2 0.1 0.2 23.1252 n/a
Mexico 26,915 375,298 102,000,000 149,900,000 120,847,477 0.1 0.1 0.1 1.2404 6.49
Moldova 129,351 505,917 385,000,000 39,500,000 3,559,519 0.6 0.1 0.1 11.0970 n/a
Montenegro 8,500 38,861 16,161,600 9,138,000 621,081 18.7 0.1 0.1 14.7131 11.29
Morocco 45,015 341,902 37,000,000 39,800,000 32,521,143 99.9 0.1 0.1 1.2238 1.67
Namibia 5,800 23,000 n/a 102,000 2,259,393 0.3 0.1 0.1 0.0451 n/a
Netherlands 200 1,200 n/a 356,000,000 16,754,962 6.0 0.2 0.5 21.2474 121.46
New Zealand 34,605 340,000 215,000,000 73,600,000 4,433,000 1.2 1.6 2.1 16.6028 156.21
Nigeria n/a n/a n/a 39,360,000 168,833,776 48.8 0.1 0.1 0.2331 0.41
Norway n/a n/a n/a 82,404,000 5,018,573 3.7 0.6 0.5 16.4198 294.46
Occupied Palestinian Territory 2,200 16,000 n/a 0 4,219,000 97.6 0.1 0.1 0.0000 n/a
Pakistan 15,600 63,500 n/a 71,000 179,160,111 96.4 0.1 1.9 0.0004 n/a
Paraguay 349 1,936 6,000,000 22,800,000 6,687,361 0.1 0.1 0.1 3.4094 n/a
Peru 18,483 365,114 66,000,000 63,200,000 29,987,800 0.1 0.2 0.1 2.1075 30.19
Philippines 370 169 n/a 9,920,000 96,706,764 5.5 0.1 0.1 0.1026 0.4
Poland n/a n/a n/a 81,000 38,535,873 0.1 0.1 0.1 0.0021 41.15
Portugal 179,500 839,500 585,700,000 441,300,000 10,514,844 0.6 0.6 0.1 41.9692 130.52
Qatar 3 8 n/a 1,671,000 2,050,514 67.7 3.1 13.8 0.8149 n/a
Réunion 30 240 30,303 0 865,000 4.2 0.2 4.5 0.0000 n/a
Romania 177,661 746,385 405,900,000 524,000,000 20,076,727 0.3 0.1 0.1 26.0999 27.92
Russia 46,100 266,790 620,000,000 1,186,000,000 143,178,000 10.0 0.1 0.1 8.2834 67.03
Saudi Arabia 14,300 150,000 n/a 81,000 28,287,855 93.0 0.3 1.1 0.0029 n/a
Serbia 41,000 263,419 219,699,780 105,700,000 7,199,077 4.2 0.1 0.1 14.6824 23.21
Singapore n/a n/a n/a 30,473,000 5,312,400 14.3 33.9 5.2 5.7362 42.27
Sint Maarten (Dutch part) n/a n/a 213,000 2,244,000 39,088 0.2 0.5 0.2 57.4089 n/a
Slovakia 10,492 52,209 36,900,000 84,200,000 5,407,579 0.2 0.1 0.1 15.5707 66.53
Slovenia 16,351 92,324 85,000,000 86,400,000 2,057,159 3.6 0.1 0.1 41.9997 50.55
South Africa 124,000 1,839,030 1,086,500,000 359,800,000 52,274,945 1.7 0.2 1.1 6.8828 26.2
South Korea 17,181 277,917 12,500,000 32,200,000 50,004,441 0.2 22.9 0.1 0.6439 20.32
Spain 943,000 5,238,300 3,150,000,000 1,010,000,000 46,761,264 2.1 0.1 0.1 21.5991 59.74
Sweden n/a n/a n/a 62,769,000 9,519,374 4.6 0.4 0.2 6.5938 272.52
Switzerland 14,920 127,153 110,500,000 309,600,000 7,996,861 5.5 0.4 0.4 38.7152 502.78
Syria 45,000 325,000 85,859 24,000 22,399,254 92.8 0.1 0.1 0.0011 n/a
Taiwan 2,800 99,267 n/a 18,603,000 23,272,000 0.1 21.3 0.1 0.7994 35.25
Tajikistan 36,000 167,101 6,000,000 10,000 8,008,990 96.7 0.1 0.1 0.0012 n/a
Tanzania 3,600 18,000 n/a 4,286,000 47,783,107 35.2 0.1 0.1 0.0897 n/a
Thailand 4,500 80,000 n/a 15,730,000 66,785,001 5.5 93.2 0.1 0.2355 3.46
Tunisia 30,000 115,000 28,000,000 83,700,000 10,777,500 99.5 0.1 0.1 7.7662 1.97
Turkey 462,296 4,275,659 14,000,000 14,100,000 73,997,128 98.0 0.1 0.1 0.1905 0.32
Turkmenistan 18,500 240,000 18,000,000 4,549,000 5,172,931 93.0 0.1 0.1 0.8794 5.1
Ukraine 67,900 456,000 215,000,000 206,800,000 45,593,300 1.2 0.1 0.1 4.5358 19.08
United Arab Emirates 20 55 n/a 18,006,000 9,205,651 76.9 2.0 6.6 1.9560 1.99
United Kingdom 640 1,000 2,300,000 1,273,000,000 63,695,687 4.4 0.4 1.3 19.9857 183.56
United States 389,349 6,661,820 2,760,400,000 3,269,238,000 313,873,685 0.9 1.2 0.6 10.4158 84.84
Uruguay 8,000 130,000 110,900,000 93,400,000 3,395,253 0.1 0.1 0.1 27.5090 n/a
Uzbekistan 115,000 1,120,000 25,000,000 110,200,000 29,774,500 96.7 0.1 0.1 3.7012 n/a
Venezuela 1,100 20,000 n/a 17,224,000 29,954,782 0.3 0.1 0.1 0.5750 6.43
Vietnam 740 15,308 n/a 12,490,000 88,772,900 0.2 16.4 0.1 0.1407 0.22
Yemen 13,532 154,869 n/a 10,000 23,852,409 99.1 0.1 0.6 0.0004 n/a
Zimbabwe 390 3,200 3,030,300 5,258,000 13,724,317 0.9 0.1 0.1 0.3831 n/a
Bangladesh n/a n/a n/a 77,000 154,695,368 89.8 0.5 9.1 0.0005 n/a

226 EP 2015 (62) 1 (207-227)
Adrian Stancu
Country
Grape-bearing Areas (ha)
Grape Production
(tonnes)
Wine Production (liters)
Wine Consumption
(liters)Population Figure
M* B* H* Wine Consum-
ption (liters per capita)
Wine Consumer
Expen-diture (US$ per capita)
(% of country’s population)
Benin n/a n/a n/a 5,882,000 10,050,702 23.8 0.1 0.1 0.5852 n/a
Bhutan n/a n/a n/a 29,000 741,822 0.2 74.7 22.6 0.0391 n/a
Brunei n/a n/a n/a 57,000 412,238 75.1 8.6 0.3 0.1383 n/a
Burkina Faso n/a n/a n/a 14,031,000 16,460,141 61.6 0.1 0.1 0.8524 n/a
Burma (Myanmar) n/a n/a n/a 688,000 52,797,319 4.0 80.1 1.7 0.0130 n/a
Cambodia n/a n/a n/a 1,623,000 14,864,646 2.0 96.9 0.1 0.1092 n/a
Cameroon n/a n/a n/a 10,987,000 21,699,631 18.3 0.1 0.1 0.5063 n/a
Central African Republic n/a n/a n/a 294,000 4,525,209 8.5 0.1 0.1 0.0650 n/a
Chad n/a n/a n/a 1,978,000 12,448,175 55.3 0.1 0.1 0.1589 n/a
Comoros n/a n/a n/a 146,000 717,503 98.3 0.1 0.1 0.2035 n/a
Cote d’Ivoire n/a n/a n/a 28,552,000 19,839,750 37.5 0.1 0.1 1.4391 n/a
Djibouti n/a n/a n/a 532,000 859,652 96.9 0.1 0.1 0.6189 n/a
Fiji n/a n/a n/a 1,150,000 874,742 6.3 0.1 27.9 1.3147 n/a
Gabon n/a n/a n/a 7,576,000 1,632,572 11.2 0.1 0.1 4.6405 n/a
Gambia n/a n/a n/a 1,791,000 1,791,225 95.1 0.1 0.1 0.9999 n/a
Ghana n/a n/a n/a 30,657,000 25,366,462 15.8 0.1 0.1 1.2086 n/a
Guinea n/a n/a n/a 1,298,000 11,451,273 84.4 0.1 0.1 0.1133 n/a
Guinea Bissau n/a n/a n/a 7,101,000 1,663,558 45.1 0.1 0.1 4.2686 n/a
Guyana n/a n/a n/a 81,000 795,369 6.4 0.1 24.9 0.1018 n/a
Kenya n/a n/a n/a 6,607,000 43,178,141 9.7 0.1 0.1 0.1530 n/a
Kosovo n/a n/a n/a 343,000 1,807,106 87.0 0.1 0.1 0.1898 n/a
Laos n/a n/a n/a 443,000 6,645,827 0.1 66.0 0.1 0.0667 n/a
Liberia n/a n/a n/a 616,000 4,190,435 12.0 0.1 0.1 0.1470 n/a
Macao n/a n/a n/a 7,189,000 556,783 0.2 17.3 0.1 12.9117 n/a
Malawi n/a n/a n/a 1,090,000 15,906,483 13.0 0.1 0.1 0.0685 n/a
Maldives n/a n/a n/a 1,137,000 338,442 98.4 0.6 0.3 3.3595 n/a
Mali n/a n/a n/a 543,000 14,853,572 92.4 0.1 0.1 0.0366 n/a
Mauritania n/a n/a n/a 29,000 3,796,141 99.1 0.1 0.1 0.0076 n/a
Mauritius n/a n/a n/a 2,568,000 1,291,167 16.7 0.1 56.4 1.9889 n/a
Mongolia n/a n/a n/a 2,875,000 2,796,484 3.2 55.1 0.1 1.0281 n/a
Mozambique n/a n/a n/a 12,059,000 25,203,395 18.0 0.1 0.1 0.4785 n/a
Nepal n/a n/a n/a 611,000 27,474,377 4.6 10.3 80.7 0.0222 n/a
Niger n/a n/a n/a 1,323,000 17,157,042 98.4 0.1 0.1 0.0771 n/a
Oman n/a n/a n/a 533,000 3,314,001 85.9 0.8 5.5 0.1608 n/a
Senegal n/a n/a n/a 6,839,000 13,726,021 96.4 0.1 0.1 0.4983 n/a
Sierra Leone n/a n/a n/a 717,000 5,978,727 78.0 0.1 0.1 0.1199 n/a
Sri Lanka n/a n/a n/a 1,103,000 20,328,000 9.8 69.3 13.6 0.0543 n/a
Sudan n/a n/a n/a 87,000 37,195,349 90.7 0.1 0.1 0.0023 n/a
Suriname n/a n/a n/a 381,000 534,541 15.2 0.6 19.8 0.7128 n/a
Togo n/a n/a n/a 12,053,000 6,642,928 14.0 0.1 0.1 1.8144 n/a
Trinidad and Tobago n/a n/a n/a 1,223,000 1,337,439 5.9 0.3 22.7 0.9144 n/a
Uganda n/a n/a n/a 1,005,000 36,345,860 11.5 0.1 0.3 0.0277 n/a
Source: Food and Agriculture Organization of the United Nations Statistics Division, 2012a, 2012b, 2012c, 2012d; The Wine Institute, 2012a, 2012b; The World Bank, 2015; USDA, 2012; Euromonitor International Ltd., 2013b, p. 119; Pew Research Center, The Pew Forum on Religion & Public Life, 2012, pp. 45-50, and author’s own calculation based on data in The Wine Institute, 2012b, and The World Bank, 2015.
*M - Muslim Population Figure; B - Buddhist Population Figure; H - Hindu Population Figure.
Note: The following formula was used to convert tonnes in liters for wine production according to different sources used (Stoker, 2013, p. 43; FAO/INFOODS Databases, 2012,
p. 9): (g) 0.99
(ml) 1 (g) Wine (ml) Wine ⋅=

227EP 2015 (62) 1 (207-227)
AN ANALYSIS OF THE RELATION BETWEEN WINE CONSUMPTION AND CULTURAL MODELS
Appendix 2. Weight of wine consumer expenditure in the alcoholic beverages consumer expenditure and in disposable income in 2011
CountryWeight of wine consumer expenditure in:
CountryWeight of wine consumer expenditure in:
Alcoholic Beverages Expenditure (%)
Disposable Income (%)
Alcoholic Beverages Expenditure (%)
Disposable Income (%)
Algeria 47.03 0.193 Lithuania 15.19 0.658
Argentina 45.41 1.024 Malaysia 20.55 0.106
Australia 34.85 0.629 Mexico 5.45 0.093
Austria 31.42 0.391 Morocco 23.66 0.081
Azerbaijan 13.24 0.068 Netherlands 48.08 0.563
Belarus 25.50 1.114 New Zealand 37.15 0.779
Belgium 68.95 0.946 Nigeria 10.44 0.042
Bolivia 3.98 0.056 Norway 36.49 0.671
Brazil 20.45 0.165 Pakistan 0.00 0.000
Bulgaria 11.45 0.308 Peru 13.28 0.737
Canada 32.08 0.594 Philippines 21.28 0.142
Chile 27.41 0.426 Poland 27.57 0.909
China 11.80 0.036 Portugal 69.37 0.809
Colombia 3.10 0.072 Romania 23.46 0.651
Croatia 46.24 0.849 Russia 18.09 0.856
Czech 19.84 0.883 Saudi Arabia n/a n/a
Denmark 54.81 0.881 Singapore 36.26 0.152
Ecuador 4.67 0.023 Slovakia 26.53 0.635
Egypt 6.29 0.008 Slovenia 25.63 0.343
Estonia 28.07 1.392 South Africa 16.35 0.590
Finland 26.17 0.799 South Korea 17.69 0.155
France 58.88 0.750 Spain 44.23 0.308
Germany 37.31 0.439 Sweden 49.15 0.995
Greece 38.07 0.332 Switzerland 78.18 1.092
Hong Kong 34.69 0.137 Taiwan 27.44 0.254
Hungary 28.42 1.453 Thailand 2.92 0.095
India 0.56 0.003 Tunisia 53.49 0.066
Indonesia 5.19 0.005 Turkey 2.76 0.005
Ireland 36.82 0.836 Turkmenistan 16.46 0.203
Israel 27.17 0.188 Ukraine 17.47 0.614
Italy 69.87 0.460 United Arab Emirates 25.42 0.007
Japan 5.23 0.100 United Kingdom 47.87 0.740
Jordan 4.22 0.079 United States 23.21 0.242
Kazakhstan 11.08 0.129 Venezuela 3.19 0.087
Kuwait n/a n/a Vietnam 4.45 0.042
Latvia 30.66 1.524 - - -
Source: Author’s own calculation based on data from Euromonitor International Ltd., 2013a, p. 77, 183.

Economics of Agriculture, Year 62, No. 1 (1-284) 2015, Belgrade
UDC 338.43:63 ISSN 0352-3462
ECONOMICS OF AGRICULTURE
CONTENT
1. Ivkov Milan, Blešić Ivana, Popov Raljić Jovanka, Ivkov Džigurski Anđelija, Pivac Tatjana, Jovanović Tamara VISITORS’ MOTIVES FOR ATTENDING A HYBRID EVENT: A CASE STUDY OF AGRICULTURAL FAIR 9
2. Mikić Neven, Ljubanović Ralević Ivana, Rajić Zoran THE SELECTION OF ACQUISITION STRATEGY AND SOLVING TRADE SURPLUSES OF FOOD PRODUCTS BY USING THE SIMULATION 29
3. Šoškić Dejan INFLATION IMPACT OF FOOD PRICES: CASE OF SERBIA 41
4. Veljković Saša, Stojanović Žaklina, Filipović Jelena ATTITUDES TOWARD FARM ANIMALS WELFARE AND CONSUMER’S BUYING INTENTIONS - CASE OF SERBIA 53
5. Zheliazkov Georgi, Zaimova Darina, Genchev Evgeni, Toneva Krasimira CLUSTER DEVELOPMENT IN RURAL AREAS 73
6. Berjan Siniša, El Bilali Hamid, Janković Snežana, Radosavac Adriana AGRICULTURAL AND RURAL DEVELOPMENT GOVERNANCE AND COORDINATION IN BOSNIA AND HERZEGOVINA 95
7. Božić Dragica, Munćan Petar REGIONAL ASPECTS OF FAMILY HOLDINGS STRUCTURE IN THE REPUBLIC OF SERBIA 107
8. Čikić Jovana, Petrović Marica, Đurđev Branislav DIFFUSION OF KNOWLEDGE AND RURAL TOURISM DEVELOPMENT – EXAMPLE OF VOJVODINA 123
9. Filipović Jasmina, Stanković Slađan, Ceranić Slobodan GROSS MARGIN AS AN INDICATOR OF THE SIGNIFICANCE OF FARMER EDUCATION ON THE WCR RISK ASSESSMENT IN REPEATED SOWING 137

Economics of Agriculture, Year 62, No. 1 (1-284) 2015, Belgrade
10. Jovanović Miomir, Kašćelan Ljiljana, Joksimović Miljan, Despotović Aleksandra COMPARATIVE ANALISYS OF AGRO-FOOD TRADE IN MONTENEGRO AND EU CANDIDATE COUNTRIES 155
11. Osmani Ataul Gani, Hossain Elias MARKET PARTICIPATION DECISION OF SMALLHOLDER FARMERS AND ITS DETERMINANTS IN BANGLADESH 163
12. Radović Vesela, Pejanović Radovan, Marinčić Dušan EXTREME WEATHER AND CLIMATIC EVENTS ON AGRICULTURE AS A RISK OF SUSTAINABLE DEVELOPMENT 181
13. Radukić Snežana, Marković Milan LIMITATION OF TRADE MARGINS AS A MEASURE OF FOOD PRICE CONTROLS: EXPERIENCE OF SERBIA 193
14. Stancu Adrian AN ANALYSIS OF THE RELATION BETWEEN WINE CONSUMPTION AND CULTURAL MODELS 207
15. Škrbić Iva, Jegdić Vaso, Milošević Srđan, Tomka Dragica DEVELOPMENT OF SREMSKI KARLOVCI WINE TOURISM AND INTEGRATION IN THE REGIONAL TOURISM OFFER 229
16. Vehapi Semir, Šabotić Zenaida THE STATE AND PROBLEMS OF SERBIAN AGRICULTURE 245
17. Vuković Predrag, Čavlin Gordana, Čavlin Miroslav COMPLEMENTARITY IN THE DEVELOPMENT OF RURAL TOURISM WITH THE DEVELOPMENT OF THERMAL BATHS, SPA AND WELNESS TOURISM 259