An Analysis of the Long-Run Impact of Ethanol Expansion on Agricultural Markets Chad Hart Center for...
40
An Analysis of the Long-Run Impact of Ethanol Expansion on Agricultural Markets Chad Hart Center for Agricultural and Rural Development Iowa State University [email protected] 515-294-9911 Presentation for representatives from Nidera Ames, Iowa August 20, 2007
-
Upload
laureen-wilkins -
Category
Documents
-
view
220 -
download
0
Transcript of An Analysis of the Long-Run Impact of Ethanol Expansion on Agricultural Markets Chad Hart Center for...

An Analysis of the Long-Run Impact of Ethanol Expansion on Agricultural Markets
Chad HartCenter for Agricultural and Rural Development
Iowa State [email protected]
515-294-9911
Presentation for representatives from NideraAmes, Iowa
August 20, 2007
Outline
Based on the CARD study “Emerging Biofuels: Outlook of Effects on U.S. Grain, Oilseed, and Livestock Markets”
http://www.card.iastate.edu/publications/synopsis.aspx?id=1050
Updated with available 2006 and 2007 data The objective is to estimate:
how large the biofuels sector in the U.S. could become the impact of the biofuels sector on crops markets, trade, and on
livestock markets the response of world agricultural markets
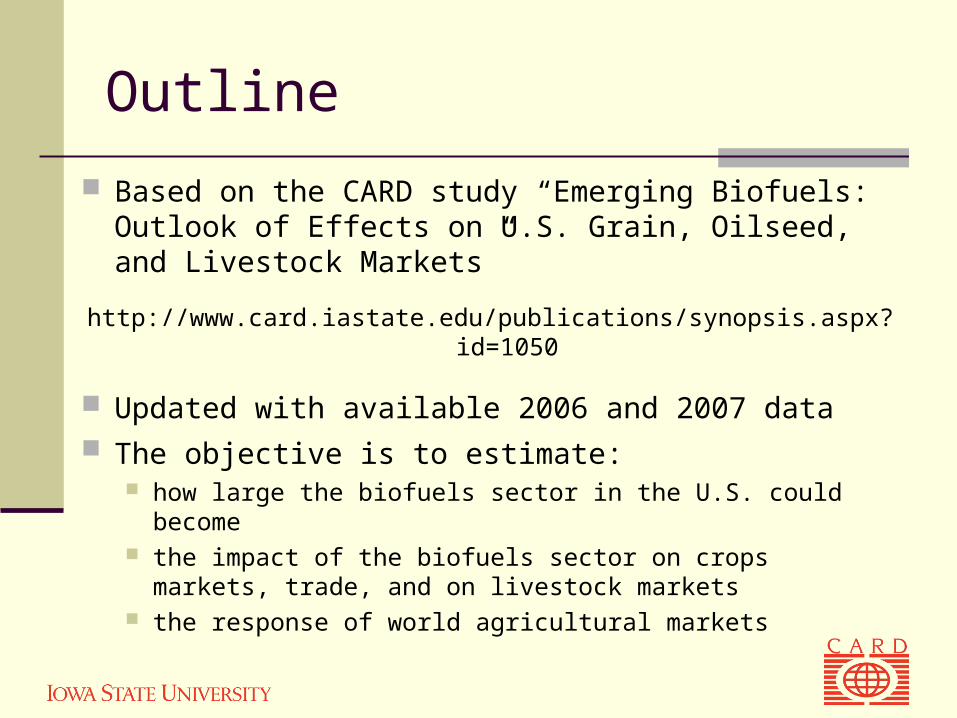
Model Interactions

•Current ethanol capacity: 124 plants, 6.48 billion gallons/year
•Total capacity under construction and expansion: 6.4 billion gallons/year
•76 new ethanol plants and 7 expansion projects underway
•2.2 billion bushels of corn were used in producing fuel ethanol in 2006/2007 marketing year.
•3.2-3.5 billion bushels of corn are expected to be used in producing fuel ethanol for 2007/2008 marketing year.
U.S. Ethanol Industry

Key Determinants of Impacts
Crude oil prices Used NYMEX futures prices as a guide
Policy incentives in the U.S. $0.51/gallon ethanol blenders credit $0.54/gallon import duty and 2.5% import tariff
Demand for E-85 included

Projected U.S. Ethanol Production
0
2
4
6
8
10
12
14
16
2006 2008 2010 2012 2014 2016
billion gallons
Ethanol Production

Projected U.S. Dry Mill Margins
-0.40
-0.20
0.00
0.20
0.40
0.60
0.80
1.00
1.20
1.40
1.60
2006 2008 2010 2012 2014 2016
US$/bushel
Margin Over Operating Costs Margin Over Total Cost

Wholesale Gasoline and Ethanol Prices
1.00
1.25
1.50
1.75
2.00
2.25
2.50
2.75
3.00
2006 2008 2010 2012 2014 2016
US$/gallon
Unleaded Gasoline Ethanol

Projected U.S. Corn Planted Area
70
75
80
85
90
95
2006 2008 2010 2012 2014 2016
million acres
Corn Planted Area
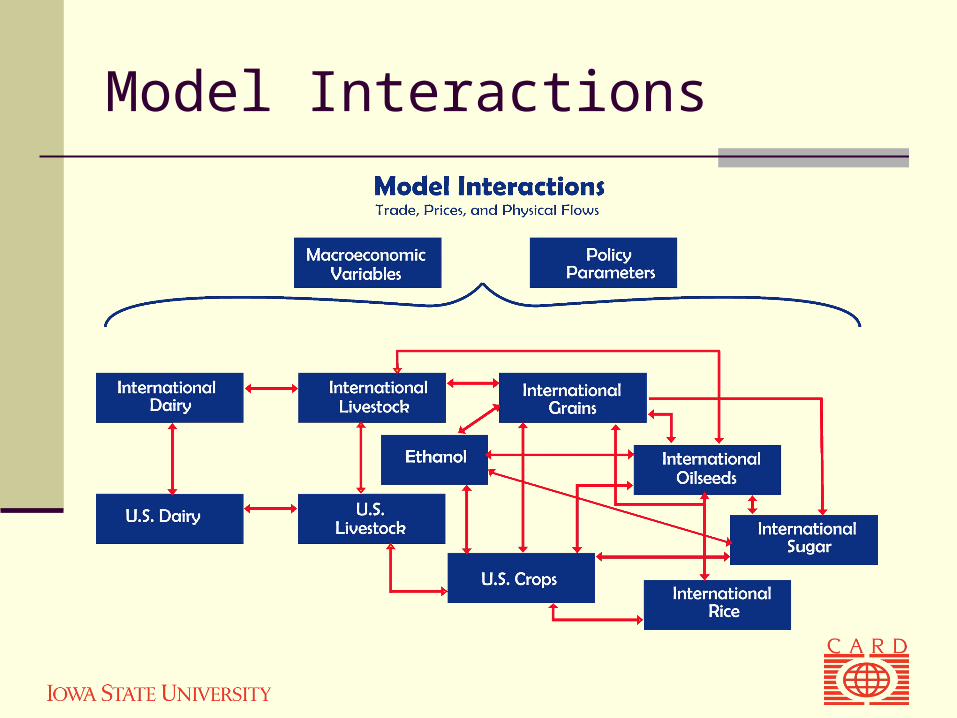
Projected Utilization of U.S. Corn
0
1000
2000
3000
4000
5000
6000
7000
2006 2007 2008 2009 2010 2016
million bushels
Feed Fuel HFCS Seed Food, Other Exports

Projected U.S. Corn and Soybean Prices
2.00
3.00
4.00
5.00
6.00
7.00
8.00
2006 2007 2008 2009 2010 2011 2012 2013 2014 2015 2016
US$/bushel
Corn Soybeans
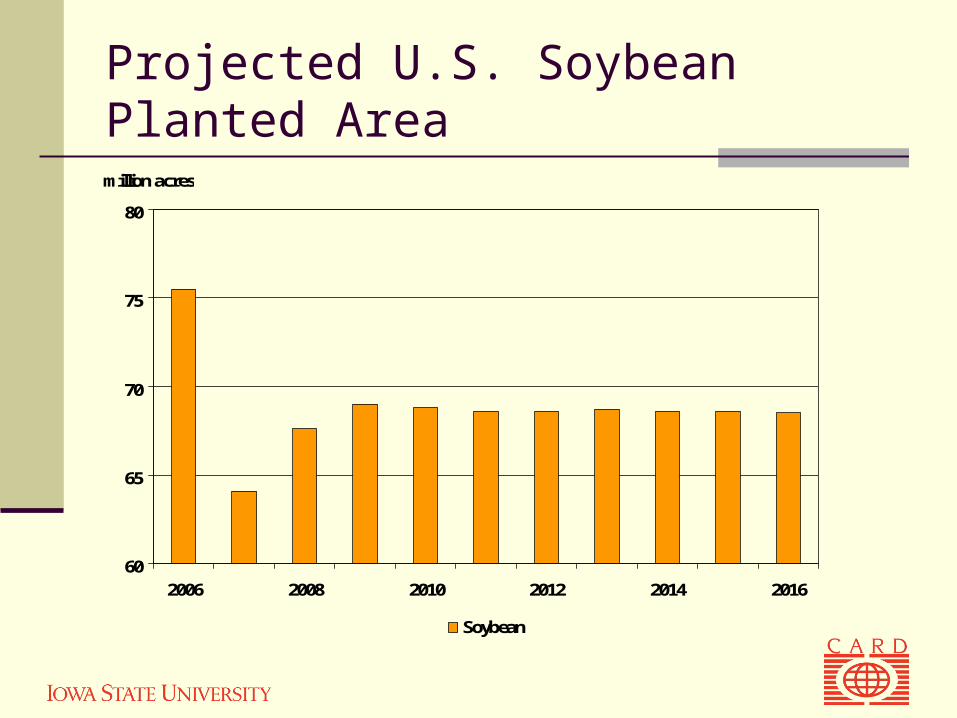
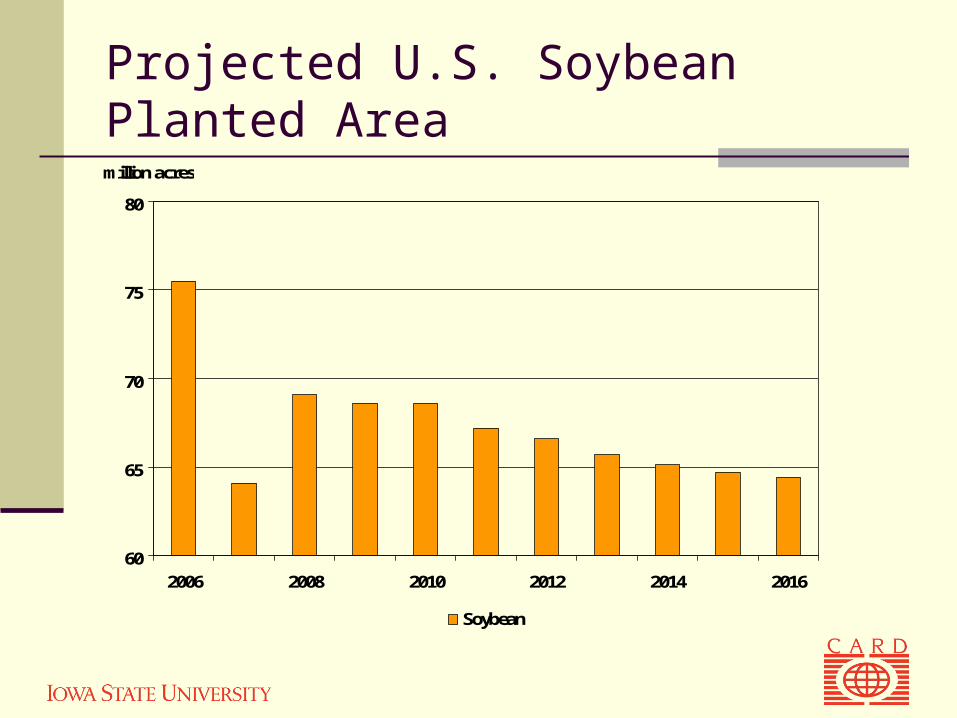
Projected U.S. Soybean Planted Area
60
65
70
75
80
2006 2008 2010 2012 2014 2016
million acres
Soybean

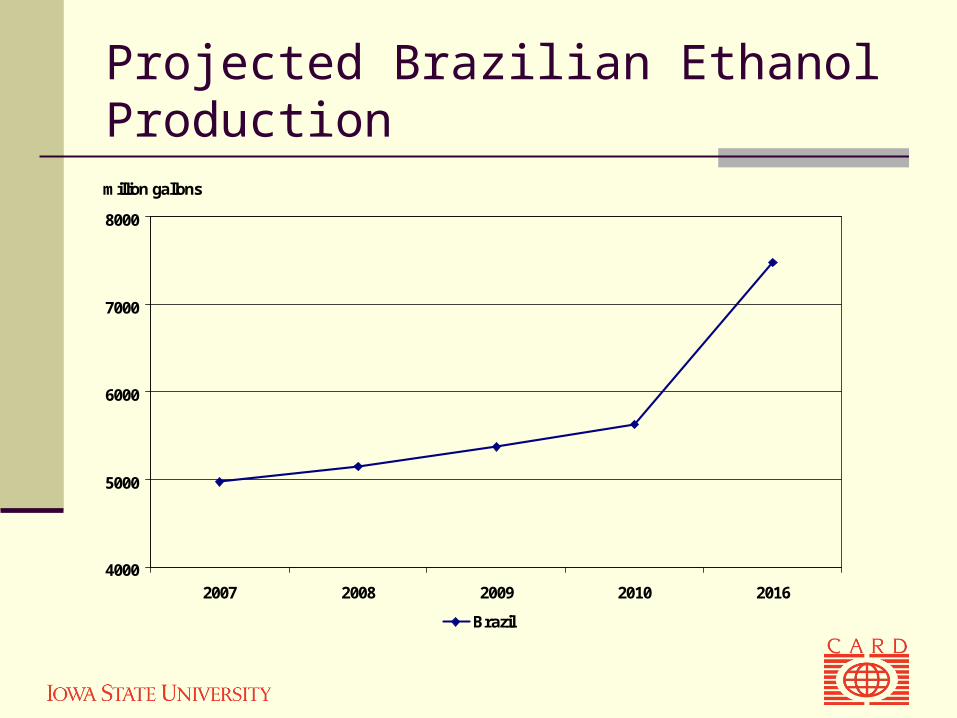
Projected Brazilian Ethanol Production
4000
5000
6000
7000
8000
2007 2008 2009 2010 2016
million gallons
Brazil
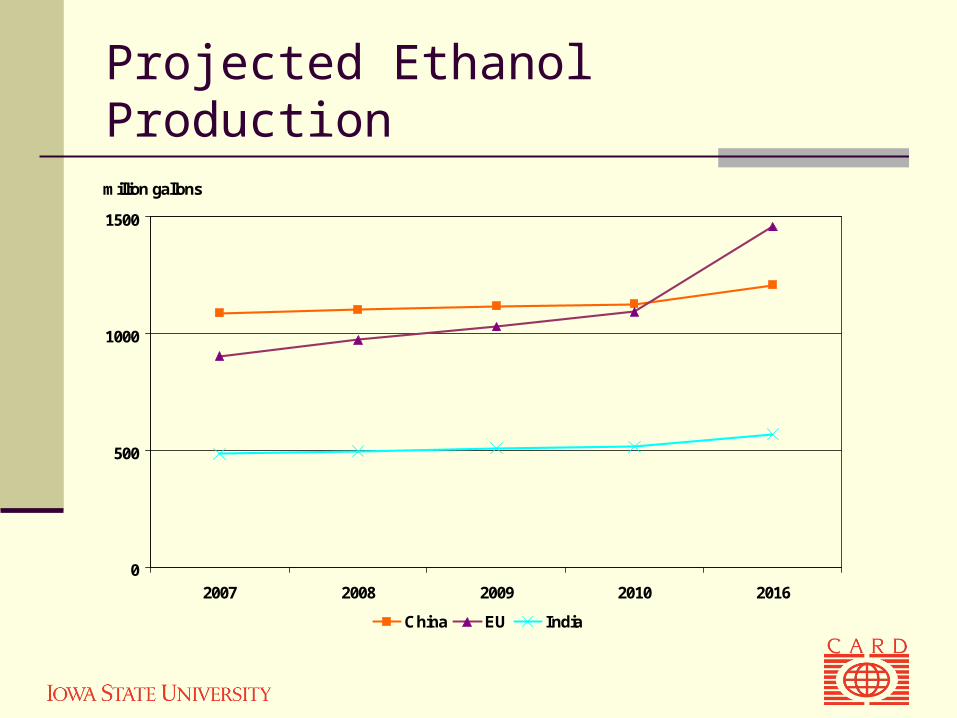
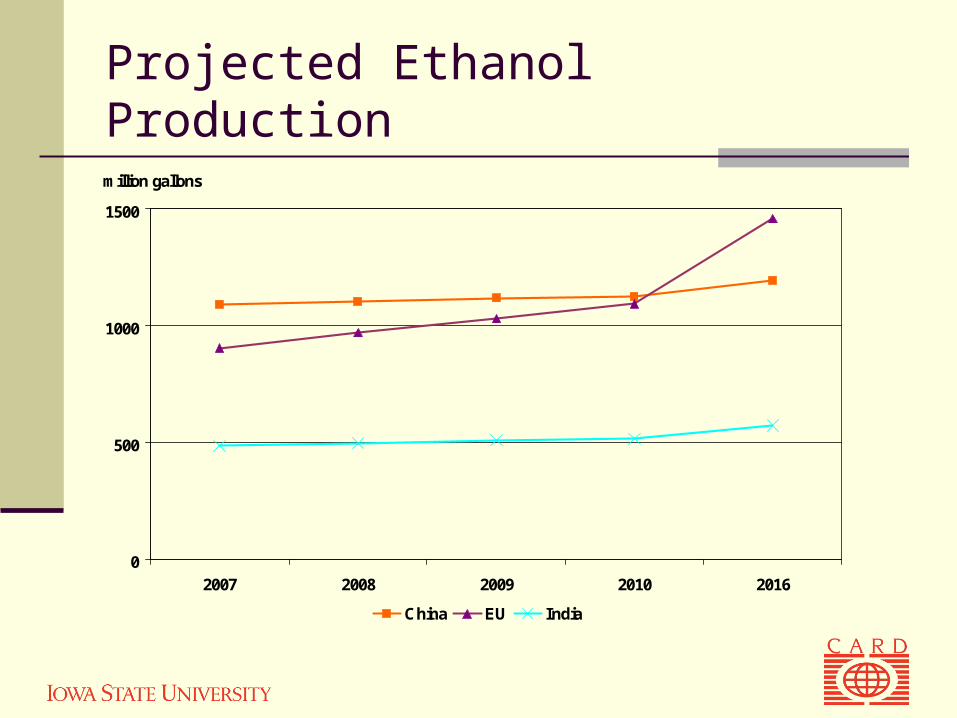
Projected Ethanol Production
0
500
1000
1500
2007 2008 2009 2010 2016
million gallons
China EU India
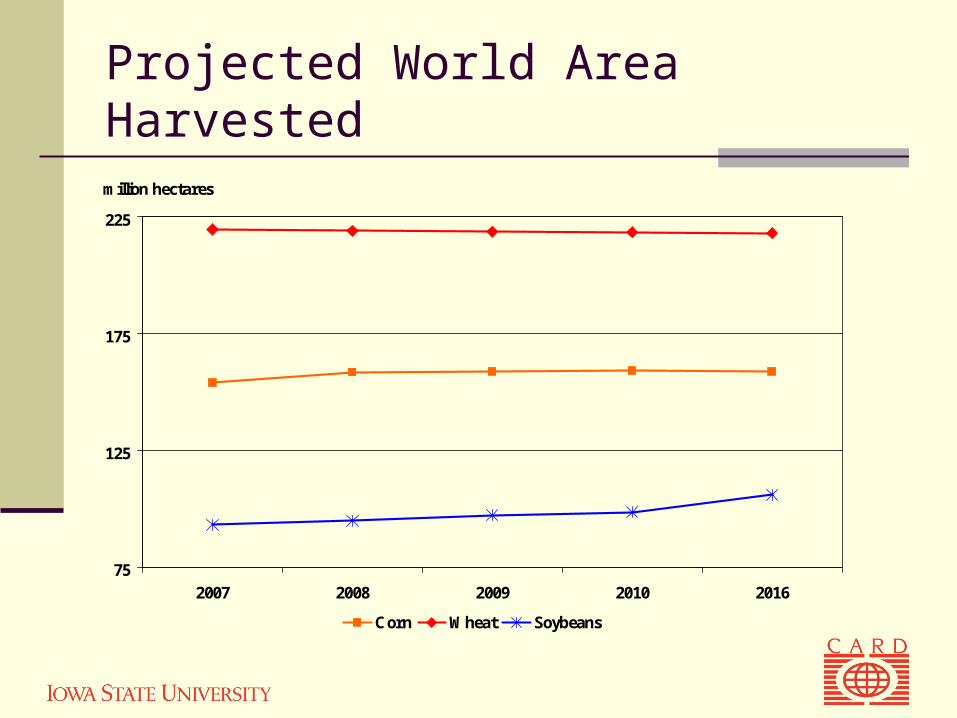
Projected World Area Harvested
75
125
175
225
2007 2008 2009 2010 2016
million hectares
Corn Wheat Soybeans

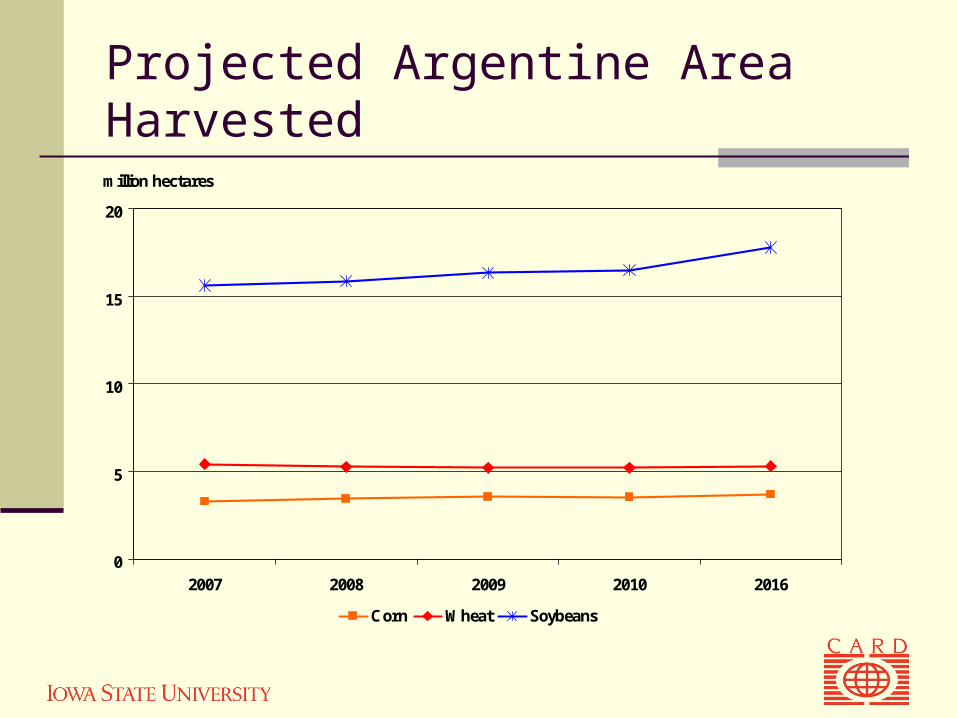
Projected Argentine Area Harvested
0
5
10
15
20
2007 2008 2009 2010 2016
million hectares
Corn Wheat Soybeans

Projected Brazilian Area Harvested
0
5
10
15
20
25
30
35
2007 2008 2009 2010 2016
million hectares
Corn Wheat Soybeans

Projected World Corn Net Exports
2007/08 2016/17
21%
7%
57%
15%
Argentina Brazil
U. S. Rest of World
19%
4%
66%
11%
Argentina Brazil
U. S. Rest of World

Projected World Wheat Net Exports
2007/08 2016/17
11%
20%
24%
45%
Argentina Canada
U. S. Rest of World
11%
16%
24%
49%
Argentina Canada
U. S. Rest of World
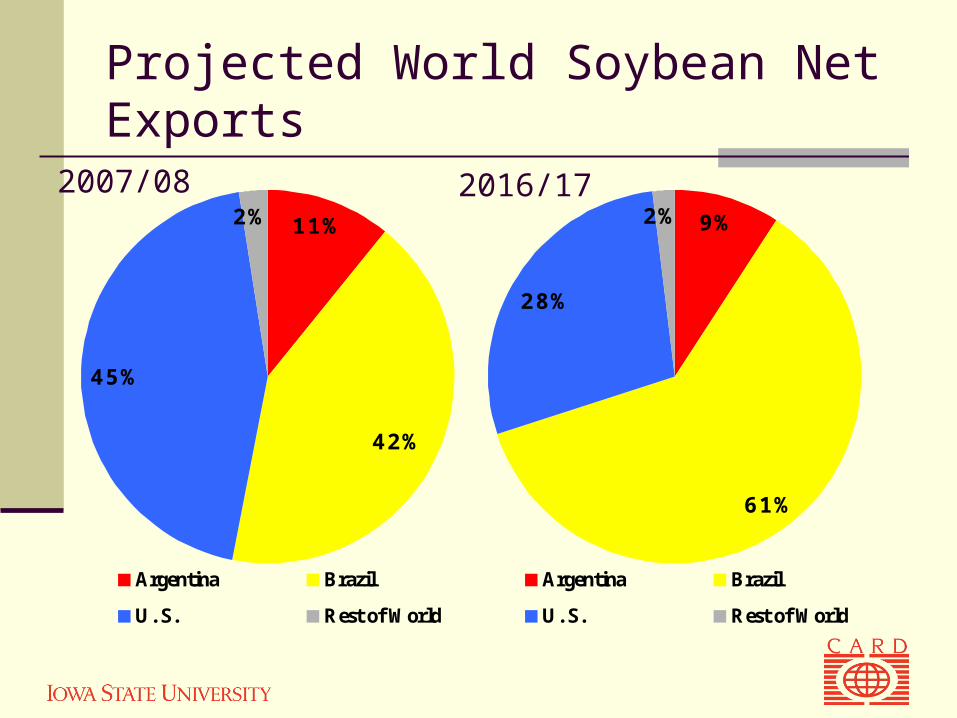
Projected World Soybean Net Exports
2007/08 2016/1711%
42%
45%
2%
Argentina Brazil
U. S. Rest of World
9%
61%
28%
2%
Argentina Brazil
U. S. Rest of World

Projected World Soybean Meal Net Exports
2007/08 2016/17
53%
26%
15%
6%
Argentina Brazil
U. S. Rest of World
52%
28%
12%
8%
Argentina Brazil
U. S. Rest of World
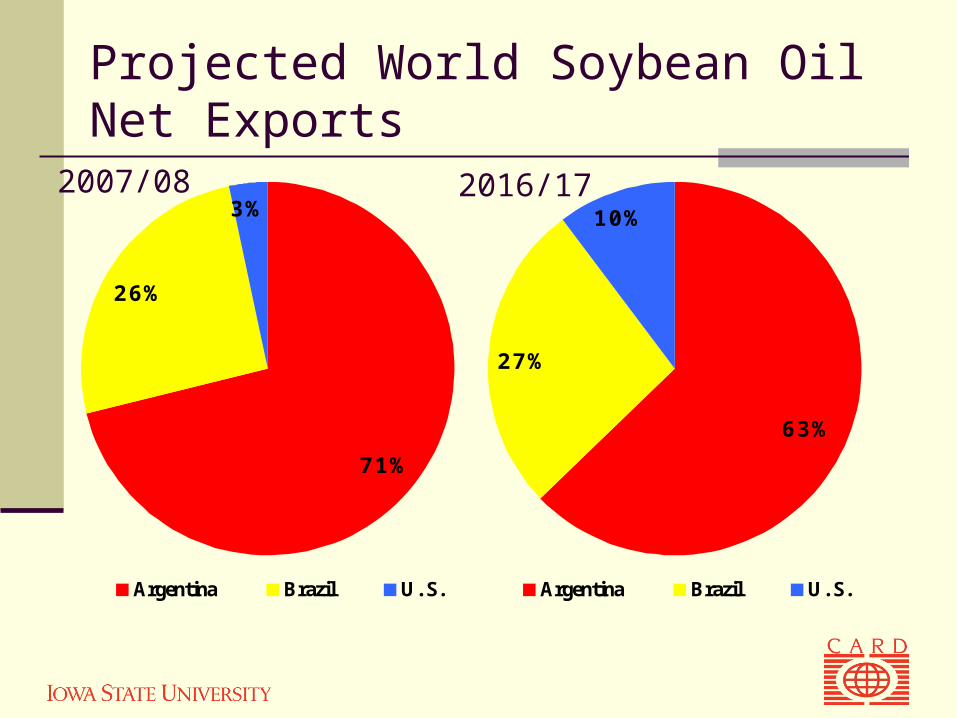
Projected World Soybean Oil Net Exports
2007/08 2016/17
71%
26%
3%
Argentina Brazil U. S.
63%
27%
10%
Argentina Brazil U. S.
Impact of Higher Crude Oil Price
Increased crude oil price by $10/barrel over the projection Margins on ethanol plants increase New incentive to invest in added capacity for ethanol
production Eventually, a new equilibrium reached where there is no
incentive to invest in or exit the ethanol industry Will demand for ethanol be enough?
E-10 market will saturate around 15 billion gallons Drop in ethanol price will eventually encourage increase in
demand for the flex-fuel cars
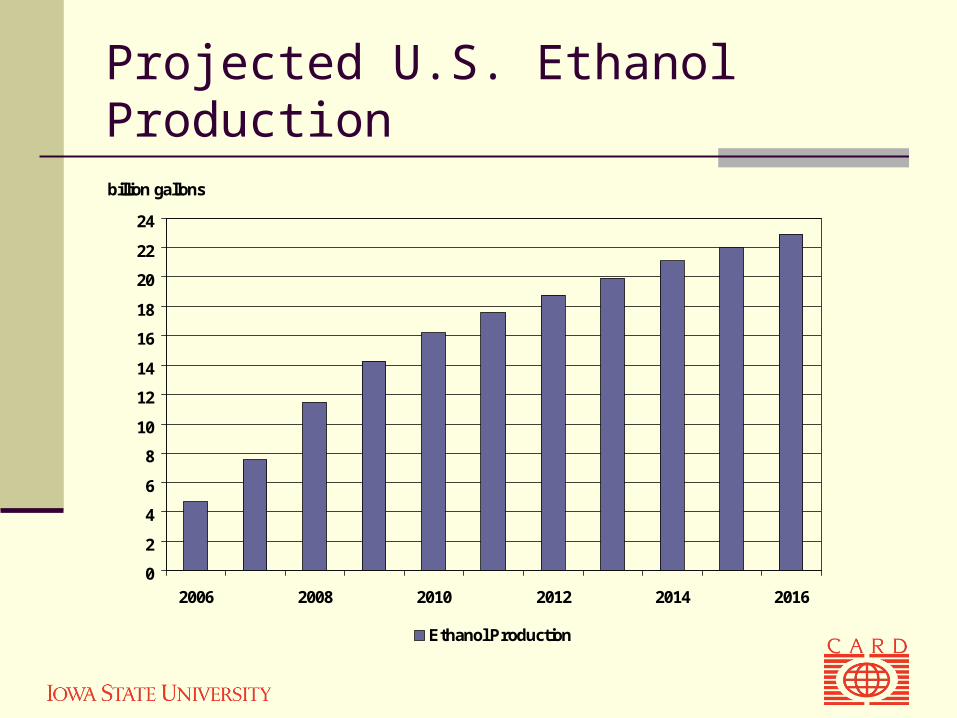
Projected U.S. Ethanol Production
0
2
4
6
8
10
12
14
16
18
20
22
24
2006 2008 2010 2012 2014 2016
billion gallons
Ethanol Production

Projected U.S. Dry Mill Margins
-0.40
-0.20
0.00
0.20
0.40
0.60
0.80
1.00
1.20
1.40
1.60
2006 2008 2010 2012 2014 2016
US$/bushel
Margin Over Operating Costs Margin Over Total Cost
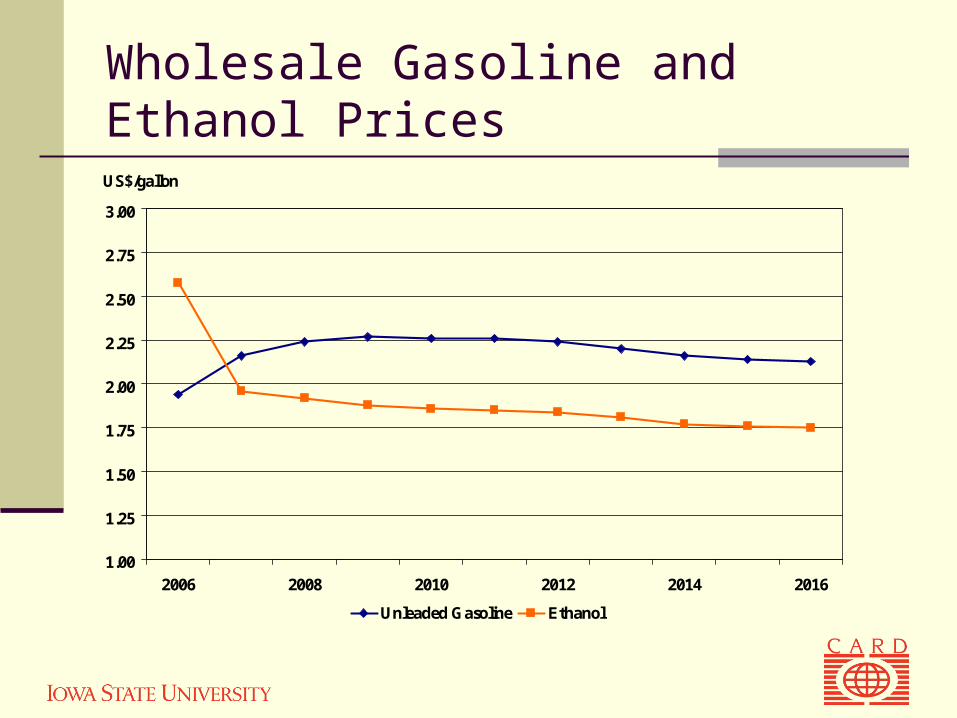
Wholesale Gasoline and Ethanol Prices
1.00
1.25
1.50
1.75
2.00
2.25
2.50
2.75
3.00
2006 2008 2010 2012 2014 2016
US$/gallon
Unleaded Gasoline Ethanol

Projected U.S. Corn Planted Area
70
75
80
85
90
95
100
105
2006 2008 2010 2012 2014 2016
million acres
Corn Planted Area

Projected Utilization of U.S. Corn
0
1000
2000
3000
4000
5000
6000
7000
8000
9000
2006 2007 2008 2009 2010 2016
million bushels
Feed Fuel HFCS Seed Food, Other Exports

Projected U.S. Corn and Soybean Prices
2.00
3.00
4.00
5.00
6.00
7.00
8.00
2006 2007 2008 2009 2010 2011 2012 2013 2014 2015 2016
US$/bushel
Corn Soybeans
Projected U.S. Soybean Planted Area
60
65
70
75
80
2006 2008 2010 2012 2014 2016
million acres
Soybean
Projected Brazilian Ethanol Production
4000
5000
6000
7000
8000
2007 2008 2009 2010 2016
million gallons
Brazil
Projected Ethanol Production
0
500
1000
1500
2007 2008 2009 2010 2016
million gallons
China EU India

Projected World Area Harvested
75
125
175
225
2007 2008 2009 2010 2016
million hectares
Corn Wheat Soybeans
Projected Argentine Area Harvested
0
5
10
15
20
2007 2008 2009 2010 2016
million hectares
Corn Wheat Soybeans
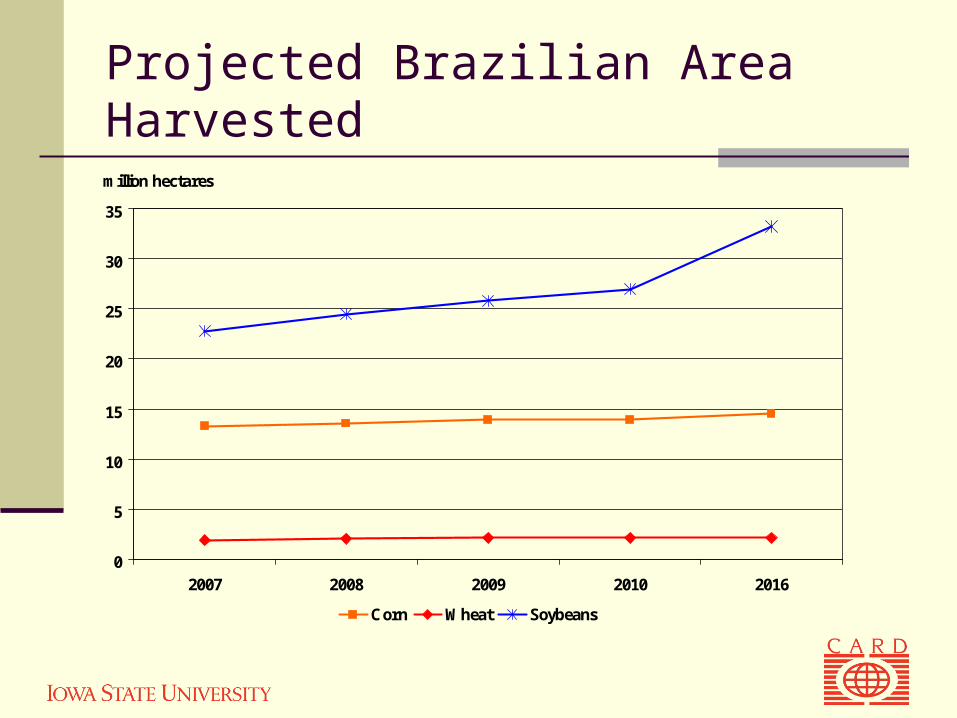
Projected Brazilian Area Harvested
0
5
10
15
20
25
30
35
2007 2008 2009 2010 2016
million hectares
Corn Wheat Soybeans
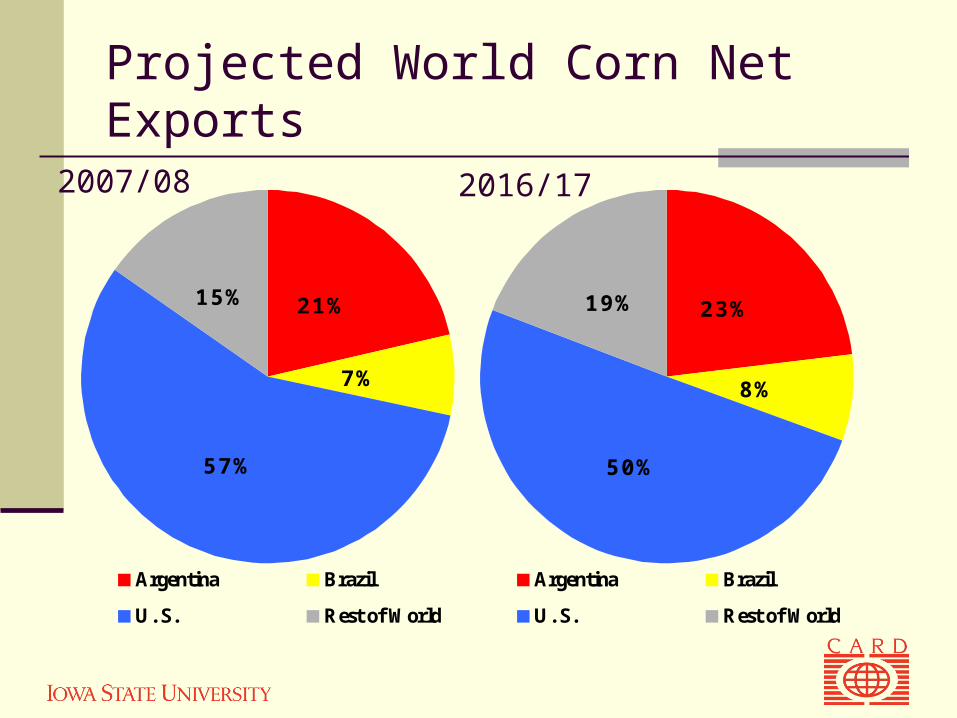
Projected World Corn Net Exports
2007/08 2016/17
21%
7%
57%
15%
Argentina Brazil
U. S. Rest of World
23%
8%
50%
19%
Argentina Brazil
U. S. Rest of World
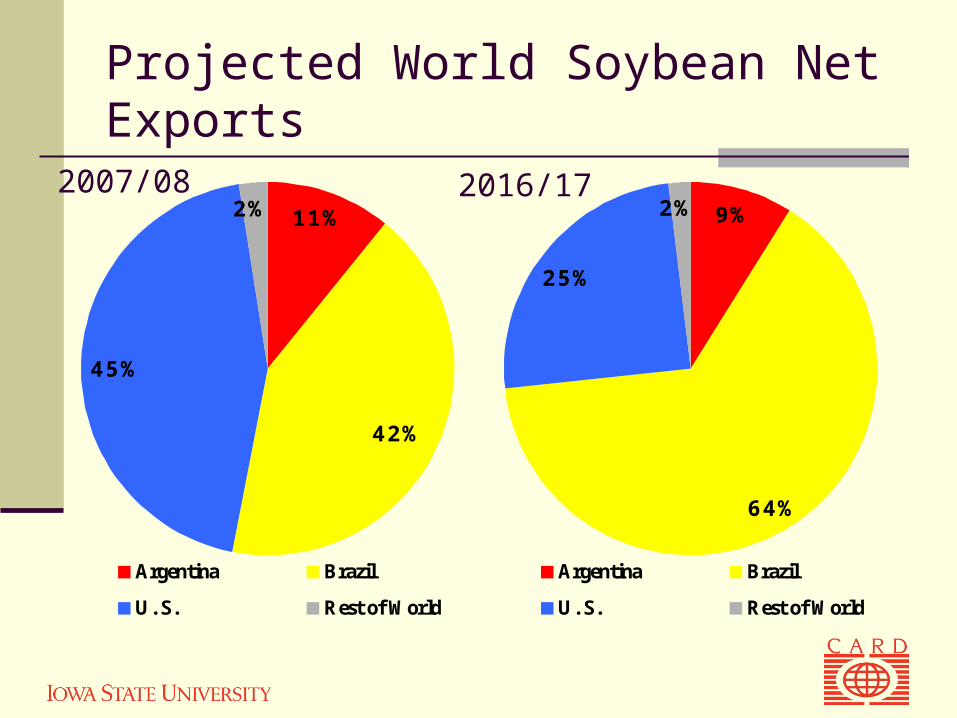
Projected World Soybean Net Exports
2007/08 2016/1711%
42%
45%
2%
Argentina Brazil
U. S. Rest of World
9%
64%
25%
2%
Argentina Brazil
U. S. Rest of World

Projected World Soybean Meal Net Exports
2007/08 2016/17
53%
26%
15%
6%
Argentina Brazil
U. S. Rest of World
52%
28%
13%
7%
Argentina Brazil
U. S. Rest of World
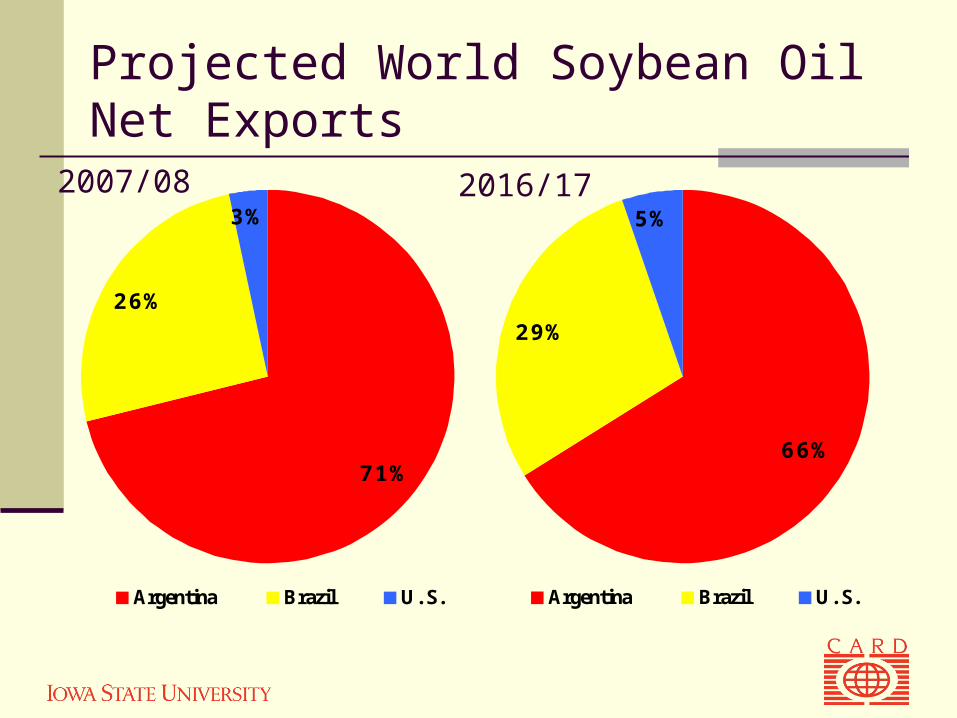
Projected World Soybean Oil Net Exports
2007/08 2016/17
71%
26%
3%
Argentina Brazil U. S.
66%
29%
5%
Argentina Brazil U. S.

Thank You