AN ANALYSIS OF THE DEMOGRAPHICS, ECONOMIC BASE, AND … · A Report to RDG PLANNING & DESIGN AND...
42
AN ANALYSIS OF THE DEMOGRAPHICS, ECONOMIC BASE, AND REAL ESTATE INVENTORY OF THE CITY OF AMES A Report to RDG PLANNING & DESIGN AND CITY OF AMES from GRUEN GRUEN + ASSOCIATES Urban Economists, Market Strategists and Land Use/Public Policy Analysts March 2019 C1529
Transcript of AN ANALYSIS OF THE DEMOGRAPHICS, ECONOMIC BASE, AND … · A Report to RDG PLANNING & DESIGN AND...
AN ANALYSIS OF THE DEMOGRAPHICS, ECONOMIC BASE, AND REAL ESTATE INVENTORY OF THE CITY OF AMES
A Report to
RDG PLANNING & DESIGN AND CITY OF AMES
from
GRUEN GRUEN + ASSOCIATES Urban Economists, Market Strategists and Land Use/Public Policy Analysts
March 2019
C1529

AN ANALYSIS OF THE DEMOGRAPHICS, ECONOMIC BASE AND REAL ESTATE INVENTORY OF THE CITY OF AMES
A Report to
RDG PLANNING & DESIGN AMD CITY OF AMES
from
GRUEN GRUEN + ASSOCIATES Urban Economists, Market Strategists and Land Use/Public Policy Analysts
March 2019
C1529
APPLYING KNOWLEDGE
CREATING RESULTS ADDING VALUE
©2019 GRUEN GRUEN + ASSOCIATES. Do not reproduce without written permission from Gruen Gruen + Associates.

i
TABLE OF CONTENTS
Page
CHAPTER I: INTRODUCTION AND EXECUTIVE SUMMARY ............................................................. 1
INTRODUCTION ........................................................................................................................................ 1
WORK COMPLETED ................................................................................................................................. 1
PRINCIPAL FINDINGS AND CONCLUSIONS .......................................................................................... 2
CHAPTER II: EMPLOYMENT BASE COMPOSITION AND TRENDS ................................................... 9
INTRODUCTION ........................................................................................................................................ 9
EMPLOYMENT TRENDS BY INDUSTRY SECTOR ................................................................................. 9
PRIVATE INDUSTRY CLUSTERS WITHIN STORY COUNTY ............................................................... 14
EMPLOYMENT TRENDS BY ESTABLISHMENT SIZE .......................................................................... 15
CITY OF AMES LABOR SHED ................................................................................................................ 17 CHAPTER III: DEMOGRAPHIC TRENDS AND LABOR MARKET CHARACTERISTICS .................... 18
INTRODUCTION ...................................................................................................................................... 18
CITY OF AMES POPULATION AND HOUSEHOLD BASE ..................................................................... 18
LABOR FORCE CONDITIONS AND CHARACTERISTICS .................................................................... 22 CHAPTER IV: LAND USE TRENDS AND OFFICE AND INDUSTRIAL MARKET CONDITIONS ........ 26
OFFICE MARKET SUPPLY TRENDS ..................................................................................................... 28
INDUSTRIAL AND FLEX MARKET SUPPLY TRENDS .......................................................................... 31 CHAPTER V: RETAIL MARKET CONDITIONS ........................................................................................ 34
AND TAXABLE RETAIL SALES TRENDS ................................................................................................. 34
INTRODUCTION ...................................................................................................................................... 34
RETAIL MARKET SUPPLY TRENDS ...................................................................................................... 34
TAXABLE RETAIL SALES BASE OF AMES ........................................................................................... 35
ii
LIST OF TABLES AND FIGURES Page
Table II-1: Ames MSA Non-farm Employment by Industry Sector, 2005-2017 ......................................... 10
Table II-2: Iowa State University Employment, 2000-20181 ...................................................................... 12
Table II-3: Shift in Composition of Ames MSA Employment, 2005-20171 ................................................. 13
Table II-4: Private Non-farm Industry Subsectors with Highest Employment Location Quotients ............. 14
Table II-5: Examples of Private Non-Retail Employers With More Than 100 Employees in Ames’ Area . 15
Table II-6: Ames MSA Employment by Establishment Size, 2008-20161 .................................................. 16
Table II-7: Distribution of Workers Employed in City of Ames by County of Residence (2015) ................ 17
Table III-1: Population, Households and Housing Units in City of Ames ................................................... 18
Figure III-1: Iowa State University Fall Enrollment, 2007-2018 ................................................................. 19
Figure III-2: Story County Population Change 2010-2017 .......................................................................... 20
Figure III-3: Ames Population by Age ......................................................................................................... 21
Figure III-4: Unemployment Rate Estimates, 2000-2018 ........................................................................... 23
Table III-2: Educational Attainment of Ames Residents Age 25+ (2017 Estimate) ................................... 23
Figure III-5: Occupational Mix of Ames Labor Force (2017 Estimate) ....................................................... 24
Figure III-6: Occupational Mix of Ames, Story County, Polk County, and Boone County Labor Force (2017 Estimate) ......................................................................................................................................... 25
Table IV-3: Potentially Developable Nonresidential Land Including Current Agricultural Uses ................. 26
Figure IV-1: Nonresidential Land Supply ................................................................................................... 27
Table IV-4: Current Office Market Inventory in City of Ames by Year Built ............................................... 28
Figure IV-2: Office Space (Square Feet) in Ames ..................................................................................... 30
Table IV-5: Current Industrial / Flex/ R&D Market Inventory in City of Ames by Year Built ...................... 31
Table IV-6: Major Industrial Buildings in Ames .......................................................................................... 32
Figure IV-3: Industrial Space (Square Feet) in Ames ................................................................................ 33
Table V-1: Current Retail Market Inventory in City of Ames by Year Built ................................................ 34
Table V-2: Taxable Non-Automotive Retail Sales in Story County ($2018 Dollars)1 ................................. 36
Table V-3: Estimated Citywide Relationship Between Non-Automotive Retail Demand and Sales. (2017) .. ......................................................................................................................................... 37

GRUEN GRUEN + ASSOCIATES PAGE 1
CHAPTER I: INTRODUCTION AND EXECUTIVE SUMMARY
INTRODUCTION This report summarizes the results of the research and analysis Gruen Gruen + Associates (“GG+A”) conducted to assess conditions and trends impacting Ames and to profile Ames’ economic base and real estate/land use inventory. The purpose of GG+A’s research and analysis was directed toward providing an information base and perspective for the development of the Comprehensive Plan. WORK COMPLETED In order to accomplish the study objectives, GG+A performed the following principal tasks:
1. Analyzed employment and business establishment data over time to (a) derive a profile of the economic structure and employment base of Ames and its relative position in the regional economy; and (b) to identify industry clusters;
2. Reviewed relevant demographic, housing and labor force characteristics of the community
and jobs-housing relationships as well as in-commuting patterns of the workforce;
3. Reviewed Iowa State University employment and student enrollment trends and components of population growth in Story County as well as changes in the age distribution of the population base of Ames;
4. Organized and analyzed taxable retail sales by category data for Story County and compared estimated total sales in Ames to estimated local expenditure potential to make an estimate of the amount of sales surplus (relative to the purchasing power of its residents) Ames captures;
5. Estimated the current inventory of office, industrial/flex, and retail space, and analyzed
historical patterns of change within the local and regional economy; and
6. Interviewed representatives of the City of Ames, Ames Chamber of Commerce and Economic Development Commission, Jones Lang LaSalle Brokerage, Inc., the marketing agent for the ISU Research Park (“ISURP”), and the Real Estate Development and Operations Manager for ISURP, and Hunziker & Associates to obtain perspective on conditions and factors affecting the regional and local economies and real estate markets.

GRUEN GRUEN + ASSOCIATES PAGE 2
PRINCIPAL FINDINGS AND CONCLUSIONS The principal findings and conclusions drawn from the research and analysis described in this report include the following: Employment Growth From 2005 to 2017, non-farm employment in the Ames Metropolitan Statistical Area (“MSA”) which encompasses all of Story County increased by an estimated 5,804 jobs, from over 57,000 jobs in 2005 to nearly 63,000 jobs in 2017. This increase equates to average annual job growth of 0.8 percent. Over the entire 2005-2017, sectors which experienced the most employment growth included:
• professional and business services (gain of 1,321 jobs or 23 percent of net job growth);
• education and healthcare (gain of 1,138 jobs or 20 percent of net job growth);
• finance, insurance, and real estate (gain of 1,020 jobs or nearly 18 percent of net job growth);
• manufacturing and wholesale trade (gain of 1,034 jobs or nearly 18 percent of net job growth); and
• leisure and hospitality (gain of 892 jobs or nearly 15 percent of net job growth). Composition and Structure of Employment Base The economic base of Ames is weighted toward public administration employment with the presence of Iowa State University. Public administration employment comprises nearly one-third of the Ames employment base. This share has shifted downward slightly as job growth has been slow in this sector. With the exception of public administration employment, Ames economic base is broad and diverse. With average annual job growth of nearly two percent over more than a decade, the share of employment in the professional and business services sector increased by 1.2 percentage points to increase its share of employment at 10.4 percent. The finance, insurance, and real estate sector also shifted upward from 5.4 percent of employment in 2005 to 6.5 percent in 2017. Education and healthcare employment continued with steady employment increases so its share of rose from nearly eight percent to nine percent. Retail employment lost some of its employment share from 2005 to 2017. Retail employment decreased by nearly one percentage points to 9.7 percent of total Ames employment. Leisure and hospitality employment increased slightly by about 0.6 percentage points to 9.6 percent of total employment. Manufacturing employment has maintained a steady share of total employment from 2005 to 2017 (at nearly eight percent of total employment). Wholesale trade, although a small share of overall employment, grew rapidly to increase its share from less than two percent to over two percent during the 12-year period. Information employment, as a small share of total employment shifted downward slightly.

GRUEN GRUEN + ASSOCIATES PAGE 3
Economic Clusters Economic Sectors having high concentrations of employment representing economic clusters in addition to the educational institution sector include farm product material wholesalers and bakery product, chemical, and printing manufacturers. Largest Employers in Ames The total number of jobs in the City of Ames was estimated at approximately 35,400 as of 2015 by the U.S. Census Bureau Longitudinal Employer-Household Dynamics Program (LEHD). This represents approximately 75 percent of the jobs in the Ames MSA. Iowa State University, the largest individual employer with over 10,000 jobs reported in Ames, comprises nearly 40 percent of total employment. Three employers in Ames, in addition to ISU, are reported to employ more than 1,000 workers. These include the Iowa Department of Transportation, the Mary Greeley Medical Center and McFarland Clinic, and Danfoss Power Solution, a Denmark-based a global provider of mobile hydraulics for the construction, agriculture and other off-highway vehicle markets. According to Ames Transportation Profile, six of the 15 largest employers are located along Interstate 35 and US Highway 30 corridor. Distribution of Employment by Firm Size The number of establishments reporting employment in the Ames metropolitan area decreased in the two smallest employment size categories from 2008 to 2016. The number of establishments with one to nine employees decreased by 39 or nearly three percent. A decrease in the number of establishments also occurred in the 10 to 19 employee category. The number of establishments decreased by 17 to 309. The number of establishments employing between 20 and 49 employees grew by about 20 percent since 2008 to 247. The number of establishments employing 50 to 99 employees grew by 39 percent or by 22 to 79 establishments. The number of establishments employing 100 to 249 workers decreased by 10 to 27. The number of establishments employing 250 or more workers grew by 36 percent, increasing from 11 to 15 establishments since 2008. Labor Shed About 37 percent of workers employed in the City of Ames live within the community. Another 15 percent of workers originate from outside of Ames but within Story County. Polk and Boone counties are the source of an additional 19 percent of labor employed within Ames. Trade, transportation, and utilities activities draw less of their labor than other employment sectors from the core labor shed of Story County. City of Ames Population and Household Base The City is currently estimated to include a population of approximately 65,000 and a housing base including about 25,100 households and 26,300 dwelling units. The average household size is about 2.21 persons and the overall housing vacancy rate is estimated at four percent. Between 2000 and

GRUEN GRUEN + ASSOCIATES PAGE 4
2017, the population and household base grew steadily which reflects continuing growth of the student and faculty/staff population at Iowa State University. Consistent with enrollment growth at Iowa State University, college age cohorts increased by about 8,000 people, an increase of 37 percent since 2000. Although the number of primary working age (i.e., 25-54 years of age) individuals increased by approximately 1,400 people, the share of primary working age members of the population base declined by three percentage points to 28 percent of total population. The population gains from growth in the age 55+ cohorts was nearly 4,100 people, an increase of 62 percent. The population from the age 55+ cohorts comprises 16 percent of the total population, up from 13 percent in 2000. Jobs-Housing Balance The jobs-housing balance (the ratio of jobs in the city to total housing units) has remained stable as employment and housing inventory have grown. The jobs-housing balance approximated 1.47 in 2007 and slightly declined to about 1.41 by 2015. Ames job-housing balance is within that range of 1.3- to- 1.7-jobs-per housing unit considered for a balanced relationship between jobs and housing. Labor Force Conditions and Characteristics The size of the civilian labor force in the City of Ames is estimated at approximately 41,000. The labor force has grown more rapidly than population between 2000 and 2017 (1.9 percent annual labor force growth compared to 1.5 percent annual population growth). Ames labor force grew by 11,900 residents between December 2000 and December 2018 while its population grew by about 14,300. The local unemployment rate has declined to under a very low 1.5 percent from a high of about seven percent in 2009 during the Great Recession. Approximately 84 percent of Ames labor force (age 25+) has some college-level educational experience or degree and nearly all have completed high school. More than one-half, 62 percent, of adult residents in Ames possess a bachelor's or advanced degree, an attribute of the local community that is rather notable but not surprising given the presence of Iowa State University as the largest employer in Ames.1 The resident labor force of Ames has a higher level of educational attainment than pertains to the broader labor force in the Ames MSA (i.e., Story County). Consistent with the high levels of educational attainment of the Ames resident labor force, the management, business, science, and arts-related occupational category comprises the largest segment of the labor force at nearly 49 percent. Within this business and management occupational category, nearly half are in education, legal, community service, arts, and media occupations. Sales and office (i.e. administrative) occupations represent an additional 20 percent of the resident labor force.
1 Only 30 percent of the U.S. population possesses a bachelor's degree or higher.

GRUEN GRUEN + ASSOCIATES PAGE 5
Vacant Land Ames is estimated to contain approximately 2,300 gross acres of vacant land currently zoned for commercial or industrial use or could be suitable for such uses. Approximately 1,840 acres of this vacant land supply are located outside of the 100-year floodplain. Approximately 230 acres located at the northeast corner of Interstate 35 and 220th Street are zoned for future Regional Commercial use and is the largest area of contiguous available commercial land. An additional 1,230 acres are planned for future industrial use, both north and south of Lincoln Way, in the East Industrial expansion area. Existing commercial and industrial parks located west of Interstate 35 in the Dayton Avenue area contain approximately 100 acres of land (outside of the floodplain) which are zoned for General Industrial and Highway-Oriented Commercial uses. Vacant lots and agricultural properties within and near the ISU Research Park contain an additional 140 net acres currently zoned for Planned Industrial and Research Park Innovation District uses. Office Space The City of Ames currently contains about 2.1 million square feet of office space. Approximately 43 percent of Ames office space was built between 1990 and 2009. Another 26 percent of office space inventory was built between 1970 and 1989. Only about 13 percent of office space or approximately 268,000 square feet has been developed since 2010. ISU Research Park contains approximately 800,000 square feet of office/flex/R&D space, about 38 percent of the City’s office (and flex/R&D) space inventory. Approximately 45 percent of the City’s office/flex/R&D space built since 2010 is located in the ISU Research Park. Limited additional existing office space or land “shovel ready” for office development is available outside of the ISU Research Park for businesses not affiliated with research activities at Iowa State University. Industrial Space The City of Ames contains approximately 5.1 million square feet of industrial/flex/R&D space. Manufacturing space comprises about 44 percent of the City’s industrial inventory. Warehouse space comprises another 37 percent of the City’s inventory. Flex/R&D space makes up only about seven percent of the City’s industrial inventory. Nearly half of Ames industrial space was built between 1990 and 2009. Another 28 percent of industrial space inventory was built between 1970 and 1989. Only about five percent of industrial space or approximately 239,000 square feet has been developed since 2010. This equates to an annual average of 29,800 square feet of built industrial space since 2010. A large amount of industrial space in Ames is single-user or owner-occupied space. Speculative industrial development has generally not occurred in Ames. Nearly half of the City’s manufacturing and warehouse space is located in seven buildings. All of these buildings are all located on the east side of Ames between 13th Street and Lincoln Way. A small amount of land remains available for industrial (or office) development along Bell Avenue on the City’s east side. The Ames Economic Development Commission (AEDC) and Alliant Energy are planning a new 730-acre industrial park within the 1,230 acres of land planned for industrial use east

GRUEN GRUEN + ASSOCIATES PAGE 6
of I-35, both north and south of Lincoln Way. Infrastructure development for the new park has not yet occurred. Retail Space and Retail Taxable Sales Ames contains nearly 4.5 million square feet of retail space. Approximately 56 percent of the retail space inventory is regional/community serving space. Another 34 percent is neighborhood/convenience retail space. Approximately 10 percent of the retail space are restaurants/bars. While 43 percent of office space and nearly half of the industrial space was built between 1990 and 2009, only about one-third of the retail space was built over the same period. A somewhat higher proportion, 38 percent of space was built earlier between 1970 to 1989. Another 18 percent of retail space is older, pre-1970 space. Just under 10 percent of retail space has been built since 2010. This compares to five percent of industrial space and 13 percent of office space built since 2010. Two major nodes of retail space exist in Ames. Over half of the regional and community serving space are located in these two nodes. The first node is located in north Ames around the City’s largest retail shopping center North Grand Mall located at Grand Avenue and 24th Avenue. This retail node contains nearly 710,000 square feet of space. The second major node of retail development in Ames is located along South Duff Avenue from Lincoln Way to south of Highway 30. Retail development in this area totals approximately 810,800 square feet of community serving retail space including several big-box stores. A former Kmart property along Duff Avenue is in process of redevelopment. The current owner has proposed a redevelopment plan which will include restaurant and retail space and other commercial uses for the 13.24 acres site. Menard’s is building a store one-half mile east of the intersection of Duff Avenue and Southeast 16th Street. The store on 26 acres will also include a couple small parcels (totaling about three acres) for outlot development. According to local commercial brokers and economic development representatives, very little commercial space is available in Ames. The City of Ames has zoned approximately 232 acres of land east of I-35 and both north and south of 13th Street for Planned Regional Commercial uses. Ames comprises approximately 66 percent of the County’s population and approximately 86 percent of the County’s taxable sales. Retail sales by category for Story County serves as an indicator of Ames retail base. The majority of the County’s sales are made in Ames indicating that the City’s retail base serves a trade area beyond the City’s boundaries. On an inflation-adjusted basis, the total non-automotive retail sales base of Story County has declined slightly over the past nine years: non-automotive sales totaled about $630 million in 2009 and $623 million in 2018. Total sales declined by about $19 million between 2009 and 2012, a period including the Great Recession, and then experienced growth between 2012 and 2018. While the overall sales volume did not change much over the prior nine years, the composition of the retailing base has shifted. Three categories, including food and beverage stores, food services and
GRUEN GRUEN + ASSOCIATES PAGE 7
drinking places (i.e., restaurants), and building materials experienced a combined increase in real sales totaling more than $64 million over the past nine years. These changes are similar to statewide sales that also increased in food stores and eating and drinking places but declined in building materials sales. At the same time, real sales in retail categories of general merchandise, furniture, appliances and home furnishings, and specialty retail declined by a combined $76 million. The declining sales trends in these categories mirrors the States’ trend in declining general merchandise and home furnishings sales declines. Retail Sales Surplus Non-automotive retailers and eating and drinking establishments in the City of Ames produce a large sales surplus, estimated at about $180 million annually, relative to the expenditure potential of Ames households. The comparison indicates that about $34 of every $100 of non-automotive retail and restaurant sales made in Ames originate from beyond the community’s border.

GRUEN GRUEN + ASSOCIATES PAGE 8
Primary Advantages of an Ames’ Location Ames’ competitive advantages include the following:
• Iowa State University provides positive economic impacts, sources of intellectual capital and labor, and cultural and recreational opportunities;
• Significant amounts of vacant nonresidential land remain available for development;
• Costs for nonresidential land and building space are generally lower than locations in Ankeny and Des Moines according to local real estate brokers;
• Ames serves as the retailing and commerce hub for the surrounding hinterland communities bringing in dollars which support retail, restaurant, and other services that residents of Ames would not support on their own; and
• Ames has a well-educated and skilled resident labor base. Constraints on Economic Development Constraints on economic development in addition to the very low unemployment rate and limited labor force availability include:
• A limited supply of “shovel ready” land for nonresidential development;
• The current state of the Downtown may not be appealing enough to help induce significant
new business attraction or new talent to move to Ames;
• Limited available housing stock makes recruiting labor from outside the region more
challenging; and
• Limited velocity of demand to support the feasible development of significant speculative
nonresidential building space so that sometimes suitable space is not readily available for new
or expanding businesses.

GRUEN GRUEN + ASSOCIATES PAGE 9
CHAPTER II: EMPLOYMENT BASE COMPOSITION AND TRENDS
INTRODUCTION This chapter presents an analysis of the structure and composition of the Ames region employment base. This chapter also summarizes analysis of characteristics related to distribution of firms by employment size, employment by industry sector, patterns of growth and decline, and the commute shed. The analysis of the employment base provides a framework from which to identify the industry sectors likely to continue to grow or contract within the local economy and the types of firms and activities likely to represent potential business targets for Ames. EMPLOYMENT TRENDS BY INDUSTRY SECTOR Table II-1 summarizes historical non-farm employment for the Ames MSA for 2005, 2010, and 2017. The Census Bureau defines the Ames MSA as Story County. The data is drawn from the Quarterly Census of Employment and Wages ("QCEW") Bureau of Economic Analysis (BEA) program. The employment estimates in Table II-1 are summarized by 2-digit NAICS code.

GRUEN GRUEN + ASSOCIATES PAGE 10
Table II-1: Ames MSA Non-farm Employment by Industry Sector, 2005-2017
Industry Sector 2005
# 2010
# 2017
#
Change 2005-2017
#
Average Annual Growth Rate 2005-2017
%
Natural Resources & Mining NA1 NA1 NA1 - -
Utilities NA1 NA1 NA1 - -
Construction 3,069 2,562 2,908 -161 -0.4
Manufacturing 4,278 3,936 4,885 607 1.1
Wholesale Trade 979 1,351 1,406 427 3.1
Retail Trade 6,039 5,640 6,109 70 0.1
Transportation & Warehousing NA1 NA1 NA1 - -
Information 851 767 769 -82 -0.8
Finance, Insurance & Real Estate 3,071 3,651 4,091 1,020 2.4
Finance & Insurance 1,382 1,609 1,600 218 1.2
Real Estate 1,689 2,042 2,491 802 3.3
Professional & Business Services 5,241 5,497 6,562 1,321 1.9
Prof., Scientific & Tech. Services 2,671 2,923 3,620 949 2.6
Management of Companies 297 358 655 358 6.8
Admin, Support, Waste Mgmt Services 2,273 2,216 2,287 14 0.1
Education & Healthcare 4,442 4,955 5,580 1,138 1.9
Educational Services 601 779 785 184 2.3
Healthcare & Social Assistance 3,841 4,176 4,795 954 1.9
Leisure & Hospitality 5,156 5,240 6,048 892 1.3
Arts, Entertainment & Recreation 777 1,008 1,184 407 3.6
Accommodation & Food Services 4,379 4,232 4,864 485 0.9
Other Services 2,430 2,338 2,432 2 0.0
Public Administration 20,120 19,952 20,569 449 0.2
TOTAL 57,148 58,026 62,952 5,804 0.8
1 Not shown to avoid disclosure of confidential information.
Sources: Bureau of Economic Analysis, Quarterly Census of Employment and Wages; Gruen Gruen + Associates.
From 2005 to 2017, non-farm employment in the Ames MSA increased by an estimated 5,804 jobs, from over 57,000 jobs in 2005 to nearly 63,000 jobs in 2017. This equates to an average annual growth rate of 0.8 percent. Between 2005 and 2010, total employment is estimated to have increased by only 878 jobs, but the Great Recession occurred during this period, starting in 2007 and ending in 2009.

GRUEN GRUEN + ASSOCIATES PAGE 11
Sectors which experienced employment declines from 2005 to 2010 included:
• construction;
• manufacturing;
• retail trade;
• information;
• other services; and
• public administration.
From 2005 to 2010, during which the Great Recession occurred, employment in the following industry sectors increased:
• wholesale trade;
• education, healthcare, and leisure/hospitality; and especially
• finance, insurance and real estate, and professional, technical and business services and management of companies.
From 2010 to 2017, employment gains were made in all industry sectors other than Information which remained flat. The average annual growth rate over this seven year period was higher at 1.2 percent as compared to the 12-year period of 2005 to 2017.
Over the entire 2005-2017, sectors which experienced the most employment growth included:
• professional and business services (gain of 1,321 jobs or 23 percent of net job growth);
• education and healthcare (gain of 1,138 jobs or 20 percent of net job growth);
• finance, insurance, and real estate (gain of 1,020 jobs or nearly 18 percent of net job growth);
• manufacturing and wholesale trade (gain of 1,034 jobs or nearly 18 percent of net job growth); and
• leisure and hospitality (gain of 892 jobs or nearly 15 percent of net job growth). The only sectors which experienced a decrease in employment over the 12-year period are construction (a loss of 161 jobs to 2,908 jobs); and information (a loss of 82 jobs to 769 jobs). The largest employer in the Ames MSA, Iowa State University in the City of Ames is included in the public administration sector. This sector’s total employment has remained stable, increasing by only 449 jobs over the 12-year period. Total public administration employment has grown less than ½ percent annually increasing from 20,120 jobs in 2005 to 20,569 jobs in 2017. Iowa State University employment is about 83 percent of public administration employment. Table II-2 shows the growth in jobs between 2009 and 2018 at Iowa State University. As of 2018, the University had 16,952

GRUEN GRUEN + ASSOCIATES PAGE 12
employees including full-time, part-time, and hourly employees.2 The total number of employees has grown by about 17 percent since 2009 and most of the growth has been in the non-faculty positions. Full-time equivalent jobs were 6,238 in 2018. These jobs include faculty, administrative, merit, and contract positions.
Table II-2: Iowa State University Employment, 2000-20181
2 https://www.ir.iastate.edu/factbook/2018-2019
10,000
11,000
12,000
13,000
14,000
15,000
16,000
17,000
18,000
2009 2010 2011 2012 2013 2014 2015 2016 2017 2018

GRUEN GRUEN + ASSOCIATES PAGE 13
Table II-3 shows the shift in the composition of the employment base for 2005 to 2017.
Table II-3: Shift in Composition of Ames MSA Employment, 2005-20171
Industry Sector 2005
% 2010
% 2017
%
Shift 2005-2017 Pct Points
Natural Resources & Mining NA NA NA -
Utilities NA NA NA -
Construction 5.4 4.4 4.6 -0.8
Manufacturing 7.5 6.8 7.8 0.3
Wholesale Trade 1.7 2.3 2.2 0.5
Retail Trade 10.6 9.7 9.7 -0.9
Transportation & Warehousing NA NA NA -
Information 1.5 1.3 1.2 -0.3
Finance, Insurance & Real Estate 5.4 6.3 6.5 1.1
Finance & Insurance 2.4 2.8 2.5 0.1
Real Estate 3.0 3.5 4.0 1.0
Professional & Business Services 9.2 9.5 10.4 1.2
Prof., Scientific & Tech. Services 4.7 5.0 5.8 1.1
Management of Companies 0.5 0.6 1.0 0.5
Admin, Support, Waste Mgmt Services 4.0 3.8 3.6 -0.4
Education & Healthcare 7.8 8.5 8.9 1.1
Educational Services 1.1 1.3 1.2 0.1
Healthcare & Social Assistance 6.7 7.2 7.6 1.3
Leisure & Hospitality 9.0 9.0 9.6 0.6
Arts, Entertainment & Recreation 1.4 1.7 1.9 0.5
Accommodation & Food Services 7.7 7.3 7.7 0.0
Other Services 4.3 4.0 3.9 -0.4
Public Administration 35.2 34.4 32.7 -2.5
TOTAL 100.0 100.0 100.0
1 Total may not add to 100 percent due to non-disclosure of some confidential data.
Sources: Bureau of Economic Analysis, Quarterly Census of Employment and Wages; Gruen Gruen + Associates.
The economic base of Ames is weighted toward public administration employment with the presence of Iowa State University. Public administration employment comprises nearly one-third of Ames employment base. This share has shifted downward slightly as growth has been slow in this sector. With the exception of public administration employment, Ames economic base is broad and diverse. With average annual job growth of nearly two percent over more than a decade, the share of employment in the professional and business services sector increased by 1.2 percentage points to increase its share of employment at 10.4 percent. The finance, insurance, and real estate sector also shifted upward from 5.4 percent of employment in 2005 to 6.5 percent in 2017. Education and healthcare employment continued with steady employment increases so its share of rose from nearly

GRUEN GRUEN + ASSOCIATES PAGE 14
eight percent to nine percent. Retail employment lost some of its employment share from 2005 to 2017. Retail employment decreased by nearly one percentage points to 9.7 percent of total Ames employment. Leisure and hospitality employment increased slightly by about 0.6 percentage points to 9.6 percent of total employment. Manufacturing employment has maintained a steady share of total employment from 2005 to 2017 (at nearly eight percent of total employment). Wholesale trade, although a small share of overall employment, grew rapidly to increase its share from less than two percent to over two percent during the 12-year period. Information employment, as a small share of total employment shifted downward slightly. PRIVATE INDUSTRY CLUSTERS WITHIN STORY COUNTY Table II-4 summarizes private non-farm industry subsectors present within Story County that exhibit Location Employment Quotients of 1.5 or greater. Location Quotients are a proxy for identifying industry clusters or agglomerations, represented by ratios that compare the concentration of a resource or activity, such as employment, in a defined area (in this case, the Ames MSA or Story County) to that of a larger reference economy. Sectors or activities that exhibit a Location Quotient substantially greater than 1.0 tend to represent basic industries that export their goods and services beyond the local area or region. Industry sectors with a Location Quotient less than 1.0 generally include non-basic or locally-serving activities. In 2017, relative to the United States employment base, for example, the bread and bakery product manufacturing subsector in Story County exhibited a Location Quotient of approximately 2.2. This ratio indicates that Story County contains about two times more bread and bakery manufacturing jobs than would be expected if conditions were consistent with the national economy.
Table II-4: Private Non-farm Industry Subsectors with Highest Employment Location Quotients
NAICS Subsector Location Quotient1 Annual Avg. 2017
NAICS 3118 Bread and bakery (inc. pasta) product manufacturing 2.20
NAICS 3231 Printing and related support activities 2.78
NAICS 3251 Basic chemical manufacturing 2.84
NAICS 3332 Industrial Machinery manufacturing 1.90
NAICS 4245 Farm product raw material merchant wholesalers 7.51
NAICS 4249 Misc. nondurable goods merchant wholesalers 2.78
NAICS 4471 Gasoline stations 1.52
NAICS 4531 Florists 2.06
NAICS 5415 Computer system design and related services 1.47
NAICS 5417 Scientific research and development services 1.88
NAICS 6233 Continuing care, assisted living facilities 1.47
NAICS 6244 Child day care services 1.83
NAICS 7113 Promoters of performing arts and sports 3.98
NAICS 7224 Drinking places, alcoholic beverages 1.66
1 Location quotient using National employment as the base.
Sources: U.S. Bureau of Labor Statistics; Gruen Gruen + Associates.

GRUEN GRUEN + ASSOCIATES PAGE 15
The most concentrated subsector as measured by Location Employment Quotient is within the whole sale trade sector, farm product material wholesalers. Three industries within the manufacturing sector also exhibit Location Quotients of about 2.0 or higher, particularly the bakery product, chemical, and printing subsector. Barilla, one of Ames larger employers, is a pasta manufacturer which would report as a subsector of bakery product manufacturing. One arts, entertainment, and recreation subsector, including performing arts and sports promoters, also exhibits a Location Quotient exceeding 2.0. EMPLOYMENT TRENDS BY ESTABLISHMENT SIZE Table II-5 shows the largest, private, non-retail store employers in Ames or nearby communities.
Table II-5: Examples of Private Non-Retail Employers With More Than 100 Employees in Ames’ Area
Name Industry / Activity
Danfoss Power Solutions Manufacturing
Amcor Ridge Plastics Manufacturing
BASF- Chemical Co. Manufacturing
Powerfilm Inc. Manufacturing
Sigler Printing Manufacturing
Barilla America Inc. Manufacturing
Agleader Technology Professional & Technical Services
Nai Electrical Contractors Construction
3M Co. Wholesale Trade
Workiva Professional Technical Services
Hach Companies Manufacturing and Services for Water Analysis
Boehringer Ingelheim Vetmedica, Inc. Manufacturer of biological vaccines for animals
Renewable Energy Group, Inc. Manufacturer of Advanced Biofuels
Sources: Iowa Workforce Development; Ames Economic Development Commission; Gruen Gruen + Associates.
Manufacturing employers comprise the preponderance of the largest private sector employers.

GRUEN GRUEN + ASSOCIATES PAGE 16
Table II-6 summarizes Ames MSA job base by employment size of the employer.
Table II-6: Ames MSA Employment by Establishment Size, 2008-20161
1-9
Employees 10-19
Employees 20-49
Employees 50-99
Employees 100-249
Employees 250+
Employees
2008:
Establishments 1,392 326 206 57 37 11
2016:
Establishments 1,353 309 247 79 27 15
Change 2008-2016:
Establishments -39 -17 41 22 -10 4
Percent Change -2.8 -5.2 19.9 38.5 -27.0 36.4
1 Estimates are for first quarter of each year.
Sources: County Business Patterns; Gruen Gruen + Associates.
The number of establishments reporting employment in the Ames metropolitan area decreased in the two smallest employment size categories from 2008 to 2016. The number of establishments with one to nine employees decreased by 39 or nearly three percent. A decrease in the number of establishments also occurred in the 10 to 19 employee category. The number of establishments decreased by 17 to 309. The number of establishments employing between 20 and 49 employees grew by about 20 percent since 2008 to 247. The number of establishments employing 50 to 99 employees grew by 39 percent or by 22 to 79 establishments. The number of establishments employing 100 to 249 workers decreased by 10 to 27. The number of establishments employing 250 or more workers has grew by 36 percent, increasing from 11 to 15 establishments since 2008.

GRUEN GRUEN + ASSOCIATES PAGE 17
CITY OF AMES LABOR SHED Table II-7 summarizes the distribution of employees in the City of Ames by industry sector and county of residence.
Table II-7: Distribution of Workers Employed in City of Ames by County of Residence (2015)
Goods
Producing %
Trade, Transportation &
Utilities %
Service Providing
% Total
%
Story County 45.9 31.6 57.3 52.0
Polk County 13.5 12.2 10.4 11.1
Boone County 9.6 5.7 8.0 7.9
Dallas County 2.3 3.4 1.8 2.1
Hamilton County 2.7 NA1 1.9 2.0
Marshall County 3.2 2.2 1.6 1.9
Other 22.8 44.9 19.0 23.0
1 NA means not available and reported separately but included in “Other”.
Sources: U.S. Census Bureau, LEHD Program Data; Gruen Gruen + Associates.
About 37 percent of workers employed in the City of Ames live within the community. Another 15 percent of workers originate from outside of Ames but within Story County. Polk and Boone counties are the source of an additional 19 percent of labor employed within Ames. Trade, transportation, and utilities activities draw less of their labor than other economic sectors from the core labor shed of Story County.

GRUEN GRUEN + ASSOCIATES PAGE 18
CHAPTER III: DEMOGRAPHIC TRENDS AND LABOR MARKET CHARACTERISTICS
INTRODUCTION Interrelated factors - including the level and kind of economic development, land use policy, and the amount and type of residential development - influence the extent to which a community can attract and hold jobs. The quality and quantity of the labor force and housing, in turn, bear on the prospects for economic development. The specific characteristics of the labor pool, such as educational level, skill mix and income range, influence the kinds of businesses that can successfully operate in a community. This chapter, therefore, presents an overview of some demographic and labor force characteristics. CITY OF AMES POPULATION AND HOUSEHOLD BASE Table III-1 summarizes the historical and projected population and household base of Ames.
Table III-1: Population, Households and Housing Units in City of Ames
2000 #
2010 #
2017 #
Historical Change 2000-2017
#
Annual Growth 2000-2017
%
Population 50,731 58,965 65,005 14,274 1.5
Households 18,085 22,759 25,123 7,038 1.9
Housing Units 18,757 23,876 26,277 7,520 2.0
Average Household Size 2.30 2.25 2.21 - -
Housing Vacancy Rate 3.6 4.7 4.4 - -
Sources: U.S. Census Bureau; Gruen Gruen + Associates.
The City is currently estimated to include a population of approximately 65,000 and a housing base including about 25,100 households and 26,300 dwelling units. The average household size is about 2.2 persons and the overall housing vacancy rate is estimated at 4.4 percent. Ames, the largest city in Story County, comprises about two-thirds of the County’s population. Between 2000 and 2017, the City’s population increased by 27 percent due in part to rising enrollment at Iowa State University. Iowa State University total enrollment increased by 8,832 students between 2007 and 2018, an increase of 34 percent over the past decade. Figure III-1 shows the rise in total enrollment at Iowa State University between 2007 and 2018.

GRUEN GRUEN + ASSOCIATES PAGE 19
Figure III-1: Iowa State University Fall Enrollment, 2007-2018
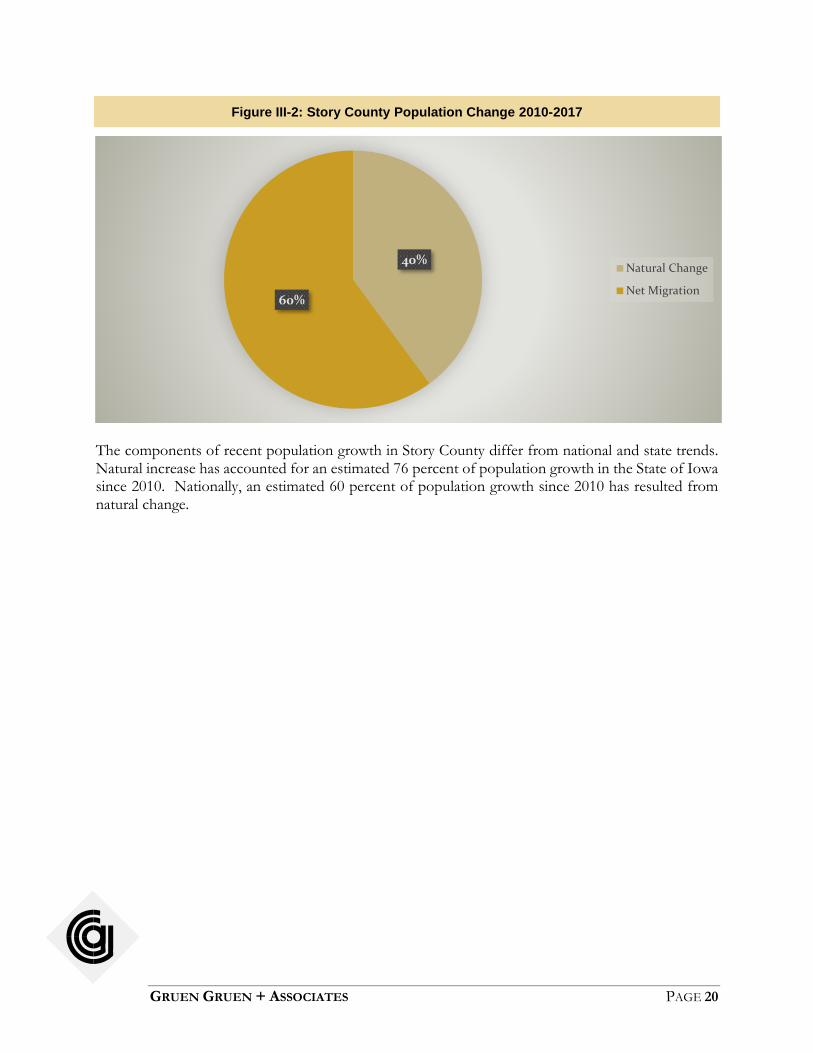
Iowa State University enrollment has plateaued the last two years following a decade of growth and eight consecutive years of record enrollment. Fall 2018 enrollment of 34,992 students is 2.8 percent fewer students than the 35,993 enrolled at Iowa State in fall 2017. Full-time students approximate 89.3 percent of enrollment with part-time students at approximately 10.7 percent. Approximately 15 percent of students live outside of Ames.3 The number also reflects national enrollment trends, a decline in international enrollment, record graduation rates, and smaller incoming classes replacing large graduating classes.4 Figure III-2 shows the components of population change in Story County between 2010 and 2017. Net migration population change exceeded natural change (i.e., births less deaths) during this period (60 percent vs. 40 percent).
3 https://www.ir.iastate.edu/factbook/2018-2019 4 https://www.news.iastate.edu/news/2018/09/05/fall-2018-enrollment
-
5,000
10,000
15,000
20,000
25,000
30,000
35,000
40,000
2007 2008 2009 2010 2011 2012 2013 2014 2015 2016 2017 2018
GRUEN GRUEN + ASSOCIATES PAGE 20
Figure III-2: Story County Population Change 2010-2017
The components of recent population growth in Story County differ from national and state trends. Natural increase has accounted for an estimated 76 percent of population growth in the State of Iowa since 2010. Nationally, an estimated 60 percent of population growth since 2010 has resulted from natural change.
40%
60%
Natural Change
Net Migration

GRUEN GRUEN + ASSOCIATES PAGE 21
Figure III-3 summarizes the historic and current distribution of the population by age cohort.
Figure III-3: Ames Population by Age
The population under the age of 15, comprising about nine percent of Ames residents, is currently estimated at approximately 6,700. The population between the age of 15 to 24, currently comprising about 45 percent of total population, up from about 42 percent of the population in 2000. The largest population gains were between age of 15 and 24. These age cohorts increased by about 8,000 people, an increase of 37 percent. The age cohorts between 25 and 54 years (which are most likely to be working age) comprises 28 percent of total population, down from about 31 percent of total population in 2000. These age cohorts increased by approximately 1,400 people, an increase of about three percent over 17 years. The statewide population in the 25 to 54 age cohort declined by approximately three percent between 2010 and 2017. The local population gains from growth in the age 55+ cohorts at nearly 4,100 people represents an increase of 62 percent. The recent growth trends suggest this age cohort is growing more rapidly than elsewhere; the statewide population of persons age 55 or older has grown by approximately 14 percent since 2010 The population from the age 55+ cohorts comprise 16 percent of the total population, up from 13 percent in 2000. Jobs-Housing Balance The jobs-housing balance (the ratio of jobs in the city to total housing units) has remained stable as both employment and housing units have grown. The jobs-housing balance approximated 1.47 in
0 5,000 10,000 15,000 20,000 25,000
Under 5 years
5 to 9 years
10 to 14 years
15 to 19 years
20 to 24 years
25 to 34 years
35 to 44 years
45 to 54 years
55 to 59 years
60 to 64 years
65 to 74 years
75 to 84 years
85 years and over
2017
2000

GRUEN GRUEN + ASSOCIATES PAGE 22
2007 and slightly declined to about 1.41 by 2015. A region is generally considered to have a sustainable jobs-housing balance if the ratio of jobs to housing units is 1.5.5 While jobs to housing relationships will vary given differences among communities in labor force, social, and economic characteristics, transportation linkages, geographical constraints, and political factors, the generally accepted ratio for a balanced relationship between jobs and housing tends to fall within 1.3-to-1.7-jobs-per-housing unit.6 Ames’ job-housing balance is within that range. Areas with balanced jobs-to-housing ratios have an adequate amount of housing supply to meet the needs of the local work force. Decreasing jobs-to-housing ratios tend to put downward pressure on housing costs, as more housing supply is available than needed to accommodate typical demands generated by the local employment base. LABOR FORCE CONDITIONS AND CHARACTERISTICS The size of the civilian labor force in the City of Ames is estimated at 40,900 in December 2018. The labor force has grown more rapidly than population between 2000 and 2017. Ames labor force grew by 11,900 residents between December 2000 and December 2018. This equates to an average annual growth rate of 1.9 percent as compared to average annual population growth of 1.5 percent. Current data is not available to estimate the age distribution of the civilian labor force in Ames. U.S. Census Bureau Center for Economic Studies LEHD data, however, suggests that as recently as 2015, labor force members under the age of 30 comprised about 32 percent of the resident labor base. Approximately 47 percent of resident labor was comprised by workers between the ages of 30 and 54. According to the Bureau of Labor Statistics, the unemployment rate in the City of Ames stood at a very low 1.3 percent in December 2018. The unemployment rate in Ames peaked at just over 4.0 percent in the first half of 2009. As illustrated below in Figure III-4, the unemployment rate has declined considerably since 2009.
5 See, for example, “Jobs-Housing Balances and Regional Mobility”, Robert Cervero, Institute of
Urban and Regional Development University of California at Berkeley, APA Journal, spring 1989, pp.136-150.
6 The August 2008 Urban Land “Mixing It Up” article indicates the ideal jobs-housing ratio is generally between 1.2 and 1.4 jobs per housing unit and that sites or communities with an integrated set of land uses minimize traffic generation and increase “capture internal rates” for services, retail, restaurants and other uses. (“Mixing It Up,” Urban Land, Walters, Jerry, Ewing, Reid. August 2008, p. 126).

GRUEN GRUEN + ASSOCIATES PAGE 23
Figure III-4: Unemployment Rate Estimates, 2000-2018
As illustrated above, unemployment levels have declined to below pre-recession levels both locally and statewide. The labor market is nearly at full-employment. The unemployment rate in Ames has consistently been lower than that for the State. Our interviews with economic development representatives and members of the real estate community indicate that the low labor force availability will be a constraint on expanding and attracting firms especially those in traditional industrial sectors. A key competitive advantage of Ames is its highly educated labor force. Table III-2 summarizes educational attainment characteristics of the adult population in the City of Ames.
Table III-2: Educational Attainment of Ames Residents Age 25+ (2017 Estimate)
Highest Level Completed City of Ames
%
Less than High School 2.4
High School or Equivalent 13.3
Some College, No Degree 14.2
Associate's Degree 7.3
Bachelor's Degree 31.3
Graduate or Professional Degree 31.4
Sources: U.S. Census Bureau, 2017 American Community Survey; Gruen Gruen + Associates.
Approximately 84 percent of Ames population (age 25+) has some college-level educational experience or degree and nearly all have completed high school. More than one-half, 62 percent, of adult residents in Ames possess a bachelor's or advanced degree, an attribute of the local community that is rather notable but not surprising given the presence of Iowa State University as the largest
0.00
1.00
2.00
3.00
4.00
5.00
6.00
7.00
2000 2001 2002 2003 2004 2005 2006 2007 2008 2009 2010 2011 2012 2013 2014 2015 2016 2017 2018
City of Ames State of Iowa

GRUEN GRUEN + ASSOCIATES PAGE 24
employer in Ames.7 The resident population of Ames has a higher level of educational attainment than pertains to the broader Ames MSA (i.e., Story County) labor market. The high levels of educational attainment are reflected in the occupational mix of Ames labor force, which Figure III-5 summarizes.
Figure III-5: Occupational Mix of Ames Labor Force (2017 Estimate)
The management, business, science, and arts-related occupational category comprises the largest segment of the labor force at nearly 49 percent. Within this business and management occupational category, nearly half are in education, legal, community service, arts, and media occupations. Sales and office (i.e. administrative) occupations represent an additional 20 percent of the resident labor force. Service occupations represent an additional 19 percent of labor in Ames. The production, transportation and material moving and natural resource, construction, and maintenance-related occupations typically blue-collar occupations collectively represent about 12 percent of the employed labor force. Figure III-6 shows Ames labor force occupational mix compared to Story, Polk, and Boone Counties. Polk County has a labor force that is almost five times as large as Story County. Ames has a higher
7 Only 30 percent of the U.S. population possesses a bachelor's degree or higher.
49%
19%
20%
5%7% Management, business, science &
arts
Service
Sales and office
Natural resources, construction &maintenance
Production, transportation, &material moving

GRUEN GRUEN + ASSOCIATES PAGE 25
share of jobs in management, business, science, and arts occupations as compared to the share these types of occupations make up of Story, Polk, and Boone Counties labor force. Story County (outside of Ames), Polk, and Boone Counties all draw a higher share of their labor force in natural resources, construction, and maintenance and production, transportation, and material moving occupations which are more typically associated with the use of industrial space. This is consistent with the commute shed patterns which indicate Ames draws more of its workforce in goods-producing and trade, transportation, and utilities industries from beyond Ames.
Figure III-6: Occupational Mix of Ames, Story County, Polk County, and Boone County Labor Force (2017 Estimate)
0.0%
10.0%
20.0%
30.0%
40.0%
50.0%
60.0%
Management,business, science &
arts
Service Sales and office Natural resources,construction &maintenance
Production,transportation, &material moving
Ames Story County Polk County Boone County
GRUEN GRUEN + ASSOCIATES PAGE 26
CHAPTER IV: LAND USE TRENDS AND OFFICE AND INDUSTRIAL MARKET CONDITIONS
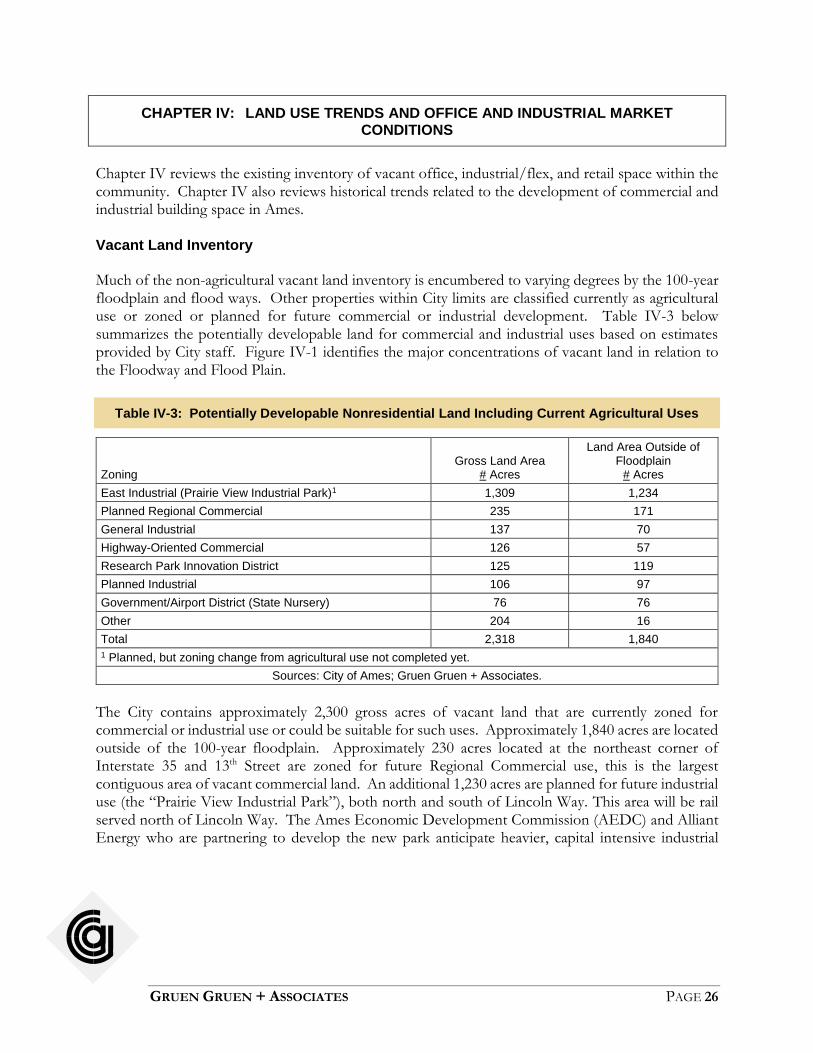
Chapter IV reviews the existing inventory of vacant office, industrial/flex, and retail space within the community. Chapter IV also reviews historical trends related to the development of commercial and industrial building space in Ames. Vacant Land Inventory Much of the non-agricultural vacant land inventory is encumbered to varying degrees by the 100-year floodplain and flood ways. Other properties within City limits are classified currently as agricultural use or zoned or planned for future commercial or industrial development. Table IV-3 below summarizes the potentially developable land for commercial and industrial uses based on estimates provided by City staff. Figure IV-1 identifies the major concentrations of vacant land in relation to the Floodway and Flood Plain.
Table IV-3: Potentially Developable Nonresidential Land Including Current Agricultural Uses
Zoning
Gross Land Area
# Acres
Land Area Outside of Floodplain
# Acres
East Industrial (Prairie View Industrial Park)1 1,309 1,234
Planned Regional Commercial 235 171
General Industrial 137 70
Highway-Oriented Commercial 126 57
Research Park Innovation District 125 119
Planned Industrial 106 97
Government/Airport District (State Nursery) 76 76
Other 204 16
Total 2,318 1,840
1 Planned, but zoning change from agricultural use not completed yet.
Sources: City of Ames; Gruen Gruen + Associates.
The City contains approximately 2,300 gross acres of vacant land that are currently zoned for commercial or industrial use or could be suitable for such uses. Approximately 1,840 acres are located outside of the 100-year floodplain. Approximately 230 acres located at the northeast corner of Interstate 35 and 13th Street are zoned for future Regional Commercial use, this is the largest contiguous area of vacant commercial land. An additional 1,230 acres are planned for future industrial use (the “Prairie View Industrial Park”), both north and south of Lincoln Way. This area will be rail served north of Lincoln Way. The Ames Economic Development Commission (AEDC) and Alliant Energy who are partnering to develop the new park anticipate heavier, capital intensive industrial

GRUEN GRUEN + ASSOCIATES PAGE 27
development north of Lincoln Way and small distribution and light industrial uses south of Lincoln Way.8 Existing commercial and industrial parks located west of Interstate 35 along Dayton Avenue contain approximately 100 acres of land (outside of the floodplain) which are zoned for General Industrial and Highway-Oriented Commercial uses. Vacant lots and agricultural properties within and near the ISU Research Park contain an additional 140 net acres (155 gross acres) currently zoned for Planned Industrial and Research Park Innovation District uses.
Figure IV-1: Nonresidential Land Supply
Source: City of Ames
8 https://innovationia.com/2018/02/09/ames-first-major-industrial-park-bookends-surging-development-in-isu-research-park/

GRUEN GRUEN + ASSOCIATES PAGE 28
OFFICE MARKET SUPPLY TRENDS Table IV-4 summarizes the current supply of office space within the City of Ames.
Table IV-4: Current Office Market Inventory in City of Ames by Year Built
Prior to 1950 # Sq. Ft.
1950 to 1969 # Sq. Ft.
1970 to 1989 # Sq. Ft.
1990 to 2009 # Sq. Ft.
2010 to 2018 # Sq. Ft.
Total # Sq. Ft.
General Office 144,959 130,488 426,733 852,797 228,309 1,783,286
Medical Office 3,037 119,878 121,284 54,386 39,232 337,817
Total 147,996 250,366 548,017 907,183 267,541 2,121,103
Sources: City of Ames Assessor; Story County Assessor; Gruen Gruen + Associates.
The City of Ames office market contains approximately 2.1 million square feet of space. The majority of office space is general office use. Approximately 43 percent of Ames office space was built between 1990 and 2009. Another 26 percent of office space inventory was built between 1970 and 1989. About 13 percent of office space or approximately 268,000 square feet has been developed since 2010. This equates to an annual average of 28,500 square feet of built office space since 2010. Approximately 45 percent or 118,500 square feet of the 264,189 square feet of office/flex/R&D space built since 2010 is located in the ISU Research Park. ISU Research Park contains about 800,000 square feet of office and flex/R&D space on 150 acres of land. The park’s space comprises about 38 percent of the City’s office (and flex/R&D) space inventory. The ISU Research Park began development in the 1980’s but has only significantly installed infrastructure to serve future development in the past five years. An additional 176 acres of land remain available for development which can support an additional 1.0 million square feet of office/flex/R&D space.9 The current building space occupancy rate in the ISU Research Park is 85 to 90 percent. According to local real estate representatives and economic development officials, the City of Ames contains limited additional office space or land available (outside of the ISU Research Park) for businesses which are not affiliated with Iowa State University. The ISU Research Park office space and land is reserved for businesses that have linkages to research activities at Iowa State University. Businesses in the ISU Research Park which occupy office space include Workiva (formerly WebFilings which creates cloud-based productivity solutions), NewLink Genetics (developing cancer vaccines), Sukup Manufacturing Co., (grain storage manufacturer), and Pella (a window manufacturer).
9 According to information from the ISU Research Park Real Estate Development and Operations Manager, the ISU Research Park’s additional 176 acres of land could support an additional 6,000 employees.

GRUEN GRUEN + ASSOCIATES PAGE 29
In the last approximately five years since significant infrastructure has been installed, about 200,000 square feet of building space has built. The building additions include about 50,000 square feet for an animal health research company (Boehringer Ingelheim Vetmedica), about 40,000 square feet of space for an agricultural technology company and support uses including a fitness center of about 30,000 square feet, a medical/child-care center of about 30,000 square feet, and 10,000 square feet of restaurant/food service space. Users considering the Park may often consider locations at other university-sponsored research parks or locations in Ankeny or Des Moines. According to the ISU Research Park real estate representatives, some of the ISU Research Park tenants may have future traditional industrial space needs which could potentially be served in the City’s newly planned Prairie View Industrial Park on the east side of Ames. Some firms in the past have selected locations in Ankeny for warehouse/distribution space. Figure IV-2 shows where office space is concentrated in Ames. Office space in Ames is broadly located in three locations: 1) central Ames; 2) south of Highway 30 in the Iowa State University Research Park; and 3) the east side of Ames along Bell Avenue between 13th and 16th Streets west of I-35.10
10 The east side of Ames contains approximately 323,200 square feet of office space or about 18 percent of the City’s general office space inventory.

GRUEN GRUEN + ASSOCIATES PAGE 30
Figure IV-2: Office Space (Square Feet) in Ames

GRUEN GRUEN + ASSOCIATES PAGE 31
INDUSTRIAL AND FLEX MARKET SUPPLY TRENDS Table IV-5 summarizes the current supply of industrial space, including flex space.
Table IV-5: Current Industrial / Flex/ R&D Market Inventory in City of Ames by Year Built
Prior to 1950 # Sq. Ft.
1950 to 1969 # Sq. Ft.
1970 to 1989 # Sq. Ft.
1990 to 2009 # Sq. Ft.
2010 to 2018 # Sq. Ft.
Total # Sq. Ft.
Manufacturing 237,230 273,526 744,884 880,000 96,603 2,232,243
Warehouse 115,314 234,495 303,007 1,160,047 65,420 1,878,283
Flex/R&D 1 90,630 31,178 82,642 101,562 35,880 341,892
Miscellaneous 2 25,455 21,708 306,938 231,926 40,740 626,767
Total 468,629 560,907 1,437,471 2,373,535 238,643 5,079,185 1 Includes the following property use codes: “Research/Development”; “Warehouse Showroom”; “Industrial Office”; “Industrial Flex”; and “Lab”. 2 Includes a variety of miscellaneous building uses which are industrial in nature, such as mini-warehouses (self-storage), aviation hangars, and equipment and lumber storage facilities.
Sources: City of Ames Assessor; Story County Assessor; Gruen Gruen + Associates.
The City of Ames has twice as much industrial space as it does office space. Total industrial space in Ames totals nearly 5.1 million square feet. Manufacturing space comprises about 44 percent of the industrial inventory. Warehouse space comprises another 37 percent of the City’s inventory. Flex/R&D space makes up only about seven percent of the industrial inventory. Nearly half of Ames’ industrial space was built between 1990 and 2009. Another 28 percent of industrial space inventory was built between 1970 and 1989. Only about five percent of industrial space or approximately 239,000 square feet has been developed since 2010. This equates to an annual average of 29,800 square feet of built industrial space since 2010. A large amount of industrial space in Ames is single-user or owner-occupied space. Nearly one-half of the manufacturing and warehouse space in Ames is located in seven buildings. Only one of the buildings is occupied by multiple tenants. Table IV-6 shows the amount of industrial space occupied by some of the larger employers in Ames. These buildings are all located on the east side of Ames between 13th Street and Lincoln Way.

GRUEN GRUEN + ASSOCIATES PAGE 32
Table IV-6: Major Industrial Buildings in Ames
Business
Address
Year Opened or Facility Built
Manufacturing # Square Feet
Warehouse
# Square Feet
Barilla America Inc.
3311 E. Lincoln Way
1999 320,585 241,920
Danfoss Power Solutions
2800 E. 13th St. 1985 336,603
3M 900 Dayton Ave. 1970 324,576
Amcor Plastic Container
520 Bell Ave. 1996 251,138
Multi-tenant 2825 E. Lincoln Way
2002 576,476
Hach Chemical 100 Dayton Ave. 1968 167,431
BASF Chemical Company1
801 Dayton Ave. 1994 90,600
Total 1,976,809 332,520 1 Also occupy a 20,498-square-foot office facility.
Sources: City of Ames Assessor; Gruen Gruen + Associates.
GRUEN GRUEN + ASSOCIATES PAGE 33
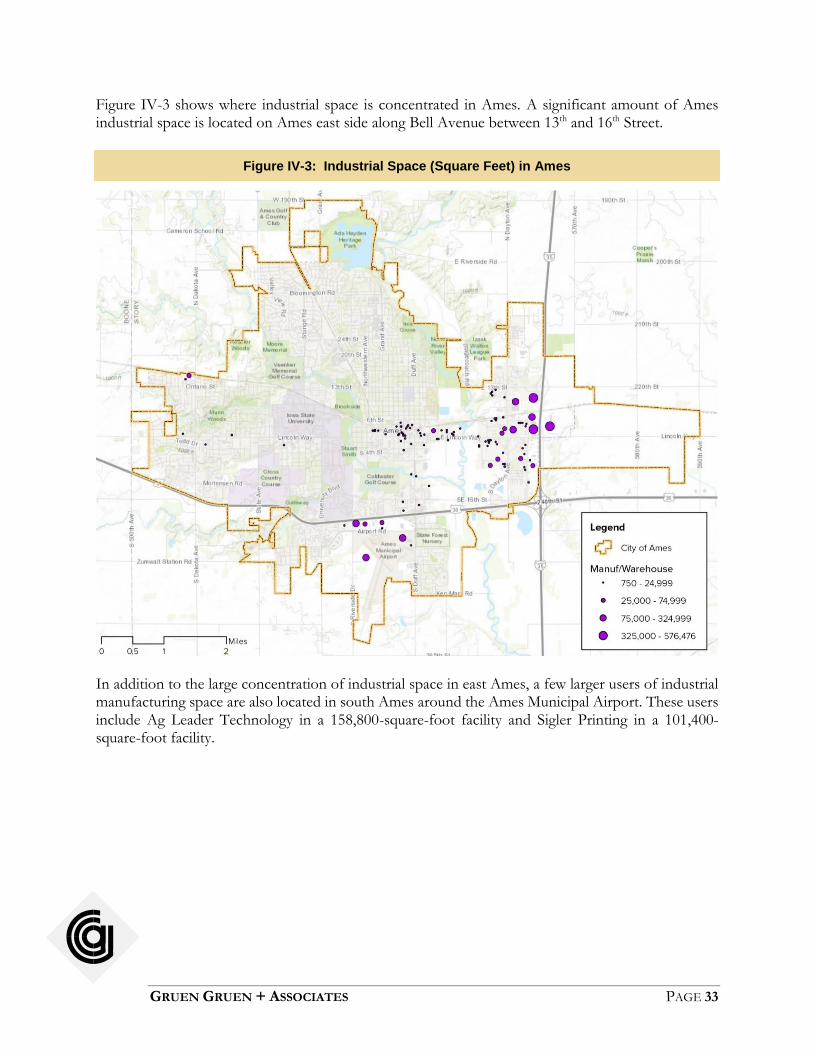
Figure IV-3 shows where industrial space is concentrated in Ames. A significant amount of Ames industrial space is located on Ames east side along Bell Avenue between 13th and 16th Street.
Figure IV-3: Industrial Space (Square Feet) in Ames
In addition to the large concentration of industrial space in east Ames, a few larger users of industrial manufacturing space are also located in south Ames around the Ames Municipal Airport. These users include Ag Leader Technology in a 158,800-square-foot facility and Sigler Printing in a 101,400-square-foot facility.

GRUEN GRUEN + ASSOCIATES PAGE 34
CHAPTER V: RETAIL MARKET CONDITIONS AND TAXABLE RETAIL SALES TRENDS
INTRODUCTION This chapter presents an overview of retail space market conditions and supply trends in Ames and the market area. It then reviews taxable retail sales trends in Ames by category to provide perspective on the strengths of the retailing base and patterns of change. RETAIL MARKET SUPPLY TRENDS Table V-1 summarizes the current supply of retail space in Ames.
Table V-1: Current Retail Market Inventory in City of Ames by Year Built
City of Ames Retail Space Inventory by Year Built (in Square Feet)
Prior to 1950
1950 to 1969
1970 to 1989
1990 to 2009
2010 to 2018 Total
Regional/Community 202,418 11,804 1,337,774 710,629 212,448 2,475,073
Neighborhood/Convenience 243,927 187,088 205,756 740,621 144,475 1,521,867
Restaurants/Bars 115,530 38,674 125,932 104,112 69,619 453,867
Total 561,875 237,566 1,669,462 1,555,362 426,542 4,450,807 1 Includes the following property use codes: “Research/Development”; “Warehouse Showroom”; “Industrial Office”; “Industrial Flex”; and “Lab”. 2 Includes a variety of miscellaneous building uses which are industrial in nature, such as mini-warehouses (self-storage), aviation hangars, and equipment and lumber storage facilities.
Sources: City of Ames Assessor; Story County Assessor; Gruen Gruen + Associates.
Ames contains nearly 4.5 million square feet of retail space. Approximately 56 percent of the retail space inventory is regional/community serving space. Another 34 percent is neighborhood/convenience retail space. Approximately 10 percent of the retail space are restaurants/bars. While 43 percent of office space and nearly one-half of the industrial space was built between 1990 and 2009, only about one-third of the retail space was built over the same period. A somewhat higher proportion, 38 percent of space was built earlier between 1970 to 1989. Another 18 percent of retail space is older, pre-1970 space. Just under 10 percent of retail space has been built since 2010. This compares to five percent of industrial space and 13 percent of office space built since 2010.

GRUEN GRUEN + ASSOCIATES PAGE 35
Two major nodes of retail space exist in Ames. Over one-half of the regional and community serving space are located in these two nodes. The first node is located in north Ames around the City’s largest retail shopping center North Grand Mall located at Grand Avenue and 24th Avenue. This retail node contains nearly 710,000 square feet of space. The 347,000-square-foot mall contains is anchored by JC Penney and Kohl’s (owned separately from the mall ownership). Younkers recently closed at the mall due to the department stores bankruptcy. A redevelopment project that began in 2012 included demolishing the area that used to house Sears and constructing a new 8,800-square-foot building on the south side of the mall. New national retailers opened stores at North Grand as part of the redevelopment including Kohl’s, T.J. Maxx, Shoe Carnival, and Gap Factory. The area also includes a newer 156,800-square-foot Walmart Supercenter which replaced an older store in 2016.
The second major node of retail development in Ames is located along South Duff Avenue from Lincoln Way to Highway 30. Retail development in this area totals approximately 810,800 square feet of community serving retail space including several big-box stores. Walmart Supercenter, Target, Sam’s Club, Lowe’s, Petco, Dollar Tree, Staples, Best Buy, HyVee, Hobby Lobby, and JoAnn Fabrics. and several fast food and fast casual restaurants located in this corridor. Fresh Thyme Market recently opened a 30,000-square-foot grocery store in a former Sports Authority store. A former Kmart property along Duff Avenue is in process of redevelopment. The current owner has proposed a redevelopment plan which will include restaurant and retail space and other commercial uses for the 13.24 acres site. Menard’s is building a store one-half mile east of the intersection of Duff Avenue and Southeast 16th Street. The store on 26 acres will also include a couple small parcels (totaling about three acres) for outlot development. According to local commercial brokers and economic development representatives, limited commercial space is available in Ames. TAXABLE RETAIL SALES BASE OF AMES An analysis of taxable retail sales trends provides a framework for assessing the relative strengths, weaknesses, and shifts within the retailing base of the City of Ames. The Iowa Department of Revenue reports detailed business group sales data only at the County level. Ames comprises about two-thirds of the County’s population and approximately 86 percent of the County’s taxable sales. We therefore present the retail sales by category for Story County which serves as an indicator of Ames retail base. The majority of the County’s sales are made in Ames indicating that the City’s retail base serves a trade area beyond the City’s boundaries. The analysis of retail sales also provides a basis from which to identify the retailing sectors capturing or leaking more sales dollars than would be expected from local resident expenditure potential alone. Retail Sales by Category Table V-2 summarizes taxable non-automotive retail sales in Story County by type of store. The taxable sales have been adjusted for inflation to current 2018 dollars based on the Consumer Price Index (CPI).

GRUEN GRUEN + ASSOCIATES PAGE 36
Table V-2: Taxable Non-Automotive Retail Sales in Story County ($2018 Dollars)1
Store Type
2009 $
2012 $
2018 $
10-Year Change
$ %
Furniture, Appliance & Home Furnishing Stores
48,635,399 39,723,981 28,418,563
(20,216,836)
-41.6
Building Material Stores
72,333,329 70,203,311 87,277,585
14,944,256 20.7
Food and Beverage Stores
60,245,840 60,485,244 87,619,150
27,373,310 45.4
Apparel and Accessories Stores
29,691,717 28,107,179 34,464,969
4,773,252 16.1
Specialty Retail Inc. Pharmacies/Drug Stores
68,509,141 66,459,356 66,406,586
(2,102,555)
-3.1
General Merchandise / Misc. Retailers
208,983,351 203,662,205 155,094,657
(53,888,694) -25.8
Food Service & Drinking Places
141,319,505 142,194,873 163,678,091
22,358,586 15.8
Non-Automotive Total
629,718,282
610,836,149
622,959,601
(6,758,681) -1.1
1 Taxable sales estimates are adjusted to current 2018 dollars based on the Consumer Price Index (CPI.
Sources: Iowa Department of Revenue; U.S. Bureau of Labor Statistics, Consumer Price Index; Gruen Gruen + Associates.
On an inflation-adjusted basis, the total non-automotive retail sales base of Story County has declined slightly over the past nine years: non-automotive sales totaled about $630 million in 2009 and $623 million in 2018. Total sales declined by about $19 million between 2009 and 2012, a period including the Great Recession, and then experienced a period of growth between 2012 and 2018. While the overall sales volume did not change much over the prior nine years, the composition of the retailing base has shifted. Three categories, including food and beverage stores, food services and drinking places (i.e., restaurants), and building materials experienced a combined increase in real sales totaling more than $64 million over the past nine years. At the same time, real sales in retail categories of general merchandise, furniture, appliances and home furnishings, and specialty retail declined by a combined $76 million. This generally reflects the closure of department stores such as Sears and Younkers at the North Grand Mall (these categories represent the traditional tenant mix of a regional mall) as well as some chainwide closures (e.g., Kmart). Consumer shopping pattern shifts that have occurred– including the ubiquitous growth of online shopping in particular – suggest sales lost over the long term in some of these categories may never be re-captured. A variety of secondary surveys indicate that consumers are purchasing an increasing proportion of community-like discretionary goods and general merchandise goods like books, home/personal electronics, office supplies, and sporting goods online instead of in-store. The increase in categories such as food and beverage stores and food services and drinking places (i.e., restaurants) likely reflects the growth in student population at ISU in Ames given the growth in
GRUEN GRUEN + ASSOCIATES PAGE 37
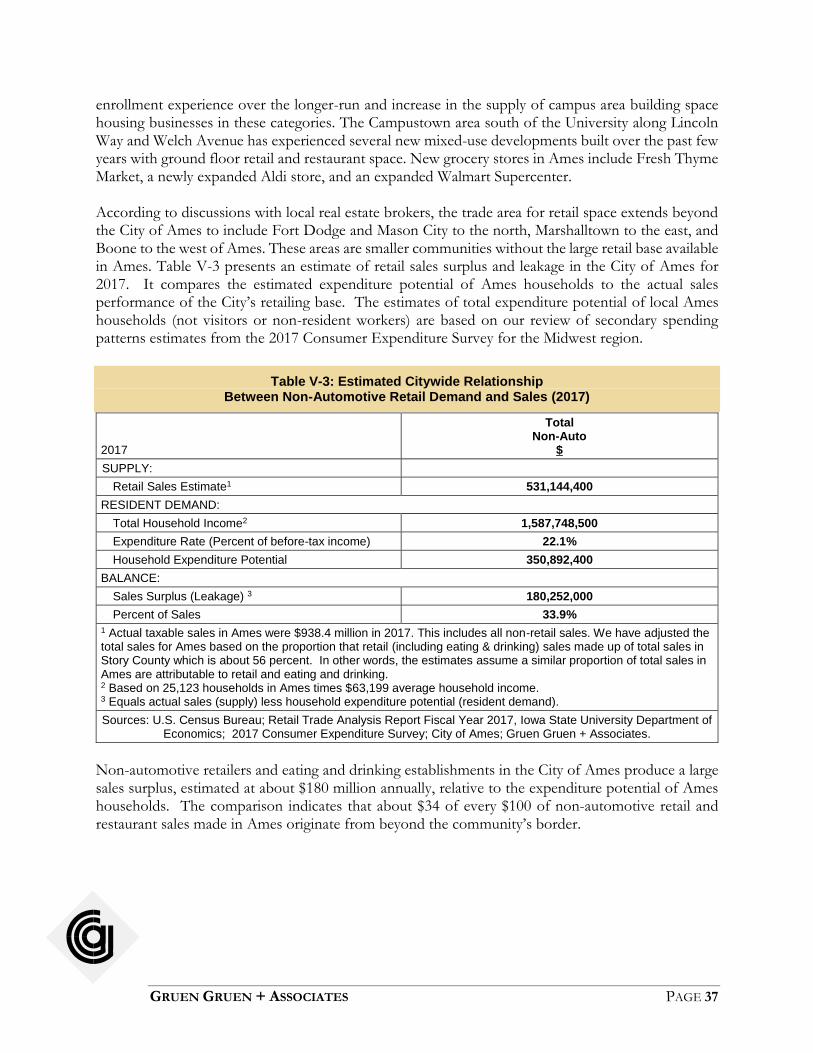
enrollment experience over the longer-run and increase in the supply of campus area building space housing businesses in these categories. The Campustown area south of the University along Lincoln Way and Welch Avenue has experienced several new mixed-use developments built over the past few years with ground floor retail and restaurant space. New grocery stores in Ames include Fresh Thyme Market, a newly expanded Aldi store, and an expanded Walmart Supercenter. According to discussions with local real estate brokers, the trade area for retail space extends beyond the City of Ames to include Fort Dodge and Mason City to the north, Marshalltown to the east, and Boone to the west of Ames. These areas are smaller communities without the large retail base available in Ames. Table V-3 presents an estimate of retail sales surplus and leakage in the City of Ames for 2017. It compares the estimated expenditure potential of Ames households to the actual sales performance of the City’s retailing base. The estimates of total expenditure potential of local Ames households (not visitors or non-resident workers) are based on our review of secondary spending patterns estimates from the 2017 Consumer Expenditure Survey for the Midwest region.
Table V-3: Estimated Citywide Relationship Between Non-Automotive Retail Demand and Sales (2017)
2017
Total Non-Auto
$
SUPPLY:
Retail Sales Estimate1 531,144,400
RESIDENT DEMAND:
Total Household Income2 1,587,748,500
Expenditure Rate (Percent of before-tax income) 22.1%
Household Expenditure Potential 350,892,400
BALANCE:
Sales Surplus (Leakage) 3 180,252,000
Percent of Sales 33.9%
1 Actual taxable sales in Ames were $938.4 million in 2017. This includes all non-retail sales. We have adjusted the total sales for Ames based on the proportion that retail (including eating & drinking) sales made up of total sales in Story County which is about 56 percent. In other words, the estimates assume a similar proportion of total sales in Ames are attributable to retail and eating and drinking. 2 Based on 25,123 households in Ames times $63,199 average household income. 3 Equals actual sales (supply) less household expenditure potential (resident demand).
Sources: U.S. Census Bureau; Retail Trade Analysis Report Fiscal Year 2017, Iowa State University Department of Economics; 2017 Consumer Expenditure Survey; City of Ames; Gruen Gruen + Associates.
Non-automotive retailers and eating and drinking establishments in the City of Ames produce a large sales surplus, estimated at about $180 million annually, relative to the expenditure potential of Ames households. The comparison indicates that about $34 of every $100 of non-automotive retail and restaurant sales made in Ames originate from beyond the community’s border.

Gruen Gruen + Associates (GG+A) is a firm of economists, sociologists, statisticians and market, financial and fiscal analysts. Developers, public agencies, attorneys and others involved in real estate asset management utilize GG+A research and consulting to make and implement investment, marketing, product, pricing and legal support decisions. The firm's staff has extensive experience and special training in the use of demographic analysis, survey research, econometrics, psychometrics and financial analysis to describe and forecast markets for a wide variety of real estate projects and economic activities. Since its founding in 1970, GG+A has pioneered the integration of behavioral research and econometric analysis to provide a sound foundation for successful land use policy and economic development actions. GG+A has also pioneered the use of economic, social and fiscal impact analysis. GG+A impact studies accurately and comprehensively portray the effects of public and private real estate developments, land use plans, regulations, annexations and assessments on the affected treasuries, taxpayers, consumers, other residents and property owners. SAN FRANCISCO: DEERFIELD, ILLINOIS: DENVER: 415-432-4342 847-317-0634 720-583-2056
www.ggassoc.com
APPLYING KNOWLEDGE, CREATING RESULTS, ADDING VALUE