An Analysis of Students’ Ability in Writing Descriptive Text...
14
1 An Analysis of Students’ Ability in Writing Descriptive Text at Tenth Grade of SMAN 2 Tanjungpinang 1 Dini Trisni Anggraini, 2 Muhammad Candra, 3 Gatot Subroto [email protected] English Education Study Program, Teacher Training and Education Faculty, Universitas Maritim Raja Ali Haji ABSTRACT The aims of this study are to find out the students’ ability in writing descriptive text particulary in its organization aspect and their formatting mistakes. Descriptive text is a text that describe particular person, animal, place, or thing in order to give information to the reader in written form. This study uses quantitative method. The sample of this study are the 52 students of science major at tenth grade of SMAN 2 Tanjungpinang. The researcher uses the simple random technique to select the sample. The instrument which used in this study is test. The researcher adapts Brown’s writing rubric for descriptive text in organization aspect to analyse the students’ descriptive text and calculates the result using mean formula. To analyse the students’ formatting mistakes, the researcher adapts Oshima and Hogue’s scoring rubric and uses the percentage formula to calculate the result. The result of this research are most of the science students has fair ability in writing descriptive text in organization aspect, and the formatting mistakes that mostly they commit is “the writing is not tidy” (34,6%). Key Words: Studentss’ Ability, Writing Descriptive Text, Organization Aspect INTRODUCTION In learning English, there are four skills which students have to learn. The skills are listening, speaking, reading, and writing. Based on the 2013 Curriculum, students have to master all skills including writing. Writing is the most difficult skill that students have to master because it has several aspects, which the students
Transcript of An Analysis of Students’ Ability in Writing Descriptive Text...

1
An Analysis of Students’ Ability in Writing Descriptive Text at
Tenth Grade of SMAN 2 Tanjungpinang
1Dini Trisni Anggraini, 2Muhammad Candra, 3Gatot Subroto
English Education Study Program, Teacher Training and Education Faculty,
Universitas Maritim Raja Ali Haji
ABSTRACT
The aims of this study are to find out the students’ ability in writing
descriptive text particulary in its organization aspect and their formatting mistakes.
Descriptive text is a text that describe particular person, animal, place, or thing in
order to give information to the reader in written form. This study uses quantitative
method. The sample of this study are the 52 students of science major at tenth grade
of SMAN 2 Tanjungpinang. The researcher uses the simple random technique to
select the sample. The instrument which used in this study is test. The researcher
adapts Brown’s writing rubric for descriptive text in organization aspect to analyse
the students’ descriptive text and calculates the result using mean formula. To
analyse the students’ formatting mistakes, the researcher adapts Oshima and
Hogue’s scoring rubric and uses the percentage formula to calculate the result. The
result of this research are most of the science students has fair ability in writing
descriptive text in organization aspect, and the formatting mistakes that mostly they
commit is “the writing is not tidy” (34,6%).
Key Words: Studentss’ Ability, Writing Descriptive Text, Organization Aspect
INTRODUCTION
In learning English, there are four skills which students have to learn. The
skills are listening, speaking, reading, and writing. Based on the 2013 Curriculum,
students have to master all skills including writing. Writing is the most difficult
skill that students have to master because it has several aspects, which the students
2
have to consider in order to make a good writing. The aspects are contents,
vocabulary, punctuation, language use, and organization aspect (Brown, 2004).
Because of those aspects, writing becomes complex for them and it makes them
lose motivation to learn more about writing.
Based on the syllabus, the students at tenth grade in senior high school learn
about descriptive text in the first semester. They have to learn how to write a simple
descriptive text particularly about tourist attraction and historical building.
According to Nordquist (2017), to make the best descriptive writing both in fiction
and nonfiction, we have to include five senses. They are smell, taste, touch, sight,
and hearing. Furthermore, to write a good descriptive text, he also states that after
identifying that subject in a clear topic sentence, they proceed to describe it in detail
while explaining its personal significance
Based on the researcher’s observation in SMAN 2 Tanjungpinang, she
found several problems connected to the students’ problem in writing descriptive
text. The problems are the students had difficulty to write the content, they confused
to write the identification and description, they cannot distinguish it, they often
make grammar mistakes, they lacked of vocabulary, and the often make mistakes
in spelling, punctuation and capitalization.
Based on the problems above, the researcher focused on students’ difficulty
in writing descriptive text in organization aspect and what kind of formatting
mistakes which they make in their descriptive text.

3
METHODOLOGY
This study used quantitative research as the methodology. Quantitative
research method uses statistical or numeric approach to quantify the data (Williams,
2007). The population of this study was the science students at tenth grade of
SMAN 2 Tanjungpinang in the academic year of 2017-2018. The researcher took
54 from 268 students as the sample of this study using a theory from Arikunto, ,
“...if the subject is large, the researcher can take 10-15% or 20-25% or more.”
Arikunto (2006, in Zakky, 2014:46). The researcher used simple random sampling
to take the sample. Frerichs (2008) stated that using simple random sampling
technique means each person in the population has the same possibility to be
selected as the sample. She also used the lottery method to select the students from
each classes.
To analyse the students’ ability in writing descriptive text in organization
aspect, the researcher adapted the writing rubric for descriptive text from Brown
(Brown, 2007).
Table 1.1
Writing Rubric for Descriptive Text in Organization Aspect: Identification
No Aspect Score Criteria
1
Organization:
Identification
4 Student writes the name of place and location
completely.
2 3 Student writes the name of place and location,
and it is almost complete.
3 2 Student writes the name of place and location
and it is not complete.
4 1 Student only writes one of the name of place or
location.
5 0 Student does not write the identification.

4
Table 1.2
Writing Rubric for Descriptive Text in Organization Aspect: Description
No Aspect Score Criteria
1
Organization:
Description
4 Student writes the part, qualities, and
characteristics of the object completely.
2 3 Student writes the part, qualities, and
characteristics of the object and it is almost
complete.
3 2 Student writes the part, qualities, and
characteristics of the object and it is not
complete.
4 1 Student only writes one of the part or qualities
or characteristics of the object.
5 0 Student does not write the description.
The researcher adapted the criteria of students’ ability from Purwanto
(1990, in Prasetyanti, 2014), to categorize their ability in writing descriptive text in
organization aspect.
Table 1.3
Criteria of Students’ Ability in Writing Descriptive Text in Organization Aspect
Letter Score Value Criterion
A 4 Excellent
B 3 Good
C 2 Fair
D 1 Less
E 0 Poor
The researcher used the mean formula (Best & Kahn, 1998) to calculate the
total score of students’ organization.
�̅� = ∑ 𝑥
𝑛

5
Where:
�̅� = mean
∑𝑥 = sum of scores from identification and description
𝑛 = total number of organization aspects
To analyse the students’ formatting mistakes, the researcher used the
scoring rubric adapted from Oshima and Hogue (2007), as follows:
Table 1.4
Scoring Rubric to Measure the Students’ Formatting Mistakes in Writing
Descriptive Text
No Criteria Maximum Score
1.
2.
3.
4.
5.
Format – 5 Points
There is a title
The title is centered
The first line is intended
The writing is tidy
The writing is clean
1
1
1
1
1
Afterward, to categorize the students’ formatting mistakes, the researcher
adapted Vagias and Wade’s (2006) level of quality.
1 – Poor, 2 – Fair 3 – Good 4 – Very Good 5 – Excellent
Last, to calculate the students’ formatting mistakes, the researcher used the
percentage formula from Lota (2015), as follows:
𝑃 = 𝑓
𝑛𝑥100%
6
Where:
𝑃 = percentage
𝑓 = frequency of student who commit the formatting mistake in each category
𝑛 = total number of students
In this study, the researcher used test as the instrument. The students had to
write a simple descriptive text about tourist attraction or historical building. After
that, the researcher collected the data and analysed it using Brown’s (Brown, 2007)
scoring rubric of writing descriptive text in organization aspect. The researcher also
analysed the formatting mistakes (Oshima and Hogue, 2007) in students’
descriptive text.
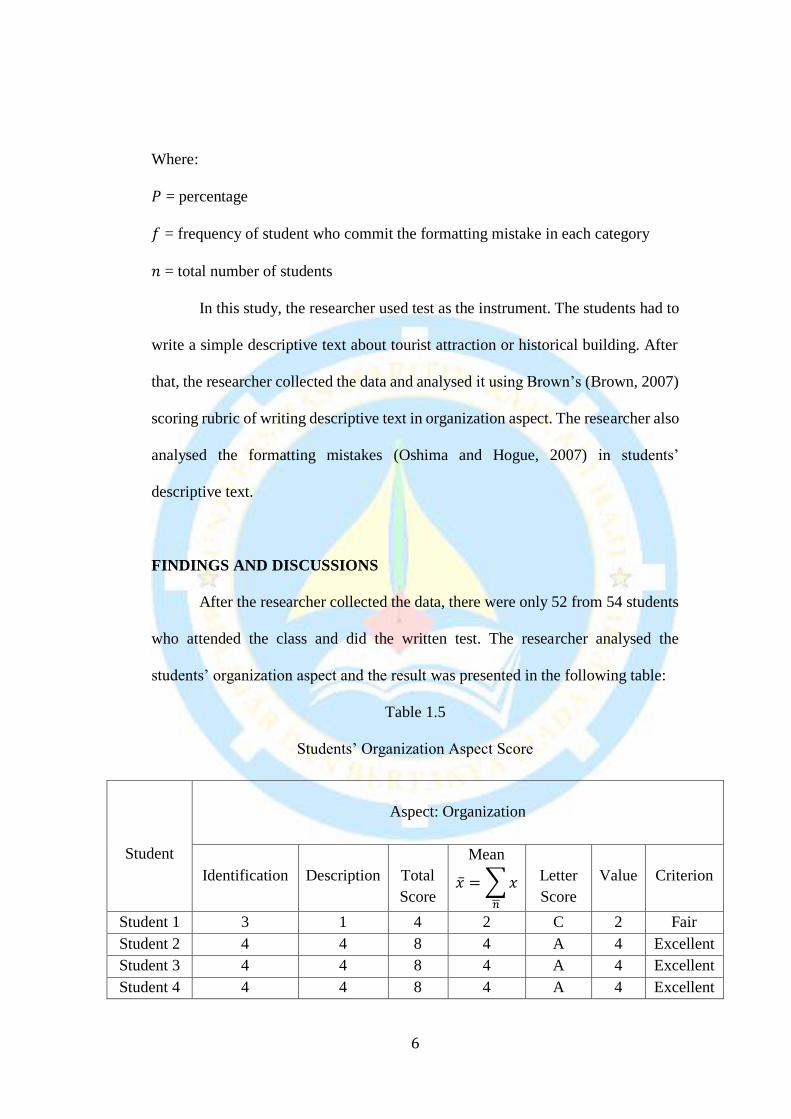
FINDINGS AND DISCUSSIONS
After the researcher collected the data, there were only 52 from 54 students
who attended the class and did the written test. The researcher analysed the
students’ organization aspect and the result was presented in the following table:
Table 1.5
Students’ Organization Aspect Score
Student
Aspect: Organization
Identification
Description
Total
Score
Mean
�̅� = ∑ 𝑥
𝑛
Letter
Score
Value
Criterion
Student 1 3 1 4 2 C 2 Fair
Student 2 4 4 8 4 A 4 Excellent
Student 3 4 4 8 4 A 4 Excellent
Student 4 4 4 8 4 A 4 Excellent
7
Student 5 3 1 4 2 C 2 Fair
Student 6 2 2 4 2 C 2 Fair
Student 7 4 4 8 4 A 4 Excellent
Student 8 3 1 4 2 C 2 Fair
Student 9 2 2 4 2 C 2 Fair
Student 10 2 2 4 2 C 2 Fair
Student 11 3 3 6 3 B 3 Good
Student 12 1 3 4 2 C 2 Fair
Student 13 2 0 2 1 D 1 Less
Student 14 2 2 4 2 C 2 Fair
Student 15 1 3 4 2 C 2 Fair
Student 16 2 2 4 2 C 2 Fair
Student 17 1 3 4 2 C 2 Fair
Student 18 1 3 4 2 C 2 Fair
Student 19 4 4 8 4 A 4 Excellent
Student 20 3 1 4 2 C 2 Fair
Student 21 1 3 4 2 C 2 Fair
Student 22 4 4 8 4 A 4 Excellent
Student 23 4 0 4 2 C 2 Fair
Student 24 2 2 4 2 C 2 Fair
Student 25 4 2 6 3 B 3 Good
Student 26 4 4 8 4 A 4 Excellent
Student 27 4 4 8 4 A 4 Excellent
Student 28 4 4 8 4 A 4 Excellent
Student 29 4 4 8 4 A 4 Excellent
Student 30 4 4 8 4 A 4 Excellent
Student 31 2 2 4 2 C 2 Fair
Student 32 1 3 4 2 C 2 Fair
Student 33 1 3 4 2 C 2 Fair
Student 34 1 3 4 2 C 2 Fair
Student 35 4 4 8 4 A 4 Excellent
Student 36 2 2 4 2 C 2 Fair
Student 37 4 4 8 4 A 4 Excellent
Student 38 3 3 6 3 B 3 Good
Student 39 4 4 8 4 A 4 Excellent
Student 40 2 4 6 3 B 3 Good
Student 41 1 3 4 2 C 2 Fair
Student 42 2 2 4 2 C 2 Fair
Student 43 4 2 6 3 B 3 Good

8
Based on the table above, there were 15 students categorized as excellent, 8
students categorized as good, 26 students categorized as fair, 3 students categorized
as less and none of them got poor. Half of them got fair, it can be concluded that
most of them still did not know how to write a good descriptive text particularly in
organization aspect.
Graphic 1.1
Students’ Ability in Writing Descriptive Text in Organization Aspect
0
5
10
15
20
25
30
Excellent Good Fair Less Poor
Graphic of Students' Ability in Writing Descriptive Text
Student 44 2 0 2 1 D 1 Less
Student 45 2 0 2 1 D 1 Less
Student 46 2 2 4 2 C 2 Fair
Student 47 4 4 8 4 A 4 Excellent
Student 48 2 2 4 2 C 2 Fair
Student 49 3 3 6 3 B 3 Good
Student 50 2 2 4 2 C 2 Fair
Student 51 4 2 6 3 B 3 Good
Student 52 3 3 6 3 B 3 Good
Total
Excellent 15 Students
Good 8 Students
Fair 26 Students
Less 3 Students
Poor 0 Student

9
Based on the graphic above, it was found that most students got fair in
writing descriptive text in organization aspect.
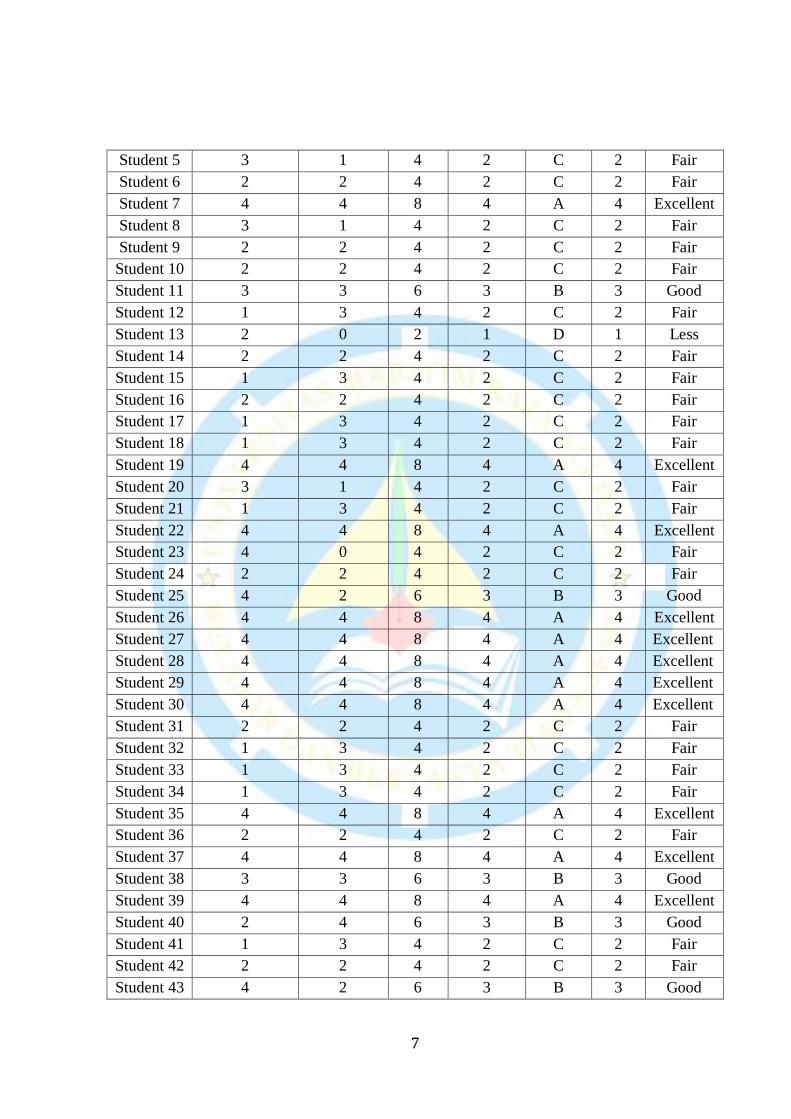
The researcher analysed students’ formatting mistakes in writing descriptive
text. The result was presented in the following table:
Table 1.6
Students’ Formatting Mistake at Five Criteria
Student
Criteria
Score
Quality There
is a title
The title
is
centered
The first line
is intended
The
writing
is tidy
The
writing
is clean
Student 1 1 1 1 1 1 4 Very Good
Student 2 1 1 - - - 2 Fair
Student 3 1 1 1 1 1 5 Excellent
Student 4 1 1 1 1 1 5 Excellent
Student 5 1 1 1 1 1 5 Excellent
Student 6 1 1 1 1 1 5 Excellent
Student 7 1 1 1 - 1 4 Very Good
Student 8 - - 1 1 1 3 Good
Student 9 1 1 1 1 1 5 Excellent
Student 10 - - - 1 1 2 Fair
Student 11 1 1 1 1 1 5 Excellent
Student 12 - - 1 - 1 2 Fair
Student 13 - - 1 1 1 3 Good
Student 14 1 1 1 1 1 5 Excellent
Student 15 1 1 1 1 1 5 Excellent
Student 16 - - 1 1 1 3 Good
Student 17 1 1 1 1 - 4 Very Good
Student 18 1 1 1 1 1 5 Excellent
Student 19 1 1 1 1 1 5 Excellent
Student 20 1 1 - 1 1 4 Very Good
Student 21 1 1 1 1 1 5 Excellent
Student 22 1 1 1 1 1 5 Excellent
Student 23 1 1 1 - - 3 Good
Student 24 1 1 1 1 1 5 Excellent
Student 25 1 1 - - 1 3 Good
Student 26 1 1 1 1 1 5 Excellent
10
Student 27 1 1 1 1 1 5 Excellent
Student 28 1 - - - 1 2 Fair
Student 29 1 1 1 1 1 5 Excellent
Student 30 1 1 1 1 1 5 Excellent
Student 31 1 1 1 1 1 5 Excellent
Student 32 1 1 1 1 1 5 Excellent
Student 33 1 1 1 - 1 4 Very Good
Student 34 1 1 1 - 1 4 Very Good
Student 35 1 1 1 1 1 5 Excellent
Student 36 1 1 - 1 1 4 Very Good
Student 37 1 1 1 - - 3 Good
Student 38 1 1 1 - - 3 Good
Student 39 1 1 1 1 1 5 Excellent
Student 40 1 1 1 1 1 5 Excellent
Student 41 1 1 1 - 1 4 Very Good
Student 42 1 1 1 - - 3 Good
Student 43 1 1 1 - - 3 Good
Student 44 1 1 1 - - 3 Good
Student 45 - - 1 - - 1 Poor
Student 46 1 1 1 - - 3 Good
Student 47 1 1 1 1 1 5 Excellent
Student 48 1 1 1 - - 3 Good
Student 49 1 1 1 1 1 5 Excellent
Student 50 1 1 1 1 1 5 Excellent
Student 51 1 1 1 - 1 4 Very Good
Student 52 1 1 1 1 - 4 Very Good
Total
Poor 1 Student
Fair 4 Students
Good 12 Students
Very Good 10 Students
Excellent 25 Students
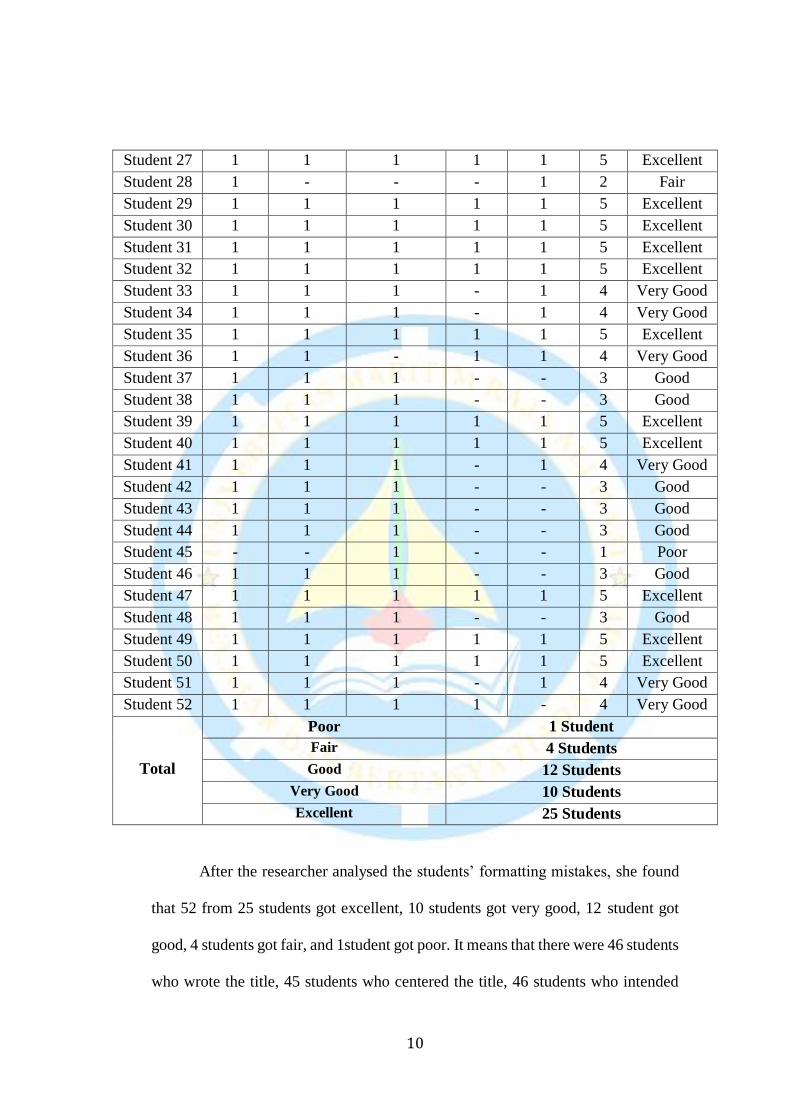
After the researcher analysed the students’ formatting mistakes, she found
that 52 from 25 students got excellent, 10 students got very good, 12 student got
good, 4 students got fair, and 1student got poor. It means that there were 46 students
who wrote the title, 45 students who centered the title, 46 students who intended
11
the first line. 34 students who wrote the descriptive text tidily, and 39 students who
wrote the descriptive text cleanly.
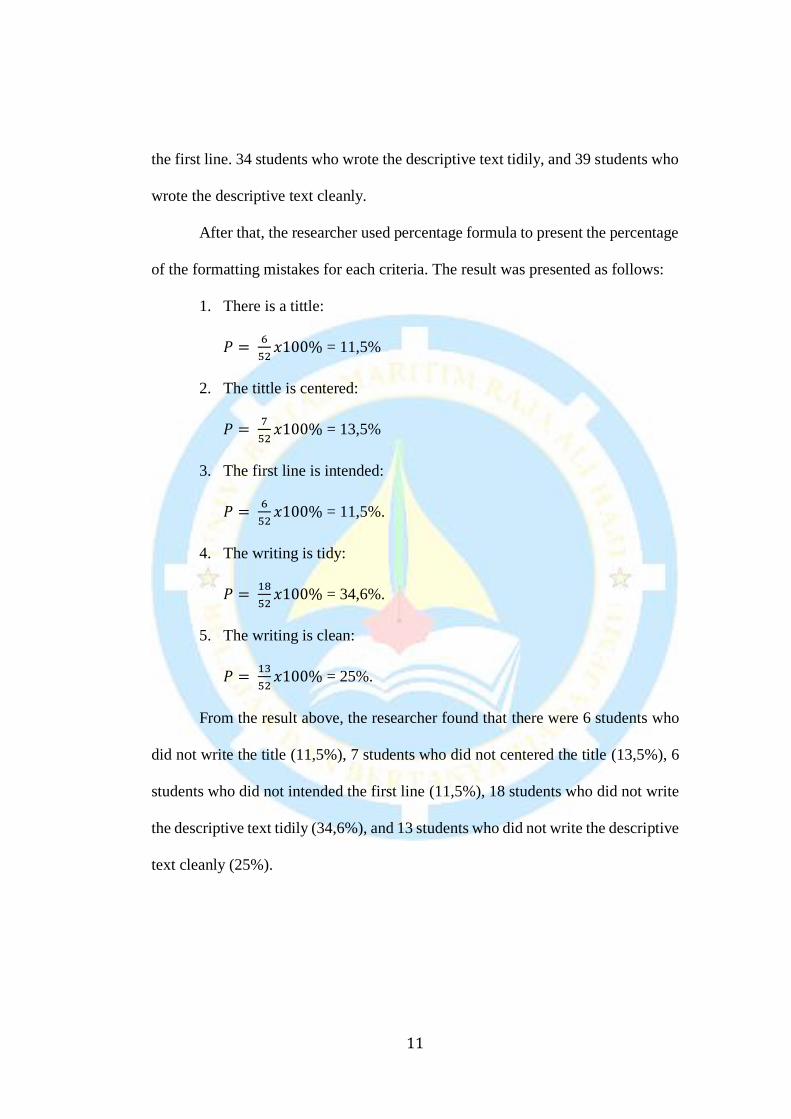
After that, the researcher used percentage formula to present the percentage
of the formatting mistakes for each criteria. The result was presented as follows:
1. There is a tittle:
𝑃 = 6
52𝑥100% = 11,5%
2. The tittle is centered:
𝑃 = 7
52𝑥100% = 13,5%
3. The first line is intended:
𝑃 = 6
52𝑥100% = 11,5%.
4. The writing is tidy:
𝑃 = 18
52𝑥100% = 34,6%.
5. The writing is clean:
𝑃 = 13
52𝑥100% = 25%.
From the result above, the researcher found that there were 6 students who
did not write the title (11,5%), 7 students who did not centered the title (13,5%), 6
students who did not intended the first line (11,5%), 18 students who did not write
the descriptive text tidily (34,6%), and 13 students who did not write the descriptive
text cleanly (25%).

12
Graphic 1.2
Students' Level of Quality in Formatting Mistakes
Based on the graphic above, the result was most of the science students at
tenth grade of SMAN 2 Tanjungpinang got excellent in using the format in their
descriptive text, and based on the findings, it showed that mistake that committed
by most students was their writing is not tidy. The percentage of the mistake was
34,6%.
CONCLUSION
Based on the data, it can be concluded that most of the science students at
tenth grade of SMAN 2 Tanjungpinang had fair ability in writing descriptive text
in terms of organization aspect. Whereas 26 students from 52 students who got C
in value and the score was 2, it means half of them still did not know how to write
a good descriptive text in organization aspect.
Based om the data, it can be concluded that the formatting mistakes that
mostly science student at tenth grade of SMAN 2 Tanjungpinang made in this
research the writing was not tidy. The percentage of the mistake was 34,6%.
0
5
10
15
20
25
30
Poor Fair Good Very Good Excellent
Graphic of Students' Level of Quality in Formatting Mistakes
13
ACKNOWLEDGMENT
The publication of this research was approved by English Education Study
Program, Teacher Training and Education Faculty, Universitas Maritim Raja Ali
Haji.
REFERENCES
Best, John W., James V Kahn. (1998). Research Education. USA: Allyn & Bacon.
Brown, H. D. (2004). Language Assessment: Principles and Classroom Practices.
New York: Pearson Longman.
_(2007). Teaching by Principles: An Interactive Approach to Language Pedagogy.
San Francisco: Pearson Longman
Crossman, Ashley. (2017). What is A Simple Random Sample?. Retrieved from
https://www.thoughtco.com/random-sampling-3026729 accessed on
Sunday November 19, 2017 at 11:13 A.M.
Dian Candra Prasetyanti. (2014). A Study on the Ability in Writing A Recount Text
by Using Pictures of the Eighth Grade Students of SMPN 2 Tambakromo Pati
Academic Year 2012/2013. Muhammadiyah University of Semarang.
Frerichs, RR. (2008). Simple Random Sampling, Chapter Three, in Rapid
Surveys (unpublished).
Lota, Violeta A. (2015). The Effectiveness of The Academic Processes of The BI-
Semestral System of Asian Institute of Maritim Studeis. DSLU Research
Congress, 3.

14
Nordquist, Richard. (2017). Model Descriptive Paragraphs.
https://www.thoughtco.com/model-descriptive-paragraphs-1690573
accessed on Sunday November 5, 2017 at 07:53 A.M.
Oshima, Alice and Hogue, Ann. (2007). Introduction to Academic Writing. NY:
Pearson Education.
Vagias, Wade M. (2006). Likert-Type Scale Response Anchors. Clemson
International Institute for Tourism & Research Development, Department
of Parks, Recreation and Tourism Management. Clemson University.
Williams, Carrie. (2007). Research Methods. Journal of Business of Economic
Research, 5.
Zakky Bunyamun Marsus. (2014). Hubungan Antara Pemanfaatan Internet
Sekolah dengan Motivasi Siswa untuk Menelusuri Bahan Ajar: Studi
Deskriptif Korelasional terhadap SMP Siswa Kelas VIII SMP Negeri 1
Lembang. Universitas Pendidikan Indonesia.