An analysis of seismic information obtained from … · An analysis of seismic information obtained...
4
An analysis of seismic information obtained from crooked line seismic surveys in crystalline rocks, Australia M. Urosevic 1 and C. Juhlin 2 1 Curtin University of Technology, Department of Exploration Geophysics, Perth, Western Australia 2 Uppsala University, Dept. of Earth Sciences, Uppsala, Sweden Exploration for mineral deposits in hard rock environments is typically quite difficult because of the regolith and crystalline rock complexities. In addition, inaccessibility and mine site restrictions including native title issues in Australia result in seismic surveys which are not favourably directed with respect to the dominant structural trend in many exploration areas. In most cases, seismic reflection data acquisition is restricted to existing roads and bush tracks. Consequently, crooked line surveys are common in the hard rock environment. Standard crooked line data processing produces in most cases clear images, revealing a wealth of structural information to an interpreter. Yet careful analysis shows that underground reflection points are often produced by geological features which are far away from a selected mid-point track. Early identification of these out-of-the-plane reflections can be to some extent achieved by analysing constant velocity stacks, by comparing the quality of pre- to post-DMO stacks, and by analysing the performance of post-stack time and depth migrations. However, more explicit assessment can be achieved through a simplified cross-dip analysis. Such analysis also offers a routine for constructing a 3D velocity model which can be subsequently employed for 3D pre-stack depth imaging. The effectiveness of this approach is dependent upon crooked line geometry and the data fold. In general, highly deviated lines bring the crooked line imaging task closer to that of true 3D survey. Here, we test our routines on field data acquired in northern Western Australia and North Territory. Introduction Seismic reflection methods were rarely used for mineral exploration in the hard rock environment in Australia until recently. It is first now that the wealth of information provided by large scale regional seismic surveys conducted over the last 10 years by Geoscience Australia is being utilised. Initial hard rock seismic images provided a very clear representation of deep crystalline structures, but failed to provide structural information at the prospect or mine scale. Primary reasons for poor structural imaging of the shallow targets were: 1) The full complexity of the regolith (near surface altered, transported and weathered zone) had not been recognised and appreciated. This zone is typically very thick (up to 150 m), highly variable and can cause significant scattering of seismic energy. Total static corrections (source plus receiver) can easily exceeds 200 ms in some areas. 2) 3D complex structures were investigated with 2D seismic lines 3) Crooked line seismic acquisition geometry was often deployed which further violated our common assumption of the orthogonality of the seismic line to underground structures. The first issue has been largely resolved (Urosevic et al., 2005) resulting in greatly improved seismic images. The main objective of the current investigations involves the last two issues. This problem has been rigorously treated and analysed by Nedimovic and West (2003). They showed that a combination of 3D geology and crooked line seismic data acquisition can be utilised to analyse cross-dip effects, partially compensate for them, and obtain improved seismic images. Our approach is that cross-dip analysis can be used for structural interpretation and for building of the 3D velocity model. Since crooked line surveys are in effect 2.5 D surveys or swath surveys it is possible to at least partially build up a 3D model based on the cross-dip analysis. Hence it makes more sense to apply 3D
Transcript of An analysis of seismic information obtained from … · An analysis of seismic information obtained...

An analysis of seismic information obtained from crooked line seismic surveys in crystalline rocks, Australia M. Urosevic1 and C. Juhlin2 1Curtin University of Technology, Department of Exploration Geophysics, Perth, Western Australia 2Uppsala University, Dept. of Earth Sciences, Uppsala, Sweden Exploration for mineral deposits in hard rock environments is typically quite difficult because of the regolith and crystalline rock complexities. In addition, inaccessibility and mine site restrictions including native title issues in Australia result in seismic surveys which are not favourably directed with respect to the dominant structural trend in many exploration areas. In most cases, seismic reflection data acquisition is restricted to existing roads and bush tracks. Consequently, crooked line surveys are common in the hard rock environment. Standard crooked line data processing produces in most cases clear images, revealing a wealth of structural information to an interpreter. Yet careful analysis shows that underground reflection points are often produced by geological features which are far away from a selected mid-point track. Early identification of these out-of-the-plane reflections can be to some extent achieved by analysing constant velocity stacks, by comparing the quality of pre- to post-DMO stacks, and by analysing the performance of post-stack time and depth migrations. However, more explicit assessment can be achieved through a simplified cross-dip analysis. Such analysis also offers a routine for constructing a 3D velocity model which can be subsequently employed for 3D pre-stack depth imaging. The effectiveness of this approach is dependent upon crooked line geometry and the data fold. In general, highly deviated lines bring the crooked line imaging task closer to that of true 3D survey. Here, we test our routines on field data acquired in northern Western Australia and North Territory. Introduction Seismic reflection methods were rarely used for mineral exploration in the hard rock environment in Australia until recently. It is first now that the wealth of information provided by large scale regional seismic surveys conducted over the last 10 years by Geoscience Australia is being utilised. Initial hard rock seismic images provided a very clear representation of deep crystalline structures, but failed to provide structural information at the prospect or mine scale. Primary reasons for poor structural imaging of the shallow targets were: 1) The full complexity of the regolith (near surface altered, transported and weathered zone) had not been recognised and appreciated. This zone is typically very thick (up to 150 m), highly variable and can cause significant scattering of seismic energy. Total static corrections (source plus receiver) can easily exceeds 200 ms in some areas. 2) 3D complex structures were investigated with 2D seismic lines 3) Crooked line seismic acquisition geometry was often deployed which further violated our common assumption of the orthogonality of the seismic line to underground structures. The first issue has been largely resolved (Urosevic et al., 2005) resulting in greatly improved seismic images. The main objective of the current investigations involves the last two issues. This problem has been rigorously treated and analysed by Nedimovic and West (2003). They showed that a combination of 3D geology and crooked line seismic data acquisition can be utilised to analyse cross-dip effects, partially compensate for them, and obtain improved seismic images. Our approach is that cross-dip analysis can be used for structural interpretation and for building of the 3D velocity model. Since crooked line surveys are in effect 2.5 D surveys or swath surveys it is possible to at least partially build up a 3D model based on the cross-dip analysis. Hence it makes more sense to apply 3D

imaging routines rather than 2D ones in such cases. Still inherent to 2.5 D surveys is the lack of illumination in the cross-dip direction. Crooked line surveys over 3D geology Where there is a significant spread in the midpoints perpendicular to the profiles it is possible to analyse the seismic data for the crossdip component of the reflections (Nedimovic and West, 2003). If the reflector dips exactly perpendicular to the strike of the profile then the crossdip component can be corrected for by
(2 / ) sinT Y ν φ∆ = ⋅∆ ⋅
where ∆Y is the signed perpendicular distance from the midpoint to the CDP stacking line, v is an appropriate constant velocity estimate of the medium, φ is the crossdip angle and ∆T is the time delay or advance to be applied to the trace in the CDP gather. By stacking data with different crossdip corrections at a given stacking or NMO velocity, an estimate of the crossdip component can be made. If the strike of the reflector is not parallel to the CDP stacking line the crossdip correction also depends upon its dip. Therefore, the crossdip angle obtained should be considered with caution, but is reasonably accurate for gently dipping reflections at all strikes. This simplified correction enables quick and efficient analysis of the off-plane events and eventually can be used to help building 3D velocity model for pre-stack migration. We applied this strategy on two different data sets from Western Australia and Northern Territory for mane scale exploration objectives.
Field data examples The first data set comes from northern part of Western Australia. A high fold, high-resolution seismic crooked seismic line was acquired to analyse main structural and stratigraphic features in this area. We selected several zones along the line where dispersion of CMP points was significant enough to enable crossdip analysis. An example is shown in Figure 1. The procedure involves rotation of the coordinate system that is rotation of the linearised segment of the track to the west-east direction (x-axis), computation of the perpendicular offsets, time corrections using a representative velocity, inverse coordinate rotation and creation of crossdip stack panels (Figure 1d). Similar procedure has been utilised by Malehmir et al. (2006) to delineate ore deposits in Northern Sweeden. It is clear that most of the shallow geological features are dipping towards the North. Since the crossline dip is gentle, coherent imaging is possible even under simplified assumptions (Figure 1b and 1c). The second example comes from all-out hard rock environment, deep in Northern Territory desert region. In this case regional seismic line of a moderate to low resolution was acquired to investigate deep crystalline structures (Figure 2). Parts of the seismic line which traversed several gold mining prospects were subsequently reprocessed. Wast improvement of the image quality in comparison to the initial processing was mainly attributed to accurate computation of refraction and residual static corrections. Despite crooked nature of the line coherent images were obtained with conventional processing flow which involved DMO and post-stack migration (Figure 3). It is however apparent that shallow events migrate better than deeper events. Subsequently we selected one of the line segments for crossdip analysis and imaging tests. Crossdip analysis confirmed that line direction was favourable for shallow structures but less so for deep structures (Figure 4). To further resolve this issue we re-binned the data into 3D greed, constructed pseudo 3D velocity model and performed 3D pre-stack depth migration (Figure 5). The resulting images showed that this approach could improve image quality and help interpret complex structures.
Conclusion We show that crooked seismic lines can be utilised for and improved structural interpretation. In favourable cases, when the line track is severely deviated, crossdip analysis can be used to help build 3D velocity model. Subsequent 3D PSDM is then likely to further improve image quality and our understanding of 3D geology. However inherent in the process is poor cross-line illumination. Hence only true 3D surveys can fully resolve complex 3D structures. References Malehmir, A., Tryggvason, A., Juhlin, C., Rodriguez-Tablante, J., and Weihed, P., 2006, Tectonophysics, 426, 319-334. Nedimovic, M. R. and West, G. F., 2003, Crooked-line 2D seismic reflection imaging in crystalline terrains: Part 1, data processing. Geophysics 68, 274-285. Urosevic, M., Stoltz, E., and Massey, S., 2005, Seismic Exploration for Gold in a Hard Rock Environment – Yilgarn Craton, Western Australia: 67th Meeting, EAGE, Expanded Abstracts, G009.
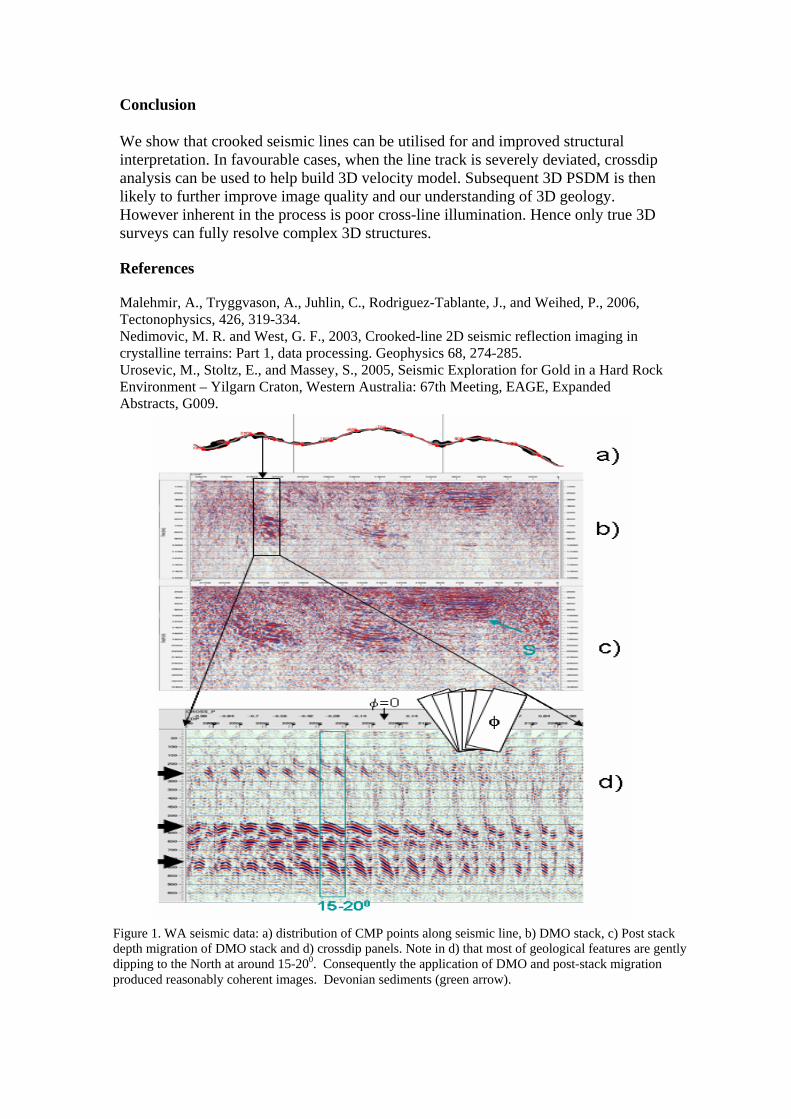
Figure 1. WA seismic data: a) distribution of CMP points along seismic line, b) DMO stack, c) Post stack depth migration of DMO stack and d) crossdip panels. Note in d) that most of geological features are gently dipping to the North at around 15-200. Consequently the application of DMO and post-stack migration produced reasonably coherent images. Devonian sediments (green arrow).

Figure 2. Seismic traverse. Several known geological structures give rise to off the plane reflections.
Figure 3. NT Seismic results: a) line track, b) DMO stack and c) post stack time migration. Note that shallow steeply dipping events SD migrate in expected positions. Deeper events (dashed blue) are stronger and more coherent in b) than in c).
SD
Figure 4. Crossdip analysis. Shallow reflections display small crossline dip angle. Dipper structural shapes appear more complex (lower panel, CMP range 600-680).
Figure 5. PSDM of crooked line segment Position of the output in-line and the corresponding image are colour connected. Note that last two images (green and blue) show most coherent images.