An Analysis of Resource Recovery Opportunities in Canada ... · An Analysis of Resource Recovery...
343
An Analysis of Resource Recovery Opportunities in Canada and the Projection of Greenhouse Gas Emission Implications March 2006 Prepared by Rob Sinclair Minerals and Metals Sector, NRCan With subcontracted assistance from Statistics Canada RIS International Kelleher Environmental Recycling Council of Alberta Government of Canada Action Plan 2000 on Climate Change
Transcript of An Analysis of Resource Recovery Opportunities in Canada ... · An Analysis of Resource Recovery...
An Analysis of Resource Recovery Opportunities in Canada and the
Projection of Greenhouse Gas Emission Implications
March 2006
Prepared by Rob Sinclair Minerals and Metals Sector, NRCan
With subcontracted assistance from � Statistics Canada � RIS International � Kelleher Environmental � Recycling Council of Alberta
Government of Canada Action Plan 2000 on
Climate Change


NRCan / RNCan i Mar-2006
Table of Contents
ACKNOWLEDGEMENTS ....................................................................................................................... IV EXECUTIVE SUMMARY .......................................................................................................................... 1 CHAPTER 1 INTRODUCTION ............................................................................................................. 6 CHAPTER 2 PROJECT OBJECTIVES ................................................................................................ 8
2.1 RESIDENTIAL SECTOR .................................................................................................................. 8 2.2 CONSTRUCTION, RENOVATION & DEMOLITION SECTOR .............................................................. 8 2.3 INDUSTRIAL, COMMERCIAL & INSTITUTIONAL SECTOR ............................................................... 8 2.4 NATIONAL PICTURE ..................................................................................................................... 8
CHAPTER 3 BACKGROUND................................................................................................................ 9 3.1 INTRODUCTION........................................................................................................................... 10 3.1 INTRODUCTION........................................................................................................................... 10 3.2 STAGE 1 – REVIEW ..................................................................................................................... 10 3.3 STAGE 2 – INVESTIGATION ......................................................................................................... 11 3.4 STAGE 3 – SURVEYS................................................................................................................... 12 3.5 STAGE 4 – DATA COLLECTION AND PROJECTIONS ..................................................................... 14 3.6 SUMMARY .................................................................................................................................. 16
CHAPTER 4 APPROACH .................................................................................................................... 17 4.1 RESIDENTIAL SECTOR ................................................................................................................ 20 4.2 INDUSTRIAL, COMMERCIAL & INSTITUTIONAL (IC&I) SECTOR ................................................. 20 4.3 CONSTRUCTION, RENOVATION & DEMOLITION (CR&D) SECTOR ............................................. 21 4.4 PRODUCT STEWARDSHIP ASSUMPTIONS..................................................................................... 24 4.5 MATERIAL PROJECTIONS............................................................................................................ 25
CHAPTER 5 BRITISH COLUMBIA ................................................................................................... 29 5.1 INTRODUCTION........................................................................................................................... 30 5.2 DEMOGRAPHICS ......................................................................................................................... 31 5.3 GENERATION, RECYCLING AND DISPOSAL BY SECTOR .............................................................. 32 5.4 WASTE COMPOSITION ................................................................................................................ 36 5.5 B.C. SUMMARY.......................................................................................................................... 41
CHAPTER 6 ALBERTA ....................................................................................................................... 43 6.1 INTRODUCTION........................................................................................................................... 44 6.2 DEMOGRAPHICS ......................................................................................................................... 44 6.3 GENERATION, RECYCLING AND DISPOSAL BY SECTOR .............................................................. 45 6.4 WASTE COMPOSITION ................................................................................................................ 50 6.5 ALBERTA SUMMARY .................................................................................................................. 55
CHAPTER 7 SASKATCHEWAN ......................................................................................................... 57 7.1 INTRODUCTION........................................................................................................................... 58 7.2 DEMOGRAPHICS ......................................................................................................................... 58 7.3 GENERATION, RECYCLING AND DISPOSAL BY SECTOR .............................................................. 59 7.4 WASTE COMPOSITION ................................................................................................................ 63 7.5 SASKATCHEWAN SUMMARY ...................................................................................................... 67
CHAPTER 8 MANITOBA .................................................................................................................... 69 8.1 INTRODUCTION........................................................................................................................... 70 8.2 DEMOGRAPHICS ......................................................................................................................... 71 8.3 GENERATION, RECYCLING AND DISPOSAL BY SECTOR .............................................................. 72

NRCan / RNCan ii Mar-2006
8.4 WASTE COMPOSITION ................................................................................................................ 76 8.5 MANITOBA SUMMARY ............................................................................................................... 80
CHAPTER 9 ONTARIO ....................................................................................................................... 83 9.1 INTRODUCTION........................................................................................................................... 84 9.2 DEMOGRAPHICS ......................................................................................................................... 84 9.3 GENERATION, RECYCLING AND DISPOSAL BY SECTOR .............................................................. 86 9.4 WASTE COMPOSITION ................................................................................................................ 90 9.5 ONTARIO SUMMARY .................................................................................................................. 95
CHAPTER 10 QUEBEC ......................................................................................................................... 99 10.1 INTRODUCTION......................................................................................................................... 100 10.2 DEMOGRAPHICS ....................................................................................................................... 101 10.3 GENERATION, RECYCLING AND DISPOSAL BY SECTOR ............................................................ 102 10.4 WASTE COMPOSITION .............................................................................................................. 105 10.5 QUEBEC SUMMARY .................................................................................................................. 109
CHAPTER 11 NEW BRUNSWICK...................................................................................................... 113 11.1 INTRODUCTION......................................................................................................................... 114 11.2 DEMOGRAPHICS ....................................................................................................................... 115 11.3 GENERATION, RECYCLING AND DISPOSAL BY SECTOR ............................................................ 115 11.4 WASTE COMPOSITION .............................................................................................................. 119 11.5 NEW BRUNSWICK SUMMARY ................................................................................................... 123
CHAPTER 12 NOVA SCOTIA ............................................................................................................. 127 12.1 INTRODUCTION......................................................................................................................... 128 12.2 DEMOGRAPHICS ....................................................................................................................... 129 12.3 GENERATION, RECYCLING AND DISPOSAL BY SECTOR ............................................................ 130 12.4 WASTE COMPOSITION .............................................................................................................. 134 12.5 NOVA SCOTIA SUMMARY......................................................................................................... 138
CHAPTER 13 PRINCE EDWARD ISLAND....................................................................................... 141 13.1 INTRODUCTION......................................................................................................................... 142 13.2 DEMOGRAPHICS ....................................................................................................................... 142 13.3 GENERATION, DIVERSION AND DISPOSAL BY SECTOR ............................................................. 143 13.4 WASTE COMPOSITION .............................................................................................................. 147 13.5 PRINCE EDWARD ISLAND SUMMARY ....................................................................................... 151
CHAPTER 14 NEWFOUNDLAND AND LABRADOR...................................................................... 153 14.1 INTRODUCTION......................................................................................................................... 154 14.2 DEMOGRAPHICS ....................................................................................................................... 154 14.3 GENERATION, RECYCLING AND DISPOSAL ............................................................................... 155 14.4 WASTE COMPOSITION .............................................................................................................. 157 14.5 NEWFOUNDLAND AND LABRADOR SUMMARY ......................................................................... 161
CHAPTER 15 THE YUKON TERRITORY, NORTHWEST TERRITORY AND NUNAVUT.......... 163 15.1 INTRODUCTION......................................................................................................................... 164 15.2 DEMOGRAPHICS ....................................................................................................................... 165 15.3 GENERATION, RECYCLING AND DISPOSAL ............................................................................... 165 15.4 WASTE COMPOSITION .............................................................................................................. 169 15.5 YUKON TERRITORY, NORTHWEST TERRITORY AND NUNAVUT SUMMARY .............................. 171
CHAPTER 16 IC&I AND CR&D WASTE GENERATION COEFFICIENT PROJECTION APPROACH 175
16.1 INTRODUCTION......................................................................................................................... 176 16.2 COEFFICIENT MODELING CONCEPT.......................................................................................... 177

NRCan / RNCan iii Mar-2006
16.3 WASTE GENERATION AND CHARACTERIZATION DATA FOR THE IC&I SECTOR ....................... 180 16.4 WASTE GENERATION AND CHARACTERIZATION DATA FOR THE CR&D SECTOR..................... 185 16.5 SUMMARY ................................................................................................................................ 187
CHAPTER 17 SELECTED MINERAL AND METAL RESIDUAL MATERIALS ........................... 189 17.1 INTRODUCTION......................................................................................................................... 190 17.2 RESIDENTIAL AND IC&I SECTORS............................................................................................ 191 17.3 CIVIL ENGINEERING SECTOR.................................................................................................... 209 17.4 INDUSTRIAL SECTOR ................................................................................................................ 223
CHAPTER 18 SUMMARY PROJECTIONS AND GREENHOUSE GAS IMPLICATIONS ........... 247 18.1 INTRODUCTION......................................................................................................................... 248 18.2 SUMMARY OF MATERIALS DISPOSED BY SECTOR .................................................................... 248 18.3 RECOVERY PROJECTIONS ......................................................................................................... 253 18.4 THE GREENHOUSE GAS BENEFIT OF RECYCLING ..................................................................... 259 18.5 SUMMARY ................................................................................................................................ 268
CHAPTER 19 CONCLUSIONS, LIMITATIONS AND RECOMMENDATIONS ............................ 270 19.1 CONCLUSIONS .......................................................................................................................... 270 19.2 LIMITATIONS ............................................................................................................................ 274 19.3 RECOMMENDATIONS ................................................................................................................ 275
APPENDIX A – ISSUES IN WASTE MEASUREMENT WORKSHOP................................................ 276 APPENDIX B - SECOND ANNUAL WASTE AND RECYCLING MEASUREMENT WORKSHOP . 280 APPENDIX C – LIST OF WASTE AUDIT REPORTS .......................................................................... 288 APPENDIX D- PROVINCIAL WASTE CHARACTERIZATION FRAMEWORK............................... 292 APPENDIX E – COMPOSITION OF CR&D WASTE WITHIN THE REGIONAL MUNICIPALITY OF OTTAWA............................................................................................................................................. 335 APPENDIX F – GHG CALCULATIONS FOR ZINC AND LEAD........................................................ 336

NRCan / RNCan iv Mar-2006
Acknowledgements
Enhanced Recycling, Action Plan 2000 on Climate Change, Minerals and Metals Program — The Government of Canada Action Plan 2000 on Climate Change Minerals and Metals Program, managed by the Minerals and Metals Sector of Natural Resources Canada, is working towards reducing Canada’s greenhouse gas (GHG) emissions from the minerals and metals sector. By matching funds with other partners, this program supports initiatives that enhance recycling practices and provide GHG emission reductions. Additional resources were brought to bear during the development of this report and without their input this project would not have reached its successful completion. Statistics Canada provided detailed national employment data that was used to project the generation of recyclable materials in eighteen different IC&I categories. RIS International assembled and summarized IC&I fifty-seven distinct characterization data sets from thirteen different studies. Kelleher Environmental was contracted to compile information (quantities and recycling activities) concerning spent foundry sands, asphalt, electric arc furnace dust and automobiles (including automobile shredder residue and catalytic converters). In March 2004, the Recycling Council of Alberta (RCA) was hired to coordinate and facilitate the first national workshop on waste and recycling measurement in Banff. This event was co-funded by Alberta Environment and Corporations Supporting Recycling. A second data workshop was held in Mont Orford, Quebec in May 2005 to continue the efforts of this national group – the second event was coordinated by Front Commun and was co-funded by Environment Canada and RECYC-Quebec. (Workshop summaries are provided in Appendices A and B). To further the state of waste and recycling measurement in Canada, three projects were supported: The Nova Scotia Department of Environment and Labour was commissioned to prepare a guidance document for other provinces interesting in building their own web-based data call system. Similarly, support was provided to the Saskatchewan Waste Reduction Council to help them conduct their first province based waste and recycling data call. Finally an RCA project was co-funded with Alberta Environment to establish appropriate protocol and methodology for province-waste characterization work (attached in Appendix D).

NRCan / RNCan 1 Mar-2006
Executive Summary The underlying premise of this report is that increased recycling of residual materials decreases the overall amount of energy required to manufacture new products and, in so doing, reduces greenhouse gas (GHG) emissions. The relationship between recycling, energy and GHG emissions is relatively new but in fact is the principle upon which the Enhanced Recycling, Action Plan 2000 on Climate Change, Minerals and Metals Program was based. This funding program provided all of the support required to complete this project on waste and recycling statistics. More information about the Enhanced Recycling program and the other projects it supported can be found on the Natural Resources Canada web site.1 The two essential goals of this report were (1) to identify and quantify recyclable materials that are currently disposed of in Canada and to develop approximate recovery projections; and (2), to estimate the associated GHG emission reduction potential. ��������������� Data concerning the first goal were assembled from a variety of sources that are referenced throughout this document. The Statistics Canada biennial Waste Management Industry Survey 2002 formed the cornerstone for the projections made in the three sectors that helped frame this undertaking: Residential, IC&I (institutional, commercial and industrial) and CR&D (construction, renovation and demolition). Review and reconciliation of available waste disposal numbers in each province was followed by the application of locally relevant characterization data. Exhibit1 provides a summary and a starting point for estimating potential recovery levels.
Exhibit 1: Composition of Materials Disposed of in Canada, 2002 (tonnes)
Material Residential IC&I CR&D Totals
Paper Glass Ferrous Nonferrous Plastics Organics Wood Renovation Textiles & rubber Multi-material Haz-waste Other Concrete Asphalt Drywall
2,072,000 432,000 277,000
65,000 890,000
4,233,000 70,000 90,000
154,000 73,000 78,000
1,022,000
4,807,000 333,000 538,000
81,000 1,326,000 2,472,000
808,000 369,000 294,000
68,000 26,000
430,000
33,000
24,000 80,000
875,000
826,000 459,000 216,000 315,000
6,912,000 765,000 839,000 226,000
2,216,000 6,705,000 1,753,000
459,000 448,000 141,000 104,000
2,278,000 459,000 216,000 315,000
Total
9,456,000 11,552,000 2,828,000 23,836,000
Numbers are rounded. Some residual error is present.
1 See Recycling in Canada at http://www.recycle.nrcan.gc.ca/enhanced_e.htm

The Government of Canada Action Plan 2000 on Climate Change
NRCan / RNCan 2 Mar-2006
A fourth “sector” was developed during the course of this study to cover residual materials that are not considered within the three sectors represented in Exhibit 1. In fact, truly industrial residual materials probably fall outside the domain of most conventional “recyclers”. Since one of the important aspects of this study is minerals and metals, an attempt was made to identify separate material residual streams that could be recovered for the purposes of reducing GHG emissions. Exhibit 2 identifies these materials and provides some quantity estimates. Exhibit 2: Summary of Selected Mineral and Metal Materials Disposed in Canada
in 2002 (tonnes)
Sector and Material Categories
Disposed or Stockpiled
Rounded Tonnes
Residential and IC&I Sectors Tires (off the road) White Goods Automobile Shredder Residue
172,500 - 345,000 t
16,720 - 54,340 t 357,000 t
259,000
36,000 357,000
Civil Engineering Sector Concrete
1.87 Mt
1,874,000
Industrial Sector Electric Arc Furnace Dust Coal Ash (fly + bottom) Ferrous Slag Nonferrous Slag Foundry Sand
66,000 - 165,000 t
3.8 - 5.2 Mt 300,000 t 1.65 Mt
351,000 - 585,000 t
116,000
4,500,000 300,000
1,650,000 468,000
Total
9,560,000
The concrete in Exhibit 2 is assumed to be material that is managed outside the Statistics Canada waste management framework, mostly as a result of civil engineering projects such as roads and bridges. Most of the concrete in Exhibit 1 is assumed to be building related. In previous years a large amount of asphalt pavement would also be included in Exhibit 2 but project research suggests that most reclaimed asphalt is already being reused either in situ or via reprocessing facilities. Not included in Exhibit 2 is 180,000 tonnes of electrical and electronic waste under the assumption that this material is already accounted for in Exhibit 1. ������������������ There are many uncertainties when attempting to project material recovery rates. Macro level influences that may lead to increased resource efficiency include the rising cost of energy, the expanding global demand for primary and secondary materials and the growing pressure on landfill disposal capacity. At the micro level, material recovery is affected by issues such as type of collection program, contamination, access to markets, recyclable versus non-recyclable (e.g. office paper vs. tissue, plate glass vs. glass bottles, etc.), public participation rates and quality of participation.
The Government of Canada Action Plan 2000 on Climate Change
NRCan / RNCan 3 Mar-2006
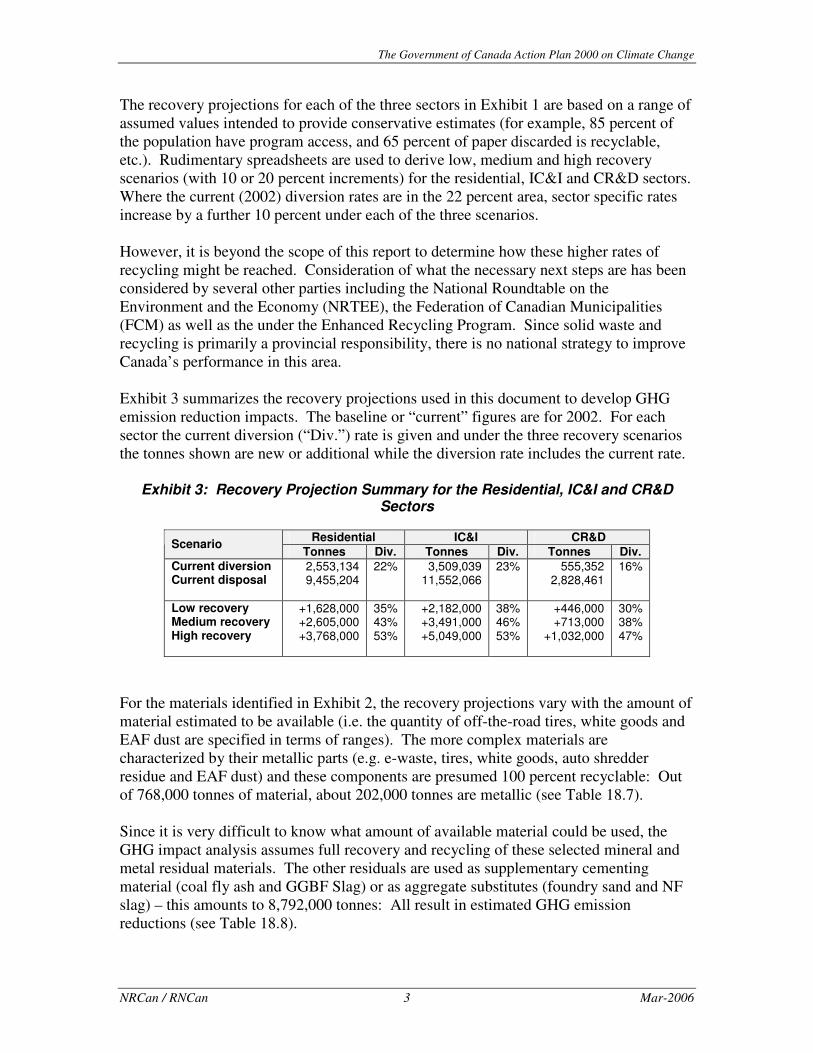
The recovery projections for each of the three sectors in Exhibit 1 are based on a range of assumed values intended to provide conservative estimates (for example, 85 percent of the population have program access, and 65 percent of paper discarded is recyclable, etc.). Rudimentary spreadsheets are used to derive low, medium and high recovery scenarios (with 10 or 20 percent increments) for the residential, IC&I and CR&D sectors. Where the current (2002) diversion rates are in the 22 percent area, sector specific rates increase by a further 10 percent under each of the three scenarios. However, it is beyond the scope of this report to determine how these higher rates of recycling might be reached. Consideration of what the necessary next steps are has been considered by several other parties including the National Roundtable on the Environment and the Economy (NRTEE), the Federation of Canadian Municipalities (FCM) as well as the under the Enhanced Recycling Program. Since solid waste and recycling is primarily a provincial responsibility, there is no national strategy to improve Canada’s performance in this area. Exhibit 3 summarizes the recovery projections used in this document to develop GHG emission reduction impacts. The baseline or “current” figures are for 2002. For each sector the current diversion (“Div.”) rate is given and under the three recovery scenarios the tonnes shown are new or additional while the diversion rate includes the current rate.
Exhibit 3: Recovery Projection Summary for the Residential, IC&I and CR&D Sectors
Residential IC&I CR&D Scenario
Tonnes Div. Tonnes Div. Tonnes Div. Current diversion Current disposal
2,553,134 9,455,204
22% 3,509,039 11,552,066
23% 555,352 2,828,461
16%
Low recovery Medium recovery High recovery
+1,628,000 +2,605,000 +3,768,000
35% 43% 53%
+2,182,000 +3,491,000 +5,049,000
38% 46% 53%
+446,000 +713,000
+1,032,000
30% 38% 47%
For the materials identified in Exhibit 2, the recovery projections vary with the amount of material estimated to be available (i.e. the quantity of off-the-road tires, white goods and EAF dust are specified in terms of ranges). The more complex materials are characterized by their metallic parts (e.g. e-waste, tires, white goods, auto shredder residue and EAF dust) and these components are presumed 100 percent recyclable: Out of 768,000 tonnes of material, about 202,000 tonnes are metallic (see Table 18.7). Since it is very difficult to know what amount of available material could be used, the GHG impact analysis assumes full recovery and recycling of these selected mineral and metal residual materials. The other residuals are used as supplementary cementing material (coal fly ash and GGBF Slag) or as aggregate substitutes (foundry sand and NF slag) – this amounts to 8,792,000 tonnes: All result in estimated GHG emission reductions (see Table 18.8).

The Government of Canada Action Plan 2000 on Climate Change
NRCan / RNCan 4 Mar-2006
���������� ������������������� The GHG emission reduction factors used in this report are drawn from several sources, as discussed in Section 18.4. These factors are based on life cycle analyses that compare the recycling of material to landfill disposal – part of this assessment is the energy required to make a new material or product from recycled inputs versus primary. Exhibit 4 illustrates the benefit of recycling versus the use of primary (virgin) feedstock. For example, making soft drink cans out of recycled aluminum requires about 85 percent less energy than using primary materials. This correlates directly with reduced GHG emissions. The “current mix” demonstrates the point that all of the identified materials already have recycled content.2
Exhibit 4: Recycling Saves Energy The unit of measurement for global warming potential is tonnes of carbon dioxide equivalents (tonnes CO2e). There is a direct correlation between giga joules (energy use) and tonnes CO2e but it depends on whether the energy source is fossil or non-fossil (coal, natural gas, diesel versus hydro, nuclear or biomass). The average fossil fuel GHG impact is about 0.073 tonnes CO2e per giga joule whereas non-fossil sources are close to zero. Exhibit 4 is based on a mix of energy sources using provincial production weighted averages. The final step taken in this report is the application of the GHG emission reduction factors to the material recovery projections. Under a low material recovery scenario, the estimated GHG benefit is estimated to be 6,457,000 tonne CO2e per year. Under a high
2 Old Newsprint, 19%; Old Corrugated Cardboard 30%; Aluminum 52%; Steel 14%; Copper wire 5%; Glass bottles 30%; High Density Polyethylene15% and Polyethylene Terephthalate 29% (these data plus the chart data are from ICF Consulting Inc.).
Giga Joules
per Tonne
0
20
40
60
80
100
120
140
PETONP OCC HDPEGlassCopperSteelAlum.
Primary
Recycled
Current mix
Feedstock
Giga Joules
per Tonne
0
20
40
60
80
100
120
140
PETONP OCC HDPEGlassCopperSteelAlum.
Primary
Recycled
Current mix
Feedstock

The Government of Canada Action Plan 2000 on Climate Change
NRCan / RNCan 5 Mar-2006
recovery scenario the estimated GHG impact almost doubles to 12,638,000 tonnes CO2e per year. Exhibit 5 summarizes:
Exhibit 5: Summary of Projected GHG Emission Reductions
Sector Low recovery
scenario (tonnes CO2e)
High recovery scenario
(tonnes CO2e) Residential IC&I CR&D Selected M&M
1,931,000 2,471,000
165,000 1,890,000
4,470,000 5,717,000
384,000 2,067,000
Total
6,457,000 12,638,000
����������
Recycling is already an integral part of the Canadian economy. In fact, it is difficult to delineate let alone measure the extent of recycling in Canada since there are many residual materials that were once considered worthless but are now considered as marketable products. However, about 33 million tonnes of residual materials are still disposed of in 2002: The first challenge is to identify the part that is of continuing value. The second challenge is to determine what policies and programs will support increased recovery that is economically and environmentally viable. It is clear from the analysis undertaken in this study that significant GHG emission reductions are associated with increased recycling. The materials that are recyclable are largely known but this is perhaps the first study to assemble local waste characterization data and then aggregate provincial and territorial projections at a national level for the purposes of estimating the tonnage of recyclables potentially available. This may also be the first study to gather data on a wide variety of selected industrial mineral and metal process residuals such as coal ash, slag, foundry sand, off-the-road tires, white goods, e-waste and automobile shredder residue. A great deal more work needs to be conducted to better understand these parts of the economy. Given the premise of this study, it is not surprising that key recommendations revolve around the long term quest for improved measurement and better data.
� Waste characterization data should be assembled by a central agency on an ongoing basis and made available to all interested parties.
� Data collection and consolidation activities through strategic partnerships will help reduce response burdens as well as verification and synthesis tasks.
� Like minded individuals should work collaboratively to address issues regarding waste measurement and data on an ongoing, national basis.
� More work needs to be done to merge life cycle analysis, GHG emission factors and recycling practices.

NRCan / RNCan 6 Mar-2006
Chapter 1 Introduction The Action Plan 2000, Climate Change, Enhanced Recycling Steering Committee approved the Recycling Statistics project in June 2002. The goal of this project has been to collect and compile data that details the supply and demand sides of recycling in Canada, particularly with respect to metals and minerals. Natural Resources Canada (NRCan) conducted this project with small sub-contracts to Statistics Canada, RIS International, Kelleher Environmental and the Recycling Council of Alberta (RCA) – the information and reports prepared under these contracts has informed significant parts of this report. Additional project funding was provided to RCA and Front Commun (Quebec) to coordinate two waste and recycling measurement workshops reported on in Chapter 3. Whereas the Enhanced Recycling program is a Government of Canada initiative, it is acknowledged that solid waste management (including recycling) is a provincial responsibility. As a result, each province (and territory) has developed its own approach to addressing solid waste as a societal issue within its jurisdiction. Nevertheless, the two measurement workshops were conducted to facilitate the exchange of lessons learned and to help interested provinces “leap forward” in this area. The Government of Canada’s general interest in waste and recycling is derived from the following factors: climate change, international reporting obligations, sustainable development, economic growth and global competitiveness, job creation, and pollution prevention. The specific impetus for this project however is climate change. A large amount of material that could be recycled is being disposed of and since recycling is energy efficient with significant associated greenhouse gas (GHG) savings, it is important that the flow of “secondary” materials be measured and understood. Figure 1.1 illustrates the concept:
Figure 1.1: The Benefit of Recycling
Increased recycling
Reduced energy use in manufacturing
Reduced greenhouse gas
emissions Cleaner air

The Government of Canada Action Plan 2000 on Climate Change
NRCan / RNCan 7 Mar-2006
While the term “secondary” may be considered pejorative by some, it does provide a simple distinction between it and virgin or primary feedstock. In the context of this report, “secondary” means that the material is or has the potential of being recovered from the waste stream rather than from a naturally occurring source (e.g. mineral deposit or forest). Over the course of this project it has become evident that a major information gap exists in Canada regarding data on both the supply and demand for recyclable minerals and metals. Without a reliable statistical base for the production and use (consumption) of recyclable materials, no defensible policy or program work can be conducted. It is a well-known cliché but “you cannot manage what you do not measure”. ����������������
Chapters 2 and 3 identify the goals of this data project and provide an overview of background work that led to the approach adopted. In Chapter 4 the methodological underpinnings of the project are discussed. Beginning in Chapter 5, an analysis of solid waste generation (with a focus on what is still being disposed) and composition is conducted for each province. The three territories are covered together in Chapter 15. In Chapters 16 and 17, alternate approaches regarding the IC&I and CR&D sector are covered. The discussion outcomes are used to modify the projections made in each province using waste composition data (Chapters 5 to 15). Chapter 18 summarizes the new projections and provides a national picture regarding the magnitude of resource recovery opportunities (i.e. materials currently disposed of) in this country. In the final analysis, there are two aspects to consider: What level of recycling is possible and what is the greenhouse gas emission implication of increased recovery under various scenarios? These are also discussed in Chapter 18.
NRCan / RNCan 8 Mar-2006
Chapter 2 Project Objectives The objectives for this project are presented within the context of the framework referenced in the introduction: 2.1 Residential Sector
� To assemble residential waste characterization studies from across the country with a view towards the development of regionally appropriate numbers.
� To estimate the amount of recyclable material that is being disposed of by province and to draw a distinction between urban and rural sources where possible.
2.2 Construction, Renovation & Demolition Sector
� To determine if there is a significant difference in the construction, renovation and demolition waste sub-streams.
� To identify materials that could be recycled but that are being disposed of. � To project the amount of waste material that could be diverted if markets existed,
by province. 2.3 Industrial, Commercial & Institutional Sector
� To identify sub-sectors that makes sense from a waste generation perspective. � To develop a means of estimating the composition by sub-sector group and
extrapolating these findings across the country. � To assemble data on special mineral and metals wastes that are managed within
the residential and IC&I sectors, the civil engineering sector, and the industrial sector.
� To quantify recyclable materials that could be targeted for diversion. 2.4 National Picture
� To develop a material flow overview for Canada in which the type, quantity and general location of recyclable material is indicated.
� To estimate the greenhouse gas emission reduction potential associated with increased recycling activities.
NRCan / RNCan 9 Mar-2006
Chapter 3 Background
3.1 INTRODUCTION........................................................................................................................... 10 3.2 STAGE 1 – REVIEW ..................................................................................................................... 10
3.2.1 Identification of key framework areas .................................................................................. 10 3.2.2 Assemblage of Industry Listings ........................................................................................... 11
3.3 STAGE 2 – INVESTIGATION ......................................................................................................... 11
3.3.1 Review of existing survey instruments .................................................................................. 11 3.3.2 Identification of Data Gaps .................................................................................................. 12
3.4 STAGE 3 – SURVEYS................................................................................................................... 12
3.4.1 Supply Side Survey................................................................................................................ 12 3.4.2 Demand Side Data................................................................................................................ 12 3.4.3 Trade Statistics and Codes ................................................................................................... 13 3.4.4 Potentially Available Scrap .................................................................................................. 13 3.4.5 Input-Output Tables.............................................................................................................. 13
3.5 STAGE 4 – DATA COLLECTION AND PROJECTIONS ..................................................................... 14
3.5.1 Waste Management Industry Survey..................................................................................... 14 3.5.2 Provincial Data Collection................................................................................................... 14 3.5.3 Waste Composition Analyses ................................................................................................ 15
3.6 SUMMARY .................................................................................................................................. 16

The Government of Canada Action Plan 2000 on Climate Change
NRCan / RNCan 10 Mar-2006
3.1 Introduction The Recycling Statistics project was approved by the Action Plan 2000 on Climate Change, Enhanced Recycling Steering Committee in June 2002. The underlying goal of this project is to collect and compile data that details the supply and demand sides of recycling, particularly with respect to metals and minerals. It is widely understood that a large amount of material that could be recycled is being disposed of and since recycling is an energy efficient activity with significant associated GHG savings, it is important that the flow of secondary materials be measured to the best of our ability. When this project was first conceived, the work was organized into four stages. In this chapter these stages will be summarized to establish project context. Stage 1: Review recycling activities and players and identify two or more options for
collecting improved recycling data. Stage 2: Conduct a detailed investigation to determine the most promising data
collection method. Stage 3: Select/enhance preferred survey tool and conduct pilot data collection. Stage 4: Implement full-scale data collection. While the first three stages were undertaken in earnest, it was soon realized that some revision of the work scope in stage four was required to take into account new approaches being developed to achieve the project’s objectives. In fact, some aspects of the work diverged from the plan as a result of increased understanding of the nature of the recycling business and better or worse data. In 2003 a “consolidation” report was prepared to summarize activities to date and to identify next steps. The following sections provide an overview of this work. 3.2 Stage 1 – Review
3.2.1 Identification of key framework areas Solid waste is generated in all sectors of the Canadian economy. In order to manage the task of monitoring the flow of this material, three framework areas have been established:
� Residential – All solid non-hazardous waste generated by Canadian households is largely the responsibility of local municipalities. This responsibility may be provided by in-house staff or contracted to private firms.
� Industrial, commercial and institutional (IC&I) – IC&I waste may or may not be the responsibility of the local municipality depending on local circumstances. It is typically managed by the private sector.
� Construction, renovation and demolition (CR&D) – CR&D is considered a distinct stream of waste primarily because of its composition rather than its origin.

The Government of Canada Action Plan 2000 on Climate Change
NRCan / RNCan 11 Mar-2006
Other than small amounts of household CR&D, this material is managed by the private sector.
3.2.2 Assemblage of Industry Listings Legwork Environmental Inc. conducted preliminary work in 2000 to identify recycling firms that process metal scrap. This listing was then posted on the NRCan “Recycling in Canada” web site (www.recycle.nrcan.gc.ca). The web site also has a registration form that allows interested firms to list themselves. The Recycling Council of Alberta conducted another Action Plan 2000 project entitled “Scan of Metals and Minerals Recycling Programs and Associated Climate Change Impacts”3. One of the outcomes of the project was a revised listing of firms involved in the recycling of scrap metal across Canada. This updated list replaced the initial Legwork list on NRCan’s Recycling in Canada web site in September 2003.4 3.3 Stage 2 – Investigation
3.3.1 Review of existing survey instruments The two principle sources of minerals and metals data are the Minerals and Mining Statistics Division (MMSD) of Natural Resources Canada and the Manufacturing, Construction and Energy Division (MCED) of Statistics Canada. MMSD assembles production and use data for non-ferrous and stainless steel materials. NRCan assumed this responsibility many years ago because MMSD has dedicated survey staff and specialized subject matter experts that are available in the Minerals and Metals Policy Branch. The primary limitation of this approach is that the MMSD surveys are independently developed and as such may not benefit from the overall framework model utilized by Statistics Canada. MCED conducts the Annual Survey of Manufacturing (ASM) that includes production and use data in dollars and tonnes for ferrous and nonferrous materials. However, the best data for ferrous scrap use is found in the monthly “Steel, Primary Forms, Steel Castings and Pig Iron Survey” also conducted by MCED. In a comparison made by Statistics Canada, it seems that the MMSD nonferrous data were more accurate and timely. In any case, the ASM is gradually reducing its emphasis on physical quantity data with a move towards monetary data.
3 See http://www.recycle.ab.ca/info_01.htm for the full report. 4 It should be noted that the Canadian Metals and Minerals Recycling Database grows via self-registration and, as a result, some of the businesses listed are brokers and dealers without actual recycling operations. The database can be found at http://www.recycle.nrcan.gc.ca/recyclingdb.asp.

The Government of Canada Action Plan 2000 on Climate Change
NRCan / RNCan 12 Mar-2006
3.3.2 Identification of Data Gaps The chief justification for this project is the fact that there are major information gaps regarding the supply and demand for recyclable metals and minerals. Statistics Canada and NRCan collect various data and efforts to collate these and the assessment of their combined efficacy is reported on in the following section.
3.4 Stage 3 – Surveys
3.4.1 Supply Side Survey The initial strategy for measuring the flow of recyclable materials was to concentrate on the supply side and to do this by conducting a survey of metal scrap dealers. A preliminary “survey” was undertaken by Statistics Canada in the first quarter of 2001 and it was determined that such data would be inaccurate for the following reasons:
� High likelihood of double-counting (small dealers sell to large ones) � Confusion between old and new scrap � Some new scrap by-passes scrap dealers altogether � Reporting on related surveys (ASM) has been quite poor
A consensus was reached that “home” or “new” scrap should not be counted as “recycling” since that material is efficiently managed as a matter of course. The material of primary interest is “old” or “post-consumer” scrap or waste because it is destined for disposal if no recovery system is in place. This perspective is consistent with Statistics Canada who further concluded that the best sources for gathering recycling statistics are the smelters, mills and foundries and not the scrap dealers.
3.4.2 Demand Side Data An alternative method for determining the supply of metal scrap was identified. This approach is based on the premise that scrap supply could be estimated by adding scrap exports to total use of scrap and subtracting scrap imports. Use (or consumption) surveys are conducted for ferrous and nonferrous material by Statistics Canada and MMSD, respectively – these surveys are reliable and the data are of good quality. Further, the Trade Retrieval and Aggregate System (TRAGS) tracks exports and imports but with incomplete distinctions between old and new scrap. MMSD have attempted to modify their use of surveys for aluminum, copper and magnesium particularly with respect to the distinction between old and new scrap. Other metals such as lead, zinc and nickel are mostly used in the production of alloys or coatings, so their recovery is more difficult to measure. There is presently no effort to modify surveys for these other metals as to the quantity of scrap recovered.

The Government of Canada Action Plan 2000 on Climate Change
NRCan / RNCan 13 Mar-2006
3.4.3 Trade Statistics and Codes There is some difficulty in comparing data that are classified according to different systems: i.e., the North American Industrial Classification System (NAICS) versus the Harmonized System (HS). The trade data in TRAGS are classified according to HS. The Statistics Canada surveys are organized according to NAICS. The NAICS system contains four categories for recycling data and collection but they do not comply with the three key framework areas of residential, CR&D and IC&I. Any changes to these codes would involve international negotiations and a great deal of time.
3.4.4 Potentially Available Scrap The measurement of recycling is a complex undertaking. It was determined that to calculate the correct ratio or assessment of recycling, it is necessary to divide the total amount of scrap recycled by the total amount available. Most indicators divide recovered materials by current production figures. This may be an incorrect approach since the current mix of scrap is likely to have been produced in prior years. As a result, Statistics Canada proposed that potentially available scrap should be based on the historical consumption (use) of goods and the service life of such items. This discussion led to input-output tables, which are being compared with the survey tools being used concurrently.
3.4.5 Input-Output Tables Input-output tables typically deal in dollars. Statistics Canada converted dollars to tonnes in an effort to estimate the quantity of metal scrap that should be potentially available. In summary, there are a number of weaknesses in the approach that suggest that these estimates should not be solely relied upon. Specifically:
� It is very difficult to estimate the service life for capital goods (which is based on Statistics Canada Capital and Repair Expenditures Survey).
� The composition of the goods in question changes over time and composition tracking data are sparse.
� The flow of goods in and out of the country confuses domestic production data (since Canada exports more than it imports, e.g., automobiles).
Nevertheless, Statistics Canada produced a summary paper on the input-output table work as it relates to the projection of potentially available recyclable materials. The initial focus was ferrous metal, specifically large appliances and motor vehicles but aluminum and copper were to be added.5 5 Readers interested in input-output tables should contact Statistics Canada directly. No further information is provided in this report.

The Government of Canada Action Plan 2000 on Climate Change
NRCan / RNCan 14 Mar-2006
3.5 Stage 4 – Data Collection and Projections
3.5.1 Waste Management Industry Survey The Statistics Canada Waste Management Industry Survey (WMIS) is conducted every two years or biennially and includes both governments and businesses. The latest report (issued March 2005) covers 2002.6 The primary source of recycling data for this survey is publicly and privately owned material recovery facilities. Disposal data have been collected from landfill and incinerator facility owners by Statistics Canada. This survey provides an excellent compilation of solid waste generation, diversion and disposal and organizes the data by province as well as by sector (the sectors coincide with the three key framework areas of this project: residential, CR&D and IC&I). While some breakdown is provided for the type of materials that are recycled, no composition data are provided for either the total amount of solid waste generated or the amount that is disposed of. WMIS 2002 provides most of the baseline waste data by province, although in some cases gaps are bridged by contacting provincial representatives or, if necessary, making assumptions where the data are incomplete or missing. Where some provinces are collecting the same data (e.g. Quebec, Nova Scotia and Ontario), Statistics Canada is working with them to reduce response burden by possibly phasing out parts of WMIS.
3.5.2 Provincial Data Collection Given the overlap between resource recovery and waste management, a better understanding of the generation and composition of solid waste became the project’s new focus in 2004. Provinces and municipalities were contacted across Canada in order to assemble as much available data as could be found. After several months’ activity, it became apparent that significant data gaps persist and therefore further effort would be well spent in helping the provinces develop systems to gather good solid waste data on a regular basis. The first national waste measurement workshop was co-funded by Action Plan 2000, Alberta Environment and Corporations Supporting Recycling and was held in Banff, March 2004. A summary of the discussions and presentations is provided in Appendix A. The second national workshop was co-funded by Action Plan 2000, RECYC-Quebec and Environment Canada and was held in Jouvence, Quebec, May 2005. Appendix B contains a summary of the second workshop. The outcome of the two data workshops has been better communication among the provinces and with interested Government of Canada departments (Statistics Canada, Environment Canada and Natural Resources Canada).
6 WMIS is available at http://www.statcan.ca:8096/bsolc/english/bsolc?catno=16F0023X (Feb-2006)

The Government of Canada Action Plan 2000 on Climate Change
NRCan / RNCan 15 Mar-2006
Some project funds were used to support the introduction of state-of-the-art provincial data collection programs. After discussions with Corporations Supporting Recycling that developed the Ontario data call program, the Province of Nova Scotia decided to build its own web-based data collection system. Dialogue between the two players was maintained throughout to make sure that the core data in the two systems were comparable. During this effort, provincial staff documented their efforts for the purposes of sharing lessons learned with the other provinces.7 Following the Nova Scotia work, Saskatchewan conducted its first ever detailed data collection study.8
3.5.3 Waste Composition Analyses Some municipalities and businesses conduct solid waste composition audits on a regular basis. For the most part, these audits produce data that are indicative of major trends rather than data that can be used for statistical reporting. For the purposes of this project, waste characterization data provide a reasonable estimate for potentially recyclable materials that are being discarded. With respect to the three framework areas, residential solid waste has been audited most frequently so sundry reports are available across the country and many of these were gathered and reviewed for this project. Second, CR&D waste data have also been characterized in several Canadian jurisdictions and some of those reports were also accessed during this project. The third framework area is IC&I. Waste composition data from this sector is relatively poor although municipalities – where some of this material impacts local handling or disposal systems – have made some attempts to quantify and define tonnages from this sector. Given the mix and diversity of generators and materials, waste audits typically break the IC&I sector into sub-sectors such as restaurants, hotel, medical, educational, light or heavy manufacturing and office buildings (etc.). Large mineral or metal industries that are remotely located are generally not included in IC&I data that are assembled by municipalities. An alternative method for estimating the amount of solid waste generated by the IC&I sector is covered in Chapter 16. It involves the association of waste generation with either number of employees or revenue earned. In the case of employees (or students or patients etc.), this approach has been used in Canada previously but is likely to be 10 years or older. This approach is also discussed in the Recycling Council Alberta report on a provincial framework referenced in the next chapter.
7 Contact Bob Kenney, Nova Scotia Department of Environment and Labour for more details. 8 Contact Joanne Fedyk, Saskatchewan Waste Reduction Council for more information.

The Government of Canada Action Plan 2000 on Climate Change
NRCan / RNCan 16 Mar-2006
3.6 Summary The Statistics Canada WMIS 2002 data are used as the basis for developing estimates for the availability of potentially recyclable materials in the residential sector.
� Various provincial efforts are underway to develop systems to track and categorize residential waste and recyclables managed by municipalities.
� NRCan is involved in the GAP (generally accepted principles) process, which seeks to close the many municipal data gaps.
Since WMIS provides IC&I numbers for only some of the provinces, further work is required to understand why the gaps exist and whether they can be bridged (see Section 4.5). The MMSD scrap metal use surveys will continue to gather aluminum, copper and magnesium data from the industrial sector. Further metals are not being considered at this time due to a lack of funds. CR&D waste data collection at a provincial level is sporadic. An analysis will be performed as with IC&I to fill the data gaps.
� A number of jurisdictions have taken a close look at this waste stream including Alberta, Nova Scotia, Vancouver and Ottawa.
� It should be noted that CR&D waste is highly variable and may have to be analyzed according to each of its constituents. In the case of construction, in collaboration with Canada Mortgage and Housing Corporation it may be possible to match housing starts with the quantity and type of waste generated and or recycled.
This project focuses on the comparison between materials recovered and the amount still “available” for recovery. Of great interest are the recyclables that are currently being discarded since that is where future GHG emission savings will be realized.
� The MMSD use surveys address the first part of the equation (the scrap metal recovered by industry).
� The input-output model tackles the second part (i.e. potential supply) but Statistics Canada is concerned about the quality of data that this approach will generate.
� As an alternative approach to estimating the quantity of recyclable material not recovered, waste characterization analyses will be utilized for each of the three framework areas and for each province. Chapter 4 provides an overview of the study approach.

NRCan / RNCan 17 Mar-2006
Chapter 4 Approach The Statistics Canada biennial survey forms the most important part of this project’s foundation; that is, population and tonnes disposed. The 2002 Statistics Canada Waste Management Survey (WMIS) provides a breakdown between the three sectors: These are compared with local data where available. Urban and rural splits are identified from provincial data sources and are of interest if rural waste characterization data are available. The definition of “waste” is taken from the WMIS report that states: “waste is a material that is unwanted by its producer”9. This would include by-products from a production process or a product or a package (etc.) that has no further value for the current consumer, user or holder. This report does not provide a glossary of waste and recycling definitions since so many of these are already available on the Internet10. The best way to understand the scope of WMIS, and therefore the type of waste materials that are counted, involves a review of the organizations that are included in its survey: Local government and other waste management service providers:
� Upper-tier municipalities � Lower tier municipalities � Other public waste service providers
Waste management businesses: � Waste collection � Waste treatment and disposal � Material recovery facilities
The assemblage of waste characterization reports and data was conducted throughout 2003 and 2004 and could continue to be an ongoing activity if a central repository for such information is ever established. A list of related reports that have been pulled together is provided in Appendix C. At the time of this report, only two areas of the country do not appear to have done any waste characterization works in any sector: Prince Edward Island and Nunavut. The reliance on local waste characterization data is another critical component of this report. Auditing solid waste streams for the purpose of characterization is full of risks and concerns given the heterogeneous and variant nature of these materials. In fact, the potential for sampling and measurement errors is great. Studies that provide more accurate results require more samples over longer period of time and therefore cost much more to implement. It is useful to realize that “precision improves with the square root of 9 Statistics Canada, Waste Management Industry Survey: Business and Government Sectors 2002, Catalogue no. 16F0023XIE, Text Box 2.4, p. 12 10 For example, http://www.ciwmb.ca.gov/LGCentral/Glossary.htm , http://waste.eionet.eu.int/definitions , http://www.dep.state.pa.us/dep/deputate/airwaste/wm/recycle/Lessons/Terms.htm , and http://www.wastewise.wa.gov.au/pages/glossary.asp

The Government of Canada Action Plan 2000 on Climate Change
NRCan / RNCan 18 Mar-2006
the number of samples”11, which means you need to quadruple the number of samples in order to double desired precision. Consequently, municipalities (the primary auditing agents) typically conduct waste audit “snap shots” that provide indicative rather than accurate results, and they cost much less. The Statistics Canada disposal tonnage and the waste characterization data are combined to develop projections for each of the three sectors. These material specific tonnage projections are then combined with related greenhouse emission factors12 to derive GHG emission reduction potential if Canada were to increase its current diversion rate from 22 percent to something higher. In Figure 4.1, a general outline of the methodology used in this study is provided. It depicts in graphic form the discussion provided in the preceding paragraphs. Figure 4.1: Project Outline
An alternative approach to assembling the required statistics, adopted by the California Integrated Waste Management Board13, would have involved direct financial support of waste audits; however, this would have been costly and too time-consuming. Instead, this project relied completely on the data assembled by other agencies. The application of numbers from the sources referenced and the subsequent projections are the
11 CCME Waste Characterization Sub-Committee, Recommended Waste Characterization Methodology for Direct Waste Analysis Studies in Canada, SENES Ltd. 1999, p. 21 12 ICF Consulting, 2005, Determination of the Impact of Waste Management Activities on Greenhouse Gas Emissions 2005 Update, Environment Canada, Natural Resources Canada 13 See http://www.ciwmb.ca.gov for more information.
Statistics Canadademographic data
disposal data
Sector splits
Urban/rural splits
Local data
Provincial data
Local waste characterization
data
Resource recovery
projectionsGHG factors
ICF Consulting (EC and AP2K)
+
Projected GHG impacts

The Government of Canada Action Plan 2000 on Climate Change
NRCan / RNCan 19 Mar-2006
responsibility of Natural Resources Canada and should in no way reflect poorly on these same sources. In the context of this project and for other related endeavours, Natural Resources Canada continues to promote the idea that disposed solid waste should be monitored, audited and reported on a regular basis. To coordinate existing knowledge, or to compile results on a provincial level, the Recycling Council of Alberta developed a “provincial waste characterization framework” – this work was co-funded through Action Plan 2000: The front end part of the report is provided in Appendix D whereas the full report is available to interested parties on the RCA web site.14 In addition to the RCA report, additional waste audit guideline is as follows:
� Waste Diversion Ontario at http://www.wdo.ca (under “Other Reports”; then “to review these reports click here” and then scroll to bottom and “Miscellaneous” for the “Residential Curbside Waste Audit Guide”)
� British Columbia Ministry of Water, Land and Air Protection, see Section 58(5)
regarding the "Procedural Manual for Municipal Solid Waste Composition Analysis": http://wlapwww.gov.bc.ca/epd/epdpa/mpp/gprswmp2.html
� The CCME report is entitled “Recommended Waste Characterization
Methodology for Direct Waste Analysis Studies in Canada”15 and can be found at http://www.ccme.ca/assets/pdf/waste_e.pdf.
Many documents were referenced and individuals contacted during the course of this project. Key sources of data for this project are:
� Statistics Canada 2002 Waste Management Industry Survey Results – Business and Government Sectors
� Generally Accepted Principles (GAP) for Calculating Municipal Solid Waste System Flow (about 41 municipal records in hand)
� Provincial government data – publications and personal contacts � Waste management industry and stewardship agencies – publications and
personal contacts � Any municipality that has conducted a waste characterization study.
14 See http://www.recycle.ab.ca/Download/WasteCharFinalReport.pdf. The full report also includes “Guidelines for Waste Characterization Studies in the State of Washington” with extensive auditing details. (Feb-2006) 15 Prepared for CCME by SENES Consultants Ltd., April 1999;

The Government of Canada Action Plan 2000 on Climate Change
NRCan / RNCan 20 Mar-2006
4.1 Residential Sector While residential waste composition data are fairly straight-forward, they are still plagued by methodological variations regarding material categories, sample sizes, seasonal representation, waste generated versus waste disposed of, and so on and so forth. Thus, while residential waste characterization data are more reliable than information from the other sectors, and given the geographical and climatic variability of this material, it is assumed that orders of magnitude will suffice in this report. As noted, the Statistics Canada data are relied upon to give total quantities of solid waste generated and disposed of in each province. This was considered the only way of maintaining consistency between the different jurisdictions. The same applies with recycling data. Exceptions are identified later in the report. Wherever possible, local characterization data are used, but where local waste composition data are unavailable, numbers from adjacent or similar provinces are used. Assumptions and calculations are presented as transparently as possible; however, the reader is requested to identify gaps, omissions or errors wherever they occur. 4.2 Industrial, Commercial & Institutional (IC&I) Sector To fully comprehend the variability of IC&I waste, it is important to understand that this grouping contains many diverse sub-sectors as defined by the North American Classification System (NAICS)16. The distribution of these sub-sectors is different throughout the country, region by region. Under contract to this project, Statistics Canada provided a detailed breakdown of the IC&I sector by province and this is discussed in detail in Chapter 16. The initial characterization of the IC&I waste stream in Chapters 5 through 15 was conducted under the assumption that the IC&I waste stream is a discrete fraction whereas this is not the case as indicated in the previous paragraph. Highly generalized waste composition data for the “IC&I” waste stream were applied to the IC&I waste material disposed of and reported to Statistics Canada. This is a very superficial approach. For those interested in auditing an IC&I waste stream, Nova Scotia’s Resource Recovery Funding Board has posted a helpful guide on its web site.17 As with CR&D, there is an opportunity to estimate IC&I waste flows by employing an alternative methodology, which was touched on in several municipal studies (e.g. Calgary, Regina and Ottawa). This alternative approach starts with operational data such as revenue, number of employees, number of students, or number of hospital beds (etc.) These operational data can be crossed with available waste data from a specific IC&I sub-sector like Education Services (NAICS 61) or Manufacturing (NAICS 31-33) to
16 See discussion in Section 16.2.1. 17 See http://www.rrfb.com/pdfs/Auditguide.pdf (Feb-2006)

The Government of Canada Action Plan 2000 on Climate Change
NRCan / RNCan 21 Mar-2006
develop projections on a province-by-province level. The level of detail is wholly dependent on available data (how much waste per employee per year and how can it be characterized?). More discussion of this approach and its use in this project is discussed in Chapter 16. Chapter 17 focuses on the industrial waste that is likely excluded from the traditional IC&I umbrella. This tonnage is significant but is generally never considered by municipally based waste and recycling planners. 4.3 Construction, Renovation & Demolition (CR&D) Sector There appear to be about three different ways of referring to this sector: C&D (construction and demolition); DLC (demolition and land clearing); and CRD (construction, renovation, demolition). This report has elected CR&D with the insertion of the “&” to be consistent with IC&I. Each one the three CR&D sub-sectors could be divided further into residential (single versus multi family dwellings), commercial (small versus large) or industrial. The solid waste generated within each sub-category is distinct and highly variable in its quantity and composition, both across the country and from year to year depending on the state of the economy. Urban areas probably have more CR&D activity than rural areas. It is certain that the Canadian winter in some parts of the country has an influential role to play as well. Provincial and municipal data summaries include or exclude civil engineering waste such as road or bridge waste and, given the mass of that kind of waste material, CR&D generation numbers will vary accordingly. An important methodological difference with CR&D waste material compared to residential is its association to other physical or financial indices such as housing starts, building permits or dollar value figures – agencies such as Canada Mortgage and Housing and Statistics Canada have good data in this regard. Construction permits play an important role in the projections made in this report (see following page). One of the earlier studies that considered CR&D waste was “Making a Molehill out of a Mountain”, prepared for the Toronto Homebuilders Association, Canada Mortgage and Housing and the Ontario Ministry of the Environment (1990-91). This work is being re-visited in Ontario via an Action Plan 2000, Enhanced Recycling Program project called “Let’s Climb Another Molehill” – some characterization of CR&D waste is explored in that report. In 1993, Environment Canada and Natural Resources Canada sponsored a landmark project on the CR&D waste management industry18. The amount of waste material disposed of in 1992 was estimated to be about 6.5 million tonnes, which is in sharp 18 SENES Consultants Ltd., 1993, Construction and Demolition Waste in Canada: Quantification of Waste and Identification of Opportunities for Diversion from Disposal, Environment Canada and Natural Resources Canada

The Government of Canada Action Plan 2000 on Climate Change
NRCan / RNCan 22 Mar-2006
contrast to Statistics Canada 2002 figure of 3.8 million tonnes. The inclusion/exclusion of concrete and asphalt may account for the difference. Interestingly, the Canadian Construction Association continues to use the 1992 generation and composition data from the SENES report19. This study uses the Statistics Canada figures but a separate discussion in Chapter 17 addresses the concrete and asphalt issue. The most recent study to examine the CR&D waste stream was commissioned by the Alberta CRD Advisory Committee20. While the percentages developed for Alberta are used for that province (see Section 6.4), for the rest of the country, average values were calculated using the data found in Appendix II in the same study. The approach used to develop CR&D numbers for the other provinces and territories is as follows:
1. Start with the Statistics Canada CR&D disposal tonnage figure for 2002 2. Divide the tonnage into residential and non-residential sources using the Statistics
Canada construction permit data in Table 4.1. For this study, it is assumed that the value of construction is a reasonable proxy for overall construction, renovation and demolition activity (and therefore waste generation).
Table 4.1: Construction Permits in 200021
Province
Residential Non-residential
BC AB SK MN ON QC NB NS PE NF YK NT NU
$2,403,100,000$3,351,300,000
$222,000,000$340,700,000
$11,166,700,000$3,647,100,000
$284,400,000$467,800,000
$64,300,000$185,600,000
$16,100,000$27,700,000$15,500,000
53% 58% 38% 40% 60% 54% 56% 56% 59% 62% 28% 69% 40%
$2,088,900,000$2,416,500,000
$357,900,000$508,800,000
$7,330,500,000$3,077,600,000
$219,200,000$373,100,000
$43,800,000$114,800,000
$41,200,000$12,400,000$23,200,000
47% 42% 62% 60% 40% 46% 44% 44% 41% 38% 72% 31% 60%
3. Split the residential and non-residential CR&D activities into construction, renovation and demolition as shown in Table 4.2 (from the Alberta CRD Advisory Committee study’s literature review, Appendix II):
19 For more information the Canadian Construction Association’s web site is: www.cca-acc.com 20 CH2M Gore & Storrie (CG&S) Limited, 2000, Construction, Renovation and Demolition (CRD) Waste Characterization Study, Alberta CRD Waste Advisory Committee 21 Source http://www.statcan.ca/english/Pgdb/manufl5c.htm (May, 2004)

The Government of Canada Action Plan 2000 on Climate Change
NRCan / RNCan 23 Mar-2006
Table 4.2: Assumed CR&D Splits for Residential and Non-Residential Waste Materials22
Activities
Residential Non-
Residential Construction Renovation Demolition
11% 55% 34%
6% 36% 58%
4. Apply waste characterization data to each of the six fractions presented in Table 4.2. Table 4.3 presents the assumed characteristics for CR&D waste disposed. As recommended in the Alberta report, given the variability in the percentages assessed for CR&D materials disposed, only eight categories are presented. In other words, more detailed numbers would be unreliable. Table 4.3 figures were derived by taking the average of ranges documented in the Alberta CR&D Advisory Committee study’s literature review. For the purposes of this document, these percents are assumed to be sufficient to provide order of magnitude projections for this waste stream.
Table 4.3: Assumed CR&D Waste Characterization Figures
Residential Non-Residential
Material Construction Renovation Demolition Construction Renovation Demolition Concrete Asphalt Wood Drywall Ferrous Nonferrous Cardboard Other
9.4% 4.4%
47.5% 20.5%
1.5% 5.0% 8.0% 3.8%
13.9% 6.6%
30.5% 11.8%
0.6% 1.9% 0.8%
33.9%
31.3% 14.7% 18.4%
2.6% 0.3% 1.0% 0.2%
31.5%
12.4% 5.8%
34.5% 4.0% 1.6% 5.3%
10.7% 25.8%
14.9% 7.0%
24.4% 35.4%
1.4% 4.6% 0.2%
12.1%
10.9% 5.1%
40.4% 0.1% 1.0% 3.3% 0.3%
39.0% Total
100% 100% 100% 100% 100% 100%
5. Following step 4, the tonnage for each material category is summed up across the board so that the total projection for ferrous metal, for example, includes residential CR&D and non-residential CR&D.
22 Franklin Associates, Characterization of Building-Related C&D Debris in the US, EPA, June 1998 (reference found in Table A-2, Alberta CRD study, Appendix II – see footnote 6). The EPA percentages exclude debris managed on-site, or roadway, bridge or land clearing debris. Also, the EPA numbers are for CR&D waste generated as opposed to disposed (an important distinction).

The Government of Canada Action Plan 2000 on Climate Change
NRCan / RNCan 24 Mar-2006
4.4 Product Stewardship Assumptions In this report, resource recovery achieved via product stewardship is assumed to be that which occurs as a result of voluntary or regulated action by industry or related agencies. Specifically, the collection of materials involving some sort of take back approach (e.g. return-to-retailer) that may or may not be facilitated by a deposit left by the consumer in exchange for the product is considered to be “product stewardship”. This distinction is made solely for the purpose of compiling the waste and recycling data that are the focus of this report, especially the former. Materials typically covered by this term include beverage containers, tires, lead acid batteries, used motor oil, paints and used pesticide containers. It could be argued that programs in which the consumer pays to return white goods, electronics or tires (etc.) are also product stewardship since the use of end-of-life “care taking” fees at either the front or back ends will be borne by the consumer one way or another. It should be recognized that there are a number of initiatives underway in Canada that use the word “stewardship” to denote financial, technical or strategic support for (primarily) municipal recycling activities: For example; Stewardship Ontario, Manitoba Product Stewardship Corporation, Electronic Product Stewardship Canada (EPSC), and Multi-Material Stewardship Board (Newfoundland & Labrador). A web search using the terms “Canada, product stewardship, agency or association or organization” generates 28,400 “hits”. Stewardship is an important concept but its usage has not really been standardized and further discussions by stakeholders regarding this issue are warranted. More information on product stewardship is provided on Environment Canada’s web site23. Lastly, regarding the beer brewing industry, their refillable bottles are reused 15-20 times before being recycled. The argument for counting refilling as “diversion” is that in their absence one-way containers would be used and then simply managed as recyclable or waste material. The problem with this approach is that refillable bottles are not considered to be “waste” by their producer (nor by the consumer vis-à-vis a national return rate of 97 percent) and for this reason Statistics Canada does not include them in their survey. Therefore to be consistent with Statistics Canada, as well as GAP24, this report calculates the tonnage of bottles returned annually and divides them by an average of fifteen round trips to calculate recycling tonnage for these containers. This approach only impacts the recycling estimates made in each province in the benchmark year (2002).
23 See http://www.ec.gc.ca/epr/en/index.cfm (Feb-2006) 24 For information regading GAP, see http://csr.org/gap/index.htm (Feb-2006)

The Government of Canada Action Plan 2000 on Climate Change
NRCan / RNCan 25 Mar-2006
4.5 Material Projections The material projections are organized by province (Chapters 5 to 15). The three territories are grouped together in Chapter 15. It was arbitrarily decided that report sections would be organized starting in the west, going east and then north. All of the assumptions made and the calculations used are presented in the appropriate sections. Statistics Canada Waste Management Industry Survey (WMIS) provides all of the baseline disposal data for the provincial projections in Chapters 5 through 15. However, in some cases, data are not provided in WMIS due to confidentiality issues. Therefore, estimates have been made to plug gaps so as to provide a complete picture of waste and recycling in Canada. The reader is advised that figures presented in this report but not shown in WMIS should be considered estimates only. The approach taken for estimating missing values was based on the following formula:
Diversion rates (tonnes diverted or recycled divided by total amount of material generated) for all provinces and all three sectors are provided by WMIS but they are all rounded to the nearest percent, which means that the above formula is not precise. To use the formula, disposal rates are required and, where missing from WMIS, they are gathered from the field or estimated.
4.5.1 Residential Projections The only way to plug the residential gaps, shown in Table 4.4, is to get the number from elsewhere or estimate them. In this case, getting the data from Prince Edward Island (PEI) allowed for the calculation of the numbers for the Yukon, Northwest Territories and Nunavut (“The North”). The details regarding the PEI data are provided in Chapter 13 but the estimates (shaded) are provided in Table 4.4. Following the estimation of the “missing” values for Table 4.4, the calculated recycling and disposal numbers for the North result in an estimated diversion rate of 13 percent rather than the 16 percent provided by WMIS. This projection gap is unfortunate but since the numbers are small in absolute terms, the estimates are left as is.
Generation = Disposal / (1 – Diversion Rate) Generation = Disposal / (1 – Diversion Rate)

The Government of Canada Action Plan 2000 on Climate Change
NRCan / RNCan 26 Mar-2006
Table 4.4: Residential Data from Statistics Canada 200225 (tonnes)
Province Disposal Diversion Generation Diversion Rate
NL PE NS NB QC ON MB SK AB BC North
216,218 31,119
169,649 203,506
2,876,000 3,438,408
412,612 278,692 866,398 936,774
25,828
15,073 19,481 82,363 52,685
595,000 949,830
81,923 42,376
293,300 417,403
3,700
231,291 50,600
252,012 256,190
3,471,000 4,388,239
494,535 321,069
1,159,697 1,354,177
29,528
7% 39% 33% 21% 17% 22% 17% 13% 25% 31%
(13%)16%
Total
9,455,204 2,553,134 12,008,338 22%
Note: The shaded numbers are estimates only, based on the diversion rates for all provinces and extra data gathered in Prince Edward Island. Error in the projection approach used is reflected in the North diversion rate: Estimated to be 13% versus WMIS rate of 16%; however, the totals are consistent with WMIS 2002.
4.5.2 IC&I Projections The IC&I data provided by WMIS have significantly more gaps than the residential sector (see Table 4.5). Fortunately, in Newfoundland and Labrador (NL), Nova Scotia (NS) and Saskatchewan (SK), diversion tonnage figures can be estimated by using the aforementioned formula. The most challenging data gaps are for disposal in PE and the North. As with residential, if a disposal figure can be determined for PE, then the number for the North can be deduced. Since WMIS published rounded diversion rates, the sum of the formula-based data and the provided data does not match the given national total (the difference is 4,332 tonnes). In this case, the difference is distributed to the five regions where the data were missing (NL, PE, NS, SK and the North) according to their relative populations. WMIS provides an opportunity to double-check this approach, where residential and total diversion numbers are provided. For example, allocation of tonnes to SK based on its population share puts it over the non-residential total for recycling in that province. This would suggest that the WMIS diversion rate was rounded up. If the Newfoundland & Labrador and Nova Scotia numbers are reduced to match the non-residential sums that can be derived from the Statistics Canada data, 2,271 tonnes of
25 Statistics Canada, Waste Management Industry Survey: Business and Government Sectors 2002, Catalogue no. 16F0023XIE, Tables A.2, A.4, A.5 and A.7

The Government of Canada Action Plan 2000 on Climate Change
NRCan / RNCan 27 Mar-2006
diverted material remain to be distributed to PEI and the North. However, this cannot be done with out substantially increasing the diversion rates established in WMIS (from 21 to 25 percent in PEI and from 9 to 12 percent in Newfoundland & Labrador). Again, since the real tonnes involved are relatively small, this exercise is somewhat academic so the gap is left as is.
Table 4.5: IC&I Data from Statistics Canada 200226 (tonnes)
Province Disposal Diversion Generation Diversion Rate
NL PE NS NB QC ON MB SK AB BC North
140,377 26,509
164,692 154,812
2,261,000 5,193,240
405,954 441,109
1,380,306 1,346,669
37,398
22,841 7,398
51,281 61,620
935,000 1,320,952
160,796 95,939
262,537 586,719
3,956
163,218 33,907
215,973 216,431
3,196,000 6,514,191
566,750 537,048
1,642,843 1,933,387
41,354
14% (22%) 21% (23%) 22%
28% 29% 20% 28% 18% 16% 30%
(10%) 9%
WMIS Total Estimate
11,563,999 11,552,066
3,511,308 3,509,039
15,075,307 15,073,036
23% 23%
Note: The shaded numbers are estimates, based on data provided by WMIS and other estimates where confidentiality precluded Statistics Canada publication. However, complete data reconciliation with WMIS 2002 was not possible with a final gap of 2,271 tonnes (numbers may not add up due to rounding), which for the purposes of this report is considered to be a minor deviation. Also, this table accommodates the shift of 11,933 t of material disposed to CR&D from IC&I in Nova Scotia (see Table 12.4).
4.5.3 CR&D Projections The IC&I data quandary discussed previously replicates itself in the CR&D sector but to a lesser degree. Table 4.6 shows virtually the same CR&D data gaps as in the IC&I sector (estimates are shaded). The so-called missing CR&D tonnage amounts to 674 tonnes and the model used to manipulate the data suggests that all of it must be allocated to PEI because WMIS reports that no CR&D waste was diverted in the North. If this were done, the PEI diversion rate for CR&D waste increases from 2 percent (WMIS) to 9 percent. Since the tonnage in question is 500 versus 1170, further analysis is not justified.
26 Ibid.

The Government of Canada Action Plan 2000 on Climate Change
NRCan / RNCan 28 Mar-2006
Table 4.6: CR&D Data from Statistics Canada 200227 (tonnes)
Province Disposal Diversion Generation Diversion Rate
NL PE NS NB QC ON MB SK AB BC North
19,999 11,426 54,854 55,288
406,800 1,013,985
77,990 75,323
643,590 461,458
7,748
472 500
36,080 8,653
213,000 144,716
8,161 8,292
33,805 100,999
0
20,471 11,926 90,934 63,941
619,800 1,158,701
86,151 83,615
677,395 562,457
7,748
2% 4%
46% 14% 34% 12%
9% 10%
5% 18%
0%
Total Estimate
2,816,528 2,828,461
555,352 554,677
3,371,880 3,383,138
16% 16%
Note: As in the previous table, it was not possible to allocate the missing tonnage to all of the provinces so the reconciliation is off by 674 tonnes (numbers may not add up due to rounding). The shaded numbers are all estimates. This table accommodates the shift of 11,933 t of material disposed to CR&D from IC&I in Nova Scotia (see Table 12.4).
4.5.4 Projections Summary The approach used to plug the WMIS gaps is not precise particularly since it is impossible to determine if the WMIS diversion rates were rounded up or down. Estimated values for the IC&I and CR&D sectors were double-checked against total (i.e. national) values to make sure the two matched. At the end of the analysis, the IC&I and CR&D gaps were relatively small and therefore this issue was not considered serious. While WMIS excludes liquid and hazardous waste, some of the waste characterization audits include some haz-waste material (always less than one percent of total solid waste disposed). Some of the industrial materials addressed in Chapter 17 may be considered hazardous because of their metal contents, but through environmentally sound management the hazard can usually be mitigated.
27 Ibid.
NRCan / RNCan 29 Mar-2006
Chapter 5 British Columbia
5.1 INTRODUCTION...........................................................................................................................30 5.2 DEMOGRAPHICS .........................................................................................................................31 5.3 GENERATION, RECYCLING AND DISPOSAL BY SECTOR ...................................................32
5.3.1 Generation Data .........................................................................................................32 5.3.2 Recycling Data............................................................................................................33 5.3.3 Product Stewardship Data ......................................................................................34 5.3.4 Disposal Data..............................................................................................................35
5.4 WASTE COMPOSITION ..............................................................................................................36
5.4.1 Residential Waste Characterization .....................................................................36 5.4.2 Industrial, Commercial and Institutional (IC&I) Waste
Characterization.........................................................................................................38 5.4.3 Construction, Renovation and Demolition (CR&D) Waste
Characterization.........................................................................................................39 5.5 B.C. SUMMARY ..........................................................................................................................41

The Government of Canada Action Plan 2000 on Climate Change
NRCan / RNCan 30 Mar-2006
5.1 Introduction In 1989, the province of British Columbia (BC) established a goal to reduce the average per capita disposal rate by the year 2000 by 50 per cent of the 1990 level. To assess performance, the Ministry of Water, Land and Air Protection (WLAP) established the “MSW28 tracking system” in 1990. The monitoring of solid waste data in BC is facilitated by the Regional District (RD) system, which was introduced in 1965.29 Each of the 27 RDs is responsible for managing residuals under approved solid waste management plans and they each track their waste statistics to the best of their ability, but WLAP has some concerns:
� Not all regional landfills have weigh scales (76 percent of waste is disposed at facilities with weigh scales, year 2000)
� Some RDs do not have dedicated staff at landfills � There is no independent verification of the submitted data � Participation on the part of the RD’s is voluntary (estimates are made when RD’s
fail to report) It is important to note that MSW, as defined in BC’s Environmental Management Act, includes refuse from residential, commercial, institutional, demolition, land clearing or construction sources. “Industrial” waste is missing from the definition. At any rate, a distinction between residential and non-residential waste is not made at the provincial level. Regarding the annual tracking effort, starting in 1996 the province contracted the Recycling Council of British Columbia (RCBC) to conduct the waste survey and prepare the annual reports.30 The amount and type of recyclable material was a secondary objective of this activity – the reliability of recycling data was undermined by the fact that RDs vary considerably in their ability to track these numbers. Further, in many RDs the recyclables are collected and managed by the private sector so these data are usually unavailable to the regional district. The last MSW Tracking Report was produced for 2001 and 2002. In the first part of 2004, WLAP decided to discontinue the survey, presumably as a cost saving measure. This position was confirmed when WLAP learned that it, like other provincial agencies, can use the Statistics Canada WMIS to monitor waste management in the province, (although WMIS is biennial and the RCBC contract was for annual reports).
28 Municipal solid waste is a phrase that many use to refer to all waste even when it is generated or managed by the private sector. 29 For more information about BC’s RDs see www.mcaws.gov.bc.ca/lgd/pol_research/rdprimer.html 30 These reports can be found at: http://wlapwww.gov.bc.ca/epd/epdpa/mpp/solid_waste_index.html

The Government of Canada Action Plan 2000 on Climate Change
NRCan / RNCan 31 Mar-2006
5.2 Demographics From Statistics Canada, the 2002 population figure for B.C. is assumed to be 4,114,981.31 In terms of size, the three most populous RD’s are the Greater Vancouver Regional District (GVRD) at 49 percent of the total, the Capital Regional district (Capital) at 8 percent and Fraser Valley at 6 percent. Consequently, the impact of waste management activities in the GVRD has a profound affect on the province’s overall performance. To show how population is distributed in BC, Table 5.1 presents data from the MSW Tracking Report of 2000.
Table 5.1: BC Population by Regional District in 2000
Regional District
Population
1 Alberni-Clayoquot 34,000 2 Bulkley-Nechako 44,204 3 Capital 334,940 4 Cariboo 73,549 5 Central Coast 4,332 6 Central Kootenay 61,790 7 Central Okanagan 152,000 8 Columbia Shuswap 52,973 9 Comox-Strathcona 105,439
10 Cowichan Valley 76,819 11 East Kootenay 62,240 12 Fraser Valley 243,008 13 Fraser-Fort George 106,933 14 Greater Vancouver 2,011,035 15 Kitimat-Stikine 46,870 16 Kootenay Boundary 34,065 17 Mount Waddington 15,058 18 Nanaimo 137,003 19 North Okanagan 79,047 20 Northern Rockies 6,434 21 Okanagan-Similkameen 84,448 22 Peace River 57,726 23 Powell River 21,060 24 Skeena-Queen Charlotte 25,514 25 Squamish-Lillooet 45,523 26 Sunshine Coast 27,438 27 Thompson-Nicola 130,192
The sum of Table 5.1 is 41,351 people less than the Statistics Canada number. In discussions that follow, it is assumed that “urban” areas have a minimum population of
31 Statistics Canada, Waste Management Industry Survey: Business and Government Sectors 2002, Catalogue no. 16F0023XIE, Table 2.2, p.10

The Government of Canada Action Plan 2000 on Climate Change
NRCan / RNCan 32 Mar-2006
100,000. Thus, the urban population is 79 percent and rural is 21 percent of the total population. 5.3 Generation, Recycling and Disposal by Sector
Table 5.2 provides a summary of the flow of solid waste material in B.C. and is based entirely on the Statistics Canada WMIS 2002 survey.
Table 5.2: B.C. Solid Waste Flow by Sector in 2002
Sector
Generation Disposal Recycling
Residential IC&I CR&D
1,354,177 1,933,388
562,457
936,774 1,346,669
461,458
417,403 586,719 100,999
Total tonnes Kilograms/capita
3,850,022 936
2,744,901 667
1,105,121 269
In B.C., an array of waste generation, recycling and disposal data are available for consideration. The following sections discuss the local data and compare them with the Statistics Canada numbers.
5.3.1 Generation Data The MSW Tracking Report for 2001 and 2002 does not report on total generation rates, since unlike earlier reports, only disposal data was requested. The Greater Vancouver (GVRD) and Capital Regional District (CRD) have conducted waste composition studies and produce their own annual reports in which total generation is indicated. The different sums in the two areas are notable.
1. The GVRD releases an Annual Solid Waste Management Report in which all sectors of the local economy are considered. In 2001, total waste generated was 1.34 tonnes per capita per year.32 In 2002, the rate increased slightly to 1.37 t/cap/yr.33 While this rate is significantly larger than the CRD (see below), it is difficult to compare these two RDs because the GVRD includes all asphalt and concrete recovered as part of its recycling amount, whereas the CRD does not, partly because it does not have total access to the numbers and partly because it believes these heavy materials skew the results (a view supported by Statistics Canada).
32 Earth Tech (Canada), Annual Solid Waste Management Report 2001, Greater Vancouver Regional District (GVRD), p. 24 33 Greater Vancouver Regional District Solid Waste Management 2002 Annual Report

The Government of Canada Action Plan 2000 on Climate Change
NRCan / RNCan 33 Mar-2006
2. In the CRD, the per capita generation of all solid waste is assumed to be 0.67 tonnes per year34 – this is taken from 1989 and is used for calculating an “historical diversion rate”. Another method for determining total waste generated, as noted, is to use current data. Using 2002 data from the CRD (population is 347,095, waste disposed is 142,940 t. and 23,636 t. are recycled), total current waste generation is calculated to be 0.48 tonnes/cap/yr. The recycling tonnage is under-reported because private sector activities (e.g. demolition and construction refuse and possibly fine paper recycling or metal scrap recycling) are not accounted for, in which case the amount generated per capita should be higher.
The Statistics Canada number 0.936 tonnes total waste generated per capita per year appears to be about midway between the GVRD (1.36) and the CRD figures (0.48).
5.3.2 Recycling Data WLAP has not tracked the quantity of recyclables recovered in B.C since the publication of the 2000 MSW Tracking Report. The recycling data compiled in the MSW Tracking Reports are problematic for reasons indicated in Section 5.1. Summarization of the individual RD program data in the 2000 Tracking Report provides a total recycling figure of 497,185 tonnes: This number is significantly lower than the comparable 2000 Statistics Canada value of 1,128,115 tonnes.35 As noted above, the 2001/2002 MSW Tracking Report does not provide any recycling data at all.36 In its 2002 annual report, the GVRD indicates that a total of 1,468,379 tonnes of material were recycled from all three sectors, which is larger than the Statistics Canada figure for the entire province. Why the difference? The GVRD summary includes product stewardship materials as well as concrete and asphalt. The Statistics Canada survey excludes the former and civil engineering waste (a large part of which is concrete and asphalt). The reason for the latter is that a large road or bridge project that generates large quantities of concrete or asphalt can easily skew a province’s total waste management picture. This material is addressed in Chapter 17. If concrete, asphalt and product stewardship data are backed out of the GVRD total recycling figure, the new estimate is 853,649 tonnes or 0.404 t/cap/yr. A few remarks can be made: (1) The revised GVRD recycling rate per capita is still higher than the Statistics Canada figure (0.269 t/cap/yr) for the province, (2) the GVRD may be counting recyclable items that Statistics Canada is not, and (3) GVRD recycling tonnes account for 76 percent of the provincial total while its population is 49 percent of the total.
34 Capital Regional District Solid Waste Division, 2002 Annual Report, Table 6, p. 13 35 Statistics Canada, Waste Management Industry Survey 2000, Table 2.5 36 RCBC, BC Municipal Solid Waste Tracking Report 2001-2002, p.5

The Government of Canada Action Plan 2000 on Climate Change
NRCan / RNCan 34 Mar-2006
5.3.3 Product Stewardship Data Product stewardship is addressed as a separate diversion component because waste materials that are managed through such programs have an unknown variety of sources, both residential and non-residential in nature. For example, beverage containers that are recovered under deposit regimes are consumed in the home, in transit, at work, on vacation and everywhere in between. It is the same situation with tires, used motor oil and paint, etc. It is therefore impossible to accurately assign these materials to one sector or the other. However, the agencies with the responsibility of managing these programs usually track the total quantity of materials recovered. As noted previously, the Statistics Canada biennial survey does not capture product stewardship data. Table 5.3 provides a summary of solid non-hazardous waste materials recovered in B.C. This means that used motor oil, paint, pesticides and flammable liquids are not included in this summary. Lead-acid batteries are addressed separately in Section 17.5.
Table 5.3: BC Product Stewardship and (Solid Non-Hazardous) Materials Recovered in 2002
Stewardship Program Commodity Tonnes
Recovered
Beverage Container Deposit-Refund System37 (non-alcoholic beverage containers) (Encorp Pacific Ltd.)
Aluminum Plastic Glass Drink box Bi-metal Bag-in-box
5,163 7,992 9,317 1,681
248 29
Brewers Distributors Ltd.38 (Domestic beer, cider and coolers)
Glass Aluminum
3,377 5,682
Liquor Distribution Branch39 (Wine, imported beer and liquor containers)
Glass Plastic Bag-in-box
50,073 366
70
Financial Incentives for Recycling Scrap Tires40 (Passenger, light truck and medium truck tires)
Tires
26,867
TOTAL 110,865
37 See http://www.encorp.ca/temp/2004102099635/recycstat1202a.pdf 38 Personal communications with Greg D’Avignon and Luke Harford, Brewers Association of Canada, Oct. 20, 2004. Note that Brewers Distribution Ltd. is also part of the provincial deposit/refund system. 39 See 2002-03 Director’s Report at http://wlapwww.gov.bc.ca/epd/epdpa/ips/bev/bev2002_03.html with conversion factors provided by Gord Hall of the LDB, Oct. 25, 2004 40 See http://wlapwww.gov.bc.ca/epd/epdpa/ips/index.html

The Government of Canada Action Plan 2000 on Climate Change
NRCan / RNCan 35 Mar-2006
The numbers presented in Table 5.3 are based on data reported to the BC Ministry of Water, Land and Air Protection, which is a requirement of the stewardship regulations in this province. A few of the numbers and various conversion factors needed to transform container units into kilograms were provided by industry (as referenced). The product stewardship tonnage are added to the Statistics Canada generation figures and this is reflected in Figure 5.2 where the total amount of waste material generated in the residential and IC&I sector is greater than that shown in Table 5.2.
5.3.4 Disposal Data The MSW Tracking Reports provide the following historical data regarding overall disposal in B.C.: 0.618 t/cap/yr in 2000; 0.612 t/cap/yr in 2001; and 0.628 t/cap/yr in 2002.41 The Statistics Canada numbers are 0.636 t/cap/yr in 2000 and 0.667 t/cap/yr in 2002. The 2002 variance between these two sources (using Statistics Canada population data) amounts to 160,484 tonnes. The Statistics Canada WMIS for 2002 provides, for the first time, the sectorial splits for tonnes disposed at a provincial level, which can be compared to some local data for interest’s sake. Table 5.4 presents the comparisons:
Table 5.4: Waste Disposal by Sector
Source Residential
IC&I C&D
GVRD42 CRD43 North Okanogan44 BC weighted average Statistics Canada45
30% 52% 46% 37%
34%
44% 29% 43% 42%
49%
26% 19% 11% 20%
17%
Totals may not add up to 100% due to rounding. Since B.C. urban and rural waste composition data are available (and are used in Section 5.4), a further distinction is made between the largest RDs and all the rest (refer back to Table 5.1). Table 5.5 provides the summary of tonnage disposed by sector of waste origin where, to reiterate, “urban” includes those RD’s with 100,000 or more population.
41 RCBC, BC Municipal Solid Waste Tracking Report 2001-2002, p.3 can be found at http://wlapwww.gov.bc.ca/epd/epdpa/mpp/solid_waste_index.html 42 Earth Tech (Canada), Annual Solid Waste Management Report 2001, GVRD, Figure 3 43 Sperling Hansen Associates, 2001, Summary of Phase 1 & 2 Solid Waste Composition Study, Capital Regional District, p. 21 44 EcoChoice Consulting and Footprint Environmental Consultants, 1998, Waste Composition Survey, North Okanogan Regional District (NORD) 45 Statistics Canada, 2004, Waste Management Industry Survey 2002, Table A.2

The Government of Canada Action Plan 2000 on Climate Change
NRCan / RNCan 36 Mar-2006
Table 5.5: B.C. Waste Materials Disposed (2002)
Sector Residential
IC&I C&D
“Urban” tonnes “Rural” tonnes
704,274 232,500
1,054,522 292,147
407,571 53,887
Total tonnes 936,774
1,346,669
461,458
The data in Table 5.5 assume that all B.C. Regional Districts dispose 0.667 t/cap/yr (see Table 5.2). In reality, it is more likely that disposal rates vary across the province. In fact, the RCBC waste tracking report of 2002-2002 in which RDs self-reported their data, the rates ranged from 256 kg/capita to 1,591 kg/capita, total waste disposed (even if the extremely high and low reports are eliminated, the range of 372-1,000 kg/capita is enormous). 5.4 Waste Composition
The waste characterization projections developed in this report accommodate separate composition inputs for the residential, IC&I and CR&D sectors. The characterization data presented are for solid waste disposed. The purpose of this project and indeed the multitude of waste audits conducted across Canada is to examine the discarded waste fraction with a view towards identifying and quantifying the resources that could be recovered if certain financial, social and technical constraints were overcome. Before the constraints can be addressed, however, it is necessary to establish a baseline of understanding.
5.4.1 Residential Waste Characterization Some good, relatively recent waste characterization data are available from a number of RDs in B.C. Two studies were selected to provide an overall sense of residential waste composition. First, the CRD provides data for the “urban” areas.46 Second, the North Okanogan Regional District (NORD) provides waste composition data for other “rural areas”.47 A description of each study is not provided in this report. The CRD audit included 72 different waste material categories while the NORD audit included 38. For the purposes of being concise and also to reflect the fact that province-wide extrapolations are being made, only twelve broad categories are used to show the type of waste material being disposed of. Since the data presented in Table 5.6 have not been rounded, the reader is cautioned to not assume an elevated level of accuracy.
46 Sperling Hansen Associates, 2001, Summary of Phase 1 & 2 Solid Waste Composition Study, Capital Regional District 47 EcoChoice Consulting and Footprint Environmental Consultants, page 22, Table 10

The Government of Canada Action Plan 2000 on Climate Change
NRCan / RNCan 37 Mar-2006
The largest material fractions are organics, paper and plastics, by a large margin. Total metal content is estimated to be about 4 percent.
Table 5.6: Estimated Composition of B.C. Residential Waste Disposed (2002)
Material
Urban tonnes Rural tonnes Total tonnes Percent
Paper Glass Ferrous Nonferrous Plastics Organics Wood Renovation Textiles & rubber Multi-material Haz-waste Other
110,360 16,269 22,818 5,141
95,359 238,326
64,652 59,018 33,030 43,524 2,465
13,311
42,013 7,324 4,929 1,209
28,109 113,506
1,604 4,999 9,881 6,254 3,650 9,021
152,372 23,592 27,747 6,350
123,468 351,833
66,257 64,017 42,912 49,778 6,115
22,332
16.3% 2.5% 3.0% 0.7%
13.2% 37.6%
7.1% 6.8% 4.6% 5.3% 0.7% 2.4%
Total
704,274 232,500 936,774 100.0%
Figure 5.1 presents the estimated characterization of residential waste disposed in B.C. where the urban and rural data are combined.
Figure 5.1: Estimated Composition of BC Residential Waste Disposed (2002)
While thousands of tonnes of recyclable material are being wasted, it is important to note that full recovery is not possible where viable markets are non-existent or not accessible, or where materials are either contaminated (multi-material) or not easily recycled (e.g. plate glass). Further, it is difficult to estimate the quantity of material in Table 5.6 that is recoverable from technical and public participation perspectives.
Paper16%
Organics37%
Multi-material5%
Haz-waste1%
Textiles & rubber5%
Wood7%
Renovation7%
Other2%
Plastics13%
Glass3%
Ferrous3%
Non-ferrous1%
Paper16%
Organics37%
Multi-material5%
Haz-waste1%
Textiles & rubber5%
Wood7%
Renovation7%
Other2%
Plastics13%
Glass3%
Ferrous3%
Non-ferrous1%

The Government of Canada Action Plan 2000 on Climate Change
NRCan / RNCan 38 Mar-2006
5.4.2 Industrial, Commercial and Institutional (IC&I) Waste Characterization
Waste characterization data for the IC&I sector is highly problematic. The most available IC&I data are usually reported in municipal-based reports. But, how is IC&I defined? For the most part, truly industrial waste is probably not included in the definition as reflected in a quote from the GVRD annual report that says: “Industrial, commercial and Institutional … waste originates from office buildings, retail services, businesses, schools and institutions.”48 The exclusion of truly industrial waste from municipal reports is not certain; however, since large industrial facilities often manage their process residues separately or even on-site, it seems likely that this is the case (some industrial wood waste may be managed by facilities handling IC&I or CR&D waste streams).49 Chapters 16 and 17 address the issue of “missing” industrial waste data. Indeed, substantial work was conducted in the GVRD regarding an analysis of waste generation in ten different (broad) IC&I sub-sectors (with estimates developed for 71 sub-sub-categories) including various industries.50 Data for the IC&I sector were pulled from the CRD and NORD reports referenced in the previous section, the former provides an urban IC&I profile and the latter covers rural.51 As with residential, the reports provide many audit categories but only the main twelve are presented in the body of the report. Table 5.7 presents the tonnage for twelve broad categories of waste, divided into the urban and rural shares, sums the two and provides category percentages. The three largest categories of IC&I waste are organics, paper and plastics, which is the same as residential. The projections suggest that almost 60,000 tonnes of ferrous and nonferrous metal were discarded from the IC&I sector in B.C. in 2002.
48 Earth Tech (Canada), Annual Solid Waste Management Report 2001, GVRD, p. 8 49 E-mail communication with Brian Grant, WLAP, Jan-2005 50 CH2M HILL Engineering (with KPMG and RIS), 1993, Greater Vancouver Regional District Waste Flow and Recycling Audit, GVRD 51 Application of the GVRD data mentioned in the previous paragraph generates completely different results. This highlights the challenge of trying to make reliable waste characterization projections.

The Government of Canada Action Plan 2000 on Climate Change
NRCan / RNCan 39 Mar-2006
Table 5.7: Estimated Composition of IC&I Waste Disposed in B.C. (2002)
Material
Urban tonnes
Rural tonnes
Total tonnes
Percent
Paper Glass Ferrous Nonferrous Plastics Organics Wood Renovation Textiles & rubber Multi-material Haz-waste Other
210,904 32,268 37,541 6,854
161,447 333,651
95,434 33,639 57,155 62,217 3,902
19,509
73,329 5,259
12,994 2,373
32,896 103,303
n.a 9,962
24,540 n.a
10,108 17,383
284,233 37,527 50,535 9,227
194,343 436,954
95,434 43,601 81,695 62,217 14,010 36,891
21% 3% 4% 1%
14% 32%
7% 3% 6% 5% 1% 3%
Total
1,054,522 292,147 1,346,669 100%
(“n.a.” means data not available)
5.4.3 Construction, Renovation and Demolition (CR&D) Waste Characterization Using the assumed splits from Table 4.2, the general composition of B.C.’s 461,458 tonnes of CR&D disposed waste (from Table 5.2) can be calculated as shown in Table 5.8.
Table 5.8: Estimated Categorization of Residential and Non-Residential CR&D Waste for B.C. (2002)
Residential Non-Residential
Source Splits tonnes Splits tonnes
Construction Renovation Demolition
11% 55% 34%
26,903 134,515 83,155
6% 36% 58%
13,013 78,079
125,793
Total
100% 244,573 100% 216,885
The assumed splits exclude debris managed on-site, or roadway, bridge or land clearing debris. The exclusion of land clearing debris may be a significant omission for the B.C. projections because this province refers to CR&D waste as DLC or demolition, land clearing and construction waste, which the Regional District of Comox-Strathcona defines as “The sector of the waste stream originating from the construction and demolition industry and from wastes left after land clearing operations”.52 Land clearing waste is likely to include wood, stumps, rock, soil and other naturally occurring materials. Presumably this material is removed from the site and disposed in a landfill.
52 see www.rdcs.bc.ca/SolidWaste/pdf/swmp/Final_Plan_glossary.pdf (Text is in italics for emphasis only)

The Government of Canada Action Plan 2000 on Climate Change
NRCan / RNCan 40 Mar-2006
The only CR&D (DLC) characterization data found in BC was in a study done for the City of Kelowna but the percentages were very rough and highly general.53 Therefore, until more B.C. data become available, the characterization of this waste stream will be based on values derived from the Alberta study referenced below. Table 5.9 presents the tonnage projections for residential and non-residential materials combined (recall Table 4.3 to understand the numbers behind the numbers). As indicated previously, CR&D waste variability is extremely high. Factors that influence the generation and composition of CR&D waste include: the economic climate, the development of mega-projects, regional preferences for building type, materials and design, the availability of recycling facilities, local disposal regulations, and landfill tip fees.54 Table 5.9: Estimated Composition of CR&D Waste Disposed in B.C. (2002)
Material
Total Tonnes
Overall Percent
Concrete Asphalt Wood Drywall Ferrous Nonferrous Paper product Other
74,216 34,925
143,366 51,786 3,943
13,200 5,333
134,689
16% 8%
31% 11%
1% 3% 1%
29%
Total
461,458
100%
53 CH2Mhill, 2002, Technical Memorandum 1: Waste Profile for the City of Kelowna and Surrounding Region, City of Kelowna, Table 5 54 CG&S Ltd., 2000, Construction, Renovation and Demolition (CRD) Waste Characterization Study, Alberta CRD Waste Advisory Committee, Appendix II, p. A-41
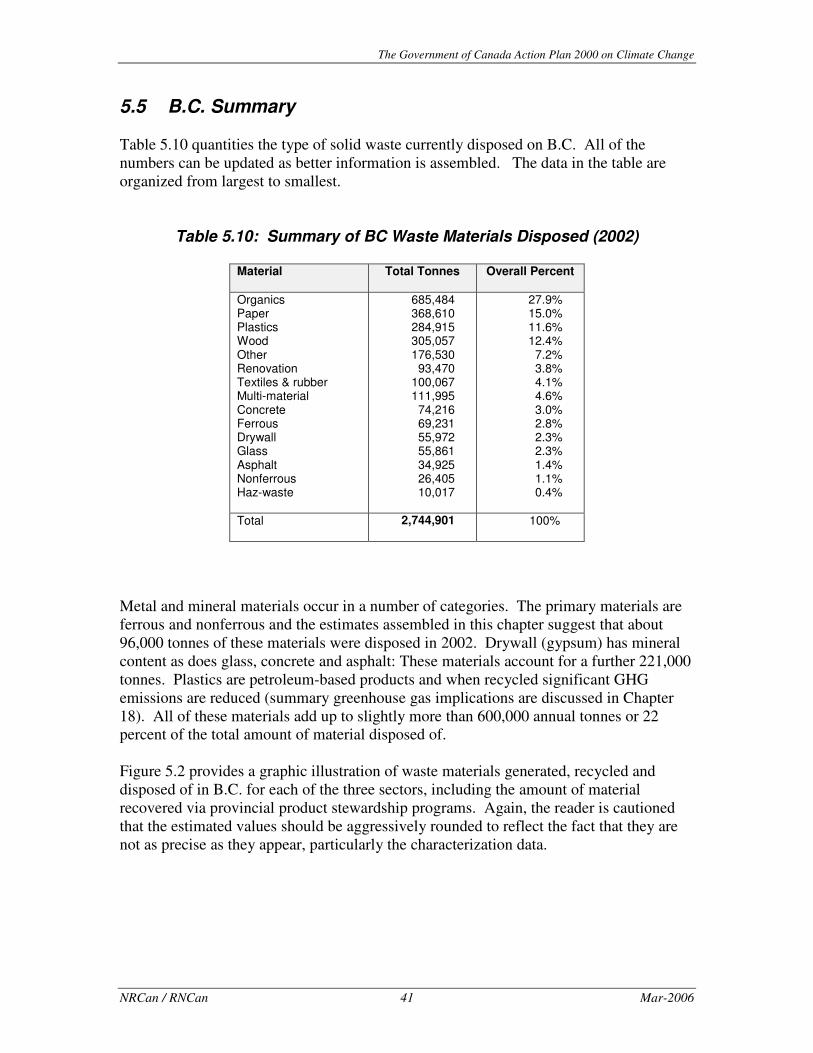
The Government of Canada Action Plan 2000 on Climate Change
NRCan / RNCan 41 Mar-2006
5.5 B.C. Summary Table 5.10 quantities the type of solid waste currently disposed on B.C. All of the numbers can be updated as better information is assembled. The data in the table are organized from largest to smallest.
Table 5.10: Summary of BC Waste Materials Disposed (2002)
Material
Total Tonnes Overall Percent
Organics Paper Plastics Wood Other Renovation Textiles & rubber Multi-material Concrete Ferrous Drywall Glass Asphalt Nonferrous Haz-waste
685,484 368,610 284,915 305,057 176,530
93,470 100,067 111,995
74,216 69,231 55,972 55,861 34,925 26,405 10,017
27.9% 15.0% 11.6% 12.4%
7.2% 3.8% 4.1% 4.6% 3.0% 2.8% 2.3% 2.3% 1.4% 1.1% 0.4%
Total
2,744,901 100%
Metal and mineral materials occur in a number of categories. The primary materials are ferrous and nonferrous and the estimates assembled in this chapter suggest that about 96,000 tonnes of these materials were disposed in 2002. Drywall (gypsum) has mineral content as does glass, concrete and asphalt: These materials account for a further 221,000 tonnes. Plastics are petroleum-based products and when recycled significant GHG emissions are reduced (summary greenhouse gas implications are discussed in Chapter 18). All of these materials add up to slightly more than 600,000 annual tonnes or 22 percent of the total amount of material disposed of. Figure 5.2 provides a graphic illustration of waste materials generated, recycled and disposed of in B.C. for each of the three sectors, including the amount of material recovered via provincial product stewardship programs. Again, the reader is cautioned that the estimated values should be aggressively rounded to reflect the fact that they are not as precise as they appear, particularly the characterization data.

NRCan / RNCan 42 Mar-2006
Figure 5.2: B.C. Solid Waste Flow in 2002
(*industrial, commercial & institutional;**construction, renovation & demolition)
Population4,114,981
Total Generation3,960,887 tonnes
Economy$130 billion (GDP)
Residential1,437,326 t.
IC&I*1,961,104 t.
CR&D**562,457 t.
ProductStewardship
Programs
110,865 t.
Rec.Disposal936,774 t.
Disposal1,346,669 t.
Disposal416,458 t.
Rec. Rec.
100,999 t417,403 t. 586,719 t.
Rec. = RecyclingRate = 31% overall
= 2,744,901 t.(total disposal)
6,1156,350
23,59222,332
27,74742,91249,778
66,25764,017
123,468
152,372
351,833 Organics
Paper
Plastics
RenovationWood
Multi-materialTextiles & rubberFerrous
OtherGlass
Haz-wasteNonferrous
3,9435,333
13,20034,92551,786
74,216
134,689
143,366 Wood
Other
Concrete
DrywallAsphaltNonferrousPaperFerrous
Organics
Paper
Plastics
Wood
Textiles & rubberMulti-materialFerrousRenovationGlassOtherHaz-wasteNonferrous9,227
14,010
37,52743,601
36,891
62,21750,535
95,434
81,695
194,343
284,233
436,954
(*industrial, commercial & institutional;**construction, renovation & demolition)
Population4,114,981
Total Generation3,960,887 tonnes
Economy$130 billion (GDP)
Population4,114,981
Total Generation3,960,887 tonnes
Economy$130 billion (GDP)
Residential1,437,326 t.
IC&I*1,961,104 t.
CR&D**562,457 t.
ProductStewardship
Programs
110,865 t.
Rec.Disposal936,774 t.
Disposal1,346,669 t.
Disposal416,458 t.
Rec. Rec.
100,999 t417,403 t. 586,719 t.
Rec. = RecyclingRate = 31% overall
= 2,744,901 t.(total disposal)
6,1156,350
23,59222,332
27,74742,91249,778
66,25764,017
123,468
152,372
351,833 Organics
Paper
Plastics
RenovationWood
Multi-materialTextiles & rubberFerrous
OtherGlass
Haz-wasteNonferrous
3,9435,333
13,20034,92551,786
74,216
134,689
143,366 Wood
Other
Concrete
DrywallAsphaltNonferrousPaperFerrous
Organics
Paper
Plastics
Wood
Textiles & rubberMulti-materialFerrousRenovationGlassOtherHaz-wasteNonferrous9,227
14,010
37,52743,601
36,891
62,21750,535
95,434
81,695
194,343
284,233
436,954 Organics
Paper
Plastics
Wood
Textiles & rubberMulti-materialFerrousRenovationGlassOtherHaz-wasteNonferrous9,227
14,010
37,52743,601
36,891
62,21750,535
95,434
81,695
194,343
284,233
436,954

NRCan / RNCan 43 Mar-2006
Chapter 6 Alberta 6.1 INTRODUCTION ...................................................................................................... 44 6.2 DEMOGRAPHICS ..................................................................................................... 44 6.3 GENERATION, RECYCLING AND DISPOSAL BY SECTOR .......................................... 45 6.3.1 Generation Data ....................................................................................... 46 6.3.2 Recycling Data.......................................................................................... 46 6.3.3 Product Stewardship Data........................................................................ 48 6.3.4 Disposal Data ........................................................................................... 49 6.4 WASTE COMPOSITION ............................................................................................ 50
6.4.1 Residential Waste Characterization ......................................................... 50 6.4.2 Industrial, Commercial and Institutional (IC&I) Waste
Characterization ....................................................................................... 52 6.4.3 Construction, Renovation and Demolition (CR&D) Waste
Characterization ....................................................................................... 53 6.5 ALBERTA SUMMARY.............................................................................................. 55

The Government of Canada Action Plan 2000 on Climate Change
NRCan / RNCan 44 Mar-2006
6.1 Introduction The purpose of this chapter is to estimate the amount of potentially recyclable material currently landfilled in Alberta. Projections of this kind are burdened with all kinds of challenges and difficulties since solid waste varies with location and season. To arrive at some reasonable estimates therefore many assumptions have been made to develop a snap shot for the year 2002. As better monitoring systems are introduced and as more waste audits are conducted, our collective knowledge about the magnitude and nature of this material will only improve. Like the other provinces, tonnage projections for materials currently discarded in Alberta are based on the Statistics Canada 2002 Waste Management Industry Survey (WMIS). This approach ensures consistency from province to province, both for demographic and waste and recycling data. Past and current local efforts to assemble waste data are also highlighted in this chapter since provincial and national (i.e. Statistics Canada) activities may merge in the future. However, Statistics Canada does not collect waste characterization data. In fact, waste audits are typically performed at the local level, such as municipalities, businesses, institutions or related associations. To estimate the amount of recyclable material disposed of in Alberta, therefore, local characterization data are used wherever possible. If provincial data are unavailable then figures from adjacent jurisdictions are used. 6.2 Demographics The 2002 population figure for Alberta is assumed to be 3,114,390.55 For the split between urban and rural populations, data from an outsourcing company56 are used since it provides population numbers for each of the 411 municipalities in Alberta, a summary of which is provided in Table 6.1. Smaller communities are aggregated as shown with Calgary and Edmonton accounting respectively for 30 percent and 22 percent of the provincial total. The intent of this section is to give the uninformed reader a sense of population distribution in this province.
55 Statistics Canada, Waste Management Industry Survey: Business and Government Sectors 2002, Catalogue no. 16F0023XIE, Table 2.2, p. 10. 56 See http://www.userful.com/tools/alberta-pop (Feb-2006)

The Government of Canada Action Plan 2000 on Climate Change
NRCan / RNCan 45 Mar-2006
Table 6.1: Alberta Population Distribution (2001)
Municipality
Population
1 Calgary 876,519 2 Edmonton 648,284 3 Strathcona County 69,268 4 Lethbridge 68,712 5 Red Deer 68,308 6 Reg Mun Of Wood Buffalo 56,841 7 St. Albert 51,716 8 Medicine Hat 50,152 9 Grande Prairie 35,692
10-11 20,000 to 29,999 population 53,663 12-32 10,000 to 19,999 population 276,283 33-83 5,000 to 9,999 population 352,397
84-132 2,500 to 4,999 population 175,163 133-201 1,000 to 2,499 population 107,886 202-411 0 to 999 population 71,510
According to Statistics Canada, a census metropolitan area consists of one or more adjacent municipalities centred on an urban area of at least 100,000 population.57 Using that as a benchmark therefore, and based on the data in Table 6.1, it is assumed that 51 percent of Alberta’s population is urban and 49 percent is rural. This distinction is made because of the notion that urban and rural wastes are different given their different socio-economic characteristics. Where urban and rural waste characterization data are available, this demographic distinction is helpful. 6.3 Generation, Recycling and Disposal by Sector Table 6.2 provides a summary of the flow of solid waste material in Alberta and is based entirely on WMIS 2002.
Table 6.2: Alberta Solid Waste Flow by Sector (2002)
Sector
Generation Disposal Recycling
Residential IC&I CR&D
1,159,697 1,642,843
677,395
866,398 1,380,306
643,590
293,300 262,537
33,805
Total tonnes Kilograms/capita
3,479,935 1,117
2,890,294 928
589,642 189
57 See http://www.ccmm.qc.ca/asp/bulletin.asp?ID=24&item=147&lang=2&Rubrique=5199

The Government of Canada Action Plan 2000 on Climate Change
NRCan / RNCan 46 Mar-2006
Compared to 2000 data (1,054 kg/cap generation; 914 kg/cap disposal; and 140 kg/cap recycling), the 2002 quantities are up in all cases. It is interesting to note the correlation between the 10 percent increase in waste generation and the 10 percent growth in GDP from 2000 to 2002.58 While per capita disposal is up, the main percentage gain has been recycling.
6.3.1 Generation Data The generation numbers are the sum of the disposal and recycling figures. How do the Statistics Canada data compare with other numbers available in the province? The City of Calgary calculated a total per capita generation rate for 1999 that was 1,290 kilograms per year.59 A comparable but approximate number for Edmonton is 774 kilograms per capita.60 Similar estimates for other Albertan municipality were unavailable when this report was prepared. The difficulty with generation numbers is that both disposal and diversion streams need to be closely monitored at the municipal level. Alberta Environment publishes sectorial splits for total waste generated and these can be compared to WMIS (in brackets): residential 33 percent (33 percent); IC&I 40 percent (47 percent); and CR&D 27 percent (20 percent).61 It is interesting to see that the residential/non-residential split is exactly the same. The higher CR&D number likely reflects increased economic activity in Alberta since 1997.
6.3.2 Recycling Data Alberta Environment does not track the amount of materials diverted from landfill. In 2000, WMIS did not report separate non-residential recyclables into the IC&I and CR&D sectors. Fortunately, in 2002 Statistics Canada was able to identify separate totals for each of the three sectors as shown in Table 6.2. ����������������� ���������
To compare local diversion data with the Statistics Canada data for 2002, a sample of reported recycling data were assembled for a number of municipalities throughout Alberta. The municipalities identified in Table 6.3 were randomly selected and are not
58 http://www.finance.gov.ab.ca/publications/measuring/measup02/prosper.html#2 (September, 2004) 59 Leszkowicz, John et al., “Using a Waste Generation Model and GIS Applications for the City of Calgary ICI/CRD Waste Composition Study”, paper presented at SWANA 1st Canadian Solid Waste Symposium, June 2003, Table 1. 60 Source: www.ewmce.com/pdf/abboud-rcapresentation2002.pdf (May, 2004) 61 Source: http://www3.gov.ab.ca/env/waste/aow/waste/index.html (May, 2004). All of the Alberta solid waste characterization data presented on their web site are from the following report: Agra Earth and Environmental, 1997, Opportunities for Accelerated Solid Waste Reduction in Alberta, prepared for the Alberta Environmental Protection Agency

The Government of Canada Action Plan 2000 on Climate Change
NRCan / RNCan 47 Mar-2006
intended to be representative of the province. In the table, “diversion” includes recycling and composting activities.
Table 6.3: Residential Recycling Data Comparison62
Municipality Year Population Generation Disposal Diversion tonnes tonnes tonnes %
Banff Calgary Cochrane Edmonton Grand Prairie Red Deer
2000 2000 2000 2002 1999 1999
7716 840,749
11,173 648,284
35,962 63,940
4016 347,614
3,416 231,857
12,427 27,536
3116 282,274
2,800 96,569 9,220
22,631
900 65,340
616 135,288
3,207 4,905
22% 19% 18% 58% 26% 18%
Sub-total
1,607,824 626,866 416,610 210,256 34%
Alberta total 2002 3,114,390 1,159,698 866,398 293,300 25%
Given the size of Edmonton and its high diversion rate, the sample sub-total diversion rate is skewed upwards. Another thing to keep in mind is that the GAP data (see footnote 8) include product stewardship programs while the Statistics Canada survey excludes them. It is therefore reasonable to assume that more municipalities with lower diversion rates and similar treatment of product stewardship would bring the sub-total and Alberta total numbers closer together. ������������ ���������
Apart from WMIS, the only IC&I recycling tonnage found are for Calgary. From Table 6.2, Statistics Canada reports that the IC&I sector recycled 262,537 tonnes of material. The City of Calgary estimates that in 1999 the IC&I sector recycled 117,000 tonnes of material.63 How does this relate to the rest of the province? Calgary has 28 percent of the provincial population and their IC&I recyclable tonnage accounts for almost 45 percent of the total (the data years do not match up but are close enough for comparison). In terms of economic activity, Calgary’s service sector apparently accounts for more than 60 percent of Alberta’s gross domestic product.64 It may be that Calgary’s IC&I sector is disproportionately big, hence the large amount of recyclable material but more detailed data are required to shed more light on this issue. � ���������� ���������
From Table 6.2 again, Statistics Canada reports that 33,805 tonnes of CR&D waste material were recycled in 2002 but the composition of this material is not provided.
62 Data sources: Banff, Calgary, Cochrane, Grand Prairie and Red Deer are from GAP sheets, http://www.csr.org/gap/index.htm; Edmonton data are from that city’s 2002 Waste Management Branch Annual Review; Alberta data are from Statistics Canada WMIS 2002. 63 Leszkowicz, John et al., “Using a Waste Generation Model and GIS Applications for the City of Calgary ICI/CRD Waste Composition Study”, paper presented at SWANA 1st Canadian Solid Waste Symposium, June 2003, Table 1. 64 See http://www.immigrationvisa.org/calgary.htm

The Government of Canada Action Plan 2000 on Climate Change
NRCan / RNCan 48 Mar-2006
On the other hand, a review of provincial data is informative. The Alberta Construction, Renovation and Demolition (CR&D) Waste Advisory Committee commissioned a study in 2000 to examine the waste materials generated in this sector. In that report, it is estimated that between 484,000 and 713,000 tonnes of concrete and asphalt were recycled in 1999.65 Other recycled CR&D materials are not quantified. Calgary data for 1999 indicate that 89,000 tonnes of concrete or asphalt were diverted.66 Similarly, the City of Edmonton reports that they recycled about 153,000 tonnes of concrete/asphalt material in 2002.67 However, the Statistics Canada survey excludes civil engineering waste (i.e. roads and bridge work), hence the discrepancy between the WMIS numbers and the ones identified in the previous paragraph. One of the primary reasons that Statistics Canada does not include civil engineering waste is that it could greatly distort local waste data (consider the impact of a demolished bridge on a relatively small community’s waste profile, as noted previously). In Section 17.2, the concrete and asphalt materials are examined in more detail with a view towards including tonnage that does not get captured in the WMIS reporting.
6.3.3 Product Stewardship Data As indicated, WMIS does not include materials recovered via product stewardship programs. Since these quantities are not insignificant, this report will include these data. In Alberta there are six stewardship programs that divide into two groups: one group is regulated and the other is not. The first group addresses beverage containers (excluding milk), used oil and oil materials, tires and electronics. The non-regulated group targets milk containers and empty pesticide containers. Table 6.4 provides a summary of the materials recovered through these programs. It should be noted that the data are not all from the same year but are considered approximate enough for the purposes of this report. The estimated product stewardship tonnage is added to the Statistics Canada generation data presented in Table 6.2. As a result, total generation in the residential and IC&I sectors shown in Figure 6.2 is slightly bigger because it includes these stewardship data.
65 CH2M Gore & Storrie (CG&S) Limited, 2000, Construction, Renovation and Demolition (CRD) Waste Characterization Study, Alberta CRD Waste Advisory Committee, p. V 66 Leszkowicz, Table 1. 67 Edmonton’s 2002 Waste Management Branch Annual Review can be found at http://www.edmonton.ca/portal/server.pt/gateway/PTARGS_0_2_271_213_0_43/http%3B/CMSServer/COEWeb/environment+waste+and+recycling/waste/

The Government of Canada Action Plan 2000 on Climate Change
NRCan / RNCan 49 Mar-2006
Table 6.4: Alberta Product Stewardship of Non-Hazardous Materials (2002)
Material Recovered Quantities
Glass bottles68 Tires69 Aluminum cans68 Plastic containers68 Polycoat cartons70 Pesticide containers71 Computers72 Bi-metal cans68
52,136 23,206 10,069 8,498 1,841
714 500 290
Total
97,255
In addition to the footnote references, Environment Canada maintains a web site on product stewardship that provides more detail on the Alberta programs (see http://www.ec.gc.ca/epr/en/index.cfm).
6.3.4 Disposal Data The province of Alberta has collected municipal solid waste disposal data since 1988, which is the year used to calculate historical diversion rates. Specifically, the data between 1988 and 1995 were collected via the Waste Management Assistance (i.e. landfill development) grant program under the auspices of Alberta Environment. Since 1995, about 27 representative landfills or landfill authorities have participated in a voluntary data collection effort that was initiated and is currently managed by Alberta Environment.73 These landfills have weigh scales, they are municipal facilities and importantly they are willing to submit data reports. These 27 landfills service about 83 percent of the province. The data are compiled and divided by population served in order to derive per capita estimates of solid waste disposed, which are then used to develop projections for the remaining 500,000 residents served by other landfills. The estimated Alberta Environment disposal number for in 2002 is 2,252,269 tonnes, which includes residential, IC&I and CR&D materials. The comparable Statistics Canada number of 2,890,294 tonnes from Table 6.2 is 28 percent higher. Since the Statistics Canada survey area population was 97 percent of the total, it is assumed that their data are more accurate.
68 Source: http://www.bcmb.ab.ca/resources/reportcard.html (Feb-2005); with conversion factors from www.abcrc.com/StatsInfo/RecoveryVolume and Brewers Association of Canada. 69 Source: http://www.ec.gc.ca/epr/inventory/en/DetailView.cfm?intInitiative=99 (2 June 2004) 70 Alberta Dairy Council Plastic Milk Jug Recycling Program, Annual Report 2002-2003, p. 12 http://www.milkcontainerrecycling.com/AB/documents/annualreport2003_lowres.pdf (2 June 2004) 71 Source: http://www.croplife.ca/english/pdf/CMP20061.pdf (3 June 2004) 72 Source: http://www3.gov.ab.ca/env/waste/aow/flcr/program/index.html (3 June 2004) 73 Personal communication with Christine Della Costa, Alberta Environment, June 12, 2003

The Government of Canada Action Plan 2000 on Climate Change
NRCan / RNCan 50 Mar-2006
WMIS 2002 provides disposal data for each of the three sectors with the following splits: residential 30 percent, IC&I 48 percent and CR&D 22 percent. Comparable Calgary splits are residential 25 percent, IC&I 45 percent and CR&D 30 percent,74 which are close to WMIS. For residential materials a distinction is made regarding urban and rural disposal data because it is assumed that waste from these two different areas of the province are different. In Section 6.2 it is assumed that Alberta’s population is 51 percent urban and 49 percent rural: Only Calgary and Edmonton fall into the urban category. Table 6.5 applies the assumed demographic split to the amount of residential waste disposed to divide the amounts between urban and rural. This is not done for IC&I and CR&D waste because rural data for these sectors were not available when this report was prepared.
Table 6.5: Alberta Waste Materials Disposed (2002)
Area Residential
Urban Rural
445,912 420,486
Total
866,398
6.4 Waste Composition Building on the WMIS disposal data, it is possible to apply local waste characterization data. The preferred approach is to use provincially relevant data. In the case of Alberta, detailed composition data are available from Calgary and Edmonton, particularly for the residential waste material stream. The IC&I data are more limited in scope while the CR&D waste issue has been addressed at length by the Advisory Committee mentioned in Section 6.3.2.
6.4.1 Residential Waste Characterization Calgary and Edmonton conducted waste characterization studies in 1999 and 2000 respectively. For the purposes of making provincial projections, the Calgary and Edmonton material categories were merged, sub-totals added and new percents derived. Both looked at more than fifty different categories of material but for this project these were eventually collapsed to nine broader groups.
74 Leszkowicz, Table 1.

The Government of Canada Action Plan 2000 on Climate Change
NRCan / RNCan 51 Mar-2006
For the “rural” communities, Alberta waste composition data were unavailable when this report was prepared. As a result, rural data from British Columbia are used instead.75 In Table 6.6, the reader is advised not to presume accuracy to the level presented.
Table 6.6: Estimated Composition of Alberta Residential Waste Disposed (2002)
Material
Urban tonnes
Rural tonnes
Total tonnes
Paper Glass Ferrous Nonferrous Plastics Organics Renovation Haz-waste Other
102,919 9,216 9,466 3,416
35,793 227,943
7,311 4,357
45,490
75,982 13,245 8,914 2,187
50,837 205,281
11,942 6,602
45,497
178,901 22,462 18,381 5,603
86,630 433,225
19,252 10,959 90,986
Total
445,912 420,486 866,398
The projected quantity of metal disposed of is very small compared to the other materials. Figure 6.1 illustrates the composition of the residential garbage stream with urban and rural quantities combined. Figure 6.1: Estimated Composition of Alberta Residential Waste Disposed
(2002) The Alberta Environment web site presents a pie chart for residential waste as well. Their six categories and values are “food & yard waste” (35 percent), “paper” (25
75 EcoChoice Consulting and Footprint Environmental Consultants, 1998, Waste Composition Survey of the Regional District of North Okanogan
Paper21%
Organics49%
Other11%
Ferrous2%
Glass3%
Renovation2%
Haz-waste1%
Non-ferrous1%
Plastics10%

The Government of Canada Action Plan 2000 on Climate Change
NRCan / RNCan 52 Mar-2006
percent), “other’ (25 percent), “plastics” (7 percent), “metals” (5 percent) and “glass” (3 percent).76 Some of the values match but most of them do not. This is typical for waste characterization data.
6.4.2 Industrial, Commercial and Institutional (IC&I) Waste Characterization Measurement of the IC&I waste stream is a great challenge given the diversity of generators found in this sector (schools, hospitals, office buildings and restaurants for example). The IC&I waste stream therefore is completely dependent on the economic profile of the community in question. This section takes available waste composition data and applies it to the disposal numbers set out in Section 6.3. An alternative approach to developing projections in this sector is presented in Chapter 16. Two sets of Alberta data are available for the IC&I sector: One is from the City of Calgary and Alberta Environment provides the other. A summary of these two data sets is provided in Table 6.7. For the purposes of developing projections using this approach, the Calgary numbers will be used since the Alberta Environment data appear to be more summary in nature and fewer categories are included. Their paper percentage appears to be quite high compared to other studies, but this is a subjective comment. As expressed previously, when better data become available, the projections can be updated.
Table 6.7: Alberta Composition Data for IC&I Waste Disposed (2002)
Material
Calgary77 Alberta Environment78
Paper Organic Wood & soil Other Plastics Metal Renovation Glass
34.1% 24.9% 12.4% 10.1% 9.5% 4.3% 2.8% 1.9%
54% 13%
- 15% 7% 7%
- 4%
One concern with the Calgary data is that they are probably not representative of the province in terms of its IC&I profile. However, rural IC&I data are available from BC and while the categories do not exactly match they will be used to estimate the composition of Alberta’s rural waste. Therefore the reader is cautioned accordingly.
76 See http://www3.gov.ab.ca/env/waste/aow/waste/index.html (May 2004), Agra Earth and Environmental, 1997, Opportunities for Accelerated Solid Waste Reduction in Alberta, prepared for the Alberta Environmental Protection Agency 77 Leszkowicz, Table 1. 78 See http://www3.gov.ab.ca/env/waste/aow/waste/industrial.html (May 2004). These data are from a 1997 study done by AGRA Earth & Environmental, for Alberta Environment.

The Government of Canada Action Plan 2000 on Climate Change
NRCan / RNCan 53 Mar-2006
Table 6.8: Alberta Projected Tonnage for IC&I Waste Disposed (2002)
Material
Urban tonnes
Rural tonnes
Total tonnes
Paper Organic Wood & soil Plastics Other Ferrous Nonferrous Renovation Glass HHW Textiles
242,248 176,891
88,090 67,489 71,751 26,576 3,971
19,891 13,498
n.a. n.a.
168,145 236,877
n.a. 75,431 39,859 30,656 4,581
22,844 12,058 23,179 56,272
410,393 413,768
88,090 142,920 111,610
57,232 8,552
42,735 25,556 23,179 56,272
Total
710,405 669,902 1,380,307
In terms of minerals and metals, like the residential sector, the Alberta IC&I sector discards relatively little. It is estimated that about 66,000 tonnes of metal were lost to Alberta landfills in 2002 and 87 percent of that was ferrous.
6.4.3 Construction, Renovation and Demolition (CR&D) Waste Characterization This section presents several different data sets for the disposed CR&D waste stream. The reader is advised to consult Section 4.3 where more background on the data for CR&D is provided. The Alberta Construction, Renovation and Demolition Waste Advisory Committee commissioned the “Construction, Renovation and Demolition Waste Characterization Study” in 2000. In the concluding section of their report, the summary analysis provides a range of projected quantities, which reflects the variability of this waste fraction. Table 6.9 presents the results of their survey and audit work.
Table 6.9: Alberta CR&D Survey and Audit Data79
Material
Survey Audit Average
Other Wood Roofing Metal Concrete Asphalt Drywall Brick/stone
29% 19% 13% 12%
8% 8% 6% 5%
25% 34% 10%
6% 10%
1% 13%
1%
27.0% 26.5% 11.5%
9.0% 9.0% 4.5% 9.5% 3.0%
For the purposes of developing tonnage projections for Alberta, an average of the survey and audit data was arbitrarily taken and then these percentages applied to the Statistics
79 CH2M Gore & Storrie (CG&S) Limited, 2000, Construction, Renovation and Demolition (CRD) Waste Characterization Study, Alberta CRD Waste Advisory Committee, Table 7-1

The Government of Canada Action Plan 2000 on Climate Change
NRCan / RNCan 54 Mar-2006
Canada CR&D disposed waste figure provided in Table 6.2 (which is 643,590 tonnes in 2002). The estimated material tonnes are presented in Table 6.10. Also provided in Table 6.10 is a second data set derived from a compilation of CR&D data as discussed in Section 4.3. These “literature review” data are based on the development of ranges assembled from studies across North America and as such are much more generic and average. The survey and audit data from the CRD Advisory Committee (averages from Table 6.9) are applied in Alberta only.
Table 6.10: Estimated Alberta CR&D Tonnes Disposed (2002)
Material
CRD Advisory Committee
Lit. Review Compilation
Wood Paper product Other Roofing Drywall Concrete Nonferrous Asphalt Brick/stone Ferrous
170,551 90,360 83,409 74,013 61,141 57,923 44,601 28,962 19,308 13,322
199,951 7,439
187,850 -
72,225 103,507
18,410 48,709
- 5,499
Total
643,590 643,590
As illustrated in Table 6.10, the estimated amount of ferrous or non-ferrous metal being discarded varies greatly depending on the characterization data used. The Alberta Environment web site also provides average CR&D waste composition data,80 by weight, as follows: wood waste, 35 percent; rubble, aggregate and ceramic, 24 percent; other, 19 percent; building materials, 14 percent; and metal, 8 percent. These data can be compared to the ones used in Table 6.9.
80 See http://www3.gov.ab.ca/env/waste/aow/waste/index.html (May 2004), Agra Earth
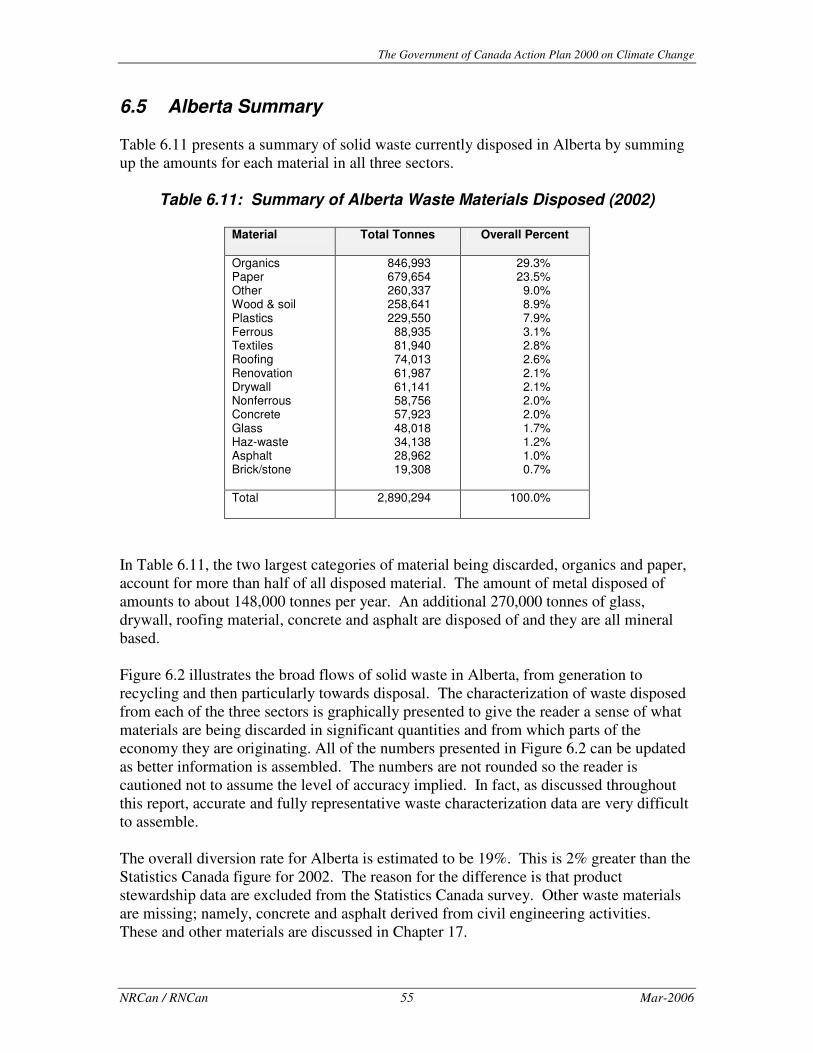
The Government of Canada Action Plan 2000 on Climate Change
NRCan / RNCan 55 Mar-2006
6.5 Alberta Summary Table 6.11 presents a summary of solid waste currently disposed in Alberta by summing up the amounts for each material in all three sectors.
Table 6.11: Summary of Alberta Waste Materials Disposed (2002)
Material
Total Tonnes Overall Percent
Organics Paper Other Wood & soil Plastics Ferrous Textiles Roofing Renovation Drywall Nonferrous Concrete Glass Haz-waste Asphalt Brick/stone
846,993 679,654 260,337 258,641 229,550
88,935 81,940 74,013 61,987 61,141 58,756 57,923 48,018 34,138 28,962 19,308
29.3% 23.5%
9.0% 8.9% 7.9% 3.1% 2.8% 2.6% 2.1% 2.1% 2.0% 2.0% 1.7% 1.2% 1.0% 0.7%
Total
2,890,294
100.0%
In Table 6.11, the two largest categories of material being discarded, organics and paper, account for more than half of all disposed material. The amount of metal disposed of amounts to about 148,000 tonnes per year. An additional 270,000 tonnes of glass, drywall, roofing material, concrete and asphalt are disposed of and they are all mineral based. Figure 6.2 illustrates the broad flows of solid waste in Alberta, from generation to recycling and then particularly towards disposal. The characterization of waste disposed from each of the three sectors is graphically presented to give the reader a sense of what materials are being discarded in significant quantities and from which parts of the economy they are originating. All of the numbers presented in Figure 6.2 can be updated as better information is assembled. The numbers are not rounded so the reader is cautioned not to assume the level of accuracy implied. In fact, as discussed throughout this report, accurate and fully representative waste characterization data are very difficult to assemble. The overall diversion rate for Alberta is estimated to be 19%. This is 2% greater than the Statistics Canada figure for 2002. The reason for the difference is that product stewardship data are excluded from the Statistics Canada survey. Other waste materials are missing; namely, concrete and asphalt derived from civil engineering activities. These and other materials are discussed in Chapter 17.

NRCan / RNCan 56 Mar-2006
Figure 6.2: Alberta Solid Waste Flow in 2002
Population3,114,390
Total Generation3,577,191 tonnes
Economy$ 150 billion (GDP)
Residential1,232,639 t.
IC&I*1,667,157 t.
CR&D**677,395 t.
Rec.Disposal866,398 t.
Disposal1,380,306 t.
Disposal643,590 t.
Rec.Rec.
33,805 t.293,300 t. 262,537 t.
ProductStewardship
Programs
97,255 t.
Rec. = RecyclingRate = 19% overall
*Industrial, commercial & institutional; **Construction, renovation & demolition
= 2,890,294 t.(total disposal)
Organics433,225
Paper178,901
Plastics86,630
Other65,318Textiles25,668Glass22,462Renovation19,252Ferrous18,381Haz-waste10,959Non-ferrous5,603
Organic
Paper
Plastics
Other
Wood & soil
FerrousTextilesRenovationGlassHHWNonferrous
413,768
410,393
142,920
111,610
88,090
57,23256,27242,73525,55623,179
8,552
Wood
Paper
Other
Roofing
Drywall
Concrete
Nonferrous
Asphalt
Brick/stone
Ferrous13,322
19,308
28,962
44,601
57,923
61,141
74,013
170,551
83,409
90,360
Population3,114,390
Total Generation3,577,191 tonnes
Economy$ 150 billion (GDP)
Residential1,232,639 t.
IC&I*1,667,157 t.
CR&D**677,395 t.
Rec.Disposal866,398 t.
Disposal1,380,306 t.
Disposal643,590 t.
Rec.Rec.
33,805 t.293,300 t. 262,537 t.
ProductStewardship
Programs
97,255 t.
Rec. = RecyclingRate = 19% overall
*Industrial, commercial & institutional; **Construction, renovation & demolition
= 2,890,294 t.(total disposal)
Organics433,225
Paper178,901
Plastics86,630
Other65,318Textiles25,668Glass22,462Renovation19,252Ferrous18,381Haz-waste10,959Non-ferrous5,603
Organics433,225
Paper178,901
Plastics86,630
Other65,318Textiles25,668Glass22,462Renovation19,252Ferrous18,381Haz-waste10,959Non-ferrous5,603
Organic
Paper
Plastics
Other
Wood & soil
FerrousTextilesRenovationGlassHHWNonferrous
413,768
410,393
142,920
111,610
88,090
57,23256,27242,73525,55623,179
8,552
Organic
Paper
Plastics
Other
Wood & soil
FerrousTextilesRenovationGlassHHWNonferrous
413,768
410,393
142,920
111,610
88,090
57,23256,27242,73525,55623,179
8,552
Wood
Paper
Other
Roofing
Drywall
Concrete
Nonferrous
Asphalt
Brick/stone
Ferrous13,322
19,308
28,962
44,601
57,923
61,141
74,013
170,551
83,409
90,360
Wood
Paper
Other
Roofing
Drywall
Concrete
Nonferrous
Asphalt
Brick/stone
Ferrous13,322
19,308
28,962
44,601
57,923
61,141
74,013
170,551
83,409
90,360

NRCan / RNCan 57 Feb-2006
Chapter 7 Saskatchewan 7.1 INTRODUCTION ...................................................................................................... 58 7.2 DEMOGRAPHICS ..................................................................................................... 58 7.3 GENERATION, RECYCLING AND DISPOSAL BY SECTOR .......................................... 59 7.3.1 Generation Data ....................................................................................... 60 7.3.2 Recycling Data.......................................................................................... 60 7.3.3 Product Stewardship Data........................................................................ 61 7.3.4 Disposal Data ........................................................................................... 62 7.4 WASTE COMPOSITION ............................................................................................ 63
7.4.1 Residential Waste Characterization ......................................................... 63 7.4.2 Industrial, Commercial and Institutional (IC&I) Waste
Characterization ....................................................................................... 65 7.4.3 Construction, Renovation and Demolition (CR&D) Waste
Characterization ....................................................................................... 66 7.5 SASKATCHEWAN SUMMARY .................................................................................. 67

The Government of Canada Action Plan 2000 on Climate Change
NRCan / RNCan 58 Mar-2006
7.1 Introduction In terms of waste management and related data, the Province of Saskatchewan is challenged with a small population dispersed over great distances. As a result, there are many small landfills remotely located many of which do not have weigh scales. The provincial ministry that is responsible for solid waste management rules and regulations is the Environmental Protection Branch, Saskatchewan Environment (SE). Due to limited resources and because of other higher priorities, SE does not monitor the amount of solid waste disposed of in the province nor is the amount of municipally managed recyclables tracked. The one exception regarding “waste” data monitoring concerns four province-wide stewardship programs. Annual reports are published for each of the following four programs:
� Beverage Container Collection and Recycling Program � Pesticide Container Collection Program � The Scrap Tire Management Program � Used Oil Material Recycling Program
Data from the first three programs are presented in Section 7.3.3. More discussion on scrap tires is provided in Section 17.2. Used oil is considered to be a liquid hazardous waste and as such is not included in this report. 7.2 Demographics According to Statistics Canada there were 995,490 people residing in Saskatchewan in 2002.81 The Saskatchewan Bureau of Statistics indicates that 64 percent of the population is urban and the remaining 36 percent are rural.82 However, the distinction between urban and rural populations is a moot point since waste characterization data are available for Regina and Saskatoon only. The Cities of Regina and Saskatoon contain 38 percent of the province’s residents. Table 7.1 summarizes the population distribution in Saskatchewan (but the total adds up to 978,933 due to the different data source).
81 Statistics Canada, Waste Management Industry Survey: Business and Government Sectors 2002, Catalogue no. 16F0023XIE, Table 2.2, p. 10. 82 These are 2001 data. See http://www.gov.sk.ca/bureau.stats for more information.

The Government of Canada Action Plan 2000 on Climate Change
NRCan / RNCan 59 Mar-2006
Table 7.1: Saskatchewan Population Distribution (2001)83
Municipality
Number Population
Total Cities Total Towns Total Villages Total Rural Municipalities Indian Reserves Northern Hamlets Unorganized
14 143 370 303 172
9 2
528,134 153,090
63,968 187,825
43,340 944
1,632
The number of small (and remote) communities in Saskatchewan highlights the challenges of establishing a comprehensive, cost-effective recycling infrastructure in this province. A regional, co-operative approach (e.g. B.C., Nova Scotia and New Brunswick) to recovering recyclable materials may be the only economical approach under such circumstances. 7.3 Generation, Recycling and Disposal by Sector Table 7.2 provides a summary of the flow of solid waste material in Saskatchewan and is based on the Statistics Canada WMIS 2002 survey. However, the quantity of materials recycled in the non-residential sector (numbers shaded) is estimated by calculating the generation rate84 and then subtracting tonnes disposed.
Table 7.2: Saskatchewan Solid Waste Flow by Sector (2002)85
Sector
Generation Disposal Recycling
Residential IC&I CR&D
321,069 537,048
83,615
278,692 441,109
75,323
42,376 95,939 8,292
Total tonnes Kilograms/capita
941,731 946
795,124 799
146,607 147
According to WMIS 2002, Saskatchewan’s performance has improved since 2000. In particular, the amount disposed of decreased by 26,822 tonnes. Overall recycling tonnage dropped by 3,436 tonnes but residential recycling increased by 8,579 tonnes (which suggests that the decrease occurred in the IC&I and CR&D sectors). In fact, from 2000 to 2002 Statistics Canada estimates that 26,473 residents migrated out of
83 Saskatchewan Bureau of Statistics, http://www.gov.sk.ca/bureau.stats/pop/popindex.htm 84 Generation = Disposal / (1 – diversion rate); disposal tonnage and diversion rates are provided by Statistics Canada, WMIS 2002. 85 Statistics Canada, Waste Management Industry Survey: Business and Government Sectors 2002, Catalogue no. 16F0023XIE, Table A.1, p. 14.

The Government of Canada Action Plan 2000 on Climate Change
NRCan / RNCan 60 Mar-2006
Saskatchewan. The population decrease may reflect reduced economic activity, which frequently correlates with the amount of solid waste generated.
7.3.1 Generation Data Generation equals disposal plus recycling. The purpose of this section is simply to compare local data sources or audits with the Statistics Canada numbers. In Saskatchewan, reports from the Cities of Saskatoon and Regina were available for review. The 2002 GAP numbers for Regina indicate that 430 kg/capita/year of residential solid waste are generated.86 GAP does not report IC&I data for Regina. In a City of Regina 1996 study, the residential generation rate was 402 kg/cap/year.87 In the same report a figure of 504 kg/cap/yr is estimated for the IC&I sector (that includes CR&D materials). Together these numbers suggest a total waste generation rate of 906 kg/cap/year. The 2002 WMIS residential solid waste generation number is 323 kg/cap/year and the overall generation rate is 946 kg/cap/year, which is less than the national average of 971 kg/cap/year but not much different than the 1996 Regina estimate. The City of Saskatoon report does not provide any estimates for total waste generation.88
7.3.2 Recycling Data The City of Saskatoon does report that 21,000 tonnes of municipal solid waste (i.e. newspapers, tin cans, beverage containers, milk jugs and cartons, and used clothing) were diverted away from the landfill in 2001.89 This works out to 103 kg/cap/yr. The comparable figure from the Regina GAP chart is 69 kg/cap/yr. These numbers all relate to residential materials only and appear to include product stewardship materials as well. As shown in Table 7.2, the quantity of residential recyclables managed in 2002 was 42,376 tonnes, which equates to 43 kg/cap/yr for the whole province. This seems like a reasonable divergence from the Saskatoon and Regina numbers given the fact that about 30% of the population live in rural and remote parts of the province where recycling is a more difficult undertaking. The total amount of non-residential recycling in 2002 is 104,231 tonnes. Since WMIS also provides diversion rates and disposal amounts for IC&I and CR&D, it is possible to
86 See http://www.csr.org/gap/index.htm for municipal GAP records. 87 University of Regina, 1996, City of Regina Waste Characterization Study Final Report, p. 18. The per capita figures have been annualized by multiplying them by 365 days. 88 City of Saskatoon Environmental Services Department, 1998, Solid Waste Characterization Study 89 http://www.city.saskatoon.sk.ca/dpt/city_manager/2003_report_citizens.pdf (Oct 19, 2004)

The Government of Canada Action Plan 2000 on Climate Change
NRCan / RNCan 61 Mar-2006
estimate the quantity of recycling occurring in each sector (see shaded figures in Table 7.2).
7.3.3 Product Stewardship Data The Environmental Protection Branch of Saskatchewan Environment produces an annual report on provincial recycling programs.90 Four programs are included in that report: the beverage container collection and recycling program; the pesticide container collection program; the scrap tire management program; and the used oil material recycling program. Two other initiatives under development are waste paint and old electronic equipment. Saskatchewan Environment contracts with an organization called SARCAN91 to operate a province wide depot system for beverage containers. Table 7.3 presents the SARCAN return rates for 2002/3 and converts their reported units into weights. Calculated numbers are in italics.
Table 7.3: Designated Beverage Containers Sold and Returned (2002)92
Container Type
Units Sold Units Returned
Return Rate
Tonnes Returned
Aluminum cans Plastic bottles Non-refillable glass bottles Drink cartons
121,450,427 74,080,486 25,772,485 32,349,243
117,636,884 67,420,650 22,880,812 17,274,496
96.86% 91.01% 88.78% 53.40%
1,765 3,058
11,933 518
Total 253,652,641
225,212,842 88.79% 17,274
The number of units sold was calculated by dividing units returned by the return rate. The tonnage numbers are based on the following assumptions:93 It is assumed that each aluminum can weighs 0.015 kilogram, 10 PET plastic soft drink bottles per pound, one glass bottle weighs 1.15 pounds, and a typical drink carton is one litre and weighs 0.03 kg. The Brewers Association of Canada operates a return to retailer program for refillable beer bottles and recyclable beer cans. This program achieves a very high rate of return. To calculate the amount of glass actually recycled every year, tonnes returned are divided by 15, which is the average number of refills per bottle (see Section 4.4). Table 7.4 summarizes the beer container data.
90 See http://www.se.gov.sk.ca/environment/recycle/ (Feb-2006) 91 SARCAN Recycling, http://www.sarcsarcan.ca/sarcan.htm (Feb-2006) 92 See http://www.se.gov.sk.ca/environment/recycle/2003%20Recycling%20Report.pdf (Feb-2006) 93 Personal communication with Mark McKenney, MGM Management, July 2003; RIS Ltd. recyclable material files wherein drink cartons have an assumed density of 30 kg/m3 (loose).

The Government of Canada Action Plan 2000 on Climate Change
NRCan / RNCan 62 Mar-2006
Table 7.4: Beer Containers Sold and Returned in Saskatchewan 94
Container Type
Units Sold Return Rate
Tonnes Returned
Tonnes Recycled
Refillable glass bottles Aluminum cans
129,620,354 30,210,321
93.7% 95.9%
32,710 435
2,181 435
Total
2,616
An organization called Croplife operates a voluntary pesticides container recovery program. In Saskatchewan the program recovered an estimated 1,072 tonnes of empty plastic containers (probably high density polypropylene) in 2002.95 According to provincial sources,96 34.6 million pounds of scrap tires were recovered in 2002. This amount can be converted to 15,692 tonnes. More general discussion of tires recycled is provided in Section 17.2. The total quantity of materials recovered under product stewardship in Saskatchewan is estimated to be 36,654 tonnes: This includes non-alcoholic beverage containers, beer containers, pesticide containers and tires. Used motor oil is not included in this summary since it is a liquid substance, which is outside the scope of this report. However, 193 tonnes of oil containers (assumed to be plastic) and 821 tonnes of oil filters were recovered and recycled in 2003,97 so these figures are added to the previous for a grand product stewardship total of 37,668 tonnes.
7.3.4 Disposal Data As indicated previously, Saskatchewan Environment does not track waste materials disposed. From Table 7.2 it is understood that 799 kg/capita or waste are disposed of in this province each year. What do the studies from Saskatoon and Regina report? In the City of Saskatoon 1998 report, data are in kilograms per capita per day:98 the residential sector disposed 0.93 kg/cap/day; the commercial/residential disposed 0.11 kg/cap/day; the IC&I sector disposed 0.40 kg/cap/day; and CR&D and self haul waste amounted to 0.69 kg/cap/day. Together these figures equal 2.13 kg/cap/day or 777 kg/cap/year, which is quite close to WMIS. In the City of Regina 1996 report, the estimated disposal rate for 1994 was 1.03 kg/cap/day for the residential sector and 1.08 kg/cap/day for the IC&I sector.99 The CR&D sector was responsible for about 22 percent of the IC&I figure. Converted to an
94 See www.brewers.ca Units to kilogram conversion factors from Brewers Association staff 95 See http://www.croplife.ca/english/pdf/CMP20061.pdf 96 See http://www.scraptire.sk.ca/pdf/ar/2002_ar.pdf 97 See http://www.se.gov.sk.ca/environment/recycle/2003%20Recycling%20Report.pdf (August 2005). It is assumed that one used oil filter weighs 1 pound or 0.45 kg and is comprised predominantly of steel. 98 City of Saskatoon Environmental Services Department, 1998, Solid Waste Characterization Study, p. 1-2 99 University of Regina, 1996, City of Regina Waste Characterization Study Final Report, p. 9.

The Government of Canada Action Plan 2000 on Climate Change
NRCan / RNCan 63 Mar-2006
annual summary figure, the report suggests that 770 kg/cap/yr of solid waste are disposed of. Although this figure is somewhat dated, it is close to both the Saskatoon and Statistics Canada numbers. 7.4 Waste Composition As in Chapters 5 and 6, this section assembles available, local data and applies it to the waste disposal data compiled by Statistics Canada and presented in Table 7.2. In the case of Saskatchewan, the only local data to be used are from the Cities of Regina and Saskatoon (already referenced).
7.4.1 Residential Waste Characterization As noted previously, the Regina and Saskatoon waste characterization studies are from 1996 and 1998 respectively, which covers off the urban areas. However, rural data cannot be sourced locally. There are three options: Use B.C. or Manitoba rural data or apply the Regina/Saskatoon data across the province. To keep the analysis simple, it was decided to go with the latter option. The Manitoba option was attractive given its similar agriculture based economy; however, it does not have a return-to-retailer deposit system like Saskatchewan, so this would probably result in some divergence in the nature of residential waste in both provinces. Even though the composition data are the same for the urban and rural parts of the province, it is important to consider community size since, arguably, the larger ones will be better able to implement a resource recovery program (re economies of scale) than the smaller ones. Table 7.5 therefore provides three sets of projections: one for the two large urban centres, another for “Total Towns” and a third for all other communities (refer to Table 7.1). To develop a provincial average set of data for Saskatchewan, the Regina and Saskatoon data were merged. This was an arbitrary decision fraught with difficulties because the two audits did not use the same material categories. For example, there were thirteen categories of paper in Regina and only three categories in Saskatoon. For this reason the number of reported fractions was reduced to nine overall categories (i.e. paper becomes one general category). As shown in Table 7.5 and Figure 7.1, organic waste represents a large proportion of residential solid waste disposed in this province, followed by paper, whereas the metal fraction is estimated to be about 4 percent of the total. (Note that the percentages in Figure 7.1 are rounded so the metals total appears to be 5 percent when in fact the figure is closer to 4 percent).

The Government of Canada Action Plan 2000 on Climate Change
NRCan / RNCan 64 Mar-2006
Table 7.5: Estimated Composition of Saskatchewan Residential Waste Disposed (tonnes, 2002)
Material
City Town Other Total
tonnes Paper Glass Ferrous Nonferrous Plastics Organics Wood Textiles Other
35,001 2,842 5,365
797 12,658 79,176 1,873 5,081 7,560
10,146 824
1,555 231
3,669 22,951
543 1,473 2,192
19,730 1,602 3,024
449 7,135
44,631 1,056 2,864 4,262
64,876 5,268 9,945 1,478
23,463 146,758
3,472 9,417
14,014
Total
150,354 43,583 84,755 278,692
Figure 7.1: Estimated Composition of Total Saskatchewan Residential Waste Disposed (2002)
In the Saskatoon study, it is possible that the amount of organics is skewed by the August and November sample periods. Ideally, sampling should occur in each month and then be rolled together for an annual figure. In Regina, yard waste was actually excluded from the audit’s summary numbers but was specified elsewhere in the report as being 0.3 kg per capita per day,100 which works out to 109 kg per capita per year. At 30 percent of the residential waste stream, this figure was considered too high so the average Alberta figure of 73 kg per capita per year of yard waste was used to develop a more conservative estimate.101 Yard waste is a tricky issue given its volume and seasonal variability (characterization numbers can be easily distorted). For this reason, the Manitoba Product Stewardship
100 University of Regina, 1996, City of Regina Waste Characterization Study Final Report, p. 38 101 This is a calculated average using Calgary and Edmonton data for yard waste disposed of.
Organics53%
Paper23%
Non-ferrous1%
Plastics8%
Glass2%
Ferrous4%
Other5%
Wood1%
Textiles3%
Organics53%
Paper23%
Non-ferrous1%
Plastics8%
Glass2%
Ferrous4%
Other5%
Wood1%
Textiles3%

The Government of Canada Action Plan 2000 on Climate Change
NRCan / RNCan 65 Mar-2006
Corporation, which has done several thorough residential waste audits, always excludes yard waste from their analyses.
7.4.2 Industrial, Commercial and Institutional (IC&I) Waste Characterization As in the other provinces, good IC&I data are difficult to find. The Saskatoon study provides data on “commercial/residential” waste, which probably means that multi-family waste is co-collected with commercial. As a result, this fraction is not a true representation of IC&I waste. Nevertheless these data will be used and can be compared with figures used elsewhere (see Chapter 16). The Regina study addresses the issue of IC&I waste at length especially in its review of available literature and studies conducted elsewhere. In the local context, this study undertook a number of targeted sorts (e.g. schools, mixed office) but did not aggregate the results for general application across the community. While this information is used to inform the content of Chapter 16, it cannot be used to develop projections in this part of the report. Table 7.6 presents the characterization estimates for Saskatchewan’s IC&I waste, as disposed in 2002. As in the previous section, IC&I projections are provided for “cities”, “towns” and other (smaller) communities.
Table 7.6: Projected Tonnage for IC&I Waste Disposed in Saskatchewan (tonnes, 2002)
Material
City
Town
Other Total
tonnes Paper Plastics Ferrous Non-ferrous Glass Textiles Wood Organics Other
103,870 20,176 10,760 1,490 4,152
12,267 3,725
77,304 4,233
30,109 5,849 3,119
432 1,204 3,556 1,080
22,408 1,227
58,552 11,373 6,065
840 2,341 6,915 2,100
43,576 2,386
192,531 37,398 19,944 2,762 7,696
22,739 6,904
143,289 7,845
Total
237,978
68,983 134,148 441,109
Based on these projections it is estimated that the IC&I sector discards almost 23,000 tonnes of metal. The proportion of this metal waste, which is most accessible, would be found in the cities, amounting to about 12,000 tonnes. The lion’s share of materials is once again paper and organic waste materials. The reader is reminded to keep two caveats in mind when reviewing these projections: (1) industrial waste not going to either a landfill or a secondary processing facility is not accounted for by the Statistics Canada 2002 WMIS, and (2) the characterization data

The Government of Canada Action Plan 2000 on Climate Change
NRCan / RNCan 66 Mar-2006
(largely reported by municipalities) probably do not include truly industrial waste. Chapter 17 attempts to address these other material streams.
7.4.3 Construction, Renovation and Demolition (CR&D) Waste Characterization The total amount of CR&D disposed of in Saskatchewan in 2002 was 75,323 tonnes according to Statistics Canada (see Table 7.2). In previous sections, a rough estimate has been made regarding cities, towns and smaller communities. This has been done in the residential and IC&I sectors by assuming a constant per capita disposal factor. This assumption cannot reasonably be applied in the case of CR&D waste since arguably there is more CR&D activity in the larger centres. Therefore only overall projections are provided with the expectation that centres of high economic activity will generate relatively larger amounts of CR&D waste. The City of Regina study provides data from other studies102 but that work did not include any direct audits of this material stream. The Saskatoon study refers to CR&D waste as “homogenous” and includes materials that were self-hauled by local residents. The analysis in their report includes an overwhelming amount of “rubble” (47%) as well as “tree/grass”, which (unusual for CR&D waste) is probably residentially sourced. Therefore the CR&D data from Alberta will be applied in Saskatchewan as presented in Table 7.7. Table 7.7: Projected Tonnage for CR&D Waste Disposed in Saskatchewan
(2002)
Material
Total Tonnes
Total Percent
Concrete Asphalt Wood Drywall Ferrous Nonferrous Paper product Other
11,332 5,333
24,077 8,836
708 2,371
816 21,848
15% 7%
32% 12%
1% 3% 1%
29%
Totals 75,323
100%
From Table 7.7 it would appear that the amount of metal material available for recovery is about 3,000 annual tonnes or about 4 percent of the total CR&D stream. Given the high value of metal scrap, it is likely that much of the available and accessible scrap metal is being recovered but it is very difficult to ascertain what that amount might be without a comprehensive recycling industry survey.
102 University of Regina, 1995, City of Regina Waste Characterization Study Stage 1 – Literature Review, p. 99, Appendix H

The Government of Canada Action Plan 2000 on Climate Change
NRCan / RNCan 67 Mar-2006
7.5 Saskatchewan Summary Table 7.8 presents a summary of solid waste currently disposed in Saskatchewan with all three sectors (residential, IC&I and CR&D) rolled up.
Table 7.8: Summary of Saskatchewan Waste Materials Disposed (2002)
Material
Total Tonnes Overall Percent
Organics Paper Plastics Other Wood Textiles Ferrous Glass Concrete Drywall Nonferrous Asphalt Sanitary
299,718 254,208
59,092 37,553 34,553 31,901 29,911 12,310 11,332 8,836 6,469 5,333 3,908
37.7% 32.0% 7.4% 4.7% 4.3% 4.0% 3.8% 1.5% 1.4% 1.1% 0.8% 0.7% 0.5%
Total
795,124
100.0%
It is estimated that organic and paper material disposed of in Saskatchewan account for more than two thirds of the total. In contrast, the amount of ferrous and nonferrous metal discarded is projected to be about 36,000 tonnes, which is just less than 5 percent of the total. Other mineral or metal related materials are plastics, glass, concrete, drywall and asphalt. Together these materials are sent to landfill in the order of 97,000 tonnes per year. The potential amounts accessible for recovery are reduced when consideration for where the materials are being generated is taken into account. Specifically, 54 percent of the population reside in cities (those with 5,000 people or more), 19 percent in towns and the remaining 36 percent in even smaller communities. However, it is the geographical dispersion of these small pockets of population that create challenges for the introduction of economically viable resource recovery programs in this province. Figure 7.2 provides a schematic overview of the estimates developed in this chapter. Orders of magnitude between materials and sectors are correlated according to graphic dimensions.

NRCan / RNCan 68 Feb-2006
Figure 7.2: Saskatchewan Solid Waste Flow in 2002
Residential339,902 t.
IC&I*555,882 t.
CR&D**83,615 t.
Rec.Disposal278,692 t.
Disposal441,109 t.
Disp.75,323Rec.
Rec.
8,292 t.42,376 t. 95,939 t.
�� � �� � ��� � �� � ��� � �� � ��� � �� � �
� �� � �� � �� �� � �� � �� �� � �� � �� �� � �� � �
�� �� � � ��� �� � � ��� �� � � ��� �� � � �
���� � �� ���
Rec. = DiversionRate = 19% overall
(*industrial, commercial & institutional;**construction, renovation & demolition)
Population995,490
Total Generation979,399 tonnes
Economy$33 billion (GDP)
paper
organics
plastics
textiles
ferrous
otherglasswood
non-ferrous 2,7626,9047,6967,845
19,94422,739
37,398
143,289
192,531
708
816
2,371
5,333
8,836
11,332
21,848
24,077wood
other
concrete
drywall
asphalt
non-ferrous
cardboard/paper
ferrous
1,478
3,472
5,268
9,417
9,945
14,014
23,463
64,876
146,758Organics
Paper
Plastics
Ferrous
Textiles
Other
Glass
Wood
Non-ferrous
= 795,124 t.(total disposal)
Residential339,902 t.
IC&I*555,882 t.
CR&D**83,615 t.
Rec.Disposal278,692 t.
Disposal441,109 t.
Disp.75,323Rec.
Rec.
8,292 t.42,376 t. 95,939 t.
�� � �� � ��� � �� � ��� � �� � ��� � �� � �
� �� � �� � �� �� � �� � �� �� � �� � �� �� � �� � �
�� �� � � ��� �� � � ��� �� � � ��� �� � � �
���� � �� ���
Rec. = DiversionRate = 19% overall
(*industrial, commercial & institutional;**construction, renovation & demolition)
Population995,490
Total Generation979,399 tonnes
Economy$33 billion (GDP)
Population995,490
Total Generation979,399 tonnes
Economy$33 billion (GDP)
paper
organics
plastics
textiles
ferrous
otherglasswood
non-ferrous 2,7626,9047,6967,845
19,94422,739
37,398
143,289
192,531
708
816
2,371
5,333
8,836
11,332
21,848
24,077wood
other
concrete
drywall
asphalt
non-ferrous
cardboard/paper
ferrous
1,478
3,472
5,268
9,417
9,945
14,014
23,463
64,876
146,758Organics
Paper
Plastics
Ferrous
Textiles
Other
Glass
Wood
Non-ferrous
= 795,124 t.(total disposal)

NRCan / RNCan 69 Mar-2006
Chapter 8 Manitoba 8.1 INTRODUCTION ...................................................................................................... 70 8.2 DEMOGRAPHICS ..................................................................................................... 71 8.3 GENERATION, RECYCLING AND DISPOSAL BY SECTOR .......................................... 72 8.3.1 Generation Data ....................................................................................... 72 8.3.2 Recycling Data.......................................................................................... 73 8.3.3 Product Stewardship Data........................................................................ 74 8.3.4 Disposal Data ........................................................................................... 75 8.4 WASTE COMPOSITION ............................................................................................ 76
8.4.1 Residential Waste Characterization ......................................................... 76 8.4.2 Industrial, Commercial and Institutional (IC&I) Waste
Characterization ....................................................................................... 77 8.4.3 Construction, Renovation and Demolition (CR&D) Waste
Characterization ....................................................................................... 79 8.5 MANITOBA SUMMARY ........................................................................................... 80

The Government of Canada Action Plan 2000 on Climate Change
NRCan / RNCan 70 Mar-2006
8.1 Introduction In 1991 the Province of Manitoba set a 50 percent waste diversion target to be achieved by 1995. As in other provinces, performance appears to be measured by comparing the amount of material disposed of per capita with an historical benchmark, usually 1988 or 1989, which coincides with the CCME initiative of that time. In 1998, the Manitoba Minister of the Environment established a Regional Waste Management Task Force to review waste management activities around the province and to make recommendations as to next steps. This was achieved through year long consultations with multiple stakeholders and a report summarizing this process and its outcomes is posted on Manitoba Conservation’s web site.103 The primary areas of interest at the time of the consultations were environmental protection, integrated approaches and regional coordination. One subject not covered in the report was waste management data. While Statistics Canada provides the baseline data for disposal and recycling, the Manitoba Product Stewardship Corporation104 (MPSC) has conducted significant waste characterization work. The MPSC studies utilized the CCME waste characterization protocol105 with 71 different categories of “waste” for both the urban and rural parts of the province. A detailed analysis of plastics in the municipal waste stream was also undertaken. Since the interest of the MPSC lies mainly with residential solid waste, there is no Manitoba based waste characterization data for the IC&I or CR&D sectors: In this chapter, other provincial data are applied. Unlike the previous three western provinces, Manitoba’s approach to municipal recycling is different: There are no deposits on beverage containers (except beer, which is a separate system). Instead, industry (i.e. the MPSC) supports municipal curbside and depot recycling efforts with 80 percent funding of total net program costs. This approach is similar to the Stewardship Ontario program that covers 50 percent of net blue box program costs. In both cases, industry has a vested interest in helping or encouraging municipalities to reduce program costs. It is for this reason that MPSC has conducted the aforementioned waste audits.
103 See http://www.gov.mb.ca/conservation/pollutionprevention/wastereg/index.html for the Final Report of the Manitoba Regional Waste Management Task Force, December 1999. 104 See http://www.mpsc.com/ 105 See http://www.ccme.ca/assets/pdf/waste_e.pdf

The Government of Canada Action Plan 2000 on Climate Change
NRCan / RNCan 71 Mar-2006
8.2 Demographics According to WMIS 2002, the population of Manitoba in that year was 1,155,492.106 From another Statistics Canada source, 72 percent of the population is considered urban and the remaining 28 percent is rural107. This split is used later in Section 8.4 when the waste characterization data are applied. For planning purposes it is assumed that urban source waste materials are easier and probably more cost-effective to recover and send to market.
Table 8.1: MB Population Distribution108
Regional Health Authority
Population
Winnipeg Brandon North Eastman South Eastman Interlake Central Assiniboine Parkland Nor-Man Burntwood Churchill
656,339 47,677 39,389 55,766 75,095 98,778 70,183 42,182 25,010 44,770 1,028
RHA Population Total 1,156,217
The Regional Health Authority (RHA) population total in Table 8.1 is 725 higher than the Statistics Canada figure. It is surmised that the Statistics Canada number has missed some of the aboriginal population,109 but certainly the two sums are extremely close. In any case, the availability of urban and rural waste characterization data in Manitoba makes this demographic split worthwhile. Of note, the City of Winnipeg contains 57 percent of the province’s population as shown in Table 8.1.
106 Statistics Canada, Waste Management Industry Survey: Business and Government Sectors 2002, Catalogue no. 16F0023XIE, Table 2.2, p. 10. 107 See http://www.statcan.ca/english/census96/table15.htm 108 See www.gov.mb.ca/health/annstats/11.pdf 109 Discussion with David Crawford, MPSC, Jan-2005

The Government of Canada Action Plan 2000 on Climate Change
NRCan / RNCan 72 Mar-2006
8.3 Generation, Recycling and Disposal by Sector Table 8.2 provides an overall summary of the flow of solid waste in Manitoba as assembled by WMIS. As in the previous three chapters, product stewardship data are added to these totals in Section 8.3.3.
Table 8.2: Manitoba Solid Waste Flow by Sector (2002)110
Sector
Generation Disposal Recycling
Residential IC&I CR&D
494,535 566,750
86,151
412,612 405,954
77,990
81,923 160,796
8,161
Total tonnes Kilograms/capita
1,147,436 993
896,556 776
250,880 217
While the total amount of solid waste generated in Manitoba has increased from 986 kg/capita in 2000 to 993 kg/capita per in 2002, the amount disposed decreased from 798 to 776 kg/capita. Tremendous gains were made on the diversion side where the quantity of material recycled increased from 188 to 217 kg/capita over the same time period.
8.3.1 Generation Data The purpose of this section is to review local waste generation date (if available) and compare it with the Statistics Canada numbers that are used in this report. Manitoba Conservation is the provincial department that addresses issues related to the management of solid waste. It estimated solid waste generation rates for the province, as shown in Table 8.3.
Table 8.3: Manitoba Conservation Waste Generation Estimates111
Community Type
Typical Waste Type Kg/capita/year
Major centres IC&I, CR&D, and residential
730
Residential Residential, institutional, some commercial, local
CR&D
548
Seasonal Residential, some commercial, local CR&D
150
Manitoba Conservation provides separate estimates for the Cities of Winnipeg and Brandon: They are 1,000 and 850 kg/capita/year respectively. The City of Winnipeg also completed a GAP form for 2001. Total residential waste generated then was
110 Statistics Canada, Waste Management Industry Survey: Business and Government Sectors 2002, Catalogue no. 16F0023XIE, Table A.1, p. 14. 111 Appendix 2, http://www.gov.mb.ca/conservation/pollutionprevention/wastereg/final_rwmtf_report.pdf

The Government of Canada Action Plan 2000 on Climate Change
NRCan / RNCan 73 Mar-2006
309,264 tonnes, which works out to 500 kg/capita.112 The GAP figure is more or less the same as the 548 kg/capita number in Table 8.3. The average provincial generation rate as determined by Statistics Canada for 2002 is 993 kg/capita (Table 8.2), which is very close to the Winnipeg estimate. The other generation estimates seem low although it is reasonable to assume that smaller centres generate less waste per capita given their smaller IC&I sector and lower CR&D activity. It is possible that the generation rates provided by Manitoba Conservation are actually disposal rates since the Statistics Canada 2002 average disposal rate for the province is 776 kg/capita (this is much closer to the “major centre” figure provided in Table 8.3).
8.3.2 Recycling Data MPSC puts out an annual report on residential recycling in the province and it’s available at www.mpsc.com. The MPSC numbers do not match Statistics Canada because of methodological and definition differences. The discrepancy is about 30,000 tonnes with Statistics Canada being higher. The Statistics Canada figure for “diversion” includes materials such as organics, white goods, scrap metal, CR&D materials whereas the MPSC mandate is limited to provincially designated non-deposit beverage containers, packaging of pre-packaged goods, in-store packaging, newspapers, magazines, advertising material and telephone books. As such, it is very difficult to compare one data set with the other. The amount of recyclables marketed (recovered minus process residue) in Winnipeg according to GAP was 30,413 tonnes in 2001 (not including stewardship numbers nor any other divertible materials), which amounts to 49 kg/capita. The MPSC figure for 2002-2003 for Winnipeg is 51 kg/capita (see Table 8.4), more or less the same as GAP. Other materials diverted, such as deposit packaging, white goods and other scrap metal, tires, grass cycling and backyard composting, are included under the GAP assessment, adding another 41 kg/capita for a total Winnipeg diversion rate of 90 kg/capita. The average provincial residential recycling rate determined by Statistics Canada (and this includes all diversion) in 2002 was 71 kg/capita. So why is the GAP figure for Winnipeg more than 20% higher than the provincial average? One possible answer is that larger municipalities have or provide more recycling opportunities. In any case, based on the MPSC data (see Table 8.4), Winnipeg Region recycles more per capita than most other regions except two. Therefore a provincial average lower than Winnipeg’s recycling rate makes some sense.
112 See http://www.csr.org/gap/index.htm and look under the GAP heading for municipal data summaries.

The Government of Canada Action Plan 2000 on Climate Change
NRCan / RNCan 74 Mar-2006
Table 8.4: Manitoba Municipal Recycling Summary (2002-3)113
Regional Health Authority
Tonnes/year Kg/capita/year
Northern North West Central West South West South Central Interlake East Winnipeg
1,247 880
1,023 2,674 4,261 1,587 3,682
34,013
29 33 43 36 53 26 53 51
Summary
49,367 (Total)
47 (Average)
In Table 8.5, a summary of the residential materials recovered is provided. However, MPSC suspects that a significant amount of these items are collected via charity based organizations and other fund raising groups, particularly in the case of aluminum cans that have a relatively high re-sell value.
Table 8.5: Materials Recycled (2002-3) 114
Material
Tonnes Estimated recovery rate
Newsprint, etc. Cardboard Glass containers PET bottles Aluminum cans Metal cans Boxboard HDPE containers Polycoat & aseptic Other plastics
30,323 5,057 6,129 1,209 6,448 1,884 2,644
970 444
61
85% 47% 44% 44% 34% 30% 27% 25% 21% 4%
Total / Average
49,367 56%
8.3.3 Product Stewardship Data As indicated at the outset, Manitoba does not have a redemption program in place for beverage containers (except beer). However, there are three programs to report on, which involve tires, empty pesticide containers and beer bottles/cans. According to Environment Canada, 718,200 passenger equivalent tires (PTE) were sold in Manitoba in 2002. Of these, an estimated 700,000 PTE were recovered115. It is 113 MPSC Annual Report, pp. 19-22 at http://www.mpsc.com/ 114 MPSC Annual Report, p. 16
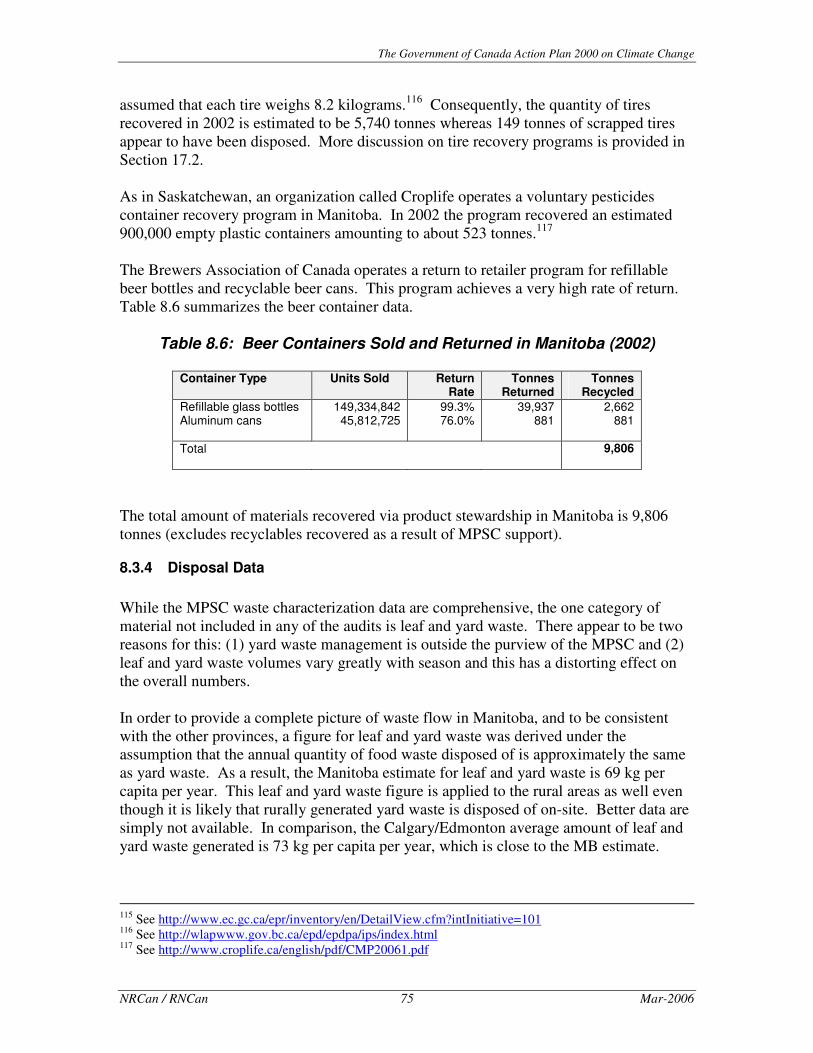
The Government of Canada Action Plan 2000 on Climate Change
NRCan / RNCan 75 Mar-2006
assumed that each tire weighs 8.2 kilograms.116 Consequently, the quantity of tires recovered in 2002 is estimated to be 5,740 tonnes whereas 149 tonnes of scrapped tires appear to have been disposed. More discussion on tire recovery programs is provided in Section 17.2. As in Saskatchewan, an organization called Croplife operates a voluntary pesticides container recovery program in Manitoba. In 2002 the program recovered an estimated 900,000 empty plastic containers amounting to about 523 tonnes.117 The Brewers Association of Canada operates a return to retailer program for refillable beer bottles and recyclable beer cans. This program achieves a very high rate of return. Table 8.6 summarizes the beer container data.
Table 8.6: Beer Containers Sold and Returned in Manitoba (2002)
Container Type
Units Sold Return Rate
Tonnes Returned
Tonnes Recycled
Refillable glass bottles Aluminum cans
149,334,842 45,812,725
99.3% 76.0%
39,937 881
2,662 881
Total
9,806
The total amount of materials recovered via product stewardship in Manitoba is 9,806 tonnes (excludes recyclables recovered as a result of MPSC support).
8.3.4 Disposal Data While the MPSC waste characterization data are comprehensive, the one category of material not included in any of the audits is leaf and yard waste. There appear to be two reasons for this: (1) yard waste management is outside the purview of the MPSC and (2) leaf and yard waste volumes vary greatly with season and this has a distorting effect on the overall numbers. In order to provide a complete picture of waste flow in Manitoba, and to be consistent with the other provinces, a figure for leaf and yard waste was derived under the assumption that the annual quantity of food waste disposed of is approximately the same as yard waste. As a result, the Manitoba estimate for leaf and yard waste is 69 kg per capita per year. This leaf and yard waste figure is applied to the rural areas as well even though it is likely that rurally generated yard waste is disposed of on-site. Better data are simply not available. In comparison, the Calgary/Edmonton average amount of leaf and yard waste generated is 73 kg per capita per year, which is close to the MB estimate.
115 See http://www.ec.gc.ca/epr/inventory/en/DetailView.cfm?intInitiative=101 116 See http://wlapwww.gov.bc.ca/epd/epdpa/ips/index.html 117 See http://www.croplife.ca/english/pdf/CMP20061.pdf

The Government of Canada Action Plan 2000 on Climate Change
NRCan / RNCan 76 Mar-2006
The City of Winnipeg disposal rate for residential waste is 410 kg/capita according to GAP. The comparable MB figure is 357 kg/capita, derived from WMIS 2002. While these two numbers are close enough to substantiate each other, it is also generally understood that larger municipalities generate more waste than smaller communities as illustrated in Table 8.3 (even though paradoxically larger centres have more recycling opportunities). 8.4 Waste Composition This section of the report assembles available, local data and applies it to the waste disposal data compiled by Statistics Canada and presented in Table 8.2. In the case of Manitoba, the local data to be used are from the MPSC studies.
8.4.1 Residential Waste Characterization Two waste audit studies were undertaken for MPSC in 2000 and 2001: One was for the City of Winnipeg118 and the other looked at several rural areas119 (from Portage la Prairie with 13,077 people to Shoal Lake, population 801). While the available data includes 71 categories, for the purposes of this report the numbers are rolled up into nine general categories. Table 8.7 shows the estimated composition of waste materials disposed for the residential sector.
Table 8.7: Estimated Composition Manitoba Residential Waste Disposed (tonnes, 2002)
Material
Urban Rural Total tonnes
Paper Plastics Ferrous Nonferrous Glass Haz-waste Food waste Yard waste Other
72,797 21,655 7,464 1,843
12,071 1,751
63,398 63,398 51,879
24,301 8,705 3,264 1,088 5,078
363 29,742 24,954 18,861
97,098 30,360 10,728 2,931
17,149 2,114
93,140 88,352 70,740
Total
296,255 116,357 412,612
The quantity of metal waste disposed is insignificant at 3.3 percent of the total. Organic (food plus yard) waste account for the majority of materials disposed (44 percent) with
118 earthbound environmental Inc., 2000, City of Winnipeg Waste Composition Study 2000, Manitoba Product Stewardship Corporation 119 earthbound environmental Inc., 2001, Rural Residential Waste Composition Study 2000, Manitoba Product Stewardship Corporation

The Government of Canada Action Plan 2000 on Climate Change
NRCan / RNCan 77 Mar-2006
“paper” and “other” accounting for much of the rest. Figure 8.1 illustrates the distribution well.
Figure 8.1: Estimated Percentage of Residential Waste Disposed (2002)
8.4.2 Industrial, Commercial and Institutional (IC&I) Waste Characterization There are no IC&I waste characterization data available from a Manitoba based study. The challenge at hand therefore is to use data from another jurisdiction, but which one. The preferred jurisdiction is Ontario given the similarity of waste management practices with Manitoba especially with respect to the non-deposit approach to recycling. As it happens, the former Metro Toronto Works Department commissioned a study in 1999 to assemble IC&I waste characterization data for that community and it is this data that are used for the urban areas of Manitoba.120 However, for the rural areas of Manitoba, using Toronto data is probably inappropriate. Therefore, the data for Lumby, BC are applied.121 Table 8.8 presents the summary analysis of rolled up material categories for Manitoba, with separate estimates for the urban and rural.
120 Proctor & Redfern Ltd. and SENES Consultants Ltd., 1999, Solid Waste Environmental Assessment Plan (SWEAP) Waste Composition Study (Discussion Paper No. 4.3), prepared for Solid Waste Management Division, Metropolitan Toronto Department of Works 121 Ecochoice Consulting and Footprint Environmental Consultants, 1998, Waste Composition Survey, Regional District of North Okanogan, Table 10, p. 22 (Lumby Landfill Waste Composition pie chart)
Paper23%
Food waste23%
Yard waste21%
Other17%
Glass4%
HHW1%
Ferrous3%
Non-ferrous1%
Plastics7%
Paper23%
Food waste23%
Yard waste21%
Other17%
Glass4%
HHW1%
Ferrous3%
Non-ferrous1%
Plastics7%
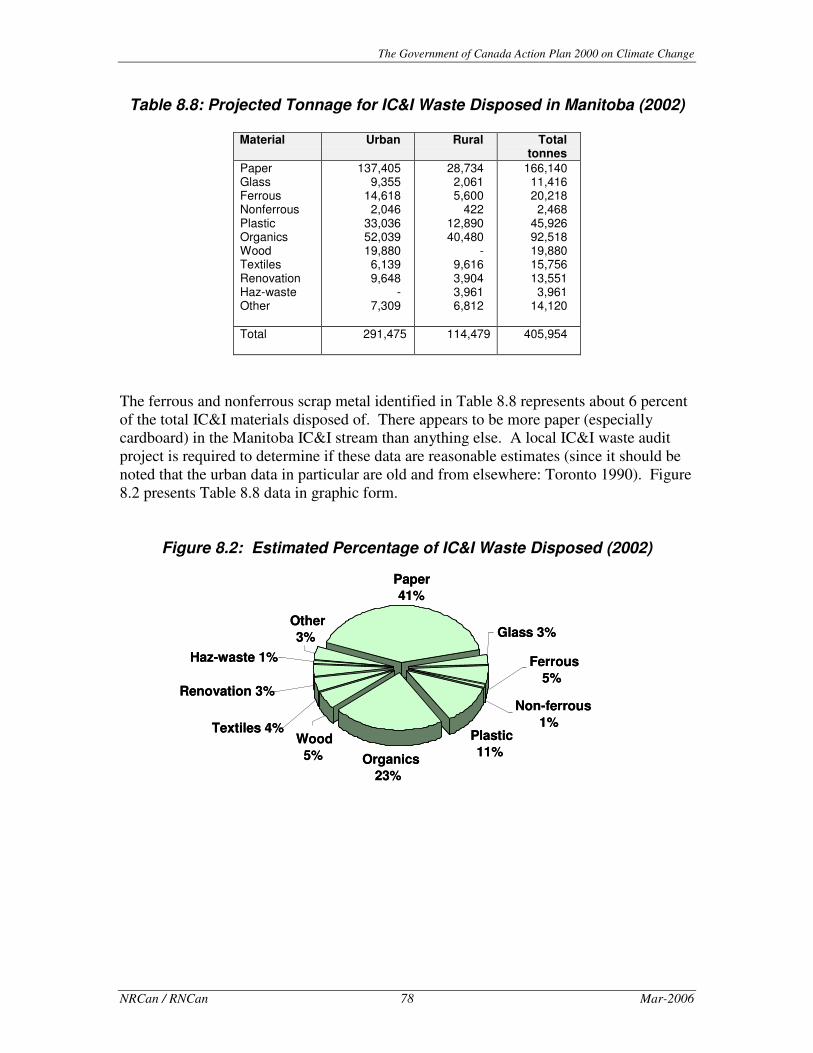
The Government of Canada Action Plan 2000 on Climate Change
NRCan / RNCan 78 Mar-2006
Table 8.8: Projected Tonnage for IC&I Waste Disposed in Manitoba (2002)
Material
Urban
Rural
Total tonnes
Paper Glass Ferrous Nonferrous Plastic Organics Wood Textiles Renovation Haz-waste Other
137,405 9,355
14,618 2,046
33,036 52,039 19,880 6,139 9,648
- 7,309
28,734 2,061 5,600
422 12,890 40,480
- 9,616 3,904 3,961 6,812
166,140 11,416 20,218 2,468
45,926 92,518 19,880 15,756 13,551 3,961
14,120
Total
291,475 114,479 405,954
The ferrous and nonferrous scrap metal identified in Table 8.8 represents about 6 percent of the total IC&I materials disposed of. There appears to be more paper (especially cardboard) in the Manitoba IC&I stream than anything else. A local IC&I waste audit project is required to determine if these data are reasonable estimates (since it should be noted that the urban data in particular are old and from elsewhere: Toronto 1990). Figure 8.2 presents Table 8.8 data in graphic form.
Figure 8.2: Estimated Percentage of IC&I Waste Disposed (2002)
Paper41%
Plastic11%Organics
23%
Renovation 3%
Textiles 4%
Haz-waste 1%
Other3%
Wood5%
Non-ferrous1%
Ferrous5%
Glass 3%
Paper41%
Plastic11%Organics
23%
Renovation 3%
Textiles 4%
Haz-waste 1%
Other3%
Wood5%
Non-ferrous1%
Ferrous5%
Glass 3%

The Government of Canada Action Plan 2000 on Climate Change
NRCan / RNCan 79 Mar-2006
8.4.3 Construction, Renovation and Demolition (CR&D) Waste Characterization On the Manitoba Conservation web site, a Guideline for Construction and Demolition Waste Management is provided; however, its focus is on proper disposal of this waste stream122. Interestingly, Manitoba Conservation’s definition of CR&D waste includes civil engineering waste (bridges and roads), which are materials not covered by the Statistics Canada survey. The total amount of CR&D waste disposed of in Manitoba in 2002 was 77,900 tonnes, according to WMIS (recall Table 8.2). As in previous chapters, the characterization of CR&D waste disposed is based on the Alberta study discussed in Section 4.3. No distinction is made between urban and rural areas because the required data are unavailable. Table 8.9 provides the overview for CR&D waste in Manitoba, 2002. Table 8.9: Projected Tonnage for CR&D Waste Disposed in Manitoba (2002)
Material
Total Tonnes
Total Percent
Concrete Asphalt Wood Drywall Ferrous Nonferrous Paper product Other
11,842 5,573
24,837 9,096
725 2,426
853 22,641
15% 7%
32% 12%
1% 3% 1%
29%
Totals 77,990
100%
The amount of scrap metal available for recovery from the CR&D waste steam appears to be relatively low at 4 percent. This is not surprising as the recovery of these materials already takes place wherever it is cost-effective. Historical and more detailed data would show that scrap metal from CR&D activities in northern or remote locations is probably not being recovered due to the high cost of transport to market.
122 http://www.gov.mb.ca/conservation/pollutionprevention/pdf/c-d-waste-guideline-e.pdf (Dec-2004)

The Government of Canada Action Plan 2000 on Climate Change
NRCan / RNCan 80 Mar-2006
8.5 Manitoba Summary Table 8.10 summarizes the data by material type, aggregated for all three sectors (residential, IC&I and CR&D). However, the reader is advised that the resulting projections should be considered “exactly wrong, approximately right”.123 Organics tops the list again (food waste plus yard waste) followed closely by paper: Together these two material categories account for about 60 percent of all solid waste disposed of Manitoba, which is a very similar finding to the other provinces.
Table 8.10: Summary of Manitoba Waste Materials Disposed (2002)
Material
Total Tonnes Overall Percent
Organics Paper Other Plastics Wood Ferrous Glass Textiles Renovation Concrete Drywall Nonferrous HHW Asphalt
274,010 264,091 107,501
76,286 44,716 31,671 28,565 15,756 13,551 11,842 9,096 7,825 6,074 5,573
30.6% 29.5% 12.0%
8.5% 5.0% 3.5% 3.2% 1.8% 1.5% 1.3% 1.0% 0.9% 0.7% 0.6%
Total
896,556
100.0%
The quantity of ferrous and nonferrous scrap disposed of in Manitoba in 2002 is estimated to be about 40,000 tonnes. Other mineral bearing waste such as drywall, glass, concrete and asphalt account for a further 55,000 tonnes and plastic waste materials an additional 76,000 tonnes. The total estimated mineral and metal segment of the disposed waste stream therefore is 171,000 tonnes per year or 19 percent. These projections can be updated whenever better, local waste audits are conducted particularly in the IC&I and CR&D sectors. Figure 8.3 illustrates the conceptual composition of solid wastes disposed of in Manitoba by sector. In Figure 8.3, the product stewardship tonnage total (9,806 tonnes) is added to total solid waste generated and then split evenly between the residential and IC&I sectors. Thus, the generation numbers for the total and each of these sectors are slightly greater than the Statistics Canada data shown in Table 8.2.
123 Discussion with David Crawford, Manitoba Product Stewardship Corporation, January 2005.

NRCan / RNCan 81 Mar-2006
Figure 8.3: Manitoba Solid Waste Flow in 2002
Residential499,438 t.
IC&I*571,653 t.
CR&D**86,151 t.
Population1,155,492
Total Generation1,147,436 tonnes
Economy$35 billion (GDP)
Paper
Food waste
Yard waste
Other
Plastics
GlassFerrousNonferrousHaz-waste
97,098
93,140
88,352
70,740
30,360
17,14910,728
2,9312,114
Rec.Disposal412,612 t.
81,923 t.
ProductStewardship
Programs
9,806 t.
Rec.
160,923 t.
Disposal405,954 t.
Disp.77,990
Rec.
8,161 t.
Rec. = DiversionRate = 25% overall
Wood
Other
Concrete
Drywall
Asphalt
Nonferrous
Paper
Ferrous
24,837
22,641
11,842
9,096
5,573
2,426
853
725
= 896,556 t.(total disposal)Plastic
Organics
Paper
Other
Ferrous
WoodTextilesGlassHaz-wasteNonferrous
166,140
95,518
45,926
27,672
20,218
19,88015,75611,416
3,9612,468
Residential499,438 t.
IC&I*571,653 t.
CR&D**86,151 t.
Population1,155,492
Total Generation1,147,436 tonnes
Economy$35 billion (GDP)
Population1,155,492
Total Generation1,147,436 tonnes
Economy$35 billion (GDP)
Paper
Food waste
Yard waste
Other
Plastics
GlassFerrousNonferrousHaz-waste
97,098
93,140
88,352
70,740
30,360
17,14910,728
2,9312,114
Rec.Disposal412,612 t.
81,923 t.
ProductStewardship
Programs
9,806 t.
Rec.
160,923 t.
Disposal405,954 t.
Disp.77,990
Rec.
8,161 t.
Rec. = DiversionRate = 25% overall
Wood
Other
Concrete
Drywall
Asphalt
Nonferrous
Paper
Ferrous
24,837
22,641
11,842
9,096
5,573
2,426
853
725
= 896,556 t.(total disposal)Plastic
Organics
Paper
Other
Ferrous
WoodTextilesGlassHaz-wasteNonferrous
166,140
95,518
45,926
27,672
20,218
19,88015,75611,416
3,9612,468

NRCan / RNCan 82 Mar-2006

The Government of Canada Action Plan 2000 on Climate Change
NRCan / RNCan 83 Mar-2006
Chapter 9 Ontario 9.1 INTRODUCTION ...................................................................................................... 84 9.2 DEMOGRAPHICS ..................................................................................................... 84 9.3 GENERATION, RECYCLING AND DISPOSAL BY SECTOR .......................................... 86 9.3.1 Generation Data ....................................................................................... 86 9.3.2 Recycling Data.......................................................................................... 88 9.3.3 Product Stewardship Data........................................................................ 89 9.3.4 Disposal Data ........................................................................................... 90 9.4 WASTE COMPOSITION ............................................................................................ 90
9.4.1 Residential Waste Characterization ......................................................... 91 9.4.2 Industrial, Commercial and Institutional (IC&I) Waste
Characterization ....................................................................................... 93 9.4.3 Construction, Renovation and Demolition (CR&D) Waste
Characterization ....................................................................................... 94 9.5 ONTARIO SUMMARY .............................................................................................. 95

The Government of Canada Action Plan 2000 on Climate Change
NRCan / RNCan 84 Mar-2006
9.1 Introduction The province of Ontario is in the process of establishing a waste diversion goal of 60 percent by the end of 2008, under the assumption that they are currently at 28 percent (CR&D waste excluded).124 According to WMIS, Ontario diverted 20 percent per capita in 2002 (21 percent if CR&D sector excluded). This variance in reported performance highlights yet again the need for standardized measurement and reporting. Regardless, the primary focus of this report is on the amount of material that was disposed of and its characterization. Given Ontario’s large population (39 percent of the Canadian total), it is not surprising that many waste management studies, audits and planning exercises have been undertaken in this province over the last decade. The Ontario reference materials assembled for this project therefore are not intended to be definitive nor all-inclusive. Consequently, it is highly likely that solid waste reports and data that could have contributed towards this report have not been sourced. The following agencies have been very active in this area and the reader is advised to consider them as potential sources of solid waste data:
� Ontario Ministry of the Environment (MOE)125 � Waste Diversion Ontario (WDO)126 � Stewardship Ontario127 � Corporations Supporting Recycling (CSR)128 � Ontario Waste Management Association (OWMA)129 � Association of Municipal Recycling Coordinators (AMRC)130 � Recycling Council of Ontario (RCO)131 � Municipal Waste Integration Network (mwin)132 � Ontario Municipal (CAO's) Benchmarking Initiative (OMBI)133
9.2 Demographics According to Statistic Canada the 2002 population of Ontario is estimated to be 12,096,627 in the WMIS report.134 Table 9.1 shows the distribution of population.
124 Ministry of the Environment, 2004, Ontario’s 60% Waste Diversion Goal – A Discussion Paper, PIBS 4651e (can be found at http://www.ene.gov.on.ca/envision/land/wda/bluebox/60percent.htm) 125 http://www.ene.gov.on.ca/land.htm#waste 126 http://www.wdo.ca/ 127 http://www.stewardshipontario.ca/index.asp 128 http://www.csr.org/ 129 http://www.owma.org/about/about.asp 130 http://www.amrc.guelph.org/ 131 http://www.rco.on.ca/ 132 http://www.mwin.org/home.asp 133 http://www232.pair.com/ombi3/index.html

The Government of Canada Action Plan 2000 on Climate Change
NRCan / RNCan 85 Mar-2006
Table 9.1: Ontario Population Distribution (2002)135
Municipality Population
Toronto Peel (Region) Ottawa York (Region) Durham (Region) Hamilton Waterloo (Region) Niagara (Region) Middlesex Halton (Region) Simcoe Essex (Region) Wellington Greater Sudbury Thunder Bay
< 150,000
2,617,219 1,082,701
817,585 807,950 537,976 514,551 464,049 428,644 426,142 402,633 401,689 396,550 197,366 160,751 156,043
2,684,778
Total 12,096,627
Geographically, Ontario splits into a heavily populated, smaller south and a much larger, thinly populated north. The “Greater Toronto Area” or GTA (the Regions of Durham, Halton, Peel and York and the City of Toronto) contains approximately 44 percent of the province’s population. Distance to market (typically in the south) impacts the communities in the north and strongly influences which recyclable materials can be targeted for recovery. In previous chapters, a distinction was made between urban and rural areas under the assumption that resource recovery programs are likely to be more viable in larger communities for reasons of economies of scale and cost-effectiveness. However, some of the most successful municipal recycling programs in Ontario are the smaller ones that have fewer disposal options and less financial resources but have, in turn, been able to implement user fees or pay-as-you-throw and stringent bag limits, which larger municipalities have found more difficult to introduce, to date. Thus, a more important geographical feature may be location rather than community size. Table 9.2 shows Ontario’s regional population under the assumption that the relative remoteness of the northern areas may make recovery programs more challenging to implement from a net cost perspective.
134 Statistics Canada, 2004, Waste Management Industry Survey: Business and Government Sectors 2002, Catalogue no. 16F0023XIE, Table 2.2, p. 10 135 Personal communication with Amanda Elliott, Statistics Canada, June 2005 – but the total population was 5,418 higher so this amount was arbitrarily deducted from the <150,000 group to match the figure in the prior footnote.

The Government of Canada Action Plan 2000 on Climate Change
NRCan / RNCan 86 Mar-2006
Table 9.2: Ontario Population Distribution by Region136
Region
Population
Percentage
East Central GTA Northeast Northwest Southwest
1,957,528 653,770
5,286,398 632,180 268,819
3,297,933
16.2% 5.4%
43.7% 5.2% 2.2%
27.3%
Total 12,096,627
100.0%
9.3 Generation, Recycling and Disposal by Sector The most recent Statistics Canada solid waste data for Ontario are provided in Table 9.3.
Table 9.3: Ontario Solid Waste Flow by Sector (2002)137
Sector
Generation Disposal Recycling
Residential IC&I CR&D
4,388,238 6,514,192 1,158,701
3,438,408 5,193,240 1,013,985
949,830 1,320,952
144,716
Total tonnes Kilograms/capita
12,061,131 997
9,645,633 797
2,415,498 200
In 2000, Ontario’s per capita generation of non-hazardous solid waste was 966 kg, which was comprised of 764 kg disposal and 202 kg diversion. The diversion rate over the two-year period is 20-21 percent. It is expected that the recent implementation of organic waste diversion programs in the GTA, Niagara and other municipalities will push the 2004 Ontario diversion rate higher.
9.3.1 Generation Data The primary waste data tracking system in Ontario is the web-based “Municipal Datacall” that was initiated by several agencies, funded extensively by CSR, and now housed at the WDO. The Datacall focus, however, is residential solid waste. There is no system in place for tracking IC&I or CR&D solid waste other than the biennial WMIS, although province-wide estimates are developed from time to time.
136 http://www.acaato.on.ca/new/research/scan/2000/section5.pdf The 1998 percents were applied to the 2002 Statistics Canada WMIS population figure. 137 Statistics Canada, 2004, WMIS 2002, Table A.1, p. 14.

The Government of Canada Action Plan 2000 on Climate Change
NRCan / RNCan 87 Mar-2006
It is possible that some municipalities track all solid waste at a regional level particularly where the primary management systems are publicly owned. However, since IC&I waste moves naturally towards the lowest cost disposal option, and since IC&I waste is not a municipal responsibility in Ontario, municipalities are generally unable (or choose not) to track non-residential waste generated or disposed. Total solid waste flow summaries are examined when solid waste management plans are drafted or when special studies are conducted. The former Region of Ottawa-Carleton examined total non-hazardous solid waste flows within its jurisdiction in 1998. The study138 estimated the generation of waste as follows: 40 percent residential, 34 percent IC&I, 20 percent CR&D, and 7 percent “other” (contaminated soils, biosolids139, and such). On an annual per capita basis the generation figures were 335 kg for total residential waste, 283 kg for IC&I waste, and 227 kg for CR&D (plus “other”) for a grand total of 845 kg per capita per year. How do the Ottawa figures compare with WMIS 2002 for all of Ontario? First, the provincial percentage splits: 36 percent residential, 54 percent IC&I, and 10 percent CR&D. Second, the annual per capita generation numbers for the province: 363 kg for residential, 539 kg for IC&I, and 96 kg for CR&D for a grand total of 998 kg per capita per year. Regarding the percentage splits and the per capita generation data, the residential numbers are quite close. The greatest variance emerges in the IC&I and CR&D sectors where the data from Ottawa in 1998 suggests (a) a relatively smaller IC&I sector but (b) relatively more CR&D activity. It would be interesting to assemble mass balance data from other Ontario municipalities to make similar comparisons. A final note on waste generation is that product stewardship tonnage is added to the Statistics Canada figure, as depicted in Figure 9.3 at the chapter end.
138 WESA, 2000, Solid Non-Hazardous Waste Characterization Study, The Region of Ottawa-Carleton 139 More commonly known as “sewage sludge”, it is a de-watered process residue from municipal wastewater treatment facilities.

The Government of Canada Action Plan 2000 on Climate Change
NRCan / RNCan 88 Mar-2006
9.3.2 Recycling Data The Datacall is the provincial vehicle for collecting residential recycling data while a similar vehicle does not exist for the other two sectors, other than WMIS. The Municipal Datacall is likely to be very accurate since program funding was tied to it, as of 2003. Table 9.4 is a summary of the data posted on the WDO web site.140
Table 9.4: Ontario Residential Recyclables (2002)
Material
Tonnes Percent
Paper Aluminum cans Steel cans Glass containers Plastics
544,734 10,776 33,472
106,097 31,928
74.9% 1.5% 4.6%
14.6% 4.4%
Total tonnes Kg per capita
727,007 60.1
100.0%
In addition to the recyclable materials identified in Table 9.4, the Ontario Ministry of the Environment (MOE) claims that 400,000 tonnes of organic material were composted in 2002, a further 94,000 tonnes of white foods and bulky items were recovered and 13,000 of household hazardous waste and electronics were recycled.141 The MOE estimates that the total quantity diverted in 2002 was about 1.2 million tonnes. A preliminary GAP analysis of the province suggested that Ontario’s residential sector diverted 27 percent in 2002.142 This figure included product stewardship, “grass cycling” and backyard composting estimates. The WMIS diversion rate for the residential sector (which excludes the aforementioned) was 22 percent in the same year. What else does the Statistics Canada WMIS say about the level of residential recycling in Ontario in that year? In 2002 the survey indicates that “residential diversion” was 949,830 tonnes. If one assumes that the residential recyclables presented in Table 9.4 and provided by the Datacall are correct, then the difference (949,830 t – 727,007 t = 222,723 tonnes) is likely comprised of residential organics. Total WMIS organics composted are 293,328 tonnes,143 which suggests that 76 percent of all organics composted in Ontario in 2002 were residentially sourced. This split seems reasonable.
140 See footnote #126. 141 See footnote #124, p.4 142 The Ontario GAP Residential Waste Flow Chart was posted at http://www.csr.org/gap/index.htm in May 2004 but it is no longer available. 143 Statistics Canada, 2004, Waste Management Industry Survey: Business and Government Sectors 2002, Catalogue no. 16F0023XIE, Table A.3, p. 15
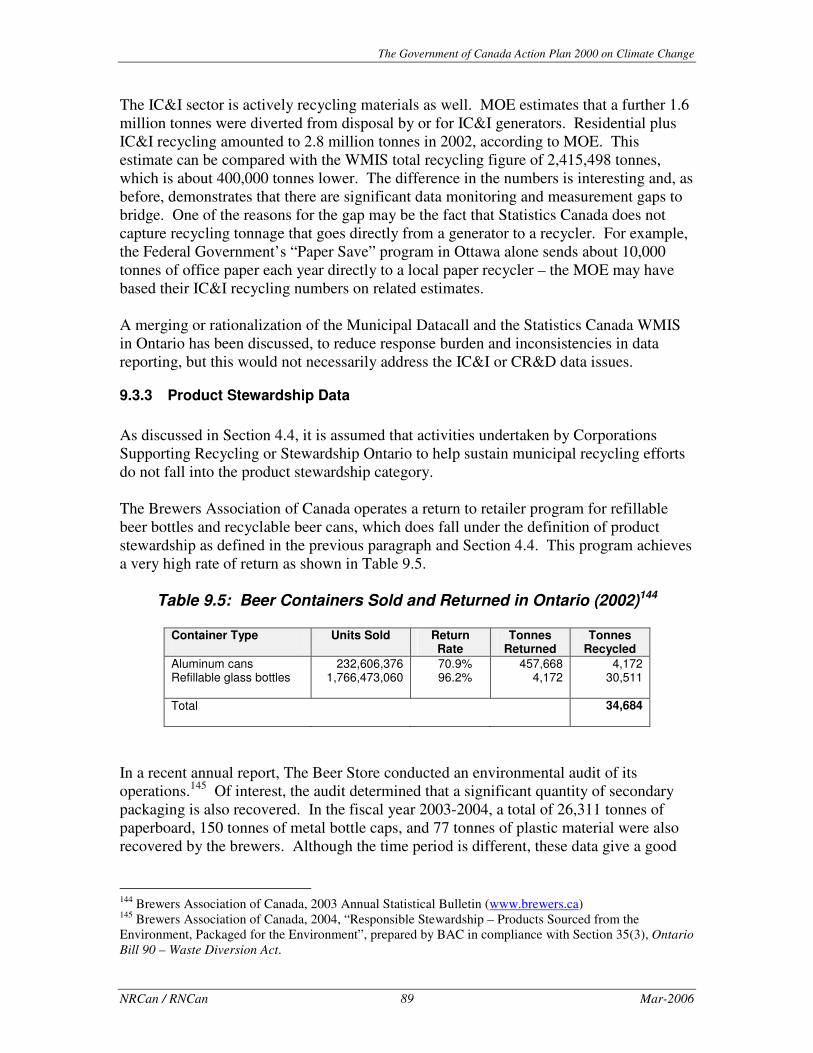
The Government of Canada Action Plan 2000 on Climate Change
NRCan / RNCan 89 Mar-2006
The IC&I sector is actively recycling materials as well. MOE estimates that a further 1.6 million tonnes were diverted from disposal by or for IC&I generators. Residential plus IC&I recycling amounted to 2.8 million tonnes in 2002, according to MOE. This estimate can be compared with the WMIS total recycling figure of 2,415,498 tonnes, which is about 400,000 tonnes lower. The difference in the numbers is interesting and, as before, demonstrates that there are significant data monitoring and measurement gaps to bridge. One of the reasons for the gap may be the fact that Statistics Canada does not capture recycling tonnage that goes directly from a generator to a recycler. For example, the Federal Government’s “Paper Save” program in Ottawa alone sends about 10,000 tonnes of office paper each year directly to a local paper recycler – the MOE may have based their IC&I recycling numbers on related estimates. A merging or rationalization of the Municipal Datacall and the Statistics Canada WMIS in Ontario has been discussed, to reduce response burden and inconsistencies in data reporting, but this would not necessarily address the IC&I or CR&D data issues.
9.3.3 Product Stewardship Data As discussed in Section 4.4, it is assumed that activities undertaken by Corporations Supporting Recycling or Stewardship Ontario to help sustain municipal recycling efforts do not fall into the product stewardship category. The Brewers Association of Canada operates a return to retailer program for refillable beer bottles and recyclable beer cans, which does fall under the definition of product stewardship as defined in the previous paragraph and Section 4.4. This program achieves a very high rate of return as shown in Table 9.5.
Table 9.5: Beer Containers Sold and Returned in Ontario (2002)144
Container Type
Units Sold Return Rate
Tonnes Returned
Tonnes Recycled
Aluminum cans Refillable glass bottles
232,606,376 1,766,473,060
70.9% 96.2%
457,668 4,172
4,172 30,511
Total
34,684
In a recent annual report, The Beer Store conducted an environmental audit of its operations.145 Of interest, the audit determined that a significant quantity of secondary packaging is also recovered. In the fiscal year 2003-2004, a total of 26,311 tonnes of paperboard, 150 tonnes of metal bottle caps, and 77 tonnes of plastic material were also recovered by the brewers. Although the time period is different, these data give a good
144 Brewers Association of Canada, 2003 Annual Statistical Bulletin (www.brewers.ca) 145 Brewers Association of Canada, 2004, “Responsible Stewardship – Products Sourced from the Environment, Packaged for the Environment”, prepared by BAC in compliance with Section 35(3), Ontario Bill 90 – Waste Diversion Act.

The Government of Canada Action Plan 2000 on Climate Change
NRCan / RNCan 90 Mar-2006
sense of the volume of material recovered by this program, which in this case is 61,222 tonnes (including the total from Table 9.5). According to Brewers, 25 percent of beer is consumed “on premise” with the remainder consumed at residential locations: This split is reflected in Figure 9.3 where the initial “generation” of these materials as “waste” is allocated to the residential and IC&I sectors accordingly. Another stewardship activity that is largely unknown in Ontario is CropLife Canada’s Container Management Program, which recovers empty plastic pesticide containers from agricultural users at 1,200 collection points across the country. In Ontario, it is estimated that in 2000 about 640,000 containers were recovered.146 This figure converts to an estimated 372 tonnes (assumed to be HDPE). Therefore the total amount of material recovered via the product stewardship programs discussed is estimated to be 61,593 tonnes. It is certain that an enormous amount of recyclable material such as paper and scrap metal is recovered in Ontario’s IC&I sector but cannot be included in this summary since the data are missing or not readily available.
9.3.4 Disposal Data The Ontario MOE estimates that 9.4 million tonnes of solid waste were disposed in 2002.147 The Municipal Datacall “Fact Sheets” do not identify the amount of residential material disposed of. The Statistics Canada WMIS 2002 waste data shown in Table 9.3 indicate that disposal of all solid waste in Ontario in this year was 9,645,633 tonnes: This is the number that will be used to develop the waste characteristic projections in Section 9.4. 9.4 Waste Composition Over the last decade, many waste characterization studies have been conducted in Ontario, most with a residential focus but some have looked at the IC&I and CR&D sectors as well. In the MOE discussion paper already referenced, estimated compositions are provided for the three sectors but they appear to be for waste generated rather than waste disposed. This is a waste measurement issue that emerges frequently and can be a point of confusion if data types are not clearly stated. In fact, the WDO Residential Curbside Waste Audit Guide148 (RCWAG) bases its composition numbers on total waste generated (that is, garbage plus recycled and composted materials).
146 See http://www.croplife.ca/english/pdf/CMP20061.pdf , slide 4, (accessed June 2005) 147 See footnote #124, p.4 148 See http://www.wdo.ca under “Other Reports”; then “to review these reports click here” and then scroll to bottom and “Miscellaneous” for the “Residential Curbside Waste Audit Guide”.

The Government of Canada Action Plan 2000 on Climate Change
NRCan / RNCan 91 Mar-2006
In this chapter, the methodology for estimating the amount of residential material disposed of in Ontario is provided in the following section.
9.4.1 Residential Waste Characterization The Region of Durham conducted a study that was used to develop residential generation quantities for the WDO.149 For that project, the consultant assembled waste audit data from about 15 Ontario municipalities and placed them into three groups: less than 100,000 population; 100,000-500,000 population; and greater than 500,000 population. Summer, fall and winter percent ranges for seven material categories were synthesized for each of the three groups.150 Since these data are for total waste generated, it is necessary to back out quantities recycled in order to identify the amount disposed. A number of steps are taken to achieve this: � Step One: Calculate average percentages for the three population groups plus one
rural data set151 for each of the seven material categories (see Table 9.6 for the seven material categories).
� Step Two: Convert the average percentages to kilograms per capita per year based on the Statistics Canada average ON residential generation for 2002 (362.8 kg)
� Step Three: Convert the tonnage of each material recycled in Ontario (in Table 9.4) to kg per capita.
� Step Four: Subtract per capita recyclables total (60.1 kg in Table 9.4) from Statistics Canada per capita diversion total (78.5 kg152) to derive amount of material composted.
� Step Five: Subtract recycled and composted amounts from quantities generated for each material to estimate per capita disposal figures.
� Step Six: Develop percentages from the per capita figures and then apply those percents against total residential tonnes disposed.
The only other adjustment made was the application of Manitoba data to the metals material group; that is, 79 percent of metals disposed are assumed to be ferrous and the remainder are nonferrous (based the data presented in Table 8.7). Table 9.6 presents the residential projections for tonnes disposed of.
149 Gartner Lee Ltd., 2001, Summary of Findings in the Development of the Ontario Municipal Waste Composition Estimation Model (WDO OPT-R2-01), Region of Durham 150 Ibid, Table 5 151 County of Simcoe, 2001, Seasonal Waste Composition Study for Streamed Programs, WDO Project Code OPT/ORG R2-03 152 WMIS 2002, Tab. A.4, Recycling, Ontario 2002 residential sources (949,830 tonnes) divided by population equals 78.5 kg/capita
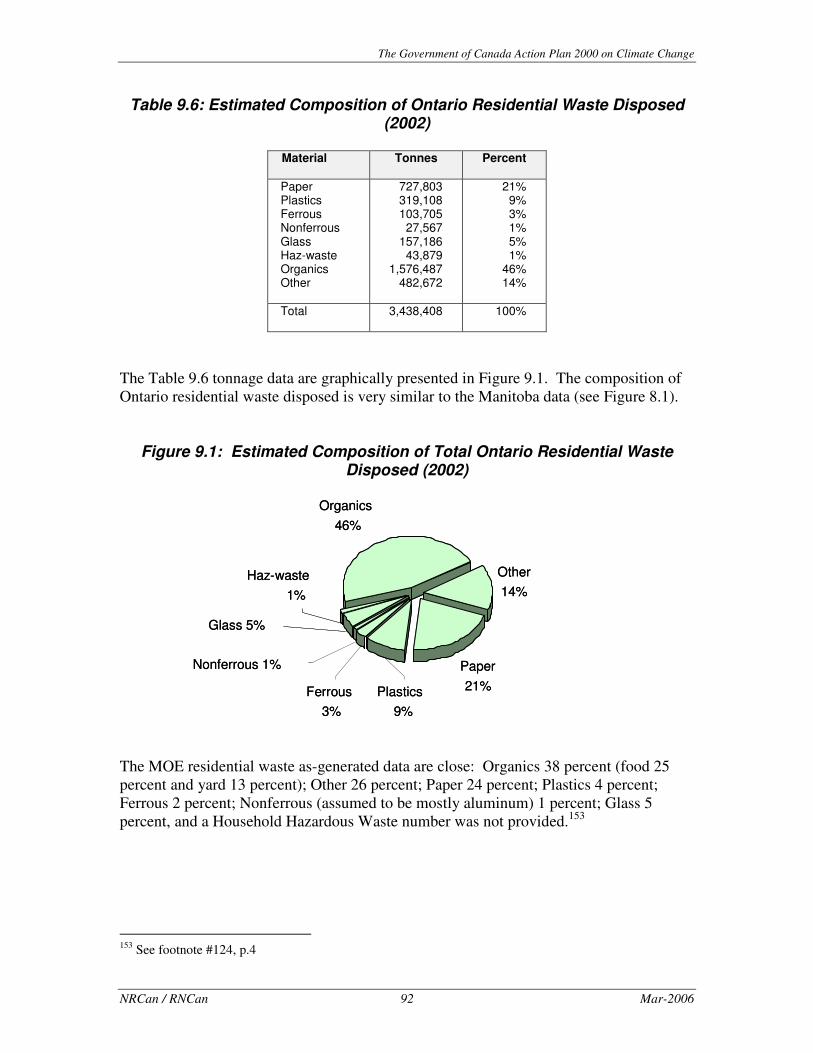
The Government of Canada Action Plan 2000 on Climate Change
NRCan / RNCan 92 Mar-2006
Table 9.6: Estimated Composition of Ontario Residential Waste Disposed (2002)
Material
Tonnes Percent
Paper Plastics Ferrous Nonferrous Glass Haz-waste Organics Other
727,803 319,108 103,705
27,567 157,186
43,879 1,576,487
482,672
21% 9% 3% 1% 5% 1%
46% 14%
Total
3,438,408
100%
The Table 9.6 tonnage data are graphically presented in Figure 9.1. The composition of Ontario residential waste disposed is very similar to the Manitoba data (see Figure 8.1).
Figure 9.1: Estimated Composition of Total Ontario Residential Waste Disposed (2002)
The MOE residential waste as-generated data are close: Organics 38 percent (food 25 percent and yard 13 percent); Other 26 percent; Paper 24 percent; Plastics 4 percent; Ferrous 2 percent; Nonferrous (assumed to be mostly aluminum) 1 percent; Glass 5 percent, and a Household Hazardous Waste number was not provided.153
153 See footnote #124, p.4
Paper21%
Organics46%
Other14%
Nonferrous 1%
Glass 5%
Plastics9%
Ferrous3%
Haz-waste1%
Paper21%
Organics46%
Other14%
Nonferrous 1%
Glass 5%
Plastics9%
Ferrous3%
Haz-waste1%

The Government of Canada Action Plan 2000 on Climate Change
NRCan / RNCan 93 Mar-2006
9.4.2 Industrial, Commercial and Institutional (IC&I) Waste Characterization As noted in Section 8.4.2, the former Metro Toronto Works Department assembled a series of IC&I waste audit data in 1999.154 The summary data used in this section are based on audits of light industry, retail and office buildings, which of course means that the IC&I sector is only partially represented. Since there are many more types of IC&I players (see Chapter 16) with different waste profiles, the reader is advised to use these data (and all other data presented in this report) with appropriate caution. Table 9.7 presents the projected composition of IC&I waste disposed in Ontario in 2002 and Figure 9.2 provides a graphical picture of Table 9.7 data.
Table 9.7: Projected Tonnage for IC&I Waste Disposed in Ontario (2002)
Material
Tonnes
Percent
Paper Plastic Wood Textiles Organics Ferrous Nonferrous Glass Construction Other
2,448,167 588,602 354,203 109,386 927,178 260,443
36,462 166,684 171,893 130,222
47.1% 11.3%
6.8% 2.1%
17.9% 5.0% 0.7% 3.2% 3.3% 2.5%
Total
5,193,240
100.0%
As with the residential waste stream, these estimated data can be compared with the MOE ones:155 Paper 23 percent; Plastics 3 percent; Wood 21 percent; Organics 11 percent; Metal 11 percent; Glass 5 percent; and Other 26 percent. Only the glass percent appears to be in the same ballpark but this is not surprising given the challenges of first defining an “average” IC&I community profile, and second, assembling representative data. More work should be done in this area to review approaches and develop ideas or useful models. Chapter 16 continues this discussion.
154 Proctor & Redfern Ltd. and SENES Consultants Ltd., 1999, Solid Waste Environmental Assessment Plan (SWEAP) Waste Composition Study (Discussion paper No. 4.3), prepared for Solid Waste Management Division, Metropolitan Toronto Department of Works 155 See footnote #124, p.5

The Government of Canada Action Plan 2000 on Climate Change
NRCan / RNCan 94 Mar-2006
Figure 9.2: Estimated Composition of Total Ontario IC&I Waste Disposed (2002)
9.4.3 Construction, Renovation and Demolition (CR&D) Waste Characterization The methodology for developing the CR&D waste projections is explained in Section 4.3. The Action Plan 2000 Enhanced Recycling program co-funded a report called “Let’s Climb Another Molehill” in which CR&D waste was examined – the results of that work were not available for this report so the reader is advised to consult the Recycling in Canada web site for updates.156 The total amount of CR&D waste disposed is a Statistics Canada figure also presented in Table 9.3. In Table 9.8, the projected tonnage for CR&D waste disposed in Ontario is broken into major material categories.
Table 9.8: Projected Tonnage for CR&D Waste Disposed in Ontario (2002)
Material
Total Tonnes
Total Percent
Concrete Asphalt Wood Drywall Ferrous Nonferrous Paper products Other
167,988 79,053
310,778 111,385
8,257 27,643 12,060
296,820
17% 8%
31% 11%
1% 3% 1%
29%
Total 1,013,985
100%
156 See http://www.recycle.nrcan.gc.ca/summaries_e.htm#17 and search for “Molehill”.
Paper47%
Plastic11%
Organics18%
Wood7%
Textiles2%
Nonferrous 1%
Ferrous5%
Glass 3%
Construction 3%
Other3%
Paper47%
Plastic11%
Organics18%
Wood7%
Textiles2%
Nonferrous 1%
Ferrous5%
Glass 3%
Construction 3%
Other3%

The Government of Canada Action Plan 2000 on Climate Change
NRCan / RNCan 95 Mar-2006
The MOE discussion paper includes a pie chart that shows the composition of CR&D waste (probably generated rather than disposed). The following MOE percentages can be compared to the projections in Table 9.8: Paper 21 percent; Other Organic 17 percent; Lumber 16 percent; Remainder composite 11 percent; Metal 10 percent; Drywall 5 percent; Plastic 5 percent; Fines 5 percent; Other 5 percent; Glass 4 percent; and Concrete 1 percent.157 The differences between the two data sets are significant. One other set of Ontario-specific CR&D data comes from Ottawa and is provided in tabular form in Appendix E.158 It was not used in this report due to a few irregularities in the data as well as unclear category types. 9.5 Ontario Summary Table 9.9 combines and summarizes the characterization of solid waste disposed from the residential, IC&I and CR&D sectors in Ontario for the year 2002. The total amounts are based on the Statistics Canada biennial Waste Management Industry Survey. The composition estimates are from Ontario studies with the exception of the CR&D waste stream data, which is a Canada/USA compilation.
Table 9.9: Summary of Ontario Waste Materials Disposed (2002)
Material
Total Tonnes Overall Percent
Paper Organics Other Plastics Wood Ferrous Glass Renovation Concrete Drywall Textiles Nonferrous Asphalt Haz-waste
3,188,031 2,503,665
909,713 907,710 664,981 371,804 323,870 171,893 167,988 111,385 109,386
92,274 79,053 43,879
33.1% 26.0%
9.4% 9.4% 6.9% 3.9% 3.4% 1.8% 1.7% 1.2% 1.1% 1.0% 0.8% 0.5%
Total
9,645,633
100.0%
The two largest categories of material being disposed in Ontario are paper and organics: Together they account for almost 60 percent of all waste disposed. This finding is consistent with other provincial projections. 157 Ministry of the Environment, 2004, Ontario’s 60% Waste Diversion Goal – A Discussion Paper, PIBS 4651e, p. 6 158 Castonguay Technologies Inc., 1998, Construction and Demolition Waste Composition Study, Regional Municipality of Ottawa-Carleton
The Government of Canada Action Plan 2000 on Climate Change
NRCan / RNCan 96 Mar-2006
Percentage wise, the metal materials are relatively small (about 5 percent) with the assembled data suggesting that some 464,000 tonnes of ferrous and nonferrous metal are discarded annually in this province. Other mineral bearing materials include glass, concrete, asphalt and drywall and they account for an additional 680,000 tonnes of wasted material. Since plastics are petroleum based, it could be argued that they should also be included in a broad category called metals and minerals, so that in total a little over 2 Mt of these materials is presently being discarded in Ontario every year. The geographical distribution of these resource recovery opportunities correlates with the regional population data presented in Table 9.2. The southern part of the province benefits from the fact that many of the end markets for these materials are also to be found in that area or in northern US states. Figure 9.3 provides a graphic illustration of which materials are being discarded, in what amounts and from which sectors. As noted in Section 9.3.1, the total, residential and IC&I generation numbers are all larger than the Statistics Canada numbers because the estimated product stewardship data have been added in – this has no effect on Ontario’s overall waste diversion figure of 20 percent.

NRCan / RNCan 97 Mar-2006
Figure 9.3: Ontario Solid Waste Flow in 2002
Population12,096,627
Total Generation12,122,724 tonnes
Economy$440 billion (GDP)
Residential4,434,433 t.
IC&I*6,529,590 t.
CR&D**1,158,701 t.
Rec.Disposal
3,438,408 t.Disposal
5,193,240 t.
Disposal1,013,985
Rec.
Rec.
144,716 t.949,830 t. 1,320,952 t.
Rec. = DiversionRate = 20% overall
61,593 t.
ProductStewardship
Programs
Nonferrous
Haz-waste
Ferrous
Glass
Plastics
Other
Paper
Organics
27,593
43,921
103,804
157,336
483,131
728,495
1,574,717
319,412
Wood
Other
ConcreteDrywallAsphaltNonferrousPaperFerrous8,257
12,06027,64379,053
111,385167,988
296,820
310,778
(*industrial, commercial & institutional;**construction, renovation & demolition)
= 9,645,633 t.(total disposal)
NonferrousTextilesOtherGlass
RenovationFerrous
Wood
Plastic
Organics
Paper2,448,167
927,178
588,602
354,203
260,443171,893
166,684135,770109,38636,462

NRCan / RNCan 98 Mar-2006

The Government of Canada Action Plan 2000 on Climate Change
NRCan / RNCan 99 Mar-2006
Chapter 10 Quebec 10.1 INTRODUCTION .................................................................................................... 100 10.2 DEMOGRAPHICS ................................................................................................... 101 10.3 GENERATION, RECYCLING AND DISPOSAL BY SECTOR ........................................ 102 10.3.1 Generation Data ..................................................................................... 102 10.3.2 Recycling Data........................................................................................ 103 10.3.3 Product Stewardship Data...................................................................... 103 10.3.4 Disposal Data ......................................................................................... 104 10.4 WASTE COMPOSITION .......................................................................................... 105
10.4.1 Residential Waste Characterization ....................................................... 105 10.4.2 Industrial, Commercial and Institutional (IC&I) Waste
Characterization ..................................................................................... 107 10.4.3 Construction, Renovation and Demolition (CR&D) Waste
Characterization ..................................................................................... 108 10.5 QUEBEC SUMMARY.............................................................................................. 109
The Government of Canada Action Plan 2000 on Climate Change
NRCan / RNCan 100 Mar-2006
10.1 Introduction Like many of the other provinces in 1989, Quebec adopted a 50 percent target regarding the amount of solid waste disposed of by the year 2000. In the absence of the required mechanisms to support efforts to strive for the target, it was not met and the strategy subsequently revised. The key planning document for solid waste management in the Province of Quebec is the Quebec Residual Materials Management Policy, 1998-2008,159 which replaces and updates the Quebec Action Plan for Waste Management of 1998. The main goal of the residuals policy is to recover 65 percent of residual materials that are reclaimable. Specific goals have been identified by sector and for material groups as follows:160 Municipalities:
� 60 percent of glass, plastics, metals, fibre, bulky waste and putrescible material
� 75 percent of oils, paints and pesticides (household hazardous materials)
� 50 percent of textiles � 80 percent of non-refillable beer and soft drink containers
Industrial, commercial and institutional establishments:
� 85 percent of tires � 95 percent of metals and glass; � 70 percent of plastics and fibres, including wood material; � 60 percent of putrescible material.
Construction, renovation and demolition sector:
� 60 percent of all recoverable resources.
While it is the Quebec Ministry of the Environment that develops the regulations and policies, it is RECYC-QUÉBEC (a crown corporation) that monitors progress by assembling annual performance data on recycling and solid waste management throughout the province.161 In fact, RECYC-QUÉBEC provides Statistics Canada with all the Quebec data it needs to complete the biennial Waste Management Industry Survey (WMIS) report referred to in previous chapters. RECYC-QUÉBEC produces an annual report (“Bilan”162), which could serve as an excellent template for other provinces and is referenced throughout this chapter.
159 See http://www.menv.gouv.qc.ca/matieres/mat_res-en/index.htm 160 See Section 4 http://www.menv.gouv.qc.ca/matieres/mat_res-en/parts-1-4.htm#note1 161 See http://www.recyc-quebec.gouv.qc.ca/client/fr/accueil.asp 162 See http://www.recyc-quebec.gouv.qc.ca/client/fr/rubriques/documentation.asp?idTypeLib=20

The Government of Canada Action Plan 2000 on Climate Change
NRCan / RNCan 101 Mar-2006
10.2 Demographics According to Statistics Canada the 2002 population of Quebec was 7,443,491. Table 10.1 shows the distribution of population throughout the province (different data source so slightly different total). Table 10.2 provides a simpler population summary from Statistics Canada.
Table 10.1: Quebec Population Distribution by Region163
Region
Population
Bas-Saint-Laurent (01) Saguenay–Lac-Saint-Jean (02) Capitale-Nationale (03) Mauricie (04) Estrie (05) Montréal (06) Outaouais (07) Abitibi-Témiscamingue (08) Côte-Nord (09) Nord-du-Québec (10) Gaspésie–Îles-de-la-Madeleine (11) Chaudière-Appalaches (12) Laval (13) Lanaudière (14) Laurentides (15) Montérégie (16) Centre-du-Québec (17)
202,983 281,067 655,699 259,125 293,582
1,867,278 327,435 147,189
98,164 39,596 97,646
391,284 355,308 400,525 480,889
1,324,608 223,367
Total
7,445,745
The data in Table 10.2 suggest that nearly half of the Quebec population reside in the Montreal area, which would imply that many of the province’s recycling industries are also located here.
Table 10.2: Quebec Population Summary164
Municipality
Population
Percent
Montréal Quebec City Gatineau Chicoutimi - Jonquière Sherbrooke Trois-Rivières 10,000 - 100,000 < 10,000
3,426,350 682,757 226,696 154,938 153,811 137,507 862,867
1,798,565
46% 9% 3% 2% 2% 2%
12% 24%
Total
7,443,491 100%
163 http://www.stat.gouv.qc.ca/donstat/societe/demographie/dons_regnl/regional/203.htm 164 http://www12.statcan.ca/english/census01/products/standard/popdwell/Table-UR-D.cfm?PR=35 Evidently the Regional boundaries listed do not coincide with the municipal ones.

The Government of Canada Action Plan 2000 on Climate Change
NRCan / RNCan 102 Mar-2006
10.3 Generation, Recycling and Disposal by Sector Quebec’s fundamental waste statistics for 2002 are presented in Table 10.3: They are from WMIS as noted.
Table 10.3: Quebec Solid Waste Flow by Sector (2002)165
Sector
Generation Disposal Recycling
Residential IC&I CR&D
3,471,000 3,196,000
619,800
2,876,000 2,261,000
406,800
595,000 935,000 213,000
Total tonnes Kilograms/capita
7,286,800 979
5,543,800 745
1,743,000 234
Total generation of solid waste is down 2 percent from 2000 levels, which were 7,345,200 tonnes or 996 kg per capita. Concurrently, Quebec disposal quantities dropped 5 percent (from 787 to 745 kg/capita) and recycling increased about 11 percent (from 209 to 234 kg/capita).
10.3.1 Generation Data The RECYC-QUÉBEC generation data are different than the Statistics Canada ones (in part) for the simple reason that one data set includes materials, which the other excludes. See Chapter 4 for a discussion of the scope that Statistics Canada has adopted for conducting its survey work. The reasons why RECYC-QUÉBEC data are different are discussed in the text that follows. The residential data reported by RECYC-QUÉBEC in their Bilan 2002 are virtually the same as the data in Table 10.3. The Bilan 2002 includes “paint” and “household hazardous waste” but Statistics Canada does not because these items are not classified as “solid non-hazardous” that constitutes the WMIS “frame”. In the case of residential waste generation, the difference is insignificant (i.e. 3,000 tonnes per year). The generation data diverge where IC&I and CR&D are concerned. The Bilan 2002 reports that 4,659,000 tonnes of IC&I and 3,131,000 tonnes of CR&D waste were generated in Quebec in 2002. These figures are significantly different than the ones presented in Table 10.3. The explanation for the IC&I difference is provided in Section 10.3.2 because the variance is a result of how the recycling numbers are calculated by Statistics Canada on the one hand and RECYC-QUÉBEC on the other. The explanation for the CR&D variance is both disposal and recycling related.
165 Statistics Canada, Waste Management Industry Survey: Business and Government Sectors 2002, Catalogue no. 16F0023XIE, Table A.1, p. 14.
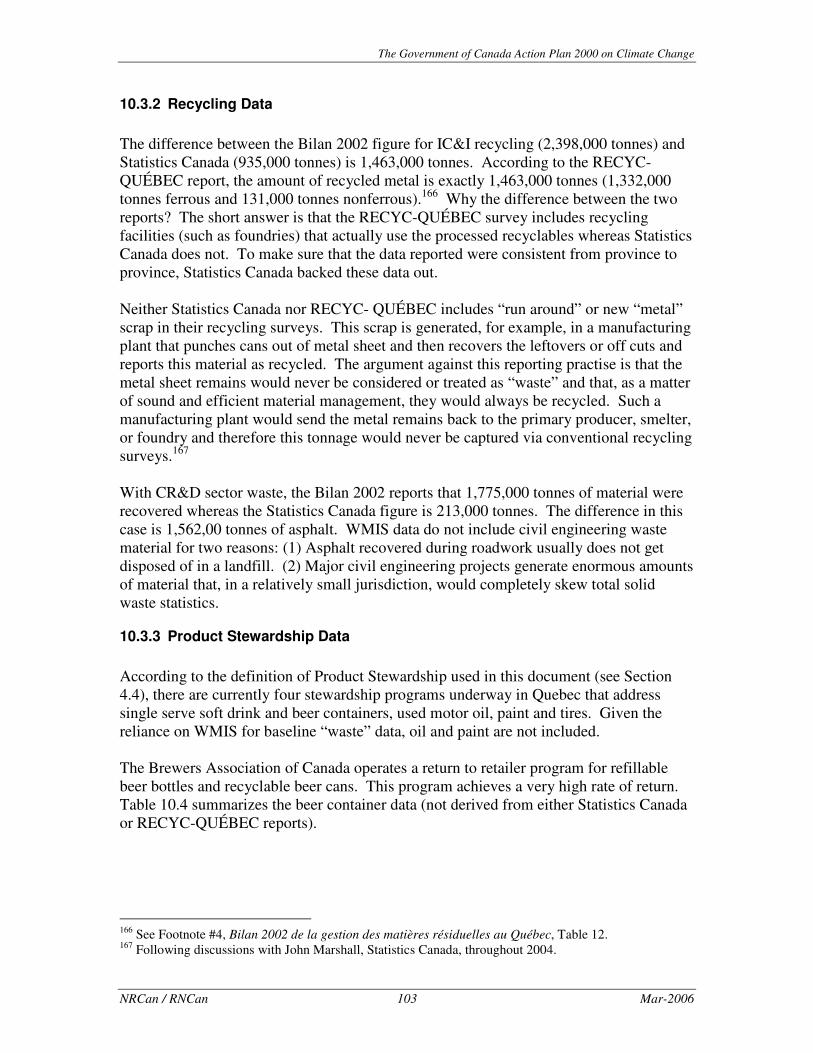
The Government of Canada Action Plan 2000 on Climate Change
NRCan / RNCan 103 Mar-2006
10.3.2 Recycling Data The difference between the Bilan 2002 figure for IC&I recycling (2,398,000 tonnes) and Statistics Canada (935,000 tonnes) is 1,463,000 tonnes. According to the RECYC-QUÉBEC report, the amount of recycled metal is exactly 1,463,000 tonnes (1,332,000 tonnes ferrous and 131,000 tonnes nonferrous).166 Why the difference between the two reports? The short answer is that the RECYC-QUÉBEC survey includes recycling facilities (such as foundries) that actually use the processed recyclables whereas Statistics Canada does not. To make sure that the data reported were consistent from province to province, Statistics Canada backed these data out. Neither Statistics Canada nor RECYC- QUÉBEC includes “run around” or new “metal” scrap in their recycling surveys. This scrap is generated, for example, in a manufacturing plant that punches cans out of metal sheet and then recovers the leftovers or off cuts and reports this material as recycled. The argument against this reporting practise is that the metal sheet remains would never be considered or treated as “waste” and that, as a matter of sound and efficient material management, they would always be recycled. Such a manufacturing plant would send the metal remains back to the primary producer, smelter, or foundry and therefore this tonnage would never be captured via conventional recycling surveys.167 With CR&D sector waste, the Bilan 2002 reports that 1,775,000 tonnes of material were recovered whereas the Statistics Canada figure is 213,000 tonnes. The difference in this case is 1,562,00 tonnes of asphalt. WMIS data do not include civil engineering waste material for two reasons: (1) Asphalt recovered during roadwork usually does not get disposed of in a landfill. (2) Major civil engineering projects generate enormous amounts of material that, in a relatively small jurisdiction, would completely skew total solid waste statistics.
10.3.3 Product Stewardship Data According to the definition of Product Stewardship used in this document (see Section 4.4), there are currently four stewardship programs underway in Quebec that address single serve soft drink and beer containers, used motor oil, paint and tires. Given the reliance on WMIS for baseline “waste” data, oil and paint are not included. The Brewers Association of Canada operates a return to retailer program for refillable beer bottles and recyclable beer cans. This program achieves a very high rate of return. Table 10.4 summarizes the beer container data (not derived from either Statistics Canada or RECYC-QUÉBEC reports).
166 See Footnote #4, Bilan 2002 de la gestion des matières résiduelles au Québec, Table 12. 167 Following discussions with John Marshall, Statistics Canada, throughout 2004.

The Government of Canada Action Plan 2000 on Climate Change
NRCan / RNCan 104 Mar-2006
Table 10.4: Beer Containers Sold and Returned in Quebec (2002)168
Container Type
Units Sold Return Rate
Tonnes Returned
Tonnes Recycled
Refillable glass bottles Aluminum cans
1,451,176,656 135,735,938
98.0% 76.0%
383,014 1,547
25,534 1,547
Total
27,081
The Bilan 2002 provides data on the quantity of single use beverage containers returned to retailer (beer plus soft drink): 15,000 tonnes of glass, 10,000 tonnes of aluminum cans, and 10,000 tonnes of plastic containers.169 To avoid double counting, it is noted that the 10,000 tonnes of aluminum cans identified in the Bilan 2002 include the 2,610 tonnes of beer cans from Table 10.4. However, the amount of glass beer bottles recycled – as calculated in Table 10.4 – is about 10,000 tonnes greater than the Bilan 2002 figure for beer and soft drink bottles. Although this discrepancy in the data is of concern and requires reconciliation by knowledgeable parties, it does not impact the main purpose of this chapter, which is to estimate the type and quantity of material being disposed. In order to report the level of product stewardship recycling in Quebec, the Bilan 2002 data are used. RECYC-QUÉBEC reports that 6.3 million passenger equivalent tires were recycled annually in Quebec.170 Under the assumption that each PTE tire weighs 8.2 kg,171 it can be calculated that 51,660 tonnes of tires were recycled (or “valorized” which is a euphemism for thermal treatment with energy recovery). More discussion on tires is provided in Section 17.2. Thus, the total amount of material reported recovered via product stewardship programs in 2002 is estimated to be 86,660 tonnes.
10.3.4 Disposal Data As shown in Table 10.3, WMIS reports that the total amount of solid non-hazardous waste disposed of in Quebec in 2002 was 5,543,800 tonnes. To be consistent with the approach used in the other provinces, this is the figure that will be used to develop characterization projections. RECYC-QUÉBEC reports in Bilan 2002 that 6,493,000 tonnes were disposed of in 2002, which is 949,200 tonnes more than WMIS. The source of this variance is the CR&D sector disposal data. As mentioned previously, the Bilan 2002 includes civil engineering waste but WMIS does not. This obviously is an issue when it comes to harmonization of waste data across the country. Given the likelihood that definitions will vary, it is 168 Brewers Association of Canada, 2003 Annual Statistical Bulletin (www.brewers.ca) 169 See Footnote #4, Bilan 2002 de la gestion des matières résiduelles au Québec, Table 10. 170 See http://www.recyc-quebec.gouv.qc.ca/Upload/Publications/zfiche_466.pdf 171 See http://wlapwww.gov.bc.ca/epd/epdpa/ips/index.html

The Government of Canada Action Plan 2000 on Climate Change
NRCan / RNCan 105 Mar-2006
important that assumptions and calculations be as transparent as possible to enable apple-to-apple comparisons. 10.4 Waste Composition Under the Quebec Action Plan for Waste Management 1998-2008, several studies were initiated including one entitled Caractérisation des matière résiduelles au Québec, which was funded by the Quebec Ministry of the Environment, RECYC-QUÉBEC, Collecte Sélective Québec and the municipalities of Montreal and Quebec City.172 This is a very comprehensive (four season) study from which the residential composition data are drawn for the projections provided in this chapter (and henceforth referred to as the Chamard study or data for ease of reference).
10.4.1 Residential Waste Characterization The referenced characterization study provides extensive waste composition detail according to location (urban, suburban, rural), income level (high, low) and building type (single-family, 2-6 unit multi-family, apartment tower). Table 10.5 provides the urban and rural percentages plus total tonnes for the province. The total generated tonnes (disposed plus recycled) are based on average percentages from the Chamard study.173
Table 10.5: Estimated Composition Quebec Residential Waste Generated (2002)
Material
Rural Urban Total tonnes
Paper Cardboard Glass Ferrous Nonferrous Plastics Textiles Organics Sanitary Other
11.7% 4.9% 4.8% 5.0% 1.4% 9.8% 4.2%
40.5% 6.6%
11.1%
24.0% 6.8% 6.7% 2.6% 0.7% 7.6% 2.7%
36.6% 6.6% 5.7%
801,801 201,318 232,557
95,416 26,069
253,383 69,420
1,416,168 187,434 187,434
Total
100.0% 100.0% 3,471,000
It is interesting to note that the urban households generate significantly more paper waste, which is probably newsprint. The effect of this is that the rural areas appear to generate more of every other category of waste material except glass and cardboard.
172 Chamard, CRIQ, Roche, 2000, Caractérisation des matière résiduelles au Québec, le ministère de l’environnement, la Société québécoise de récupération et de recyclage, Collecte Sélective Québec, la Communauté urbaine de Québec et la Régie intermunicipale de gestion des déchets sur l’île de Montréal. 173 Ibid, Table 1.20, page 64

The Government of Canada Action Plan 2000 on Climate Change
NRCan / RNCan 106 Mar-2006
To estimate the characterization of solid waste disposed, it is necessary to subtract the tonnage of materials recycled (Bilan 2002) from the amount generated (Chamard). Unfortunately, since the material categories do not exactly match the “Other” category in Table 10.6 combines 99,000 tonnes of appliances with 1,000 tonnes of HHW.
Table 10.6: Estimated Composition Quebec Residential Waste Disposed (2002)
Material
Generated
tonnes Recycled
tonnes Disposed
tonnes Paper Glass Ferrous Nonferrous Plastics Textiles Organics Other
1,003,119 232,557
95,973 25,512
253,383 69,420
1,416,168 374,868
301,000 45,000 12,000 11,000 21,000 21,000 84,000
100,000
702,119 187,557
83,973 14,512
232,383 48,420
1,332,168 274,868
Total
3,471,000
595,000 2,876,000
For the pie chart presented as Figure 10.1, the disposal tonnes shown in Table 10.6 are used so the percentages should be considered as provincial averages.
Figure 10.1: Estimated Composition of Total Residential Waste Disposed in Quebec (2002)
Paper24%
Organics45%
Other10%
Ferrous3% Glass
7%
Nonferrous1%
Plastics8%
Textiles2%

The Government of Canada Action Plan 2000 on Climate Change
NRCan / RNCan 107 Mar-2006
10.4.2 Industrial, Commercial and Institutional (IC&I) Waste Characterization The Quebec characterization study consultants decided that the IC&I sector was too complex to develop average values for, there being eighteen divisions according to the Standard Industrial Classification174. The manufacturing industry alone has 115 groups175. For the purposes of the Quebec study, the IC&I sector was split into institutional and commercial (IC), and then a sub-set of industrial generators was considered. IC waste generators included (i) education, medical and other institutions and (ii) grocery stores, regional and local shopping centres, commercial strips and restaurants. The data assembled in Quebec that specifically reflect waste generation and its varying composition by IC&I generator type, will help inform the alternative approach to characterizing this stream of solid waste, as first mentioned in Section 4.2 and later discussed in more detail in Chapter 16. However, for the purposes of developing a much generalized picture of IC&I waste in Quebec, the composition data from Ontario are employed. This approach is consistent with the other provincial treatments. Thus, Table 10.7 provides rough projections for what the Quebec IC&I sector solid waste stream looks like when average Toronto data are applied. Table 10.7: Projected Tonnage for IC&I Waste Disposed in Quebec (2002)176
Material
Tonnes Percents
Paper Plastic Wood Textiles Organics Ferrous Nonferrous Glass Construction Other
1,065,868 256,262 154,211
47,624 403,669 113,390
15,875 72,570 74,838 56,695
47.1% 11.3%
6.8% 2.1%
17.9% 5.0% 0.7% 3.2% 3.3% 2.5%
Total
2,261,000
100.0%
There is no point in graphing Table 10.7 data since the pie chart would look exactly like Figure 9.2 where paper and organics appear to account for more than half of the IC&I waste stream.
174 Statistics Canada now uses NAICS, the North American Industrial Classification System. 175 Chamard, page 151 176 Proctor & Redfern Ltd. and SENES Consultants Ltd., 1999, Solid Waste Environmental Assessment Plan (SWEAP) Waste Composition Study (Discussion paper No. 4.3), prepared for Solid Waste Management Division, Metropolitan Toronto Department of Works

The Government of Canada Action Plan 2000 on Climate Change
NRCan / RNCan 108 Mar-2006
10.4.3 Construction, Renovation and Demolition (CR&D) Waste Characterization As noted, the Bilan 2002 data include waste materials derived via roadwork whereas Statistics Canada does not (see Section 10.3.2). Similarly, the Chamard study indicates that institutional CR&D waste includes roadwork materials. This is evident in Table 10.8 where a significant amount of material is concrete waste material (look under “Chamard tonnes”). It is important to note that Chamard et al state that the results of their analysis do not provide an accurate portrait of the actual production of CR&D waste in that province177. Indeed, as discussed in Section 4.3 and as shown in Table 4.3, the CR&D sector’s waste stream is highly variable and difficult to model in any simplistic way. For the purposes of this study, however, it is necessary to make some assumptions and produce some projections (and the reader is cautioned accordingly). Table 10.8 compares the Chamard CR&D composition data with the values being used throughout this report (“Report standard”). Note that “asphalt” in the Chamard report is asphalt shingles whereas the assumed figure includes shingles with some asphalt aggregates. It is interesting to note how divergent the data are with respect to the metal materials: In the standard approach it is assumed that ferrous/nonferrous is 23/77 while the Chamard data suggest 87/13.178 This highlights the caution that should be taken when applying any of these data. Table 10.8: Projected Tonnage for CR&D Waste Disposed in Quebec (2002)
Material
Chamard Tonnes
Report standard Tonnes Percent
Ferrous Nonferrous Paper Asphalt Drywall Concrete Other Wood Glass Textiles Haz-waste Plastics
9,181 1,396 8,543
20,747 66,715
138,312 46,782 87,462 2,441 2,848
16,679 5,695
3,453 11,559 4,721
30,921 45,514 65,706
118,785 126,141
0.8% 2.8% 1.2% 7.6%
11.2% 16.2% 29.2% 31.0%
Totals 406,800
406,800
100.0%
177 Chamard et al, page 176 178 A simplistic justification for assuming that a smaller amount of ferrous is discarded is the likelihood that some form of magnetic separation is applied to CR&D waste to remove resalable materials.

The Government of Canada Action Plan 2000 on Climate Change
NRCan / RNCan 109 Mar-2006
10.5 Quebec Summary Table 10.9 combines the solid waste disposed from the residential, IC&I and CR&D sectors to present an overall characterization. The projections developed in this chapter suggest that the quantity of organic and paper waste disposed of in Quebec in 2002 amounted to almost 3.5 million tonnes or about 63 percent of the total. This finding is relatively similar to the other provinces. The inclusion of CR&D roadwork waste materials, namely concrete and asphalt would change the overall percentages slightly, reducing paper and organic material’s share of the pie by about 9 percent. Ferrous and nonferrous metal amount to about 245,000 tonnes or 4.4 percent of the total amount of solid waste disposed of in Quebec in 2002. If glass, drywall, concrete and asphalt are considered under the minerals and metals umbrella then a further 400,000 tonnes of material are potentially available for resource recovery programs. More data needs to be assembled to estimate what amount of that material is actually recyclable since much of it is likely to be contaminated or commingled with other non-recyclable items.
Table 10.9: Summary of Quebec Waste Materials Disposed (2002)
Material
Total Tonnes Overall Percent
Paper Organics Other Plastics Wood Glass Ferrous Textiles Renovation Concrete & brick Drywall Asphalt Nonferrous
1,901,753 1,577,077
486,088 466,210 280,352 265,262 217,503 105,144
74,838 65,706 45,514 30,921 27,433
34.3% 28.4%
8.8% 8.4% 5.1% 4.8% 3.9% 1.9% 1.3% 1.2% 0.8% 0.6% 0.5%
Total
5,543,800
100.0%
As discussed at the end of previous chapters, plastics could be considered mineral in substance given their petroleum base – another 466,000 tonnes of material could be added to the list. As a result, the total amount of direct and indirect mineral and metal material discarded in Quebec in 2002 could be as high as 1.12 million tonnes. Since the occurrence of these materials correlates with population density, it is likely that more than half of the total is

The Government of Canada Action Plan 2000 on Climate Change
NRCan / RNCan 110 Mar-2006
generated in the greater Montreal area and even more within direct access of the St. Lawrence River. In Figure 10.2, a summary of the estimated characterization of solid waste disposed in Quebec in 2002 is provided. The reader is advised not to assume the level of accuracy reflected in the fact that the numbers have not been rounded. The RECYC-QUÉBEC Bilan 2002 rounds all of its waste and recycling tonnage to the nearest thousand, which is a sound strategy to adopt given the large and varied number of data points that exist. Also note that the total Statistics Canada generation figure (7,286,000 tonnes) is increased by the value of the sum estimated for product stewardship (estimated to be 86,660 tonnes).

NRCan / RNCan 111 Mar-2006
Figure 10.2: Quebec Solid Waste Flow in 2002
Population7,443,491
Total Generation7,373,460 tonnes
Economy$229 billion (GDP)
Residential3,535,995 t.
IC&I*3,217,665 t.
CR&D**619,800 t.
Rec.Disposal
2,876,000 t.Disposal
2,261,000 t.
Disposal406,800 t.
Rec.
213,000 t. Rec.595,000 t. 935,000 t.
Rec. = DiversionRate = 25% overall
86,660 t.
ProductStewardship
Programs
Organics
Paper
Plastics
Glass
Cardboard
Other
SanitaryFerrousTextilesNonferrous21,600
1,173,408
664,356
209,948
192,692
166,808
155,304155,304
79,06057,520
Paper
Organics
Plastic
Wood
FerrousRenovationGlassOther
TextilesNonferrous
1,056,868
403,669
256,262
154,211
113,39074,83872,57056,695
47,62415,875
= 5,543,800 t.(total disposal)
WoodOtherConcreteDrywallAsphaltNonferrousPaperFerrous
126,141118,785
65,70645,51430,92111,559
4,7213,453
Population7,443,491
Total Generation7,373,460 tonnes
Economy$229 billion (GDP)
Residential3,535,995 t.
IC&I*3,217,665 t.
CR&D**619,800 t.
Rec.Disposal
2,876,000 t.Disposal
2,261,000 t.
Disposal406,800 t.
Rec.
213,000 t. Rec.595,000 t. 935,000 t.
Rec. = DiversionRate = 25% overall
86,660 t.
ProductStewardship
Programs
Organics
Paper
Plastics
Glass
Cardboard
Other
SanitaryFerrousTextilesNonferrous21,600
1,173,408
664,356
209,948
192,692
166,808
155,304155,304
79,06057,520
Organics
Paper
Plastics
Glass
Cardboard
Other
SanitaryFerrousTextilesNonferrous21,600
1,173,408
664,356
209,948
192,692
166,808
155,304155,304
79,06057,520
Paper
Organics
Plastic
Wood
FerrousRenovationGlassOther
TextilesNonferrous
1,056,868
403,669
256,262
154,211
113,39074,83872,57056,695
47,62415,875
= 5,543,800 t.(total disposal)
WoodOtherConcreteDrywallAsphaltNonferrousPaperFerrous
126,141118,785
65,70645,51430,92111,559
4,7213,453

NRCan / RNCan 112 Mar-2006

The Government of Canada Action Plan 2000 on Climate Change
NRCan / RNCan 113 Mar-2006
Chapter 11 New Brunswick 11.1 INTRODUCTION .................................................................................................... 114 11.2 DEMOGRAPHICS ................................................................................................... 115 11.3 GENERATION, RECYCLING AND DISPOSAL BY SECTOR ........................................ 115 11.3.1 Generation Data ..................................................................................... 116 11.3.2 Recycling Data........................................................................................ 116 11.3.3 Product Stewardship Data...................................................................... 117 11.3.4 Disposal Data ......................................................................................... 119 11.4 WASTE COMPOSITION .......................................................................................... 119
11.4.1 Residential Waste Characterization ....................................................... 119 11.4.2 Industrial, Commercial and Institutional (IC&I) Waste
Characterization ..................................................................................... 120 11.4.3 Construction, Renovation and Demolition (CR&D) Waste
Characterization ..................................................................................... 122 11.5 NEW BRUNSWICK SUMMARY............................................................................... 123

The Government of Canada Action Plan 2000 on Climate Change
NRCan / RNCan 114 Mar-2006
11.1 Introduction Along with the other provinces, under the 1989 auspices of the Canadian Council of Ministers of the Environment (CCME), New Brunswick agreed to a national goal of reducing per capita waste disposal to 50 percent by the year 2000. It is of interest to note that the goal refers to reduced waste disposal rather than increased diversion or recycling. While the two activities are closely linked, the benefit of using waste disposal as a measure of diversion performance is that waste disposed is usually always measured whereas quantities of materials recycled are not. The strategy developed by the New Brunswick Ministry of the Environment and Local Government is summarized in a document entitled “Waste Reduction & Diversion: An Action Plan for New Brunswick”.179 In order to strive towards the 50 percent goal, the province introduced sweeping changes to their solid waste management approach. Of note, hundreds of “dumps” were closed, six sanitary landfills and five transfer station were opened, a deposit/refund system was set up for beverage containers and the NB Tire Stewardship Regulation was passed. Further, a series of twelve Regional Solid Waste Commissions were created to manage all aspects of solid waste including collection. However, to date, the commissions’ role is focused on disposal and waste diversion while municipalities continued to be responsible for collection services. Many commissions have facilities to process recyclables or to compost organic matter. The commissions are: Nepisiguit-Chaleur, Kent County, COGEDES, COGERNO, Fredericton Region, Fundy Region, Northumberland, Kings County, Restigouche, Valley, Southwest and Westmoreland-Albert. The population of each commission is shown in Table 11.1. For a map of New Brunswick that shows where all the commissions are located and provides useful contact information, the NB Solid Waste Association has established a web site.180 Each commission assembles waste and recycling data and reports them to the NB Department of the Environment and Local Government. However, as with the other provinces, the primary source of generation, recycling and disposal data for this chapter is Statistics Canada’s Waste Management Industry Survey for 2002.
179 See http://www.gnb.ca/0009/0372/0005/WRD-E.pdf 180 See http://www.recyclenb.ca/regional_commissions_map.asp

The Government of Canada Action Plan 2000 on Climate Change
NRCan / RNCan 115 Mar-2006
11.2 Demographics According to WMIS, the population of New Brunswick in 2002 was 750,183.181 According to the province’s Department of Environment and Local Government, the 2001 population was 729,498. The 2001 population distribution by Solid Waste Commission is presented in Table 11.1.
Table 11.1: New Brunswick Population Distribution by Solid Waste Commission182
Commissions
Population
COGEDES COGERNO Fredericton Region Fundy Region Kent Kings County Nepisiguit-Chaleur Northumberland Restigouche South West Valley Westmorland-Albert
46,140 51,160
115,738 120,863
31,383 23,123 38,712 51,723 27,634 32,201 39,384
151,437
Total (2001) 729,488
Almost one quarter of the population live in the three largest cities of Saint John (69,661), Moncton (61,046) and Fredericton (47,560). For the purposes of developing characterization projections, where possible, it is assumed that the urban population of New Brunswick is 178,267 (which is the sum of these three cities) rather than 50.4% as identified by Statistics Canada. It is assumed that the three largest cities in NB have an IC&I profile that is significantly different than other communities (see Section 11.4.2). 11.3 Generation, Recycling and Disposal by Sector Any differences that the province may have with WMIS 2002 numbers are reported on in this section. Table 11.2 provides the general overview; however, materials recovered under provincial product stewardship are not included in the summary at this point (further discussion in Section 11.3.3).
181 Statistics Canada, Waste Management Industry Survey: Business and Government Sectors 2002, Catalogue no. 16F0023XIE, Table 2.2, p. 10 182 Provided by Tim Leblanc, Department of Environment and Local Government, New Brunswick, March 2005

The Government of Canada Action Plan 2000 on Climate Change
NRCan / RNCan 116 Mar-2006
Table 11.2: New Brunswick Solid Waste Flow by Sector (2002)183
Sector
Generation Disposal Recycling
Residential IC&I CR&D
256,191 216,432
63,941
203,506 154,812
55,288
52,685 61,620 8,653
Total tonnes Kilograms/capita
536,564 715
413,606 551
122,958 164
According to WMIS, solid waste disposal in New Brunswick has slightly decreased over the period 2000 to 2002 (a decrease of 1,452 tonnes). Although total waste generation has increased more significantly (6,609 tonnes), all of the slack has been taken up by an 8 percent improvement in recycling performance (plus 8,601 tonnes).
11.3.1 Generation Data During the research phase of this project, each Solid Waste Commission (SWC) was contacted to see if it had any waste and recycling data that it could share. The following total waste generation numbers were assembled (disposed plus recycling):
� Valley SWC 555 kg/capita/year (39,384 pop.) � Fredericton SWC 681 kg/capita/year (assume 115,738 pop.) � Northumberland SWC 526 kg/capita/year (approx. 51,723 pop.) � COGERNO 994 kg/capita/year (51,160 pop.) � Westmoreland-Albert 674 kg/capita/year (151,437 pop.)
Without additional SWC data it is difficult to make any meaningful comparisons with the WMIS numbers. However, these five per capita numbers do reflect the fact that the generation of solid waste in a province the size of New Brunswick can vary widely from one region to the next.
11.3.2 Recycling Data WMIS reports that in 2002 New Brunswick residents recycled 164 kg of materials each (this includes recycling in all three sectors). The Statistics Canada survey is highly inclusive. Their report takes into account materials shipped between SW Commissions, which appears to be an NB practice based on facility locations, hauling distances and economies of scale. Recycling data assembled from a few of the SW Commissions are substantially lower than WMIS; that is, Valley 40 kg/cap/yr, Fredericton 47 kg/cap/yr, COGERNO 29 kg/cap/yr and Northumberland at 17 kg/cap/yr. It is assumed that these data pertain to residential materials only or simply do not include all recycling tonnage in their local 183 Statistics Canada, Waste Management Industry Survey: Business and Government Sectors 2002, Catalogue no. 16F0023XIE, Table A.1, p. 14.

The Government of Canada Action Plan 2000 on Climate Change
NRCan / RNCan 117 Mar-2006
areas. It is noted that Fredericton tracks scrap metal, brush and tires whereas the other Commissions do not. Fredericton also identified a relatively large amount of CR&D material as being “diverted” where, in fact, the material went to an inert landfill. To be consistent with this report’s methodology, that CR&D material was not counted as “recycled”. The mix of public and private recycling activities is typically difficult to track in any community. If the waste disposal and material recovery facilities (MRF) are publicly controlled, then data collection is more likely to happen. It is recognized however that many jurisdictions in Canada tend to monitor tonnage disposed (rather than materials recycled) because (a) they have landfill weigh scales and (b) the CCME national target emphasized waste disposal reduction.
11.3.3 Product Stewardship Data The New Brunswick Beverage Containers Program includes the following beverages: soft drinks, beer, wine, and spirits, flavoured waters, fruit juices, vegetable juices, and low alcohol drinks. These beverages are sold in any of the following packages: glass and plastic bottles, metal cans, drink boxes, plastic cups with foil lids, plastic pouches (e.g. mini-sips), and polycoat cartons. To collect related packaging, there are 82 redemption centres across the province and some retailers may redeem deposits (but none do). The collection of the beverage containers is divided between Encorp Atlantic Inc. (all non-alcoholic drinks), Rayan Investments (all liquor board containers) and the brewers (all refillable beer bottles). Table 11.3 provides a summary of all NB beverage containers recovered in 2002 except beer.184 The Brewers Association of Canada (specifically Moosehead Breweries and Labatt Breweries) operates a collection system for refillable beer bottles through licensed redemption centres. Recyclable beer cans are also collected through licensed redemption centres and handled by Rayan investments. Return to retail does not exist in New Brunswick. This program achieves a very high rate of return. Table 11.4 summarizes the beer container data. Note that the total number of returned (refillable) bottles is divided by 15 to estimate the amount of glass bottles actually recycled each year (see Section 4.4 for more discussion regarding this issue).
184 The data were assembled via telephone and e-mail communication with Bryan Howell of Encorp Atlantic and Rick Smith of the NB Liquor Board in 2003. For an overview of NB’s beverage container program see http://www.ec.gc.ca/epr/inventory/en/DetailView.cfm?intInitiative=83

The Government of Canada Action Plan 2000 on Climate Change
NRCan / RNCan 118 Mar-2006
Table 11.3: New Brunswick Beverage Container Recovery Program Summary (excluding beer containers, 2002)
Container Type
Units Returned
Kg per unit Tonnes
Aluminum185 Glass186 PET187 Other188
82,868,677 18,302,729 52,042,183 18,577,976
0.015 0.516 0.041 0.094
1,243 9,445 2,061 1,738
Total 14,487
Table 11.4: New Brunswick Beer Containers Sold, Returned and Recycled
(2002)
Container Type
Units Sold Return Rate
Tonnes Returned
Tonnes Recycled
Refillable glass bottles Aluminum cans
115,173,467 22,538,621
97.4% 69.8%
30,212 236
2,014 236
Total
2,250
There are two other product stewardship programs to consider, tires and empty plastic pesticide containers. In the first case, it is estimated that 6,417 tonnes of tires are recycled in NB each year.189 More tire discussion and references are provided in Section 17.2. In the second case, there is a voluntary plastic pesticide container recycling program in NB whereby empty containers are returned to designated collection points (usually licensed dealers). The New Brunswick Department of the Environment and Local Government suggests that over 25,000 of these containers are recycled annually.190 This can be converted to 15 tonnes under the assumption that each container weighs 0.354 kg.191 The estimated total amount of material recovered via product stewardship is 23,168 t.
185 It is assumed that empty 355 ml aluminum cans weigh 0.015 kg. 186 The empty non-alcoholic glass bottle weight is assumed to be 0.416 kg, based on Alberta data at www.abcrc.com/StatsInfo/RecoveryVolume. An empty liquor bottle is assumed to be 0.57 kg from Vineyard & Winery Management at www.vwm-online.com/Magazine/Archive/2002/Vol28_No6/Bottles_on_Steroids.htm. The figure in Table 11.3 is a weighted average. 187 It is assumed that an empty PET bottle weighs 0.041 kg, from Nova Scotia RRFB data (see Section 12.3.3). 188 Since the Alberta beverage container program has an “other” category as well, it was assumed that the “other” containers in NB weighed the same; that is, 0.094 kg/unit (see Footnote #8, first reference). 189 For more information see http://www.nbtire.com/ 190 See http://www.gnb.ca/0009/0372/0008/0004-e.asp for more information 191 See http://www.croplife.ca/english/pdf/CMP20061.pdf for national overview of program.

The Government of Canada Action Plan 2000 on Climate Change
NRCan / RNCan 119 Mar-2006
11.3.4 Disposal Data As shown in Table 11.2, the total amount of solid waste disposed of in New Brunswick in 2002 was 413,606 tonnes of which 49% was residential, 37% was IC&I, and 13% was CR&D. The comparable figures for all of Canada are 40%, 49% and 12%, so it would appear that the residential portion of the NB disposed waste stream is larger than the national average. In the following section, the Statistics Canada disposal data for 2002 form the basis for projecting resource recovery opportunities. 11.4 Waste Composition Research regarding waste characterization in New Brunswick has revealed only one study that was conducted for the Fredericton Region Solid Waste Commission in 2003.192 Therefore data from other provinces are used where necessary with the understanding that these projections can be updated when more local waste characterization data become available. No distinction is made between urban and rural areas.
11.4.1 Residential Waste Characterization In order to develop estimates for the standard set of categories, the Fredericton data were combined with more detailed data from Lunenburg, Nova Scotia.193 Specifically, the Fredericton report had six material categories, three of which were sub-divided into “recyclable” and “non-recyclable” (very useful distinctions). The Lunenburg data are used to create new material sub-divisions. For example, the Fredericton report identifies a total of 3.2 percent metal divided into recyclable metals (2.1 percent) and non-recyclable metals (1.1 percent). The non-recyclable metals are defined as all metals except white goods, ferrous and aluminum. The Lunenburg data divide the metal category into three categories interest: ferrous (64 percent), aluminum (26 percent and metal bearing (10 percent). These percentages are applied against the Fredericton metal total. The metal-bearing material category is helpful since these items could be shredded in order to separate the metals and fluff. However, further research into this area is required to investigate the technical and economic feasibility of such an approach. The projections provided in Table 11.5 show that the estimated quantity of metal bearing items in New Brunswick is rather low: This warrants further audit work. Figure 11.1 provides a chart representation of the data in Table 11.5.
192 GEMTEC Ltd., 2003, Waste Reduction and Diversion Plan, Fredericton Region Solid Waste Commission 193 SNC-Lavalin, 2001, Waste Characterization Study of Residual Solid Waste & Recyclables in Lunenburg, NS (Spring 2001), Resource Recovery Fund Board and EPIC

The Government of Canada Action Plan 2000 on Climate Change
NRCan / RNCan 120 Mar-2006
Table 11.5: Estimated Composition New Brunswick Residential Waste Disposed (2002)
Material
Total tonnes
Paper Glass Ferrous Aluminum Metal bearing Plastics Multi-material Textiles Organics Other
37,671 6,641 4,132 1,677
627 18,159 9,093
21,951 64,461 39,094
Total
203,506
Figure 11.1: Estimated Composition of Total New Brunswick Residential Waste Disposed (2002)
11.4.2 Industrial, Commercial and Institutional (IC&I) Waste Characterization In the Fredericton waste audit, the IC&I waste stream was measured qualitatively because a truly representative analysis would have been an extensive and expensive undertaking. Therefore an observational approach was taken and an estimated range for four basic material groups was derived as follows: fibre (40-50%), compostables (8-10%), plastics (5-8%) and metals (0-2%).194 Since about half of the materials being sent
194 GEMTEC, Table 5.4
Paper19%
Textiles11%
Organics32%
Other19%
Ferrous 2%
Aluminum 1%
Metal bearing <1%
Plastics 9%Multi-material4%
Glass 3%
Paper19%
Textiles11%
Organics32%
Other19%
Ferrous 2%
Aluminum 1%
Metal bearing <1%
Plastics 9%Multi-material4%
Glass 3%

The Government of Canada Action Plan 2000 on Climate Change
NRCan / RNCan 121 Mar-2006
to the Fredericton Region SWC landfill are IC&I in origin, significant opportunity exists to recover more recyclable material. For the purposes of making general IC&I waste characterization projections in New Brunswick, data from Toronto (Section 9.4.2) are applied to the urban areas with rural IC&I composition data borrowed from B.C. (Section 5.4.2). The Toronto IC&I study estimated 47 percent paper, which fits into the fibre range identified in the previous paragraph. However, the Toronto estimates for organics, plastics and metals are all higher than what was observed in Fredericton so the reader is advised accordingly. The IC&I data from rural B.C. suggest 25 percent paper and a much higher organic content at 35 percent. This makes sense if one assumes that less office paper is generated in a smaller community and therefore proportionately there would be more organics. It is a debateable assumption but once again points to the obvious need for better data. It is assumed that the disposal of IC&I waste as determined by Statistics Canada is an even 206 kg per capita throughout the province (although this is highly unlikely). Recall from Section 11.2 that “urban” in this chapter is limited to the three largest communities of New Brunswick that represent 24 percent of the total population. Therefore, in Table 11.6, urban tonnes also account for 24 percent of the total, given the per capita IC&I disposal rate assumption. Table 11.6: Projected Tonnage for IC&I Waste Disposed in New Brunswick
(2002)
Material
Urban
Rural
Total tonnes
Paper Ferrous Nonferrous Glass Plastics Organics Wood Textiles Renovation Haz-waste Other
17,342 1,845
258 1,181 4,170 6,568 2,509
775 1,218
- 922
29,624 5,446
762 2,124
13,289 41,733
- 9,914 4,025 4,084 7,022
46,966 7,291 1,021 3,305
17,459 48,301 2,509
10,689 5,242 4,084 7,945
Total
36,788 118,024 154,812
The data in Table 11.6 are graphically presented in Figure 11.2 where the significant presence of paper and organic materials is made apparent.

The Government of Canada Action Plan 2000 on Climate Change
NRCan / RNCan 122 Mar-2006
Figure 11.2: Estimated Composition of New Brunswick Total IC&I Waste Disposed (2002)
11.4.3 Construction, Renovation and Demolition (CR&D) Waste Characterization CR&D waste characterization data are not available in New Brunswick so the estimates developed in Section 4.3 are used to derive projections for this province. Regional solid waste commission records show that 53,617 tonnes of CR&D waste were disposed of in NB in 2002. It is however acknowledged that the volume of CR&D material managed by private disposal sites is unknown. Since the WMIS figure for CR&D waste disposed of is 55,288 tonnes (see Table 11.2), the difference (1,671 t) may be that which is managed at private sites. CR&D data for 2000 were deemed confidential and therefore WMIS did to publish them so it is impossible to comment on whether more or less CR&D waste is being disposed of in 2002. Table 11.7 provides province wide estimates for this waste stream based on the percentages set out in Section 4.3.
Paper30%
Plastics11%
Organics31%
Renovation3%
Haz-waste 3%
Wood 2%
Textiles 7% Other 5%
Glass2%
Ferrous 5%
Nonferrous 1%
Paper30%
Plastics11%
Organics31%
Renovation3%
Haz-waste 3%
Wood 2%
Textiles 7% Other 5%
Glass2%
Ferrous 5%
Nonferrous 1%

The Government of Canada Action Plan 2000 on Climate Change
NRCan / RNCan 123 Mar-2006
Table 11.7: Projected Tonnage for CR&D Waste Disposed in New Brunswick (2002)
Material
Total
Tonnes Total
Percent Concrete Asphalt Wood Drywall Ferrous Nonferrous Paper product Other
9,007 4,238
17,078 6,148
463 1,550
647 16,157
16% 8%
31% 11%
1% 3% 1%
29%
Totals 55,288
100%
11.5 New Brunswick Summary Table 11.8 combines the tonnage for all materials from all three sectors, residential, IC&I and CR&D and presents the totals. As elsewhere in the country, paper and organic material make up more than half of all solid waste currently disposed of. However, as revealed in the Fredericton study, it is important to realize that not all of these materials are recyclable: The estimated amount of residential paper that is recyclable is 65 percent with the remaining 35 percent wet or soiled. The same logic needs to be applied against the other materials (i.e. how much recyclable metal is economically recoverable). The intention of this summary analysis is to produce order of magnitude numbers that are used to develop national recovery projections in Chapter 18. Table 11.8: Summary of New Brunswick Waste Materials Disposed (2002)
Material
Total Tonnes Overall Percent
Paper Organics Other Plastics Wood Textiles Ferrous Glass Concrete Drywall Renovation Nonferrous Asphalt
111,299 92,100 68,226 35,706 27,637 25,211 12,359 11,610 9,007 6,148 5,124 4,941 4,238
26.9% 22.3% 16.5%
8.6% 6.7% 6.1% 3.0% 2.8% 2.2% 1.5% 1.2% 1.2% 1.0%
Total
413,606
100.0%
The total estimated amount of ferrous and nonferrous metal discarded in New Brunswick in 2002 is 17,300 tonnes. If drywall, glass, concrete and asphalt are considered to be in the minerals category then a further 31,000 tonnes of these materials are being discarded.

The Government of Canada Action Plan 2000 on Climate Change
NRCan / RNCan 124 Mar-2006
All of the materials shown in Table 11.8 and in Figure 11.3 are managed at various locations including, private recycling centres, redemption centres, transfer stations, and sanitary landfills. This infrastructure could represent a basis for future, expanded resource recovery activities. All waste materials not recycled are disposed of in one of six engineered sanitary landfills.

NRCan / RNCan 125 Mar-2006
Figure 11.3: New Brunswick Solid Waste Flow in 2002
Population750,183
Total Generation559,659 tonnes
Economy$20.2 billion (GDP)
Residential273,512 t.
IC&I*222,206 t.
CR&D**63,941 t.
Rec.Disposal203,506 t.
Disposal154,812 t.
Disposal55,288 t.
Rec.
8,653 t. Rec.52,685 t. 61,620 t.
Rec. = DiversionRate = 26% overall
ProductStewardship
Programs
= 413,606 t.(total disposal)
WoodOtherConcreteDrywallAsphaltNonferrousPaperFerrous
23,095 t.
Organics
Other
Paper
Textiles
Plastics
Multi-materialGlassFerrousAluminumMetal bearing
64,461
39,094
37,671
21,951
18,159
9,0936,6414,1321,677
627
Organics
Paper
Plastics
TextilesOtherFerrousRenovation
Haz-wasteGlassWood
Nonferrous
48,301
46,966
17,459
10,6897,9457,2915,242
4,0843,3052,509
1,021
17,07816,157
9,0076,1484,2381,550
647463

NRCan / RNCan 126 Mar-2006

The Government of Canada Action Plan 2000 on Climate Change
NRCan / RNCan 127 Mar-2006
Chapter 12 Nova Scotia 12.1 INTRODUCTION .................................................................................................... 128 12.2 DEMOGRAPHICS ................................................................................................... 129 12.3 GENERATION, RECYCLING AND DISPOSAL BY SECTOR ........................................ 130 12.3.1 Generation Data ..................................................................................... 131 12.3.2 Recycling Data........................................................................................ 131 12.3.3 Product Stewardship Data...................................................................... 132 12.3.4 Disposal Data ......................................................................................... 133 12.4 WASTE COMPOSITION .......................................................................................... 134
12.4.1 Residential Waste Characterization ....................................................... 134 12.4.2 Industrial, Commercial and Institutional (IC&I) Waste
Characterization ..................................................................................... 136 12.4.3 Construction, Renovation and Demolition (CR&D) Waste
Characterization ..................................................................................... 137 12.5 NOVA SCOTIA SUMMARY .................................................................................... 138

The Government of Canada Action Plan 2000 on Climate Change
NRCan / RNCan 128 Mar-2006
12.1 Introduction Nova Scotia is Canada’s leading province in terms waste minimization: According to Statistics Canada’s per capita data, Nova Scotians generate and dispose of the least amount of solid waste in the country, measured on a per capita basis.195 This impressive performance has been reported on extensively so the reader is advised to consult the following agencies to learn more about Nova Scotia’s recycling and waste management policy and program activities:
� Department of Environment and Labour196 � Resource Recovery Funding Board (RRFB)197 � GPI Atlantic198 (Genuine Progress Index) � Clean Nova Scotia199
In 1996 Nova Scotia adopted the CCME (Council of Canadian Ministers of the Environment) standard of assessing diversion by measuring disposal. To facilitate this goal, the province closed poorly managed “dumps”, created regional waste-resource management districts and regulated all remaining disposal sites to report quantities of material received. In fact, there are two sources of financial support for municipalities: (1) RRFB funding is based on total materials diverted (less process residue) and (2) dairy industry funding is based on actual program costs. As a result, the province’s Department of Environment and Labour has assembled comprehensive waste statistics for at least five years. In 2004, the province began the process of moving their data call effort to a web based system along the lines of the Ontario “municipal data call”.
195 Statistics Canada, Waste Management Industry Survey: Business and Government Sectors 2002, Catalogue no. 16F0023XIE, Table A.1, p.14 196 See http://www.gov.ns.ca/enla/emc/wasteman/ (accessed May 2005) 197 See http://www.rrfb.com (accessed May 2005) 198 See http://www.gpiatlantic.org/pdf/solidwaste/solidwaste.pdf (accessed May 2005) 199 See http://www.clean.ns.ca/ (accessed May 2005)

The Government of Canada Action Plan 2000 on Climate Change
NRCan / RNCan 129 Mar-2006
12.2 Demographics According to Statistics Canada WMIS, the population of Nova Scotia in 2002 was 934,392.200 This is the population figure that will be used in this report. However, in order to show the distribution of population throughout the province, Table 12.1 presents Statistics Canada estimates (with a slightly different total).201
Table 12.1: Nova Scotia 2002 Population Distribution by County202
Counties
Population
Annapolis Antigonish Cape Breton Colchester Cumberland Digby Guysborough Halifax Hants Inverness Kings Lunenburg Pictou Queens Richmond Shelburne Victoria Yarmouth
22,160 20,059
111,017 50,885 33,266 19,873 9,839
373,817 41,684 20,316 60,442 48,791 47,806 11,977 10,286 16,584 8,153
27,552
Total 934,507
As shown in Table 12.1, Halifax contains about 40 percent of the provincial population. The next largest jurisdiction is the Cape Breton Regional Municipality with over 100,000 people. Taken together these two municipalities account for over half of Nova Scotia’s population. Where urban and rural data are available therefore, it is assumed that Halifax and Cape Breton are urban (52 percent) and rest (48 percent) of the province rural. This arbitrary split is in close alignment to Statistics Canada data that suggest urban/rural is 55/45.203 The primary reason for making this distinction is that it could be argued that the waste material generated in an urban IC&I sector is different (e.g. has more office paper) than a rural IC&I sector.
200 Ibid., Table 2.2, p. 10 201 Personal communication with Amanda Elliott, Statistics Canada, May 31, 2005 202 See http://www12.statcan.ca/english/census01/products/standard/popdwell/Table-UR-D.cfm?T=1&SR=1&S=1&O=A&PR=12 (accessed May 2005) 203 See http://www.statcan.ca/english/census96/table15.htm (accessed May 2005)

The Government of Canada Action Plan 2000 on Climate Change
NRCan / RNCan 130 Mar-2006
12.3 Generation, Recycling and Disposal by Sector This chapter relies on WMIS 2002 for the baseline waste and recycling data. Any differences that the province may have with these numbers are reported on in this section. Table 12.2 therefore provides the general overview; however, materials recovered under provincial product stewardship are not included in the summary at this point (further discussion in Section 12.3.3). It should be noted that WMIS provides all disposal data, residential and total recycling data, and diversion rates for each sector. It is possible to use these data to estimate the missing figures, which are shaded in Table 12.2.
Table 12.2: Nova Scotia Solid Waste Flow by Sector in 2002204
Sector
Generation Disposal Recycling Diversion Rates
Residential IC&I CR&D
252,012 227,906
79,000
169,649 176,625
42,921
82,363 51,281 36,080
33% 22% 46%
Total tonnes Kilograms/capita
558,918 598
389,195 417
169,724 182
30%
For example, in the CR&D sector WMIS reports that 42,921 tonnes of waste were disposed of in 2002 and that the diversion rate for this sector was 46 percent. By using the formula mentioned in Section 4.5 [generation = disposal divided by (1 - diversion rate)] including a weighted allocation of tonnes not accounted for (as a result of the rounded diversion rates that WMIS provides), it is possible to estimate both generation and recycling amounts. As a check on the allocations, the WMIS based total for IC&I and CR&D diversion is 87,360 (which coincides closely with Table 12.2, re 51,281 + 36,080). These calculated figures are approximate. According to provincial officials,205 there may be two errors in the Statistics Canada numbers: (1) The overall waste generation rate for Nova Scotia appears to be 38 percent lower than the Canadian average (which is 971 kg per capita per year) – although Nova Scotia may recycle more per capita than other provinces it is unlikely that they generate so much less (see discussion in following section). (2) The most difficult waste material to measure in Nova Scotia is CR&D. The CR&D data in Table 12.2 are probably under-reported; in fact, some of the IC&I waste disposed is possibly CR&D waste (especially that material originating in Halifax but being hauled to neighbouring municipalities).
204 Statistics Canada, Waste Management Industry Survey: Business and Government Sectors 2002, Catalogue no. 16F0023XIE, Table A.1, p. 14. 205 Personal communication with Bob Kenney, NS Environment and Labour, May 31, 2005.

The Government of Canada Action Plan 2000 on Climate Change
NRCan / RNCan 131 Mar-2006
12.3.1 Generation Data The only local waste generation data available are from the Halifax Regional Municipality (HRM). According to staff there, in 2003 the HRM generated a total of 347,138 tonnes of solid waste material (includes estimates for private sector paper recycling, backyard composting and “drop-off” materials):206 This works out to 966 kg per capita per year, which is substantially higher than the provincial figure provided in Table 12.2. In fact, this figure is comparable to generation rates in SK, ON, QC and MB. Provincial officials indicate that the HRM comprises about half of the Nova Scotian economy and this would be reflected in the size of its IC&I and CR&D sectors. This might also suggest that the rest of the province generates the same amount of waste (all other things being equal). Therefore, under the assumption that Nova Scotia generates twice the amount of HRM waste, an alternative set of waste generation figures would be as follows: 249,170 tonnes residential, 298,806 tonnes IC&I, and 146,296 tonnes CR&D (notably much more CR&D waste than shown in Table 12.2). Further discussion of this issue is provided in Section 12.3.4.
12.3.2 Recycling Data The Nova Scotia Department of the Environment and Labour has conducted a comprehensive data call since 2000 when the dairy products stewardship agreement was reached. Their survey work has been paper based since then but has now been re-born as a web-based data call system for the 2004 numbers. Insofar as diversion activities are concerned, one major discrepancy occurs where CR&D waste is concerned. According to the figure calculated and presented in Table 12.2, Nova Scotia recycled 36,080 tonnes of CR&D waste in 2002. According to HRM data, 73,148 tonnes of CR&D waste were diverted from landfill in 2003.207 There are a number of possibilities:
� 2003 was a much busier year in the CR&D sector in the HRM than 2002 � Some CR&D waste was processed at a facility but not included in the Statistics
Canada survey � The definition of “diverted” is not consistently applied (e.g. is processed CR&D
waste that is used to make roads in a landfill diverted?) Another potential gap in the Statistics Canada data is that materials going directly from generators to a recycling facility are not captured in the survey. This is especially the case where office paper recycling programs are concerned as mentioned in the Ontario chapter. In Nova Scotia, there is a company called Minas Basin Pulp and Power that recycles a significant tonnage of paper. Provincial officials are attempting to gather that data. In fact, the HRM mass balance for 2003 and 2004 includes an estimate of 43,000 annual tonnes of fibre recycled at a private facility, as referred to in Section 12.3.1. 206 Mass balance for 2003 and 2004 provided by Jim Bauld, Halifax Regional Municipality, May 2005 207 Ibid.

The Government of Canada Action Plan 2000 on Climate Change
NRCan / RNCan 132 Mar-2006
Therefore, it is probable that the IC&I recycling numbers (and thus the generation numbers) are understated in Table 12.2.
12.3.3 Product Stewardship Data There are four product stewardship programs in Nova Scotia to report on: the deposit/refund system for beverage containers, the Brewers Association of Canada program, milk package recycling, and the tire return system. Table 12.3 summarizes the materials managed via product stewardship. It should be noted that the dairy packages that have been recycled (1,092 tonnes208) are included in Table 12.2 since they are processed and reported as municipal tonnage. Table 12.3: Nova Scotia Beverage Packaging Recovery Summary (2002)209
Container Type
Units Returned
Kg per unit Tonnes
SOFT DRINK & JUICE Aluminum cans210 Glass PET HDPE Other plastics Steel cans Gable top Tetra pak Mini-sips
111,082,108 17,207,100 69,517,443 4,153,576 3,659,130 3,082,449 4,515,473 6,953,325
1,150
0.015 0.227 0.041 0.036 0.041 0.151 0.043 0.024 0.229
1,666 3,906 2,850
150 150 465 194 167
0
LIQUOR CONTAINERS Glass >500 ml PET Other
9,879,642 2,831,931
327,719
0.570 0.041 0.023
5,631 116
8
BEER Refillable glass bottles211
111,953,796 0.269 1,962
OTHER pounds Corrugated cardboard Newsprint
525,712 369,039
238 167
TOTAL (some rounding) 17,671
According to a recent tire recycling study funded by Action Plan 2000 on Climate Change (under the Enhanced Recycling Program), the quantity of tires recycled in Nova Scotia in 2003/04 was 7,478 tonnes.212 This figure will be used for 2002 as well. The
208 Personal communication with Bob Kenney, NSDEL, Feb-2005 209 Resource Recovery Funding Board, personal communication with Dale Lyons, Jan-2005 210 Includes aluminum beer cans as they are recovered via the RRFB depot system, not via Brewers. 211 Brewers Assoc. of Canada 2003 Annual Stat Bulletin, www.brewers.ca 212 Dr. Alexandra Pehlken and Dr. Elhachmi Essadiqi, 2005, Scrap Tire Recycling in Canada, CANMET, Natural Resources Canada, p. 35

The Government of Canada Action Plan 2000 on Climate Change
NRCan / RNCan 133 Mar-2006
RRFB indicates that 900,000 tires are collected annually for recycling213 and if one tire weighs 8.2 kilograms that would be 7,380 tonnes (or virtually the same as the Enhanced Recycling Program study). The total amount of materials recovered via product stewardship (as defined in Section 4.4) therefore is estimated to be 25,149 tonnes per year.
12.3.4 Disposal Data In 1989, each resident discarded 747 kg of waste per year.214 According to Statistics Canada, recent comparable figure is 417 kg/cap in 2002 – this refers to solid waste disposed from all three sectors. Thus, it can be calculated that Nova Scotians discarded 44 percent less waste in 2002 than in 1989. Based on discussions with provincial staff, this report assumes that the Statistics Canada figure for CR&D waste disposed of is understated. According to the HRM, 73,148 tonnes of CR&D waste were generated and diverted or reused at local private sites in 2003.215 None of this tonnage is reported as disposed (although some CR&D waste may have entered the “refuse” stream). According to the Nova Scotia Department of Finance,216 the value of all building permits was $879,670,000 in the province of which $469,205,000 (or 53.3 percent) was in the HRM. Using these permit values as a proxy for the generation of CR&D waste across the province it can be calculated that some 137,135 tonnes of CR&D waste may have been generated in 2002.217 It is however difficult to estimate the percentage of this that was disposed of. Since very few CR&D programs divert more than 60 percent, it is assumed that given its aggressive diversion regulations (e.g. HRM has a 60 percent CR&D diversion by-law) Nova Scotia disposed of 54,854 tonnes (40 percent of 137,135 tonnes), which is 11,933 tonnes higher than the Statistics Canada figure. As a result, the disposal tonnes presented in Table 12.2 are revised as follows. Total tonnage disposed remains unchanged.
213 See http://www.rrfb.com/pages/secondary%20pages/tireprogram.html (access June 2005) 214 Nova Scotia Environment and Labour, Status Report 2004 of Solid waste-resource Management in Nova Scotia, www.gov.ns.ca/enla/emc/wasteman, p. 11 215 See footnote #12 216 See http://www.gov.ns.ca/finance/publish/conact/ca0302.pdf (accessed June 2005) 217 Calculated as follows: 73,148 tonnes divided by 53.34% = 137,135 tonnes.

The Government of Canada Action Plan 2000 on Climate Change
NRCan / RNCan 134 Mar-2006
Table 12.4: Revised Nova Scotia Waste Disposal by Sector (2002)
Sector
Disposal Compared to Table 12.2
Residential IC&I CR&D
169,649 164,692
54,854
No change -11,933 t +11,933 t
Total tonnes
389,195 No change
12.4 Waste Composition For the purposes of estimating the quantity of materials disposed of in Nova Scotia, the data presented in Table 12.4 are used in conjunction with local characterization data. Section 12.4 is divided into three sub-sections as per the three sectors referenced throughout this study: residential, industrial, commercial and institutional (IC&I), and construction, renovation and demolition (CR&D).
12.4.1 Residential Waste Characterization From Table 12.2 it is assumed that 169,649 tonnes of residential solid waste were disposed in Nova Scotia in 2002. The data used to characterize this material stream are from HRM218 (for an urban picture) and Lunenburg219 (for the rural areas). The HRM study provides a picture of a program that has a mature organic waste diversion program in place. Consequently it is difficult to use this data in another jurisdiction particularly where organic waste has not been banned from disposal, as is the case in Nova Scotia. One anomaly in Nova Scotia is Cape Breton Regional Municipality, which hosts the only incinerator in the province that is also slated for closure in 2005. As a result, CBRM does not have an organic waste diversion program. Therefore, to compensate, the total amount of organic waste diverted in the HRM (calculated to be 109 kg per capita per year) is added to the CBRM and this effectively adjusts the organic content of the urban tonnage upward. In the Lunenburg study, it is apparent that during the February 2000 audit an extraordinary amount of bio-hazardous waste was counted. In fact, Photo 7 in the report shows the removal of biomedical waste from the audit.220 The remaining amount is comprised of diapers, sanitary products and first aid wastes: It is surmised that diapers are the primary constituents of this group. Included as is, this category accounts for 12.6 percent of the residential waste (disposed) stream. In the HRM study (with its long
218 SNC-Lavalin, 2004, Waste Characterization Study, Halifax Regional Municipality 219 SNC-Lavalin, 2001, A Study to Determine the Composition of Residual Solid Waste & Recyclables in the Municipality of the District of Lunenburg, Nova Scotia, Resource Recovery Fund Board and the Environment and Plastics Industry Council 220 SNC-Lavalin , 2001, Appendix D

The Government of Canada Action Plan 2000 on Climate Change
NRCan / RNCan 135 Mar-2006
established organics diversion program), bio-hazardous wastes accounted for 3.23 percent of the residential waste stream; hence the concern. Therefore, an adjustment to the Lunenburg data is made in order to lower the estimated amount of bio-hazardous waste in the residential stream. This is done somewhat arbitrarily by only using the data from the spring 2001 audit. As a result, the percentage of bio-hazardous waste in the residential stream falls to 5.1 percent, which is closer to the HRM estimate. Table 12.5 summarizes the urban and rural tonnes of residential waste disposed of in Nova Scotia in 2002. Figure 12.1 shows the relative amounts.
Table 12.5: Estimated Composition Nova Scotia Residential Waste Disposed (2002)
Material
Urban
Rural
Total
tonnes Paper Glass Ferrous Aluminum Metal bearing Plastics Multi-material Textiles Organics Special care Other Renovation
18,476 1,241 3,618
825 184
12,596 2,800 9,450
21,571 2,620
10,588 4,047
17,821 2,340 2,979 1,209
452 15,310 3,806 9,187
19,155 4,157 5,218
0.00
36,297 3,581 6,597 2,034
636 27,906 6,606
18,637 40,726 6,777
15,806 4,047
Total
88,016
81,633
169,649
Figure 12.1: Estimated Composition of Nova Scotia Residential Waste
Disposed (2002)
Paper21.4%
Plastics16.4%Multi-material
3.9%Textiles11.0%
Organics24.0%
Special care4.0%
Other9.3%
Renovation2.4%
Metal bearing0.4%
Aluminum1.2%
Ferrous3.9%
Glass2.1%

The Government of Canada Action Plan 2000 on Climate Change
NRCan / RNCan 136 Mar-2006
12.4.2 Industrial, Commercial and Institutional (IC&I) Waste Characterization It is estimated that 164,692 tonnes of IC&I waste were disposed in Nova Scotia in 2002 (see Table 12.4).
Table 12.6: Projected Tonnage for IC&I Waste Disposed in Nova Scotia (2002)
Material
Urban
Rural
Total
tonnes Paper Glass Ferrous Aluminum Metal bearing Plastics Multi-material Textiles Organics Special care Other Renovation
44,296 2,237 4,257 1,293 1,125
20,677 1,000 4,594
17,928 2,447 8,505 8,986
19,982 849
1,761 340 629
9,387 317
1,231 6,142
738 3,310 2,662
64,278 3,085 6,019 1,633 1,755
30,064 1,317 5,825
24,070 3,185
11,815 11,647
Total
117,345 47,347 164,692
The data in Table 12.6 are graphically presented in Figure 12.2 where the significant presence of paper and plastics materials is made apparent. Notably, as a result of the disposal ban on organic waste, its relative presence is estimated to be much smaller than comparable data from other provinces.
Figure 12.2: Estimated Composition of Nova Scotia Total IC&I Waste Disposed (2002)
Paper 39.0%
Plastics 18.3%Organics14.6%
Renovation 7.1%
Special care 1.9%
Other 7.2%
Textiles3.5%
Multi-material0.8%
Ferrous 3.7%
Glass 1.9%
Aluminum 1.0%
Metal bearing 1.1%
Paper 39.0%
Plastics 18.3%Organics14.6%
Renovation 7.1%
Special care 1.9%
Other 7.2%
Textiles3.5%
Multi-material0.8%
Ferrous 3.7%
Glass 1.9%
Aluminum 1.0%
Metal bearing 1.1%

The Government of Canada Action Plan 2000 on Climate Change
NRCan / RNCan 137 Mar-2006
12.4.3 Construction, Renovation and Demolition (CR&D) Waste Characterization No CR&D characterization data were found in Nova Scotia. Therefore, the “standard” figures used throughout this report will be applied once again. Since CR&D waste is aggressively diverted in Nova Scotia, it highly likely that its composition is significantly different than the standard used in this report. In a high diversion environment, CR&D waste materials that can be used as an aggregate substitute would not be disposed of. All metal scrap would similarly be recovered for recycling. Scrap wood would be chipped and used as mulch. According to the adjusted disposal data in Table 12.4, it is estimated that 54,854 tonnes of CR&D waste were disposed of in 2002. Table 12.7 shows the estimated percentages by major material group and projected annual tonnage.
Table 12.7: Projected Tonnage for CR&D Waste Disposed in Nova Scotia (2002)
Material
Total Tonnes
Total Percent
Concrete Asphalt Wood Drywall Ferrous Nonferrous Paper product Other
8,936 4,205
16,944 6,100
459 1,538
642 16,031
16% 8%
31% 11%
1% 3% 1%
29%
Totals 54,854
100%
As in the other provinces it is wood that appears to be produced most plentifully followed by “other” and concrete. However, as discussed, local Nova Scotia CR&D characterization data would tell a different story.

The Government of Canada Action Plan 2000 on Climate Change
NRCan / RNCan 138 Mar-2006
12.5 Nova Scotia Summary Table 12.8 combines the tonnage for all materials from all three sectors, residential, IC&I and CR&D and presents the totals. Of note, the Nova Scotia disposal ban has resulted in significantly less organic waste being disposed of (the average organic content in the other provinces is 28.5 percent).
Table 12.8: Summary of Nova Scotia Waste Materials Disposed (2002)
Material
Total Tonnes Overall Percent
Paper Organics Plastics Other Textiles Wood Renovation Ferrous Special care Concrete Multi-material Glass Drywall Nonferrous Asphalt Metal bearing
101,217 64,796 57,969 43,651 24,462 16,944 15,694 13,075 9,962 8,936 7,923 6,666 6,100 5,204 4,205 2,391
26.0% 16.6% 14.9% 11.2%
6.3% 4.4% 4.0% 3.4% 2.6% 2.3% 2.0% 1.7% 1.6% 1.3% 1.1% 0.6%
Total
389,195
100.0%
The estimated amount of metal and metal bearing material disposed of in Nova Scotia annually is 20,671 tonnes. Other mineral based materials (drywall, concrete, asphalt and glass) account for a further 25,905 tonnes. Plastics are discarded at an estimated rate of 57,969 tonnes per year. Not all of these materials can be recycled but the potential to improve on current levels is evident. Figure 12.3 provides a graphic illustration of the type of materials that are currently (i.e. 2002) being discarded in Nova Scotia. The reader is advised that the numbers are rough and are meant to be indicative rather than precise. The accuracy and reliability of waste characterization data and material projections should always be held in question.

NRCan / RNCan 139 Mar-2006
Figure 12.3: Nova Scotia Solid Waste Flow in 2002
Population934,392
Total Generation584,068 tonnes
Economy$25 billion (GDP)
Residential264,587 t.
IC&I*228,548 t.
CR&D**90,934 t.
Rec.Disposal169,649 t.
Disposal164,692 t.
Disposal54,854 t.
Rec.
36,080 t.82,363 t. 51,281 t.
Rec. = DiversionRate = 33% overall
ProductStewardship
Programs
= 389,195 t.(total disposal)
25,149 t.
Wood
Other
Concrete
DrywallAsphaltNonferrousPaperFerrous
(*industrial, commercial & institutional;**construction, renovation & demolition)
Paper
Plastics
Organics
Other
RenovationFerrousTextilesSpecial careGlassMetal bearingAluminumMulti-material
64,278
30,064
24,070
11,815
11,6476,0195,8253,1853,0851,7551,6331,317
Paper
Organics
Plastics
Textiles
Other
Special careFerrous
Multi-material
Renovation
Glass
AluminumMetal bearing
40,726
36,297
27,906
18,637
15,806
6,7776,597
6,606
4,047
3,581
2,034636
Recycling Rec.
459642
1,5384,2056,100
8,936
16,031
16,944

NRCan / RNCan 140 Mar-2006

The Government of Canada Action Plan 2000 on Climate Change
NRCan / RNCan 141 Mar-2006
Chapter 13 Prince Edward Island 13.1 INTRODUCTION .................................................................................................... 142 13.2 DEMOGRAPHICS ................................................................................................... 142 13.3 GENERATION, DIVERSION AND DISPOSAL BY SECTOR ......................................... 143 13.3.1 Solid Waste and Recyclables Data ......................................................... 143 13.3.2 Product Stewardship Data...................................................................... 146 13.4 WASTE COMPOSITION .......................................................................................... 147
13.4.1 Residential Waste Characterization ....................................................... 147 13.4.2 Industrial, Commercial and Institutional (IC&I) Waste
Characterization ..................................................................................... 149 13.4.3 Construction, Renovation and Demolition (CR&D) Waste
Characterization ..................................................................................... 150 13.5 PRINCE EDWARD ISLAND SUMMARY ................................................................... 151

The Government of Canada Action Plan 2000 on Climate Change
NRCan / RNCan 142 Mar-2006
13.1 Introduction The primary regulatory responsibility for solid waste on Prince Edward Island (PEI) emanates from that province’s Department of the Environment and Energy (or DEE, formerly known as the Department of Fisheries, Aquaculture and Environment). In order to optimize waste diversion activities, a province wide program known as “Waste Watch” was launched in 1994. It was eventually deemed necessary to separate the regulatory function of the provincial government from the day-to-day business of managing solid waste and recyclables. Thus, in 1999 a Crown Corporation called the Island Waste Management Corporation (IWMC) was established to administer and provide related services to the residential and commercial sectors throughout PEI. DEE staff provided the 2002 data discussed in this chapter – their records are based on reports submitted by the IWMC. Since the residential and IC&I waste streams are managed as one material stream, the data is mostly all inclusive as well. In this regard the Statistics Canada Waste Management Industry Survey for 2002 is not illuminating because of their confidentiality proviso that prevents them from publishing data with which specific waste management agents can be identified.221 In order to provide a waste and recycling picture of PEI that is symmetrical with the rest of Canada, a number of assumptions are made to bridge certain gaps and to develop some rough projections for what is potentially available in the disposal stream. With respect to “disposal” and consistency, the Statistics Canada view that disposal includes landfill and incineration is maintained throughout this report. This is an important note given the fact that about half of all residential and commercial waste managed in its final stage is processed at the PEI Energy Systems facility (incineration with recovery of energy). 13.2 Demographics Of the ten provinces PEI has the smallest population. According to WMIS, there were 136,998 people living in PEI in 2002 – this figure probably does not take into account the large increase in seasonal population that occurs in the summer. There are three counties in PEI with total population distributed as shown in Table 13.1. The capital city is Charlottetown with 32,245 or 26 percent of the provincial population. Although Statistics Canada does identify the urban and rural parts of the province, for the purposes of waste characterization it is assumed that the waste generated in PEI does not have urban versus rural distinctions.
221 Whereas PEI may not be concerned about this issue, the publication of their data in WMIS would allow readers to deduct waste and recycling data for the Canadian north and there may be private sector players who would rather keep their data confidential.

The Government of Canada Action Plan 2000 on Climate Change
NRCan / RNCan 143 Mar-2006
Table 13.1: PEI Population Distribution by County 222
Counties
Population
Kings Prince Queens
19,245 45,048
72, 057
Total 136,998
13.3 Generation, Diversion and Disposal by Sector
13.3.1 Solid Waste and Recyclables Data According to PEI officials, the total amount of residential and IC&I waste generated in the province in 2002 is 118,688 tonnes. However, this figure includes materials that other provinces do not track such as car hulks, lead acid batteries, scrap metal stockpiles, and refillable beverage bottles. As mentioned in the previous section, this chapter attempts to distil the PEI number into its constituent parts using assumptions that are clearly identified and calculations that are transparent. In the WMIS report, Statistics Canada indicates that the total overall rate of diversion in PEI in 2002 is 28 percent.223 Similar diversion rates are also provided for each sector. With the data provided by PEI regarding overall disposal, it is possible to estimate the split between the different sectors and then calculate generation sub-totals using the formula presented in Section 4.5 (i.e. tonnes disposed divided by 1 minus the rate of diversion equals tonnes generated). The key disposal data for PEI in 2002 are presented in Table 13.2 (in which there is some rounding). The two landfills are Wellington Centre and Sleepy Hollow, the latter having closed in 2003. The EFW (energy-from-waste) tonnage is what was received at the PEI Energy Systems facility in 2002. Although the CR&D landfill facility is privately owned and operated, they report their tonnage to DEE on a regular basis (including tonnes recycled): Their figure is for 2003 but it is assumed satisfactory as an estimate for 2002. The process residue is the result of recycling and composting operations and is calculated from data provided by DEE. Table 13.2 summarizes the disposal data provided by DEE for 2002.
222 See http://www12.statcan.ca/english/census01/products/standard/popdwell/Table-UR-D.cfm?T=1&SR=1&S=1&O=A&PR=12 (accessed May 2005) 223 Statistics Canada, Waste Management Industry Survey: Business and Government Sectors 2002, Catalogue no. 16F0023XIE, Table A.1, p. 14.

The Government of Canada Action Plan 2000 on Climate Change
NRCan / RNCan 144 Mar-2006
Table 13.2: PEI Solid Waste Disposal (2002)224
Facility/Source
Disposal
Landfill 1 Landfill 2 EFW plant CR&D landfill Process residue
12,159 14,102 29,325 11,426 2,043
Total tonnes Kilograms/capita
69,054 504
To calculate solid waste generation (and compare that with the DEE diversion data), two steps are taken: 1. Estimate the amount of materials disposed from each sector
� Assume 11,426 t. is all of the CR&D waste disposed of in 2002 � Since the total disposed is 69,064 t., the remainder is residential and IC&I (55,585
t.) � Using NB and NS data, the average split between these two sectors is estimated to
be 54% residential (31,119 t.) and 46% IC&I (26,509 t.) 2. Apply the Section 4.5 formula to the sector disposal tonnage to calculate generation
for each sector based on the given diversion rates:225 � Residential generation = 31,119 t. / (1- 39%) = 51,015 t. � IC&I generation = 26,509 t. / (1 – 21%) = 33,555 t. � CR&D generation = 11,426 t. / (1 – 4%) = 11,902 t.
Since the WMIS report does not provide data for PEI and the North (Yukon, Northwest Territories and Nunavut), it is possible to deduct the northern values on the basis of PEI estimates. As a check on this approach, reference to the given diversion rates for each sector in each region is made. Based on the estimated PEI tonnage (previous paragraph), the residential diversion rate for the North is 11.3 percent much lower than the WMIS given figure of 16 percent. To close this gap however slightly, the PEI residential diversion rate is decreased to 38.5 percent (which still rounds to 39 percent) and, as a result, the North residential diversion rate increases to 12.5 percent (still short of 16 percent but closer than before). Table 13.3 provides the estimated flow of materials by sector based on the adjustments identified above. The shaded diversion rates are calculated (see step 2 above for the WMIS rates).
224 Personal communication with Garth Simmons, DEE, March 2005 225 WMIS 2002, Table A.7, p. 17

The Government of Canada Action Plan 2000 on Climate Change
NRCan / RNCan 145 Mar-2006
Table 13.3: Estimated PEI Solid Waste Flow by Sector (2002)
Sector
Generation Disposal Recycling Diversion Rate
Residential IC&I CR&D
50,600 33,907 11,926
31,119 26,509 11,426
19,481 7,398
500
38.5% 21.8%
4.2%
Total tonnes 96,433 69,054 27,379 28.4%226
How do the estimated recycling amounts in Table 13.3 compare with the diversion data provided by DEE? See Table 13.4 and accompanying text box for that discussion.
Table 13.4: PEI Materials Diverted in 2002227
Material
Processed Residue Diverted
Curbside recycling Curbside organics Agricultural film White goods HHW CR&D material
8,490228 14,535
731 160
89 268
215 1,828
8,275 12,708
731 160
89 268
Total Diversion Scrap metal�
24,273
2,043 22,230 5,149
Revised Total 27,379
� The gap between the revised estimate (27,379 t.) and what is
indicated in Table 13.3 (22,230 t.) is 5,149 tonnes. For the purposes of this report, it is assumed that this tonnage is scrap metal, and Table 13.4 is revised accordingly. This is not an unreasonable assumption given that DEE reports a scrap metal stockpile of 10,300 tonnes for 2002 accumulated over more than one year (and which is otherwise not accounted for in this summary).
One value that is quite different in Tables 13.3 and 13.4 is the amount of CR&D material that was diverted in 2002. The figure from DEE is 268 tonnes, which is really only an
226 The provincial diversion rate increases to 31% with the inclusion of product stewardship materials (see Figure 13.3 at chapter end). 227 The materials that are excluded at this point are those materials managed via product stewardship programs and discussed in the next section as well as car hulks and lead acid batteries covered in Chapter 17. 228 Non-refillable glass bottles diverted (443 t + 670 t), which DEE monitors separately as “generated” and “diverted”, are included with “curbside recycling”. It is assumed that all the recyclables are processed together.
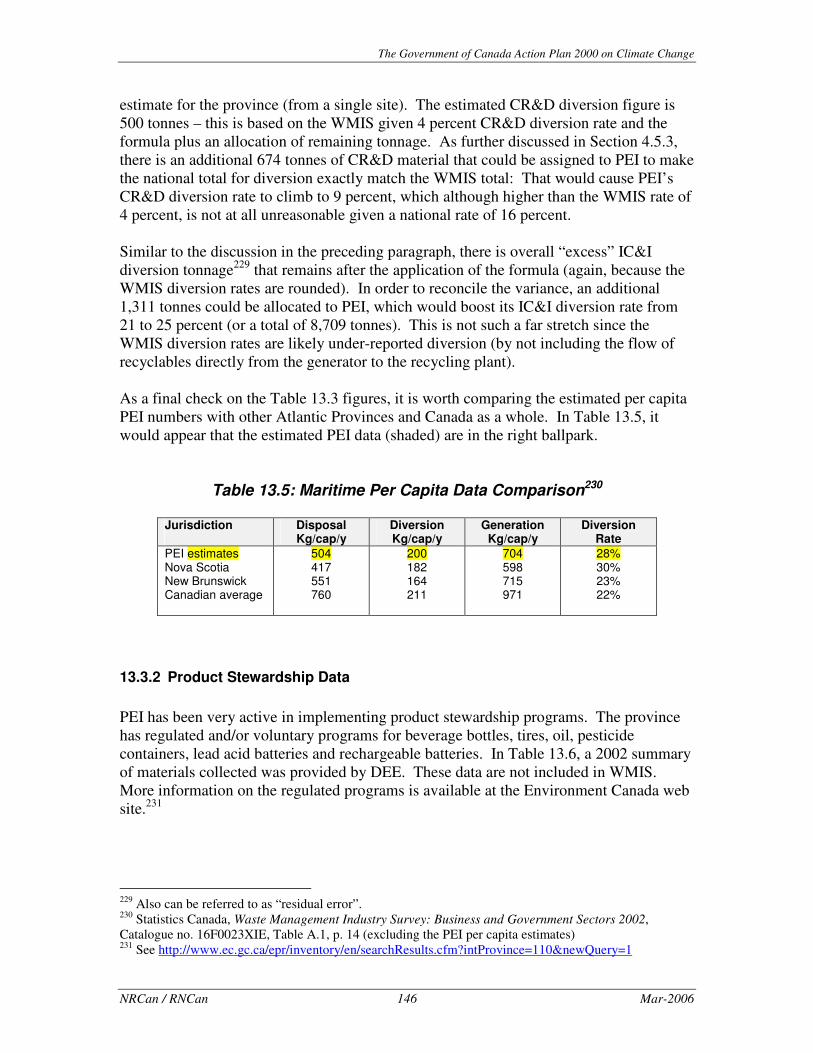
The Government of Canada Action Plan 2000 on Climate Change
NRCan / RNCan 146 Mar-2006
estimate for the province (from a single site). The estimated CR&D diversion figure is 500 tonnes – this is based on the WMIS given 4 percent CR&D diversion rate and the formula plus an allocation of remaining tonnage. As further discussed in Section 4.5.3, there is an additional 674 tonnes of CR&D material that could be assigned to PEI to make the national total for diversion exactly match the WMIS total: That would cause PEI’s CR&D diversion rate to climb to 9 percent, which although higher than the WMIS rate of 4 percent, is not at all unreasonable given a national rate of 16 percent. Similar to the discussion in the preceding paragraph, there is overall “excess” IC&I diversion tonnage229 that remains after the application of the formula (again, because the WMIS diversion rates are rounded). In order to reconcile the variance, an additional 1,311 tonnes could be allocated to PEI, which would boost its IC&I diversion rate from 21 to 25 percent (or a total of 8,709 tonnes). This is not such a far stretch since the WMIS diversion rates are likely under-reported diversion (by not including the flow of recyclables directly from the generator to the recycling plant). As a final check on the Table 13.3 figures, it is worth comparing the estimated per capita PEI numbers with other Atlantic Provinces and Canada as a whole. In Table 13.5, it would appear that the estimated PEI data (shaded) are in the right ballpark.
Table 13.5: Maritime Per Capita Data Comparison230
Jurisdiction
Disposal Kg/cap/y
Diversion Kg/cap/y
Generation Kg/cap/y
Diversion Rate
PEI estimates Nova Scotia New Brunswick Canadian average
504 417 551 760
200 182 164 211
704 598 715 971
28% 30% 23% 22%
13.3.2 Product Stewardship Data PEI has been very active in implementing product stewardship programs. The province has regulated and/or voluntary programs for beverage bottles, tires, oil, pesticide containers, lead acid batteries and rechargeable batteries. In Table 13.6, a 2002 summary of materials collected was provided by DEE. These data are not included in WMIS. More information on the regulated programs is available at the Environment Canada web site.231
229 Also can be referred to as “residual error”. 230 Statistics Canada, Waste Management Industry Survey: Business and Government Sectors 2002, Catalogue no. 16F0023XIE, Table A.1, p. 14 (excluding the PEI per capita estimates) 231 See http://www.ec.gc.ca/epr/inventory/en/searchResults.cfm?intProvince=110&newQuery=1

The Government of Canada Action Plan 2000 on Climate Change
NRCan / RNCan 147 Mar-2006
Table 13.6: PEI Product Stewardship in 2002232
Material
Tonnes
Refillable soft drink bottles Refillable beer bottles Tires Used oil Lead batteries Rechargeable batteries Pesticide containers
11,775 6,632 1,735
455 242
5 18
Total 20,862
Revised number (See note)
3,682
Note: To be consistent with the approach adopted in this report, it is necessary to adjust the refillable glass bottle tonnes as reported by DEE. Refillable bottles are not defined as “waste” by Statistics Canada unless they are managed as waste. The refillable bottle program in PEI boasts a 98% return rate. According to DEE data, there were 18,783233 tonnes of refillable bottles used in 2002 and only 2% of these (376 tonnes) were not recovered, so presumably they were discarded into the waste stream. Of the captured bottles, it is assumed that each bottle makes on average fifteen round trips before reaching the end of its life cycle: At that point, the bottle is recycled. The actual quantity of bottles recycled in this way is therefore about 1,227 tonnes per year.234 The total for Table 13.6 is therefore revised to 3,682 tonnes.
13.4 Waste Composition The tonnage of material disposed in PEI by sector is presented in Table 13.3. The reader is again advised that the sector-by-sector splits are estimates only and as such should be used with caution.
13.4.1 Residential Waste Characterization The best Maritime waste characterization data available is from Nova Scotia. Since PEI also has an aggressive waste diversion program including organic matter, blended data from HRM and Lunenburg, Nova Scotia are considered appropriate. Figure 13.1 and Table 13.7 present the data.
232 Personal communication with Garth Simmons, DEE, March 2005 233 Generation equals 12,016 tonnes of soft drink glass bottles and 6,767 tonnes of beer bottles. The quantity of beer bottles is very close to the Brewers Association figure of 6,423 tonnes, which is based on 23,848,753 units consumed, 97.9% return rate and 0.26932 kg/bottle (www.brewers.ca). 234 That is, (11,775 tonnes of soft drink bottles + 6,632 tonnes of beer bottles) divided by 15 trips = 1,227 t.

The Government of Canada Action Plan 2000 on Climate Change
NRCan / RNCan 148 Mar-2006
Figure 13.1: Estimated Composition of Total PEI Residential Waste
Disposed (2002)
Table 13.7: Estimated Composition PEI Residential Waste
Disposed (2002)
Material
Tonnes
Paper Organics Plastics Textiles Other Ferrous Special care Multi-material Renovation Glass Metal bearing Aluminum
7,200 5,447 5,346 3,693 3,436 1,339 1,246 1,244 1,038
926 110
96
Total
31,119
From Table 13.7 and Figure 13.1, it appears that paper, organics and plastics are the largest components of the PEI residential waste stream, based on the application of the Nova Scotia characterization data. Textiles also seem to occur in large quantity. The rise in percentage for materials that are traditionally not targeted is not surprising when large amounts of organic and other material are being recovered. The aluminum percentage has been adjusted down from the Nova Scotia number because PEI has banned the sale of canned beverages in favour of refillable bottles. Since it is likely that some aluminum cans get into the province regardless, 25 percent of the Nova
Paper 23.1%
Glass 3.0%
Plastics17.2%Multi-material
4.0%
Textiles 11.9%
Organics 17.5%
Special care 4.0%
Other 11.0%
Renovation3.3%
Aluminum 0.3%
Metal bearing 0.4%
Ferrous 4.3%
Paper 23.1%
Glass 3.0%
Plastics17.2%Multi-material
4.0%
Textiles 11.9%
Organics 17.5%
Special care 4.0%
Other 11.0%
Renovation3.3%
Aluminum 0.3%
Metal bearing 0.4%
Ferrous 4.3%

The Government of Canada Action Plan 2000 on Climate Change
NRCan / RNCan 149 Mar-2006
Scotia number is retained as an estimate for this material (and there will be other items made of aluminum as well).
13.4.2 Industrial, Commercial and Institutional (IC&I) Waste Characterization Although the IWMC manages both the residential and IC&I waste streams, it is necessary to split these fractions into two parts so that the relevant characterization data can be applied. The genesis of these estimates is discussed in Section 13.3.2. The IC&I waste composition data are from the Halifax Regional Municipality (HRM) with the apartment fraction subtracted from the total, because HRM includes apartments with IC&I and because, it is assumed, PEI does not have as much multi-family housing. As a result, the percents shown in Figure 13.2 are slightly different than those shown in Figure 12.2 (the Nova Scotia chapter). It not known how much organic matter is recovered from the IC&I sector in PEI – if this is not a prevalent activity, the estimates for PEI’s non-residential organics are too low. In other words, the HRM data reflects the fact that organic matter is diverted from their IC&I sector so the amount still available in the waste stream is less than expected (see Table 13.8 and Figure 13.2).
Table 13.8: Projected Tonnage for IC&I Waste Disposed in PEI (2002)
Material Tonnes
Paper Plastics Organics Other Renovation Ferrous Textiles Glass Special care Metal bearing Aluminum Multi-material
11,187 5,255 3,439 1,853 1,490
986 689 475 413 352 190 177
Total
26,509

The Government of Canada Action Plan 2000 on Climate Change
NRCan / RNCan 150 Mar-2006
Figure 13.2: Estimated Composition of PEI Total IC&I Waste Disposed (2002)
The prominence of paper in the IC&I waste stream is not surprising and, further, is consistent with the data from across the country. Plastics appear to be the second largest component of the IC&I waste stream but also may be overstated. The low amount of metallic material being disposed is relatively low, as expected, given its recyclability and high market value.
13.4.3 Construction, Renovation and Demolition (CR&D) Waste Characterization The standard approach has been taken for estimating the characterization of the CR&D waste stream in PEI. See Section 4.3 for a detailed overview of the approach taken. Suffice to say, the CR&D waste stream is incredibly variable and therefore the numbers presented in Table 13.9 should be considered as very approximate. Local PEI characterization would likely paint a much different picture.
Table 13.9: Projected Tonnage for CR&D Waste Disposed in PEI (2002)
Material
Total Tonnes
Total Percent
Concrete Asphalt Wood Drywall Ferrous Nonferrous Paper product Other
1,885 887
3,509 1,259
94 314 135
3,343
16% 8%
31% 11%
1% 3% 1%
29%
Totals 11,426
100%
Paper 42.2%
Plastics 19.8%Organics13.0%
Special care 1.6%
Other 7.0%
Renovation 5.6%
Textiles2.6%
Multi-material 0.7%
Aluminum 0.7%
Metal bearing 1.3%
Ferrous 3.7%
Glass1.8%
Paper 42.2%
Plastics 19.8%Organics13.0%
Special care 1.6%
Other 7.0%
Renovation 5.6%
Textiles2.6%
Multi-material 0.7%
Aluminum 0.7%
Metal bearing 1.3%
Ferrous 3.7%
Glass1.8%

The Government of Canada Action Plan 2000 on Climate Change
NRCan / RNCan 151 Mar-2006
13.5 Prince Edward Island Summary Table 13.10 summarizes each material by sector (Tables 13.7, 13.8 and 13.9) and ranks them from largest to smallest. The four big items are paper, plastics, organics and other accounting for slightly more than two thirds of everything. From the metal perspective, there are ferrous, nonferrous, and metal-bearing items amounting to 3,481 tonnes per year, which is less than the estimated amount of scrap metal recovered each year (recall Table 13.4). Consideration of mineral based materials would include glass, drywall, asphalt, and concrete with these materials accounting for another 5,432 tonnes per year. While many grades of paper include various fillers and coatings that are mineral based (up to 50 percent by weight in some cases), it is believed that these materials become process residue when the paper is recycled.
Table 13.10: Summary of PEI Waste Materials Disposed (2002
Material
Total Tonnes Overall Percent
Paper Plastics Organics Other Textiles Wood Renovation Ferrous Concrete Special care Multi-material Glass Drywall Asphalt Nonferrous Metal bearing
18,523 10,601 8,886 8,632 4,382 3,509 2,528 2,419 1,885 1,659 1,421 1,401 1,259
887 600 462
26.8% 15.4% 12.9% 12.5%
6.3% 5.1% 3.7% 3.5% 2.7% 2.4% 2.1% 2.0% 1.8% 1.3% 0.9% 0.7%
Total
69,054
100.0%
In Figure 13.3, a schematic showing the flow and characterization of materials disposed in PEI in 2002 is provided. Note that the estimated product stewardship tonnage (3,682 tonnes) is added to the residential and IC&I generation figures under an assumed 50/50 split. This means that the generation numbers for these two sectors do not match the ones in Table 13.3.

NRCan / RNCan 152 Mar-2006
Figure 13.3: Prince Edward Island Solid Waste Flow in 2002
Population136,998
Total Generation100,115 tonnes
Economy$3.4 billion (GDP)
Residential52,441 t.
IC&I*35,748 t.
CR&D**11,926 t.
RecyclingDisposal31,119 t.
Disposal26,582 t.
Disposal11,426 t.
Rec.
500 t. Rec.19,481 t. 7,398 t.
Rec. = DiversionRate = 31% overall
ProductStewardship
Programs
= 69,054 t.(total disposal)
3,682 t.
Wood
Other
Concrete
DrywallAsphaltNonferrousPaperFerrous
(*industrial, commercial & institutional;**construction, renovation & demolition)
Paper
Plastics
Organics
Other
RenovationFerrousTextilesSpecial careGlassMetal bearingAluminumMulti-material
paper
organics
plastics
textiles
other
ferrous
special caremulti-material
renovationglassmetal bearingaluminum
7,200
5,447
5,346
3,693
3,436
1,339
1,246
1,244
1,038926110
96
11,187
5,255
3,439
1,853
1,490986689475413352190177
3,509
3,343
1,885
1,25988731413594

NRCan / RNCan 153 Mar-2006
Chapter 14 Newfoundland and Labrador 14.1 INTRODUCTION .................................................................................................... 154 14.2 DEMOGRAPHICS ................................................................................................... 154 14.3 GENERATION, RECYCLING AND DISPOSAL ........................................................... 155 14.3.1 Actual and Projected Data by Sector...................................................... 155 14.3.2 Product Stewardship Data...................................................................... 156 14.4 WASTE COMPOSITION .......................................................................................... 157
14.4.1 Residential Waste Characterization ....................................................... 157 14.4.4 Industrial, Commercial and Institutional (IC&I) Waste
Characterization ..................................................................................... 159 14.4.3 Construction, Renovation and Demolition (CR&D) Waste
Characterization ..................................................................................... 160 14.5 NEWFOUNDLAND AND LABRADOR SUMMARY ..................................................... 161

The Government of Canada Action Plan 2000 on Climate Change
NRCan / RNCan 154 Mar-2006
14.1 Introduction Waste and recycling regulatory and legislative direction in Newfoundland and Labrador comes from the province’s Department of Environment and Conservation (Pollution Prevention Division). However, a more active and direct role was vested in the Multi-Material Stewardship Board (MMSB), which was established as a Crown Agency of the Provincial Department of the Environment in 1997. According to their web site,235 the MMSB is “responsible for developing, implementing, and managing waste diversion programs” throughout the province. Since their inception, several programs have come into being: Waste Management Trust Fund, Public education and information, Beverage containers, Used tires and Used oil (more detail on each of these programs is available at the MMSB web site). Given their role in supporting waste diversion programs, it makes sense that the primary agency interested in monitoring waste and recycling in NL is also the MMSB. 14.2 Demographics The population data presented in Table 14.1 are “updated postcensal estimates”. As shown, the total population of this province is assumed to be 519,449 in the year 2002.
Table 14.1: Newfoundland & Labrador 2002 Population Distribution by County236
Division No. Area Name
Population
1 2 3 4 5 6 7 8 9
10
Avalon Peninsula Burin Peninsula South Coast St. George's Humber District Central Newfoundland Bonavista/Trinity Notre Dame Bay Northern Peninsula Labrador
248,036 24,264 19,244 22,412 40,925 36,856 37,550 42,194 19,989 27,979
Total 519,449
Nearly half the population of the province resides in the Avalon Peninsula of which 72 percent are in the St. John’s metropolitan area. Table 14.2 shows the five largest communities in Newfoundland and Labrador (46 percent of total population). Needless
235 See http://www.mmsb.nf.ca/aboutuspage.htm (accessed July 2005) 236 Economics and Statistics Branch, Newfoundland & Labrador Statistics Agency www.stats.gov.nl.ca (accessed July 4005)

The Government of Canada Action Plan 2000 on Climate Change
NRCan / RNCan 155 Mar-2006
to say, a low population density and large distances make the implementation of cost-effective recycling programs very challenging. Table 14.2: Five Largest Newfoundland & Labrador Municipalities (2002)237
Municipality
Population
St. John's (CMA) Corner Brook Grand Falls-Windsor Gander Labrador City
172,918 25,747 18,981 11,254 9,638
Total 238,538
14.3 Generation, Recycling and Disposal
14.3.1 Actual and Projected Data by Sector The data provided in WMIS 2002 for Newfoundland and Labrador can be used to develop estimates for the missing sectors as shown in Table 14.3. The shaded numbers are estimates (not included in WMIS) with explanations following the table.
Table 14.3: Newfoundland & Labrador Solid Waste Flow by Sector in (2002)238
Sector
Generation Disposal Recycling Diversion Rate
Residential IC&I CR&D
231,291 163,218
20,471
216,218 140,377
19,999
15,073 22,841
472
7% 14%
2%
Total tonnes Kilograms/capita
414,979 799
376,593 725
38,386 74
9%
The key data provided by WMIS are disposal tonnage and diversion rates for each of the three sectors plus residential and total generation data. With these data sets, it is possible to estimate the generation and recycling numbers for the IC&I and CR&D sectors (by dividing disposal tonnes by one minus the diversion rate) as discussed in Sections 4.5.2 and 4.5.3. However, since the WMIS diversion rates are rounded (as shown), the aforementioned formulae are not 100% reliable and so some adjustment of the estimates
237 See http://www12.statcan.ca/english/census01/products/standard/popdwell/Table-UR-D.cfm?PR=35 (accessed July 2005) 238 Statistics Canada, Waste Management Industry Survey: Business and Government Sectors 4004, Catalogue no. 16F0043XIE, Table A.1, p. 14. Totals do not add up exactly due to rounding.

The Government of Canada Action Plan 2000 on Climate Change
NRCan / RNCan 156 Mar-2006
is required to make sure that the IC&I and CR&D diversion sub-total equals the amount that can be deduced from the WMIS data (total diversion minus residential diversion). Since neither the Department of the Environment and Conservation nor MMSB collect province wide waste and recycling data, WMIS provides the only data set that can be used to project potential recovery rates. It should be noted that NL Ministry staff suspect that actual tonnage disposed far exceeds stated statistics.239 However, the NL disposal rate (725 kg/capita) is quite close to the national rate (753 kg/capita),240 which might suggest that the numbers are not that far off.
14.3.2 Product Stewardship Data There are three notable product stewardship programs in Newfoundland and Labrador: beverage containers,241 tires and beer bottles. The first two programs are operated by MMSB. While the beer aluminum cans are recovered via MMSB, the refillable beer bottles are managed by the beer industry. The Brewers Association of Canada provided the quantity of beer containers returned (Table 14.4). Although the beer cans are recovered via the MMSB system, the aluminum can units and tonnes are shown Table 13.4 (in italics) but not counted towards the total.
Table 14.4: Beer Containers Sold and Returned in Newfoundland & Labrador (2002)242
Container Type
Units Sold Return Rate
Tonnes Returned
Aluminum cans Refillable glass bottles
111,888,312 7,548,352
68.0% 95.6%
77 1,921
Total
1,921
In 2002, MMSB reports that some 109 million beverage containers were recycled. Table 14.5 provides a summary of the materials by weight.
239 Personal communication with Toby Matthews, Manager, Waste & Contaminated Sites, Ministry of the Environment, June 2003 240 WMIS 2002, Table A.1, p. 14 241 For more background information on the beverage container program see http://www.ec.gc.ca/epr/inventory/en/DetailView.cfm?intInitiative=85 (accessed July 2005) 242 Brewers Association of Canada, 2003 Annual Statistical Bulletin (www.brewers.ca)

The Government of Canada Action Plan 2000 on Climate Change
NRCan / RNCan 157 Mar-2006
Table 14.5: Newfoundland & Labrador Beverage Packaging Recovery Summary (2002)243
Container Type
Units Returned
Kg per unit 244
Tonnes
Aluminum Steel cans Glass PET HDPE Other plastics Drink boxes Cartons Mini-sips
56,415,592 546,495
9,577,886 31,317,518
873,356 2,225,184
10,459,380 1,070,652
31,691
0.015 0.151 0.399 0.041 0.036 0.041 0.024 0.043 0.229
846 83
3,817 1,284
31 91
251 46
7
Total 6,457
14.4 Waste Composition
14.4.1 Residential Waste Characterization According to WMIS, the total amount of residential solid waste disposed of in 2002 was 216,218 tonnes (recall Table 14.3). The characterization data for residential solid waste disposed of in Newfoundland and Labrador is from work undertaken in the Avalon Peninsula,245 using data from Lunenburg, Nova Scotia246. The numbers may be too high for paper and plastics, especially in those more remote areas where waste may be burned on site.247 Table 14.6 and Figure 14.1 summarize the estimated characterization of the residential waste disposed in 2002.
243 Personal communication with Nancy Griffiths, MMSB, July 2005 244 As used by Nova Scotia’s RRFB. Canada needs standardized data for beverage container weights. 245 Avalon Waste Management, Community Consultative Committee, Action Plan September 2002, Figure 3.2, p. 15. http://www.avalonwaste.com/Archives/FinalReport.pdf (accessed July 2005) 246 SNS-Lavalin, 2001, Waste Characterization Study of Residual Solid Waste & Recyclables in the Mun. of Lunenburg, NS (Spring 2001), Table 3.5 247 For more information on this subject see http://www.ccme.ca/assets/pdf/df_rwc_gartner_lee_rpt_e.pdf (accessed July 2004)

The Government of Canada Action Plan 2000 on Climate Change
NRCan / RNCan 158 Mar-2006
Table 14.6: Estimated Composition of Newfoundland & Labrador Residential Waste Disposed (2002)
Material
Total
tonnes Organics Paper Glass Ferrous Nonferrous Plastics Multi-material Textiles HHW Other
90,163 60,109 6,703 7,784 2,162
21,189 6,270 8,865 7,135 5,838
Total
216,218
Figure 14.1: Estimated Composition of Newfoundland & Labrador Residential Waste Disposed (2002)
Several small audits were conducted in five Newfoundland & Labrador communities (Mary’s Harbour, Nain and Forteau) with the following averaged results:248 Organics 26 percent; paper 37 percent; glass 6 percent; metal 9 percent; plastics 8 percent; textiles 5 percent; haz-waste 3 percent and other 6 percent. The variation in organics and paper quantities is notable while the metal and glass numbers seem high. With respect to Figure 14.1, organics and paper are prominent, making up 69 percent of the total. The 5 percent metals content is typical for this stream of materials.
248 Quebec-Labrador Foundation, 1998, Waste Audit for Three Coastal Communities of Labrador: Mary’s Harbour, Cartwright and Nain; and Quebec-Labrador Foundation, 1999, Labrador Straits Waste Audit Report: Results, Analysis and Recommendations
Organics 41%
Paper 28%Glass 3%
Textiles 4%
Other3%
Multi-material 3%
Haz-waste 3%
Nonferrous 1%
Plastics 10%
Ferrous 4%
Organics 41%
Paper 28%Glass 3%
Textiles 4%
Other3%
Multi-material 3%
Haz-waste 3%
Nonferrous 1%
Plastics 10%
Ferrous 4%

The Government of Canada Action Plan 2000 on Climate Change
NRCan / RNCan 159 Mar-2006
14.4.4 Industrial, Commercial and Institutional (IC&I) Waste Characterization The total amount of IC&I tonnes disposed of in Newfoundland & Labrador in 2002 is assumed to be 140,377 tonnes (Table 14.3). The Avalon Waste Management report provides some composition estimates for the IC&I waste stream with reference to another report249 that was not found during the research phase of this study. One problem with the data presented in the Avalon report is that the percentages add up to 110 percent.250 Therefore, the data were each reduced by 10 percent and applied to IC&I tonnage considered to be “urban”. It was assumed that urban tonnes could be associated proportionately with the population of the five largest communities (recall Table 14.2). For the rural areas, characterization data are borrowed from the Regional District of North Okanogan in B.C..251 A significant difference between the two data sets is that urban assumes a large amount of paper while rural assumes much more organic matter. Table 14.7 presents the estimated characterization of the IC&I waste stream in Newfoundland & Labrador. The metal split into ferrous and nonferrous components is based on the residential numbers from Avalon, which is 78/22. Table 14.7: Projected Tonnage for IC&I Waste Disposed in Newfoundland &
Labrador (2002)
Material
Urban tonnes
Rural tonnes
Total tonnes
Paper Plastics Ferrous Nonferrous Organics Glass Wood Other Renovation Haz-waste
28,283 7,168 2,267
639 8,911 2,260 3,939 7,232 3,874
0
19,027 8,535 3,110
877 26,804 1,364
0 10,878 2,585 2,623
47,310 15,703 5,377 1,516
35,715 3,625 3,939
18,110 6,459 2,623
Total
64,573 75,804 140,377
In Figure 14.2, the total tonnage data from Table 14.7 are presented in a graphic form. The reader is advised that the IC&I characterization data are extremely rough given the variable nature of this sector (i.e. restaurants, offices, hospitals, schools, industries, etc.). A different approach to projecting resource recovery potential in the IC&I sector is discussed in Chapter 16.
249 Vaughan Environmental Consultants Ltd. in association with RIS Ltd. and Jacques Whitford Environment Ltd., 1994, South Shore/Valley Region Waste Management Study, Phase 1 Waste Audit Final Report. 250 Avalon Waste Management, Figure 3.4, p. 16 (see previous footnote). 251 EcoChoice Consulting and Footprint Environmental Consultants, 1998, Waste Composition Survey of the RD of North Okanogan (the Lumby Landfill Waste Composition Pie Chart), Table 10, p. 22

The Government of Canada Action Plan 2000 on Climate Change
NRCan / RNCan 160 Mar-2006
Figure 14.2: Estimated Composition of Total IC&I Waste Disposed in
Newfoundland & Labrador (2002)
14.4.3 Construction, Renovation and Demolition (CR&D) Waste Characterization The total amount of CR&D waste disposed in Newfoundland & Labrador in 2002 is taken to be 19,999 tonnes (Table 14.3). As no CR&D characterization data were found in the province, national averages are applied. Specific to Newfoundland & Labrador is the large amount of residential construction activity versus non-residential (62/38). The reader is reminded that the value of construction permits issues in 2000 is used as a proxy for estimating the amount of CR&D waste that is residential or non-residential. For each of these categories, different construction, renovation and demolition data are applied, in turn (see Section 4.3 for more discussion of this approach). Table 14.8 provides the estimates for the amount and type of CR&D waste disposed. Table 14.8: Projected Tonnage for CR&D Waste Disposed in Newfoundland
& Labrador (2002)
Material
Total Tonnes
Total Percent
Concrete Asphalt Wood Drywall Ferrous Nonferrous Paper product Other
3,341 1,572 6,106 2,183
161 538 240
5,859
17% 8%
31% 11%
1% 3% 1%
29%
Totals
19,999 100%
Paper 33%
Organics 25%
Other 13%
Plastic 11%Renovation 5%
Wood 3%
Haz-waste 2%
Nonferrous 1%
Ferrous 4%
Glass 3%
Paper 33%
Organics 25%
Other 13%
Plastic 11%Renovation 5%
Wood 3%
Haz-waste 2%
Nonferrous 1%
Ferrous 4%
Glass 3%
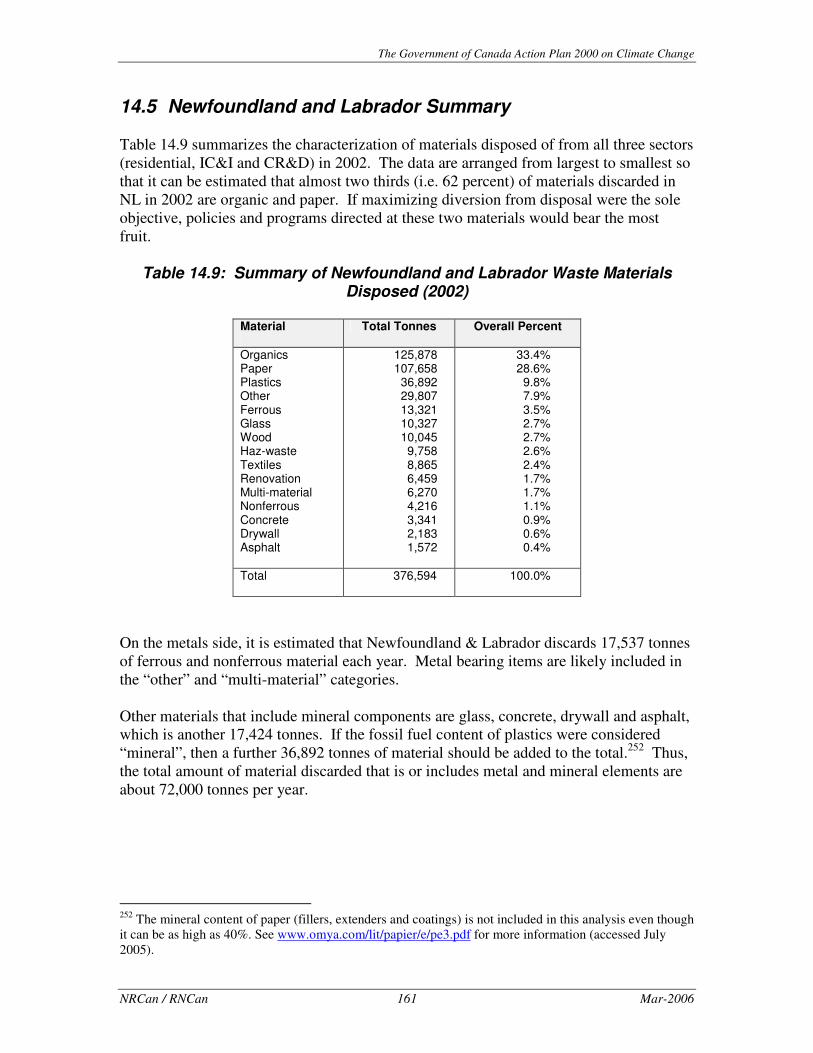
The Government of Canada Action Plan 2000 on Climate Change
NRCan / RNCan 161 Mar-2006
14.5 Newfoundland and Labrador Summary Table 14.9 summarizes the characterization of materials disposed of from all three sectors (residential, IC&I and CR&D) in 2002. The data are arranged from largest to smallest so that it can be estimated that almost two thirds (i.e. 62 percent) of materials discarded in NL in 2002 are organic and paper. If maximizing diversion from disposal were the sole objective, policies and programs directed at these two materials would bear the most fruit.
Table 14.9: Summary of Newfoundland and Labrador Waste Materials Disposed (2002)
Material
Total Tonnes Overall Percent
Organics Paper Plastics Other Ferrous Glass Wood Haz-waste Textiles Renovation Multi-material Nonferrous Concrete Drywall Asphalt
125,878 107,658
36,892 29,807 13,321 10,327 10,045 9,758 8,865 6,459 6,270 4,216 3,341 2,183 1,572
33.4% 28.6%
9.8% 7.9% 3.5% 2.7% 2.7% 2.6% 2.4% 1.7% 1.7% 1.1% 0.9% 0.6% 0.4%
Total
376,594
100.0%
On the metals side, it is estimated that Newfoundland & Labrador discards 17,537 tonnes of ferrous and nonferrous material each year. Metal bearing items are likely included in the “other” and “multi-material” categories. Other materials that include mineral components are glass, concrete, drywall and asphalt, which is another 17,424 tonnes. If the fossil fuel content of plastics were considered “mineral”, then a further 36,892 tonnes of material should be added to the total.252 Thus, the total amount of material discarded that is or includes metal and mineral elements are about 72,000 tonnes per year.
252 The mineral content of paper (fillers, extenders and coatings) is not included in this analysis even though it can be as high as 40%. See www.omya.com/lit/papier/e/pe3.pdf for more information (accessed July 2005).

NRCan / RNCan 162 Mar-2006
Figure 14.3: Newfoundland and Labrador Solid Waste Flow in 2002
Population514,449
Total Generation425,826 tonnes
Economy$13.9 billion (GDP)
Residential236,712 t.
IC&I*168,642 t.
CR&D**20,472 t.
Rec.Disposal216,218 t.
Disposal140,377 t.
Disposal19,999 t.
Rec.
472 t. Rec.15,073 t. 22,841 t.
Rec. = DiversionRate = 10% overall
ProductStewardship
Programs
= 376,594 t.(total disposal)
10,843 t.
(*industrial, commercial & institutional;**construction, renovation & demolition)
Organics
Paper
90,163
60,109
Plastics
TextilesFerrousHHWGlassMulti-materialOtherNonferrous
21,189
8,8657,7847,1356,7036,2705,8382,162
Paper
Organics
Other
Plastic
RenovationFerrousWoodGlassHaz-wasteNonferrous
47,310
35,715
18,110
15,703
6,4595,3773,9393,6252,6231,516
woodotherconcretedrywallasphaltnon-ferrouspaperferrous161
240538
1,5722,1833,3415,8596,106
Population514,449
Total Generation425,826 tonnes
Economy$13.9 billion (GDP)
Residential236,712 t.
IC&I*168,642 t.
CR&D**20,472 t.
Rec.Disposal216,218 t.
Disposal140,377 t.
Disposal19,999 t.
Rec.
472 t. Rec.15,073 t. 22,841 t.
Rec. = DiversionRate = 10% overall
ProductStewardship
Programs
= 376,594 t.(total disposal)
10,843 t.
(*industrial, commercial & institutional;**construction, renovation & demolition)
Organics
Paper
90,163
60,109
Organics
Paper
90,163
60,109
Plastics
TextilesFerrousHHWGlassMulti-materialOtherNonferrous
21,189
8,8657,7847,1356,7036,2705,8382,162
Plastics
TextilesFerrousHHWGlassMulti-materialOtherNonferrous
21,189
8,8657,7847,1356,7036,2705,8382,162
Paper
Organics
Other
Plastic
RenovationFerrousWoodGlassHaz-wasteNonferrous
47,310
35,715
18,110
15,703
6,4595,3773,9393,6252,6231,516
Paper
Organics
Other
Plastic
RenovationFerrousWoodGlassHaz-wasteNonferrous
47,310
35,715
18,110
15,703
6,4595,3773,9393,6252,6231,516
woodotherconcretedrywallasphaltnon-ferrouspaperferrous161
240538
1,5722,1833,3415,8596,106 wood
otherconcretedrywallasphaltnon-ferrouspaperferrous161
240538
1,5722,1833,3415,8596,106

NRCan / RNCan 163 Mar-2006
Chapter 15 The Yukon Territory, Northwest Territory and Nunavut
15.1 INTRODUCTION .................................................................................................... 164 15.2 DEMOGRAPHICS ................................................................................................... 165 15.3 GENERATION, RECYCLING AND DISPOSAL ........................................................... 165 15.3.1 Actual and Projected Data by Sector...................................................... 166 15.3.2 Product Stewardship Data...................................................................... 167 15.4 WASTE COMPOSITION .......................................................................................... 169
15.4.1 Residential Waste Characterization ....................................................... 169 15.4.2 Industrial, Commercial and Institutional (IC&I) Waste
Characterization ..................................................................................... 170 15.4.3 Construction, Renovation and Demolition (CR&D) Waste
Characterization ..................................................................................... 171 15.5 YUKON TERRITORY, NORTHWEST TERRITORY AND NUNAVUT SUMMARY .......... 171

The Government of Canada Action Plan 2000 on Climate Change
NRCan / RNCan 164 Mar-2006
15.1 Introduction The three northern territories are addressed within this one chapter, given their combined population of about 100,000 people and estimated solid waste generation of about 80,000 tonnes per year. In regards to recycling, efforts to date have been limited due to other priorities, extremely low population density, very small quantities and enormous distances to secondary material markets (located entirely in the south). While each of the territories has various environmental protection programs regarding the management of solid waste, the focus of this chapter is recycling and the measurement of solid waste disposed. Generally speaking, waste measurement does not appear to be a priority task in the North.253 �� ���!���������
The Environmental Protection and Assessment Branch of the Yukon Government has responsibility for waste and recycling in that territory. The Yukon has Beverage Container Regulations (amended in 1996 and 1998) and the performance of this program is monitored. In 2000, the Waste Reduction and Recycling Initiative was established to fund new recycling activities at licensed drop-off depots. There are 26 landfills in the Territory and the Yukon Department of Community and Transportation Services manages 19 of them. Incorporated municipalities such as the City of Whitehorse manage the remaining sites. While the Whitehorse landfill has a weigh scale, it is uncertain whether the other sites have scales. Whitehorse has the most extensive recycling program in the North, perhaps driven by local desire to extend the life of their landfill well beyond 2033. "���#$���!����������%"&!'�
The Department of Municipal and Community Affairs has responsibility for solid waste management in NWT. This responsibility includes recycling initiatives. The NWT Beverage Container Refund Program was proposed in 2001 but it was not until 2003 with the passage of the Waste Reduction and Recovery Act that the government had the authority to set up the desired program. More information on these deliberations can be found at the NWT web site.254 There are plans to target other materials such as milk containers, cardboard, plastics, tires and computers. The NWT Liquor Commission already has a deposit/refund system in place for its bottles; however, the primary reason is litter reduction since the businesses that collect the bottles are not committed to recycling them, and so most are landfilled.255
253 See http://www.enr.gov.nt.ca/eps/pdf/Background%20Report%20Solid%20Waste%20Sites.pdf (accessed July 2005) 254 See http://www.enr.gov.nt.ca/eps/pdf/bcrp_2003.pdf (accessed July 2005) 255 FSC, 2003, Background Report, Updating the Guidelines for the Planning, Design, Operations and Maintenance of Modified Solid Waste Sites in NWT, DMCA, Government of NWT, p. 53 (which can be found at www.enr.gov.nt.ca/eps/environ.htm , accessed July 2005)

The Government of Canada Action Plan 2000 on Climate Change
NRCan / RNCan 165 Mar-2006
The City of Yellowknife has a recycling program at their landfill site plus three drop-off depots in other parts of the community. The depots collect aluminum and tin cans, cardboard, newsprint and other paper. More extensive recycling activities are typically not pursued once the cost of shipping the materials to southern markets is realized. "�������
Neither waste nor recycling are mentioned at the Nunavut web site where the Department of Sustainable Development is the agency most likely to be responsible for this issue.256 In any case, all recycling activities in Nunavut are strictly voluntary. For example, the local Rotary Club collected paper in blue boxes and Canadian North transported this material south. The Town of Iqaluit operated the Iqaluit Recycling Centre until 1993 and then it passed into private hands. For a time the centre was processing 35 to 50 thousand aluminum cans per year and these were then flown to Ottawa by First Air, but eventually the centre was no longer financially viable and the program ended. 15.2 Demographics The total 2002 population of the Yukon, NWT and Nunavut is estimated by Statistics Canada to be 100,635 as shown in Table 15.1.
Table 15.1: Northern 2002 Population Distribution257
Territory
Population
Yukon NWT Nunavut
30,137 41,489 28,739
Total
100,635
The largest community in the North is Whitehorse with 19,058 (in 2001).258 Whereas the average Canadian population density is 3.15 people per square kilometre, in the three territories combined, the density is 0.03.259
15.3 Generation, Recycling and Disposal WMIS 2002 report does not provide any data for the North except the overall diversion rate of 10 percent. Due to their confidentiality protocol, they cannot publish data with which individual operators can be identified. For this reason, the PEI numbers are also largely absent although WMIS does include the data from these two jurisdictions in the
256 See http://www.gov.nu.ca/Nunavut/environment/Minister.html (accessed July 2005) 257 Personal communication with Amanda Elliott, Statistics Canada, May 31, 2005 258 See http://www12.statcan.ca/english/census01/products/standard/popdwell/Table-UR-M.cfm?T=1&PR=60&CD=6001&SR=26&S=1&O=A 259 See http://www.thecanadapage.org/CanStat.htm#Economic/Social%20Data (accessed July 2005)

The Government of Canada Action Plan 2000 on Climate Change
NRCan / RNCan 166 Mar-2006
national summary. However, since estimates for the missing PEI data have been made in Chapter 13, it is possible to interpolate the waste and recycling numbers for the North.
15.3.1 Actual and Projected Data by Sector Table 15.2 provides estimated solid waste tonnage numbers for the North (shaded). For the purposes of this report, the disposal estimates are key. Once the disposal estimates for PEI’s three sectors are established, it is possible to calculate generation and diversion for the North using basic mathematics. These estimates can then be double checked by using the Section 4.5 formula. The re-calculated diversion rates in Table 15.2 (shaded) are based on the estimates derived in this report and should be compared with the WMIS numbers noted in the table that are not shaded.
Table 15.2: Northern Solid Waste Flow by Sector (2002)
Sector
Generation Disposal Recycling Diversion Rate
Residential IC&I CR&D
29,528 41,354 7,748
25,828 37,398 7,748
3,700 3,956
0
12.5% -16% 9.6% - 9%
0%
Total tonnes Kilograms/capita
78,630 70,974 7,656 9.7% - 10%
�����������������
WMIS gives a residential diversion rate for the North of 16 percent (no doubt a rounded figure). However, in using the PEI and National numbers to deduce the Northern values, the calculated residential diversion rate is 12.5 percent, which is 3.5 percent short of the WMIS rate. The 16 percent diversion rate can be achieved by adding 1,602 tonnes to the recycling figure, which would suggest that 4,934 tonnes of residential material are recycled in the north rather than 3,332 tonnes. In any case, these numbers are too small to merit further discussion. ������������
The IC&I diversion rate for the North, according to WMIS, is 9 percent. The Table 15.2 rate is 9.6 percent, based on the data adjustments undertaken to this point. The variance between the diversion rates and the “residual error” in the IC&I and CR&D sectors was reviewed in previous chapters. More analysis is not required. � ����������
From the Statistics Canada report, the only two disposal numbers missing are those from PEI and the North, which total 19,174 tonnes. Since the PEI figure was estimated to be 11,426 tonnes (Section 13.3.2), the remaining amount (7,748 tonnes) is assumed to be the quantity of CR&D waste disposed in the North in 2002. Statistics Canada indicates that none of this material was diverted.
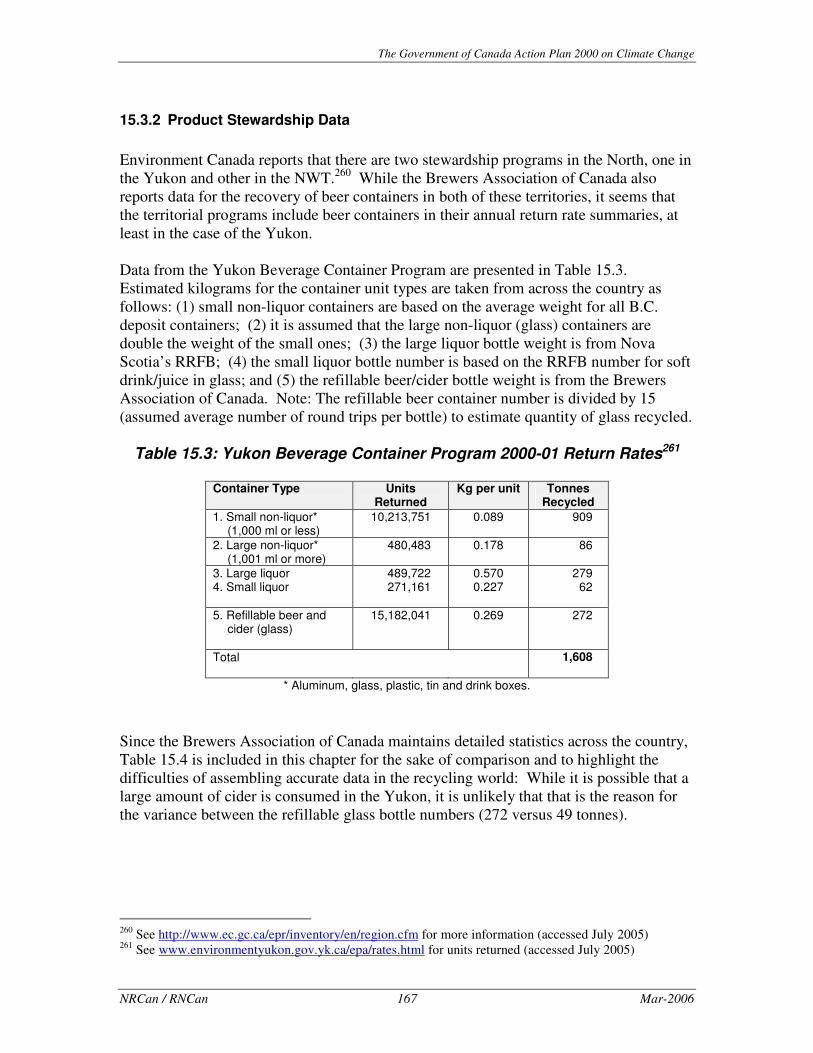
The Government of Canada Action Plan 2000 on Climate Change
NRCan / RNCan 167 Mar-2006
15.3.2 Product Stewardship Data Environment Canada reports that there are two stewardship programs in the North, one in the Yukon and other in the NWT.260 While the Brewers Association of Canada also reports data for the recovery of beer containers in both of these territories, it seems that the territorial programs include beer containers in their annual return rate summaries, at least in the case of the Yukon. Data from the Yukon Beverage Container Program are presented in Table 15.3. Estimated kilograms for the container unit types are taken from across the country as follows: (1) small non-liquor containers are based on the average weight for all B.C. deposit containers; (2) it is assumed that the large non-liquor (glass) containers are double the weight of the small ones; (3) the large liquor bottle weight is from Nova Scotia’s RRFB; (4) the small liquor bottle number is based on the RRFB number for soft drink/juice in glass; and (5) the refillable beer/cider bottle weight is from the Brewers Association of Canada. Note: The refillable beer container number is divided by 15 (assumed average number of round trips per bottle) to estimate quantity of glass recycled.
Table 15.3: Yukon Beverage Container Program 2000-01 Return Rates261
Container Type
Units Returned
Kg per unit Tonnes Recycled
1. Small non-liquor* (1,000 ml or less)
10,213,751 0.089 909
2. Large non-liquor* (1,001 ml or more)
480,483 0.178 86
3. Large liquor 4. Small liquor
489,722 271,161
0.570 0.227
279 62
5. Refillable beer and cider (glass)
15,182,041 0.269 272
Total 1,608
* Aluminum, glass, plastic, tin and drink boxes.
Since the Brewers Association of Canada maintains detailed statistics across the country, Table 15.4 is included in this chapter for the sake of comparison and to highlight the difficulties of assembling accurate data in the recycling world: While it is possible that a large amount of cider is consumed in the Yukon, it is unlikely that that is the reason for the variance between the refillable glass bottle numbers (272 versus 49 tonnes).
260 See http://www.ec.gc.ca/epr/inventory/en/region.cfm for more information (accessed July 2005) 261 See www.environmentyukon.gov.yk.ca/epa/rates.html for units returned (accessed July 2005)

The Government of Canada Action Plan 2000 on Climate Change
NRCan / RNCan 168 Mar-2006
Table 15.4: Beer Containers Sold and Returned in the Yukon (2002)262
Container Type
Units Sold Return Rate
Tonnes Returned
Tonnes Recycled
Aluminum cans Refillable glass bottles
6,012,861 2,766,394
47.6% 98.3%
43 732
43 49
Total
92
The NWT beverage container program is voluntary and involves a deposit on all liquor, wine and beer containers. Although the program reports a 75 percent recovery rate no other details on containers actually returned are available. The exception again is the Brewers Association of Canada’s data for the NWT as shown in Table 15.5.
Table 15.4: Beer Containers Sold and Returned in NWT (2002)263
Container Type
Units Sold Return Rate
Tonnes Returned
Tonnes Recycled
Aluminum cans Refillable glass bottles
4,938,123 5,502,744
47.6% 85.6%
35 1,269
35 85
Total
120
Other non-beer containers recovered via the NWT Liquor Commission Board are landfilled. Only aluminum cans are valuable enough to ship to Alberta markets. It’s not known what happens to refillable beer bottles at their end of their life but presumably they are landfilled as well given the high cost of transport to southern markets. Total product stewardship tonnage is assumed to be 1,728 tonnes for the Yukon and NWT (Yukon Brewer’s data excluded to avoid double counting). There are no product stewardship programs in Nunavut.
262 Brewers Association of Canada, 2003 Annual Statistical Bulletin (www.brewers.ca) 263 Brewers Association of Canada, 2003 Annual Statistical Bulletin (www.brewers.ca)

The Government of Canada Action Plan 2000 on Climate Change
NRCan / RNCan 169 Mar-2006
15.4 Waste Composition
15.4.1 Residential Waste Characterization The City of Whitehorse appears to be the only jurisdiction in the North with recent waste and recycling data with which to estimate the composition of residential waste disposed of. 264 Table 15.6 presents the data and Figure 15.1 is the chart.
Table 15.6: Estimated Composition of Northern Residential Waste Disposed (2002)
Material
Total tonnes
Organics Paper Other Plastics Renovation Glass Ferrous Aluminum Other metal Haz-waste
9,815 7,124 2,336 2,260 1,572 1,400
780 223 168 150
Total
28,828
Figure 15.1: Estimated Composition of Northern Residential Waste Disposed (2002)
Other residential composition data were found in a NWT study but they were considered to be historical.265
264 City of Whitehorse, 1995, Solid Waste Action Plan, staff, Appendix B, pp. 65-66 265 Gary Heinke & Jeffery Wong, 1990, Solid Waste Composition Study for Iqaluit, Pangnirtung and Broughton Island of the NWT, Dept. of Municipal and Community Affairs, Govt. of NWT, Table 6, p. 20
Paper 28%
Glass 5%
Plastics 9%
Organics 37%
Other 9%
Aluminum 1%
Ferrous 3%
Other metal 1%
Renovation 6%
Haz-waste 1%
Paper 28%
Glass 5%
Plastics 9%
Organics 37%
Other 9%
Aluminum 1%
Ferrous 3%
Other metal 1%
Renovation 6%
Haz-waste 1%

The Government of Canada Action Plan 2000 on Climate Change
NRCan / RNCan 170 Mar-2006
15.4.2 Industrial, Commercial and Institutional (IC&I) Waste Characterization During the research phase of this study no IC&I waste characterization data were found for the Yukon, Northwest Territories or Nunavut. Therefore to generate some estimates, the data from a rural IC&I sector in B.C. are used to develop figures for Table 15.7.266 Figure 15.2 provides a pie chart for the same data set. Table 15.7: Projected Tonnage for IC&I Waste Disposed in the North (2002)
Material
Total
tonnes Organics Paper Other Plastic Ferrous Haz-waste Renovation Glass Nonferrous
13,224 9,387 5,367 4,211 1,341 1,294 1,275
673 626
Total
37,398
Figure 15.2: Estimated Composition of Total IC&I Waste Disposed in the North (2002)
266 EcoChoice Consulting and Footprint Environmental Consultants, 1998, Waste Composition Study for the Regional District of North Okanogan (NORD ), Table 10, p. 22
Paper 25%
Plastic 11%
Organics 36%
Other 14%Glass2%
Ferrous 4%
Nonferrous 2%
Renovation 3%
Haz-waste 3%
Paper 25%
Plastic 11%
Organics 36%
Other 14%Glass2%
Ferrous 4%
Nonferrous 2%
Renovation 3%
Haz-waste 3%

The Government of Canada Action Plan 2000 on Climate Change
NRCan / RNCan 171 Mar-2006
15.4.3 Construction, Renovation and Demolition (CR&D) Waste Characterization The amount of CR&D waste disposed of in the Yukon, Northwest Territories and Nunavut is relatively small (7,748 tonnes per year) and spread out across vast distances. Any potential recovery activities are likely to be limited to the materials of highest value, likely nonferrous and possibly some ferrous. Nevertheless, in keeping with the study approach, general characterization data are applied and estimates developed for what the components of this stream of material might be. Section 4.3 provides the outline of the approach taken for CR&D waste. Table 15.8 presents the projections.
Table 15.8: Projected Tonnage for CR&D Waste Disposed in the North (2002)
Material
Total
Tonnes Total
Percent Wood Other Concrete Drywall Asphalt Nonferrous Paper Ferrous
2,449 2,253 1,198
893 564 235
86 70
32% 29% 15% 12%
7% 3% 1% 1%
Totals
7,748 100%
15.5 Yukon Territory, Northwest Territory and Nunavut
Summary As discussed, the small amount of solid waste disposed of in the North reflects the fact that only 0.3 percent of the Canadian population resides here (in fact, it is a direct correlation). While northern characterization data are available for the residential sector, it is expected that the application of data from the south for the IC&I and CR&D sectors have resulted in extremely rough projections for these material streams and thus these numbers should be regarded with great caution. Given the remoteness of 3this area, it is likely that certain materials and products are not consumed to the same degree as in the southern parts of the country. For example, one might anticipate fewer and smaller newspapers per capita and less heavy food packaging (such as glass) in favour of lighter materials (e.g. plastics). The prohibition of alcohol in some communities will have an impact on the quantity of related containers in the waste stream. While data specific to the North is unavailable, it is likely that broken or old appliances are discarded rather than repaired, given the higher cost of assembling required parts. In

The Government of Canada Action Plan 2000 on Climate Change
NRCan / RNCan 172 Mar-2006
fact the recovery of metal scrap from the North is the goal of another Enhanced Recycling project, to determine how it can be done in the most cost-effective manner.267 Table 15.9 summarizes the estimates for all of the materials across all three sectors. Table 15.9: Summary of Northern Waste Materials Disposed (2002)
Material
Total Tonnes Overall Percent
Organics Paper Other Plastics Renovation Ferrous Wood Glass Haz-waste Concrete Nonferrous Drywall Asphalt
23,039 16,597 9,955 6,471 2,847 2,191 2,449 2,073 1,444 1,198 1,252
893 564
32.5% 23.4% 14.0%
9.1% 4.0% 3.1% 3.5% 2.9% 2.0% 1.7% 1.8% 1.3% 0.8%
Total
70,794 100.0%
Consistent with other parts of Canada, organics and paper top the list representing nearly 55 percent of all waste disposed. As for minerals and metals, ferrous and nonferrous items amount to an annual 3,443 tonnes – this quantity does not include the stockpiles of metal scrap that have likely accumulated across the north awaiting recovery whenever it makes economic sense. Figure 15.3 illustrates the estimated characterization of waste disposed for each of the three sectors: (1) residential, (2) institutional, commercial & industrial, and (3) construction, renovation & demolition.
267 See http://www.recycle.nrcan.gc.ca/summaries_e.htm#25, and search for “Northern Communities”; report due March 2006.

NRCan / RNCan 173 Mar-2006
Figure 15.3: Solid Waste Flow in Yukon Territory, Northwest Territory and Nunavut in 2002
Population100,635
Total Generation80,358 tonnes
Economy$5.0 billion (GDP)
Residential30,392 t.
IC&I*42,218 t.
CR&D**7,748 t.
Rec.Disposal25,828 t.
Disposal37,398 t.
Disposal7,748 t.
Rec.
3,700 t.. 3,956 t.
Rec. = DiversionRate = 11% overall
ProductStewardship
Programs
= 70,974 t.(total disposal)
1,728 t.
(*industrial, commercial & institutional;**construction, renovation & demolition)
Organics
Paper
Other
Plastics
RenovationGlassFerrousAluminumOther metalHaz-waste
9,815
7,124
2,336
2,260
1,5721,400
780223168150
Organics
Paper
Other
Plastic
FerrousHaz-wasteRenovationGlassNonferrous
13,224
9,387
5,367
4,211
1,3411,2941,275
673626
2,449
2,253
1,198
893564235
8670
Wood
Other
Concrete
DrywallAsphaltNonferrousPaperFerrous
Population100,635
Total Generation80,358 tonnes
Economy$5.0 billion (GDP)
Residential30,392 t.
IC&I*42,218 t.
CR&D**7,748 t.
Rec.Disposal25,828 t.
Disposal37,398 t.
Disposal7,748 t.
Rec.
3,700 t.. 3,956 t.
Rec. = DiversionRate = 11% overall
ProductStewardship
Programs
= 70,974 t.(total disposal)
1,728 t.
(*industrial, commercial & institutional;**construction, renovation & demolition)
Organics
Paper
Other
Plastics
RenovationGlassFerrousAluminumOther metalHaz-waste
9,815
7,124
2,336
2,260
1,5721,400
780223168150
Organics
Paper
Other
Plastics
RenovationGlassFerrousAluminumOther metalHaz-waste
9,815
7,124
2,336
2,260
1,5721,400
780223168150
Organics
Paper
Other
Plastic
FerrousHaz-wasteRenovationGlassNonferrous
13,224
9,387
5,367
4,211
1,3411,2941,275
673626
2,449
2,253
1,198
893564235
8670
Wood
Other
Concrete
DrywallAsphaltNonferrousPaperFerrous
2,449
2,253
1,198
893564235
8670
Wood
Other
Concrete
DrywallAsphaltNonferrousPaperFerrous

NRCan / RNCan 174 Mar-2006

The Government of Canada Action Plan 2000 on Climate Change
NRCan / RNCan 175 Mar-2006
Chapter 16 IC&I and CR&D Waste Generation Coefficient Projection Approach
16.1 INTRODUCTION.........................................................................................................................176 16.2 COEFFICIENT MODELING CONCEPT ....................................................................................177
16.2.1 North American Industry Classification System .............................................177 16.2.2 Statistics Canada Employment Data ..................................................................179
16.3 WASTE GENERATION AND CHARACTERIZATION DATA FOR THE IC&I SECTOR .....180
16.3.1 Waste Generation Data for the IC&I Sector....................................................180 16.3.2 Waste Characterization Data for the IC&I Sector.........................................183 16.3.3 Calculating a Disposal Rate and Applying Characterization Data ..........183
16.4 WASTE GENERATION AND CHARACTERIZATION DATA FOR THE CR&D SECTOR ..185 16.5 SUMMARY .................................................................................................................................187

The Government of Canada Action Plan 2000 on Climate Change
NRCan / RNCan 176 Mar-2006
16.1 Introduction Chapters 5 through 15 have used WMIS 2002 as a baseline for quantities of waste generated and disposed. The application of local, regional, provincial or even national composition data has been undertaken in an attempt to develop estimates regarding the amount and type of materials being discarded across Canada. While this approach is probably imperfect (due to weak or inconsistent characterization data), it is possibly the first attempt to make such projections at a national level. An alternative approach to developing projections of quantities of solid waste and potential recyclables can be applied to the non-residential sector. There are several reasons for taking a second look at the IC&I and CR&D sectors:
� The IC&I characterization data employed while developing provincial estimates (Chapters 5-15) assumed that one set of figures could be applied across the sector.
� The IC&I sector is highly heterogeneous in nature (e.g. office building, restaurant, manufacturing plants, hospitals, etc.) and its constituents consequently generate different types and amounts of waste and recyclables.
� It is possible that large amounts of recyclable materials are not being recovered because (a) municipalities do not manage IC&I or CR&D waste, (b) the sector is fragmented (not organized to achieve economies of scale when contracting with recycling companies), or (c) the economics do not support it.
� Some IC&I generation and characterization data are available and, if merged with Statistics Canada employment data, may provide an alternative set of materials projections with which to check the provincially based numbers.
The essence of the coefficient approach is to determine the amount of waste generated or disposed per employee per year, to multiply that by the total number of employments in that particular sub-sector, and to then apply characterization data specific to that sub-sector. A number of benchmark municipal studies have employed the coefficient approach including the Region of Ottawa-Carleton, Metro Toronto, the Greater Vancouver Regional District (GVRD), and the City of Calgary. The main concern with these studies is that most of them are over ten years old. An alternative approach bases waste generation on other measurable factors such as units of output, dollars in sales, building floor space and number of students or hospital beds. The California Integrated Waste Management Board (CIWMB) web site provides a summary of generation rates for institutions, service, commercial and industrial establishments that have been taken from studies conducted across the US.268
268 See http://www.ciwmb.ca.gov/WasteChar/ (accessed September 2005).

The Government of Canada Action Plan 2000 on Climate Change
NRCan / RNCan 177 Mar-2006
16.2 Coefficient Modeling Concept The challenge of adopting the coefficient approach lies in the assemblage of required data since the model is relatively simple to conceive, as illustrated in Figure 16.1.
Figure 16.1 Logic Model for Coefficient Approach
16.2.1 North American Industry Classification System A discussion of the North American Industry Classification System (NAICS) began in Section 4.2 and is continued here in more detail. Most readers are familiar with SIC, the Standard Industry Classification, which has been in use since the 1930’s. However, that system was replaced by NAICS in 1997 after extensive deliberations by American, Mexican and Canadian statistical representatives. NAICS was designed to provide common definitions of the industrial structure of the three countries and a common statistical framework to facilitate the analysis of the three economies. Its hierarchical structure is composed of sectors (two-digit code), sub sectors (three-digit code), industry groups (four-digit code), and industries (five-digit code). More information about the
U.S. Mexico
External sources
External sources
North American Industry Classification
System (NAICS)
Statistics Canada
Employment data by region and category
Solid waste generated per
employee per year
Characterization of waste generated by
category
Regional or National
projections
U.S. Mexico
External sources
External sources
North American Industry Classification
System (NAICS)
Statistics Canada
Employment data by region and category
Solid waste generated per
employee per year
Characterization of waste generated by
category
Regional or National
projections

The Government of Canada Action Plan 2000 on Climate Change
NRCan / RNCan 178 Mar-2006
development of this new classification system can be found at the NAICS or Statistics Canada web sites.269 The adoption of NAICS has an impact on the waste coefficient approach because most of the external sources for generation and characterization are based on the SIC system. Comparisons between SIC and NAICS can be found via Internet search engines. Table 16.1 provides a summary of the major twenty NAICS categories. Table 16.1: North American Industry Classification System (NAICS) 2002 -
Canada270
Code Category
Code Category
11 Agriculture, Forestry, Fishing and Hunting
53 Real Estate and Rental and Leasing
21 Mining and Oil and Gas Extraction
54 Professional, Scientific and Technical Services
22 Utilities 55 Management of Companies and Enterprises
23 Construction 56 Administrative and Support, Waste Management and Remediation Services
31-33
Manufacturing 61 Educational Services
41 Wholesale Trade 62 Health Care and Social Assistance
44-45
Retail Trade 71 Arts, Entertainment and Recreation
48-49
Transportation and Warehousing
72 Accommodation and Food Services
51 Information and Cultural Industries
81 Other Services (except Public Administration)
52 Finance and Insurance 91 Public Administration
269 See http://www.naics.com/info.htm#Structure (accessed September 2005) and also see Statistics Canada at http://www.statcan.ca/english/Subjects/Standard/naics/1997/naics97-intro.htm#top (accessed September 2005) 270 The elements of Table 16.1 (http://www.statcan.ca/english/Subjects/Standard/naics/2002/naics02-menu.htm) are hot-linked to the Statistics Canada web site where a detailed description of each category is provided including all the sub and sub-sub listings.

The Government of Canada Action Plan 2000 on Climate Change
NRCan / RNCan 179 Mar-2006
16.2.2 Statistics Canada Employment Data In 2004, Statistics Canada was engaged to provide baseline employment data by Province and Territory down to the industry sub-sectors (three digit) level. Table 16.2 provides national employment summary data at the sector (two digit) level only because more detailed waste generation or characterization data are mostly unavailable at the sub-sector level. However, only 18 categories of employment groupings were provided by Statistics Canada as two sectors are merged (52-53) and one (55) is missing altogether (refer to Table 16.1 for sub-sector identification).
Table 16.2: NAICS and National Employment Data in 2002271
Code North American Industry Classification System (NAICS)
Employees
11 21
221 23
31-33 41
44-45 48-49
51 52-53 541 56 61 62 71 72 81 91
Agriculture, forestry, fishing and hunting Mining and oil and gas extraction Utilities Construction Manufacturing Wholesale trade Retail trade Transportation and warehousing Information and cultural industries Finance, insurance, real estate and renting and leasing Professional, scientific and technical services Administrative & support, waste management & remediation services Education services Health care and social assistance Arts, entertainment and recreation Accommodation and food services Other services (except public administration) Public administration
431,311 158,805 109,296 962,784
1,943,200 835,184
1,744,286 712,079 409,977
1,218,858 844,429 663,582
1,010,119 1,524,167
303,440 1,135,598
911,595 754,141
All industries
15,672,851
While construction appears as a sub-sector in Table 16.1, this report considers CR&D to be a separate sector. As a result, the coefficient approach for CR&D is addressed separately in Section 16.4 and the estimates compared with the more conventional methodology used in Chapters 5 through 15.
271 Statistics Canada, Labour statistics consistent with the system of national accounts, by job category and NAICS (Table 383-0009), provided February 2004.

The Government of Canada Action Plan 2000 on Climate Change
NRCan / RNCan 180 Mar-2006
16.3 Waste Generation and Characterization Data for the IC&I Sector
Most of the IC&I waste modeling efforts to date have been conducted by consultants for municipal clients or industry associations. Since much of the available data are old or perhaps not wholly representative of the many IC&I sub-sectors indicated in previous tables, more extensive and recent IC&I generation and characterization data need to be assembled through a national effort of like-minded agencies. As a case in point, consider Ontario regulation 102/94 in which a sundry business types (hotels, hospitals, schools, retail, etc.) are required to conduct annual waste audits, prepare related reports and submit them to the Ministry of the Environment upon request. To date this information has not been gathered but nevertheless represents an invaluable and untapped source of IC&I waste characterization data (under the assumption that these audits are actually conducted). An alternative approach was adopted by CIWMB in which they actually conducted 1,200 IC&I waste audits from “dumpsters” right across the state in order to assemble the data required. This undertaking was enormous but also very expensive at US$ 1.5-2 million.272
16.3.1 Waste Generation Data for the IC&I Sector Waste generation by employee by year are available for each of the sub-sectors shown in Table 16.2 from a wide variety of sources some of which are now dated. The primary source of both the generation and composition data is a study prepared by RIS International for this report.273 In addition, the Recycling Council of Alberta (RCA) undertook a review of “waste modeling” work in Canada and this also serves as a source of per employee generation factors (Appendix D). Therefore, two sets of waste generation factors are used to develop waste generation tonnage estimates and these are compared in Table 16.3. In 1993 the Greater Vancouver Regional District (GVRD) hired consultants to prepare a waste flow and recycling audit. As a result of this work, various waste generation rates were calculated for nine industry categories – these rates were assigned to the categories in Table 16.2 as appropriate (e.g. “public administration” is assumed to include NAICS 51, 52-53, 541 and 56). The RCA assembled some waste data of interest during their project to develop a provincial waste characterization framework. Reference is made in the report of the “MK IC&I Model” and some projected tonnes are shown for Ontario in 2002.274 By using
272 Personal communication with Nancy Carr, Waste Analysis Branch, CIWMB, 2003 273 RIS International, March 2004, Summary of Available Data on IC&I Waste Composition, Action Plan 2000 on Climate Change 274 Ibid., p. 24. It is likely that “MK” is Maria Kelleher, one of the principles of RIS International.

The Government of Canada Action Plan 2000 on Climate Change
NRCan / RNCan 181 Mar-2006
Statistics Canada employment data for Ontario it is possible to deduce the per employee generation rates. Table 16.3 provides a summary of waste generation factors from the two sources identified in a previous paragraph. There are two exceptions as noted in the table footnotes.
Table 16.3: Waste Generation Rates (tonnes/employee/year)
NAICS Categories
GVRD study
MK IC&I Model (Ont.)
Agriculture, forestry, fishing & hunting Mining and oil and gas extraction Utilities Manufacturing Wholesale trade Retail trade Transportation and warehousing Information and cultural industries Finance, insurance, real estate and renting & leasing Professional, scientific and technical services Admin. & support, waste mgt. & remediation services Education services Health care and social assistance Arts, entertainment and recreation Accommodation and food services Other services (except public administration) Public administration
0.94 0.94
0.58275 1.48 1.15 1.68 0.97 1.21 1.21 1.21 1.21 0.83
0.34276 1.07 1.07 1.07 1.21
0.75 0.41 0.41 1.91 1.56 1.44 1.44 1.02 0.25 0.54 0.25 0.44 1.31 1.04 2.09 0.84 0.31
As shown in Table 16.3, the waste generation rates can differ greatly and, in a few cases, the rates are significantly different. To reflect the uncertainty of the generation rates, a set of high and low estimates are developed (all rounded to the nearest thousand) in order to provide a range in tonnes generated. Table 16.4 presents the estimated ranges by IC&I sub-sector and calculates percentage figures for both sets of estimates. If an average were taken between the low and high estimates for IC&I tonnage, then it could be estimated that the IC&I sector generates 16,867,000 tonnes per year. According to Statistics Canada, the total amount of waste and recycled material generated in 2002 was 15,075,307 tonnes,277 which falls within the Table 16.4 range but is larger than the average by about 12 percent. In fact, the generation estimate is a fairly reasonable figure. One of the likely reasons for the variance between the generation rates (which include disposal plus recycling) is that WMIS under reports IC&I recycling tonnage. This issue
275 The Utilities (electric power and gas) generation rate is from CH2M Hill Eng., Ltd., 1991, The Physical and Economic Dimensions of Municipal Solid Waste Management in Ontario, Environment Canada 276 Personnel communication with Katherine Fleming of The Ottawa Hospital (4,025 tonnes/year and 11,825 employees), September 2005 277 WMIS 2002, Table A.5

The Government of Canada Action Plan 2000 on Climate Change
NRCan / RNCan 182 Mar-2006
has already been discussed in Section 12.3.2 in which it is asserted that large IC&I generators of recyclable paper (for example) bypass the traditional waste management system by sending their material directly to a recycling facility (in return for revenues).
Table 16.4: Total Waste Generated by IC&I Source in Canada (2002 tonnes) NAICS Categories
Low High Avg. Avg. %
Agriculture, forestry, fishing & hunting Mining and oil and gas extraction Utilities Manufacturing Wholesale trade Retail trade Transportation and warehousing Information and cultural industries Finance, insurance, real estate and renting & leasing Professional, scientific and technical services Admin. & support, waste mgt. & remediation services Education services Health care and social assistance Arts, entertainment and recreation Accommodation and food services Other services (except public administration) Public administration
323,000 65,000 45,000
2,876,000 960,000
2,512,000 691,000 418,000 305,000 456,000 166,000 444,000 518,000 316,000
1,215,000 766,000 234,000
405,000 149,000
64,000 4,330,000 1,303,000 2,930,000 1,025,000
496,000 1,475,000 1,022,000
803,000 838,000
1,997,000 325,000
2,373,000 975,000 913,000
364,000 107,000
54,500 3,603,000 1,131,500 2,721,000
858,000 457,000 890,000 739,000 484,500 641,000
1,257,500 320,500
1,794,000 870,500 573,500
2.2% 0.6% 0.3%
19.9% 6.8%
16.4% 5.2% 2.8% 5.4% 4.5% 2.9% 3.9% 7.6% 1.9%
10.8% 5.3% 3.5%
Total tonnes 12,310,000
21,423,00 16,867,000 100.0%
The next step in the IC&I coefficient approach is the application of characterization data for each of the sub-sectors identified in the previous tables. Once again, various sources of data are used with several caveats: Some of the data are old, most of the sources are Canadian but California Integrated Waste Management Board data are also used, and it is not always certain whether data labelled “generation” include recycling or just disposal amounts. However, since the estimated generation tonnage is 12 percent higher than the Statistics Canada figure, it is assumed that the data are, in fact, tonnes generated. Since the focus of this report is on assessing the opportunity for increased recycling, the materials currently disposed of are of greater interest. Therefore to estimate a disposal figure from the estimated generation number, it is necessary to subtract IC&I materials prepared for recycling, which in 2002 were 3,511,308 tonnes.278 However, this figure is only available as a total for the sector. Ideally, it would be useful to know what the sector specific composition of the total is but these data are unavailable from Statistics Canada. So an alternative approach is adopted: First the tonnes generated are characterized using available data.279 Second, data from the GVRD are used to estimate sector wide recovery rates for specific materials. Third, the resulting total numbers are compared with Statistics Canada data.
278 WMIS, Table A.4, but note that IC&I recycling tonnage figures are likely under reported. 279 The reason for not subtracting total IC&I recyclables from total IC&I waste generated and then applying characterization data, is that most the characterization data in hand concern waste generated.

The Government of Canada Action Plan 2000 on Climate Change
NRCan / RNCan 183 Mar-2006
16.3.2 Waste Characterization Data for the IC&I Sector To develop the required figures, a rudimentary spreadsheet model was created to accommodate the estimated characterization of each IC&I sub-sector identified in Table 16.4. The sub-totals for each material from each sub-sector are summed up and presented in Table 16.5.
Table 16.5: Characterization of IC&I Waste Generated, 2002
Materials
Low High Average Avg. %
Paper Glass Ferrous (mostly) Nonferrous Plastic Organics C&D Wood Textiles Haz-waste Tires Other
4,864,000 434,000 909,000 100,000 912,000
2,642,000 262,000 424,000
12,000 9,000
75,000 1,667,000
9,059,000 814,000
1,430,000 170,000
1,591,000 4,666,000
387,000 638,000
18,000 19,000
112,000 2,519,000
6,961,500 624,000
1,169,500 135,000
1,251,500 3,654,000
324,500 531,000
15,000 14,000 93,500
2,093,000
41.3% 3.7% 6.9% 0.8% 7.4%
21.7% 1.9% 3.1% 0.1% 0.1% 0.6%
12.4%
Total tonnes 12,310,000
21,423,000 16,867,000
100.0%
Numbers may not add up due to rounding. The four largest material groups are paper, organics, other and ferrous metal (which also contains mixed metals according to some of the characterization data used). It should be emphasized that the Table 16.5 data are for materials generated, not disposed.
16.3.3 Calculating a Disposal Rate and Applying Characterization Data Of all the municipalities in Canada, it is possible that the GVRD has done the most analyses of its entire solid waste stream including the flow of IC&I waste and recyclables. For the purposes of this report, it is assumed that the material recovery rates measured in the GVRD in 1991 are approximate enough to be used as proxies for Canada as a whole. The calculated recovery rates are as follows: Paper 38.9 percent, glass 28.6 percent, ferrous, 71.6 percent, nonferrous 72.9 percent, plastics 21.1 percent, and organics 0.8 percent.280 In Table 16.6, the GVRD recovery rates are used to estimate the amount of IC&I material being disposed of across Canada (the “coefficient approach”). For interest’s sake, the numbers developed in Chapters 5 through 15, which are based on Statistics Canada’s WMIS 2002 and local characterization data, are summarized by material and included in Table 16.6 (the “regional approach”). As a result, a range can be derived regarding the composition of IC&I waste disposed of nationally.
280 CH2M Hill Engineering et al., 1993, GVRD Waste Flow and Recycling Audit, Greater Vancouver Regional District

The Government of Canada Action Plan 2000 on Climate Change
NRCan / RNCan 184 Mar-2006
Table 16.6: Characterization of IC&I Waste Disposed (2002 tonnes)
Material
Coefficient Approach
Regional approach
Paper Glass Ferrous (mostly) Nonferrous Plastic Organic Renovation Wood Textiles Haz-waste Tires Other
4,253,500 445,500 332,100
36,600 987,400
3,624,800 324,500 531,000
15,000 14,000 93,500
2,093,000
4,807,000 333,000 538,000
81,000 1,326,000 2,472,000
808,000 369,000 294,000
68,000 26,000
430,000
Total
12,750,900
11,552,000
The WMIS 2002 report states that the total amount of IC&I waste disposed of was 11,563,999 tonnes (rather than the 11,552,066 [exact] tonnes as in Table 16.6)281. The reason for the difference is that 11,933 tonnes of material were shifted from Nova Scotia’s IC&I sector to the CR&D sector (see Section 12.3 for related discussion). In separate work conducted by Statistics Canada, the amount of waste paper not recycled in Canada has been estimated using mill and trade data.282 In 2002, it is estimated that 4,625,000 tonnes of waste paper were not recycled. This estimate and the two projections in Table 16.6 for paper are very close, even though two different people derived those using completely different methodologies. From Table 16.6, comparing the coefficient and regional approaches, it appears that in some cases the range is narrow (e.g. paper, glass, ferrous, plastics, wood and organic material) whereas in other cases the range is great (e.g. textiles, haz-waste and other). For the metal materials, it is estimated that there are between 332,100 and 538,000 tonnes ferrous including mixed metals, as per the characterization data that were used). For nonferrous metals, the range is 36,600 to 81,000 tonnes. Without more comprehensive and representative data sets more precise projections are not possible.
281 WMIS 2002, Table A.2 282 Personal communication with John Marshall, Statistics Canada, Sep-2005.

The Government of Canada Action Plan 2000 on Climate Change
NRCan / RNCan 185 Mar-2006
16.4 Waste Generation and Characterization Data for the CR&D Sector
In the provincial sections, the amount of CR&D waste generated, disposed and recycled is based on WMIS. While there are gaps in the WMIS data due to confidentiality, estimates have been made where required in order to paint a full national CR&D waste and recycling picture. Table 16.7 summarizes the data (the shaded numbers are the estimates). The sector employment data were provided by Statistics Canada283 and are used in this report to calculate the tonnes disposed per employee.
Table 16.7: CR&D Waste Disposal and Recycling, by Province
Province Territory
Sector employees
Disposal (t/employ.)
Disposal (tonnes)
Recycling (tonnes)
Generation (tonnes)
NL PE NS NB QC ON MB SK AB BC North
14,479 4,915
28,646 22,378
164,127 374,187
26,093 25,667
182,570 114,196
5,526
1.38 2.32 1.50 2.47 2.48 2.71 2.99 2.93 3.53 4.04 1.40
19,999 11,426 54,854 55,288
406,800 1,013,985
77,990 75,323
643,590 461,458
7,748
472 500
36,080 8,653
213,000 144,716
8,161 8,292
33,805 100,999
zero
20,471 11,926 90,934 63,941
619,800 1,158,701
86,151 83,615
677,395 562,457
7,748
Canada
962,784 2.94 2,828,461 554,677 3,383,138
Note: The WMIS 2002 total for recycling CR&D recycling is 555,352 tonnes. It does not appear to be possible to allocate the difference (674 t.) among the four provinces with estimated (shaded) numbers, without compromising the WMIS given diversion rates and non-residential recycling totals for each. See Table 4.6. The generation total is similarly affected. Also, this table accommodates the shift of 11,933 t of material disposed to CR&D from IC&I in Nova Scotia (see Table 12.4).
A national disposal coefficient of 2.93 tonnes per employee is derived from the Statistics Canada data in Table 16.7. In comparison, it is interesting to note that the CIWMB uses 2.72 tonnes per employee per year for its CR&D disposal rate.284 A similar figure can be deduced from an Alberta CR&D study: that is, 2.79 tonnes per employee per year.285 There are not a lot of other data to consider, however, two other figures were found that are several orders of magnitude larger in size than those discussed in the previous paragraph. In a 1991 study it was estimated that the median generation rate per employee 283 Statistics Canada, Labour statistics consistent with the system of national accounts, by job category and NAICS (Table 383-0009), provided February 2004 284 See http://www.ciwmb.ca.gov/wastechar/DispRate.htm (accessed September 2005) 285 510,000 tonnes of CR&D waste disposed divided by 182,570 construction employees in Alberta. CG&S Ltd., 2000, Construction, Renovation and Demolition (CRD) Waste Characterization Study, prepared for the Alberta CRD Waste Advisory Committee, p. 7-1;

The Government of Canada Action Plan 2000 on Climate Change
NRCan / RNCan 186 Mar-2006
per day was 29 kilograms286 (which is 10.6 tonnes per year). The other, more recent figure is 22.3 kilograms287 per employee per day (which is 8.1 tonnes per year). At an average of 9.4 t/emp/yr (average of 10.6 and 8.1), this would suggest that some 9 million tonnes of CR&D waste are generated in Canada annually, or considerably more than identified in Table 16.7. In 1993 a benchmark report entitled “Construction and Demolition Waste in Canada”288 estimated the amount of CR&D material disposed of in 1992 was 6,470,871 tonnes (or 6.7 tonnes per employee per year) of which 26.5 percent was road and bridge related (i.e. concrete and asphalt). This latter point is important because WMIS does not include civil engineering waste, particularly that material not managed within the Statistics Canada survey frame. A revised coefficient that excludes the concrete and asphalt estimates is 4.94 tonnes per employee per year.289 This coefficient is closer to the Statistics Canada figure of 2.93 t/emp/yr but still about one and half times larger. As a result, it advisable to estimate the quantity of CR&D waste disposed of in Canada by using a range. Based on the preceding discussion, the proposed range is 2.94 to 4.94 tonnes per employee per year. This would suggest that between 2,828,000 and 4,758,000 rounded tonnes of CR&D waste are disposed of each year. The characterization data used for the CR&D waste stream are discussed at length in Section 4.3 where it is recognized that this material stream is highly heterogeneous and therefore the application of an average set of percentages is fraught with concerns for accuracy and reliability. In Table 16.8, the “coefficient approach” characterization data are based on an audit of CR&D materials sent to Alberta landfills in 2000.290 The total tonnage figure is based on the 4.94 tonnes per employee per year number from the discussion above. The “regional approach” is a summation of the provincial and territorial projections in Chapters 5 through 15 using the Section 4.3 methodology. One interesting statistic from the Alberta CR&D audit not shown in Table 16.8 is that asphalt can be split into pavement (9 percent) and shingles (91 percent) – and, as should be further noted, the audit asserts that most asphalt and concrete are recycled in Alberta (in the hundreds of thousands of tonnes, see Section 17.2 for more discussion). The projections in Table 16.8 are rounded to the nearest thousand.
286 This was a Metro Toronto figure. See CH2M Hill Eng., Ltd., 1991, The Physical and Economic Dimensions of Municipal Solid Waste Management in Ontario, Environment Canada 287 CG&S Ltd., 2000, Appendix II, Table A-35 (actually, this is “waste per man day of work performed”) 288 SENES Consultants Ltd., 1993, Construction and Demolition Waste in Canada: Quantification of Waste and Identification of Opportunities for Diversion from Disposal, Environment Canada and Natural Resources Canada 289 [6,470,871 t. – (1,067,064 t. asphalt + 646,066 t. concrete)] / 962,784 employees = 4.94 tonnes per employee per year (data are from the SENES report) 290 CG&S Ltd., 2000, Construction, Renovation and Demolition (CRD) Waste Characterization Study, prepared for the Alberta CRD Waste Advisory Committee, p. 7-1

The Government of Canada Action Plan 2000 on Climate Change
NRCan / RNCan 187 Mar-2006
Table 16.8: Characterization of CR&D Waste Disposed (2002 tonnes)
Material
Coefficient Approach
Regional Approach
Concrete Asphalt Wood Drywall Ferrous Nonferrous Cardboard/Paper Other
476,000 522,000
1,619,000 620,000
66,000 218,000
n.a. 1,236,000
459,000 216,000 875,000 315,000
24,000 80,000 33,000
826,000
Total
4,758,000 2,828,000
It is evident from Table 16.8 that the two different approaches provide disparate tonnage estimates. This is a true reflection of the fact that CR&D waste characterization is an inexact science. The monitoring and measurement of this material stream is challenged by the fragmented and independent nature of the business. One of the reasons why CR&D waste disposal is difficult to track may be that some of the material may be classified as inert and therefore is deposited as “fill” at unmonitored sites. In any case, from the metal perspective, it is estimated that between 24,000 and 66,000 tonnes of ferrous material are discarded annually from CR&D sites across Canada. The comparable amount of nonferrous metal disposed of is between 80,000 and 218,000 tonnes per year. While the greenhouse gas implications of recycling drywall are less than nonferrous and ferrous metal, it noted that between 315,000 and 620,000 tonnes of drywall are disposed of in Canada on an annual basis. 16.5 Summary The employee coefficient approach for IC&I and CR&D waste materials provides an alternate set of tonnage projections with which to compare the regional approach presented in Chapters 5 through 15. The ranges for each sector are presented in Tables 16.6 and 16.8. The IC&I sector is comprised of hundreds of elements as organized under the NAICS regime. To build a model to generate waste quantities and characteristics is fairly straight-forward; however, assembling the data to populate such a model is the primary challenge at hand. Perhaps the first step in considering such a project is to address some fundamental questions: Who would use the data? What are their interests and requirements? Would better understanding of the waste stream lead to increased recycling initiatives?

The Government of Canada Action Plan 2000 on Climate Change
NRCan / RNCan 188 Mar-2006

The Government of Canada Action Plan 2000 on Climate Change
NRCan / RNCan 189 Mar-2006
Chapter 17 Selected Mineral and Metal Residual Materials
17.1 INTRODUCTION .....................................................................................................189 17.2 RESIDENTIAL AND IC&I SECTORS ........................................................................191
17.2.1 Tires .........................................................................................................191 17.2.2 White Goods.............................................................................................194 17.2.3 Electronic and Electric Equipment..........................................................196 17.2.4 Automobile Hulks.....................................................................................198 17.2.5 Lead-Acid Batteries .................................................................................207
17.3 CIVIL ENGINEERING SECTOR ................................................................................209
17.3.1 Concrete ..................................................................................................209 17.3.2 Asphalt ....................................................................................................214
17.4 INDUSTRIAL SECTOR ...........................................................................................223
17.4.1 Electric Arc Furnace Dust ......................................................................223 17.4.2 Coal Fly Ash ............................................................................................230 17.4.3 Ferrous and Nonferrous Slag ..................................................................235 17.4.4 Foundry Sand ..........................................................................................239 17.4.5 Mine Wastes ............................................................................................239
The Government of Canada Action Plan 2000 on Climate Change
NRCan / RNCan 190 Mar-2006
17.1 Introduction Chapters 5 through 16 have quantified and characterized the “waste” materials that are presently disposed of across Canada. These materials occur within one or all three of the study’s three framework areas: (1) residential, (2) institutional, commercial and industrial (IC&I), and (3) construction, renovation & demolition (CR&D). However there are two exceptions to consider when developing national projections:
� One, the inclusion of industrial “waste” materials within the IC&I sector – as it is commonly understood – is probably an incorrect approach to take since industrial systems are often managed independently via on-site treatment, stockpiling or direct arrangements with recycling businesses. In these cases, the Statistics Canada Waste Management Industry Survey does not include these data.291
� Two, there are a number of “waste” materials that are not adequately covered by
the municipal characterization studies that have been consulted thus far in the report. Further, the Action Plan 2000, Enhanced Recycling program has funded other studies to examine certain materials and these can be used to inform this report (e.g. tires, white goods and electronics).
For the purposes of this report, the mainly mineral and metal materials covered in this chapter are organized into three sections: Residential and IC&I sectors, Civil engineering sector, and industrial sector.
291 Various discussions with John Marshall, Statistics Canada, 2005

The Government of Canada Action Plan 2000 on Climate Change
NRCan / RNCan 191 Mar-2006
17.2 Residential and IC&I Sectors Five different “waste” materials are covered in this section: used tires, white goods (large appliances), electronic and electrical equipment waste, automobile hulks (including catalytic converters and auto shredder reside), and spent lead acid batteries.
17.2.1 Tires A report entitled “Scrap Tire Recycling in Canada” was funded by Action Plan 2000, Enhanced Recycling program and conducted by the CANMET Materials Technology Laboratory of NRCan.292 This section summarizes the tire report’s findings specifically with respect to the quantity of tires generated, recycled, stockpiled, used as a fuel source and/or disposed of. According to the CANMET tire study, all provinces that have a tire stewardship program have also banned tires from landfill disposal. Ontario is the only exception but a program is currently under review by the Ministry of the Environment and implementation is likely in 2006. Regardless, it is likely that many municipal landfills in Ontario have introduced their own tire bans for operational or public health reasons (i.e. tires in the open may hold water, breed mosquitoes and become a source for the West Nile Virus). The net result is that currently, it is assumed that virtually no passenger or truck tire in Canada is disposed of at the end of its life except those in the Yukon, Northwest Territories, Nunavut and remote provincial regions. The typical composition of materials that comprise a passenger tire in North America is illustrated in Figure 17.1. Passenger tires weigh 11 kg when new and about 9 kg at the end of their life. Comparative statistics for truck tires are 54 and 45 kilograms. In addition to weight, the difference between passenger and truck tires is rubber content: 14% and 27% respectively.
Figure 17.1: Typical Composition of a Passenger Tire in North America 293
292 A. Pehlken & E. Essadiqi, 2005, Scrap Tire Recycling in Canada, Action Plan 2000, CANMET MTL, NRCan 293 Pehlken & Essadiqi reference www.rma.org
Natural rubber14%
Synthetic rubber27%
Carbon black27%
Steel15%
Fibre, fillers, etc. 17%
Natural rubber14%
Synthetic rubber27%
Carbon black27%
Steel15%
Fibre, fillers, etc. 17%

The Government of Canada Action Plan 2000 on Climate Change
NRCan / RNCan 192 Mar-2006
Since carbon black is generally sourced from petroleum, the tire material of greatest recycling interest to Natural Resources Canada (Minerals and Metals Sector) is the steel component. A more detailed review of the data on tires suggests steel varies from 10 to 14 percent,294 so considering the 15 percent figure shown in Figure 17.1 considerable uncertainty or variance remains as to the exact magnitude of tire steel. According to one of the Pehlken & Essadiqi references, the quality of steel recovered from waste tires is typically inconsistent or poor, but it can be marketed when demand for steel is high.295 Regardless of the steel quality, what are the national estimates for the steel found in scrap tires? Table 17.1 provides projections for all of Canada taking into account the 10 and 14 percent figures indicated in the previous paragraph.
Table 17.1: Potential Weight of Steel Recovered from Scrap Tire Processing296
Province
Minimum tonnes
Maximum tonnes
Alberta British Columbia Manitoba New Brunswick Newfoundland & Labrador Nova Scotia Ontario Prince Edward Island Quebec Saskatchewan
1,968 2,296
738 656 328 574
8,446 164
6,642 902
2,834 3,306 1,063
945 472 827
12,162 236
9,564 1,299
Canada
22,714 32,708
In contrast only three provinces report the actual amount of steel recovered on an annual basis and that is 5,726 tonnes (see footnote #296). From a product stewardship perspective, it would be interesting to know whether the steel fraction is actually being recovered and, if so, where it is going. It is likely that such data is either hard to measure or confidential, but the gap between the reported 5,726 tonnes and Table 17.1 projections is certainly wide. To put the steel tonnage into context, Table 17.2 provides a summary of tires processed and/or generated in 2003 or 2004. The variances in the data highlight the ongoing challenge of monitoring and measurement.
294 Ibid. p. 40 295 CalRecovery Inc, Ralph Hoag Consulting, CalRecovery Europe Ltd., and SDV/ACCI, 2003, Assessment of Markets for Fiber and Steel Produced from Recycling Waste Tires, California Integrated Waste Management Board (CIWMB), Publication Number 622-03-010 296 Pehlken & Essadiqi, Table 6-4, p. 39

The Government of Canada Action Plan 2000 on Climate Change
NRCan / RNCan 193 Mar-2006
Table 17.2: Estimated Total Weight of Scrap Tires in Canada 297
Scrap tires in metric tonnes per year Province
Provincial Data Rubber Assoc. of Canada
British Columbia Alberta Saskatchewan Manitoba Ontario Quebec New Brunswick Nova Scotia Prince Edward Island Newfoundland and Labrador
28,346 28,493 11,966 12,099
101,737 54,883 6,417 7,478 1,148 3,280
22,960 19,680 9,020 7,380
84,460 66,420 6,560 5,740 1,640 3,280
Canada
255,848 227,140
The potential for increased tire recycling in Canada is off-the-road tires or OTR, which are the ones used in the mining, forestry and agriculture sectors. These tires can be enormous (up to 15 feet diameter and as much as 1,400 kg.) with a natural rubber content of 100 percent for mining tires.
Photo credit298 The actual amount of OTR tires generated in Canada is estimated to be between 172,500 and 345,000 tonnes per year with 50 percent in the west, 23 percent in Ontario, 23 percent in Quebec and 4 percent in the Maritimes.299 If it is assumed that the steel component is 15 percent (based on passenger and truck tires), then between 26,000 and 52,000 tonnes of steel are potentially available for recovery from OTR tires in Canada. The current obstacles to recovery are the tires are typically used in remote locations, the cost of processing is very high (about $200 per tonne) and there are no stewardship programs for OTR tires.
297 Ibid. 298 http://www.sermonaudio.com/newsimages/imdf27072001062357a.jpg (Jan-2006) 299 Pehlken & Essadiqi, Table 6-5
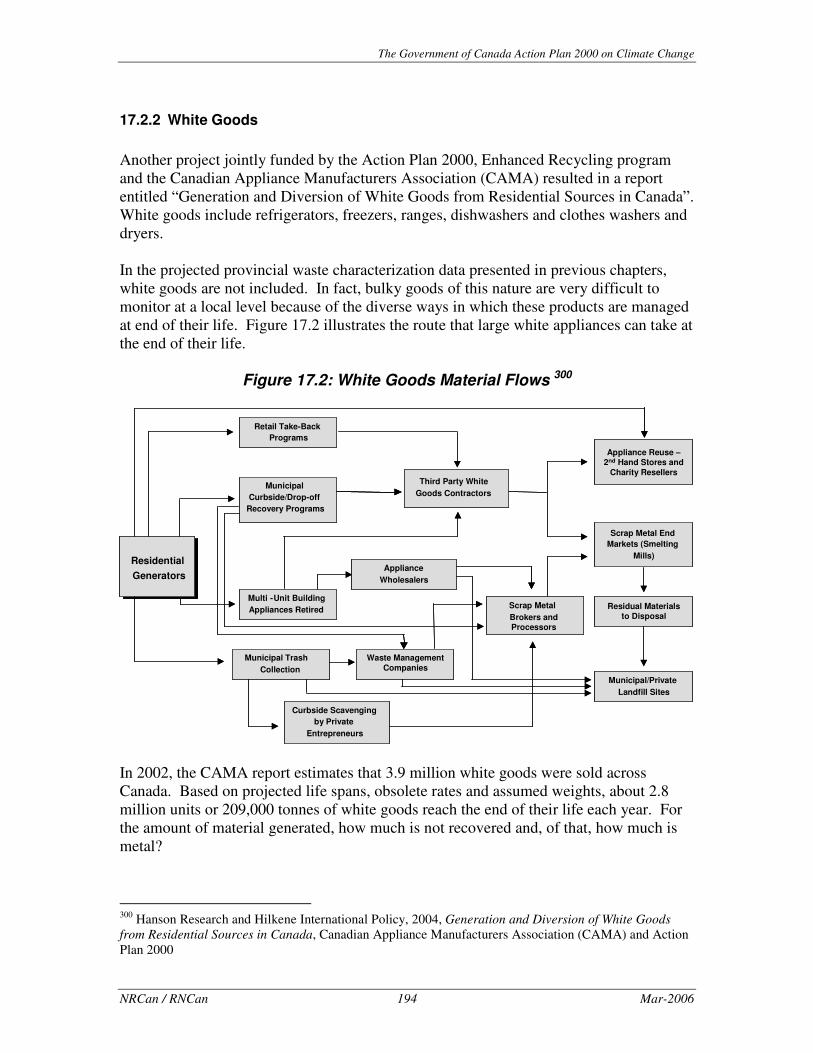
The Government of Canada Action Plan 2000 on Climate Change
NRCan / RNCan 194 Mar-2006
17.2.2 White Goods Another project jointly funded by the Action Plan 2000, Enhanced Recycling program and the Canadian Appliance Manufacturers Association (CAMA) resulted in a report entitled “Generation and Diversion of White Goods from Residential Sources in Canada”. White goods include refrigerators, freezers, ranges, dishwashers and clothes washers and dryers. In the projected provincial waste characterization data presented in previous chapters, white goods are not included. In fact, bulky goods of this nature are very difficult to monitor at a local level because of the diverse ways in which these products are managed at end of their life. Figure 17.2 illustrates the route that large white appliances can take at the end of their life.
Figure 17.2: White Goods Material Flows 300
In 2002, the CAMA report estimates that 3.9 million white goods were sold across Canada. Based on projected life spans, obsolete rates and assumed weights, about 2.8 million units or 209,000 tonnes of white goods reach the end of their life each year. For the amount of material generated, how much is not recovered and, of that, how much is metal?
300 Hanson Research and Hilkene International Policy, 2004, Generation and Diversion of White Goods from Residential Sources in Canada, Canadian Appliance Manufacturers Association (CAMA) and Action Plan 2000
Residential Generators
Municipal Trash Collection
Municipal/Private Landfill Sites
Third Party WhiteGoods Contractors
Municipal Curbside/Drop-off
Recovery Programs
Multi -Unit Building Appliances Retired
Retail Take-BackPrograms
Appliance Wholesalers
Scrap Metal End Markets (Smelting
Mills)
Residual Materials to Disposal
Scrap Metal Brokers and Processors
Curbside Scavenging by Private
Entrepreneurs
Appliance Reuse –2nd Hand Stores and
Charity Resellers
Waste ManagementCompanies

The Government of Canada Action Plan 2000 on Climate Change
NRCan / RNCan 195 Mar-2006
The amount of white goods recovered in Canada is estimated to be between 74 and 92 percent. This would suggest that between 16,720 and 54,340 tonnes of whites goods are not being recovered each year or 36,000 t on average. The amount of metal contained in this material is estimated to be 67 percent ferrous, 8 percent nonferrous and 25 percent plastics and other material. The following discard rates are based on the 36,000 t average: 23,800 tonnes of ferrous, 2,800 tonnes of nonferrous and 8,900 tonnes of plastics and other material. The nonferrous metal can be sub-divided further into aluminum (46 percent), copper (41 percent), brass (2 percent) and other metal (12 percent).301 On the recovery side, Figure 17.3 identifies where all of the white goods typically go. Municipal white good programs appear to recover the most appliances – they take many forms as described in the CAMA report. Retail represents the appliances that are “taken back” when new ones are purchased. Scavenging occurs when the appliances sit at the curbside and scrap prices are high. Multi-unit buildings tend to manage white goods privately, separate from any service that the local municipality may offer. Disposed white goods are the ones that are effectively lost to recovery (although landfill mining might unearth them sometime in the future).
Figure 17.3: End-of-life Management of White Goods 302
The quantity of metals recovered in 2002 from recycled white goods is estimated to be 121,000 tonnes of ferrous, 6,700 tonnes of aluminum, 6,200 tonnes of copper (including some brass) and then 1,800 tonnes of other metal.
301 Much more detailed characterization data are available in the Hanson and Hilkene report. See Table 6.1. 302 Hanson and Hilkene, p. 84
Municipal 39%
Retail 29%
Disposed 7%
Scavenging 19%
Multi-unit bldgs 2%
Resale/donation 4%Municipal 39%
Retail 29%
Disposed 7%
Scavenging 19%
Multi-unit bldgs 2%
Resale/donation 4%

The Government of Canada Action Plan 2000 on Climate Change
NRCan / RNCan 196 Mar-2006
In summary, the efforts to recover white goods work well especially in comparison to other countries (according to the CAMA study). While more standardized reporting protocol for municipal and retail players is recommended in the report, the ways and means of increasing Canada’s recovery of white goods (the remaining 8 to 26 percent) is not specified.
17.2.3 Electronic and Electric Equipment A small but growing part of the residential and IC&I waste stream is electronic and electrical equipment, also referred to as EEE, WEEE (Waste EEE) or e-waste. Generally speaking, EEE does not appear in many waste characterization studies but this is starting to change with the increasing interest that this stream of materials is attracting, for two reasons: Valuable metallic materials are being lost and some of the metal content may have a negative environmental impact. Given these concerns, recent studies have attempted to shed some light on the nature and magnitude of e-waste in Canada and these efforts are referenced below. The questions that need to be answered are what products are included in this category, how much e-waste is generated (disposed plus recycled), and specifically what and how much recyclable material is potentially available for recovery?
The definition of EEE and the products that are included or excluded determines the quantity of material generated. In Ontario, EEE is defined as any item that requires an electrical current, which includes some 206 different pieces of equipment such as appliances; information technology; audio/visual; toys, leisure and sports; and tools, navigational, measuring, medical and control instruments.303 In comparison, Alberta’s new Electronic Recycling Program targets televisions and computer equipment.304 Alberta’s list of materials mirrors the one established by Electronics Product Stewardship Canada.305 In response to a 2004 request from the Ontario Minister of the Environment, Waste Diversion Ontario commissioned a study on waste electronic and electrical equipment. A detailed report was completed in 2005 and is posted on the WDO web site.306 For the 303 See http://www.e-laws.gov.on.ca/DBLaws/Source/Regs/English/2004/R04393_e.htm (Nov-2005) 304 See http://www.albertarecycling.ca/default.cfm (Nov-2005) 305 See http://www.epsc.ca/index.html (Nov-2005) 306 See http://www.wdo.ca/content/?path=page80+item63446 (Jan-2006)

The Government of Canada Action Plan 2000 on Climate Change
NRCan / RNCan 197 Mar-2006
purposes of developing estimates for Canada, the WDO report is used. The equipment of interest falls into three categories: information technology (IT), telecommunications (“Telcom”) and audio-visual (AV). Table 17.3 presents the projected quantities of EEE sold, retained, recovered and disposed in Canada, based on the WDO report. The estimated recycling rate for end-of-life EEE is 1-2 percent.
Table 17.3: Estimated 2002 Quantities of EEE in Canada
Equipment
Tonnes Sold
Tonnes Retained
Tonnes Recycled
Tonnes Disposed
IT Telcom
AV
60,200 3,400
165,300
10,200 600
34,900
1,500 100
1,300
48,500 2,700
129,090
Total
228,900 45,700 2,900 180,300
Note: The data are based on Ontario estimates for 2005. The national projections for 2002 are derived by using total Canadian population, which are from Statistics Canada WMIS 2002, referenced throughout this document. The estimates were rounded to the nearest hundred.
In comparison, an earlier study conducted for Environment Canada estimated that 6 percent of all EEE was recycled in Canada in 2002 (out of a total 167,331 tonnes of material generated).307 Even a 2 to 6 percent recycling rate suggests that there is an opportunity for increased recovery activities in this area. Of the estimated quantity of e-waste disposed, how much recyclable material is potentially available for recovery? To answer this question, a full material analysis of each item is required but those detailed data are not available for this report. However, another study co-funded by Enhanced Recycling (Action Plan 2000 on Climate Change) estimates general, weighted material composition numbers for an array of selected EEE items (computers, monitors, peripherals, rechargeable batteries, televisions, telephones and printed circuit boards).308 Under the assumption that the aforementioned characterization data can be applied against all EEE items, Table 17.4 provides a very rough estimate of the materials that could be found in these end-of-life products.
307 RIS International Ltd., 2003, Information Technology (IT) and Telecommunication (Telecom) Waste in Canada – 2003 Update, Environment Canada 308 PHA Consulting Associates, 2005 draft, Electronic Waste Recovery Study, Resource Recovery Fund Board, Action Plan 2000 (plus several other funding agents)

The Government of Canada Action Plan 2000 on Climate Change
NRCan / RNCan 198 Mar-2006
Table 17.4: Estimated Material Composition of EEE
Material
Percent Tonnes
Glass Ferrous Copper Aluminum Other metal Plastics Other material
27.1% 29.1%
3.4% 2.7% 8.4%
21.5% 7.7%
48,861 52,467 6,130 4,868
15,145 38,765 13,883
Total 100.0% 180,300
Based on these approximate estimates, it would appear that disposed EEE contains almost 79,000 annual tonnes of metallic material. The comparable figure for the United States is about 1.7 million annual tonnes, which is an interesting point since Canadian businesses such as Noranda and TechCominco need foreign supplies of discarded EEE to remain competitive.
17.2.4 Automobile Hulks309 Automobile hulks refer to scrapped automobiles, most of which are recovered given the well-established recycling infrastructure in Canada and the high value of most metals. Statistics Canada reports that a total of 25.1 million vehicles were registered in 2004. Of this total:
� 19 million were road motor vehicle registrations; � 4.5 million were trailers � 1.5 million were off-road, construction and farm vehicles.
Within the road motor vehicle category:
� 17.92 million were road motor vehicles weighing less than 4,500 kg � 389,810 weighed 4,500 to 15,000 kg � 285,000 weighed more than 15,000 kg � 77,447 were buses and � 408,706 were motorcycles and mopeds.
Most cars are reportedly scrapped after an operating life of a life of 11 to 15 years.310 Automobile Recyclers of Canada (ARC) use a “rule of thumb” that one million auto hulks are discarded in Canada each year,311 based on 6 percent of the fleet being retired
309 The background research for this section was conducted and reported on by Kelleher Environmental. 310 Recycling Council of Ontario, 1999, Management of End of Life Vehicles (ELVs) in Ontario, Report, Proceedings and Draft Recommendations of the RCO Roles and Responsibilities Forum, 28th April, 1999

The Government of Canada Action Plan 2000 on Climate Change
NRCan / RNCan 199 Mar-2006
on an annual basis. The one million autos per year estimate was confirmed with Steve Fletcher of Auto Recyclers of Canada (ARC) in December, 2005, although the comment was made that it is a “soft” number. The Ontario Ministry of Transportation estimates that approximately 6 percent of the provincial fleet ends up in scrap yards each year. The Recycling Council of Ontario applied the same end-of-life rate nationally, and estimated that 1,080,000 end-of-life vehicles (ELV) ended up in scrap-yards in Canada in 1998. Given that the number of registered vehicles has stayed at about the same level in 2004, a similar number (about 1 million vehicles) are expected to be scrapped in 2004. A report on catalytic converters estimated that 11 to 12 million cars are scrapped annually in the US and an additional 1 to 1.5 million312 units will be scrapped in Canada in 2004 (more discussion on catalytic converters later in this section). The mix of vehicle types has been constantly changing over time to reflect changes in social demographics and needs (i.e. the trend to larger sport utility vehicles). Metal and material composition varies by type of car. For example, a typical 1999 car contains about 127 kg of aluminum, but some cars (e.g. the Ford Lincoln LS) may contain up to 218 kg. The 2000 model year of the Audi A8 is manufactured from approximately 38 percent aluminum. The U.S. Council for Automotive Research (USCAR) estimates that about 1,020 kg (2,250 pounds) of materials are usually recovered (through reuse and recycling) per vehicle. That is about 69 percent by weight of an average vehicle. Most of the material recovered is metal, with a very small quantity of plastics and rubber.
Photo credit313 Table 17.5 outlines the metal and material content in a typical 1999 family vehicle using the most recent data on automotive composition from the Ward's Automotive Yearbook, 1999314. The composition is presented in broad categories. Table 17.5 assumes that 1 million automobiles are scrapped annually with an average weight of 3,274 pounds.315 Under these assumptions, it is estimated that 1,488,300 tonnes of automotive “waste” material are processed annually in Canada.
311 Personal communication between Steve Fletcher and Kelleher Environmental 312 Recycling Today online; Tuned Up by Curt Harler, 15th June, 2005 313 http://www.lib.berkeley.edu/WRCA/bayfund/2002_1/photo1.html (Jan-2006) 314 The information provided to RCO courtesy of the Canadian Vehicle Manufacturers' Association (CVMA)]. 315 Source: Ward's Automotive Yearbook, 1999

The Government of Canada Action Plan 2000 on Climate Change
NRCan / RNCan 200 Mar-2006
It is estimated that 95 percent of all vehicles in the US go through a market driven recycling infrastructure,316 and the auto hulks are recycled for ferrous and non-ferrous metal recovery. Therefore, based on an estimated 1 million autos per year retired each year in Canada, up to 50,000 autos could still be abandoned. Nova Scotia reported 4,500 to 6,900 vehicles abandoned yearly in the Province.317 Extrapolating this reported number to all of Canada, on the basis that Nova Scotia represents 2.9 percent of the national population, an estimated 155,000 to 237,000 cars could be abandoned across Canada each year. This figure is likely overstated, as most of Canada is well served by metal shredders who provide a market for auto hulks.
Table 17.5: Estimated Materials in Discarded Auto Hulks
Component Pounds per vehicle
Kg per vehicle
Percent by weight
Tonnes/year
Steel and ferrous metal Plastic and plastic composites Aluminum Copper and brass Powder metal parts Zinc Magnesium Fluids and lubricants Rubber Glass Other Materials
2,157.5 245.0 236.0
45.5 35.0 12.0
7.0 194.0 142.0
97.0 103.0
980.7 111.4 107.3
20.7 15.9
5.5 3.2
88.2 64.5 44.1 46.8
66% 7.5% 7.2% 1.4% 1.1% 0.4% 0.2% 5.9% 4.3% 2.9% 3.1%
980,700 111,400 107,300
20,700 15,900 5,500 3,200
88,200 64,500 44,100 46,800
Total
3,274.0 1,488.3 100.0% 1,488,300
The metallic content of automobiles varies from vehicle to vehicle, and from country to country. The data in Table 17.5 suggest that nonferrous and ferrous metal make up about 76 percent of a vehicle by weight:318 These materials are captured in the metal shredding operation and subsequent nonferrous metal recovery processes. The remaining 24 percent of the vehicle becomes Automobile Shredder Residue (ASR), which is typically landfilled across Canada. This would suggest that Canada generates about 357,000 tonnes of ASR annually. Once all the fluids have been drained and parts have been removed, as shown in Figure 17.4, the automotive recycler employs the services of an automobile crusher to flatten the vehicle hulk. These flattened hulks are shipped to shredders that pulverize the car into fist-sized pieces of steel in minutes. Ferrous and non-ferrous metals are removed magnetically, and with complex floatation systems. The non-metallic components,
316 USCAR Vehicle Recycling Partnership Works to Optimally Recycle End of Life Vehicles, www.uscar.org 1st November, 2005 317 RCO, 1999 318 The 76 percent metal content figure is substantiated in a British report that can be found at www.wasteonline.org.uk/resources/InformationSheets/vehicle.htm (Jan-2005)

The Government of Canada Action Plan 2000 on Climate Change
NRCan / RNCan 201 Mar-2006
known as Auto Shredder Residue (ASR) or fluff, are generally landfilled. ASR is composed of rubber, plastics, fabric, dirt, foam, glass and metal particles. Figure 17.4 illustrates the manner in which end-of-life vehicles are managed in Canada.
Figure 17.4: Management Flow for End-of-Life-Vehicles (ELV)
The composition of autos has changed over the last number of years, with a focus in some cases on making cars lighter, through the use of more plastics and aluminum. This alters the steel content of auto hulks, which was traditionally the material of interest in auto shredding. There is an increasing interest in the nonferrous component of auto hulks, which is recovered and processed, as this provides a large revenue stream to recyclers.
Ferrous Metals/ Steel
Sale
-Auto Recyclers-Salvage Yards-Scrap Metal Recyclers-Dealers, Body Shops, Tow-Individuals
Tires, Fluids, etc.
Reusable Parts, Batteries, CFCs
Landfill Disposal
ASR – Air Separation Residues
Landfill (24% by weight)
Sale (70% by weight)
Sale (6% by weight)
Non-ferrous / Al, ZN, Cu,
Pb
Dismantling Shredding Operations
Magnetic Separation
Non-Magnetic Separation
Air Separation
ELV of Life
Vehicle

The Government of Canada Action Plan 2000 on Climate Change
NRCan / RNCan 202 Mar-2006
(�����#������� ������
ASR is also getting more attention, particularly in Europe, where the ELV Directive requires the auto industry to achieve an 85 percent recovery rate. This cannot be achieved unless ASR is recycled. The composition of ASR is shown in Figure 17.5. As with the content of the whole vehicle, ASR varies greatly. Data from the US suggest that the main components of ASR are 50 percent “fluff” (paper, fabric and lint), 3-10 percent metal, 18-22 percent rubber, and 15-27 percent plastic, plus residual moisture.319 ASR data may include white goods that have been processed as well (this may increase the metal content).
Figure 17.5: Estimated Composition of Auto Shredder Residue (ASR) 320 Research has been on-going for over 20 years to find uses for ASR. Options considered include (1) landfill cover, (2) thermal processing to recover energy and other materials, and (3) substitute fuel for coke in blast furnaces and steel mills. ASR is a good material for landfill cover, as it has good metal absorbing characteristics, has good compressibility characteristics, and takes up considerably less space than traditional landfill cover. In California, stabilized ASR is an accepted landfill cover. It has advantages over the usual soil in that much less is required on a daily basis and the material provides better traction for bulldozers and other heavy equipment when conditions are wet. The Environment and Plastics Industry Council (EPIC) and American Plastics Council tested ASR as a substitute for coke. One of the reported benefits was improved air emission.321 Since the organic fraction of ASR has a calorific value somewhat better than coal it could be considered as a fuel in properly designed facilities. Some of the 319 Jan Schut, 2005, Commingled Plastic Waste: New Gold Mine for Automotive Processors, Plastic Technology (www.plastictechnology.com Sep-2005) 320 The pie chart data: J. Staudinger and G. A. Keoleian, 2001, Management of End-of Life Vehicles (ELVs) in the US, Centre for Sustainable Systems, University of Michigan, p. 23; The table data: M. Day & J. Shen, 1997, Automobile Shredder Residue – An Assessment of Thermal Recycling as a Recovery Option, National Research Council (It is assumed that 18% is moisture, which is close to the pie chart). 321 See http://www.cpia.ca/files/files/files_techtalk2Q98.pdf (Jan-2006)
Plastics31%
Rubber8%
Glass12% Carpet, textile, etc.
14%
Dirt and Metal Fines 20%
Moisture15%
Plastics31%
Rubber8%
Glass12% Carpet, textile, etc.
14%
Dirt and Metal Fines 20%
Moisture15%
Elements percentCarbon 29%Hydrogen 4%Oxygen 20%Iron 12%Silica 8%Calcium 2%Aluminum 1.5%Chlorine 1%Nitrogen 1%Zinc 1%Copper 1%Lead, cadmium, chromium 1%
82%
Elements percentCarbon 29%Hydrogen 4%Oxygen 20%Iron 12%Silica 8%Calcium 2%Aluminum 1.5%Chlorine 1%Nitrogen 1%Zinc 1%Copper 1%Lead, cadmium, chromium 1%
82%

The Government of Canada Action Plan 2000 on Climate Change
NRCan / RNCan 203 Mar-2006
techniques learned in the steel research supported by EPIC would have to be applied to feed the material along with pulverized coal. In the US, the Vehicle Recycling Partnership (VRP), which is a committee of the US Council for Automotive Research (USCAR) has put considerable effort into researching alternative uses for ASR. In 1991 Daimler-Chrysler, Ford and General Motors formed the USCAR VRP (Vehicle Recycling Partnership). USCAR has a Research and Development Agreement (CRADA) with the American Plastics Council and the US Department of Energy’s Argonne National Laboratory that extends to 2015. The CRADA is working on a number of projects that will allow the recovery of materials such as plastics from ASR. In addition, the VRP has a Task Force dedicated to removing substances of concern found in shredder residue.322 A coalition was formed that was known as the Energy Recovery Coalition of Ontario (ERCO). Its membership was made up of EPIC, two cement companies, several auto shredders and a shipping company. ERCO's purpose was to set up a process to deliver and use ASR in a cement kiln. ASR provided energy and the residual ferrous oxide is an ingredient for cement. A full-scale test was to have been conducted in a highly monitored cement kiln in Bowmanville, Ontario but the license was pulled and the coalition folded. In 2000, EPIC and the American Plastics Council hired the Competitive Analysis Centre in Ottawa to carry out a feasibility study to prepare and use shredder residue in a blast furnace.323 A hypothetical process was developed to separate the organic fraction of ASR and prepare it for injection into a blast furnace. ASR provides several benefits to the reduction of iron ore. It supplies energy from its carbon content and it serves as a reductant by virtue of its hydrogen content. The result is that less coke is required in the process. Coke is expensive and its production results in various environmental impacts. The economic analysis showed that there was an appreciable financial return to the use of ASR but several million dollars were required to set up the handling systems for ASR. There was interest in the concept, but economic conditions for the entire steel industry were poor at the time, so this option was not pursued. There have been some attempts to produce moulded products from ASR. EPIC contracted the National Research Council to carry out some research over ten years ago. There are challenges in getting the ASR to stick together for manufacture into moulded products since a lot of the plastics in ASR are polyurethane’s, mineral and glass filled nylon & PET, polycarbonates etc. ASR generated by Wheat City Metals is used by XPotential Products to make impact products such as fence posts and curbs for use in Regina and surrounding areas. XPotential also has a plant in Winnipeg so their total capacity for both locations is 82 tonne per day.324
322 USCAR Vehicle Recycling Partnership Works to Optimally Recycle End of Life Vehicles www.uscar.org (Nov-2005) 323 See http://www.environmental-center.com/articles/article923/automotive.pdf (Jan-2006) 324 See http://www.xpotentialproducts.com/main.htm (Mar-2006)

The Government of Canada Action Plan 2000 on Climate Change
NRCan / RNCan 204 Mar-2006
Innovative recovery approaches to ASR are likely to come from Europe given the EU End-of-Life (ELV) directive that stipulates an 85 percent recycling rate for all automobiles by 2000 – this cannot be achieved with out further processing of ASR. Two companies involved in advanced ASR processing are Comet Sambre325 (Belgium) and SiCon GmbH326 (Germany). The following image shows the SiCon material flow and some mass balance data.327
35.4% Granules 28.4% Fibres 26.4% Sand 3.1% Nonferrous 3.6% Ferrous 0.8% Dust 2.4% Water
��������������������
Catalytic converters are stainless steel boxes mounted in the exhaust system of a car (and more recently, motorbikes). Catalytic converters have been installed in cars since the 1970’s to reduce air pollution. They are designed to eliminate carbon monoxide, nitrous oxides and hydrocarbons by reacting them with excess oxygen on a platinum catalyst. The ceramic or metallic support holds a catalyst that oxidizes carbon monoxide and hydrocarbons to carbon dioxide and water while reducing nitrogen oxides (Nox) to nitrogen:
� The reduction catalyst uses platinum or rhodium to help reduce NOx emissions. � The oxidation catalyst is platinum or palladium.
Together, platinum, rhodium and palladium are referred to as the Platinum Group Metals (PGM). In 2003, the recovery of platinum from recycled auto-catalysts worldwide was estimated at 645,000 ounces; recovery of palladium waste estimated at 410,000 ounces and the recovery of rhodium was estimated at 123,000 ounces.328 Figures for 2004 were
325 See http://www.osd.org.tr/23.pdf (Jan-2006) 326 See www.sicontechnology.com (Jan-2006) (in German only). Also see “Avoiding the Landfill”, Recycling International, Dec-2005, No. 10, pp. 26-27 327 Personal communication with Florian Haug, [email protected]; Image credit: http://www.mobility-and-sustainability.com/buster/buster.asp?i=_content/22686.asp 328 Source: IPA member Johnson Matthey, Platinum, 2004 at www.platinuminfo.net (Dec-2005)

The Government of Canada Action Plan 2000 on Climate Change
NRCan / RNCan 205 Mar-2006
estimated at 730,000 oz platinum, 450,000 oz palladium and 120,000 oz rhodium.329 The numbers are expected to increase sharply by 2010, with the increasing retirement of autos equipped with catalytic converters in Western European countries. This trend has already occurred in the US and Canada, where mandatory installation of catalytic converters occurred earlier than it did in Europe. The late onset of pollution legislation in Europe in the 1990’s (i.e. manufacturers are required to fit catalytic converters onto cars), coupled with the extended life of cars in eastern Europe are cited as some of the reasons for the slower recovery and expected jump by 2010. With a 10-12 year life, these autos are approaching retirement The prices of the PGM are the motivator for recycling:
� Platinum moved from $450 to $937 per ounce in 2004. The reason for the increase was the demand for catalytic converters in diesel cars, which make up 50 percent of the cars in Europe.
� Palladium was worth $148 per ounce, compared to $1,100 per ounce a few years earlier. The reason given for the price drop is the oversupply situation for nickel, which is mined at the same locations;
� Rhodium is around $800 per ounce, compared to $7,000 per ounce in the early 1990’s.
Recent designs have substituted palladium for platinum because of the more favourable price,330 and also because concerns regarding palladium supply have decreased, as Russia is reported to have 4-6 million ounces stockpiled.331 A new industry has sprung up around the need to recycle platinum group metals (PGM) from catalytic converters at the end of a vehicle’s life. It involves modern car dismantlers, scrap yards and workshops as well as specialist companies to collect and warehouse the catalytic converters. Converter supply channels have become organized into loose networks of one-truck collectors, vehicle dismantling yards, scrap yards, auto parts dealers, aftermarket converter manufacturers, used converter refurbishers and other lot consolidators. Each network is managed by a “lot consolidating” firm that in turn supplies a smelter/refiner with the final PGM production steps. A lot consolidating firm holds its supply network together with credibility. The aggregator recycles the converters in larger volumes; most companies deal through an aggregator. The network includes extractors and refiners of PGM, including some PGM mining companies, trading companies, commodities brokerages and vehicle manufacturers. Influx and turnover among participants is high.
329 Source: Ashok Kumar, A-1 Specialized Services and Supplies Inc. Pennsylvania, Tuned Up – Catalytic Converter Recycling; Curt Harler, 15th June, 2004 330 Spring Forward, Curt Harler, “Recycling Today”, June 2005 331 Ibid.

The Government of Canada Action Plan 2000 on Climate Change
NRCan / RNCan 206 Mar-2006
The recycling of catalytic converters is somewhat seasonal. Prospera Metals of Petrolia, Ontario reported recycling 10,000 units per week in spring, which was twice the winter rate.332 Auto salvage yards and muffler shops remain the key sources.
333 Recycling of catalytic converters involves the following steps:334
� Collection � Decanning of ceramic converters � Shredding of metallic converters � Weighing and sampling of ceramic honeycomb or wash coat � Assaying � Smelting and refining
The catalyst is removed from the steel can by cutting devices and the steel is sorted by quality and sold as secondary scrap to steel plants. The catalyst with the precious metals is delivered to refiners that specialize in the recovery of PGM to generate high purity platinum, palladium and rhodium of similar quality to freshly mined and refined material. Catalytic converters are typically removed from vehicles before they are sent to the scrap yard, because of the high precious metal content of the unit. Each catalytic converter contains platinum, rhodium and palladium, all extremely valuable, as well as aluminum and ferrous metal. It is estimated that the metal content of catalytic converters is $28 to $35 or up to $70 for each scrapped vehicle, or almost half of the total value of the vehicle after other parts have been removed. There are a number of companies who specialize in the recovery of catalytic converters. Old units are removed from vehicles by auto wreckers, and are consolidated into loads that are then sold into the chain of metal recovery operations to companies, which specialize in consolidating loads into full truckloads. About 80 percent of catalytic converters come from scrapped vehicles, and 20 percent come from muffler shops. The recycling of catalytic converters accounts for about 10 percent of the global supply of converter supply channels. A study in the UK took apart 400 automobiles. The weight of all catalytic converters was 404 kilograms, suggesting an average weight of one kilogram per converter. Therefore the converters from vehicles discarded in Canada each year would weigh 1,000 tonnes, on this basis (assuming one million automobiles retired annually). 332 Ibid. 333 Photo credit: http://www.mobility-and-sustainability.com/buster/buster.asp?i=_content/22686.asp 334 Umicore Precious Metals Refining at http://www.preciousmetals.umicore.com/home/ (Dec-2005)

The Government of Canada Action Plan 2000 on Climate Change
NRCan / RNCan 207 Mar-2006
In conclusion, it is assumed that given strong market demand for the PGM elements contained in catalytic converters, the only such material not being recovered would be that associated with the 50,000 abandoned vehicles mentioned in the previous section. In other words, it is estimated that about 50 tonnes of catalytic converters are being lost to the system.
17.2.5 Lead-Acid Batteries According to the International Lead and Zinc Study Group, 71 percent of lead goes into the manufacture of lead-acid batteries.335 These batteries start or help power cars, trucks and buses. They are also used in a variety of other electrical accessories. A good source of background information regarding lead acid batteries can be found care of the Battery Council International (BCI).336 The BCI indicates that more than 97 percent of all battery lead is recycled, making it one of the most recycled materials in circulation. Although this figure is not specific to Canada, it is likely that Canada and the US would have similar rates given the nature of our integrated economies and the fact that spent lead acid batteries cross the border in both directions. The lead-acid battery has three primary components: (1) the plastic casing is polypropylene, (2) there are lead grids, lead oxide and other lead parts, and (3) there is the sulphuric acid. All of the lead and plastic components can be recycled. The old battery acid is treated, cleaned, tested and released into the public sewer system or the acid is converted into sodium sulphate for use in laundry detergent, glass or textile manufacturing. There are several compelling reasons why most of the spent lead acid batteries are recovered in Canada: Virtually all cars are recovered, dismantled and valuable metals recycled; the value of lead is significant (estimated at US $950 per tonne); and the lead recycling infrastructure in Canada is well developed. Information regarding industrial players who may still be active is identified in the Canadian Minerals Yearbook (1994).337 Some recent facts about lead-acid batteries in Canada are as follows:
� The average car battery weight is assumed to be 17.2 kilograms and its estimated average battery life is 3.5 years (in 1989).338
� A more recent estimate for a “well maintained properly charged” battery is 4 to 5 years.339
335 See http://www.ilzsg.org/ilzsgframe.htm (Nov-2005) 336 See http://www.batterycouncil.org/batteries.html (Nov-2005) 337 See http://www.nrcan.gc.ca/mms/cmy/content/1994/72.pdf Tables 9 and 10. (Jan-2006) 338 Golder Associates Ltd. (with RIS Ltd.), 1994, Guideline for the Management of Used Lead-Acid Batteries in Canada, Environment Canada, p. 5 and p. 11 339 See http://www.uuhome.de/william.darden/carfaq11.htm (Dec-2005)

The Government of Canada Action Plan 2000 on Climate Change
NRCan / RNCan 208 Mar-2006
� The Canadian Minerals Yearbook estimates that the average car battery contains 10 kilograms of lead.340
� It is estimated that there were 19.1 million registered motor vehicles (cars, trucks, buses, motorcycles, etc.) in 2004 plus an additional 1.5 million off-road, construction and farm registered vehicles for a total of 20.6 million, each presumably having a lead acid battery.341
� It has been estimated that in 1991 some 112,000 tonnes of lead acid batteries were recycled.342
Based on the latter two points and the fact that there were 17,246,074 registered vehicles in 1991, it estimated that in 2004 about 134,000 tonnes of spent lead acid batteries were recycled. The equivalent quantity of recycled lead therefore was around 77,000 tonnes.
Photo credit343 Another estimate of lead acid batteries recovered in Canada comes from Prince Edward Island; the only provinces with a lead acid battery “take back” regulation.344 Apparently, the recovery rate for these batteries has risen from 65 percent in 1998 to 107 percent in 2000. According to PEI officials, the quantity of batteries recovered in 2002 was 242 tonnes (see Section 13.3.2). Projected on a population basis only, the PEI figure suggests that about 55,400 tonnes of batteries might be recovered in Canada annually. Therefore, a range in the quantity of lead acid batteries recovered would be 55,000 to 134,000 tonnes, or 32,000 to 77,000 tonnes of lead. The exact quantity of lead acid batteries recycled in Canada may never be known; however, based on the fact that (1) a comprehensive automobile recycling infrastructure exists in Canada, (2) there is battery processing plants across North America, and (3) lead a is highly valued metal, it is certain that most of the available material is recovered and recycled. A more comprehensive tracking system might require an agency such as Statistics Canada but the cost of such an effort would have to be balanced against anticipated benefits.
340 See http://www.nrcan.gc.ca/mms/cmy/content/2004/33.pdf (Nov-2005) 341 See http://www.statcan.ca/Daily/English/050315/d050315d.htm (Dec-2005) 342 Golder Associates, 1994, Guideline for the Management of Used Lead Acid Batteries in Canada, Environment Canada, Table 2.3, p. 11 343 http://altura.speedera.net/ccimg.catalogcity.com/210000/213900/213944/Products/12405883.jpg (Jan-2006) 344 See http://www.ec.gc.ca/epr/inventory/en/DetailView.cfm?intInitiative=72 for PEI regulations.

The Government of Canada Action Plan 2000 on Climate Change
NRCan / RNCan 209 Mar-2006
17.3 Civil Engineering Sector “Civil engineering” is intended to refer to the construction and maintenance of roads and bridges. While these activities are ongoing across Canada, related projects are apt to generate enormous amount of debris that Statistics Canada does not include in their biennial Waste Management Industry Survey for reasons stated previously (Section 16.4, difficult to measure and likely to skew “normal” solid waste generation provincial profiles). The two most significant “waste” materials generated in this sector are concrete and asphalt. These two material streams are also mentioned in the provincial summaries (Chapters 5 to 15) but that is in the context of CR&D, which attempts to exclude civil engineering activities. Section 17.2 is all about concrete and asphalt including discussions of current recycling activities and potential opportunities.
17.3.1 Concrete 345 One of the most important construction materials used to build Canada’s economic infrastructure is concrete. When buildings or bridges (etc.) reach the end of their life, a decision is made to refurbish or to demolish. The reuse of concrete walls and floors reduces the need for the production of new cement or concrete and this has a beneficial impact on greenhouse gas emissions, in turn. In Chapter 18, the reuse of existing infrastructure is assigned a GHG emission reduction value – however, there are no data to indicate reuse activities so later in this report a 10 percent figure is assumed. There are three possible outcomes following demolition of infrastructure: landfill disposal, transfer of rubble to a permanent recycling facility or on-site processing for immediate use. With increasing demands for landfill space and the drive towards resource conservation in general, a recent survey by the Cement Association of Canada (CAC) suggests that about three quarters of all concrete debris is currently recovered. The diversion figure might be even higher than 75 percent given the difficulty of measuring on-site activities. ������������)�*�������+�,��
According to CAC, concrete is comprised of aggregates plus paste. Aggregates include crushed stone or gravel and sand. The paste or glue includes portland cement, water and air. Supplementary cementing materials (such as coal fly ash or ground granulated blast furnace slag) can replace part of the portland cement component. It is the chemical reaction between the cement and water that results in a rock-solid product.346
345 Primary research for this section was conducted by Five Winds International for the Cement Association of Canada. 346 See http://www.cement.ca for a more detailed and technical description of concrete (under “technical knowledge base”).

The Government of Canada Action Plan 2000 on Climate Change
NRCan / RNCan 210 Mar-2006
The use of concrete is widespread throughout Canada including roads, subways, bridges, dams, airport runways, buildings, silos and many other structures. Given the magnitude of concrete use and its density, it is not surprising that the demolition of concrete infrastructure generates tremendous quantities of rubble and debris that must be managed. ��������������������
The generation and destination of concrete rubble is not monitored in Canada. There are a number of possible reasons for this:
� Private sector on-site reuse of concrete as clean fill or recycled aggregate is not tracked;
� Concrete rubble that is removed from a demolition site may not end up at a certified landfill – it may get used as “clean fill”;
� If the material goes to a concrete processing facility (e.g. Strada Aggregates347), Statistics Canada’s biennial WMIS will not capture that data;
� Landfills that accept concrete rubble may not weigh or report tonnage to municipal or provincial authorities (some provinces such as Nova Scotia and P.E.I. have regulations to facilitate this but many do not);
� If a landfill does monitor incoming material they are unlikely to know or report the composition of those materials (few if any landfills do this); and
� Concrete rubble is often combined with asphalt or other CR&D wastes. Available data are based on surveys or targeted audits and these provide a wide range in tonnage projections for both amounts recycled and disposed. CAC recently engaged Five Winds International to collate data assembled from the association’s membership and other industry contacts. Table 17.6 summarizes the results:
Table 17.6: Concrete Waste Flow Estimates348 Region Recycled
Disposed
Recycling Rate
BC Prairies Ontario Quebec Atlantic
500,000 1,000,000 5,000,000 1,000,000
300,000
100,000 333,333
1,000,000 800,000 100,000
83% 75% 83% 56% 75%
Total
7,800,000 2,333,333 77%
Table 17.6 suggests that 10.1 Mt of concrete rubble are generated in Canada each year, which is significantly more than the 3.4 Mt of total CR&D waste generated as reported by Statistics Canada WMIS 2002. In Sections 4.3 and 16.4, two different CR&D disposal projection approaches and characterizations are discussed: The net effect is an
347 http://www.constrada.com/main.html# (Mar-2006) 348 Five Winds International, 2006, Estimating Concrete Waste Flows & Recycling Rates in Canada, Cement Association of Canada, p. 7.

The Government of Canada Action Plan 2000 on Climate Change
NRCan / RNCan 211 Mar-2006
estimated range in disposal of between 459,000 and 476,000 tonnes of concrete material for all of Canada. How do all these figures compare? The primary source of concrete disposal and recycling data referenced in many other reports (including this document, Section 4.3) is the SENES study conducted for Environment Canada and Natural Resources Canada in 1993.349 The SENES report estimates that in 1992, the amount of concrete disposed was 646,066 tonnes while 1,702,074 tonnes were diverted, for an overall generation of 2,348,140 tonnes.350 SENES also identified “Rubble” as a separate material (1,700,987 tonnes disposed) but it is likely to contain a large amount of concrete. If 75 percent of this building demolition rubble were concrete material, than another 1.3 Mt would be added to 646,066 t for a new estimate of 1.9 Mt of disposed concrete. It is reported in a recent survey that the U.S. recycled about 135 Mt of concrete in 2005.351 In a 1999 U.S. Geological Survey fact sheet it is estimated that recycled concrete aggregate supplied about 5 percent of the total U.S. aggregates market of 2,000 Mt per year,352 which is 100 Mt. On a per capita basis therefore, using these U.S. figures, Canada might produce 10-14 Mt of recycled concrete aggregate annually and it is noted that the CAC survey recycling estimate falls within this range. For the purposes of this study, two disposal estimates are considered: (1) the 459,000 tonnes figure that is based on WMIS 2002 and Alberta audit work, and (2) the much larger volume of material reported by CAC contacts from across Canada that is 2.3 Mt. The first figure is considered within the context of the three sector analysis used in all of the provinces (Chapters 5 through 15). The difference between the two figures (1,874,000 tonnes) is addressed within the context of selected mineral and metal residuals, the so-called fourth “sector”. It is assumed that the 2.3 Mt is the upset limit for total concrete rubble discarded in Canada on an annual basis. ��������*�������������������
It is assumed that all concrete recycled in Canada is used as an aggregate substitute. To produce concrete, the respective rubble needs to be reclaimed from the demolition site, processed with crushing equipment and have recyclables or contaminants sorted out of the mix. This whole operation can be conducted on-site (where the demolition took place) or off-site. In Table 17.7 the advantages and disadvantages of each approach are compared. Both approaches are affected to some degree by the noise and dust generated by concrete crushing operations. In this regard, the mobile operation is obviously more flexible since its activities will have only a temporary impact on site neighbours.
349 SENES Consultants Ltd., 1993, Construction and Demolition Waste in Canada: Quantification of Waste and Identification of Opportunities for Diversion from Disposal, Environment Canada and Natural Resources Canada 350 Ibid., Table 2,5 351 Construction & Demolition Recycling Magazine, 2006, Survey Says, accessed at the following URL: www.cdrecycler.com/news/news.asp?ID=2481 352 USGS, 1999, Recycled Aggregate – Profitable Resource Conservation, http://pubs.usgs.gov/fs/fs-0181-99/fs-0181-99so.pdf

The Government of Canada Action Plan 2000 on Climate Change
NRCan / RNCan 212 Mar-2006
Table 17.7: Advantages and Disadvantages of On-site and Off-site Concrete Crushing
On-site Concrete Crushing Off-site Concrete Crushing
Advantages
� No need to transport unprocessed rubble
� Can meet on-site needs for aggregate (“just in time” inventory)
� Better economies of scale via larger operation
� Presumably better noise and dust controls (operation may be enclosed)
Disadvantages
� May be a local nuisance from a noise and dust perspective
� Need room to operate and store processed material
� Costly to transport unprocessed rubble
� May need to re-locate due to urban sprawl
A variety of mobile or portable on-site concrete crushing equipment is available and several Internet sites are provided for interested readers.353 The following images illustrate the concrete recycling process succinctly:354
For a virtual tour of more permanent concrete processing operations an excellent series of images can be found at EcoFootage.com.355 ��������(���������
From Table 17.6 it is evident that concrete recycling occurs right across Canada with Ontario processing the most material. According to the report author, the large Ontario tonnage may be due to more reporting from on-site reuse activities, especially roads, compared to other provinces. One project of note and one that probably contributed significantly to the Ontario quantity is the demolition of Toronto’s Pearson International Airport Terminal One. In 2004 the firm of Priestly Demolition successfully diverted 95 percent of materials away from disposal by, for example, processing about 200,000 tonnes of concrete rubble for
353 http://www.betterroads.com/articles/NewProds/apr04bid.htm, http://rocktoroad.com/index.html and http://www.cdrecycler.com/product/ (Mar-2006) 354 Photo credits: www.cement.ca (Mar-2006) 355 http://www.ecofootage.com/tapes/recycling/VS28.html (Mar-2006)

The Government of Canada Action Plan 2000 on Climate Change
NRCan / RNCan 213 Mar-2006
immediate on-site use. More detailed information on this project is available in a separate report supported by Action Plan 2000 on Climate Change.356 A typical municipal operation occurs in Camrose, Alberta where they process about 22,000 tonnes of concrete and asphalt on an annual basis.357 The merge of concrete and asphalt materials is common for CR&D processing facilities and subsequently makes it difficult to track separate fractions. ���������������-������������
In Canada, recycled concrete is processed mostly into aggregate as discussed under current management practices. In the U.S., recycled concrete has the following end uses: sub-base (68 percent), bituminous concrete (9 percent), cement concrete (6 percent), general fill (7 percent), rip rap (3 percent) and other uses (7 percent).358 Comparative data are unavailable in Canada. Efforts are underway to determine if recovered concrete can be broken down into its constituent parts; namely, aggregates and cement precursors as suggested in the following quote: “Another promising technology called Franka-Stein treats concrete in a powerful electric arc using electrodynamic fragmentation, which separates the electrically weak material boundaries prevalent in concrete. In addition to producing clean aggregate, the Franka-Stein process separates cementitious material that can replace natural raw material in cement production”.359
The results of experiments involving the FRANKA process have been conducted in Germany and are presented in the image above where steel rebar has also been recovered.360 It is not certain what the net benefit of this approach is from an economic or GHG emissions perspective.
356 RCO, 2005, Let’s Climb Another Molehill, AP2000 on Climate Change, CMHC, Region of Peel, New West Gypsum and Walker Environmental Services, Case Study 15, p. A-80 357 See http://www.camrose.com/engineer/ConcreteRecycling/concrec.htm (Mar-2006) 358 USGS, 1997, Crushed Cement Concrete Substitution for Construction Aggregates— A Materials Flow Analysis http://pubs.usgs.gov/circ/1998/c1177/c1177.pdf (Mar-2006) provides a definition for each of these materials. 359 http://www.fhwa.dot.gov/pavement/pccp/pubs/05053/track5.cfm (Mar-2006) 360 Photo credit : http://www.fzk.de/fzk/idcplg?IdcService=FZK&node=2726&lang=en (Mar-2006)

The Government of Canada Action Plan 2000 on Climate Change
NRCan / RNCan 214 Mar-2006
!#��.���)����)�,���� �����������������
On-site processing and use of recycled concrete rubble as an aggregate saves landfill space, increases material use efficiency, dramatically reduces transportation requirements and of course reduces GHG emissions. A permanent processing facility has the same benefits as an on-site operation only shipment of materials to and from points of supply or sell is an issue to be considered from a full life cycle perspective. For urban markets, the use of mobile crushers gives some advantage to making crushed concrete on-site because most quarries are located outside city boundaries. The demand for aggregate in Canada is enormous: Almost 146 Mt of crushed stone was used in 2003.361 The size of this market would suggest that material demand is good although it is a high volume, low value material. If the U.S. experience is comparative, recycled aggregate can compete with natural aggregate sources and do well. However, it is noted that aggregate characteristics and application needs vary greatly, and therefore recycled concrete is not necessarily the right material for all occasions.
17.3.2 Asphalt 362
While asphalt is discussed in each of the provincial chapters, this section provides more discussion specific to this material including information regarding current recycling activities that are both economically and environmentally beneficial. ������������)�*�������+�,��
Asphalt is a member of a heavy, brownish-black group of hydrocarbons called bitumen. Asphalt can be taken from natural deposits or it may be produced artificially as a by-product of the petroleum industry (petroleum asphalt). There are two asphalt products to consider in this section: pavement and shingles. When mixed with gravel or other aggregates the resulting mixture can be used to pave roads, parking lots and pathways.363 An asphalt pavement has two key components: the aggregate and the asphalt cement. The aggregate, which makes up about 95% of the asphalt concrete, provides the pavement with its strength and load carrying capacity. The asphalt cement, which binds the aggregate together, adds strength and flexibility to the pavement. Asphalt shingles are the most common roofing material in North America. Asphalt shingles are categorized as either organic-based (base made of various cellulose fibres) or fibreglass-based.364 Roof material needs to be replaced every 20 years due to the long-term effects of weathering. Asphalt shingles can often be applied directly over existing
361 See http://www.nrcan.gc.ca/mms/cmy/content/2004/56.pdf, Table 3 362 The background research for this section was conducted and reported on by Kelleher Environmental. 363 http://www3.gov.ab.ca/env/waste/aow/crd/publications/CRD_Market_Profiles_Report.pdf (Jan-2006) 364 See http://www.ciwmb.ca.gov/ConDemo/Shingles/#ShingleComp for some American information regarding the composition of asphalt shingles.

The Government of Canada Action Plan 2000 on Climate Change
NRCan / RNCan 215 Mar-2006
roofs without the necessity of tearing off the old roof. Some local ordinances forbid re-roofing over two or more layers of shingles.365 ��������������������
Asphalt waste is primarily generated during municipal infrastructure and commercial projects in which roads are removed. Asphalt is a reusable material. All asphalt has the potential to be recycled. However, as discussed in Section 16.4, it is difficult to determine the amount of waste asphalt generated annually in Canada. The estimated quantity of asphalt material being disposed in Canada is between 216,000 and 522,000 annual tonnes (See Table 16.8). There is a lack of data reported regarding generation, disposal and recycling of waste asphalt and asphalt shingles for two main reasons: (1) There are many players involved in this industry (e.g. Ministries, municipalities, contractors, construction yards, landfills and paving companies) and (2) there has not been a need or incentive to collect the data. To develop a better understanding of this resource, there has to be a standard reporting method to establish more accurate data records. The amount of asphalt shingles cast into the waste stream is difficult to determine. Alberta data suggest that 10-13 percent of CR&D waste disposed of is “asphalt roofing products”.366 At these rates, it can be estimated that Canada generates 282,000 to 366,000 tonnes of shingle waste. In the U.S., it is estimated that about 9 million tonnes of asphalt shingles are discarded annually: On a straight population ratio basis, it can be estimated that 962,000 tonnes of asphalt shingles are discarded in Canada every year, based on the US discard rate. This disparity of estimates once again highlights the difficulty in measuring the waste stream. ��������*�������������������
Asphalt for roads is reportedly North America’s “most recycled material”.367 Four out of every five tonnes of asphalt pavement removed during widening and resurfacing projects is re-used. In the US, contractors reuse and recycle 73 million tonnes a year.368 The flow of asphalt is shown in Figure 17.5.
365 http://www3.gov.ab.ca/env/waste/aow/crd/publications/CRD_Market_Profiles_Report.pdf (Jan-2006) 366 CH2M Gore & Storrie Ltd., 2000, Construction, Renovation and Demolition (CRD) Waste Characterization Study, Alberta CRD Waste Advisory Committee, Table 4-1 367 See http://www.ogra.org/lib/db2file.asp?fileid=1770, (Jan-2006) 368 See http://www.asphaltalliance.com/singlenews.asp?item_ID=53&comm=0 (Jan-2006)

The Government of Canada Action Plan 2000 on Climate Change
NRCan / RNCan 216 Mar-2006
Figure 17.5: Conceptual Flow of Asphalt
The main road rehabilitation paving methods are:
� Milling (“shave and pave”) removes the top layer of asphalt pavement. It prepares the surface for the overlay by removing rutting and surface irregularities. The milled asphalt pavement can be recycled as reclaimed asphalt pavement (RAP) in other hot mixes.
� Cold In-Place Recycling (CIR) turns the existing pavement into an aggregate
base. The existing pavement is removed, mixed with an emulsion, re-laid and then compacted to a specified density. After a short curing period, the new base is ready for the overlay. The entire process is carried out in-situ. None of the old pavement is removed from the site.
� Full Depth Reclamation (FDR) processes the entire pavement section and a
portion of the base material. A full depth recycling machine uniformly pulverizes and blends the pavement and base to produce a stabilized base course. Aggregate can be added to improve the base's characteristics.
� Hot In-Place Recycling (HIR) is a cost efficient alternative pavement construction
technology which involves the heating and mixing of the existing surface asphalt, remixing it with or without admixture (a heated mixture of aggregates and asphalt cement binder) and binder rejuvenators, followed by repaving — all in a continuous process.
North American Industry Classification
System (NAICS)
Asphalt Generation: Pavement Milling,
Roof Shingles
Landfill (disposal, cover or roads)
Asphalt Recycling Aggregate
Hot or Cold In-Place Recycling, Embankments,
Shoulders
New roads,Roadbeds,Shoulders, &Embankments, etc.
North American Industry Classification
System (NAICS)
Asphalt Generation: Pavement Milling,
Roof Shingles
Landfill (disposal, cover or roads)
Asphalt Recycling Aggregate
Hot or Cold In-Place Recycling, Embankments,
Shoulders
New roads,Roadbeds,Shoulders, &Embankments, etc.

The Government of Canada Action Plan 2000 on Climate Change
NRCan / RNCan 217 Mar-2006
CIR and FDR are now routinely used in most regions of Canada to restore surfaces and stabilize roadways. These methods include a final overlay of new hot mix asphalt that increases the overall cost. Candidate projects for CIR and full depth reconstruction would be a pavement requiring rehabilitation due to severe distress. Before repaving a road, a contractor either mills the top layer of the old asphalt pavement or removes the old asphalt pavement entirely and then takes the reclaimed asphalt pavement (RAP) to a central yard for processing and stockpiling.
�
�
�
������������ �
Asphalt is processed into a new aggregate product by crushing and screening the crushed material to specific size ranges. Pieces that can be handled by loaders and accepted by the crushing technology are up to 75 cm X 75 cm X 30 cm. Due to the expense of operating crushing equipment and moving portable equipment to the locations of stockpiles, a minimum amount of material must be available to make crushing viable, typically 30,000 to 50,000 tonnes. Operators will move processing equipment 200 to 300 kilometres to stockpiles of this magnitude. Smaller processors are now available that can be financially viable crushing piles as small as 3,000 tonnes. Processing is not as widespread in rural areas as it is in the major centres due to the distances as well as smaller stockpiles Processing requires space for the unprocessed material, the crushing and screening equipment and for the finished product. Depending on the size of the stockpile to be processed minimum space requirements for processing range between 0.5 and 2 hectares (1 to 5 acres). In areas where the dust generated by the processing of these materials is likely to be a nuisance, mitigating steps such as foam spray incorporated into the crushing equipment can be taken. Noise may also be a nuisance depending on the location of the processing operation. ��������(���������
Ontario has 39,000 km of highway with 58 percent in Northern Ontario and 42 percent in Southern Ontario with an average of 7,200 m2/km of asphalt.370 Ontario hot mix plants produce about 14 million tonnes of hot mix a year to build and maintain roads and highways. New roads will need to be rehabilitated in 20 years. During rehabilitation, 60 369 http://www.hawaiiasphalt.com/HAPI/modules/04_pavement_types/04_recycled_hma.htm (Jan-2006) 370 See http://www.arra.org/datafiles/presentations/PavementRecyclinginthecontextofAssetManagementNeilZohorsky.pdf (Jan-2006)

The Government of Canada Action Plan 2000 on Climate Change
NRCan / RNCan 218 Mar-2006
percent of the pavement will not be removed; however 5.6 million tonnes of pavement will be recycled. The 5.6 million tonnes of pavement that will need to be recycled in twenty years time contains approximately 280,000 tonnes of asphalt cement, worth at current prices approximately $84 million. If the current production of hot mix in Ontario contained 20 percent RAP (reclaimed asphalt pavement), the province could recover $42 million worth of asphalt cement a year. The Ontario Ministry of Transportation has a hot mix recycling policy of zero waste. The reality is the vast majority of road building in Ontario takes place on relatively small municipal projects. In places where recycling is not practiced, most asphalt is stockpiled by contractors for use in other projects such as road fill and shoulders. The Ministry estimates that contractors stockpile and eventually reuse 2-3.5 million tonnes of asphalt. They use 15 percent RAP typically in hot mix. In 1998, the Ministère de l’Environnement du Québec (MTQ) developed a residual materials reclamation policy with the aim of reducing the disposal of asphalt residue in dry material disposal sites.371 The MTQ increasingly uses pavement material recycling techniques on their highway construction projects. Specifications and contract clauses include standard NQ 2560-600 for recycled materials. The City of Montreal is a major user of hot in-place recycling (HIR) technology, normally awarding two or three HIR contracts totalling approximately 100,000 m2 each construction season.372 At this rate, the generation of asphalt waste in Montreal will be minimal in time if the City continues to use HIR technology since there is zero asphalt waste generated in this process. In Nova Scotia, recycling of asphalt is not always practiced. Much of it is stockpiled by contractors and eventually reused as fill or road base. They have been stockpiling for 15 years. The province is however looking into a specification for RAP to use in hot mix. At one time they paved many of their gravel roads with the old asphalt but it became too costly. In British Columbia, the Ministry reported that it was difficult to determine the amount of asphalt waste that is generated, as they do not keep statistics, especially the BC Ministry of Transportation’s District Works and their construction projects. The province does however carry out HIP work but it is only a percentage of the total work. They recycled 1.8 million square meters of BC highways last year that translates into about 500 lane kilometres. Many municipalities have banned the disposal of asphalt in landfills. Some landfills however accept recycled asphalt as a clean fill for daily landfill cover or to pave their own roads. In Newfoundland, asphalt is not accepted at landfills. Milled asphalt is used for fill purposes such as highway shoulders. Old asphalt is generally stockpiled and used in road maintenance. 371 See http://www.tac-atc.ca/english/pdf/conf2003/marquis_e.pdf (Jan-2006) 372 See http://www.rocktoroad.com/hotquebec.html (Jan-2006)

The Government of Canada Action Plan 2000 on Climate Change
NRCan / RNCan 219 Mar-2006
In Saskatchewan, the Environmental Protection Branch of Saskatchewan Environment (SE) encourages municipalities to include a section in permits on handling practices for CR&D waste with asphalt and roofing materials are specifically mentioned. It mentions separation of CR&D waste into separate waste streams, which can be salvaged for reuse. It does suggest that shingles are not reusable.373 The recycling of asphalt into aggregate products to replace natural aggregate has become well established in Alberta in recent years. Several operators and a number of municipalities now have well established stockpiling or recycling programs. Waste material can be delivered to recyclers for a tipping fee ranging from zero to $20.00 per tonne. In some cases, the tipping fee is charged according to truckload at about $20.00 per tandem load and $40.00 per end-dump. Processed aggregate is sold in the $6.00 to $10.00 per tonne range, which is close to natural aggregate prices. Processing and sale of the recycled aggregate is considered to be competitive with natural aggregate when full cost-benefit (including disposal fees for old material and all transportation costs as well as the costs of new aggregate to replace any aggregate disposed in landfill) is carried out.374 Two examples of different options for asphalt recycling show the range of costs and fees associated with asphalt recycling in Alberta.
1. The City of Edmonton accepts asphalt rubble from its own projects as well as from commercial contractors free of charge. The asphalt along with other CR&D materials is processed to a size for use in road base applications and for sidewalk construction. When sufficient amounts of rubble are stockpiled, the material is processed for $4.00 per tonne. It is estimated that at least 25,000 tonnes are required to make processing feasible at that cost. The City has found that by using the recycled material in their asphalt mix they can reduce pavement thickness by 20 percent due to the extra strength and binding properties of the concrete content. The city processes up to 200,000 tonnes per year of CR&D waste. Most city contractors are aware of the City’s stockpiling and processing program and take advantage of it. However, some contractors will take advantage of lower tipping fees at landfills outside the city when it is more convenient and incurs lower trucking costs.
2. Inland Construction Limited, in Edmonton, accepts concrete and asphalt rubble at
its yard. No tipping fee is charged. When a pile of about 40,000 to 50,000 tonnes is accumulated, usually after about two years, a crusher is hired from a sister company and the processed material is offered for sale. Asphalt is processed to 12.5 millimetres for the recycled asphalt pavement market. The material is sold for between $8.50 and $10.00 per tonne. The stockpile is sold within a year.
373 See http://www.se.gov.sk.ca/environment/protection/land/Designated%20areas%20and%20waste%20disposal%20PFD.pdf (Jan-2006) 374 See http://www3.gov.ab.ca/env/waste/aow/crd/publications/CRD_Market_Profiles_Report.pdf (Jan-2006)

The Government of Canada Action Plan 2000 on Climate Change
NRCan / RNCan 220 Mar-2006
���������������-������������
A recent study in the Edmonton area has shown that smaller municipalities that can make use of the recycled product can realize significant savings by stockpiling and processing these materials to significantly reduce the costs of obtaining natural aggregate. This study demonstrated that when all costs are considered, the recycling approach yields equal volumes of aggregate at less than half the cost of obtaining 100 percent natural aggregate.375 RAP is acceptable as a “black rock” aggregate for roadbeds, shoulders and embankments where engineering properties are of less concern. It is only when RAP is used as a hot mix raw material (recycled hot mix or RHM) that engineers can take full advantage of the engineering properties of both the aggregate and asphalt cement and maximize the economic value of recycling. By using RAP as a hot mix raw material rather than simply as a “black rock” aggregate, ensures the recovery of the asphalt cement component, which was about $300 per tonne in mid-2003. Using a blend of 20 percent RAP in a municipal rehabilitation project could reduce costs by about $2,500 per lane kilometre.376 More provincial and municipal public works agencies are turning to in-situ recycling as an alternative to conventional hot mix asphalt pavement rehabilitation. In-situ recycling can be performed by both hot in-place (HIR) and cold in-place (CIR) asphalt recycling methods, with both methods proving to be economical, conserving both energy and materials, and resulting in zero waste. HIR technology has been found to be an economical and practical solution for the rehabilitation of existing surface courses to depths of 50 mm or more by reducing the haul of materials, reducing usage of virgin aggregates and asphalt, as well reducing the quantity of work to the travel lanes only. HIR restores the ride quality and surface condition of structurally sound pavements while maintaining curb heights for safety and drainage. Advanced HIR methods eliminate the need for overlays of new plant mixed asphalt, and therefore have the potential to reduce the overall surface rehabilitation cost by up to 40 percent, when compared to other methods such as cold milling and CIR. From a global perspective, much of the recent HIR innovation has occurred in Canada where transportation departments have embraced the concept and equipment manufacturers have provided numerous improvements. To improve the efficiency and depth of milling, two Canadian manufacturers (Pyrotech and Artec) developed “twostep” and “fourstep” milling processes. Pyrotech also developed an afterburner system to incinerate excessive smoke and vapours generated by the infrared heaters. Overall, the advantages of in situ recycling include the conservation of aggregates, asphalt cement and energy. In situ recycling uses 100 percent of the reclaimed material, while conventional central plant recycling is limited to much smaller percentages of
375 Ibid. 376 See the Ontario Hot Mix Producers Association web site.

The Government of Canada Action Plan 2000 on Climate Change
NRCan / RNCan 221 Mar-2006
RAP. The newer HIR equipment, in conjunction with Superpave binder design of the recycled mix and appropriate QA/QC procedures, will produce high quality surface asphalt with a similar lifecycle performance to virgin hot mix at significant cost saving.377 The Pyropaver 300 E is a Canadian system for hot in-place Asphalt Recycling on roads.378 The equipment consists of three separate units and one conventional asphalt paver. The Pyropaver is often referred to as a "train" because of its two stage, hot in-place asphalt recycling system. The surface is heated by infrared radiation and milled in two steps to a desired depth. The mix of the old asphalt layer can be changed directly by adding virgin asphalt and new types of bitumen or rejuvenator.
The two-stage recycling means the sequential heating and removing of two separate layers of asphalt in one continuous operation. It has an efficient emission control system, which gives a virtually smoke free operation. Given the magnitude of estimates (282-366,000 annual tonnes), old or off spec asphalt shingles represent an opportunity that is either not yet understood or has not yet been figured out. Since the US has both more shingles to manage and a dedicated association (see footnote below), activities south of the border should be monitored for developments and possible application in Canada. In this report, it is assumed that most shingles are disposed in landfills since asphalt shingle recycling technologies are not well developed in Canada. Potential uses for shingles are hot mix asphalt, cold patching, dust control on rural roads, temporary road material, aggregate road base, and new shingles.379 !#��.���)����)�,���� ��������(�#����
There is growing awareness that recycled aggregate can serve as well or better than natural aggregate and be competitive in price with natural aggregate. As this awareness increases, demand for recycled aggregate and diversion rates will also increase. As more portable crushing equipment becomes available and project space permits, there will be a trend towards more on-site processing to try to reduce transportation costs and facilitate
377 See http://rocktoroad.com/hotinplace.html (Jan-2006) 378 See http://www.pyropaver.com/ (Jan-2006) 379 See http://www.shinglerecycling.org/index.asp for more information regarding shingle recycling activities (mostly US), - photo credit as well. (Jan-2006)

The Government of Canada Action Plan 2000 on Climate Change
NRCan / RNCan 222 Mar-2006
use of the recycled material in new projects. This trend is currently demonstrated by in situ asphalt recycling. Recycling of asphalt is well established in Alberta, for example, and demand continues to exceed supplies. In spite of high demand, a number of operators indicate that the barrier to increasing the amount that is captured in recycling operations is a lack of awareness of the opportunity. Another barrier to more universal recycling is the lack of awareness on the part of project designers and engineers that the product is equal to or better than natural aggregate in most applications and can be included in specifications. The latter is mostly true for commercial operations. Project planners should undertake more detailed cost benefit analysis on a project-by-project basis to accurately determine real cost of using recycled aggregate versus using an equivalent amount of natural aggregate. In most cases, even at landfill costs in the range of $10 per tonne, the cost of landfill disposal combined with purchase of replacement natural aggregate is likely to be higher than using recycled aggregate. This advantage works for operators who are active in both construction and demolition. In these cases, the materials generated in demolition can be processed and re-applied to the new project on the same site or to the operator’s future projects. For operators who are active only in demolition, costs are more related to immediate disposal fees for individual projects. In these cases, low tipping fees at nearby landfill sites remain an economic deterrent to delivery of concrete and asphalt waste to recycling operators. Smaller municipalities should realize the economic value of stockpiling independently or co-operatively with other municipalities. Rural diversion rates may also be enhanced by smaller, portable crushing operations that can take advantage of the smaller generation rates in rural areas. If landfill operators undertake to stockpile clean asphalt, these reserves will provide an opportunity for revenue to the landfill when volumes that justify processing have been accumulated.380 If the key barriers to aggregate recycling can be reduced, the trend towards complete recovery of aggregate waste for reuse and recycling will continue.
380 See http://www3.gov.ab.ca/env/waste/aow/crd/publications/CRD_Market_Profiles_Report.pdf (Jan-2006)

The Government of Canada Action Plan 2000 on Climate Change
NRCan / RNCan 223 Mar-2006
17.4 Industrial Sector The industrial sector includes five materials that are largely mineral or metal related: electric arc furnace dust, coal fly ash, ferrous and nonferrous blast furnace slag, electroplating or metal finishing sludge and foundry sand. A short summary on mine waste is provided at the end.
17.4.1 Electric Arc Furnace Dust 381
A steel mill is an industrial plant for the manufacture of steel. Steel is an alloy of iron and carbon. It is produced in a two-stage process. Iron ore is reduced or smelted with coke and limestone in a blast furnace, producing molten iron, which is either cast into pig iron or carried to the next stage as molten iron. In the second stage, known as steelmaking, impurities are removed and alloying elements such as manganese, nickel, chromium and vanadium are added.
The steel industry is composed of both integrated steel mills and mini steel mills. Integrated mills are large facilities that are only economical to build at 2,000,000 tonne per year annual capacity and up, and have the capacity to reduce iron ore to metallic iron which is usually converted to steel in a basic oxygen furnace at the same site and rolled to a semi-finished form of bar, rod, sheet or slab. This process from iron ore to shaped product is integrated at one site hence the name. Mini-mills are smaller, and normally do not incorporate the step of reducing iron ore to metallic iron. Consequently, they are able to use electric arc furnaces to melt steel scrap and metallic iron to produce liquid steel which can then be formed and rolled into various products. Because of the higher scrap content in the feed for mini-mills, in the early years of the electric arc furnaces, mini-mills produced lower grades of steel, and because of their size, fewer products. More recently, some mini-mills produce quite high grades of steel and a larger variety of products.
What might be referred to as a hybrid between the two processes are mills which reduce iron using a direct reduction process and feeding the metallized iron product along with scrap to an electric arc furnace for production of steel.
Integrated mills use carbon in the form of coke to reduce iron ore (Fe2O3 or Fe3O4) to metallic iron, Fe, and must purchase or make coke in coke ovens which historically had significant environmental emissions. At the direct reduced iron (DRI) plants, natural gas is usually used to reduce the iron ore to metallic iron. In both cases, the oxygen in the ore combines with the carbon in the coke or natural gas to produce carbon dioxide among other compounds. .
Steel mills use one of two types of furnaces. Both furnaces recycle old steel products into new steel.
381 The background research for this section was conducted and reported on by Kelleher Environmental.
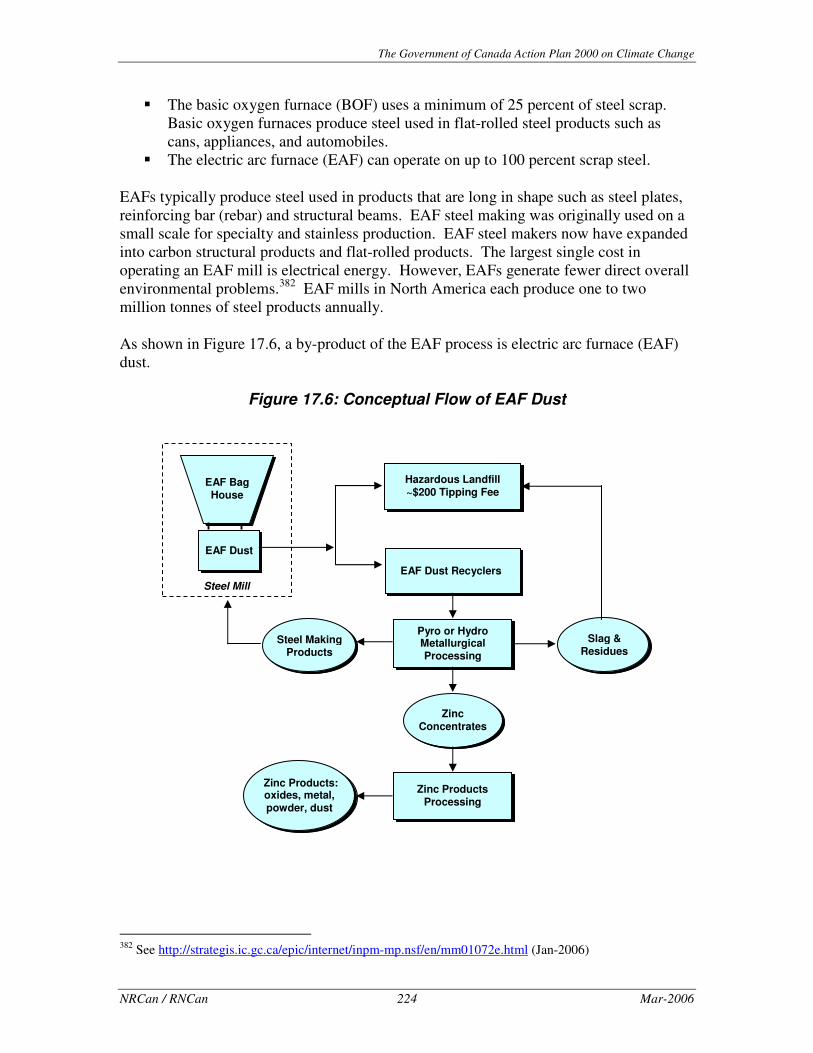
The Government of Canada Action Plan 2000 on Climate Change
NRCan / RNCan 224 Mar-2006
� The basic oxygen furnace (BOF) uses a minimum of 25 percent of steel scrap. Basic oxygen furnaces produce steel used in flat-rolled steel products such as cans, appliances, and automobiles.
� The electric arc furnace (EAF) can operate on up to 100 percent scrap steel.
EAFs typically produce steel used in products that are long in shape such as steel plates, reinforcing bar (rebar) and structural beams. EAF steel making was originally used on a small scale for specialty and stainless production. EAF steel makers now have expanded into carbon structural products and flat-rolled products. The largest single cost in operating an EAF mill is electrical energy. However, EAFs generate fewer direct overall environmental problems.382 EAF mills in North America each produce one to two million tonnes of steel products annually.
As shown in Figure 17.6, a by-product of the EAF process is electric arc furnace (EAF) dust.
Figure 17.6: Conceptual Flow of EAF Dust
382 See http://strategis.ic.gc.ca/epic/internet/inpm-mp.nsf/en/mm01072e.html (Jan-2006)
Hazardous Landfill ~$200 Tipping Fee
EAF Dust Recyclers
EAF Bag House
EAF Dust
Pyro or Hydro Metallurgical Processing
Steel Making Products
Zinc Concentrates
Slag & Residues
Zinc Products Processing
Zinc Products: oxides, metal, powder, dust
Steel Mill
The Government of Canada Action Plan 2000 on Climate Change
NRCan / RNCan 225 Mar-2006
Composition of the dust varies greatly, depending on feedstock. One source suggests 45 percent iron, 25 percent zinc and 25 percent slag making compounds.383 Another source provides ranges: zinc 5-35 percent, lead 2-7 percent plus amounts of cadmium, chromium and nickel.384 In Chapter 18, a blend of the two data sources is used to develop GHG impact projections.
Due to the presence of this lead, as well as small amounts of cadmium and hexavalent chromium, EAF dust has been classified as a hazardous waste by various government regulatory agencies and therefore must be treated or disposed of as a hazardous waste.
Most dust treatment processes use carbon as a reducing agent for the zinc oxide in the EAF dust. The zinc vapour that is produced can be condensed and zinc can be recovered as a saleable product. New EAF dust processing technologies are being developed.385 The annual tonnage of EAF dust generated for disposal or recycling is increasing.386
��������������������
Ontario accounts for about 70 percent of the total Canadian steel production capacity. Mini-mills have increased their production of flat-rolled products to approximately 70 percent of the overall steel market. The hot-rolled capacity in North America is approximately 73 million tonnes, including specialty steel and plate produced in a hot-strip mill: 64 million tonnes in the U.S. and 9 million tonnes in Canada and mini-mills account for 16 percent of this total capacity. Direct reduced iron (DRI) is a high-purity product for use in steelmaking, iron making and foundry applications.387 Modifications to EAFs now permit the usage of up to 50 percent DRI in the charge, although typical mini-mill charges range from 100 percent scrap to 70 percent scrap and 30 percent pure iron units.388 There are an estimated 750,000 short tons of EAF dust presently being generated in U.S. carbon steel operations. In addition, it is estimated that about 85,000 short tons of EAF dust are being generated by U.S. specialty steelmakers including stainless steel production. With the trend toward EAF steel production expected to continue, the amount of dust generated is also expected to increase.389 The annual disposal of hazardous EAF dust in the United States and Canada is an expensive problem for the steel industry. The production of one short ton of steel will generate approximately 25 pounds of EAF dust as a by-product390 whereas other 383 H. Mostaghaci (ed.), 2000, Proceedings of the International Symposium: Environment Conscious Materials – Ecomaterials, M. Clapham, “Recycling: Key Component of a Sustainable Development Strategy,” The Canadian Institute of Mining, Metallurgy and Petroleum, p. 201 384 World bank Group, 1998, Mini Steel Mills – Pollution Prevention and Abatement Handbook, p. 341 385 J.R. Donald and C.A. Pickles, Canadian Metallurgical Journal. Reduction of Electric Arc Furnace Dust with Solid Iron Powder. Vol: 35(3), 1996, pp. 255-267 386 See http://strategis.ic.gc.ca/epic/internet/inpm-mp.nsf/en/mm01073e.html (Jan-2006) 387 http://www.midrex.com Manufacturer of DRI 388 http://strategis.ic.gc.ca/epic/internet/inpm-mp.nsf/en/mm01073e.html 389http://www.epri.com/OrderableitemDesc.asp?product_id=CR%2D110868&targetnid=267797&value=04T012.0&marketnid=267712&oitype=1&searchdate=5/8/1998 390 http://www.eere.energy.gov/industry/metalcasting/pdfs/procelecarc.pdf “Project Fact Sheet

The Government of Canada Action Plan 2000 on Climate Change
NRCan / RNCan 226 Mar-2006
estimates suggest 20 to 50 pounds.391 The cost of treating and properly disposing of the dust has been estimated to be $2 US to $3 US per short ton of steel produced. This cost has a significant impact on the economics of EAF steel.392 According to one source, Canadian steelworks using EAFs to re-melt and recycle scrap steel produce 90,000 annual tonnes of EAF dust.393 However, a more appropriate estimate of this material is one based on the 20-50 pound per ton (or 10-25 kg per tonne) range provided in the previous paragraph. In 2000, Canadian EAF mini-mills shipped 6.6 million tonnes of product.394 Thus, it can be projected that 66,000 to 165,000 tonnes of EAF dust are generated in Canada each year, based on these assumptions.
This image shows the old EAF dust disposal site in Sydney, Nova Scotia prior to its removal to a new landfill site with an engineered containment cover in 1999-2002.395
Canada currently has 10 steel producers, based mainly in Ontario.396 There are 14 plants across five provinces (Alberta, Saskatchewan, Manitoba, Ontario, Quebec). Algoma, Dofasco and Stelco are the largest and produce close to three fifths of the total national output. They operate large integrated facilities equipped with blast furnaces and rolling mills. The smaller producers use EAFs, which allow them to focus on carbon steel plate, sheet, bar, and rod products as well as specialty steels. Stelco's Lake Erie Works is the newest integrated facility in North America. Other integrated facilities include Stelco's Hilton Works, Dofasco and Algoma. The remaining 10 steelmaking facilities are mini-mills operating EAF facilities: Gerdau Ameristeel Manitoba, Gerdau Ameristeel (Cambridge), Gerdau Ameristeel (Whitby), Mittal Canada Inc. (Contrecouer), Mittal Canada Inc. (Sorel), IPSCO Inc., Ivaco Inc., Moly Cop Steel Inc., Hamilton Specialty Bar Corporation and QIT-Fer et Titane Inc.. They produce flat products, long products and specialty steels. The thirteenth firm, QIT-Fer et Titane, produces iron and steel.
Steel: Processing Electric Arc furnace Dust into Saleable Chemical Products” 391 See http://www.environmental-center.com/articles/article985/recyclingkey.pdf (Jan-2006) 392http://www.epri.com/OrderableitemDesc.asp?product_id=TR%2D112357&targetnid=267797&value=04T012.0&marketnid=%20267712&oitype=1&searchdate=1/15/1999 (ARCDUST � A Model for Analyzing EAF Dust Recycling Cost) 393http://www.ic.gc.ca/cmb/welcomeic.nsf/558d636590992942852564880052155b/85256a5d006b972085256e6f00476b69!OpenDocument (Jan-2006) 394 See Industry Canada paper on Manufacturers of Steel Mill Products at http://www.nccp.ca/NCCP/national_stakeholders/pdf/1_d_steel_e.pdf , Appendix 3 (Jan-2006) 395 See http://www.sysco.ns.ca/esa5_4_12.htm plus photo credit. (Mar-2006) 396 http://strategis.ic.gc.ca/epic/internet/inpm-mp.nsf/en/mm01072e.html

The Government of Canada Action Plan 2000 on Climate Change
NRCan / RNCan 227 Mar-2006
��������*�������������������
The Canadian iron and steel industry has made significant improvements to processes including:
� Building recycling into the steelmaking process: gases and dust particles from smelting and refining are captured at most facilities and used as feedstock or by-products.
� Increasing the use of recycled steel in the steelmaking process: today every tonne of steel produced in Canada represents over half a tonne of recycled steel.
� Significant improvements in energy consumption: total energy consumption by the Canadian steel industry is down by about 40 peta joules per year since the mid-1980s while the energy intensity per tonne shipped is down by 8.5 giga joules, an improvement of 35 percent relative to 1985.
The disposal of hazardous EAF dust costs nearly $200 US per short ton.397 Such high disposal costs encourage alternative handling practices of EAF dust. Several specialty steelmakers are recycling bag house dust back to the EAF. The benefits include high recoveries of the alloy units from the dust to the steel melt. Recycling of dust and other steel wastes to the EAF however increases energy and reductant usage. The recycling of EAF dust back into the EAF is a common steel industry practice. The Electric Power Research Institute Inc. (EPRI) carried out a comparison of several methods of reusing the dusts in the EAF. They include briquetting and pelletizing dust prior to charging to the furnace, putting dust in super sacks and including with the charge, and injecting the dust directly into the furnace. No recycling method appeared to have a clear advantage over other methods. Dust injecting was a simple low-cost technique for recycling limited amounts of dust during the flat bath period. Dust in super sacks and pellet form was also an inexpensive method of recycling dust with the scrap. Problems were reported with pellet strength if the dust had high lime content. Briquettes gave much less physical carryover of dust and a more enriched secondary dust. Briquetting was favoured by companies recycling stainless steel dusts because alloy unit recoveries were improved, and swarf and mill scale could be incorporated in the briquettes. Briquetting is however more expensive than pelletizing or injection.398 The recycling of briquetted dust rather than pellets is the preferred technology. Mill scale and swarf can be incorporated in the briquettes more easily than pellets. Briquettes create less secondary dust and have a higher density than pellets. Pellets are more completely immersed in the slag for more efficient reactions. In most cases, the recycling of dust to the EAF is economically beneficial compared to landfill disposal. 397 http://www.epri.com/OrderableitemDesc.asp?product_id= IN%2D106894&targetnid= 270716&value=05T012.0&marketnid= 270632&oitype= 5&searchdate=12/19/1997 (Participation in EAF Dust Minimization Project Helps Utility Build Relationships With Important Customers ) 398 http://www.epri.com/OrderableitemDesc.asp?product_id=CR%2D110868&targetnid=267797&value= 04T012.0&marketnid= 267712&oitype= 1&searchdate= 5/8/1998 State-of-the-Art Assessment Study on Recycling Electric Arc Furnace Dust Jun 1998,

The Government of Canada Action Plan 2000 on Climate Change
NRCan / RNCan 228 Mar-2006
Most of the specialty steel EAF dust in the United States and Western Europe is processed by pyro-metallurgical processes (e.g. the Inmetco submerged arc furnace in the United States, Scandust plasma furnace, and the Valera submerged arc furnace in Western Europe). Several specialty steel companies have established their own, on site, pyro-metallurgical process routes (e.g. AST dc arc furnace in Italy, Avesta dc arc furnace in the UK, Nisshin ac submerged arc furnace in Japan, and the Kawasaki shaft furnace in Japan).399 Dofasco recycles 100 percent of EAF dust to a metals recovery facility. In this way, it is estimated that 15,574 tonnes of the zinc-rich dust were recycled. With the installation of a pneumatic silo at the EAF in 2001, Dofasco has diverted nearly 48,000 tonnes of EAF dust from landfill disposal. The Dofasco web site provides the following update on their EAF dust activities:
“Recycling additional EAF material was the focus of a feasibility study that began in 2003. A cross-functional team developed a new sealed and dustless handling system that can safely filter, sort, store and recycle additional steelmaking by-products. Using this system, heavy particulates found in steelmaking dusts, which contain iron, lime and slag, can be sealed in steel drums and then recycled in the EAF, returning valuable and reusable materials directly back into the steelmaking process. In trials conducted in the fall of 2003, recycling the material showed no negative effects on the environment, steel quality, EAF operations or energy consumption. Work will continue on developing the new handling system in 2004, with the goal of redirecting upwards of 5,000 tonnes of steelmaking by-products from landfill.”400
A company called Horsehead Corporation is the world’s largest recycler of zinc-containing wastes. They are an affiliate of Sun Capital Partners Inc, following a period of time in Chapter 11 bankruptcy, but now appear to be fully functional again.401 The main source of feed for Horsehead’s recycling process is EAF dust. They have a pyro-metallurgical facility that has the capabilities to use a full range of zinc feeds. Most electrolytic zinc refineries do not have such flexibility. Horsehead uses two high temperature metals recovery technologies: (1) a two-step rotary kiln process and (2) a flame reactor process. The EPA had designated their technologies as “Best Demonstrated Available Technology” for the management of EAF dust in the US. The flame reactor process is ideal for on-site recycling. It is a compact unit and a flash-smelting process in which EAF dust is injected into hot gases in a water–cooled furnace downstream from the burner.
399 http://www.epri.com/OrderableitemDesc.asp?product_id= CR%2D108958&targetnid= 267797&value= 04T012.0&marketnid= 267712&oitype= 1&searchdate= 8/30/1997 (State-of-the-Art Assessment Study on Treatment of Specialty Steel EAF Dust Report CR-108958 Date Published Sep 1997) 400 http://www.dofasco.ca/INVESTORS/2004_annual_report/download/DOFASCO_e_AR903_environment.pdf 401 See http://www.horseheadcorp.com/ (Jan-2006)

The Government of Canada Action Plan 2000 on Climate Change
NRCan / RNCan 229 Mar-2006
���������������-������������
The argument that EAF dust be “unlisted” as a hazardous waste is based on the fact that its metal components such as zinc, lead, iron can be separated and sold as by-products which are non-hazardous. De-listing the dust would reduce the costs of transporting the EAF dusts for further processing since hazardous material transportation is more costly than non-hazardous transportation. Several companies are researching alternative processing technologies to process the dust into useable and valuable products. Fermag Inc. is involved in the development of a Montreal based recycling facility402 to extract and recycle ferrite and magnetite pigments from dust, which can be re-sold as cement additives and pigments to the paint and coating industry. Using hydro-metallurgy, this processing will separate lead and zinc that can be sold to associated smelting operations. Competing EAFs dust recycling technologies are often expensive. However, the hydro metallurgical extraction process developed by Fermag might reduce disposal costs and provide a saleable product. If the pilot is successful, the facility will be scaled up and commercialized to recycle up to 30,000 tonnes of hazardous waste per year.403 Ferrinov Pigments Inc. has been carrying out research and development since 1991 to find a way to dispose of EAF dust. The company has an international patent (pending) hydro-metallurgical process for the decontamination and the transformation of steel dust into industrial pigments. The pigments produced belong to a new generation of "mixed metal oxides". These highly anti-corrosion and heat-resistant pigments may be used in paints, inks, and plastics. Decontamination of dust and separation into different fractions are carried out through a hydro-metallurgical process that isolates ferrites and magnetites from other metals. The supply of raw materials for the Sorel-Tracy plant is assured through agreements with steel mills.404 Drinkard Metalox, Inc. (DMI) of Charlotte, NC is also working with a hydro-metallurgical system to process EAF dust into saleable products such as calcium, magnesium and manganese. The process digests EAF dust followed by isolation and retrieval of the individual components. The DMI technology saves energy by eliminating the need for furnace treatment, whereas the competing Waelz kiln process requires two furnace treatment steps to adequately separate EAF dust (see Horsehead Corp.). The DMI process can be implemented on-site at a steel mill, thereby eliminating the expense and risk of transporting hazardous waste.405 The US Department of Energy funded a study but there are no publications to date.406 Significant energy savings have been projected using the DMI approach.407
402 But, the company may have an American parent as per http://www.fermagtechnologies.com/ (Jan-2006) 403 See http://www.ic.gc.ca/cmb/welcomeic.nsf/ICPagesEPrint/85256A5D006B972085256E6F00476B69 for more discussion. (Jan-2006) 404 See http://www.ferrinov.com/index.htm for more details. (Jan-2006) 405 http://www.ferrinov.com/en/ouverture.htm.gov/industry/metalcasting/pdfs/procelecarc.pdf “Project Fact Sheet Steel: Processing Electric Arc furnace Dust into Saleable Chemical Products” 406 http://www.pprc.org/pprc/rpd/statefnd/nc_owr/novelmet.html 407 See http://www.eere.energy.gov/industry/metalcasting/pdfs/procelecarc.pdf (Jan-2006)

The Government of Canada Action Plan 2000 on Climate Change
NRCan / RNCan 230 Mar-2006
SGS Lakefield Research in Ontario has carried out test programs for conventional zinc hydro-metallurgical processes such as roast, leach and electrowin processes. SGS Lakefield Research has experience recovering zinc from secondary sources including EAF dust. They have developed a chloride leaching process for EAF dust using a “NIST” process. They have developed a process that produces pure zinc oxide (ZnO) from chloride leach of EAF dust and also a chloride pyro-hydrolysis process of EAF dust.408 In a typical EAF operation for melting scrap containing iron, approximately one to two per cent of the charge is converted into dust. SGS Lakefield has been researching zinc yields in a carbon monoxide environment. A high zinc-containing EAF dust was processed using a plasma arc furnace in a carbon monoxide gas atmosphere. The degree of zinc removal was a function of reactor temperature, EAF dust feed rate and reactant ratio of dust per litre of CO gas. Increased process temperatures resulted in an increased recovery of zinc to the condensate. In general, the degree of lead removal from the EAF dust was found to be approximately equal to that of zinc. Cadmium in the dust was found to be totally recovered in the condensate.409
17.4.2 Coal Fly Ash A significant portion of Canada’s national energy requirements are met by coal powered electric generating utilities. In fact, 55 Mt of coal are consumed in Canada each year and this accounts for about 17 percent of Canada’s total electricity needs.410 One of the annual by-products of Canadian coal combustion is coal ash. When the coal is burned and exhaust gas created, electrostatic precipitators (or other methods) are used to collect suspended particulate matter known as fly ash, which accounts for 70 to 85 percent of all coal ash. The total amount of coal ash in 2004 was 6.26 Mt.
411
Fly ash is comprised of particles in the range of 50 microns in size. Importantly, fly ash is a pozzolan and that means it can be used to produce a cementitious material. For more information on the properties of fly ash, the Association of Canadian Industries Recycling Coal Ash (CIRCA) can be contacted.412
408 http://www.sgslakefield.com/OC_zinc_oxide_experience.html 409 http://pubs.nrc-cnrc.gc.ca/cmq/06140-1.html 410 International Energy Agency, 2005 edition, Electricity Information, Tables 3-4, Referenced source: IEA/OECD Energy Statistics of OECD Countries 411 Photo credit: http://www.mii.org/Combus/Combus.html (Mar-2006) 412 See www.circainfo.ca, The Executive Director is Anne Weir. (Feb-2006)

The Government of Canada Action Plan 2000 on Climate Change
NRCan / RNCan 231 Mar-2006
Coal fly ash as viewed with a Scanning Electron Microscope by the New York State Department of Environmental Conservation.413
Viewed at 1000x. Note the smooth texture of the spheres. This is a power plant sample.
Same sample taken at 500x.
The spherical shape of fly ash enhances its flowable properties, which makes it economical to handle (CIRCA).
The remaining coal ash product is a heavier material known as bottom ash. This material is frequently contaminated with coal mill rejects that are removed from the system using the same transfer systems. The mill rejects contain pyrite, which means it cannot be used in cementitious applications because the pyrite cause expansion in concrete. Some producers have separate collection and transport systems for the mill rejects and therefore are able to market their bottom ash for use in cementitious systems. Uncontaminated bottom ash is often used as a light weight aggregate in concrete block manufacture. A summary description of this material is provided as follows:
“The remaining 20 percent of the ash is dry bottom ash, a dark gray, granular, porous, predominantly sand size minus 12.7 mm (½ in) material that is collected in a water-filled hopper at the bottom of the furnace. When a sufficient amount of bottom ash drops into the hopper, it is [usually] removed by means of high-pressure water jets and conveyed by sluiceways either to a disposal pond or to a decant basin for dewatering, crushing, and stockpiling for disposal or use.”414
In summary, of the 6.26 Mt of coal ash generated in Canada in 2004, between 4.4 and 5.3 Mt are fly ash, while the remaining 0.8 to 1.5 Mt are bottom ash. According to CIRCA, 31 percent of all fly ash in Canada was recycled in 2004; therefore, it can be estimated that between 3 and 3.7 Mt of fly ash are being sent to stockpile or landfill. This amount represents the greatest opportunity for increased recovery. Europe, for example, presently utilizes 88 percent of all fly ash generated. However, such comparisons are difficult since some European “uses” are defined as disposal activities in Canada (e.g. land remediation such as filling old quarries). The combustion of coal and the generation of fly and bottom ash is depicted in Figure 17.7.
413 See http://www.dec.state.ny.us/website/dar/baqs/micro/whtscfa.html for more fly ash images (Mar-2006) 414 See the Tuner-Fairbank Highway Research Centre at http://www.tfhrc.gov/hnr20/recycle/waste/cbabs1.htm (Feb-2006). Some producers use “dry” removal systems such as conveyors.

The Government of Canada Action Plan 2000 on Climate Change
NRCan / RNCan 232 Mar-2006
Figure 17.7: Dry-Bottom Utility Boiler and Production of Coal Ash
����������)�/���(#�
Fly ash is currently used in a number of applications including the manufacture of cement, cementitious applications (concrete), hydraulic mine backfill (substitutes for cement), flowable fills, grouts etc.), mineral fillers, structural fills, mine tailings remediation, and stabilization of liquid waste. Figure 17.8 compares Canada’s use of fly ash with the USA and helps illustrates the wide range of uses for this material. Figure 17.8: Canadian (2001) and U.S. (2004) Use of Coal Fly Ash415
415 Minerals and Metals Sector, NRCan with CIRCA; and American Coal Ash Association 2004 Combustion Product (CCP) Production and Use Survey, www.ACAA-USA.org
Cement 39.9%
Concrete or grout 38.8%
MiningApplications
13.8%
Mineral filler flowable fill 6.7%
Road-base or sub-base 0.8%
Cement 39.9%
Concrete or grout 38.8%
MiningApplications
13.8%
Mineral filler flowable fill 6.7%
Road-base or sub-base 0.8%
Concrete or grout
50.3%
Cement 8.4%
Flowable fill 0.6%
Soil modification stabilization 1.8%
Other 7.3%
Aggregate 0.0% Waste stabilization/solidification 8.7%
Agriculture 0.2%
Mining applications 4.0%
Structural fill 16.7%
Mineral filler in asphalt 0.3%
Road-base/sub-base 1.7%
Snow & ice control 0.0%Concrete
or grout 50.3%
Cement 8.4%
Flowable fill 0.6%
Soil modification stabilization 1.8%
Other 7.3%
Aggregate 0.0% Waste stabilization/solidification 8.7%
Agriculture 0.2%
Mining applications 4.0%
Structural fill 16.7%
Mineral filler in asphalt 0.3%
Road-base/sub-base 1.7%
Snow & ice control 0.0%

The Government of Canada Action Plan 2000 on Climate Change
NRCan / RNCan 233 Mar-2006
Additional uses and benefits of fly ash are identified and explained on the CIRCA web site including controlled low strength material (CLSM, a.k.a. flowable fill), roller compacted concrete (RCC), structural fill, concrete products and pre-cast concrete.416 One statistic that is relevant to this report is the fact that the manufacture of one tonne of cement produces one tonne (closer to 0.8 tonne for modern plants) of carbon dioxide. One of the significant uses of fly ash is in the production of concrete. Recognition of the performance-enhancing qualities (reduced permeability and higher strengths mean greater durability) that fly ash imparts to concrete are evidenced in Canadian Standards Association (CSA) technical specifications and increasing market demand. Of relevance to coal fly ash are the efforts of EcoSmart Concrete Partnership, the Canada Green Building Council and Leadership in Energy & Environmental Design (LEED) Canada which aim to reduce greenhouse gas emissions by promoting innovative construction practices that require concrete.417 Therefore, the substitution of fly ash for cement in the production of concrete has a direct reduction impact on GHG emissions and the use of energy and natural resources.
418
The construction of roads in North America is an enormous industry. In particular, concrete roads could potentially consume large amounts of fly ash. The U.S. Federal Highway system incorporates more concrete and fly ash than is used in Canada.419
Fly ash in the manufacture of autoclaved aerated concrete (AAC) blocks has been used in Britain since the 1940’s but appears to be a relatively recent product in North America. Not only do the AAC blocks contain up to 70 percent fly ash but they also provide some interesting thermal benefits.420 There are also plants in India and Eastern Europe that routinely produce AAC products using ash as a raw material. However, according to CIRCA it should be noted that concrete mix containing greater than 20 percent is an "engineered material" and therefore must be batched and tested prior to use.
416 See Technical Fact Sheets #1-7 at www.circainfo.ca. Also refer to the Learning Module on Traditional and Non-Traditional Uses of CCP found at the same URL. 417 http://www.ecosmart.ca/about_index.cfm (Feb-2006) 418 Photo credit: http://www.aep.com/about/coalCombustion/currentProjects/Rockport.htm (Mar-2006) 419 http://www.cement.ca/cement.nsf/0/E30DF5453354042285256A9D00696EAA?OpenDocument (Mar-2006) 420 See http://www.advancedbuildings.org/main_t_building_aerated_concrete.htm or http://www.aacpa.org/ (Mar-2006)

The Government of Canada Action Plan 2000 on Climate Change
NRCan / RNCan 234 Mar-2006
����
The primary challenge that fly ash use faces as a supplementary cementing material is the fact that the vast majority of coal production in Canada is located in Alberta and B.C., whereas the production and use of concrete correlates with the most densely populated areas of the country, namely Ontario and Quebec. A number of observations can be made regarding the challenge of increasing the use of coal ash in central Canada:
� Ontario power plants already supply concrete quality ash to the ready mix industry in Ontario and Manitoba and to hydraulic mine backfill applications in Ontario: Is there market demand for more ash in Ontario?
� If there were more demand for ash, American suppliers in Ohio and other states might be more competitive, since they are closer to Ontario and Quebec.421
� Other products compete with ash in the “supplementary cementing material” market.422 For example, a significant amount of ground granulated blast furnace slag is readily available in Southern Ontario.
Fly ash must be managed like portland cement, only containment of the powder should be more rigorous since the material is highly flowable. Concrete plants need to have separate storage infrastructure in order to utilize fly ash in place of cement in concrete. Most fly ash not utilized in Canada is stored in landfills or lagoons. Storage silos are also used on an interim basis where fly ash is kept pending delivery to an end user. Coal ash is usually assessed for its “hazardousness” using an acetic acid leach test. Both Ontario and Canada rely on US EPA protocol in this regard. The Canadian regulations list toxic compounds that can trigger a hazard classification and, according to CIRCA, this has never occurred with coal fly ash.423 Given the fact that fly ash is used in an ongoing industrial process without further combustion, Ontario defines this material as recyclable (O. Reg. 347). The Government of Canada regulations are more general in that they provide the criteria for assessing hazardousness.424 These criteria are based on the UN Orange Book425 and therefore are the same in Canada (including Ontario), the United States as well as under the Basel Convention. The implementation of “maximum achievable control technology” (MACT) to address emission issues at coal fired power plants may result in the addition of mercury to fly ash particulates.426 Some research into the matter suggests that mercury in coal ash is
421 See http://www.flyash.com/flyashconcrete.asp to appreciate potential scale of US supply of fly ash to Canadian concrete markets. 422 Norman F. McLeod, 2005, A Synthesis of Data: On the Use of Supplementary Cementing Materials (SCMs) in Concrete Pavement Applications Exposed to Freeze / Thaw and Deicing Chemicals, Cement Association of Canada and Government of Canada Action Plan 2000 on Climate Change 423 Personal communication with John Flynn, Director at CIRCA (Mar-2006) 424 See http://www.ec.gc.ca/CEPARegistry/regulations/detailReg.cfm?intReg=84 for more information. 425 http://www.un.org/Pubs/environ/95viii1.htm (Mar-2006) 426 Danold W. Golightly et al., Ohio State University, 2005, Mercury Emissions from Concrete Containing Fly Ash and Mercury-Loaded Powdered Carbon, 2005 World of Coal Ash (WOCA)

The Government of Canada Action Plan 2000 on Climate Change
NRCan / RNCan 235 Mar-2006
unlikely to be released into the environment through volatilization or leaching for certain coal types427 but continued monitored and increased understanding of this issue is obviously warranted. For the production of concrete, the maximum content of carbon in coal fly ash is around 6 percent (ASTM C618 and CSA A3000). However, technologies (such as MACT) to reduce the emission of nitrogen oxides (NOx) are also resulting in increased carbon content of fly ash. To rectify this problem, beneficiation plants are being installed to ensure that such fly ash continues to meet market specifications.
17.4.3 Ferrous and Nonferrous Slag Natural ores are mined in Canada to produce metallic products. High temperature processes are required to separate the metal and nonmetal elements found in the ore. The nonmetal constituents end up in a by-product called slag, which is a granular rocky material. This section covers ferrous (iron and steel) and nonferrous (copper, nickel, lead, zinc, etc.) slag. The primary purpose of this section is to provide some projections regarding the amounts of slag material generated in Canada. /�����������
Many different forms of ferrous slag are produced including blast furnace, air-cooled, pelletized or expanded, granulated and steel furnace slag. For a detailed description of each, the reader is encouraged to consult the National Slag Association.428 As discussed in Section 17.3.1, there are two types of steel mill furnaces, the electric arc furnace (EAF) and the basic oxygen furnace (BOF), and each has a slag phase in which the liquid metal is refined and the impurities removed. The average amount of BOF slag produced is around 121 kg/t of steel while the EAF process produces about 116 kg/t of steel product.429 The molten slag floats on top of the steel thereby facilitating their division. Figure 17.9 shows where slag is produced in the blast furnace process. The ferrous slag product of greatest interest in Canada is referred to as ground granulated blast furnace slag (GGBFS). All GGBFS produced is potentially useable as supplementary cementing material430 or as granular base in highway construction. It is estimated that 2.3 Mt of ferrous slag are generated in Canada every year, as of 2003, and approximately 2 Mt of that slag is already sold as a by-product. 431
427 Mei Xin et al., University of Nevada and Electric Power Research Institute, 2005, Mercury Release from Coal Combustion Products (CCPs), 2005 World of Coal Ash (WOCA) 428 See http://www.nationalslagassoc.org/ and look under “slag information”. 429 F. Akbari & C.A. Pickles, 1998, “A Review of the utilization and processing of steeling making slags”, in S.R. Rao (et al.) (eds.): Waste Processing and Recycling III, p. 124, Calgary: The Metallurgical Society of CIM. 430 N. Bouzoubaâ & B. Fournier, 2003-4, Current Situation of SCMs in Canada, MTL, Natural Resources Canada and Government of Canada Action Plan 2000 on Climate Change, p.32 431 Personal communication with Bruce Boyd, Canadian Steel Producers Association of Canada, Dec-2005

The Government of Canada Action Plan 2000 on Climate Change
NRCan / RNCan 236 Mar-2006
Figure 17.9: Blast Furnace Operation and Production of Slag
Potential uses for slag are provided by the National Slag Association in Table 17.8.432
Table 17.8: Ferrous Slag and Potential Uses
Slag Form
Uses
Blast Furnace (BF) Air-Cooled
Asphalt aggregate, Concrete aggregate, Insulation/ mineral wool, Cement raw feed, Agriculture, Fill, Roof aggregate, Railroad ballast, Glass manufacture, Environmental Applications
BF Expanded Concrete masonry, Lightweight concrete, Lightweight fill, Insulation
BF Granulated GGBFS cement, Soil cement, Roller compacted concrete
Steel Slag Asphalt aggregate, Fill, Cement raw feed, Agriculture, Environmental Applications, Railroad ballast
432 http://www.nationalslagassoc.org/Slag_Information.html, also see http://www.slagcement.org for more related information (Mar-2006)

The Government of Canada Action Plan 2000 on Climate Change
NRCan / RNCan 237 Mar-2006
433 434 "��)�����������
For a concise description of the metallurgical process resulting in nonferrous outputs, the Turner-Fairbank Highway Research Centre (US Department of Transportation) is a good reference point.435 As described in the ferrous paragraphs, the smelting of mineral inputs to produce the desired nonferrous metal generates a residual slag and the nature of this material depends on whether it is copper, nickel, phosphorous, lead, lead-zinc or zinc. A conceptual overview of how nonferrous is produced is provided in Figure 17.10.
Figure 17.10: Material Flow for Copper, Nickel and Lead-Zinc Slag Production
The vital statistics regarding nonferrous smelter slag are: 3.05 Mt generated, 1.4 Mt sold (reused or recycled), and 1.65 Mt stockpiled. These data are for 1997. The amount of nonferrous slag that is estimated in the current stockpile is 200.5 Mt.436
433 Photo credit: http://www.tailings.info/images/pictures/smelter%20slag.jpg 434 Photo credit: http://www.slag.com/granular.html 435 http://www.tfhrc.gov/hnr20/recycle/waste/cbabs1.htm (Mar-2006) 436 Data provided by David Koren, Minerals and Metals Sector, NRCan, Sep-2005
Mill and Concentrate
Smelting furnace
Secondary Furnace
Processing
Nonferrous metal ore
Roasting if required
Smelter slag
Disposal UseCement, asphalt, aggregate, backfill, ballast, roofing material, (etc.)
Optional Optional
Optional
Mill and Concentrate
Smelting furnace
Secondary Furnace
Processing
Nonferrous metal ore
Roasting if required
Smelter slag
Disposal UseCement, asphalt, aggregate, backfill, ballast, roofing material, (etc.)
Optional Optional
Optional

The Government of Canada Action Plan 2000 on Climate Change
NRCan / RNCan 238 Mar-2006
����
The primary challenge facing the utilization of nonferrous smelter slag is distance to market. There may also be quality issues to address in regards to the residual metal content of the slag since leaching can be problematic wherever appropriate controls are lacking. Further study is required to determine if the metals contained within the slag are stable and under which conditions would they start to leach out. GGBFS is considered to be volumetrically stable whereas steel slag is comparatively unstable and must be subjected to various quality control procedures before it can be used for highway construction.437 The overall process by which ferrous or nonferrous slag can be utilized in the construction of highways is neatly depicted in Wang and Emery (2004): In summary, the characteristics of slag vary greatly and therefore it is important to evaluate three key aspects for project viability – chemical and mineral properties, expansion properties, and physical and mechanical properties – before proceeding to one of three potential end-uses, which are granular and hot mix asphalt aggregate, concrete aggregate, and cementitious applications. (���������
Falconbridge Ltd. sales slag to contractors in Timmins, Ontario where it is used for sandblasting and industrial applications.438 More significantly in terms of tonnage, several million cubic metres of nickel slag from Falconbridge’s Dominican Republican operations were used as aggregate in a 140 kilometre highway project.439 Fenicem Minerals Inc. (FMI) developed a process to transform nonferrous slag from Inco for the purposes of making concrete. FMI have a joint patent with another company called Rainbow Concrete Industries Ltd. to undertake the work and a number of products are available.440 Further, according to FMI,441 it is possible to recover residual metals (copper, nickel and cobalt) from base metal smelter slag – the remaining material is converted to obsidian, which has pozzolanic properties. A pilot was conducted in Sudbury Ontario but this technology was not being employed at the time of this report.
437 G. Wang & J. Emery, 2004, Technology of Slag Utilization in Highway Construction, Annual Conference presentation, Transportation Association of Canada (www.tac-atc.ca) 438 http://www.falconbridge.com/documents/sustainable_development/NorFal_2004_Sustainable_Dev.pdf (Mar-2006) 439 Wang & Emery, pp. 7-8 440 http://www.rcil.ca/framework/sl11.html (Mar-2006) 441 See http://www.krofchak.com/ (Mar-2006)
The Government of Canada Action Plan 2000 on Climate Change
NRCan / RNCan 239 Mar-2006
17.4.4 Foundry Sand 442 A foundry produces metal castings from molten metal. Sand is used to create moulds in which the castings are made. Sand works well in this regard because of its refractory (heat resistant) characteristics. There are 145-200 foundries in Canada and background details on this industry sector can be found at several informative web sites.443 The Canadian Foundry Association represents large, medium and small companies in the foundry industry across Canada also can provide some background information.444 The Canadian foundry industry has been fragile in the last 10-15 years for several compelling reasons and as a result foundries are closing down:
� The auto industry, which is the largest customer for foundries, is moving from metal to plastic parts.
� Castings are being imported from off-shore, sometimes at half of the cost of producing the castings in North America and therefore the “Big Three” automakers have all established foundries in Mexico.
� The American and Canadian auto sector is being seriously challenged by foreign auto makers who are sourcing their castings elsewhere.
/������������������������
Foundry sand consists primarily of high quality silica sand or lake sand that is bonded to form moulds for ferrous (iron and steel) and nonferrous (copper, aluminum, brass for instance) metal castings. These sands are clean prior to use but after casting contain small amounts of materials such as tramp metals, clays, sea-coal and cereal flour and residual binder materials that are introduced to the sands during moulding, or are picked up from the metal casting. These residuals can preclude the total reuse of spent foundry sand in the foundry. The tramp metals are usually recovered where practical, and the remaining foundry sand is generally classified as non-hazardous material. Phenolic binders in the sands do not usually cause environmental concerns, aside from aesthetic problems caused by their foul odour. Demand for foundry sand is dependent mainly on automobile and light truck production. Ferrous foundries are the largest generators of foundry sand, comprising upwards of about 95 percent of the total amount of spent foundry sand produced. The demand for foundry sand has been reduced by the advent of continuous casting in the steel industry.
442 The background research for this section was conducted and reported on by Kelleher Environmental. 443 See http://www.oee.nrcan.gc.ca/industrial/opportunities/sectors/foundry.cfm?attr=24 or http://www.oee.nrcan.gc.ca/cipec/ieep/newscentre/foundry/profile.cfm?PrintView=N&Text=N 444 See http://www.foundryassociation.ca/ (Jan-2006)

The Government of Canada Action Plan 2000 on Climate Change
NRCan / RNCan 240 Mar-2006
Natural Resources Canada reports that foundries used the following total amounts of silica in foundries:445
� 312,400 tonnes in 2000; � 290,806 in 2001 and � 258,768 tonnes in 2002.
In comparison, Table 17.9 shows the amount of silica sand imported to Canada over a three year period, most of which is used as foundry sand. The numbers do not match the usage ones because some of the sand is stockpiled or used for other purposes.
Table 17.9: Canadian Imports of Silica Sand from Other Countries, By Province, 2001-2003 446
Imported Silica for Foundry Sand (tonnes) Province/Territory
2002 2003 2004 (preliminary)
Nova Scotia New Brunswick Quebec Ontario Manitoba Saskatchewan Alberta British Columbia
0 989
34,421 353,168
45,931 3,638
30,517 18,530
91 2,509
39,709 596,517
53,026 2,035 8,869 2,306
- 2,759
50,864 477,733
25,739 1,752 2,000 3,339
Total
487,194 704,038 564,186
Value
$13.5 million $ 11.0 million $ 11.6 million
A 1993 report by Ontario Ministry of the Environment identified that the foundry industry in Ontario at that time consisted of about 35 ferrous (iron and steel) and 50 nonferrous (mostly copper, aluminum and brass) foundries that produced about 500,000 tonnes of product annually. It was estimated that ferrous foundries in Ontario produced 380,000 tonnes/year of spent foundry sand in 1993.447 Nonferrous metal foundries in Ontario were estimated to produce 10,000 tonnes of spent foundry sand in the same year.448 These figures would suggest an overall total of 390,000 tonnes of spent foundry sand in Ontario only.
445 Personal communication with Michel Dumont, Silica/Quartz Commodity Officer, Natural Resources Canada, Dec-2006 (note 446 See http://www.nrcan.gc.ca/mms/cmy/content/2004/51.pdf , Table 2 (Feb-2006) 447 John Emery Geotechnical Engineering Ltd., 1993, Spent Foundry Sand - Alternative Uses Study, Ontario Ministry of the Environment and Energy 448 Ibid.

The Government of Canada Action Plan 2000 on Climate Change
NRCan / RNCan 241 Mar-2006
An alternative way of estimating Canadian foundry sand numbers is to consider relative American data. According to FIRST,449 there are 3,000 foundries in the US with 200,000 employees (this works out to about 67 staff per foundry). In Canada, there are 145-200 foundries with about 13,000 employees450 (this works out to 65-89 staff per facility so an extrapolation from US data to Canada appears reasonable). FIRST indicates that 6-10 million short tons of foundry sand are discarded annually (this equates to 5.4-9 million metric tonnes). Using employees as a ratio it is projected that 351,000 to 585,000 tonnes of spent foundry sand are discarded or available for recycling in Canada each year. Most of the foundry sand in the 1990’s was disposed in municipal and private landfills, with a relatively small amount of the spent sand reclaimed for foundry reuse or recycled for other purposes. However, the industry has contracted considerably since the early 1990’s451 and it is not certain what impact that has had on the number of foundries, employment levels and generation of spend sand. /�������������#�������������
Iron and steel castings are produced by melting steel scrap, alloys and other additives in an appropriate melting furnace such as a cupola or electric cordless induction melter, then transferring the molten iron and steel in ladles to be poured into moulds. The moulds are fabricated using foundry sand, typically silica sand or lake sand, bonded together using a small amount of clay or organic chemical binder. Ferrous foundries basically use two types of moulding processes:
� A mechanically bonded process or green sand system, and � Chemically bonded processes involving various organic binders and catalysts.
The mechanically bonded process or green sand system typically involves adding up to about 10 percent bentonite clay (as the binder) and 5 percent sea coal (a carbonaceous mould additive to improve casting finish) to silica sand. The mixture is then mechanically formed into the desired shape against a pattern and pressed to make the hardened mould. Chemically bonded processes involve the use of one or more organic binders in conjunction with catalysts and different hardening and setting procedures. Foundry sand makes up 97 percent of the mixture, with the various additives accounting for the remaining 3 percent.
449 Foundry Industry Recycling Starts Today, see http://www.foundryrecycling.org (Jan-2006) 450 See http://www.oee.nrcan.gc.ca/industrial/opportunities/sectors/foundry.cfm?attr=24 (Jan-2006) 451 Personal communication Bob Van Wyngarten, Lakeshore Sand, December, 2005
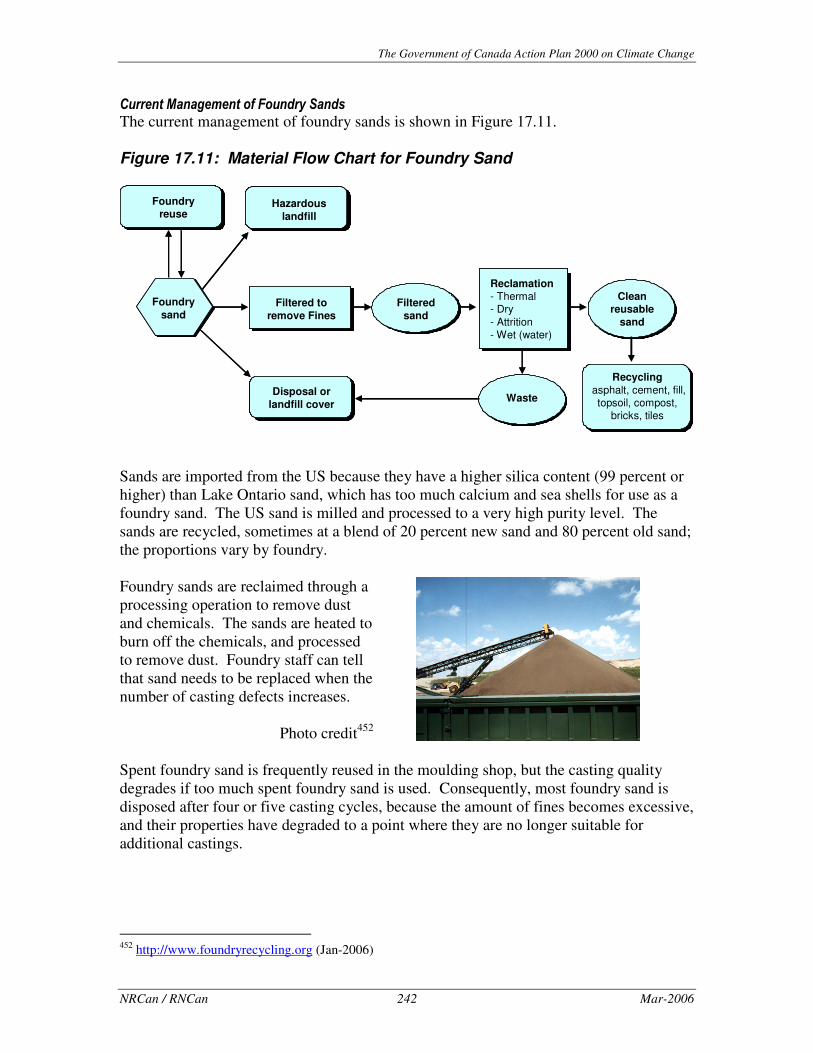
The Government of Canada Action Plan 2000 on Climate Change
NRCan / RNCan 242 Mar-2006
��������*�����������)�/������������
The current management of foundry sands is shown in Figure 17.11. Figure 17.11: Material Flow Chart for Foundry Sand Sands are imported from the US because they have a higher silica content (99 percent or higher) than Lake Ontario sand, which has too much calcium and sea shells for use as a foundry sand. The US sand is milled and processed to a very high purity level. The sands are recycled, sometimes at a blend of 20 percent new sand and 80 percent old sand; the proportions vary by foundry. Foundry sands are reclaimed through a processing operation to remove dust and chemicals. The sands are heated to burn off the chemicals, and processed to remove dust. Foundry staff can tell that sand needs to be replaced when the number of casting defects increases.
Photo credit452 Spent foundry sand is frequently reused in the moulding shop, but the casting quality degrades if too much spent foundry sand is used. Consequently, most foundry sand is disposed after four or five casting cycles, because the amount of fines becomes excessive, and their properties have degraded to a point where they are no longer suitable for additional castings.
452 http://www.foundryrecycling.org (Jan-2006)
Filtered to remove Fines
Disposal or landfill cover
Hazardous landfill
Foundry reuse
Recyclingasphalt, cement, fill, topsoil, compost,
bricks, tiles
Reclamation- Thermal- Dry- Attrition- Wet (water)
Foundry sand
Filtered sand
Clean reusable
sand
Waste
Filtered to remove Fines
Disposal or landfill cover
Hazardous landfill
Foundry reuse
Recyclingasphalt, cement, fill, topsoil, compost,
bricks, tiles
Reclamation- Thermal- Dry- Attrition- Wet (water)
Foundry sand
Filtered sand
Clean reusable
sand
Waste

The Government of Canada Action Plan 2000 on Climate Change
NRCan / RNCan 243 Mar-2006
����������,��)���������/������������
Foundry sand is not considered “spent” until after it has left the foundry (i.e. it has already been through 4-5 cycles). Reclamation and reuse of foundry sand within the moulding operation is a standard practice. Some sand is currently used as an aggregate substitute. Foundry sand can also be used as a silica source for some applications, although its high content of fine particles limits its use to particular applications. Some spent foundry sand is supplied to the asphalt and cement industry as a feedstock. Some processing (screening to remove large pieces) is required before the spent sand can be reused in this manner. There are also limits to the amount which can be blended into these operations. Spent foundry sand could be used as a high grade silica or supplementary silica source for a number of industries, in particular:
� Aggregates and building materials (particularly fill applications); � Cement industry; � Mineral wool products industry.
An analysis of the potential for foundry sand to be used as an aggregate substitute in Ontario was assessed in 1993.453 Major uses of sand, gravel and crushed stone are in roads, concrete aggregates and asphalt aggregates. The analysis concluded that all of the 400,000 tonnes/year of foundry sands produced in Ontario could easily be absorbed by the demand for aggregate materials given the large amounts of aggregate produced and used.454 Because of the fines profile of foundry sand, and the dark colour, the best use was considered to be in transportation facilities construction and maintenance applications such as engineered fill, ballast, pipe bedding, sub-base, base, shouldering and cold and hot mixes. Spent foundry sand can be used as an aggregate in backfill applications: This has been allowable practice in Ontario since the late 1970’s. However, this has not occurred because of supply concerns and the need to have a stockpile of 5,000 tonnes of available material, processed and crushed to remove oversize materials, cores or core butts, tramp metals. About 14 million tonnes of hot mix asphalt are used in Ontario annually. Fine aggregate makes up about 50 percent of the mix. A somewhat dated survey from 1990 indicates that about 20,000 tonnes of spent foundry sand were incorporated into the mix, primarily because hot mix producers did not recognize that spent foundry sand was readily available, or could be readily incorporated. There is always an on-going concern regarding secure supplies of material when a substitute such as foundry sand is used. Spent foundry sand can not be used to make hot mix aggregate on its own, because it
453 Emery, 1993 454 According to the Canadian Minerals Yearbook, the amount of crushed stone produced for typical aggregate purposes was 114.7 million tonnes in 2003. See http://www.nrcan.gc.ca/mms/cmy/content/2004/39.pdf (Jan-2006)
The Government of Canada Action Plan 2000 on Climate Change
NRCan / RNCan 244 Mar-2006
contains too much fine material. Clean foundry sand could theoretically be incorporated to a maximum of 15 percent of the mix. However, foundry sand also has hydrophilic properties (it has an affinity for water), which results in rapid deterioration of a pavement where foundry sand is incorporated into the asphalt at high percentages. The Ontario Waste Diversion Program provided funding to one hot mix asphalt supplier to build storage facilities to secure a supply of foundry sand for his operation. Product consistency and an adequate supply are the major considerations in a case such as this. Where processing and storage of foundry sand are required, the cost of incorporating it into selected building and paving materials can not be justified compared to low disposal costs in most locations in Canada. Foundry sand is not suitable for concrete fine aggregate because its gradation profile contains too much fine material. The use of foundry sand as a feedstock for cement manufacture has been proven since the 1970’s, but has not been adopted widely. Trials were conducted in the Hamilton, Ontario area in the late 1970’s, after the process had been proven by the Peerless Cement Company in Detroit, Michigan. Only limited information on the use of foundry sand as a feedstock for cement manufacture is in the public record. Available research indicated that Portland cement made using 13.4 percent foundry sand has slightly higher compressive strengths than conventional cement. Initial interest in Ontario waned due to a lack of secure supplies of foundry sand. At an incorporation rate of 5 percent, the Ontario cement industry could absorb 200,000 tonnes per year of foundry sand, or 50 percent of the amount produced. The cement industry already uses other industrial by-products such as fly ash as a silica source. Spent foundry sand is not considered a promising source of material for the mineral wool industry (rock wool, slag wool or glass fibre), because it would need to be briquetted to prevent sand particles being blown up the cupola stack. ������������ �����#�"����
It appears that there are many opportunities to use foundry sand as a feedstock in certain aggregate substitute applications, and also in the cement industry. The key barrier to more widespread adoption of this practice is a lack of confidence in a secure supply of spent foundry sand being consistently available. Small foundries only produce small amounts of foundry sand. To direct these amounts to beneficial use, they would need to be transported to a central location where they could be processed and stockpiled. A number of efforts were made in the past to explore the viability of locating central facilities where sand from a number of foundries could be centrally processed and stored, thereby overcoming the barriers to increased incorporation into a range of silica-related applications. There is a need to better identify the amounts of spent foundry sand currently produced, and the amount currently directed to other industries, such as cement and asphalt. With better data, a strategy could be developed to direct the remaining foundry sand (probably in the order of 250,000 tonnes per year) to useful purpose.

The Government of Canada Action Plan 2000 on Climate Change
NRCan / RNCan 245 Mar-2006
17.4.5 Mine Wastes Two kinds of mine waste are considered: mine tailings and waste rock. Government and industry representatives participated in a 1994 workshop that addressed mine reclamation issues. The workshop report provides some order of magnitude estimates for the amount of mine waste generated.455 In the report summary, reference is made to 7 billion tonnes of metal-mine and industrial tailings plus a further 6 billion tonnes of surface waste rock. These figures are substantially reduced when consideration is given towards those mine wastes that are actual or potential sources of acid:456 1,878 Mt tailings and 739 Mt of waste rock.457 These latter numbers are the ones that will be used in this report. These materials are not considered to be recyclable in the traditional sense although they may be use on site for mine closure purposes. Potash is mentioned briefly in Chapter 18 when an attempt is made to paint the “complete” picture of residual matter in Canada. The Canadian production of potash is 16.5 Mt per year and the majority of this is in Saskatchewan. For every tonne of potash product produced, about 1.5 tonnes of residue are generated that are comprised mostly of impure salt plus smaller amounts of anhydrite, clay and dolomite. It can be calculated that Canada generates 24.8 Mt of residue from its potash operations every year. This residual is disposed of in specially engineered dams and ponds. Some of the salt is reportedly used for de-icing local Saskatchewan roads.458 The main issue with regard to these materials is environmental liability. NRCan is working with the Mining Association of Canada to address these issues on an ongoing basis through the Mine Environment Neutral Drainage (MEND) Program. For example, some of the elements of the MEND program are prediction, prevention, control, treatment and monitoring of acid drainage.
455 G. Feasby and R.K. Jones, NRCan, 1994, Report of Results of a Workshop Mine Reclamation (Hosted by the IGWG-Industry Task Force, Toronto, Ontario), MEND Report 5.8e 456 For more information consult on acid mine drainage see http://www.nrcan.gc.ca/mms/canmet-mtb/mmsl-lmsm/mend/ (Mar-2006) 457 Feasby & Jones, Table 2 458 See http://www.mineralresourcesforum.org/docs/pdfs/phosphate_potash_mining.pdf for more information on how potash residuals are managed. (Mar-2006)

The Government of Canada Action Plan 2000 on Climate Change
NRCan / RNCan 246 Mar-2006

The Government of Canada Action Plan 2000 on Climate Change
NRCan / RNCan 247 Mar-2006
Chapter 18 Summary Projections and Greenhouse Gas Implications
18.1 INTRODUCTION .....................................................................................................247 18.2 SUMMARY OF MATERIALS DISPOSED BY SECTOR .................................................248
18.2.1 Residential, IC&I and CR&D Sectors .....................................................248 18.2.2 Selected Mineral and Metal Residual Materials Disposed......................249 18.2.3 Forestry and Agricultural Residue ..........................................................250 18.2.4 The (Nearly) Complete Picture................................................................251
18.3 RECOVERY PROJECTIONS ......................................................................................253
18.3.1 Residential Sector Projections.................................................................253 18.3.2 IC&I Sector Projections ..........................................................................255 18.3.3 CR&D Sector Projections........................................................................255 18.3.4 Selected Industrial Mineral and Metal Residuals Projections ................256
18.4 THE GREENHOUSE GAS BENEFIT OF RECYCLING ..................................................259
18.4.1 GHG Factors ...........................................................................................260 18.4.2 Projected Material Recovery Rates and GHG Values for the Residential,
IC&I and CR&D Sectors .........................................................................262 18.4.3 Projected GHG Values for Selected Industrial Residuals .......................265
18.5 SUMMARY.............................................................................................................268

The Government of Canada Action Plan 2000 on Climate Change
NRCan / RNCan 248 Mar-2006
18.1 Introduction The purpose of this chapter is threefold: (1) to summarize all of the “waste” characterization projections and estimates made in the previous thirteen, (2) to identify and quantify the resource recovery opportunities that exist and (3) to round out the analysis with an assessment of the potential for greenhouse gas emissions reductions vis-à-vis increased recycling activity across the Canadian economy.
18.2 Summary of Materials Disposed by Sector This report has considered “waste” mostly within the framework of three sectors: residential, IC&I (institutional, commercial and industrial) and CR&D (construction, renovation and demolition). This approach is largely consistent with the efforts of the provinces that seek to minimize the amount of material being disposed of in landfills. However, it has also been shown in Chapters 16 and 17 that large amounts of discarded material are unaccounted for, primarily in the industrial sector – these materials are often not managed through traditional “municipal” waste management systems; hence the data are more difficult to track. In addition to the industrial minerals and metals process by-products, there are literally millions of tonnes of other materials discarded in Canada that have not been discussed in this report. Therefore, in this section, a brief overview is given to establish the proper context.
18.2.1 Residential, IC&I and CR&D Sectors Summaries of the characterization projections from Chapters 5 through 15 are provided in Table 18.1. To reiterate earlier discussion points, the number of categories is relatively few even though some waste characterization studies include as many as 58 or in one case 700459 categories of material. Materials that occur infrequently or in very small amounts in the waste stream are likely to generate unreliable or misleading data, particularly for the purposes of provincial or national projections. Further, all figures in Table 18.1 are rounded to the nearest thousand to reflect the low level of precision. While the residential figures are relatively sound, the IC&I and CR&D are less so, as discussed in Chapter 16. A reporting challenge regarding these sectors is that material ranges should be used to reflect low confidence in the projections. One compromise would be to use averages for the purposes of providing summary numbers; however, in so doing the total amount for each disposal stream is nearly one million tonnes greater than the Statistics Canada figure for 2002. Therefore, the IC&I and CR&D numbers presented in Table 18.1 are based on the so-called “Regional Approach”, summarized in Tables 16.6 and 16.8 (this keeps the report figures more in line with Statistics Canada).
459 See http://waste.eionet.eu.int/wastebase (Dec-2005) Also see Appendix D, p. 35.

The Government of Canada Action Plan 2000 on Climate Change
NRCan / RNCan 249 Mar-2006
Table 18.1: Composition of Materials Disposed of in Canada from the
Residential, IC&I and CR&D Sectors, 2002 (tonnes)
Material
Residential IC&I CR&D Totals
Paper Glass Ferrous Nonferrous Plastics Organics Wood Renovation Textiles & rubber Multi-material Haz-waste Other Concrete Asphalt Drywall
2,072,000 432,000 277,000
65,000 890,000
4,233,000 70,000 90,000
154,000 73,000 78,000
1,022,000
4,807,000 333,000 538,000
81,000 1,326,000 2,472,000
808,000 369,000 294,000
68,000 26,000
430,000
33,000
24,000 80,000
875,000
826,000 459,000 216,000 315,000
6,912,000 765,000 839,000 226,000
2,216,000 6,705,000 1,753,000
459,000 448,000 141,000 104,000
2,278,000 459,000 216,000 315,000
Total
9,456,000 11,552,000 2,828,000 23,836,000
Numbers are rounded. Some residual error is present.
18.2.2 Selected Mineral and Metal Residual Materials Disposed �
This section provides a summary of Chapter 17 in which selected waste materials are covered. The selected materials are not addressed in any of the conventional waste characterization studies (e.g. municipal waste audits). Targeted material streams are those that have mineral or metal components. The materials and product groups considered in this section are not intended to be all inclusive. A review of Tables 16.1 and 16.2 highlights the fact that the non-residential sector is both immense and diverse and, accordingly, the quantity and composition of process residue generated is complex. Only the most detailed materials flow accounting would be able to map out all the inputs and outputs consumed and produced in the Canadian economy,460 and that is beyond the scope of this report. Table 18.2 summarizes the estimated tonnage of material disposed or stockpiled in Canada, with no regional distinctions provided. Mine waste is excluded from this table.
460 See http://www.nrtee-trnee.ca/Publications/HTML/Complete-Documents/Report_Indicators_E/ESDI-Report_Chapter5_E.htm, http://waste.eionet.eu.int/mf/1 or http://www.is4ie.org/images/Rogich.pdf for further discussion (Dec-2005).

The Government of Canada Action Plan 2000 on Climate Change
NRCan / RNCan 250 Mar-2006
Table 18.2: Summary of Selected Mineral and Metal Materials Disposed in Canada in 2002 (tonnes)
Sector and Material Categories
Disposed or Stockpiled
Rounded Tonnes
Residential and IC&I Sectors Tires (off the road) White Goods Electronic and Electric Equipment Automobile Shredder Residue
172,500 - 345,000 t
16,720 - 54,340 t 180,300 t 357,000 t
259,000
36,000 180,000 357,000
Civil Engineering Sector Concrete
1.87 Mt
1,874,000
Industrial Sector Electric Arc Furnace Dust Coal Ash (fly + bottom) Ferrous Slag Nonferrous Slag Foundry Sand
66,000 - 165,000 t
3.8 - 5.2 Mt 300,000 t 1.65 Mt
351,000 - 585,000 t
116,000
4,500,000 300,000
1,650,000 468,000
Total
9,560,000
�
Note: To avoid double counting, E-waste is not included in this table’s total since it is assumed to be included in Table 18.1 (residential or IC&I waste). The concrete identified in this table is assumed to be that which is not included in the Statistics Canada WMIS 2002 survey, for which characterization estimates were made using both the Regional and Coefficient approaches (see Section 16.4).
�
18.2.3 Forestry and Agricultural Residue �
The purpose of this section is to provide a very brief summary of the residue being generated in two other large parts of the Canadian economy; namely, the forestry and agricultural sectors. /�������
In an NRCan study from 1999 it was estimated that Canada’s forest product mills produced 17.7 Mt of wood residues each year.461 Of that amount, about 70 percent or 12.3 Mt are utilized (energy or value added) and the remaining 5.4 Mt are discarded. According to the study, Canada’s residual utilization rate is trending upward as mill technologies improve, harvest levels decrease and as consideration towards biomass as an energy source increases. The use of wood residue as a fuel source would also help Canada reduce greenhouse gas emissions since wood is biogenic.462 461 Canadian Forest Service, NRCan (Terry Hatton), 1999, Canada’s Wood Residues: A Profile of Current Surplus and Regional Concentrations (DRAFT), National Climate Change Process, Forest Sector Table. 462 ICF Consulting Ltd., Determination of the Impact of Waste Management Activities on Greenhouse Gas Emissions: 2005 Update Final Report, Environment Canada and Government of Canada Action Plan 2000 on Climate Change (NRCan), p. 16
The Government of Canada Action Plan 2000 on Climate Change
NRCan / RNCan 251 Mar-2006
A more recent assessment of Canada’s biomass inventory suggests that 7.4 Mt of forest related waste is generated in Canada annually (5.9 Mt of mill residue, 0.3 Mt of stockpiled wood material, 1.0 Mt of pulp sludge and 0.2 Mt of forest floor debris).463 A quite different estimate for forest floor residuals, also referred to as “non-stem biomass”, is 91.75 M oven dry tonnes, so obviously measurement of this lost resource is as challenging as it is for other waste streams. From an energy viewpoint, this estimated non-stem biomass has annual calorific value of between 0.72 exajoules and 1.44 exajoules (1 exajoule = 1 x 10¹⁸ joules). Total current non-biomass energy use in Canada is about 12.6 exajoules per year.464 (�����������
The total amount of crop residue generated in Canada on an annual basis is estimated to be 78.3 dry Mt. 465 While much of that material is already being used in traditional ways, the referenced report estimates that the amount available for further utilization is 17.8 Mt. From an energy perspective, and consequently with a view towards decreased dependence on fossil fuels, BIOCAP Canada makes the following estimates: � Carbon content of agricultural residues is estimated to be 45% of dried biomass
(therefore 8.64 Mt C/yr). � About 36 GJ may be derived from each tonne of carbon from the dried biomass. � Based on these assumptions, this material would generate 311 million GJ per year In addition, there is the enormous production of livestock waste generated across the country. Excluding manure from field grazing animals, BIOCAP Canada estimates that 58 Mt or manure are “recoverable” and that this material has an energetic heating value of about 65 million GJ per year.466
18.2.4 The (Nearly) Complete Picture The total amount of solid waste disposed in Canada is presented in Table 18.3. Even though all of the data are not of 2002, this year is used as an approximate benchmark. �
As shown in Figure 18.1, the inclusion of mine wastes dwarfs the other sources of residual materials, especially the materials that fall under the Statistics Canada survey frame (residential, IC&I and CR&D represent less than one percent of the total shown). �
�
463 B. McCloy & Associates, 2003, “Industry Progress in Biomass Utilization”, IEA Bioenergy Task 38, CanBio and FPAC workshop presentation (see slide 5 at http://www.pollutionprobe.org/whatwedo/GPW/calgary/Presentations/PDFs/bradley.pdf) 464 Susan Wood & David Layzell, Biocap Canada, 2003, A Canadian Biomass Inventory: Feedstock for a Bio-Based Economy, Industry Canada, p. 6, 14-15 465 Ibid., p. 23 466 Ibid., pp. 24-25

The Government of Canada Action Plan 2000 on Climate Change
NRCan / RNCan 252 Mar-2006
Table 18.3: Summary of Materials Disposed in Canada (2002)
Sector/Material Tonnes
Residential IC&I CR&D Selected industrial Potash residuals Forestry mills Forest floor Agricultural Livestock waste Mine tailings Waste rock
9,456,000 11,552,000 2,828,000 9,560,000
24,800,000 7,400,000
91,750,000 78,300,000 58,000,000
1,878,000,000 739,000,000
Total 2,910,646,000
�
�
�
Figure 18.1: Distribution of Material Disposed by Sector
�
�
�
�
�
�
�
�
�
�
�
�
�
�
�
�
�
In Figure 18.2, mining, potash residuals, agricultural and forestry wastes and process residues are removed from this discussion. The sectors shown are the ones of interest to this report. The CR&D bar shows projected disposal tonnage from both the Regional (Min.) and Coefficient (Max.) approaches (see Table 16.8). The total amount of material depicted in Figure 18.2 is 33,396,000 tonnes, which is based on WMIS (residential, IC&I and CR&D sectors) and the selected mineral and metal residual estimates developed in Chapter 17. �
�
Livestock waste 2.0%
Waste rock 25.4%
Agricultural 2.7%
Mine tailings 64.5%
Forest floor 3.2%
Forestry mills 0.3%Potash residual 0.9%
Residential 0.3%
Selected industrial 0.3%
CR&D 0.1%
IC&I 0.4%Livestock waste 2.0%
Waste rock 25.4%
Agricultural 2.7%
Mine tailings 64.5%
Forest floor 3.2%
Forestry mills 0.3%Potash residual 0.9%
Residential 0.3%
Selected industrial 0.3%
CR&D 0.1%
IC&I 0.4%

The Government of Canada Action Plan 2000 on Climate Change
NRCan / RNCan 253 Mar-2006
Figure 18.2: Distribution of Material Disposed in the Residential, IC&I, CR&D and Selected Industrial Sectors (2002)
�
�
�
�
18.3 Recovery Projections Not all of the material being disposed of can be recovered for the purposes of recycling. The reasons for less than 100 percent recovery are technical (the extra processing capacity may not be available), economic (the markets may be too far away) and social (people are not 100 percent efficient all of the time). In order to reflect the uncertainty but also the potential benefit, a number of variables are used to make material recovery projections. The underlying premise in this section is that Canadians can recover more material than the status quo through the implementation of better programs, policies and technologies. However, it is beyond the scope of this study to determine what changes are required; this exercise focuses on developing possible recovery scenarios so that corresponding GHG emission reductions can be estimated.
18.3.1 Residential Sector Projections The recovery estimates summarized in Tables 18.4, 18.5 and 18.6 are based on five variables described as follows: (1) The total amount of each material stream discarded is taken from Table 18.1. This is
the starting point. (2) According to the Canadian Rural Partnership, about 30 percent of all Canadians
reside in rural areas and 50 percent of these are in “rural metro-adjacent regions”.467 It is therefore assumed that 85 percent of the population (70 + 15) lives in areas with viable recycling collection programs.
467 http://www.rural.gc.ca/research/note/note1_e.phtml (Mar-2006)
0
2,000,000
4,000,000
6,000,000
8,000,000
10,000,000
12,000,000
Residential IC&I CR&D Selectedindustrial
Tonn
es
Max.
Min.
0
2,000,000
4,000,000
6,000,000
8,000,000
10,000,000
12,000,000
Residential IC&I CR&D Selectedindustrial
Tonn
es
Max.
Min.

The Government of Canada Action Plan 2000 on Climate Change
NRCan / RNCan 254 Mar-2006
(3) The amount of material that is available for recovery: At this stage, certain amounts of material are eliminated for a number of reasons. For example, a Fredericton residential waste audit determined that only 65 percent of the paper fraction is recyclable since the rest was either not recyclable (tissue, paper towel), wet or contaminated.468 The same 65 percent applies to metals other than steel, beverage cans and white goods. For plastics, the audit found that only 29 percent of the plastics in the waste stream are recyclable – this of course will vary greatly from program to program. For glass, a Lunenburg audit indicates that 60 percent of that fraction is likely to be food or beverage containers –that is what can be recycled. Insofar as organics are concerned, a very large portion can be composted so the analysis assumes that 80 percent is available for recovery (some programs may not target meat and dairy waste).
(4) Public participation rates in local collection programs vary greatly but for the
purposes of these projections the assumed range is 50 percent, 70 percent and 90 percent. These levels are intended to be national averages.
(5) The effectiveness of a participant’s source separation activities varies with their rate
of participation but not so extremely (e.g. a household that participates all the time may not capture all targeted materials because they get used for something else or the garbage can was more accessible, etc.). The assumed range is 70 percent, 80 percent and 90 percent.
Finally it is assumed that certain residential waste materials are just not targeted including wood, renovation materials, textiles and rubber, multi-materials (composites), household hazardous waste and other. As shown in Table 18.4, three projections are conducted: high, medium and low. These projected tonnes are new quantities of recovered material that presently are being disposed of. Recall that the residential sector disposes 9,456,000 tonnes per year. Table 4.4 indicates that the residential sector is currently (same year, 2002) recycling or composting 2,553,134 tonnes, which gives a 22 percent diversion rate. The projected diversion rates in Table 18.4 combine the current recovery rate with the projected “additional” tonnes.
Table 18.4: Recovery Projections in the Residential Sector
Scenario
Additional tonnes diverted
Of which, metal tonnes
Projected diversion rates
High Medium Low
3,768,000 2,605,000 1,628,000
153,000 106,000 66,000
53% 43% 35%
The projections in Table 18.4 are entirely speculative and predicated on assumptions (1) 468 See Section 11.4, GEMTEC reference.

The Government of Canada Action Plan 2000 on Climate Change
NRCan / RNCan 255 Mar-2006
through (5) discussed on the previous page. Metal tonnes are for ferrous and nonferrous metals.
18.3.2 IC&I Sector Projections As with the residential sector, the same five variables discussed in the previous section are used for the IC&I sector projections. Based on the characterization data presented throughout the report, total tonnes available are specific to this sector. Also, some adjustments to the amount of material available for recovery are made on the basis of the Toronto IC&I audit referenced in Section 9.4.2. Specifically, recyclable paper represents 70 percent of the total; recyclable glass 75 percent; recyclable plastics 65 percent; metals and organics are left at 65 and 80 percent respectively (based on residential data); and wood and textiles are added in at 50 and 25 percent available given their presence in the IC&I waste stream but also assuming a high level of contamination. The Canadian IC&I sector disposed of 11,552,000 tonnes (Table 18.3) and diverted 3,509,039 tonnes (Table 4.4) for a 23 percent 2002 diversion rate. The projected diversion rates in Table 18.5 include the 2002 (current) rate.
Table 18.5: Recovery Projections in the IC&I Sector
Scenario
Additional tonnes diverted
Of which, metal tonnes
Projected diversion rates
High Medium Low
5,049,000 3,491,000 2,182,000
277,000 192,000 120,000
57% 46% 38%
18.3.3 CR&D Sector Projections Consistent with the previous two sections, the projection of how much material might be recovered from the current CR&D disposal stream is based on a series of assumptions including: characterization of this material, accessibility to programs and markets (i.e. urban versus rural), the specific materials that could be targeted for recovery and how much of that material is presumed to be useable or uncontaminated (that is, paper 50 percent, metals 80 percent, and 75 percent for wood, drywall, concrete and asphalt).469 The participation and capture rates are maintained from the residential and IC&I, in order to provide projections within the three scenarios shown in Table 18.6. 469 Regarding concrete and asphalt, the fact that these materials are included in CR&D and selected industrial mineral and metal residuals requires explanation: The dilemma is that some concrete and asphalt is managed within the WMIS survey frame but much of it is not. Recovery projections involving the CR&D sector include the quantities of concrete and asphalt estimated in Table 16.8. The estimated amount of concrete that is being disposed outside the WMIS frame (as identified during the CAC survey, Section 17.2.1) is addressed in Section 18.3.4 under various recovery scenarios. Asphalt quantities are included in the CR&D stream.

The Government of Canada Action Plan 2000 on Climate Change
NRCan / RNCan 256 Mar-2006
To establish context, it should be recalled from Table 18.3 that 2,828,000 tonnes of CR&D materials were disposed in 2002 and concurrently 555,352 tonnes were recovered (Table 4.6, 16 percent diversion). The projected diversion rates in Table 18.6 include the 2002 (current) rate. �
Table 18.6: Recovery Projections in the CR&D Sector
Scenario
Additional tonnes diverted
Of which, metal tonnes
Projected diversion rates
High Medium Low
1,032,000 713,000 446,000
57,000 40,000 25,000
47% 38% 30%
�
18.3.4 Selected Industrial Mineral and Metal Residuals Projections As discussed in Chapter 17 and summarized in Table 18.2, a significant amount of industrial mineral and metal residual material is presently not recycled in Canada. It is very difficult to estimate how much of the estimated 9.56 Mt of material could be recycled given the policy, technical and economic barriers that persist. A material by material summary follows: -))0�#�0�����%-! '�������
The estimated amount of OTR tires discarded annually (172,500-345,000 t) suggests broad uncertainty and reflects poorly on the recoverability of this material. A stewardship program might be the solution but only a substantial financial incentive is likely to work. Targeted regulations might have some impact but only if backed up with appropriate enforcement. To develop some estimates regarding GHG emissions (Section 18.4), this report assumes that all of the OTR tires are recovered (rounded average of 259,000 t) and of that, about 39,000 tonnes are steel – this is the material and the figure that will be used to develop GHG impacts. The benefit of recycling the natural rubber contained in OTR tires was not determined. &#���������
Large household appliances are already recovered and recycled in large number. The introduction of better tracking systems would provide a more accurate assessment of current program performance. It is not unreasonable to assume that all white goods could be recovered with the right programs and policies in place. Estimated tonnes available rounded to 17,000-54,000 t or an average of 36,000 t (which includes 23,800 t ferrous, 1,300 t aluminum, 1,200 t copper and 300 t other metal; plus 8,900 t other material). ������������������������1��������
Efforts are already underway to introduce stewardship programs for assorted electronic and electrical equipment and it is too early to determine how effective those programs will be. Therefore, a range of recovery estimates are used to provide a basis for the GHG emission projections. Specifically, if 25 percent, 50 percent and 75 percent are the assumed recovery rates, then the following tonnage would result: 45,000 t, 90,000 t, and

The Government of Canada Action Plan 2000 on Climate Change
NRCan / RNCan 257 Mar-2006
135,000 t. While the estimated e-waste tonnage of 180,300 tonnes is not included in the Table 18.2 total (to avoid double counting, as noted), the projected GHG impact of increased recovery is reported in Section 18.4 under selected industrial mineral and metal residuals. (�����2�����#������� ������%(� '�
As discussed in Section 17.2.4, it is estimated that Canada produces about 357,000 tonnes of ASR annually. It is assumed that most of the metal has been recovered from this material although the National Research Council (NRC) data presented in Table 17.7 does indicate that some metal content was present at the time of their analysis. With changes in automobile design, construction and use of new materials, there is probably less metal in cars today than ten years ago (recall discussion in Section 17.3.4 about the pressures on Canadian foundries). Regardless, the focus of this study is the extraction of residual metal from the shredder residue although it is acknowledged that a more feasible market for ASR may be impact products such as posts and curbs.470 It is estimated that the 357,000 annual tonnes of ASR contain about 56,000 tonnes of iron, aluminum, copper and other metal. �
���������
From the CAC survey, it is assumed that 2.3 Mt of concrete is disposed annually. Subtract the concrete that is presumably included in WMIS (based on the Alberta CRD study, 459,000 t) and the “extra” tonnage is 1,874,000 tonnes. It is assumed that all of this material can be used as aggregate. Various recovery scenarios are run for the sake of sensitivity, but given the low GHG impact of aggregate substitution, this is somewhat of an academic exercise. (/�����
Based on the estimates developed in Section 17.3.1, it is noted that from 66,000 to 165,000 tonnes of EAF dust are generated in Canada annually, with an average of 116,000 tonnes. It is further understood that EAF dust varies according to the characteristics of any particular mini-mill’s feedstock. A zinc content range of 5-35% makes it difficult to generalize; however, for the purposes of this report, it is assumed that 20% is a reasonable average with which to work. Similarly, since lead content can vary between 2-7%, the assumed value is 4.5%. Finally, 45% of the dust is assumed to be iron. All of these metals can be recycled. ������#�
The use of coal ash, particularly fly ash, is discussed at length in many other forums and these are identified in Section 17.3.2. The best opportunity to link utilization of fly ash with GHG emission reductions is with the production of cement and concrete. As illustrated in Figure 17.8 some 828,000 tonnes of fly ash were used in cement and concrete in 2001.471 One estimate for the maximum amount of fly ash usable as a
470 See www.xpotentialproducts.com for more information. (Mar-2006) 471 Minerals and Metals Statistical Division, NRCan in cooperation with CIRCA, 2001 survey regarding coal combustion products

The Government of Canada Action Plan 2000 on Climate Change
NRCan / RNCan 258 Mar-2006
supplementary cementing material (SCM) is 2.2 Mt.472 Therefore, it is can be deduced that a further 1,372,000 tonnes of FA (currently stockpiled or disposed) could technically be used as an SCM. As with the recovery projections made in the other sectors, it is possible to develop some scenarios in which an increasing amount of fly ash is used in place of cement. Such an approach was presented at an international symposium,473 the results of which are be used to inform the GHG discussion in the next section. Coal bottom ash is used as an aggregate substitute (about 202,000 tonnes in 2001).14 In the GHG impact analysis it is assumed that varying percentages of bottom ash are used as aggregate, but the impact is relatively small. /����������
As discussed in Section 17.3.2, nearly 90 percent of all ferrous slag is already being utilized. It is likely that the remaining ferrous slag is economically unusable at this time. However, given the variety of end uses (see Table 17.7) it is not unreasonable to think that all of this material could be utilized under the right circumstances. As a supplementary cementing material (SCM), the GHG benefits are significant since one tonne of Portland cement generate one tonne of carbon dioxide.474 While other uses for slag may not be as beneficial, from a GHG perspective, this report assumes the remaining slag (300,000 t) can be used as an SCM. "��)����������
About 46 percent of nonferrous slag is currently sold for use as a source of aggregate material and the remaining 1.65 Mt of material is stockpiled. Data regarding the location, availability and properties of this slag need to be assembled before its recovery potential can be determined. For the purposes of this report, however, two simple recovery scenarios are considered: Full and 50 percent utilization of NF slag as aggregate. /�����������
It is assumed that all spent foundry sand could be recovered given the fact that there are only 145-200 foundries in Canada (with about 50 plants representing 80 percent pf production and sales).475 While use of spent foundry sand is identified as a potential SCM,476 it seems that competing materials such as fly ash, GGBFS and silica fume are preferred and used.477 For the purposes of this report, spent foundry sand (average 468,000 tonnes) is likely to be used as an aggregate with minimal GHG emission reductions. Table 18.7 provides a summary of available tonnes plus an estimate of metal content for
472 N. Bouzoubaa & B. Fournier, Spring 2005, Current Situation of SCMs in Canada, CANMET, Materials Technology Laboratory, NRCan (CIRCA Seminar series, PP Presentation) 473 See www.ecosmart.ca/Kbase/filedocs/trventa99.pdf (Mar-2006) 474 See http://www.ecosmart.ca/enviro_statistics.cfm (Mar-2006) 475 See http://www.foundryassociation.ca/Geninfo.html (Mar-2006) 476See http://www.cement.ca/cement.nsf/0/63E315317CAF6BEA852570D0006CB28D?opendocument and http://www.cement.org/buildings/sustainable.pdf (Mar-2006) 477 See http://rmc-foundation.org/newsite/images/LEED%20Guide%20E-Version.pdf in which the “Ready Mix Concrete Industry LEED Reference Guide” only mentions foundry sand once in 83 pages.

The Government of Canada Action Plan 2000 on Climate Change
NRCan / RNCan 259 Mar-2006
the more complex materials. It is assumed that the identified metal components will be targeted for recycling. For the more homogenous mineral industrial residuals see Table 18.8 – the assumed end uses for these materials is either supplementary cementing material or aggregate substitute.
Table 18.7: Summary of Complex Industrial Mineral and Metal Recovery Projections (Tonnes by Material)
�
Item Available Tonnes
Tonnes of Metal
OTR tires White Goods WEEE ASR EAF Dust
259,000 36,000
180,000 357,000 116,000
39,000 27,000 79,000 56,000 80,000
Total
768,000 202,000
Note: Waste Electrical and Electronic Equipment (WEEE) tonnage is not included in the totals to avoid double-counting (see Table 18.2 note).
�
Table 18.8: Summary of Other Industrial Residuals Recovery Projections (Total Available Tonnage)
Material
Tonnes
Coal Ash Concrete Nonferrous Slag Foundry Sand Ferrous Slag
4.500 Mt 1.874 Mt 1.650 Mt 0.468 Mt 0.300 Mt
Total 8.792 Mt
18.4 The Greenhouse Gas Benefit of Recycling In the introduction, one of the benefits of recycling is illustrated in Figure 1.1: That is, increased recycling reduces the emission of greenhouse gas emissions when the full life cycle of materials and products is assessed. In Chapter 2, two of the most important study objectives are found under the “national picture”: That is, develop a material flow overview for waste and residuals (characterize it and develop reasonable recovery projections) and estimate the GHG emissions impact if recycling were to reach its zenith.

The Government of Canada Action Plan 2000 on Climate Change
NRCan / RNCan 260 Mar-2006
18.4.1 GHG Factors The Government of Canada Action Plan 2000 on Climate Change (Enhanced Emission Reductions) co-supported a project entitled “Determination of the Impact of Waste Management Activities on Greenhouse Gas Emissions: 2005 Update” and the resulting report is used as a baseline for projecting GHG values in this document.
Table 18.9: GHG Emissions from Recycling Compared to Landfill Disposal (tonnes CO2e per tonne) 478
�
���������
�
����� ��
Newsprint Fine paper Cardboard Other paper Aluminum Steel Copper wire Glass HDPE PET Other plastic Food scraps Yard trimmings White goods Personal computers Televisions Microwaves VCRs Tires
(1.53) (4.38) (3.54) (3.98) (6.51) (1.20) (4.11) (0.12) (2.29) (3.64) (1.82)
(1.04) “C” 0.09 “C” (1.48) (1.61) (0.24) (1.28) (0.97) (3.31)
�
Note: The “C” values are for composting. The ICF study assumed that tire recycling is retreading.
The values in Table 18.9 are expressed as carbon dioxide equivalents (CO2e), which is the standard measurement for global warming potential. The values should be interpreted in the following way: For every one tonne of newsprint recycled, 1.53 tonnes of CO2e are avoided. Where the emission values are shown as negative, an enlargement of a carbon sink (the opposite of an emission) has occurred. There are other recyclable materials that are not included in Table 18.9 for which GHG factors have been developed and applied in other Action Plan 2000 (Enhanced Recycling) projects. Specifically, the “Let’s Climb Another Molehill” report uses GHG factors for wood (reuse, recycled into animal bedding and waste to energy/WTE), concrete (reuse,
478 ICF Consulting, 2005, Determination of the Impact of Waste Management Activities on Greenhouse Gas Emissions: 2005 Update Final Report, Contract No. K2216-04-0006, Environment Canada and Action Plan 2000 (Natural Resources Canada), Ex. 8-3, p. 91. This report will be posted at www.recycle.nrcan.gc.ca

The Government of Canada Action Plan 2000 on Climate Change
NRCan / RNCan 261 Mar-2006
and recycled into aggregate), asphalt (reuse in place), and drywall (recycled gyproc).479 The factors used were developed and provided by the Athena Sustainable Materials Institute with one exception noted below.480 Table 18.10 summarizes these additional GHG factors that are used in this report for the projected CR&D sector materials. �
Table 18.10: Greenhouse Gas Emission Factors (tonnes CO2e per tonne) �
Material
GHG factor
Wood – reuse Wood – recycle Wood – WTE* Concrete – reuse Concrete – recycle Asphalt – reuse Drywall – recycle
0.068 0.011 0.052 0.170
0.00344 0.111 0.024
�
*Note: The WTE (waste to energy) figure is from the EPIC/CSR Integrated Waste Management model.481 The factor for concrete recycled into aggregate is used wherever recovered materials could be used as aggregate (e.g. nonferrous slag, foundry sand).
While it is acknowledged that waste to energy (WTE) is not unanimously considered to be diversion, there is growing interest in Canada’s vast biomass energy potential (see discussion in Section 18.2.3.) and so it is considered here for wood waste only to stimulate further thought and discussion. Since zinc and lead are identified as recoverable components of EAF dust, the corresponding GHG factors are estimated to be 2.12 and 1.27 tonnes CO2e. The reader is advised that these factors are extremely rough but are used in Section 18.4.2 to develop order of magnitude projections for the GHG implications of increased recycling activities. Details on how the zinc and lead factors were derived are provided in Appendix F. When better data become available the projections in this report can be updated accordingly.
479 Recycling Council of Ontario, 2005, Let’s Climb Another Molehill: An Examination of CRD Waste Diversion in Canada and Associated Greenhouse Gas Emission Impacts, Government of Canada Action Plan 2000, Region of Peel, CMHC, New West Gypsum Recycling, and Walker Environmental Services 480 http://www.athenasmi.ca/ (Mar-2006) 481 As referenced by GHGm.com, 2006, Greenhouse Gas Measurement and Reporting Plan – Project Title: Let’s Climb Another Molehill, Action Plan 2000 (Natural Resources Canada), Table 24

The Government of Canada Action Plan 2000 on Climate Change
NRCan / RNCan 262 Mar-2006
18.4.2 Projected Material Recovery Rates and GHG Values for the Residential, IC&I and CR&D Sectors
����������
The starting point for this discussion is the recovery projections for the residential sector as presented in Table 18.4. To apply the GHG factors from Table 18.9, it is necessary to estimate the further composition of paper, plastics and organics as follows:
� Paper482 = newsprint (46%) + fine paper (8%) + cardboard (12%) + other paper (34%)
� Plastics483 = HDPE (14%) + PET (13%) + other plastics (73%) � Organics484 = food waste (50%) + yard waste (50%)
Under all three scenarios (high, medium and low), materials excluded from the recovery projections are wood, renovation, textiles & rubber, multi-material, household haz-waste and other, which represents about 16 percent of total residential waste disposed. Table 18.11 presents the GHG emission projections for the residential sector. Where the values are negative (inside brackets), the emission is negative (i.e. does not occur). It is estimated that only composted yard waste generates a GHG emission because the effect of carbon sinks is included in the Table 18.11 values.485
Table 18.11: Residential Sector, Projected GHG Emissions (Rounded tonnes CO2e)
�
Recovery Scenarios Material
Low Medium High Newsprint Fine paper Cardboard Other paper Glass Ferrous Nonferrous HDPE PET Other plastics Food waste Yard waste
(282,000) (140,000) (170,000) (542,000)
(9,000) (64,000) (82,000) (25,000) (36,000)
(102,000) (524,000)
45,000
(451,000) (225,000) (272,000) (868,000)
(15,000) (103,000) (131,000)
(39,000) (58,000)
(163,000) (838,000)
73,000
(653,000) (325,000) (394,000)
(1,255,000) (21,000)
(149,000) (189,000)
(57,000) (84,000)
(236,000) (1,212,000)
105,000
Total
(1,931,000) (3,090,000) (4,470,000)
482 earthbound environmental Inc., 2000, City of Winnipeg Waste Composition Study 2000, Manitoba Product Stewardship Corporation; and, earthbound environmental Inc., 2001, Rural Residential Waste Composition Study 2000, Manitoba Product Stewardship Corporation 483 Ibid. 484 This is a rough estimate. City of Ottawa data indicated food waste 59 percent, yard waste 26 percent and pet waste 16 percent. [Integrated Environmental Waste Services Inc., 2003, Residential Curbside Waste Characterization Study Fall & Winter 2003, City of Ottawa. 485 See ICF Consulting, pp. 73-76

The Government of Canada Action Plan 2000 on Climate Change
NRCan / RNCan 263 Mar-2006
There is an obvious correlation between tonnes recycled and GHG emissions avoided, as shown in Table 18.11. Under a highly optimistic set of assumptions (material availability, participation and capture rates), and with the implementation of comprehensive recycling programs and policies across the country, a reduction of as much as 4.47 Mt of carbon dioxide equivalents could be realized. �����
Table 18.5 provides the summary recovery projections for the IC&I sector. As with residential, for the purposes of developing some GHG emission projections, only certain materials are deemed recyclable. The following more detailed material break downs are provided, all taken from a study in Victoria, BC:486 � Paper = newsprint (15%) + fine paper (12%) + cardboard (23%) + other paper (49%) � Plastics = HDPE (7%) + PET (7%) + other plastics (90%) � Organics487 = food waste (75%) + yard waste (25%) Following the approach discussed with the residential projections, Table 18.12 provides the summary GHG projections for increased recycling activities in the IC&I sector under three recovery scenarios. The projections suggest a range of 2.47 Mt to 5.72 Mt of carbon dioxide equivalents could be achieved over and above current IC&I recycling efforts.
Table 18.12: IC&I Sector, Projected GHG Emissions (Rounded tonnes CO2e)
�
Recovery Scenarios Material
Low Medium High Newsprint Fine paper Cardboard Other paper Glass Ferrous Nonferrous HDPE PET Other plastics Food waste Yard waste
(94,000) (209,000) (331,000) (788,000)
(9,000) (64,000) (82,000) (12,000) (9,000)
(126,000) (765,000)
18,000
(150,000) (334,000) (530,000)
(1,261,000) (15,000)
(103,000) (131,000)
(18,000) (14,000)
(202,000) (1,223,000)
29,000
(218,000) (483,000) (766,000)
(1,824,000) (21,000)
(149,000) (189,000)
(27,000) (20,000)
(292,000) (1,770,000)
42,000
Total
(2,471,000) (3,952,000) (5,717,000)
�
�
486 Sperling Hansen Associates, 2001, Summary of Phase 1 & 2 Solid Waste Composition Study, Capital Regional District (Victoria, BC) 487 The split on organics is actually food waste 73%, yard waste 20% and other 7%. These are rounded to 75/25 for food /yard waste.
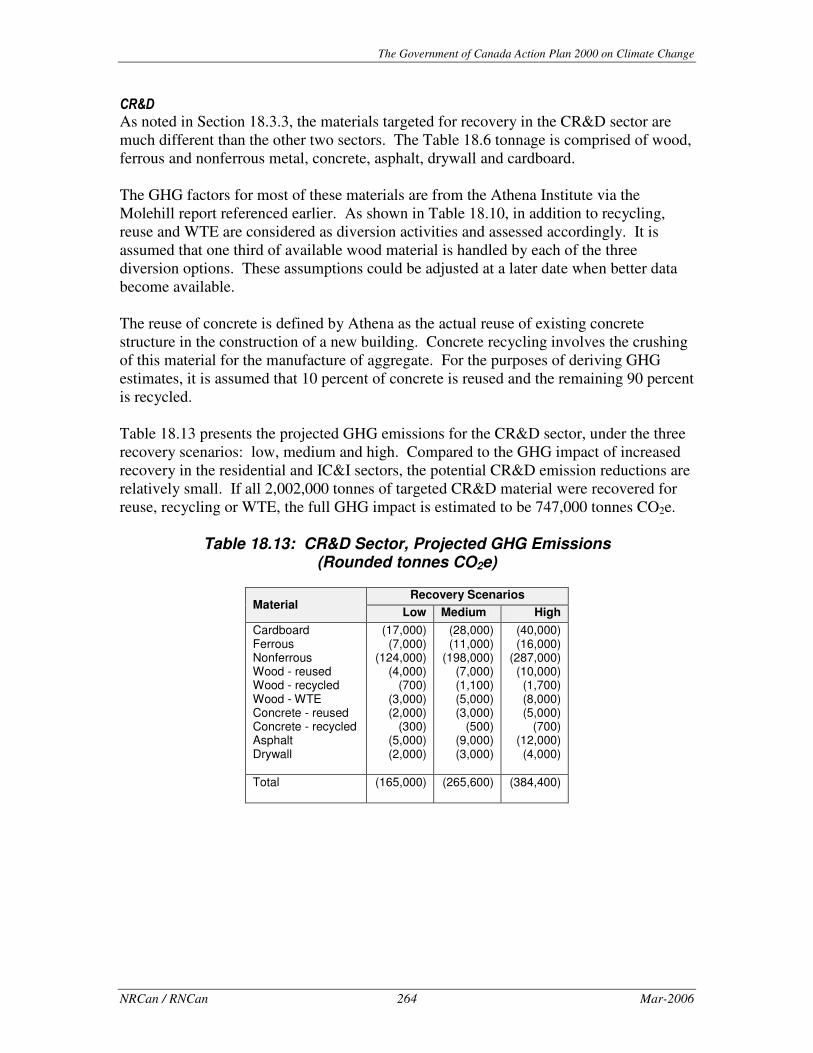
The Government of Canada Action Plan 2000 on Climate Change
NRCan / RNCan 264 Mar-2006
� ���
As noted in Section 18.3.3, the materials targeted for recovery in the CR&D sector are much different than the other two sectors. The Table 18.6 tonnage is comprised of wood, ferrous and nonferrous metal, concrete, asphalt, drywall and cardboard. The GHG factors for most of these materials are from the Athena Institute via the Molehill report referenced earlier. As shown in Table 18.10, in addition to recycling, reuse and WTE are considered as diversion activities and assessed accordingly. It is assumed that one third of available wood material is handled by each of the three diversion options. These assumptions could be adjusted at a later date when better data become available. The reuse of concrete is defined by Athena as the actual reuse of existing concrete structure in the construction of a new building. Concrete recycling involves the crushing of this material for the manufacture of aggregate. For the purposes of deriving GHG estimates, it is assumed that 10 percent of concrete is reused and the remaining 90 percent is recycled. Table 18.13 presents the projected GHG emissions for the CR&D sector, under the three recovery scenarios: low, medium and high. Compared to the GHG impact of increased recovery in the residential and IC&I sectors, the potential CR&D emission reductions are relatively small. If all 2,002,000 tonnes of targeted CR&D material were recovered for reuse, recycling or WTE, the full GHG impact is estimated to be 747,000 tonnes CO2e.
Table 18.13: CR&D Sector, Projected GHG Emissions (Rounded tonnes CO2e)
�
Recovery Scenarios Material Low Medium High Cardboard Ferrous Nonferrous Wood - reused Wood - recycled Wood - WTE Concrete - reused Concrete - recycled Asphalt Drywall
(17,000) (7,000)
(124,000) (4,000)
(700) (3,000) (2,000)
(300) (5,000) (2,000)
(28,000) (11,000)
(198,000) (7,000) (1,100) (5,000) (3,000)
(500) (9,000) (3,000)
(40,000) (16,000)
(287,000) (10,000) (1,700) (8,000) (5,000)
(700) (12,000) (4,000)
Total
(165,000) (265,600) (384,400)
�
�

The Government of Canada Action Plan 2000 on Climate Change
NRCan / RNCan 265 Mar-2006
18.4.3 Projected GHG Values for Selected Industrial Residuals �
Given the special characteristics of the selected industrial mineral and metal residuals and also the range in estimates, this section provides a material by material summary for the calculation of potential GHG impacts. A summary table is provided at the end of this section. -))0�#�0�����%-! '������
The operating assumption is that 39,000 tonnes of steel could be recycled if all OTR tires were recovered. At -1.20 tonnes of carbon dioxide equivalents (CO2e) per tonne of steel recycled rather than disposed (Table 18.9), this recycling activity would result in 47,000 t CO2e savings. If the tonnage of steel available varies as much as the range in OTR tires (172,500-345,000 t) then the range in GHG emission reductions is 31-62,000 t CO2e. While the closed loop recycling of natural rubber is unknown, it is likely that the energy requirements of harvesting and processing the natural rubber are very low. The net GHG benefit or cost of combusting OTR tires to displace fossil fuels is not assessed in this report but should be considered as a potentially advantageous option. �
&#���������
The metallic content of white goods is taken to be 75 percent and this is comprised of ferrous, aluminum, copper, brass and other metal (assume brass GHG profile is the same as copper and “other metal” is like ferrous). It is assumed that the plastics are not recyclable for the purposes of this study; however, it is possible that when white goods are shredded the resulting fluff is used in the manufacture of impact products such as bumpers and posts (see ASR discussion). If 36,000 tonnes of white goods are being disposed, and if all of these can be recovered, then about 42,000 tonnes CO2e could be reduced. Based on the range of white goods potentially available (17-54,000 t), the corresponding range in GHG emissions reduction is 20-65,000 tonnes CO2e. ������������������������1��������%'�
The estimated composition of EEE is presented in Table 17.5 and the associated GHG values are found in Table 18.9. The total amount being disposed is estimated to be 180,300 tonnes per year. Since there is no way of knowing how much EEE could be recovered, several different scenarios are run: 25, 50, 75 and 100 percent. At these recovery rates the respective GHG emission savings are 35,000, 69,000, 104,000 and 138,000 tonnes CO2e. (�����2�����#������� ������%(� '�
As discussed previously, it is assumed that there is about 55,400 tonnes of metal available for recovery in the annual generation of ASR. Using the same recovery scenarios as with EEE (25, 50 and 75 percent), the associated GHG projections are as follows: 26,000, 53,000, 79,000 and tonnes CO2e. At full recovery levels, an estimated 106,000 tonnes CO2e are available. How ASR could be fully utilized has yet to be determined, but the thermal potential for this material suggests that it might eventually be used to displace fossil fuels provided

The Government of Canada Action Plan 2000 on Climate Change
NRCan / RNCan 266 Mar-2006
undesirable emissions do not result. The GHG benefits of that option are not discussed in this report. ��������� �22���
In Table 18.10, the GHG benefit per tonne of converting concrete rubble to aggregate instead of using natural stone (e.g. limestone), is assumed to be 0.003 tonnes CO2e. The total amount concrete rubble available for use is assumed to be 1,874,000 tonnes. If all that material was used as aggregate, the projected GHG benefit would be 8,000 tonnes CO2e. As the amount of concrete rubble converted to aggregate decreases, so too does the amount of GHG emission reductions. At 75 percent rubble reuse the impact is 6,000 tonnes CO2e; at 50 percent, 4,000 t CO2e and at 25 percent 2000 t CO2e. ��������(���/�������%(/'�����
As with ASR, and based on the range in values considered, the GHG impact of recycling available EAF dust is provided using minimum, medium and maximum scenarios. Table 18.14 summarizes:
Table 18.14: EAF Dust Recycling Scenarios and GHG Impacts �
GHG Min Med Max EAF dust 66,000 116,000 165,000 tonnes t CO2e/t Iron (45%) Zinc (20%) Lead (4.5%)
(1.20) (2.12) (1.27)
(35,640) (27,984) (3,772)
(62,640) (49,184) (6,629)
(89,100) (69,960) (9,430)
Total
(67,396) (118,453) (168,490) t CO2e/t
�
As shown, under the assumed quantities of EAF dust available for recycling, and using the estimated GHG factors for iron, zinc and lead, it is projected that between 67,000 and 168,000 tonnes of CO2e emissions could be avoided by reutilizing these valuable metallic dust elements. �����(#�
The derivation of GHG impacts for the increased utilization of coal ash is based on the two following uses: (i) Fly ash as a supplementary cementing material with a corresponding 0.90 tonnes CO2e benefit for every tonne of FA used.488 (ii) FA and bottom ash used as an aggregate substitute with a corresponding 0.003 tonnes CO2e benefit for every tonne of ash used (see Table 18.10, concrete recycling). From Table 18.2, it is surmised that 4.5 Mt of coal ash are stockpiled or disposed. The estimated composition of this ash is 3.35 Mt fly ash (FA) and 1.15 Mt bottom ash. It was indicated previously that 2.2 Mt of FA was usable as supplementary cementing material (SCM). As of 2001, an NRCan survey reveals that about 828,000 tonnes of FA are being
488 See www.ecosmart.ca/kbase/filedocs/trventa99.pdf (Mar-2006)

The Government of Canada Action Plan 2000 on Climate Change
NRCan / RNCan 267 Mar-2006
used in cement and concrete applications.489 Therefore, it is assumed that a further 1,372,000 tonnes of FA could be used as SCM, which leaves 1,978,000 tonnes of FA for other uses. As indicated previously, bottom ash can be used as an aggregate substitute. At 0.003 tonnes CO2e per tonne of displaced “natural” aggregate, the GHG impact is rather small (4,000 t CO2e). As shown in Table 18.15, if fly ash were used as an SCM at the prescribed limit, then about 1.2 Mt of GHG emissions would be displaced. If the prescribed maximum were surpassed by 25 and 50 percent, the associated impacts would be 1.6 and 1.9 Mt CO2e, respectively. These order of magnitude numbers for fly ash will vary with the demand for cement and concrete materials.
Table 18.15: Coal Fly Ash Recycling Scenarios and GHG Impacts �
Material (tonnes)
Use Tonnes CO2e
Fly Ash 1,372,000 1,978,000
SCM Aggregate
1,235,000 8,000
Bottom ash
1,150,000 Aggregate 4,000
Total 4,500,000
1,247,000
�
�
/�����������
The estimated GHG impact of using the remaining ferrous slag (300,000 tonnes) as an SCM is straight-forward if is assumed that each tonne of ferrous slag displaces one tonne of cement. If this were the case, then 270,000 tonnes of CO2e would be avoided. However, if the remaining ferrous slag could only be used as an aggregate substitute, then the benefit would be about 1,000 tonnes CO2e, or significantly less. "��)�����������
NF slag is typically not used as a substitute for portland cement and therefore is unable to enjoy the associated GHG benefits. As an aggregate substitute, the GHG impact is minimal as shown in the previous paragraph. If the current 1.65 Mt per year of NF slag could all be used as aggregate, then about 1,000 tonnes CO2e would be displaced. A 50 percent utilization rate would generate correspondingly half the GHG benefits. More interestingly, if the 200.5 Mt accumulated stockpile of NF slag could all be used as aggregate, then 690,000 tonnes CO2e would be displaced – however, this analysis does not take into account long haul transportation of the material (and those GHG emissions), which is likely to be both a requirement and an economic barrier. /������������
If all 468,000 tonnes of spent foundry sand were recycled into aggregate, the estimated GHG emission reductions would be 1,600 tonnes CO2e (rounded to 2,000 for table
489 Minerals and Metals Statistical Division, NRCan in cooperation with CIRCA, 2001 survey regarding coal combustion products.

The Government of Canada Action Plan 2000 on Climate Change
NRCan / RNCan 268 Mar-2006
18.16). If the outside estimate for available sand is considered (585,000 tonnes), then the GHG benefit increases slightly to 2,000 CO2e. ���������������
Table 18.16 summarizes the GHG emission estimates for each of the selected industrial mineral and metal materials considered in Section 18.4.3. All of the emission reductions are expressed in tonnes of carbon dioxide equivalents (CO2e) have been rounded to the nearest thousand (K) tonnes.
Table 18.16: Summary of GHG Emission Reductions via Increased Recycling of Selected Industrial Mineral and Metal Residuals
Item
Tonnes CO2e Comment
OTR Tires
31-62 K Varies with quantity available for recovery
White Goods
20-65 K
Varies with quantity available for recovery
Electronic and Electric Equipment
138 K
Assumes 100% recovery of available metals
Automobile Shredder Residue
106 K Assumes 100% recovery of available metals
Electric Arc Furnace Dust
67-168 K Varies with quantity available for recovery
Coal Ash 1,247 K Assumes SCM and aggregate use of ash
Concrete 8 K Assumes 100% aggregate use of old concrete
Ferrous slag 270 K Assumes 100% SCM use of F slag
Nonferrous slag 1 K Assumes 100% aggregate use of NF slag
Foundry sand 2 K Assumes 100% aggregate use of spent sand
Total
1,890-2,067 K (average = 1,979 K)
�
�
�
18.5 Summary This chapter started by providing a summary of the quantity of materials disposed across Canada as discussed in Chapters 5 through 17. The primary focus of this study has been the residential sector, the institutional, commercial & industrial (IC&I) sector, the construction, renovation & demolition (CR&D) sector, and selected industrial mineral and metal residuals as generated across the economy but not captured in either the Statistics Canada Waste Management Industry Survey (WMIS 2002) or in the municipal (et al) waste audits. The total amount of material being disposed of annually is estimated to be about 34 million tonnes. This amount does not include the millions of tonnes of mining, forestry and agricultural waste also discarded but outside the scope of this study.

The Government of Canada Action Plan 2000 on Climate Change
NRCan / RNCan 269 Mar-2006
While all of this material is potentially available for recycling, various estimates and assumptions are made to develop recovery scenarios in which a range of quantities are hypothetically recovered (low, medium and high) with commensurate GHG emission reductions. Indeed, the potential reduction of GHG emissions that could be achieved through increased recycling is great, as reflected in the analyses conducted in this chapter. A rough summary of the estimated impact by sector is provided in Table 18.17. For example, where a high recovery scenario is considered in the residential sector (3,768,000 tonnes from Table 18.4), the estimated reduction in GHG emissions is 4,470,000 tonnes CO2e. The corresponding recovery scenarios for the IC&I and CR&D sectors as well as selected industrial mineral and metal residuals are found in Tables 18.5, 18.6 and 18.16. Table 18.17: Summary of GHG Implications of Increased Recycling Activity
Tonnes CO2e Sector Low recovery scenario High recovery scenario Residential IC&I CR&D Industrial M&M
1,931 Kt 2,471 Kt 165 Kt
1,890 Kt
4,470 Kt 5,717 Kt 384 Kt
2,067 Kt
Total
6,457 Kt 12,638 Kt
Based on the GHG emissions projection approach employed in this chapter, the estimated range of CO2e reductions is between 6,457 Kt and 12,638 Kt per year. The difference between these two estimates is societal and systemic inefficiency. Material “leakage” occurs because:
� The level and quality of program participation is always less than 100 percent; � The distance between points of collection and end-markets is not always optimal; � Recyclable items are contaminated with non-recyclable materials either in the
way they are made or the way in which they are discarded; � Collection programs may not be economically viable in small communities under
current circumstances; � Recycling technologies are not commercially feasible for all materials; and � Supply of recyclable material may exceed demand.

NRCan / RNCan 270 Mar-2006
Chapter 19 Conclusions, Limitations and Recommendations
19.1 Conclusions
19.1.1 Material Quantities The potential for increased recycling to reduce the quantity of greenhouse gas emissions is significant. This report has attempted to assemble and synthesize available data regarding the generation, recycling and disposal of “waste” materials. The quotation marks are important to note since the term “waste” and all similar words such as scrap, dust, ash, slag and rubble suggest worthless, useless materials. This is not the case. Various Canadian jurisdictions have moved away from the w-word towards “resources” or “residual matter”. This report supports that paradigm shift by identifying and quantifying materials of value that are currently being discarded. The total amount of material disposed of in 2002 was 23,836,000 tonnes, according to Statistics Canada. Data for 2004 will be released in May or June 2006. In this report, an assessment of selected mineral and metal residual materials has been conducted with the result that a further 9,560,000 tonnes of resources are being stockpiled or disposed of. Estimated total disposal is about 33 million tonnes but this figure excludes the residual matter from mining, forestry and agricultural activities. While Statistics Canada remains the only agency responsible for the gathering of national waste and recycling data, some provinces (Ontario and Nova Scotia) have introduced web-based data call systems for residentially generated materials. In the future it is likely that Statistics Canada will not collect residential data in some provinces but will focus instead on the IC&I and CR&D sectors given their survey compliance requirements as well as their protocol for handling confidential data.
19.1.2 Material Characterizations Characterization data have been assembled from sources across Canada. Information regarding the residential sector is plentiful, particularly for urban areas, since municipalities typically are responsible for managing this “waste” stream. Rural data are not available for all provinces. IC&I characterization data are much more difficult to base nation wide projections on given the diverse nature of this sector. Municipalities are generally not responsible for this waste stream. Given the lack of central authority for this sector, IC&I waste generation is not audited in a standardized, ongoing manner. However, a methodology

The Government of Canada Action Plan 2000 on Climate Change
NRCan / RNCan 271 Mar-2006
for deriving more reliable and accurate projections is discussed in Section 16.2. The IC&I waste characterization data used in this study are largely the result of municipal planning activities. The residual matter generated by the CR&D sector is similarly difficult to use with any degree of certainty, but that is the nature of the business. Even the quantities, as discussed in Section 16.4, are much debated since some CR&D material is managed outside the Statistics Canada survey frame. The reporting of weight data is often not a requirement or not even possible where disposal sites lack weigh scales, which is not an unusual occurrence in those parts of Canada that have small dispersed settlements. A fourth “sector” has been considered in this study and it concerns selected mineral and metal residual materials. Most of these materials are industrial in the true sense of the word and, as has been pointed out in this report, are typically not included in traditional waste management surveys or audits. E-waste and white goods are used and discarded from the residential and IC&I sectors but they also fly under the municipal radar in terms of both quantification and characterization: Since these items include recyclable metals of interest they are addressed separately in Sections 17.2.2 and 17.2.3. Figure 19.1 provides a national summary of the characterization estimates made in Chapters 5 through 15. This figure is based on the Statistics Canada 2002 Waste Management Industry Survey and local characterization data from across the country. The truly industrial residual materials are the ash, slag, dust and sand discussed in Chapter 17 – these materials are not included in Figure 19.1. In regards to recoverable metallic elements, only EAF dust qualifies and associated characterization data are provided in this report. The other materials can be utilized either as supplementary cementing materials (SCM) or as aggregate substitutes – characterization of these materials is important where the possibility of contamination exists (especially with respect to SCM). Also included with this group of materials are automobile shredder residue (ASR) and off-the-road tires. The characterization of ASR is tricky given the changing nature of automobiles and may even increase in relative quantity if vehicle designers continue the trend towards more non-metallic components.

NRCan / RNCan 272 Mar-2006
Figure 19.1: Solid Waste Flow in Canada in 2002
Residential12,242,510 t.
IC&I*15,309,479 t.
3,371,880 t.
Rec.Disposal9,455,204 t.
Disposal11,552,066 t.
Disposal
Rec.
555,532 t.2,553,134 t. 3,511,308 t.
Rec. = DiversionRate = 23% overall
2,828,461 t.
468,344 t.
ProductStewardship
Programs
Organics
Paper
Other
Plastics
GlassFerrousTextiles & rubberRenovationHaz-wasteMulti-materialWoodNonferrous
4,232,575
2,071,570
1,022,122
890,272
432,465276,652153,89589,92678,37572,99169,72964,633
Paper
Organics
Plastics
Wood
FerrousOtherRenovationGlassTextiles & rubberNonferrousMulti-materialHaz-waste
4,806,752
2,472,054
1,326,353
808,238
537,534430,274368,646333,282294,403
81,25167,67225,608
Wood
Other
Concrete
Drywall
AsphaltNonferrous
Paper
Ferrous
875,234
826,277
458,958
315,426
215,98079,782
32,972
23,831
Population31,361,611
Total Generation30,923,869 tonnes
Economy$1,085 billion (GDP)
Rec.
(*industrial, commercial & institutional;**construction, renovation & demolition)
= 23,835,731 t.(total disposal)
CR&D**.Residential12,242,510 t.
IC&I*15,309,479 t.
3,371,880 t.
Rec.Disposal9,455,204 t.
Disposal11,552,066 t.
Disposal
Rec.
555,532 t.2,553,134 t. 3,511,308 t.
Rec. = DiversionRate = 23% overall
2,828,461 t.
468,344 t.
ProductStewardship
Programs
Organics
Paper
Other
Plastics
GlassFerrousTextiles & rubberRenovationHaz-wasteMulti-materialWoodNonferrous
4,232,575
2,071,570
1,022,122
890,272
432,465276,652153,89589,92678,37572,99169,72964,633
Organics
Paper
Other
Plastics
GlassFerrousTextiles & rubberRenovationHaz-wasteMulti-materialWoodNonferrous
4,232,575
2,071,570
1,022,122
890,272
432,465276,652153,89589,92678,37572,99169,72964,633
Paper
Organics
Plastics
Wood
FerrousOtherRenovationGlassTextiles & rubberNonferrousMulti-materialHaz-waste
4,806,752
2,472,054
1,326,353
808,238
537,534430,274368,646333,282294,403
81,25167,67225,608
Paper
Organics
Plastics
Wood
FerrousOtherRenovationGlassTextiles & rubberNonferrousMulti-materialHaz-waste
4,806,752
2,472,054
1,326,353
808,238
537,534430,274368,646333,282294,403
81,25167,67225,608
Wood
Other
Concrete
Drywall
AsphaltNonferrous
Paper
Ferrous
875,234
826,277
458,958
315,426
215,98079,782
32,972
23,831
Wood
Other
Concrete
Drywall
AsphaltNonferrous
Paper
Ferrous
875,234
826,277
458,958
315,426
215,98079,782
32,972
23,831
Population31,361,611
Total Generation30,923,869 tonnes
Economy$1,085 billion (GDP)
Rec.
(*industrial, commercial & institutional;**construction, renovation & demolition)
= 23,835,731 t.(total disposal)
CR&D**.

The Government of Canada Action Plan 2000 on Climate Change
NRCan / RNCan 273 Mar-2006
19.1.3 Material Recovery Opportunities Characterization of what is disposed provides a rough idea of what might be available for recovery. Since recovery is always less than 100 percent, the following variables were adjusted to develop conservative projections: urban-rural splits, refined characterizations within certain material categories (e.g. plastics, paper), participation rates and material capture levels. These adjustments resulted in the derivation of low, medium and high scenarios for the residential, IC&I and CR&D sectors. Table 19.1 provides a sector summary of the three recovery projections in addition to the 2002 baseline. Projected new recovery pulls tonnage out of the disposed (2002) column. The diversion rate (recycling plus composting) in 2002 is 22 percent. With the new or additional tonnes recovered under the low, medium and high scenarios, the total diversion rate increases to the levels shown in Table 19.1. At the high end, the diversion of recyclable and compostable material is projected to be 54 percent (which is, 6,617K + 9,849K divided by total generated, 30,452K).
Table 19.1: Projected Recovery Scenarios (tonnes)
2002 (current) Projected New Recovery Sector
Recycled Disposed Low Medium High
Residential IC&I CR&D
2,553 K 3,509 K
555 K
9,455 K 11,552 K 2,828 K
1,628 K 2,182 K
446 K
2,605 K 3,491 K
713 K
3,768 K 5,049 K 1,032 K
Total Diversion rate
6,617 K 22%
23,835 K 4,256 K 36%
6,809 K 44%
9,849 K 54%
Numbers are rounded. Some residual error is present. Where selected mineral and metal residuals are concerned, the only way of projecting recycling rates was once again to run scenarios, typically from 25 to 100 percent. The total quantity of mineral and metal residual considered in this report is 9,560,000 tonnes, which is comprised of 768,000 tonnes of complex materials (with 202,000 tonnes of recyclable metal content) and 8,792,000 tonnes of material that can be used either as SCM or aggregate substitution, in varying proportions. More detailed summaries of industrial materials available for use are provided in Tables 18.7 and 18.8 and are not repeated in this chapter.
19.1.4 GHG Emission Reduction Potential One of the key objectives of this report is to estimate GHG emission reduction potential vis-à-vis increased recycling activities. In the previous section, recovery projections are developed and these form the basis for estimating the GHG impacts in Chapter 18. The factors used to derive GHG values are based on the difference between the recycling of a material or its disposal. The standard unit for global warming potential is tonnes carbon
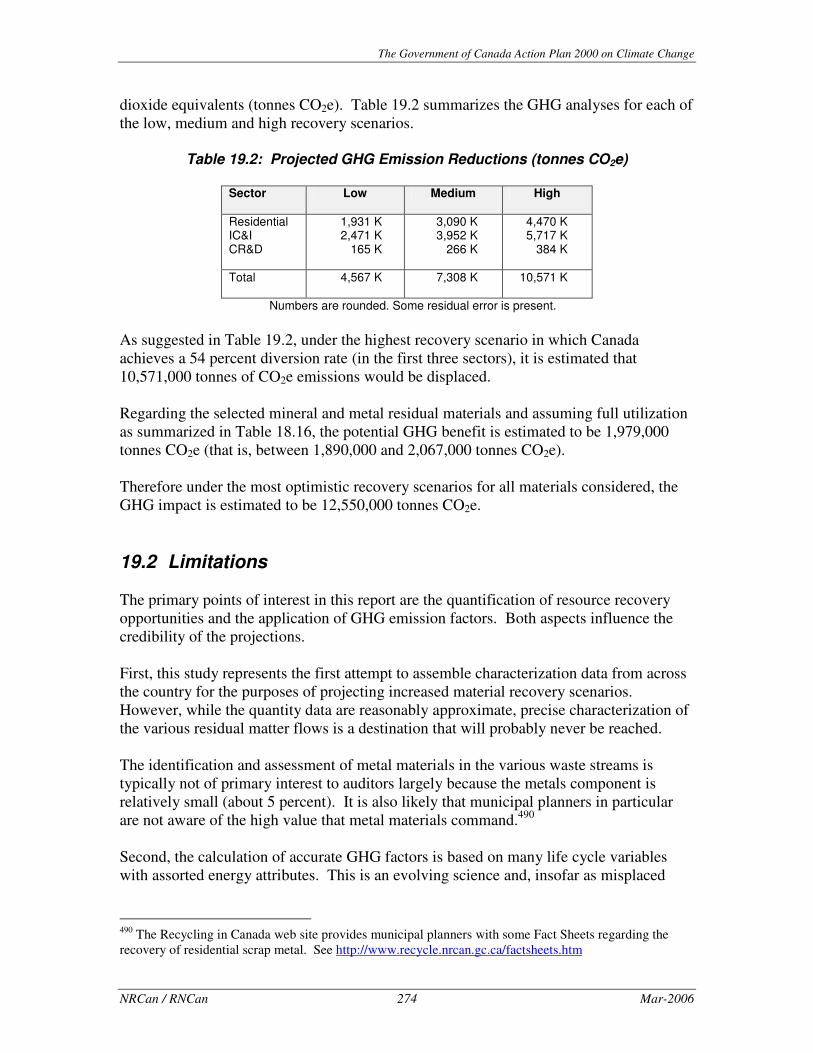
The Government of Canada Action Plan 2000 on Climate Change
NRCan / RNCan 274 Mar-2006
dioxide equivalents (tonnes CO2e). Table 19.2 summarizes the GHG analyses for each of the low, medium and high recovery scenarios.
Table 19.2: Projected GHG Emission Reductions (tonnes CO2e)
Sector
Low Medium High
Residential IC&I CR&D
1,931 K 2,471 K
165 K
3,090 K 3,952 K
266 K
4,470 K 5,717 K
384 K
Total
4,567 K 7,308 K 10,571 K
Numbers are rounded. Some residual error is present. As suggested in Table 19.2, under the highest recovery scenario in which Canada achieves a 54 percent diversion rate (in the first three sectors), it is estimated that 10,571,000 tonnes of CO2e emissions would be displaced. Regarding the selected mineral and metal residual materials and assuming full utilization as summarized in Table 18.16, the potential GHG benefit is estimated to be 1,979,000 tonnes CO2e (that is, between 1,890,000 and 2,067,000 tonnes CO2e). Therefore under the most optimistic recovery scenarios for all materials considered, the GHG impact is estimated to be 12,550,000 tonnes CO2e. 19.2 Limitations The primary points of interest in this report are the quantification of resource recovery opportunities and the application of GHG emission factors. Both aspects influence the credibility of the projections. First, this study represents the first attempt to assemble characterization data from across the country for the purposes of projecting increased material recovery scenarios. However, while the quantity data are reasonably approximate, precise characterization of the various residual matter flows is a destination that will probably never be reached. The identification and assessment of metal materials in the various waste streams is typically not of primary interest to auditors largely because the metals component is relatively small (about 5 percent). It is also likely that municipal planners in particular are not aware of the high value that metal materials command.490 Second, the calculation of accurate GHG factors is based on many life cycle variables with assorted energy attributes. This is an evolving science and, insofar as misplaced
490 The Recycling in Canada web site provides municipal planners with some Fact Sheets regarding the recovery of residential scrap metal. See http://www.recycle.nrcan.gc.ca/factsheets.htm

The Government of Canada Action Plan 2000 on Climate Change
NRCan / RNCan 275 Mar-2006
resources are concerned and their management as waste or recyclables, the previously referenced ICF study is the most up-to-date and comprehensive analysis of its kind. With better quantification and characterization data as well as better understanding of life cycles and GHG impacts, the projections developed in this report will likely change. The selection of mineral and metal residuals for this report is not intended to be all-inclusive. As a result, various materials are excluded, such as metal finishing sludge, but could be considered in future work when the data become available. 19.3 Recommendations This report is all about measurement and data. Where data gaps have been uncovered, assumptions have been made to develop the necessary projections. Too many assumptions and too many estimates may undermine the validity and usefulness of this report. Therefore for the purposes of obtaining better data with which to develop more appropriate policies, the following recommendations rate made:
� Waste characterization data should be assembled by a central agency on an ongoing basis and made available to all interested parties (via the Internet).
� Agencies that collect waste and recycling data should continue to work together to minimize response burden and to share results.
� A national ad hoc steering committee of like minded individuals should be established to address issues regarding waste measurement and data. On an ongoing basis. Such a group could be sector specific.
� Given the importance of life cycle analysis (LCA) to the development of reliable GHG emission factors used in this study, individuals and agencies interested in establishing a life cycle inventory in Canada should continue to support related activities wherever they are occurring.
The continued disposal of millions of tonnes of residual matter reflects poorly on Canada’s ability to manage its resources efficiently: In the long run there may be both environmental and economic costs to such an approach. In the short run and as a much needed first step, the systems or infrastructure required for assembling and synthesizing better waste and recycling data need to be identified and supported: This work, which is a form of materials flow accounting, can be augmented by integrating LCA knowledge for the purposes of designing and introducing policies and programs that will enable Canadians to become more efficient from both a materials’ and energy perspective. This undertaking would be of benefit to everyone interested in taking advantage of the opportunities for resource recovery that have been identified in this report.

The Government of Canada Action Plan 2000 on Climate Change
NRCan / RNCan 276 Mar-2006
Appendix A – Issues in Waste Measurement Workshop Co-funded by Government of Canada Action Plan 2000 for Climate Change, Alberta Environment, Corporations Supporting Recycling and the Recycling Council of Alberta June, 2004 .�� �������
Comprehensive and accurate measurement of waste generation and disposal has been identified as an issue virtually across the country. A national multi-stakeholder committee was established a couple of years ago to address issues surrounding national standardization of waste diversion measurement, or Generally Accepted Principles (GAP) of waste measurement. This committee has served to initiate valuable discussion regarding these issues, and has developed a protocol and manual that communities can follow in producing comparable waste generation and diversion measures.
It was determined that a national workshop on waste measurement would be valuable in determining barriers and opportunities to increased standardization of waste measurement and reporting throughout Canada. �������������
The primary workshop goal was to initiate national discussions surrounding issues of accurate and comparable waste generation and diversion measurement, with the ultimate goal to facilitate a standardized approach to facilitate data aggregation at a national level. To accomplish this goal, the following objectives were identified:
� to showcase existing waste data collection systems in Canada � to share lessons learned in the development, implementation and maintenance of
these systems � to establish a principle of assembling accurate and comparable waste generation,
diversion and disposal data � to determine whether there is an opportunity for having a standard, national
approach to data collection &�� #������������The workshop was held at the Banff Centre on March 21-23, 2004, with 25 people attending from across the country. A participant list is attached.

The Government of Canada Action Plan 2000 on Climate Change
NRCan / RNCan 277 Mar-2006
Proceedings were recorded and compiled, and subsequently provided to workshop participants for review and comment. These proceedings, including presentations, are identified at the back of this summary report. �����3�����������
Primary conclusions arising from the workshop are summarized as follows: Waste Streams to Measure Although it would be ideal to be able to measure the entire waste stream, and this is
the ultimate goal, the level of accuracy in measuring residential waste is currently much greater than for the IC&I and C&D sectors. This is largely because municipalities generally control and monitor residential waste.
However, approximately 2/3 of the waste stream is currently missing, so systems for
measuring non-residential waste must be developed. Units of Measurement Weight is the measurement unit of choice – it tends to be the most accurate and
easiest to translate into other measures, such as environmental impact. Some remote areas and sectors may require estimates based on volumes – conversions are readily available.
Measurement Purpose A comprehensive, harmonized national measurement system would serve a variety of
purposes and provide a number of advantages, including the following:
� Good information provides the foundation for decision-making. Accurate measurement allows for setting of goals and prioritizing actions.
� Harmonization provides the opportunity for benchmarking, identifying best practices, and comparative analysis.
Obtaining Private Sector Data Private sector has good data, as they need the information for business purposes.
However, they are generally reluctant to share the information because of competitive concerns. Additional work needs to be done to determine if this data can be compiled at a high enough level and in an aggregate form that the private sector would be comfortable with. For example, reporting of IC&I numbers at a provincial level may be adequate for policy development needs, but not threaten disclosure of any information of a confidential nature. Since Statistics Canada already attracts good participation from the private sector, it makes sense that they continue to collect data from this sector.
���������������-�������*����������������
A number of features were identified to define the optimal measurement system:
� User friendly and efficient

The Government of Canada Action Plan 2000 on Climate Change
NRCan / RNCan 278 Mar-2006
� Ability to extensively manipulate data � High response/participation rate � Provides valuable information – comprehensive and relevant, e.g. national
indicators � Flexible to meet a variety of needs � Nationally consistent � Transparent, standardized methodology
����������������������������������(�����
Discussions identified Statistics Canada as a potential national delivery agent that could provide a unified approach. Statistics Canada already delivers national surveys, and is a trusted agency with a very high compliance rate. There is also a high degree of confidence in data compiled by Statistics Canada, and respondents trust them to protect confidential information. It was determined that there would be value in pursuing the evolution of the current Statistics Canada Waste Management Industry Survey to accomplish the data collection goals of the group. This would provide a base level of core data collection for provinces currently not doing their own. Provinces already undertaking detailed data collection (Nova Scotia, Ontario, Quebec and Manitoba) could potentially feed their data into Statistics Canada, thereby reducing the survey burden on individual reporters. There is also the potential for provinces with detailed data collection systems to share their survey instrument with other provinces wanting to collect additional data. CSR has expressed a willingness to share their web-based tool with other jurisdictions. This information, in turn, could then be fed into the national Statistics Canada database. ����������
The Issues in Waste Measurement Workshop was a very productive event that shows strong potential to further the goal of harmonized waste data collection systems across the country. Through the ongoing facilitation and coordination of national organizations such as Natural Resources Canada, Environment Canada and Statistics Canada, in consultation with provincial governments and non-profit organizations, real progress in resolving issues surrounding waste measurement can be made. "����
The Recycling Council of Alberta prepared this report in June 2004. All of the appendices are posted on the Recycling Council of Alberta’s web site at http://www.recycle.ab.ca/conf_08.htm

The Government of Canada Action Plan 2000 on Climate Change
NRCan / RNCan 279 Mar-2006
&�� #���������������
Organization
Contact City, Province
Tire Recycling Management Association of Alberta
Stewart Bruce Edmonton, Alberta
Manitoba Product Stewardship Corporation
David Crawford Winnipeg, Manitoba
Corporations Supporting Recycling Gordon Day Toronto, Ontario Alberta Environment Christine Della Costa Edmonton, Alberta Saskatchewan Waste Reduction Council
Joanne Fedyk Saskatoon, Saskatchewan
Recyc-Quebec Louis Gagne Anjou, Quebec BC Ministry of Water, Land and Air Protection
Brian Grant Victoria, B.C.
City of Calgary Dave Griffiths Calgary, Alberta Multi-Material Stewardship Board Nancy Griffiths St. John's, Newfoundland & Labrador Environment Canada Dennis Jackson Hull, Quebec RIS International Ltd. Maria Kelleher Toronto, Ontario Nova Scotia Department of Environment and Labour
Bob Kenney Halifax, Nova Scotia
Town of Banff Kurt Koester Banff, Alberta City of Edmonton Greg Lewin Edmonton, Alberta Statistics Canada John Marshall Ottawa, Ontario Corporations Supporting Recycling Guy Perry Toronto, Ontario BFI Harold Richardson Calgary, Alberta Alberta Environment Bob Rippon Edmonton, Alberta Recycling Council of Alberta Christina Seidel Bluffton, Alberta Natural Resources Canada Robert Sinclair Ottawa, Ontario Northern CARE / Athabasca Regional Waste Management Services Commission
Rob Smith Athabasca, Alberta
Recycling Council of Ontario Jo-Anne St. Godard Toronto, Ontario Greater Vancouver Regional District Mike Stringer Burnaby, B.C. Earth Tech Sarah Wilmot Burnaby, B.C. Recycling Council of British Columbia Natalie Zigarlick, Vancouver, B.C. �&�� #���"��������������������
Overview: � Workshop Notes � Current Data Collection � Ontario, Saskatchewan, Alberta Municipal Systems (summary) � British Columbia (presentation) � Greater Vancouver Regional District (report) � Quebec (presentation) � Alberta (report) � Nova Scotia (presentation) � Newfoundland & Labrador (presentation) � Statistics Canada Presentation � Generally Accepted Principles (GAP) � Solid Waste Benchmarking
The individual presentations are available on-line at the RCO’s web site: http://www.recycle.ab.ca/Download/MeasurementReport.pdf (Mar-2006)

The Government of Canada Action Plan 2000 on Climate Change
NRCan / RNCan 280 Mar-2006
Appendix B - Second Annual Waste and Recycling Measurement Workshop Co-funded by Government of Canada Action Plan 2000 for Climate Change, Environment Canada and RECYC-QUÉBEC May 26-27, 2005 Background In March 2004 the first waste measurement workshop was held in Banff to assemble interested players from across Canada to address issues and solutions regarding the monitoring and quantification of waste generation, diversion and disposal. It was also strongly believed that an opportunity existed in which lessons could be shared between those provinces that have implemented measurement systems and those that have not. The primary Federal role appears to be one in which these discussions are facilitated. Since the Banff workshop ended with a number of recommended next steps, a national conference call was held in June 2004. This was a useful exercise intended mostly to keep the momentum going. The minutes from that call included a suggestion that another measurement workshop would be timely. Given the fact that the first workshop was held in the west, it was decided to hold the second one in the east and in this regard Quebec was selected. Original plans would have seen the workshop take place in February or March (a year after Banff) but this moved to June for a number of administrative reasons. Both Environment Canada and RECYC-QUEBEC were recruited as funding partners by Natural Resources Canada.491 As the “host”, RECYC-QUEBEC was tasked with finding an agency to coordinate and facilitate the workshop on behalf of the three partners. Towards this end, the Front commun Québécois pour une gestion écologique des déchets (FCQGED492) was selected. �
&�� #���-2��������
Three objectives underpinned the 2005 workshop: � To maintain the national network of waste/recycling measurement individuals and
organizations � To check on provincial progress and to share lessons learned � To broaden the discussion from measurement systems to include waste
characterization work (������-������$�
The agenda for the workshop is attached in Appendix A. Essentially the first whole day was dedicated to presentations and discussions concerning waste and recycling 491 The source of NRCan’s workshop funding is the Government of Canada, Action Plan 2000 on Climate Change (Enhanced Recycling Program, Minerals and Metals Sector). 492 Voyez http://www.cam.org/~fcqged/ seulement en français.

The Government of Canada Action Plan 2000 on Climate Change
NRCan / RNCan 281 Mar-2006
measurement systems. The second half-day focused on waste characterization for the purposes of assessing program performance and identifying potential resource recovery opportunities. 4������������������
The FCQGED identified three potential venues for the workshop and the preferred location was Centre de Villégiature, Jouvence, located near Mont Orford in the Eastern Townships. About half of the participants came to the workshop by car and the other half flew and drove from Quebec airports. A participant list is attached in Appendix B. The minutes were taken by FCQGED and are attached in Appendix C. Also included with the minutes are the PowerPoint presentations that individuals prepared and presented at the workshop. ���������5�������
Non-Residential Data As in Banff, workshop participants agreed that IC&I and CR&D data collection are
still significant challenges. Statistics Canada (and sanctioned agents) compiles these data under their protocol of data aggregation and confidentiality but other players do not have the same access. It may be useful to approach an industry organization such as the Ontario Solid Waste Management Association (OWMA) to find out what their views are on data issues.
Generally Accepted Principles The GAP approach to program data and comparison mainly focuses on municipal
(residential) activities but efforts to measure IC&I waste material flows have also been attempted with less success. On the residential side, Statistics Canada has adopted some of the GAP principles for use in their waste surveys. Waste Diversion Ontario recently contracted with RIS to prepare GAP profiles on the 30 largest municipalities (see http://www.csr.org/gap/index.htm for more information). In Ontario, GAP is closely integrated with the datacall.
Web-Based Systems Following Ontario’s lead, Nova Scotia has developed its own on-line data waste and
recycling data collection systems. The primary advantages for this approach are cost-effectiveness, flexibility, convenience and speed. A private out-sourcing option is also available under the name of Re-TRAC (see http://www.re-trac.com).
Duplication and Response Burden Statistics Canada is not interested in duplicating provincial measurement activities
although, where surveys overlap, differences persist. Therefore, when a province and Statistics Canada reach agreement about reducing response burden (i.e. the province takes on that responsibility for the residential sector), Statistics Canada’s main concern is maintaining consistency across the country with a view towards having regionally compatible data sets.

The Government of Canada Action Plan 2000 on Climate Change
NRCan / RNCan 282 Mar-2006
Points of Measurement As discussed, there are many points of measurement when it comes to waste and
recycling. In some provinces the emphasis is on measuring waste disposal and using that as the yardstick for performance (based on an historical marker). In other provinces, it is critical to measure recyclables since that forms the basis for municipal program funding. In a perfect world both streams would be measured to provide a complete picture of which materials are flowing where. There is no consensus on this issue. However, it is most important that all forms of measurement be clearly stated and transparent so that others will understand what the numbers represent.
Waste Characterization Characterization work is very important for evaluating program and/or targeted
material performance. Interest in and support for characterization projects varies from province to province. The most frequent agents for conducting this kind of work have been municipalities, given the fact that their reports are readily available. In some provinces, industry steward groups have initiated characterization work (e.g. Ontario and Manitoba). In others it is the province that has driven these studies (e.g. Quebec).
Many different methodologies are available for evaluating solid waste
characterization. It is understood that the approach established by CCME493 in 1999 is the preferred one as it has been used extensively across Canada since that time. The Recycling Council of Alberta (RCA) is developing a characterization framework that will include suggested protocol and recommended aggregation guidelines (see Appendix D).
The Molehill project that was conducted by the Recycling Council of Ontario offers
further insight into the characterization of CR&D waste. That report will be available on the RCO’s web site.
��������������"�6�������
At the Mont Orford workshop, a participant said: “The consistent use of standard approaches leads to better understanding”. That one sentence captures the essence of what these measurement workshops are all about. Nova Scotia’s Datacall The Department of the Environment and Labour prepared and distributed copies of a
report entitled “Developing a Waste-Resource Management Datacall System” (dated May 2005). The purpose of the report was to document all the efforts that NS has gone to in building their web-based system. Review and comments would be appreciated – contact Bob Kenney at NSDEL directly for more information.
493 See www.ccme.ca/assets/pdf/waste_e.pdf (in English); www.ccme.ca/assets/pdf/waste_f.pdf (en français)

The Government of Canada Action Plan 2000 on Climate Change
NRCan / RNCan 283 Mar-2006
Saskatchewan’s Datacall The Saskatchewan Waste Reduction Council and the Association of Regional Waste
Management Authorities of Saskatchewan Inc. are currently undertaking an extensive survey over 500 waste facilities in the province. It will be interesting to see how their numbers differ with Statistics Canada for the same year. A final report is expected in August 2005. Contact Joanne Fedyk of SWRC directly with questions.
Recycling Council of Alberta’s Characterization Framework Christina Seidel will be looking for some peer review assistance – please contact her
directly to express you interest. California Integrated Waste Management Board (CIWMB) Their approach to assembling a statewide database on waste generation and
composition was identified as a model that may be of interest to Canada, at a provincial or national level. Please visit the web site494 and tour the database to determine if this is something worth replicating within Canadian data and if so, what might that look like?
Missing Data The data that are most lacking are IC&I and CR&D. There was interest in pooling
data that has been collected from the non-residential sector. As a group it would be useful to consider how this might be done, where would the data reside, who would have access to it and what would be done with it. There are two catalysts for moving forward on this issue: (1) the RCA study mentioned above and (2) the NRCan study entitled “An Analysis of Resource Recovery Opportunities in Canada and the Projection of Greenhouse Gas Emission Implications” which includes a great deal of waste characterization data from all sectors.
Further national discussions Funding from Action Plan 2000 on Climate Change (via the Enhanced Recycling
Program c/o NRCan) is no longer available to support measurement workshops although proposals have been submitted to extend or even expand the program. Therefore, further discussions by interested parties may best be accomplished by piggybacking on related events. The RCA/Composting Council of Canada joint conference in October 2005 was identified as the next event where this might happen.
494 See http://www.ciwmb.ca.gov/wastechar/

The Government of Canada Action Plan 2000 on Climate Change
NRCan / RNCan 284 Mar-2006
WORKSHOP AGENDA Thursday, May 26 7:00 a.m. Breakfast 8:30 a.m. Introductions and Welcome (Rob Sinclair & facilitator) 8:45 a.m. Setting the Stage (Rob Sinclair)
� What did we learn at the last workshop? � Where are we going?
9:00 a.m. Facilitated Group Discussion Regarding Key Issues (Facilitator)
� Review the key issues? � Disposal or diversion or both � Boundary conditions (re non-residential waste & recycling data?) � Response burden (overlapping surveys?) � What else came out of the Banff workshop?
9:30 a.m. Update on provincial activities re waste/recycling data collection (Facilitator)
� BC - Brian Grant (5 min) � AB - Christine Della Costa (5 min) � SK - Joanne Fedyk, Tracy Roy (10-15 min) � MB – Brett Eckstein (5 min) � ON – Glenda Gies, Guy Perry (15-20 min) � QC - Louis Gagné (10 min) � NB - Kevin Gould (5 min) � PEI – Rob Sinclair (5 min) � NF - Nancy Griffith (5 min) � Other discussion
11:00 a.m. Update discussion continues (Facilitator)
� NS - Bob Kenney (60 min) including discussion 12:00 p.m. Lunch 1:00 p.m. Update on National Overview
� Statistics Canada – John Marshall (20-30 min) � 2002 data results, 2004 survey in the field, GAP questions
1:30 p.m. Private Sector Data Management Option
The Government of Canada Action Plan 2000 on Climate Change
NRCan / RNCan 285 Mar-2006
� Re-TRAC™ on-line data system – Rick Penner (60 min) 2:30 p.m. Conclusions and Next Steps (Facilitator)
� Summarize common goals and issues (where have we been, where do we stand, and where are we going?)
� Summarize & compare roles and responsibilities in each province � Municipality, province, industry, NGO – who does what? � Fundamental data collection, verification (data integrity), compilation, analysis,
reporting … resources and funding support? � Identify barriers and constraints to introducing comprehensive waste/recycling
data collection systems � Explore the link to broader environmental reporting (e.g. Genuine Progress Index)
4:00 p.m. Close and free time 5:00 p.m. Group activity 7:00 p.m. Dinner Friday, May 27 7:30 a.m. Breakfast 8:30 a.m. Characterizing the waste stream (brief presentations)
� Introduction to the issue – there is interest and activity in some provinces – Rob Sinclair (5 min)
� Enhanced Recycling Program – Recycling Statistics Project summary – Rob Sinclair (10-15 min)
� Alberta’s Waste Characterization Framework project – Christina Seidel (10-15 min)
� Quebec’s (Chamard et al) study of waste in all sectors – Louis Gagné (10 min) � Stewardship Ontario’s residential waste characterization activity – Guy Perry (10-
15 min) � Manitoba waste characterization work – Rick Penner (5 min)
10:00 a.m. Characterization data in general (facilitator) General discussion:
� Many studies have been done across Canada: Who does them and why? � Do municipalities/businesses have the right tools? � Data are available: Residential waste, IC&I waste, CR&D waste: Is it enough,
do we need more, what’s missing? � What are the general views on the value of waste characterization data? � Does good waste characterization data actually influence program decision-
makers? � Assuming there is interest sharing waste composition data, how can that be
achieved?

The Government of Canada Action Plan 2000 on Climate Change
NRCan / RNCan 286 Mar-2006
� California Integrated Waste Management Board’s on-line searchable solid waste characterization database www.ciwmb.ca.gov – Rob Sinclair (5 min)
10:30 a.m. IC&I characterization data
� What would a coordinated, cooperative approach to assembling IC&I data look like?
� Waste generation & characterization factors. Kg/employee: Is this the right unit? � Who has IC&I waste characterization data and how can they be accessed? � What challenges/opportunities should be considered?
11:00 a.m. CR&D characterization data
� Climbing Another Molehill – CR&D Waste Characterization – Jo-Anne St. Godard (10-15 min)
� Alberta CRD Waste Advisory Committee work, report on-line – Christina Seidel (5-10 min)
� Work in progress – Recycling Statistics project – Rob Sinclair (10-15 min) 11:30 a.m. Path Forward/Wrap Up
� Is there a Federal role involving waste characterization work? Conduct annual workshops? Clearinghouse for data?
� Not all waste audits are alike: Is there a need to standardize and if so how can that be done?
� Next steps? ~12:00 p.m. Lunch, Close and Departures

The Government of Canada Action Plan 2000 on Climate Change
NRCan / RNCan 287 Mar-2006
WORKSHOP PARTICIPANTS
Organization
Contact City, Province
Alberta Environment Christine Della Costa
Edmonton, Alberta
Recycling Council of Alberta Christina Seidel
Bluffton, Alberta
Ministry of Water, Land and Air Brian Grant
Victoria, B.C.
Manitoba Conservation, Brett Eckstein
Winnipeg, Manitoba
Multi-Material Stewardship Board
Nancy Griffiths
St. John’s, Newfoundland & Labrador
Department of Environment & Labour
Bob Kenney
Halifax, Nova Scotia
Statistics Canada Amanda Elliortt
Ottawa, Ontario
Waste Diversion Ontario Glenda Gies
Toronto, Ontario
RIS International Maria Kelleher
Toronto, Ontario
Statistics Canada John Marshall
Ottawa, Ontario
Corporations Supporting Recycling
Guy Perry
Toronto, Ontario
Natural Resources Canada Rob Sinclair
Ottawa, Ontario
Collecte Sélective Québec Réjean Bouchard
Montréal, Québec
Ministère de l’Environnement Marie Dussault
Québec, Québec
Ministère de l’Environnement
Alix Fortin
Québec, Québec
Environment Canada Dennis Jackson
Hull, Quebec
RECYC-QUEBEC Louis Gagne
Montréal, Québec
FCQGED Karel Menard
Montréal, Québec
Ministère de l’Environnement
Patrice Savoie Québec, Québec
RECYC-QUEBEC Guy Tremblay
Québec, Québec
Solid Waste Reduction Council Joanne Fedyk
Saskatoon, Saskatchewan
Saskatchewan Environment Edgar Gee
Regina, Saskatchewan
Assoc. of Regional Waste Mgmt. Authorities of SK Inc.
Anne Mathewson
Saskatoon, Saskatchewan

The Government of Canada Action Plan 2000 on Climate Change
NRCan / RNCan 288 Mar-2006
Appendix C – List of Waste Audit Reports Province Community Project title Date Prepared by: Comments
British Columbia
Regional District of Kootenay Boundary
Residual Waste Compositon Study 2002 Becky Brown, Selkirk College
municipal
GVRD Greater Vancouver Regional District Waste Flow and Recycling Audit
1993 CH2MHILL IC&I
GVRD Waste Composition Study at the North Shore Transfer Station
2001 Sperling Hansen Associates
residential and IC&I
GVRD Solid Waste Composition Study 2005 Technology Resource Inc. residential and IC&I
City of Kelowna Waste Profile for the City of Kelowna and Surrounding Region
2002 CH2MHILL mass balance
Regional District of North Okanagan
Waste Composition Study for the RD of North Okanogan
1998 EcoChoice Consulting & Footprint Envtal Consultants
rural and some IC&I
BC Institute of Tech, Burnaby Campus
Solid Waste Audit 2002 May Jean O'Donnell IC&I
Capital Region District Summary of Phase 1 and 2 Solid Waste Composition Study
2001 Sperling Hansen Associates
all streams
Alberta Province-wide CRD Waste Characterization Study 2000 CH2M Gore & Storrie Ltd. C&D waste City of Calgary Exec. Summary, Residential Waste
Composition Study 2000 CH2M Gore & Storrie Ltd. residential
City of Calgary Using a Waste Generation Model and GIS Applications for the City of Calgary ICI/CRD Waste Composition Study
2002 mun. and consultant team IC&I and C&D waste
City of Edmonton Waste Characterization Study 2001 municipal staff mostly residential
Province-wide Opportunities for Accelerated Solid Waste Reduction in Alberta
1997 AGRA Earth & Environmental Ltd.
all streams
Saskatchewan City of Saskatoon Solid Waste Characterization Study 1998 municipal staff all streams

The Government of Canada Action Plan 2000 on Climate Change
NRCan / RNCan 289 Mar-2006
City of Regina Waste Characterization Study Final Report 1996 Kim Barlishen, University of Regina
all streams
Manitoba City of Winnipeg Waste Composition Study 2000 earthbound environmental
inc. residential
Rural Manitoba Rural Residential Waste Composition Study 2000 earthbound environmental inc.
residential
Ontario Region of Ottawa-
Carleton Construction and Demolition Waste Composition Study
1998 Castonguay Tedchnologies Inc.
C&D waste
Region of Ottawa-Carleton
Solid Waste Characterization Project 1991 Stanley and Associates, et al.
IC&I
City of Ottawa various waste composition studies, curbside and apartments
1997-99
various consultants residential
Natural Resources Canada
facility waste generation and composition 1996-2000
various consultants IC&I
Interim Waste Diversion Organization
see next sheet for list of available studies 2000-2002
various consultants various streams
Toronto SWEAP Waste Composition Study - Discussion paper No. 4.3
1999 P&R Ltd., SENES Ltd. IC&I
Quebec Province-wide Bilan 2000 de la Gestion des Matières
Résiduelles au Québec 2000 Recyc-Quebec mass balance
Province-wide Caractérisation des matières résiduelles au Québec
2000 Chamard & Associes, et al.
mostly residential, 4 season
New Brunswick Fredericton Development of the Fredericton Region Solid
Waste Commission Waste Reduction and Diversion Plan
2002 GEMTEC Ltd. urban and rural
Nova Scotia Lunenburg A Study to Determine the Compositionof
Residual Solid Waste & Recyclables in the Municipality of Lunenburg
2001 SNC - Lavalin mostly residential
Halifax Regional Municipality
HRM Solid Waste Characterization Study (2003)
2003 SNC - Lavalin residential and IC&I

The Government of Canada Action Plan 2000 on Climate Change
NRCan / RNCan 290 Mar-2006
Newfoundland & Labrador
Greater Avalon Region Avalon Waste Management 2002 Avalon Community Consultative Committee
residential and IC&I
Labrador Waste Audit for Three Coastal Communities of Labrador: Mary's Harbour, Cartwright and Nain
1999 Quebec-Labrador Foundation
residential
Labrador Labrador Straits Waste Audit Report: Results, Analysis and Recommendations
1999 Quebec-Labrador Foundation
residential
The North City of Whitehorse Solid Waste Action Plan 1995 Whitehorse Solid Waste
Task Force urban and rural
Northwest Territories Solid Waste Composition Study for Iqualuit, Pangnirtung and Broughton Island of the Northwest Territories
1990 Heinke & Wong mostly rural

The Government of Canada Action Plan 2000 on Climate Change
NRCan / RNCan 291 Mar-2006
Interim Waste Diversion Organization, co-funded waste characterization studies 1 The Regional Municipality of Halton “WasteWatch” Program ; Waste Characterization Study
Final Report (Project # OPT R1-01)
2 Waste Composition Studies 2000 : City of Peterborough (Project # OPT R1-02)
3 Durham Region (Clarington) Waste Audit (Project # OPT R1-03)
4 Township of Augusta Waste Audit 2000 (Project # OPT R1-04)
5 Residential Curbside Waste Audit For North Glengarry (Project # OPT R1-05)
6 City of Toronto Waste Composition Study 2000/2001 (Project # OPT R1-08)
7 Sudbury Residential Waste Audit Results (Project # OPT R1-09)
8 Residential Curbside Collection Program Set-Out Study (Project # OPT R1-10)
9 Summary of Study Findings in the Development of the Ontario Municipal Waste Composition Estimation Model (Project # OPT R2-01)
10 Seasonal Waste Composition Study for Streamed Programs Simcoe County (Project # OPT/ORG R2-03)
All the above reports are available at the following web site - http://www.wdo.ca/

The Government of Canada Action Plan 2000 on Climate Change
NRCan / RNCan 292 Mar-2006
Appendix D- Provincial Waste Characterization Framework A Joint Project of Alberta Environment, Government of Canada, Action Plan 2000 on Climate Change (Enhanced Recycling Program)1 and the Recycling Council of Alberta Final Project Report, October, 2005 (also available on-line at http://www.recycle.ab.ca/Download/WasteCharFinalReport.pdf)
(� ��$����������
The Government of Canada Action Plan 2000 on Climate Change Minerals and Metals Program is working towards reducing Canada's greenhouse gas (GHG) emissions from the minerals and metals sector (MMS). By matching funds with other partners and collaborators, the Minerals and Metals Program supports initiatives that enhance mineral and metal recycling practices, and assess alternate production processes with focus in those industrial sectors with high GHG-emitting activities. The Minerals and Metals Program is managed by the Minerals and Metals Sector of Natural Resources Canada.
1 Natural Resources Canada chairs the Enhanced Recycling Program Advisory Committee.

The Government of Canada Action Plan 2000 on Climate Change
NRCan / RNCan 293 Mar-2006
Table of Contents
1. Background 1.1 Project Goal 2. Review of Existing Protocols 3. Design Compatibility with Other Waste Characterization Studies 3.1 Standard definitions of waste sectors 3.1.1 Industrial Waste 3.1.2 Commercial Waste 3.1.3 Consumer Waste 3.1.4 Other Wastes 3.2 Standard definitions of materials in the waste stream 3.3 Standardized recording and presentation of data 4. Procedures for Selecting Disposal Facilities, Generators, Loads and Waste Samples 4.1 Disposal Facility Selection 4.2 Disposal Facility Load Selection 4.3 Disposal Facility Waste Sample Selection 4.4 Generator Selection 4.5 Generator Waste Sample Selection 4.6 Number of Samples and Random Sampling 5. Rural Waste Characterization 5.1 Rural Waste Characterization Methodology 5.1.1 Selection and Recruiting of Businesses 5.1.2 Site Visits 5.1.3 Generation Period 6. Budgeting Waste Characterization Research 6.1 Scenario #1: One landfill (regardless of what size population it serves) 6.2 Scenario #2: Three landfills (findings at the municipality level) 6.3 Scenario #3: Three landfills (findings at the landfill level) 7. Existing Waste Composition Data 8. Overall Waste Composition Results 9. Waste Modeling 10. References
Appendices
The Government of Canada Action Plan 2000 on Climate Change
NRCan / RNCan 294 Mar-2006
1. Background Comprehensive and accurate measurement of waste generation and disposal continues to be an issue at both provincial and national levels. Considerable efforts and progress are being made towards improving and streamlining the measurement of waste disposal across Canada. At the same time, additional detail and perspective can be obtained through closer examination of the composition of waste generated from various sources. A number of communities and organizations have conducted waste composition analyses for their internal use. However, there is currently no mechanism to coordinate this research, or to compile results on a provincial level. 787� �������������
This project was initiated to develop a provincial waste characterization framework that will provide a suggested protocol for conducting waste characterization studies, as well as a process for coordinating and aggregating waste characterization data on a provincial level. 2. Review of Existing Protocols Phase 1 of the project involved researching existing protocols for conducting waste characterization analyses. This research is summarized in Annex A. As shown in the table, a number of primary features that were assessed as important to the research have been outlined. These include the organization initiating the development of the protocol, date of publication, waste streams and sectors addressed, time period suggested for study, sampling method or study area, collection method or source, health and safety considerations, number of sorting categories, data analysis summary, and worksheets provided. Five primary Canadian protocols were identified, while an additional five protocols were reviewed from US sources. One regulatory protocol was also included from the European community. Sampling methodologies utilized within each protocol were also researched in more detail, and are summarized in Annex B. Protocols were then reviewed with respect to the features identified. A comparison based on this review is summarized in

The Government of Canada Action Plan 2000 on Climate Change
NRCan / RNCan 295 Mar-2006
Annex C. As can be seen, various protocols have different advantages and disadvantages. For example, the BC Environment protocol does not specifically address IC&I2 or CRD3 sectors, while the Ontario Ministry protocol does not specifically deal with CRD waste. The Stewardship Ontario protocols are also limited, in that they are geared to residential waste, although they provide a high level of comprehensiveness for this waste stream. The Canadian Council of Ministers of the Environment (CCME) methodology is of particular interest in that it was a previous initiative to integrate the best components from existing protocols, combining features of the BC Environment, Ontario Ministry of the Environment and California Integrated Waste Management Board protocols/guidelines to create a waste characterization methodology. This approach resulted in a good overall protocol, lacking only specific reference to CRD waste, as well as providing less detail on waste sampling methodology than some other protocols. Looking outside Canada, the Washington State Department of Ecology offers the most current (2003) and comprehensive waste characterization protocol that was identified. This protocol addresses residential, IC&I and CRD sectors, and offers considerable detail on sampling methodology, including a detailed waste category list. The comprehensiveness of this protocol is perhaps also its only drawback, in that it may be too onerous for small communities. Other international protocols are instructive in specific ways. For example, the American Society for Testing and Materials (ASTM) Standard Test Method provides a highly technical standard. The European Community (EC) regulation, on the other hand, offers a regulatory foundation for waste characterization, and includes a very comprehensive waste category listing. The reference tables provide information that will assist governments and other decision-makers to choose the best waste characterization protocol for specific research needs. In general, the CCME protocol offers a good overall guideline for undertaking generic waste composition research, while those researchers requiring an increased level of comprehensiveness may consider the Washington State protocol. 3. Design Compatibility with Other Waste Characterization Studies Waste characterization studies are typically conducted to answer questions related to the feasibility of recovering or diverting specific materials from the disposal waste stream. However, each study also has the potential to contribute to a larger body of knowledge at the provincial or national level. If research is to provide this additional value, it is important for waste characterization studies to be designed to answer immediate questions as required locally, while also considering how the results can also be utilized at the aggregate level. The latter can be facilitated by conforming to certain conventions, such as the following: 987� �����������)���������)�$����������
Standard definitions for waste stream sectors (e.g., industrial, construction / demolition and residential waste) can ensure that waste is assigned in the same way in each study. For instance,
2 Industrial, commercial and institutional is also referred to as ICI in some provinces. 3 Construction, renovation and demolition is also referred to as C&D, CR&D or DLC (demolition and landclearing) in some provinces.
The Government of Canada Action Plan 2000 on Climate Change
NRCan / RNCan 296 Mar-2006
Guidelines for Waste Characterization Studies in the State of Washington (Cascadia Consulting Group Inc., 2003a) gives a detailed description of waste sectors: 3.1.1 Industrial Waste Originates from businesses that are engaged in agriculture, resource extraction, or manufacturing. Businesses that have North American Industry Classification System (NAICS) codes ranging from 11 to 33 (at the 2-digit level of detail) are classified as industrial. 3.1.2 Commercial Waste Originates from businesses, government agencies, and institutions engaged in any activity other than those associated with industry as defined above. Examples include, waste originating from retail and wholesale businesses, medical facilities, schools, government agencies, and park and street maintenance. Commercial entities have NAICS codes ranging from 42 to 92 (at the 2-digit level of detail). 3.1.3 Consumer Waste Originates from households as a function of the “living” activities in those households. In the strict definition, it does not include waste generated by business activity conducted at households, although for practical purposes it can be difficult to distinguish home-business waste from consumer waste in a characterization study. Consumer waste also does not include waste generated by construction, remodeling, or landscaping activities that are conducted by hired companies at a residential location. 3.1.4 Other Wastes Typically are tracked and counted separately by waste disposal facilities. Examples include sludge from sewage treatment plants, petroleum-contaminated soils, asbestos, and other special wastes. 98:� �����������)���������)��������������#��$����������
Material definitions (e.g., newspaper, PET bottles, food waste, painted wood, concrete, aluminum foil) are also required to guide waste characterization studies. A list of material definitions that cover numerous types of studies can be developed. This compatibility in material lists can facilitate comparisons in disposal behaviour, recycling levels and overall program performance. The California Statewide Waste Characterization Study – Results and Final Report, which includes the Draft Regulations Governing Disposal Characterization Studies (Cascadia Consulting Group Inc. et al, 1999) and the Guidelines for Waste Characterization Studies in the State of Washington (Cascadia Consulting Group Inc., 2003a), both have material definition lists. Additionally, the CCME methodology provides a basic list of waste categories for sampling purposes (see Annex G). 989� ���������;������������������������������)�������
Selecting specific databases or models for information storage can assist with analysis and data sharing among communities. The following waste characterization databases and model are available for communities utilizing data as required.
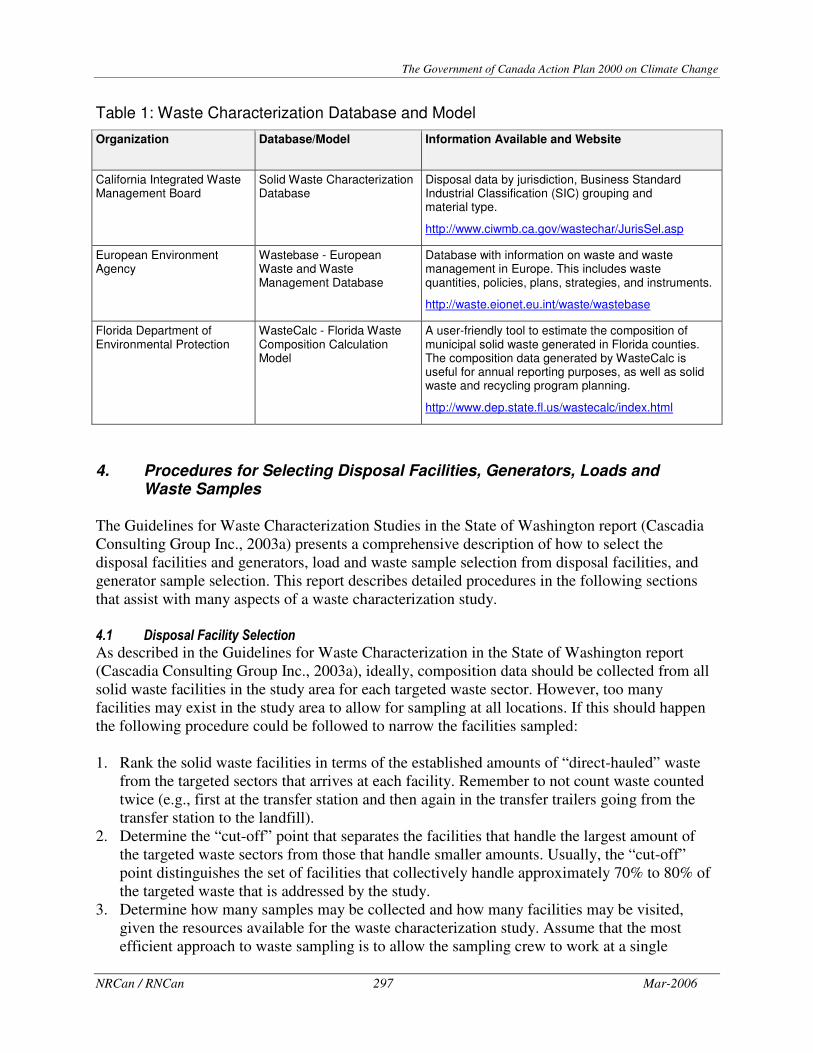
The Government of Canada Action Plan 2000 on Climate Change
NRCan / RNCan 297 Mar-2006
Table 1: Waste Characterization Database and Model
Organization Database/Model Information Available and Website
California Integrated Waste Management Board
Solid Waste Characterization Database
Disposal data by jurisdiction, Business Standard Industrial Classification (SIC) grouping and material type.
http://www.ciwmb.ca.gov/wastechar/JurisSel.asp
European Environment Agency
Wastebase - European Waste and Waste Management Database
Database with information on waste and waste management in Europe. This includes waste quantities, policies, plans, strategies, and instruments.
http://waste.eionet.eu.int/waste/wastebase
Florida Department of Environmental Protection
WasteCalc - Florida Waste Composition Calculation Model
A user-friendly tool to estimate the composition of municipal solid waste generated in Florida counties. The composition data generated by WasteCalc is useful for annual reporting purposes, as well as solid waste and recycling program planning.
http://www.dep.state.fl.us/wastecalc/index.html
4. Procedures for Selecting Disposal Facilities, Generators, Loads and
Waste Samples The Guidelines for Waste Characterization Studies in the State of Washington report (Cascadia Consulting Group Inc., 2003a) presents a comprehensive description of how to select the disposal facilities and generators, load and waste sample selection from disposal facilities, and generator sample selection. This report describes detailed procedures in the following sections that assist with many aspects of a waste characterization study. <87� �������/������������������
As described in the Guidelines for Waste Characterization in the State of Washington report (Cascadia Consulting Group Inc., 2003a), ideally, composition data should be collected from all solid waste facilities in the study area for each targeted waste sector. However, too many facilities may exist in the study area to allow for sampling at all locations. If this should happen the following procedure could be followed to narrow the facilities sampled: 1. Rank the solid waste facilities in terms of the established amounts of “direct-hauled” waste
from the targeted sectors that arrives at each facility. Remember to not count waste counted twice (e.g., first at the transfer station and then again in the transfer trailers going from the transfer station to the landfill).
2. Determine the “cut-off” point that separates the facilities that handle the largest amount of the targeted waste sectors from those that handle smaller amounts. Usually, the “cut-off” point distinguishes the set of facilities that collectively handle approximately 70% to 80% of the targeted waste that is addressed by the study.
3. Determine how many samples may be collected and how many facilities may be visited, given the resources available for the waste characterization study. Assume that the most efficient approach to waste sampling is to allow the sampling crew to work at a single

The Government of Canada Action Plan 2000 on Climate Change
NRCan / RNCan 298 Mar-2006
location for one or more complete days, rather than the crew moving from one facility to another on the same day.
4. Use the random selection method to choose the requisite number of facilities from among those that handle the largest amounts of the targeted waste.
5. For the facilities where sampling does not occur, correlate the waste in each sector to the waste at the facilities where the sampling does take place. For instance, if single-family waste is sampled at one large facility, while two small facilities are not visited at all, then single-family waste at the smaller facilities should be assumed to have the same composition as the larger facility. Typically, this issue is considered later during the analysis phase of the study.
<8:� �������/��������=��������������
The Guidelines for Waste Characterization in the State of Washington report (Cascadia Consulting Group Inc., 2003a) states that, in order to obtain waste samples at disposal facilities, the most practical approach is usually to select certain vehicles through a systematic selection process and then to characterize the loads, or portions of the loads, that are delivered by the selected vehicles. The following suggested procedure should be repeated for each targeted waste sector that is sampled at the disposal facility. 1) During the construction of the sampling plan, determine how many loads representing the
targeted waste sector arrive at the facility on the chosen sample day. Let the variable a represent the number of loads.
2) Allow some margin for uncertainty in the number of loads that will arrive on the sampling day. In order to create a safety margin, reduce the number of loads that the study anticipates to arrive by approximately 20% (e.g., reduce the number of loads expected for planning purposes to approximately 0.8 x a)
3) Determine how many waste samples are to be obtained and characterized for a particular waste sector on the scheduled day. Designate the targeted number of samples with the variable b. As a guide for determining the number of samples to be sampled during the day, an untrained sorting crew can sort approximately eight to ten samples by hand in one day, when the sample weight is roughly 200 lbs and is composed of mixed materials. A highly trained sorting crew can sort as many as 15 waste samples in one day. If visual characterization methods are utilized, a single person can characterize approximately 25 to 30 loads in one day.
4) The requisite number of samples, b, will be chosen systematically from the 0.8 x a loads available for sampling. The number of loads available for sampling will be divided by b to determine the interval, c, which loads will be chosen for sampling.
5) A random starting point should be selected, and sampling should then proceed throughout the day. Based on a randomly chosen integer, d, between 1 and c, the sampling crew should obtain the first sample of the day from the dth load of the targeted waste sector that arrives on the sampling day. Every cth load thereafter should be sampled, until the quota of samples is met for the day.
a – expected number of loads for the day b – targeted number of samples c – interval at which loads will be selected for sampling d –number corresponding to the first sampled load

The Government of Canada Action Plan 2000 on Climate Change
NRCan / RNCan 299 Mar-2006
<89� �������/��������&���������������������
The appropriate procedure for selecting the waste from a load, as presented in the Guidelines for Waste Characterization in the State of Washington report (Cascadia Consulting Group Inc., 2003a), is to be characterized depending on the method of characterization. If visual composition estimates are being used, then the entire load should be characterized. If hand sorting is being done, then a manageable portion of the load should be selected through the random selection.
1) Tip the load onto the facility floor or on to the ground, such that it forms a symmetrical elongated pile.
2) Envision that a grid divides the load into multiple sections. The appropriate number of sections depends on the size of the load. For loads tipped from packer trucks or other large vehicles, divide the load in a grid with 16 sections (Figure 1). For smaller loads, envision the load being divided into eight sections.
Figure 1: Imaginary Grid on Elongated Pile (Cascadia Consulting Group Inc., 2003a)
3) Choose one cell through the random selection process. Extract the waste material dedicated to the selected cell and move it to the sorting area. Examples of recommended numbers and sample sizes include can be viewed in
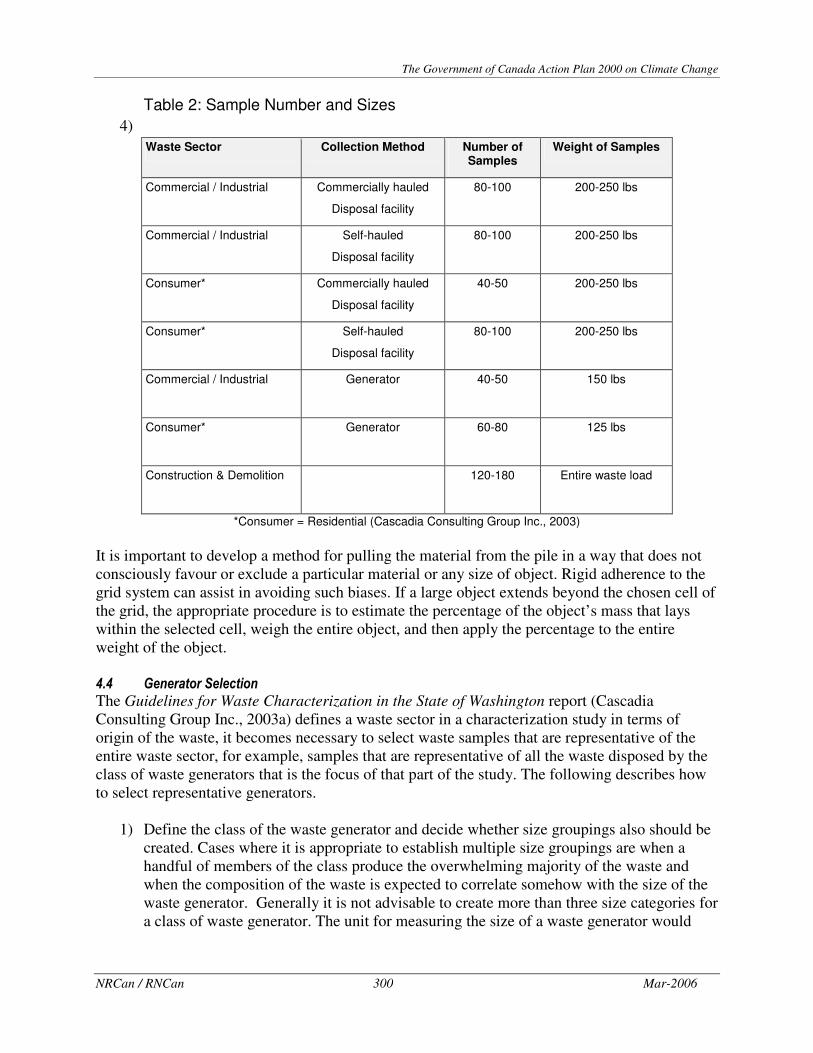
The Government of Canada Action Plan 2000 on Climate Change
NRCan / RNCan 300 Mar-2006
Table 2: Sample Number and Sizes 4)
Waste Sector Collection Method Number of Samples
Weight of Samples
Commercial / Industrial Commercially hauled
Disposal facility
80-100 200-250 lbs
Commercial / Industrial Self-hauled
Disposal facility
80-100 200-250 lbs
Consumer* Commercially hauled
Disposal facility
40-50 200-250 lbs
Consumer* Self-hauled
Disposal facility
80-100 200-250 lbs
Commercial / Industrial Generator
40-50 150 lbs
Consumer* Generator
60-80 125 lbs
Construction & Demolition
120-180 Entire waste load
*Consumer = Residential (Cascadia Consulting Group Inc., 2003) It is important to develop a method for pulling the material from the pile in a way that does not consciously favour or exclude a particular material or any size of object. Rigid adherence to the grid system can assist in avoiding such biases. If a large object extends beyond the chosen cell of the grid, the appropriate procedure is to estimate the percentage of the object’s mass that lays within the selected cell, weigh the entire object, and then apply the percentage to the entire weight of the object. <8<� ��������������������
The Guidelines for Waste Characterization in the State of Washington report (Cascadia Consulting Group Inc., 2003a) defines a waste sector in a characterization study in terms of origin of the waste, it becomes necessary to select waste samples that are representative of the entire waste sector, for example, samples that are representative of all the waste disposed by the class of waste generators that is the focus of that part of the study. The following describes how to select representative generators.
1) Define the class of the waste generator and decide whether size groupings also should be created. Cases where it is appropriate to establish multiple size groupings are when a handful of members of the class produce the overwhelming majority of the waste and when the composition of the waste is expected to correlate somehow with the size of the waste generator. Generally it is not advisable to create more than three size categories for a class of waste generator. The unit for measuring the size of a waste generator would
The Government of Canada Action Plan 2000 on Climate Change
NRCan / RNCan 301 Mar-2006
ideally be the number of tonnes of waste that each generator produces annually, but other units such as number of employees, number of students, or number of acres can be used.
2) Devise a method of random selection for choosing representative businesses, agencies, buildings, and homes that belong to the class of generator. Usually this is completed by establishing a comprehensive list of all members of the class. The list may be compiled by someone with local knowledge of the generator class, or it may be taken from an existing source such as the phone book or from various companies that are in the business of producing lists for marketing purposes (e.g., Dun and Bradstreet). Select members at random from the list and contact them to ensure that they meet the criteria for being included in the desired class and/or size group of generators.
<8>� ����������&���������������������
A process that can be followed to obtain samples from a randomly selected generator, as presented in the Guidelines for Waste Characterization in the State of Washington report (Cascadia Consulting Group Inc., 2003a), includes:
1) Identify and distinguish the waste streams produced by the generator. It is important to be cognizant of the waste sectors that are being considered in the larger waste characterization study. For instance, a selected generator produces waste that is sent to the landfill and some that is recycled, but the study focuses only on landfill waste, resulting in the data collected describing only the landfill waste. However, even when the destination sectors of waste are properly distinguished, it is still possible for the generator to have multiple waste streams within each waste destination sector.
2) When the waste streams have been identified for a given waste destination sector at a generator, each waste stream should be characterized separately. In cases where a waste stream consists of a pure material (e.g., dirt, food scraps), it usually is not necessary to characterize the waste stream by sorting an actual sample. Rather, it is sufficient to quantify the waste stream and note that it is composed entirely of one material. In cases where the waste stream is not homogenous, then hand-sorted or visual characterization methods should be applied to the waste sample.
3) If a sample is to be hand-sorted, then a method should be devised for selecting a sample at random from the available waste. If the waste is contained in a dumpster, then a vertical cross-section of waste weighing approximately 150 pounds should be extracted from the dumpster and placed in a container for transport to a location where it can be sorted. If there are multiple dumpsters, then one should be chosen at random to provide the sample. Note that multiple dumpsters may be an indication that there are actually multiple waste streams at the location. This possibility should be investigated before a waste sample is taken.
<8?� "��2����)������������ ���������������
Ultimately, how many samples should be collected depends on the level of confidence or reliability desired. The number of samples will depend upon how much the proportion of each material varies from sample to sample. The greater the variation, the more samples are required. Sampling required also depends on the fraction of a specific material contained in the sample - materials with similar variability that average 2% will tend to require more samples that those that average 20%. Therefore, to produce the desired reliability, the number of samples will vary

The Government of Canada Action Plan 2000 on Climate Change
NRCan / RNCan 302 Mar-2006
from one material to another (e.g., aluminum may require 45 samples while food waste may require 15). A simple way to estimate the number of samples required is to utilize the generic estimates from standard tables with varying confidence intervals (see Annex D). Typically, the confidence level is set at 80% or 90% (Cascadia Consulting Group Inc., 2003a). Additionally, statistical formulas can be utilized to create individual calculations. Statistical software packages like WasteSort and PROTOCOL (see Annex B) are also available to assist with determining the number of samples required. Once the number of samples has been determined it is important to ensure that the samples are randomly selected. This is essential in order to allow for a systematic and unbiased statistical analysis. Random sample selection can be facilitated through the use of a “random numbers table” (see Table 3). In order to use a random numbers table, it is necessary to know the number of trucks or samples required and the total number from which the trucks or samples are selected. Using this base information, the following method is incorporated:
1) Arbitrarily pick any number on the random numbers table. Use only the last digits of each number that are the same number of digits in the total number of trucks or samples. For instance, if the total number is 50 (2 digits), and the first number chosen from the table is 52759081, then use the last two digits of that number (e.g., 81).
2) Determine if the last digits of that number are less than or equal to the total number, but greater than zero. If so, record the last digits of the number equal to the number of the digits in the total number. Otherwise, proceed to the next number until one qualifies.
3) Follow this process again and determine if the last digits are less than or equal to the total number. If so, record that number. Repeat until you have written down the number of trucks or samples required.
4) Order the numbers on your page sequentially. Select the trucks or samples matching those numbers.
A simpler variant of this procedure is to only use the first and second step to determine the first random number for the set. Then divide the total number by the number of samples required, which will give the interval for every nth number, starting with the first random number selected.

The Government of Canada Action Plan 2000 on Climate Change
NRCan / RNCan 303 Mar-2006
Table 3: Random Numbers Table
(RecycleWorlds Consulting Corp., 1994)

The Government of Canada Action Plan 2000 on Climate Change
NRCan / RNCan 304 Mar-2006
5. Rural Waste Characterization After conducting significant research into the area of waste characterization methodologies, little information was found dedicated to rural areas. The following waste characterization studies were examined:
• 2000 Solid Waste Characterization Study - Alameda County, California (R.W. Beck, 2001)
• 2002 Oregon Solid Waste Characterization and Composition (Sky Valley Associates, 2004)
• California Statewide Waste Characterization Study (Cascadia Consulting Group Inc., 2004a)
• King County Waste Monitoring Program – 2002/2003 Comprehensive Waste Stream Characterization and Transfer Station Customer Surveys – Final Report (Cascadia Consulting Group Inc, 2004b)
• Iowa Solid Waste Characterization (R.W. Beck, 1998)
• Minnesota Statewide MSW Composition Study (R.W. Beck, 2000)
• Pennsylvania Statewide Waste Composition Study (R.W. Beck, 2003)
• Wisconsin Statewide Waste Characterization Study (Cascadia Consulting Group Inc., 2003b)
In most cases, a standard methodology for disposal facility and generator sampling utilized for municipalities, including physical sorting and visual surveying, is adapted to rural areas. >87� �����&�����#��������;������*��#��������
The most comprehensive report found on rural waste characterization is the Rural Waste Characterization Report (Cascadia Consulting Group Inc., and Green Solutions Inc., 2003) for the Washington State Department of Ecology. The general approach followed for the generator-based portion of the study included developing estimates for the quantity and composition of all solid waste produced by selected industries and types of agriculture that are typical to the study area. The basic steps involved in developing the estimates, as described in this report (Cascadia Consulting Group Inc., and Green Solutions Inc., 2003) incorporate the following:
1) Defining target industry groups, deciding how many waste samples or waste characterization “observations” to conduct to represent the waste disposed by each industry group, and how many samples to obtain from the study area.
2) Using a random selection and recruitment method to identify industrial and agricultural businesses to participate in the study.
3) Contacting and visiting the recruited businesses to conduct measurements of waste generation and to characterize each waste stream produced by each business.
4) Combining the composition and quantity data from each site to form a broader picture of all waste produced by each industrial/agricultural group.

The Government of Canada Action Plan 2000 on Climate Change
NRCan / RNCan 305 Mar-2006
5) “Scaling up” the quantity estimates for each industrial or agricultural group in the study area to reflect waste generated by that group state-wide.
Key principles included the following:
1) Representative businesses from each industrial and agricultural group were selected at random from available lists.
2) Study endeavored to classify and quantify all segments of the entire solid waste stream generated by each business, including solid waste that is taken to landfills, recycled, reused, or disposed of through other methods.
3) Study utilized a protocol for sampling and characterization through either hand-sorting, visual estimation of contents, or identification of pure streams, to each type of waste encountered at each business that participated in the study.
5.1.1 Selection and Recruiting of Businesses The Rural Waste Characterization Report (Cascadia Consulting Group Inc., and Green Solutions Inc., 2003) suggests that the following procedure be followed for recruiting businesses:
1) Obtain a list of businesses located in the study area. Utilize SIC codes to differentiate businesses into targets industry groups and input the businesses randomly into a database.
2) Make contact with randomly selected business. Explain the purpose of the study, and ask to speak to the person who is knowledgeable about the types and quantities of wastes the business generates. The name, phone number, and other contact information for the person that is best able to provide information should be recorded.
3) Gather industry group and size information. Confirm what the business does as its primary activity and that it fits with its assigned industry group. The number of employees at the work site is determined, or if the business is agricultural-based, how many acres or animals it manages is determined.
4) Arrange a visit. A site visit is requested to obtain waste quantity measurements and waste composition data.
5) Classify waste streams. Interviews are utilized to determine material generation at each site as by-products of the main business activity. Information that could quantify each type of waste is requested, or plans are made to conduct direct measurements during the scheduled visit. The nature and disposition of each waste stream is noted.
5.1.2 Site Visits As presented in the Rural Waste Characterization Report (Cascadia Consulting Group Inc., and Green Solutions Inc., 2003), site visits must be arranged with each business. Each visit can begin with an interview to verify information obtained previously and to discover whether any waste types had been overlooked during the initial conversation. Once this is completed, determining which waste can be sampled and sorted and which waste can be quantified and characterized by observation or examination of records is important. The way the waste is disposed may determine how it is sampled. Waste can be separated into three categories: landfilled, other disposal or beneficial use.
The Government of Canada Action Plan 2000 on Climate Change
NRCan / RNCan 306 Mar-2006
Landfilled Waste Landfilled waste is generally the easiest type to quantify. If the business self-hauls the waste, they typically know the number of trips they make to the landfill each week, month or year and they know approximately how much waste they haul each trip. If the waste is collected by a commercial hauler, the size of the dumpster and the frequency of the pick-up can be determined. If there is currently waste in the dumpster, that waste can be manually sorted and weighed, if possible. Otherwise, it cam be characterized visually. Finally, if there is no waste to be sampled at that time, a representative of the business can be interviewed to describe the type of waste generated. The annual amount of waste is determined based on the interview, and a composition profile from other similar sites can be applied to estimate the amount. Other Disposal In many cases, businesses use other disposal to handle infrequent wastes. Examples of other disposal include stockpiling, burning or burying waste. Stockpiled material, such as old tires can be easily measured. Beneficial Use The types and amounts of waste being used beneficially tend to be specific to the industry. For instance, field crops, orchards and vegetable industry groups typically have some sort of crop residues that can be returned to the field. In most cases one should be able to obtain a measurement of the amount of material being sent for beneficial use. For example, if a crop has been recently harvested, then a sample of the crop residue can be collected and weighed. If it is not possible to obtain an accurate measurement of the amount of waste disposed through beneficial use, then an estimate can be constructed based on information obtained in the interview with the business representative. For instance, a business may have records of the amount of waste used beneficially if the waste is transferred to another company for processing.
Generation Period Each sample is associated with a generation time period and the method to determine the generation time depends on the type of disposal. As described in the Rural Waste Characterization Report (Cascadia Consulting Group Inc., and Green Solutions Inc., 2003), for landfilled wastes, if they are commercially collected, the time since the last pick-up is used to estimate generation time, and the amount of waste observed in the waste container can be taken to be the amount of waste that accumulated during that generation period. For example, if waste is collected on Monday morning and the site is visited on Wednesday morning, the observed quantity is associated with two days of waste generation. This quantity can then be extrapolated to a year. For other landfilled samples, such as self-hauled waste, representatives of participating businesses are interviewed to determine the frequency with which they transport waste to the landfill. Other disposal may include stockpiled materials. For these samples, the business representative is asked to estimate the accumulation time associated with the material if the material accumulated at a regular rate for the whole time. For instance, a pile of tires might have taken two years to accumulate. This quantity would then be divided by two to calculate an annual

The Government of Canada Action Plan 2000 on Climate Change
NRCan / RNCan 307 Mar-2006
estimate. If the material did not accumulate at a steady rate, but, instead, was generated as the result of one event, the interviewer is asked how often this amount of waste was generated. For example, a pile of trees at an orchard can be estimated by the orchard representative to result from tree removals that occur once every ten years. For this reason, the measured quantity is divided by ten to obtain an annual estimate. Creating annual estimates for beneficially used waste requires a more varied approach than for landfilled or other disposal samples. For instance, for the industrial group field crops, a type of beneficially used waste common to all generators is crop residues. For crops that have been recently harvested, residues are measured by raking up remaining residues within a 625 square foot area. This quantity is first extrapolated to an acre, then to the total farm. The resulting quantity represents the quantity of crop residues associated with that crop for that farm. All businesses in the industry group livestock dispose of manure. If it is left in a field, it is considered to be stockpiling. When manure is collected for composting, this material is considered to be beneficially used. Similar to stockpiled materials, if the manure is gathered in one area for composting, the interviewer can ask the length of time it took for the livestock to generate that quantity of manure. This quantity can be scaled up to a year based on the estimated generation for that sample. Disposal facility samples can also be sorted utilizing the same procedure described in Sections 4.2 (Disposal Facility Load) and 4.3 (Disposal Facility Waste Sample) in this report annex. 6. Budgeting Waste Characterization Research Budgetary considerations are often a critical factor when determining waste characterization approaches. Generalizing costs for a waste characterization study can be very difficult as there are numerous types of waste characterization study options. A waste characterization study can range greatly in price, from $3,000 to $500,000, depending on its size and comprehensiveness. For instance, a disposal facility waste characterization involving 80 samples of residential waste, 120 samples of commercial waste, and 120 samples of self-haul waste might be expected to cost between $80,000 and $120,000 USD (Cascadia Consulting Group Inc., 2003a). A study of generator waste is relatively more expensive on a per-sample basis as site visits are required. Cost estimates for three types of waste characterization studies conducted by consultants are described below (Hulse, K., 2005). All cost estimates are in Canadian dollars and rely on the following assumptions:
• No training is necessary for members of the sorting crew • Tonnage data for each waste sector (e.g., single-family, multifamily, each type of IC&I)
is readily available

The Government of Canada Action Plan 2000 on Climate Change
NRCan / RNCan 308 Mar-2006
Scenario #1: One landfill (regardless of what size population it serves) Task Cost Residential Obtain and sort 60 residential waste samples (30 single-family, 30 multi-family) $25,500 Develop sampling plan, analyze data and prepare report $23,000
Subtotal $48,500 Industrial, Commercial and Institutional Obtain and sort 120 IC&I waste samples (random selection of incoming loads) $51,000 Develop sampling plan, analyze data and prepare report $23,000
Subtotal $74,000 Construction and Demolition Visually characterize 160 construction and demolition loads $6,000 Develop sampling plan, analyze data and prepare report $12,000
Subtotal $18,000
TOTAL $140,500
Scenario #2: Three landfills (findings at the municipality level) Task Cost Residential Obtain and sort 120 residential waste samples (60 single-family, 60 multi-family) $51,000 Develop sampling plan, analyze data and prepare report $29,000
Subtotal $80,000 Industrial, Commercial and Institutional Obtain and sort 240 IC&I waste samples (random selection of incoming loads) $102,000 Develop sampling plan, analyze data and prepare report $29,000
Subtotal $131,000 Construction and Demolition Visually characterize 320 construction and demolition loads $12,000 Develop sampling plan, analyze data and prepare report $14,500
Subtotal $26.500 TOTAL $237,500

The Government of Canada Action Plan 2000 on Climate Change
NRCan / RNCan 309 Mar-2006
Scenario #3: Three landfills (findings at the landfill level, a more detailed study than Scenario #2 that provides information sufficient to describe waste composition at the level of individual landfills) Task Cost Residential Obtain and sort 180 residential waste samples (90 single-family, 90 multi-family) $76,000 Develop sampling plan, analyze data and prepare report $35,000
Subtotal $111,000 Industrial, Commercial and Institutional Obtain and sort 360 IC&I waste samples (random selection of incoming loads) $152,500 Develop sampling plan, analyze data and prepare report $35,000
Subtotal $187,500 Construction and Demolition Visually characterize 480 construction and demolition loads $18,000 Develop sampling plan, analyze data and prepare report $17,000
Subtotal $35.000 TOTAL $333,500
Some of the factors to consider when budgeting for the cost of a waste characterization study include the following (RecycleWorlds Consulting Corp., 1994):
• Number of samples to be sorted • Who will perform each of the tasks and what are the local wage rates • The time it will take to make logistical arrangements, including coordination with the
study site, local haulers and personnel • Time to recruit crews • Cost of insurance if not covered by others • The cost, if any, of a location to tip and sort • The cost of renting or borrowing an end loader and operator to move loads tipped from
trucks selected for sampling • The cost of sorting equipment for the crews such as scale, gloves etc. • The time and cost to sort each sample • The cost of transporting supervisors and crews • The costs of longer sorting times if there is inclement weather, or rescheduling in the
event that weather conditions prevent the originally planned sort time • The time and cost of analyzing the data and preparing a report • A contingency for overruns
One way to minimize costs is to hire a consultant to assist with the waste characterization design, logistics and training. Internal staff can then be utilized to conduct the waste characterization study. If internal time and knowledge is available to analyze the data, keeping this in-house can also reduce costs. However, if internal expertise does not exist, consultants can also be used to complete the data analysis and develop a report, if required.

The Government of Canada Action Plan 2000 on Climate Change
NRCan / RNCan 310 Mar-2006
For municipalities, another way to minimize cost is to provide the sorting location and to utilize municipal employees and machinery to transport materials to and from the disposal site to the sorting location. 7. Existing Waste Composition Data Phase 2 of the project researched available Alberta waste characterization data for communities of various sizes, considering residential, IC&I and CRD sectors. Existing and planned studies, as well as supplemental data, are outlined in Annex E. As shown, the majority of data is focused in Calgary and Edmonton, with both cities having completed research into residential waste composition. In addition, Calgary has also conducted research into IC&I waste composition, with additional research planned, although they are the only municipality identified as having undertaken IC&I studies. Therefore, insight into waste composition in this sector remains minimal. The study conducted by the Calgary and Region Waste Reduction Partnership, as well as research planned by the City of Grande Prairie and Lesser Slave Lake Region may help to provide additional information on waste composition outside the two major cities. However, the nature of waste in small towns and rural communities remains a significant gap in waste composition research. Even expanding the scope of research outside Alberta did not assist in identifying comprehensive studies for non-urban areas.

The Government of Canada Action Plan 2000 on Climate Change
NRCan / RNCan 311 Mar-2006
8. Overall Waste Composition Results Waste composition data that was obtained was compiled to present overall estimates of various waste streams in Alberta. These results are represented in the figures below:
Figure 2: Alberta Construction and Demolition Waste4
Organics25%
Paper and Cardboard
33%
Other Waste10%
Plastics10%
Wood and Soil12%
Industrial Waste1%
Glass2%
Construction and Demolition
3%
Metal 4%
Figure 3: Large City IC&I Waste5
4 Audit - Calgary (Shepard, Ecco Waste Systems), Edmonton (Northlands Sand and Gravel), Grande Prairie (City of Grande Prairie), Lethbridge (Lethbridge Regional), Lundbreck (Crowsnest/Pincher Creek), Wainwright (Wainwright Regional) Alberta Construction, Renovation and Demolition (CRD) Waste Characterization Study CH2M Gore and Storrie Limited, December 2000
Concrete10%
Drywall13%
Metal6%
Other26%
Roofing 10%
Wood33%
Asphalt1% Brick/Stone 1%
Concrete10%
Drywall13%
Metal6%
Other26%
Roofing 10%
Wood33%
Asphalt1% Brick/Stone 1%

The Government of Canada Action Plan 2000 on Climate Change
NRCan / RNCan 312 Mar-2006
Food Waste
21%
Glass2%
HHW2%
Metal3%
Other Material11%
Paper22%
Plastics8%
Yard Waste31%
Figure 4: Large City Residential Waste6
Figure 5: Small Town / Village Waste7
5 City of Calgary IC&I/CRD Waste Composition Study - UMA Engineering Ltd. in association with EBA Engineering Consultants Ltd., January 2001 6 Source: Edmonton’s Residential Waste Composition, 2001 (pie chart) State of Environment Report – Waste Management, City of Edmonton http://www.edmonton.ca/Environment/WasteManagement/OfficeofEnv/WasteMan.pdf , City of Calgary 1999 Residential Waste Composition Study CH2M Gore & Storrie Limited and ENVIRORIS, Executive Summary hard copy from J. Leszkowicz (City of Calgary)
Construction & Demolition 14%
Glass 2%
Metal 4%
Mixed Residuals 6%
Other Organic 23%
Other Waste 3%
Paper 21%
Plastic 8%
Wood & Soil 19%
Construction & Demolition 14%
Glass 2%
Metal 4%
Mixed Residuals 6%
Other Organic 23%
Other Waste 3%
Paper 21%
Plastic 8%
Wood & Soil 19%

The Government of Canada Action Plan 2000 on Climate Change
NRCan / RNCan 313 Mar-2006
It is important to note that these results represent only the data that was successfully obtained during the research. Where this data is limited, as in the case of IC&I and small towns, the validity of the results when applied to the province as a whole cannot be verified. However, at the same time, these results provide a starting point on which to build as additional waste composition results become available. 9. Waste Modeling An interesting alternate approach to waste characterization was identified during this project. This approach involves using a modeling method to develop waste stream estimates. Waste modeling can provide a very useful tool in planning future waste management approaches, as well as defining highly variable waste streams such as IC&I and C&D. The IC&I waste stream is the most diverse waste stream generated in a City. Where the residential and C&D waste streams tend to have common individual sources, volumes and characteristics, the IC&I stream is representative of the businesses activity within the City. Because the IC&I waste stream is intimately related to the business mix it is not appropriate to take statistics from other cities and apply them directly. Each analysis must consider the unique nature of each jurisdiction’s businesses and use data about the business mix to generate appropriate information. Independent researchers, including EBA Engineering Consultants Ltd., have developed waste generation models which can provide information about the waste generation of municipalities. The IC&I portion of the EBA model works in the following manner: First, the model uses business statistics to characterize the business community, based on commercially available databases. The data used comprises:
• Company name and address, • NAICS code at the 6 digit level, and • Total Employees.
This data is entered in to the model and used to identify business location patterns and numbers and size of specific businesses. The model also contains the results of a large number of waste audits that have been collated from the literature and from audits conducted by several firms. All of these audits are related to business type (through NAICS) and number of employees: The business type, in general, determines the composition of the waste which may be expected: The number of employees is a measure of the size of a business, and determines the volume of waste which may be expected. Summed up, this provides a good first-order "snapshot" of the IC&I waste stream in the City. 7 Regional Solid Waste Management Study Calgary Region, EBA Engineering Consultants Ltd., February 2003, Hard copy from Town of Cochrane (Joanne Walroth)

The Government of Canada Action Plan 2000 on Climate Change
NRCan / RNCan 314 Mar-2006
Future IC&I waste volumes can be predicted through applying the model and weigh scale data, and by comparing this data to historical and projected City development and planning data. It is also possible to migrate the data into a GIS system, which can then provide information about concentrations of various businesses. By linking the data and the waste composition model to a georeferenced and coded street network, the business mix and correlating waste composition mix can be determined. This GIS database can provide a planning tool for management of the IC&I waste stream in the City. Businesses tend to group within Cities according to their business types (hotels, restaurants, light industry, etc) in certain planning zones. As such, the composition of IC&I waste may be expected to vary within various sectors of the City. With this planning tool, specific materials may be targeted within the various sectors and collection vehicle routing for recycling programs may be more appropriately planned according to the business mix. Based on the projected development and planning within the City, the composition of the IC&I waste stream for a specific area of the City or for the City as a whole can then be developed using the model. The MK IC&I Model is a similar planning tool which allows municipalities and provincial governments to carry out preliminary planning of IC&I diversion strategies, using best available waste composition information. The output of the model is customized to best reflect local circumstances and the local business mix, using employment by business sector as the indicator of the likely composition of the IC&I waste in a particular region. The input to the model has been constantly updated with most recently available IC&I waste composition data from waste audits and waste composition studies carried out by jurisdictions throughout North America since 1989 and before. The model was first developed in 1989 to estimate the composition of IC&I waste generated in the Province of Ontario as input to an econometric model which estimated the impacts of the 50% diversion objective on Ontario business. The first version of the model had 25 business categories and 10 waste stream categories. The GVRD (Greater Vancouver Regional District) used an updated version of the model in 1991 for planning the 50% diversion strategy for year 2000. The MK IC&I model identified the composition of IC&I waste generated in the Region. A separate study estimated the amount of IC&I waste diverted, therefore the combination of the two approaches estimated the composition of the IC&I waste disposed. The GVRD version of the model was expanded to estimate the amount of IC&I waste generated by material and business sector in 21 different area municipalities which formed the GVRD. The model was updated again in 1993 and 1994 to estimate the amount and composition of the waste generated by IC&I businesses in the Greater Toronto Area, in support of the Interim Waste Authority landfill sizing study. The model identified the materials and business sectors which

The Government of Canada Action Plan 2000 on Climate Change
NRCan / RNCan 315 Mar-2006
should be targeted for aggressive diversion efforts. It was subsequently used in waste planning studies for the City of Toronto and the Province of Manitoba, and most recently has been used in a study of private sector waste in the Province of Ontario for the Ontario Waste Management Association (December, 2004). The MK IC& I model uses the following inputs:
• Available waste composition studies by IC&I sector (constantly updated); • Employment data by IC&I sector or NAICS code for the jurisdiction being studied • Known amount of IC&I waste disposed (to re-calibrate the waste allocation) • The model uses local employment data and per capita waste generation rates to yield
estimates of waste generation quantities by IC&I sector. Waste composition data for each IC&I sector are then applied to estimate the composition of IC&I waste generated by different IC&I groups. The model currently summarizes the data as follows: - Waste generation (tonnes per year) for each major NAICS category. - Waste composition by IC&I sector. Composition data area provided for 13 material
categories; these can be collapsed or expanded into the categories requested by the client;
- Overall IC&I waste generation by material type. Tables 4 and 5 show examples of the MK IC&I Model output.
Table 4: Waste Generated By IC&I Sources in Ontario, 2002
Sector NAICS Code
IC&I Waste Gen
% of Total
Agriculture, forestry, fishing, hunting 11 75,000 1.1%
Mining, oil, gas extraction and utilities 21 25,000 0.4%
Manufacturing 31-33 1,730,000 26.5%
Wholesale Trade 41 560,000 8.6%
Retail Trade 44-45 950,000 14.6%
Transportation and warehousing 26,49 340,000 5.2%
Information and Cultural Industries 51 180,000 2.8%
Finance, Insurance, Real Estate, renting & leasing 30 150,000 2.3%
Professional, scientific, and technical services 54 200,000 3.1%
Admin & Support, Waste Management & Remediation Services 56 75,000 1.2%
Education Services 61 165,000 2.5%
Health Care and Social Assistance 62 690,000 10.6%
Arts, Entertainment & Recreation 71 130,000 2.0%
Accommodation and food services 72 890,000 13.7%
Other services (except public administration) 81 280,000 4.3%
Public Administration 91 80,000 1.3%
TOTAL 6,520,000 100.0%

The Government of Canada Action Plan 2000 on Climate Change
NRCan / RNCan 316 Mar-2006
Table 5: Ontario IC&I Waste Composition, 2002
Material Estimated Amount
Generated
Estimated Composition
Generated
OCC 990,000 15.1%
ONP 290,000 4.4%
Paper 1,655,000 25.4%
Glass 275,000 4.2%
Ferrous 470,000 7.2%
Non-ferrous 300,000 4.6%
HDPE 120,000 1.9%
PET 15,000 0.2%
Plastic 535,000 8.2%
Food 740,000 11.4%
Yard 105,000 1.6%
Wood 505,000 7.8%
Other 520,000 8.0%
Total 6,530,0008 100.0%
8 May not add because of rounding error

The Government of Canada Action Plan 2000 on Climate Change
NRCan / RNCan 317 Mar-2006
Table 6: Example of MK IC&I Model Output Estimated Unit Generation Rates and Waste Composition for Major NAICS Groups for Province of Ontario (2004)
Waste Composition 1 2 3 4 5 6 7 8 9 10 11 12 13 Major IC&I
Group OCC ONP Paper Glass Ferrous Non-Ferrous
HDPE PET Plastic Food Yard Wood Other Total
1 Primary (%)
(tonnes)
2 Manufacturing (%)
(tonnes)
4 Transportation/ (%)
Communication/ (tonnes)
Utilities
5 Trade: Wholesale (%)
(tonnes)
6 Trade: Retail (%)
(tonnes)
7 Financial, Insurance (%)
& Real Estate (tonnes)
8 Services: (%)
Non-Commercial (tonnes)
9 Services: (%)
Commercial (tonnes)
10 Public (%)
Administration (tonnes)
Total Waste (tonnes)
Composition (% total)

The Government of Canada Action Plan 2000 on Climate Change
NRCan / RNCan 318 Mar-2006
10. References Alberta Environment, 2005. Alberta Waste Composition (pie charts) http://www3.gov.ab.ca/env/waste/wastenot/less.html American Society for Testing and Materials (ASTM) International, 2003. Standard Test Method for Determination of the Composition of Unprocessed Municipal Solid Waste -D5231-92(2003). 6p. http://www.astm.org/cgi-bin/SoftCart.exe/STORE/filtrexx40.cgi?U+mystore+wefn3429+-L+WASTE:COMPOSITION+/usr6/htdocs/astm.org/DATABASE.CART/REDLINE_PAGES/D5231.htm California Integrated Waste Management Board Database by Jurisdiction http://www.ciwmb.ca.gov/wastechar/JurisSel.asp Cascadia Consulting Group, Inc., 2004a. California Statewide Waste Characterization Study. Prepared for the Integrated Waste Management Board. 124p. http://www.ciwmb.ca.gov/publications/LocalAsst/34004005.pdf Cascadia Consulting Group Inc., 2004b. King County Waste Monitoring Program – 2002/2003 Comprehensive Waste Stream Characterization and Transfer Station Customer Surveys – Final Report. Prepared for the King County Department of Natural Resources and Parks Solid Waste Division. 144p. http://www.metrokc.gov/dnrp/swd/about/waste_documents.asp Cascadia Consulting Group Inc., 2003a. Guidelines for Waste Characterization Studies in the State of Washington. Prepared for the Washington State Department of Ecology. 67p. Cascadia Consulting Group Inc., 2003b. Wisconsin Statewide Waste Characterization Study Final Report. Prepared for the Wisconsin Department of Natural Resources. 114p. http://www.dnr.state.wi.us/org/aw/wm/publications/recycle/wrws-finalrpt.pdf Cascadia Consulting Group Inc. and Green Solutions Inc., 2003. Rural Waste Characterization Report. Prepared for the Washington State Department of Ecology. 82p. Cascadia Consulting Group, Sky Valley Associates, Sheri Eiker-Wiles Associates, Pacific Waste Consulting Group, Veterans Assistance Network, E. Tseng and Associates, and E. Ashley Steel, 1999. California Statewide Waste Characterization Study – Results and Final Report. In cooperation with the California Integrated Waste Management Board. 192p. http://www.ciwmb.ca.gov/publications/LocalAsst/34000009.doc CH2M Gore and Storrie Limited, 2000. Alberta Construction, Renovation and Demolition (CRD) Waste Characterization Study. Prepared for Alberta Environment and the Construction, Renovation, and Demolition Waste Reduction Advisory Committee. 131p. http://www3.gov.ab.ca/env/waste/aow/crd/publications/CRD_Report_All.pdf CH2M Gore and Storrie Limited, 1999. City of Calgary 1999 Residential Waste Study. Prepared for the City of Calgary.

The Government of Canada Action Plan 2000 on Climate Change
NRCan / RNCan 319 Mar-2006
City of Edmonton, 2001. Edmonton’s Residential Waste Composition. State of Environment Report – Waste Management http://www.edmonton.ca/Environment/WasteManagement/OfficeofEnv/WasteMan.pdf DeWolfe, K., 2004. Waste Audit Study: at the Bonnybrook Waterwater Treatment Plant. Prepared for the City of Calgary. 26p. Downie, W. A., D. M. McCartney and J. A. Tamm, 1998. “A Case Study of an Institutional Solid Waste Environmental Management System.” Journal of Environmental Management. (1998) 53, pp 137-146. EBA Engineering Consultants Ltd., 2003. Regional Solid Waste Management Study Calgary Region. Prepared for the City of Calgary and the Calgary Regional Partnership. 52p. European Parliament and the European Union, 2002. Regulation (EC) No. 2150/2002 of the European Parliament and of the Council of the European Union – Waste Statistics. 45p. http://europa.eu.int/eur-lex/lex/LexUriServ/site/en/consleg/2002/R/02002R2150-20040416-en.pdf Gartner Lee Ltd., 2004. Aquatera Landfill Solid Waste Composition Study. Prepared for Aquatera Utilities Ltd. 33 p. Gartner Lee Ltd., 1991. British Columbia Procedural Manual for Municipal Solid Waste Composition Analysis. Prepared for the British Columbia Ministry of Environment, Lands and Parks. 58p. Gore and Storrie Limited, 1991. Procedures for the Assessment of Soils Waste Residential and Commercial, Volume III of the Ontario Waste Composition Study. Prepared for Ontario Environment. 248p. Head, M. and L. Wytrykush, 1999. Waste Audit – Robert H. Smith Elementary School. Prepared for the University of Manitoba. 74p. Hulse, K., 2005. E-mail Communication. Cascadia Consulting Group. March 10, 2005. McCartney, D.M., 2003. “Auditing Non-hazardous Wastes from Golf Course Operations: Moving From a Waste to a Sustainability Framework.” Resources Conservation and Recycling. 37 (2003), pp 283-300. RecycleWorlds Consulting Corp., 1994. Everything You Want to Know About Waste Sorts But Were Afraid to Ask. 133p. Tel: (608) 231-1100. Reinhart, Debra R. and Pamela McCauley-Bell, 1996. Methodology for Conducting Composition Study for Discarded Solid Waste. Prepared for the Florida Center for Solid and Hazardous Waste Management. 82p. http://www.floridacenter.org/publications/discarded_waste_composition_96-1.pdf

The Government of Canada Action Plan 2000 on Climate Change
NRCan / RNCan 320 Mar-2006
R.W. Beck, 2003. Pennsylvania Statewide Waste Composition Study Final Report. Prepared for the Pennsylvania Department of Environmental Protection. 176p. http://www.dep.state.pa.us/dep/deputate/airwaste/wm/recycle/waste_comp/study.htm R.W. Beck, 2001. 2000 Waste Characterization Study – Alameda County, California. Prepared for the Alameda County Waste Management Authority and Source Reduction Recycling Board. 98p. http://stopwaste.org/wcs2000.html R.W. Beck, 2000. Minnesota Statewide MSW Composition Study. Prepared for the Solid Waste Management Coordinating Board. 98p. http://www.moea.state.mn.us/publications/wastesort2000.pdf R.W. Beck, 1998. Iowa Solid Waste Characterization. Prepared for the Department of Natural Resources. 138p. http://www.iowadnr.com/waste/sw/files/charstudy.pdf SENES Consultants Limited, 1999. Recommended Waste Characterization Methodology for Direct Waste Analysis Studies in Canada. Prepared for Canadian Council of Ministers of the Environment Waste Characterization Sub-Committee. 58p. http://www.ccme.ca/assets/pdf/waste_e.pdf Sky Valley Associates, 2004. Oregon 2002 Solid Waste Characterization and Composition. Prepared for the State of Oregon Department of Environmental Quality. 102p. http://www.deq.state.or.us/wmc/solwaste/wcrep/ReportWC02Full.pdf Stewardship Ontario, 2005. Blue Box Waste Audit Program 2005: Multi-Family Audits. 27p. http://www.stewardshipontario.ca/wdocs/MultiResWasteAudits_RFQ.doc Stewardship Ontario, 2005. Guide for Single-Family Waste Audits. 14p. http://www.stewardshipontario.ca/pdf/eefund/waste_audit_guide2005_sf.pdf UMA Engineering Ltd. and EBA Engineering Consultants Ltd., 2001. City of Calgary IC&I/CRD Waste Composition Study. Prepared for the City of Calgary. Wastebase – European Waste and Waste Management Database http://waste.eionet.eu.int/waste/wastebase WasteCalc – Florida Waste Calculation Model Florida Department of Environmental Protection http://www.dep.state.fl.us/wastecalc/index.html

The Government of Canada Action Plan 2000 on Climate Change
NRCan / RNCan 321 Mar-2006
Annexes Annex A: Review of Existing Waste Characterization Protocols and Guidelines Annex B: Review of Existing Waste Characterization Protocols and Guidelines - Sampling
Options Annex C: Advantages and Disadvantages of Existing Waste Characterization Protocols and
Guidelines Annex D: Estimated Number of Samples to Achieve Different Confidence Intervals at 90%
Confidence Level Annex E: Existing Data Annex F: Guidelines for Waste Characterization Studies in the State of Washington Annex G: CCME Recommended Waste Characterization Methodology – Waste Categories

The Government of Canada Action Plan 2000 on Climate Change
NRCan / RNCan 322 Mar-2006
Annex A: Review of Existing Waste Characterization Protocols and Guidelines
����������� �� ��� � ��������� �� ��� �� �� � ��� � �� �
� �� � � �� � ���� � �� ��� �� � � � � � � � �� �� � � �� � � �� ������ � � � � � � � �� � � �� � � � � � � �� � � �� � ����� �
� ��� ����� � �� �� !� "�
# $ �� � � �%�� �� �� �� � �� � � �� � & �� ��� �� ���� � �
� ����� � ����� � � ��� � � � ��� � �
� � �� �� � � �� � �� � � ��' � � �� �
� � � � � � �
BC Environment Procedural Manual for Municipal Solid Waste Composition Analysis (1991)
- Divided into two, waste collected by waste collection vehicles and waste hauled in self-haul vehicles then divided by residential, commercial and institutional where appropriate - Does not cover industrial or biomedical waste
- Seven day surveys throughout the year to cover seasonal differences
- Random sampling, nth vehicle is selected so there is no bias to morning and afternoon or large and small loads
- Disposal facility
- Detailed equipment list - Safety equipment - Staff training and requirements
- Yes - 15 MC - 58 SC
- Input wet weight data and calculate percent composition - Using moisture content values convert wet weights into dry weights - Calculate percent composition by dry weight
- Weigh Scale Form - Sample Information - Large Objects: Weights and Descriptions - Waste Sorting
Canadian Council of Ministers of the Environment (CCME)
Recommended Waste Characterization Methodology (1999)
- Discusses general components of a study design and provides guidance for studies that can be developed based on simplified statistical design for industrial, commercial and institutional, and residential waste streams
- Minimum of two study periods; summer and late fall recommended
- Landfill, random sampling of trucks for each sector from a list of trucks or routes - Generator, selected from specifies categories
- Disposal facility - Generator
- Detailed equipment list from BC Environment (1991) - Health and safety procedure - Staff training
- Yes - 10 MC - 58 SC
- Sector and seasonal data summarized to provide measures of the average (mean) values and variability - Calculate annual mean from seasonal and sector averages
Ontario Ministry of the Environment
Procedures for the Assessment of Solid Waste Residential and Commercial, Volume III of the Ontario Waste Composition Study (1991)
- Outlines the procedures for conducting residential and commercial waste composition studies in Ontario municipalities - Includes waste and recyclables - Does not include bulky items
- Residential, study area selected by enumeration area 1 using an income/housing matrix; random household samples
- Generator - Detailed equipment list - Safety equipment - Staff training and requirements
- Yes - 14 MC - 47 SC
- Residential, estimation of waste component generation rate based on percent `composition and per capita waste generation rate - Commercial, estimate total commercial waste generation by adding together individual groups
- Waste Composition Data Collection Sheet
Stewardship Ontario
Blue Box Waste Audit Program 2005: Multi-Residential Audits (2005) DRAFT2
- Designed for municipalities that are planning to complete waste quantification and composition studies for multi-residential housing
-Four two-week (two consecutive weeks) long audits over a twelve month period; one per season
- Random multi-residential complexes - Work with planning or housing department
- Generator - Equipment list - Safety equipment
- Yes - 8 MC - 67 SC
-Material sorted, weighed, and net weight calculated
- Collection Log - Waste Sort Worksheet - Description of Audit and Notes
Stewardship Ontario
Guide for Single-Family Waste Audits (2005)
- Designed for municipalities that are planning to complete waste quantification and composition studies of single family residences
- Four two-week (two consecutive weeks) long audits over a twelve month period; one per season
- Work with planning or housing department to identify suitable sample areas and households
- Generator - Equipment list - Safety equipment
- Yes - 8 MC - 67 SC
- Material sorted, weighed, and net weight calculated
- Collection Log - Waste Sort Worksheet - Description of Audit and Notes - Waste Sort Results

The Government of Canada Action Plan 2000 on Climate Change
NRCan / RNCan 323 Mar-2006
����������� �� ��� � ��������� �� ��� �� �� � ��� � �� �
� �� � � �� � ���� � �� ��� �� � � � � � � � �� �� � � �� � � �� ������ � � � � � � � �� � � �� � � � � � � �� � � �� � ����� �
� ��� ����� � �� �� !� "�
# $ �� � � �%�� �� �� �� � �� � � �� � & �� ��� �� ���� � �
� ����� � ����� � � ��� � � � ��� � �
� � �� �� � � �� � �� � � ��' � � �� �
( � �� � �� �� � � �
American Society for Testing and Materials (ASTM)
Standard Test Method for Determination of the Composition of Unprocessed Municipal Solid Waste – 5231-92 (2003)
- Test method describes procedures for measuring composition of unprocessed municipal solid waste by employing manual sorting
- One week minimum - Consider seasonal variations
- Random vehicle sampling
- Disposal facility - Equipment list - Discusses hazards in general
- Yes - 13 MC - 14 SC
- Statistical analysis - Weight fraction of each component is calculated from the weight of the components - Mean waste composition is calculated using the results of the composition of each of the sorting samples
- Waste Composition Data Sheet
California Integrated Waste Management Board (CIWMB)
Disposal Characterization Studies (1996) California Code of Regulations, Title 14, Division 7, Chapter 3 - did not move past a draft regulation
- Designed to collect information on the disposed waste stream, not materials that have been diverted through recycling, composting or source reduction. - For residential, commercial and industrial sectors
- Landfill residential/nonresidential, minimum of two seasons - Generator residential, minimum of two seasons - Generator nonresidential and subpopulation3 with similar/different businesses, samples distributed suitably to reflect seasons
- Landfill, random sampling - Generator, stratification4 with “80/20 rule”5 if data for stratification is not available the random selection may be utilized
- Best-fit option - Generator - Disposal facility - Use of default data from the CIWMB’s waste characterization database - Combination of approaches
- Detailed health and safety guidelines
- Yes - 8 MC - 57 SC
- Landfill, calculated by adding each individual material type percentages and dividing by the number of samples for each sector - Generator, data for each generator is weighed based upon the importance of the generator within the sector (e.g., size, no. of employees). Data from each strata is then weighed according to the size of the strata
Florida Center for Solid and Hazardous Waste Management
Methodology for Conducting Composition Study for Discarded Solid Waste (1996)
- Designed for discarded solid waste for residential, institutional and some commercial and industrial sectors
- Minimum of four sampling per year; one for each season
- Random sampling
- Generator - Staff training - Health and safety plan
- Yes - 13 MC - 61 SC
- Mean and standard deviation of the waste categories are aggregated together by sample as a function of source resulting in a breakdown of the percentages of the waste composition
- Composition Survey Form - Waste Composition Data Sheet for Composite Items
RecycleWorld Consulting
Everything You Wanted to Know About Waste Sorts…But Were Afraid to Ask (1994)
- Designed for municipalities to assess industrial, commercial and institutional including construction and demolition, and residential sectors
- Conduct a minimum of two seasons (e.g., summer and winter)
- Random sampling - Use stratification
- Disposal facility - Generator
- Equipment list - Brief safety discussion
- Yes - 11 MC - 28 SC
- Statistical analysis (averages, confidence intervals, standard error) - WasteSort software package
- Study Design - Budget - Truck Selection - Sample Selection - Truck Log and Sample - Data Recording
Washington State Department of Ecology
Guidelines for Waste Characterization Studies in the State of Washington (2003)
- Designed for industrial, commercial, construction and demolition, and residential waste streams
- Conduct over multiple seasons
- Random sampling
- Disposal facility - Generator
- Equipment list - Health and safety plan
- No - 10 MC - 91 SC
- Calculate estimates of the composition and quantity of one or more segments of the waste stream
- Vehicle Survey - Recording Material Weights in a Sample

The Government of Canada Action Plan 2000 on Climate Change
NRCan / RNCan 324 Mar-2006
����������� �� ��� � ��������� �� ��� �� �� � ��� � �� �
� �� � � �� � ���� � �� ��� �� � � � � � � � �� �� � � �� � � �� ������ � � � � � � � �� � � �� � � � � � � �� � � �� � ����� �
� ��� ����� � �� �� !� "�
# $ �� � � �%�� �� �� �� � �� � � �� � & �� ��� �� ���� � �
� ����� � ����� � � ��� � � � ��� � �
� � �� �� � � �� � �� � � ��' � � �� �
# ��� � � �� �� � � ��� �
Regulation (EC) No. 2150/2002 of the European Parliament and of the Council of the European Union - Waste Statistics
European Parliament and the Council of the European Union (2002)
- To establish a framework for the production of European Community statistics on the generation, recovery and disposal of waste
- No - 48 MC - 700+ SC
MC = main categories; SC = sub categories 1Enumeration Area – Census data collected in municipalities using areas mapped out by Census Canada 2Blue Box Waste Audit Program 2005: Multi-Residential Audits methodology is in a draft format, Stewardship Ontario anticipates the audit methodology will be finalized in 2006
3Subpopulation – generators divided into groups of similar businesses or residences (e.g., retail trade food stores, apartments) 4 Stratification – process of dividing units into groupings such that the units in a grouping are similar in terms of a defined characteristic (e.g., strata, single-family and multi-family for residential studies, and Standard Industrial Classification groupings for industrial, commercial and institutional studies) 5 “80/20 rule” states that generally the larger generators that make up 20 percent of the entities (businesses or types of residences) to be sampled will generate 80 percent of the waste. The total number of generators to be sampled should be allocated so that 80 percent of the samples are randomly assigned to entities in the large generator group, and the remaining 20 percent of the samples are randomly assigned to the remaining entities that generate 20 percent of the waste.
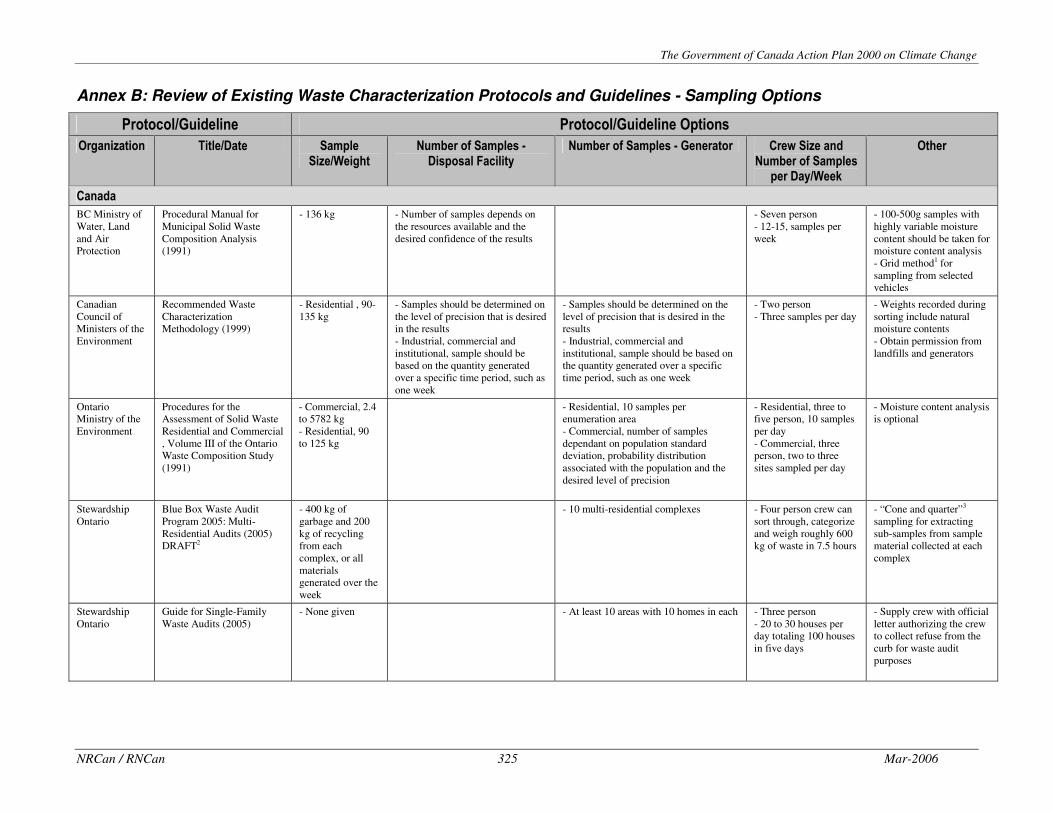
The Government of Canada Action Plan 2000 on Climate Change
NRCan / RNCan 325 Mar-2006
Annex B: Review of Existing Waste Characterization Protocols and Guidelines - Sampling Options
��������� �� ��� � ��������� �� ��� �� � ���� � �
� �� � � �� � ���� � � ��� �� � � � � � � � � �� �� �� �� � ��
) � * ���&�� � � � � � �+�� �� � �� � ��, � ������ �
) � * ���&�� � � � � � �+� � �� ���� � � - �� �� �� � � �) � * ���&�� � � � � � �
� ��� � � �� ' �
� �� ��
� � � � � � BC Ministry of Water, Land and Air Protection
Procedural Manual for Municipal Solid Waste Composition Analysis (1991)
- 136 kg - Number of samples depends on the resources available and the desired confidence of the results
- Seven person - 12-15, samples per week
- 100-500g samples with highly variable moisture content should be taken for moisture content analysis - Grid method1 for sampling from selected vehicles
Canadian Council of Ministers of the Environment
Recommended Waste Characterization Methodology (1999)
- Residential , 90-135 kg
- Samples should be determined on the level of precision that is desired in the results - Industrial, commercial and institutional, sample should be based on the quantity generated over a specific time period, such as one week
- Samples should be determined on the level of precision that is desired in the results - Industrial, commercial and institutional, sample should be based on the quantity generated over a specific time period, such as one week
- Two person - Three samples per day
- Weights recorded during sorting include natural moisture contents - Obtain permission from landfills and generators
Ontario Ministry of the Environment
Procedures for the Assessment of Solid Waste Residential and Commercial , Volume III of the Ontario Waste Composition Study (1991)
- Commercial, 2.4 to 5782 kg - Residential, 90 to 125 kg
- Residential, 10 samples per enumeration area - Commercial, number of samples dependant on population standard deviation, probability distribution associated with the population and the desired level of precision
- Residential, three to five person, 10 samples per day - Commercial, three person, two to three sites sampled per day
- Moisture content analysis is optional
Stewardship Ontario
Blue Box Waste Audit Program 2005: Multi-Residential Audits (2005) DRAFT2
- 400 kg of garbage and 200 kg of recycling from each complex, or all materials generated over the week
- 10 multi-residential complexes - Four person crew can sort through, categorize and weigh roughly 600 kg of waste in 7.5 hours
- “Cone and quarter”3 sampling for extracting sub-samples from sample material collected at each complex
Stewardship Ontario
Guide for Single-Family Waste Audits (2005)
- None given - At least 10 areas with 10 homes in each - Three person - 20 to 30 houses per day totaling 100 houses in five days
- Supply crew with official letter authorizing the crew to collect refuse from the curb for waste audit purposes

The Government of Canada Action Plan 2000 on Climate Change
NRCan / RNCan 326 Mar-2006
��������� �� ��� ��������� �� ��� �� � ���� �
� �� � � �� � ���� � ��� �� � � � � � � � �� �� �� �� � �
) � * ���&�� � � � � � �+�� �� � �� � ��, � ������
) � * ���&�� � � � � � �+� � �� ��� � � - �� �� �� � � �) � * ���&�� � � � � � �
� ��� � � �� '
� �� �
( � �� � �� �� � �
American Society for Testing and Materials (ASTM)
Standard Test Method for Determination of the Composition of Unprocessed Municipal Solid Waste –D5231-92 (2003)
- Disposal facility, 200-300 lb
- Number of samples to be sorted determined by investigators based on waste components to be sorted and the desired precision to each component
- A precision and bias statement cannot be made for this test method at this time
California Integrated Waste Management Board (CIWMB)
Uniform Waste Disposal Characterization Method (1996)
- Generator, 125 lb, 1.5 CY or whole sample - Landfill, 200 lb
- Residential, 30 samples per year - Nonresidential, 40 samples per year
- Residential, 40 samples per year - Nonresidential, 50 samples per year - Subpopulation4 with similar businesses, 25 samples per year - Subpopulation with different businesses, 40 samples per year
Florida Center for Solid and Hazardous Waste Management
Methodology for Conducting Composition Study for Discarded Solid Waste (1996)
- 250-300 lb - Number of samples taken per generator should be proportional to the portion the waste generator represents (e.g., area, population) - Use PROTOCOL5 to determine the number of samples required from each strata
- Seven person
RecycleWorld Consulting
Everything You Wanted to Know About Waste Sorts…But Were Afraid to Ask (1994)
- 200-300 lb - Determined by municipality based on desired level of reliability - Generic estimates from standard tables - Formula and techniques for doing own calculations
- Determined by municipality based on desired level of reliability - Generic estimates from standard tables - Formula and techniques for doing own calculations6
- Four to six person - One 200-300 lb sample into 20 materials of the size typically found in municipal solids waste with 4 sorters and a crew leader: 30 – 60 minutes
- WasteSort4
Washington State Department of Ecology
Guidelines for Waste Characterization Studies in the State of Washington (2003)
- Commercial/ industrial, 150 to 250 lbs - Construction and demolition, entire waste load - Residential, 125 to 250 lbs
- Commercial/industrial, 80-100 samples - Construction and demolition, 120-180 samples - Residential, 40-100 samples
- Commercial/industrial, 40-50 samples - Construction and demolition, 120-180 samples - Residential, 60-80 samples
- Untrained crew, 8-10 samples by hand per day
- Trained crew, up to 15 samples per day
-If visual characterization is used, 1 person can view 25-30 loads per day
- ASTM7 has developed a method for predicting in composition estimates in a waste characterization study that involves a given number of samples
1Grid method – grid locations are selected using a random number table
2Blue Box Waste Audit Program 2005: Multi-Residential Audits methodology is in a draft format, Stewardship Ontario anticipates the audit methodology will be finalized in 2006
3”Cone and quarter” – 1) Sample unloaded from complex onto the tip floor at the waste management facility; 2) Bulky items are separated from the load, categorized and weighed; 3) Remaining material is mixed by mechanical shovel, or by hand using rakes or shovels, into a uniform, homogeneous pile approximately 0.8 m high; 4) Pile is divided into two by a straight line through the centre of the pile; 5) Pile is further divided by a second line roughly perpendicular to the first; 6) Either pair of opposite quarters is removed, leaving half the original sample; 7) Steps 3 through 5 are repeated until the required amount of sample material remains

The Government of Canada Action Plan 2000 on Climate Change
NRCan / RNCan 327 Mar-2006
4Subpopulation – generators made into groups of similar businesses or residences (e.g., retail trade food stores, apartments) 5 PROTOCOL – a computerized technique to aid in selection of the number of samples required for a waste composition study (National Technical Information Service, 1-800-553-6847. Order #PB91-201699, $130USD) 6 WasteSort statistical software package ($395USD, RecycleWorld Consulting, 1-800-449-1010) 7American Society for Testing and Materials, “Standard Test Method for Determination of the Composition of Unprocessed Municipal Solid Waste D5231-92(2003)”, www.astm.org, $33USD

The Government of Canada Action Plan 2000 on Climate Change
NRCan / RNCan 328 Mar-2006
Annex C: Advantages and Disadvantages of Existing Waste Characterization Protocols and Guidelines
��������� �� ��� �
� �� � � �� � ���� � � ��� �� � � �� � � �
� � . � � �� � � � � �� � � . � � �� � � �
� � � � � � BC Environment Procedural Manual for Municipal
Solid Waste Composition Analysis (1991)
- Detailed waste category list - Does not cover industrial and construction and demolition sectors specifically - Does not include generator sampling
Canadian Council of Ministers of the Environment
Recommended Waste Characterization Methodology (1999)
- Selected “best” components from BC Environment, Ontario Ministry of the Environment and the California Integrated Waste Management Board protocols/guidelines to create a waste characterization methodology - Disposal facility and generator based sampling - Detailed waste category list
- Does not look at construction and demolition sector specifically - Other protocols/guidelines give more details on the waste sampling methodology - No worksheets
Ontario Ministry of the Environment
Procedures for the Assessment of Solid Waste Residential and Commercial , Volume III of the Ontario Waste Composition Study (1991)
- Discusses residential apartment building waste sample collection - Good detail on sampling strategy
- Does not include construction and demolition sector specifically - Does not include disposal facility sampling
Stewardship Ontario Blue Box Waste Audit Program 2005: Multi-Residential Audits (2005) DRAFT1
- Detailed waste category list - Detailed information on sample weight requirements
- Does not include disposal facility sampling - Only looks at residential sector
Stewardship Ontario Guide for Single-Family Waste Audits (2005)
- Detailed waste category list - Easy to read, straight forward easy-to-follow audit procedures
- Does not include disposal facility sampling - Only looks at residential sector
( � �� � �� �� � � �
American Society for Testing and Materials (ASTM)
Standard Test Method for Determination of the Composition of Unprocessed Municipal Solid Waste – D5231-92 (2003)
- International organization for voluntary standards
- Does not include generator sampling - Not give as detailed information on sampling like other protocols/guidelines - Not as easy to read for audience, more technical
California Integrated Waste Management Board (CIWMB)
Disposal Characterization Studies (1996) Protocol California Code of Regulations, Title 14, Division 7, Chapter 3 - did not move past a draft regulation
- For commercial, industrial and residential sectors - Generator and disposal facility based sampling - Several options for data collection options - Detailed waste category list
- Legal context - No worksheets
Florida Center for Solid and Hazardous Waste Management
Methodology for Conducting Composition Study for Discarded Solid Waste (1996)
- Detailed waste category list - Standard generator categories can include single-family and multi-family residential (urban and rural)
- Does not include disposal facility sampling - Does not include construction and demolition sector specifically
RecycleWorld Consulting
Everything You Wanted to Know About Waste Sorts…But Were Afraid to Ask (1994)
- Covers C&D, IC&I and residential waste streams - Generator and disposal facility based sampling - Detailed sampling selection and procedure
- Perhaps too detailed for smaller studies

The Government of Canada Action Plan 2000 on Climate Change
NRCan / RNCan 329 Mar-2006
��������� �� ��� �
� �� � � �� � ���� � � ��� �� � � �� � � �
� � . � � �� � � � � �� � � . � � �� � � �
Washington State Department of Ecology
Guidelines for Waste Characterization Studies in the State of Washington (2003)
- Covers C&D, IC&I and residential waste streams - Disposal facility and generator based sampling - Good detail on sampling strategy - Detailed waste category list - Utilizes ASTM International statistical method for predicting the number of samples required to yield desired precision
- Perhaps too detailed for smaller studies
# ��� � � �� �� � � ��� �
Regulation (EC) No. 2150/2002 of the European Parliament and of the Council of the European Union - Waste Statistics
European Parliament and the Council of the European Union (2002)
- Extremely detailed waste category list - No other information regarding waste characterization surveys
1Blue Box Waste Audit Program 2005: Multi-Residential Audits methodology is in a draft format, Stewardship Ontario anticipates the audit methodology will be finalized in 2006

The Government of Canada Action Plan 2000 on Climate Change
NRCan / RNCan 330 Mar-2006
Annex D: Estimated Number of Samples to Achieve Different Confidence Intervals at 90% Confidence Level
(RecycleWorlds Consulting Corp., 1994)

The Government of Canada Action Plan 2000 on Climate Change
NRCan / RNCan 331 Mar-2006
Annex E: Existing Data Existing Alberta Waste Characterization Data
� � � � �� ����� � �� � � �� � ���� � � �� � � � � ����/ ��� � � �� � �����/ ��� , � � ����/ ���
Alberta Environment Alberta Construction, Renovation and Demolition (CRD) Waste Characterization Study1 (December 2000)
Aquatera Utilities Inc. Aquatera Landfill Solid Waste Composition (2004)
Calgary & Region Waste Reduction Partnership
Regional Solid Waste Management Study2 (2003)
Construction and Demolition
City of Calgary IC&I/CRD Waste Study (2000)
IC&I/CRD Waste Study (anticipated completion, December 2005)
Aquatera Utilities Inc. Aquatera Landfill Solid Waste Composition (2004)
Calgary & Region Waste Reduction Partnership
Regional Solid Waste Management Study2 (2003)
City of Calgary Bonnybrook Wastewater Treatment Plant Waste Audit (2004)
Industrial, Commercial and Institutional
City of Calgary IC&I/CRD Waste Study (2000)
IC&I/CRD Waste Study (anticipated completion, December 2005)
Aquatera Utilities Inc. Aquatera Landfill Solid Waste Composition (2004)
Calgary & Region Waste Reduction Partnership
Regional Solid Waste Management Study2 (2003)
City of Calgary Residential Waste Study (1999) Residential Waste Study (anticipated completion, Spring 2005)
City of Edmonton Edmonton’s Residential Waste Composition (2001)
Residential
Calgary & Region Waste Reduction Partnership
Regional Solid Waste Management Study2 (2003)
Alberta Environment Alberta Waste Composition by Sector Alberta Waste Composition by Material
City of Grande Prairie Waste Composition Study (anticipated completion Spring 2005)
Waste Composition (Overall)
Lesser Slave Lake Regional Management Facility
Waste Composition Study (anticipated completion April 2005)
1Alberta Construction, Renovation and Demolition (CRD) Waste Characterization Study site audits include Calgary, Edmonton, Grande Prairie, Lethbridge, Lundbreck and Wainwright; survey participants include 39 rural and 13 urban sites 2Regional Solid Waste Management Study participants include County/Municipal Districts (Kananaskis County, Kneehill County, MD Bighorn, MD of Rocky View, Mountain View County, and Wheatland County) and Cities/Towns/Villages/Hamlets (Acme, Airdrie, Banff, Beiseker, Black Diamond, Calgary, Canmore, Carbon, Carstairs, Cochrane, Cremona, Crossfield, Didsbury, Drumheller, Gleichen, High River, Irricana, Linden, Morrin, Nanton, Okotoks, Olds, Redwood Meadows, Rockyford, Strathmore, Sundre, Three Hill, Trochu, and Turner Valley)

The Government of Canada Action Plan 2000 on Climate Change
NRCan / RNCan 332 Mar-2006
Other Waste Characterization Data
� � � � �� ����� � �� � � �� � ���� � � �� � � � � ����/ ��� � � �� � �����/ ��� , � � ����/ ���
Recycling & Environmental Action Planning Society (Prince George, BC)
Conducted 108 waste audits with IC&I businesses (anticipated completion April 2005)
University of Alberta
Auditing Non-hazardous Wastes from Golf Course Operations (2002) Institutional Solid Waste Environmental Management System (1998)
Large Education Institution (anticipated completion May 2005)
Industrial, Commercial and Institutional
University of Manitoba Waste Audit Report: Robert H. Smith Elementary School (1999)
City of Winnipeg Waste Composition Study (2000) Waste Composition (Overall)
City of Yellowknife Waste Audit (anticipated completion December 2005)

The Government of Canada Action Plan 2000 on Climate Change
NRCan / RNCan Mar-2006 333
Annex F: Guidelines for Waste Characterization Studies in the State of Washington
State of Washington Waste Characterization Protocol.pdf WA Rural_Report.pdf WA Rural_Appendices.pdf Annex F can be found at the Recycling Council of Alberta’s web site. It is very large (about 200 pages) and is in English only.
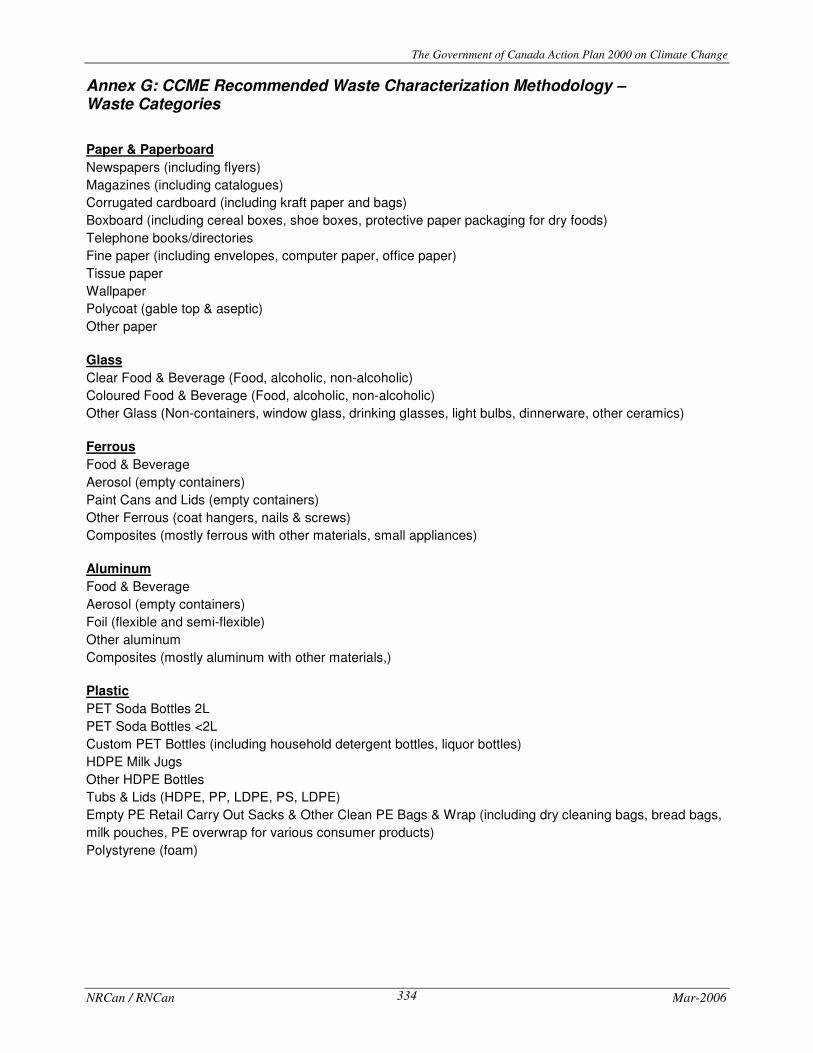
The Government of Canada Action Plan 2000 on Climate Change
NRCan / RNCan Mar-2006 334
Annex G: CCME Recommended Waste Characterization Methodology – Waste Categories
Paper & Paperboard Newspapers (including flyers) Magazines (including catalogues) Corrugated cardboard (including kraft paper and bags) Boxboard (including cereal boxes, shoe boxes, protective paper packaging for dry foods) Telephone books/directories Fine paper (including envelopes, computer paper, office paper) Tissue paper Wallpaper Polycoat (gable top & aseptic) Other paper
Glass Clear Food & Beverage (Food, alcoholic, non-alcoholic) Coloured Food & Beverage (Food, alcoholic, non-alcoholic) Other Glass (Non-containers, window glass, drinking glasses, light bulbs, dinnerware, other ceramics)
Ferrous Food & Beverage Aerosol (empty containers) Paint Cans and Lids (empty containers) Other Ferrous (coat hangers, nails & screws) Composites (mostly ferrous with other materials, small appliances)
Aluminum Food & Beverage Aerosol (empty containers) Foil (flexible and semi-flexible) Other aluminum Composites (mostly aluminum with other materials,)
Plastic PET Soda Bottles 2L PET Soda Bottles <2L Custom PET Bottles (including household detergent bottles, liquor bottles) HDPE Milk Jugs Other HDPE Bottles Tubs & Lids (HDPE, PP, LDPE, PS, LDPE) Empty PE Retail Carry Out Sacks & Other Clean PE Bags & Wrap (including dry cleaning bags, bread bags, milk pouches, PE overwrap for various consumer products) Polystyrene (foam)

The Government of Canada Action Plan 2000 on Climate Change
NRCan / RNCan Mar-2006 335
Appendix E – Composition of CR&D Waste within the Regional Municipality of Ottawa
(Three 1998 seasonal sorts combined, winter, spring and summer)
Material type Demolition New Construction Renovation
Total (normalized
average) Building materials
Insulation
Drywall
Ferrous
Fibre
Glass
Nonferrous
Organics
Plastics
Rubble & aggregates
Wood
Appliance/tires
Textiles
Other
2.5%
*12.9%
0.5%
1.8%
0.2%
0.0%
0.1%
3.3%
0.2%
14.5%
21.9%
0.1%
1.3%
40.7%
3.1%
1.2%
16.2%
1.2%
3.2%
0.0%
0.1%
**16.5%
1.2%
11.2%
22.3%
0.3%
1.0%
22.5%
23.6%
1.9%
28.2%
5.8%
1.1%
0.0%
0.3%
0.3%
0.9%
2.6%
12.6%
0.4%
3.6%
18.7%
9.7%
5.3%
15.0%
2.9%
1.5%
0.0%
0.2%
6.7%
0.8%
9.4%
18.9%
0.3%
2.0%
27.3%
Total
100.0% 100.0% 100.0% 100.0%
Kg sorted
74,377 52,376 59,140 185,892
* More than 98% of insulation waste for demolition projects was from one sample load. ** More than 94% of organic waste for new construction projects was from one sample load, which
consisted of straw used for winter construction. Source: Castonguay Technologies Inc., 1998, Construction and Demolition Waste Composition Study, Regional Municipality of Ottawa-Carleton, Table 7, p. ii

The Government of Canada Action Plan 2000 on Climate Change
NRCan / RNCan Mar-2006 336
Appendix F – GHG Calculations for Zinc and Lead ZINC
1 (giga joule) GJ = 277.8 kWh (kilowatt hours)Indirect emissions from electricity in Ontario = 0.00018 * t eCO2/kWh
277.8 kWh (kilowatt hours)X 0.00018 t eCO2/kWh = 0.05 t eCO2/GJ
Energy requirements for Primary and Secondary Zinc Production**
primary 61.00 GJ/tonne X 0.05 t eCO2/GJ = 3.05 t eCO2/tNo. 1 scrap 0.28 GJ/tonne X 0.05 t eCO2/GJ = 0.01 t eCO2/tNo. 2 scrap 4.65 GJ/tonne X 0.05 t eCO2/GJ = 0.23 t eCO2/tNo. 3 scrap 2.44 GJ/tonne X 0.05 t eCO2/GJ = 0.12 t eCO2/tNo. 4 scrap 27.90 GJ/tonne X 0.05 t eCO2/GJ = 1.40 t eCO2/tNo. 5 scrap 22.91 GJ/tonne X 0.05 t eCO2/GJ = 1.15 t eCO2/tNo. 6 scrap 3.00 GJ/tonne X 0.05 t eCO2/GJ = 0.15 t eCO2/tNo. 7 scrap 3.79 GJ/tonne X 0.05 t eCO2/GJ = 0.19 t eCO2/t
To calculate the emissions benefit of recycled feedstock over primary, subtract the former fromthe latter.
primary scrap difference3.05 t eCO2/t - 0.01 t eCO2/t = 3.04 t eCO2/t3.05 t eCO2/t - 0.23 t eCO2/t = 2.82 t eCO2/t3.05 t eCO2/t - 0.12 t eCO2/t = 2.93 t eCO2/t3.05 t eCO2/t - 1.40 t eCO2/t = 1.65 t eCO2/t3.05 t eCO2/t - 1.15 t eCO2/t = 1.90 t eCO2/t3.05 t eCO2/t - 0.15 t eCO2/t = 2.90 t eCO2/t3.05 t eCO2/t - 0.19 t eCO2/t = 2.86 t eCO2/t
Need to account for "loss rates" as calculated by ICF for aluminum (84%) and ferrous (79%).***Assume that the average of these (82%) is the loss rate for Zinc. This means that every tonneof recycled zinc displaces 0.82 tonnes of virgin input.
difference loss rate3.04 t eCO2/t X 82% = 2.49 t eCO2/t2.82 t eCO2/t X 82% = 2.31 t eCO2/t2.93 t eCO2/t X 82% = 2.4 t eCO2/t1.65 t eCO2/t X 82% = 1.35 t eCO2/t1.90 t eCO2/t X 82% = 1.56 t eCO2/t2.90 t eCO2/t X 82% = 2.38 t eCO2/t2.86 t eCO2/t X 82% = 2.35 t eCO2/t
average = 2.12 t eCO2/t
On average, the GHG emissions difference between using one tonne of primary and one tonne ofsecondary zinc feedstock is estimated to be 2.12 tonnes equivalent carbon dioxide.
Sources: * Canadian Electricity Association. 1997 Ontario emission averages** Michael Henstock, "The Recycling of Non-Ferrous Metals", ICME, 1996, Table 7.3, p. 201*** ICF Consulting, GHG spreadsheet model, sheet "Loss rates"

The Government of Canada Action Plan 2000 on Climate Change
NRCan / RNCan Mar-2006 337
LEAD
1 (giga joule) GJ = 277.8 kWh (kilowatt hours)Indirect emissions from electricity in Ontario = 0.00018 * t eCO2/kWh
277.8 kWh (kilowatt hours)X 0.00018 t eCO2/kWh = 0.05 t eCO2/GJ
Energy requirements for Primary and Secondary Lead Production**
primary 39 GJ/tonne X 0.05 t eCO2/GJ = 1.95 t eCO2/tNo. 1 scrap 11.22 GJ/tonne X 0.05 t eCO2/GJ = 0.56 t eCO2/tNo. 2 scrap 9.36 GJ/tonne X 0.05 t eCO2/GJ = 0.47 t eCO2/tNo. 3 scrap 11.17 GJ/tonne X 0.05 t eCO2/GJ = 0.56 t eCO2/tNo. 4 scrap 0.71 GJ/tonne X 0.05 t eCO2/GJ = 0.04 t eCO2/t
To calculate the emissions benefit of recycled feedstock over primary, subtract the former fromthe latter.
primary scrap difference1.95 t eCO2/t - 0.56 t eCO2/t = 1.39 t eCO2/t1.95 t eCO2/t - 0.47 t eCO2/t = 1.48 t eCO2/t1.95 t eCO2/t - 0.56 t eCO2/t = 1.39 t eCO2/t1.95 t eCO2/t - 0.04 t eCO2/t = 1.91 t eCO2/t
Need to account for "loss rates" as calculated by ICF for aluminum (84%) and ferrous (79%).***Assume that the average of these (82%) is the loss rate for lead. This means that every tonneof recycled lead displaces 0.82 tonnes of virgin input.
difference loss rate1.39 t eCO2/t X 82% = 1.14 t eCO2/t1.48 t eCO2/t X 82% = 1.21 t eCO2/t1.39 t eCO2/t X 82% = 1.14 t eCO2/t1.91 t eCO2/t X 82% = 1.57 t eCO2/t
average = 1.27 t eCO2/t
On average, the GHG emissions difference between using one tonne of primary and one tonneof secondary lead feedstock is estimated to be 1.27 tonnes equivalent carbon dioxide.
Sources: * Canadian Electricity Association. 1997 Ontario emission averages** Michael Henstock, "The Recycling of Non-Ferrous Metals", ICME, 1996, Table 6.13, p. 172*** ICF Consulting, GHG spreadsheet model, sheet "Loss rates"