An Analysis of Public Water and Sewer Providers … and...An Analysis of Public Water and Sewer...
52
An Analysis of Public Water and Sewer Providers Rates and Practices
Transcript of An Analysis of Public Water and Sewer Providers … and...An Analysis of Public Water and Sewer...
An Analysis of Public Water and Sewer Providers Rates and Practices
An Analysis of Public Water and Sewer Providers Rates and Practices
September 2008
Prepared by:
Mark Bondo
Research Associate
The authors wish to acknowledge the following parties for contributing information and
assistance for this analysis:
Anna Berger, IPSPR Senior Research Associate Bill Tomes, IPSPR Senior Research Associate
Megan Mann, IPSPR Research Assistant Patricia Comp, South Carolina Budget and Control Board
Jeff Hughes, Environmental Finance Center, University of North Carolina Stacey Berahzer, Environmental Finance Center, University of North Carolina
ii
Table of Contents
Preface.................................................................................................................................1
Introduction..........................................................................................................................1
Basic Survey Information and Methodology........................................................................2
General Utility Information.................................................................................................2
Billing...................................................................................................................................7
Utility Rates and Fees..........................................................................................................9
Low-Income Assistance......................................................................................................23
High-Strength Discharges.................................................................................................24
Fees for Fire Protection.....................................................................................................25
Infrastructure Status .........................................................................................................27
Conservation......................................................................................................................28
Conclusion.........................................................................................................................31
Appendix A: Survey Instrument
Appendix B: Selected Water Fee Information
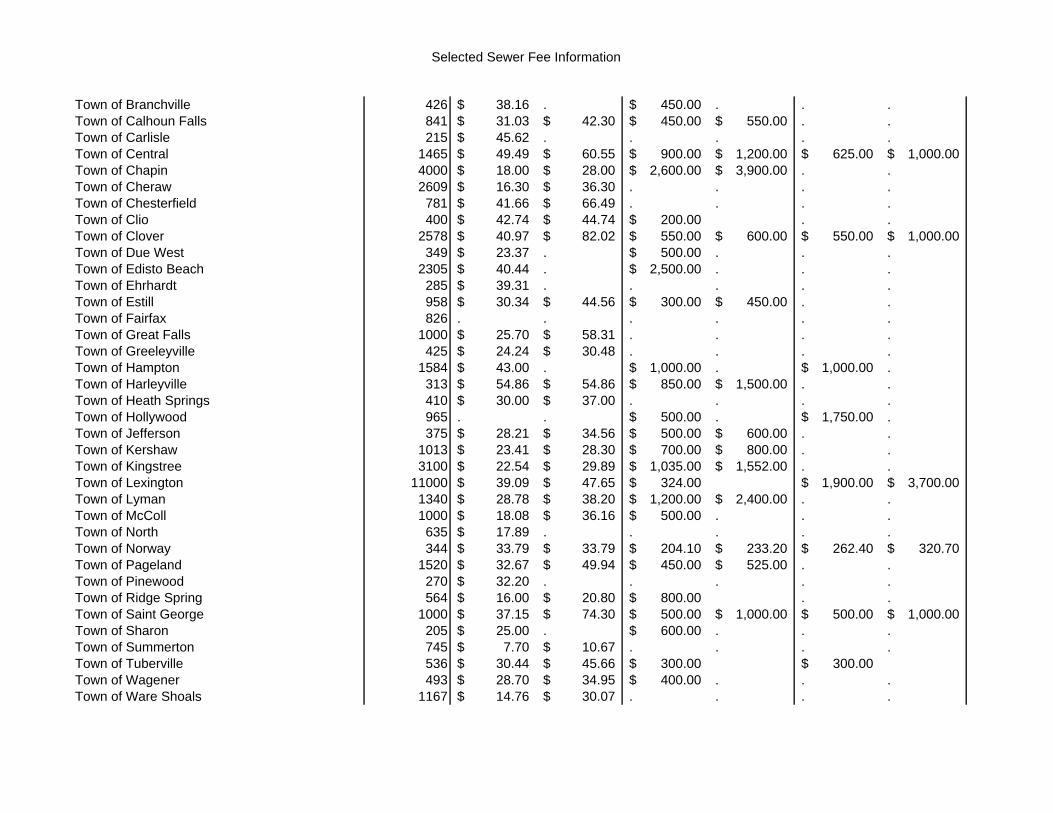
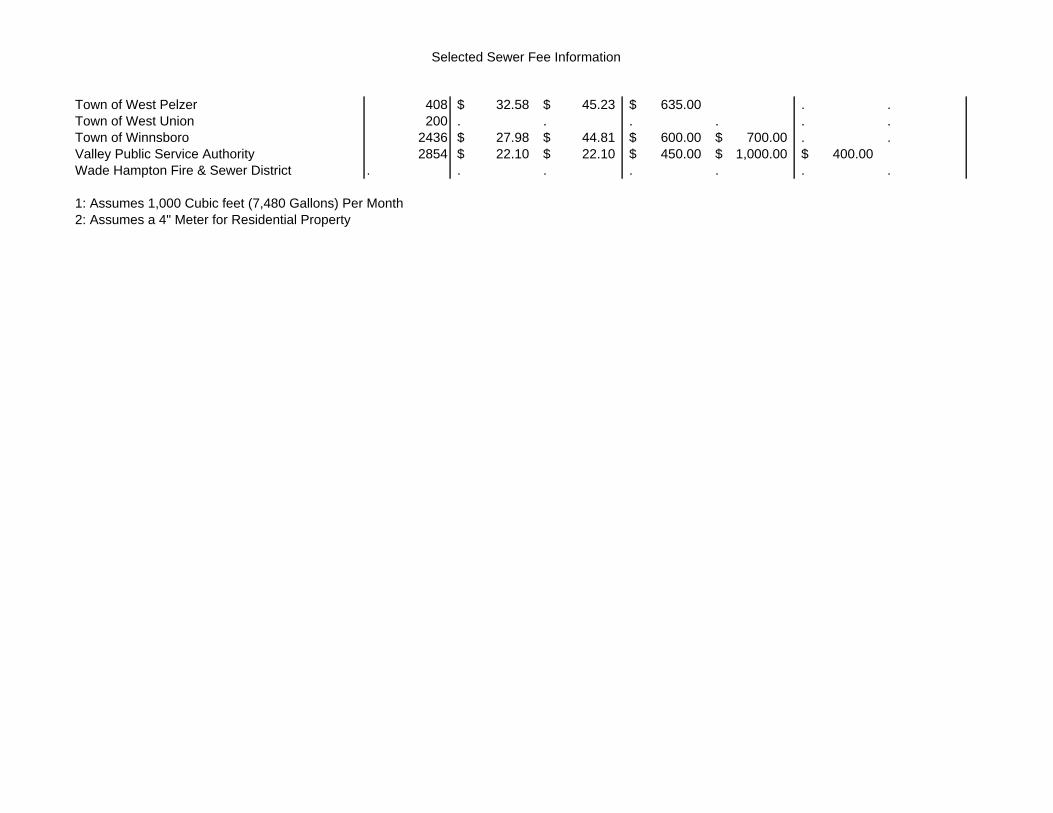
Appendix C: Selected Sewer Fee Information
Appendix D: Respondent Contact Information
1
Preface A core purpose of the University of South Carolina’s Institute for Public Service and Policy Research (IPSPR) is to enhance the quality and effectiveness of state and local government management and leadership. In fulfilling this mission, the IPSPR administers the South Carolina Local Government Rate and Practices Surveys. The purpose of these surveys is to collect relevant and timely information on local government fees and practices and to serve as a repository of information. The ultimate goal of South Carolina Local Government Rate and Practices Surveys is to help inform the decision-making process for local government councils and staffs. The topic of this survey is public water and sewer systems. The infrastructure of the United States has been an issue of concern for some time. In 2005, the American Society of Civil Engineers (ASCE) gave the drinking and waste water infrastructure a grade of “D-” for the nation as a whole.1 For the state of South Carolina, the United States Environmental Protection Agency (EPA) estimated that the public water and sewer systems needed $1.25 billion dollars of infrastructure improvements over a 20-year period to continue to provide safe drinking water.2 The EPA estimated that the state needed $698 billion in investment in order handle wastewater.3 A second concern in the country concerns water scarcity. As of September 16, 2008, all but ten counties within South Carolina are in some stage of drought, according to the South Carolina State Climatology Office. The efficient and effective use of water is forecast to become a major issue within the state, as well as the country, as drought related scarcity combines with issues relating to population growth, agricultural needs, business needs, and intra-state water resource competition. Introduction The provision of water for consumption and the subsequent treatment of waste water is an extremely important service. Safe drinking water is important for public health. Water is also important for agriculture and industry. The treatment of wastewater is equally important as improper treatment and disposal of wastewater poses a threat to public health. Thus, the rates and fees charged to support water and sewer systems are important.
1 American Society of Civil Engineers (n.d) 2005 Report Card for America’s Infrastructure. Retrieved April 10, 2008 http://www.asce.org/reportcard/2005/index2005.cfm 2 January 2003 Dollars. United States Environmental Protection Agency (2005, June) Drinking Water Needs Survey and Assessment (Pub. No. EPA 816-R-05-001). Retrieved on February 15, 2008 http://www.epa.gov/OGWDW/needssurvey/index.html 3 January 2004 Dollars, does not include needs related to stormwater or recycled water management programs. United States Environmental Protection Agency (2008, January ) Clean Watershed Needs Survey 2004 Report to Congress. Retrieved on February 15, 2008. http://www.epa.gov/owm/mtb/cwns/2004rtc/toc.htm
2
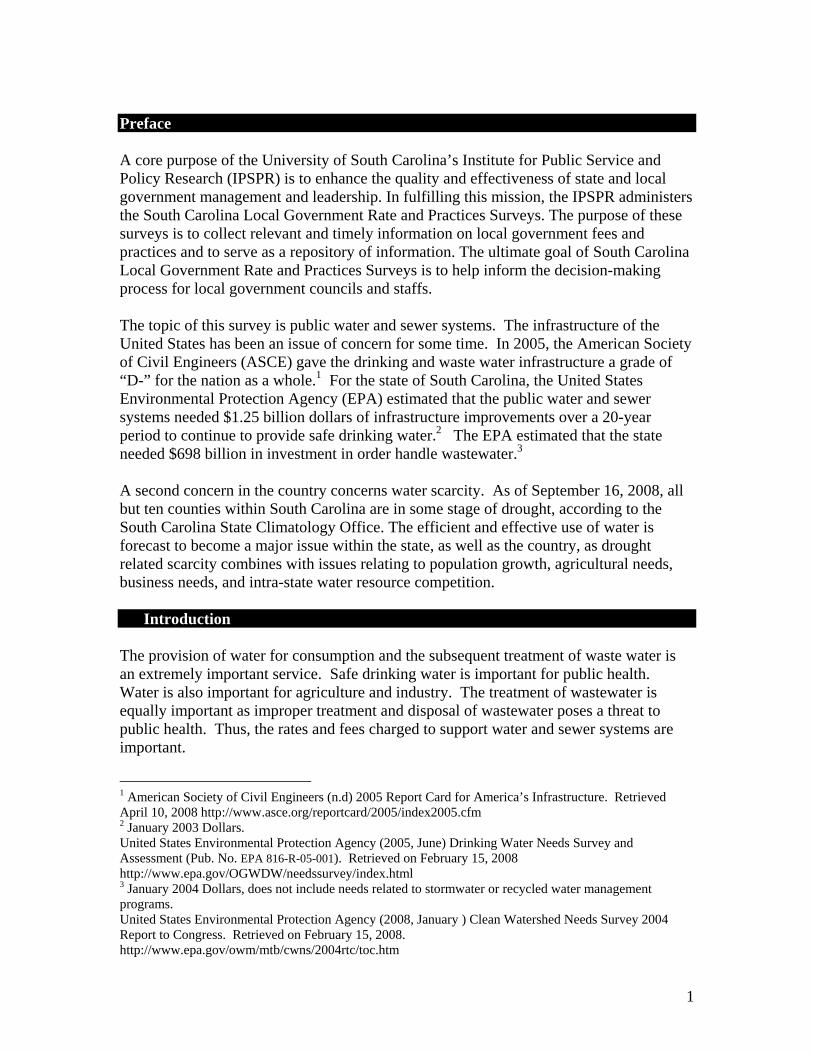
Basic Survey Information and Methodology The water and sewer rate and practice survey was mailed to water and sewer providers. Respondents were given the option to complete the survey electronically and email it to IPSPR. A total of 267 surveys were mailed using addresses provided by the South Carolina Budget and Control Board and the South Carolina Association of Special Purpose Districts. Nine surveys were mailed back, notifying IPSPR that they did not provide either water or sewer service. A total of 139 surveys were received. After subtracting the nine respondents who did not provide either service, this yields a response rate of 54%.4 The survey instrument is available for view in Appendix A. Survey questions were developed by reviewing literature related to water and sewer rates and practices and conversations with experts from the South Carolina Budget and Control Board, South Carolina Department of Health and Environmental Control, and the Environmental Finance Center at the University of North Carolina in Chapel Hill. General Utility Information Political Jurisdiction: Public water and sewer providers fall under two categories: a part of a local government (such as a city or county) or a separate entity known as a special purpose district. As a part of this survey, water and sewer providers were asked to self identify themselves as either a special purpose district or as a part of a city or county government. Of the water providers, 102 (81%) categorized themselves as part of a city or county government, while 24 (21%) identified themselves as a special purpose district. For sewer providers, 100 (87%) identified themselves as part of a city or county government, while 15 (13%) identified themselves as special purpose district.
4 However, it should be noted that IPSPR staff aired on the side of caution when sending out surveys and there may be more non-respondents that do not provide either water or sewer services.
3
Characteristics of Respondents
81% 87%
19% 13%
0%
20%
40%
60%
80%
100%
Water (N = 126) Sewer (N = 115)
City/CountySpecial Purpose District
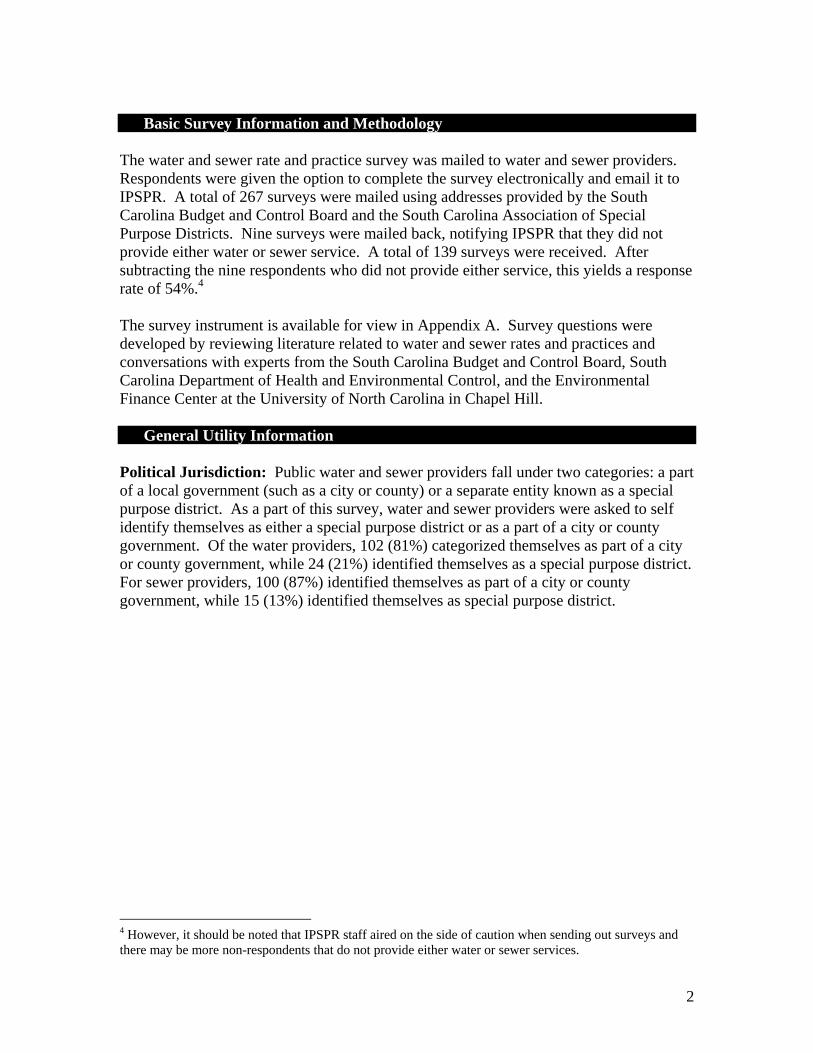
Service Provision: There are three service options for water and sewer providers. They may provide water service, sewer service, or both. There may be a number of reasons for this service provision. Water and sewer providers were asked to self identify their services as “water only,” “sewer only” or “water and sewer.” For the total number of respondents (139), 101 (73%) provided both water and sewer services, 25 (18%) provided water services only, and 13 (19%) provided services only.
Service Provision of Survey Respondents (N = 139)
18%
9%
73%
Water OnlySewer OnlyWater and Sewer
Size: Size may be an important factor in analyzing water and sewer rates. Large entities may have an easier time achieving economies of scale; meaning, large utilities may be able to charge less for individual service without sacrificing infrastructure quality or service. Large utilities may be more likely to have the ability to have access to capital markets for large projects. Also, larger utilities may have a more diverse set of account

4
categories. However, research has shown that utility size is not statistically significant in determining whether or not a utility generates sufficient revenue to cover expenses.5 One measure of size is the number of active accounts. Accounts represent the number of bill payers. It is possible that one account has multiple connections. For water providers, the average number of active accounts was 8,388 and the median was 2,569. For sewer providers, the average number of active accounts was 8,148, and the median was 2,514. Additional information can be found in the following table:
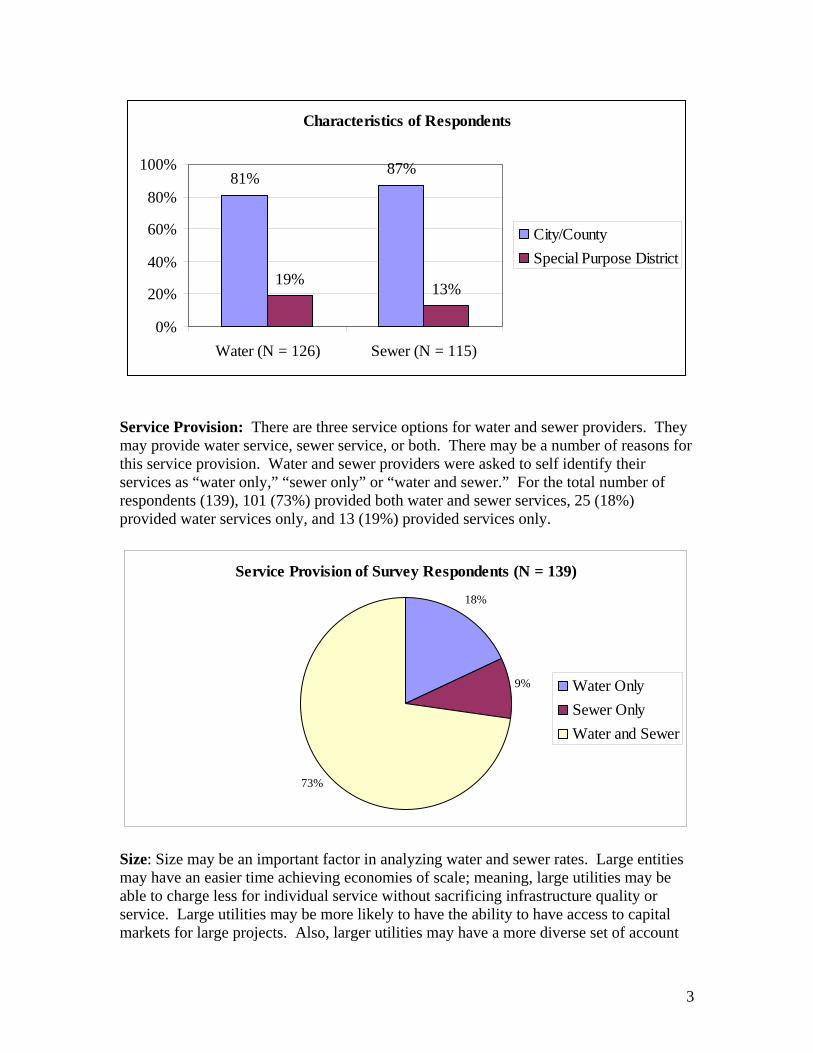
Active Account Information6 Water (N =126) Sewer (N = 112) Mean 8,388 8,148 Median 2,569 2,514 Minimum 50 200 Maximum 130,000 105,000 25th Percentile 579 870 75th Percentile 8,075 9,940 Account Categories: Water and sewer providers may provide service to different types of customers. Survey respondents were asked to list the different type of account categories that they provide service to. The respondents were given the options of residential, commercial, and industrial account categories. The type of service population may affect a service provider in many ways. For example, industrial customers may require larger amounts of water, but may also provide a predictable stream of demand and revenue. Also, different types of water and sewer customers may face different rate structures. For water providers, 126 (100%) have residential accounts, 122 (97%) have commercial accounts, and 84 (67%) have industrial accounts. For sewer providers, 114 (100%) have residential accounts, 112 (98%) have commercial accounts, and 79 (69%) have industrial accounts.
5 United States Government Accountability Office (2002, August) Water Infrastructure: Information on Financing, Capital Planning, and Privatization. (GAO-02-764). Retrieved on September 30, 2008 http://www.gao.gov/new.items/d02764.pdf 6 The survey instrument only asked for the total number of active accounts, with no separation for water and sewer accounts. Thus, many providers of water and sewer services provided only one number. This number was used for both water and sewer. It is possible, and some providers separated active accounts by water and sewer, that this number could be different.
5
Account Categories
0%20%40%60%80%
100%
Water (N = 126) 100% 97% 67%
Sewer (N = 114) 100% 98% 69%
Residential Commercial Industrial
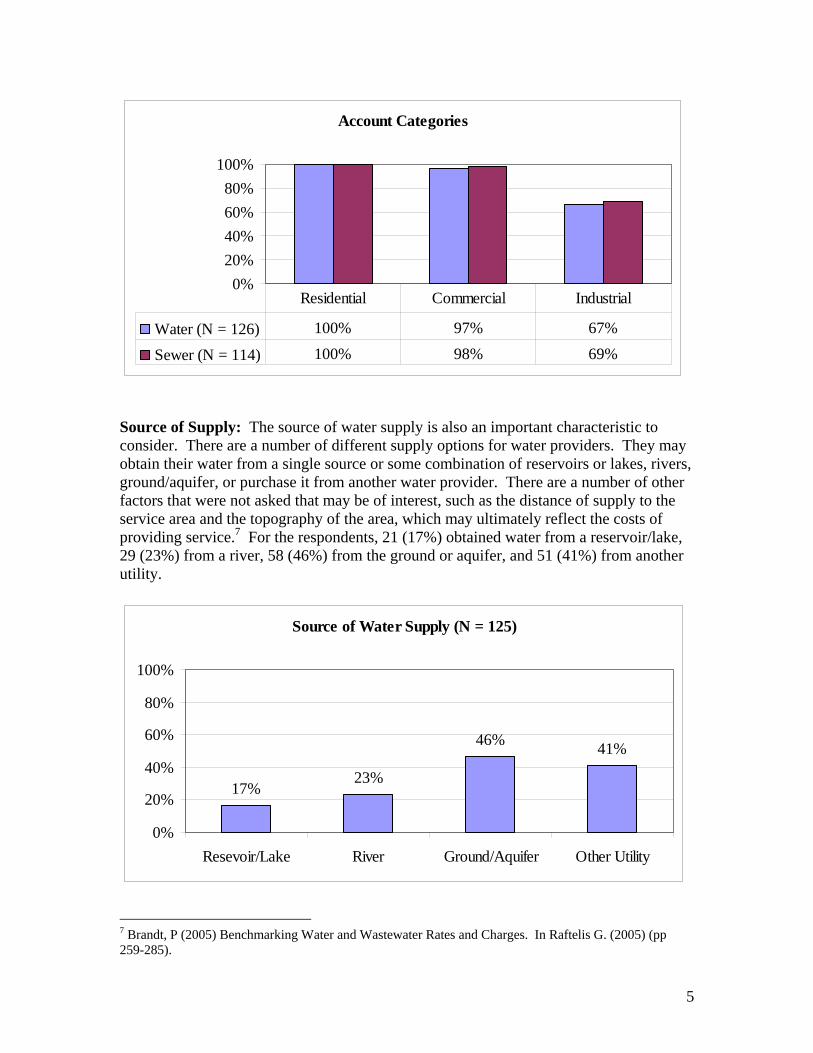
Source of Supply: The source of water supply is also an important characteristic to consider. There are a number of different supply options for water providers. They may obtain their water from a single source or some combination of reservoirs or lakes, rivers, ground/aquifer, or purchase it from another water provider. There are a number of other factors that were not asked that may be of interest, such as the distance of supply to the service area and the topography of the area, which may ultimately reflect the costs of providing service.7 For the respondents, 21 (17%) obtained water from a reservoir/lake, 29 (23%) from a river, 58 (46%) from the ground or aquifer, and 51 (41%) from another utility.
Source of Water Supply (N = 125)
17%23%
46% 41%
0%
20%
40%
60%
80%
100%
Resevoir/Lake River Ground/Aquifer Other Utility
7 Brandt, P (2005) Benchmarking Water and Wastewater Rates and Charges. In Raftelis G. (2005) (pp 259-285).
6
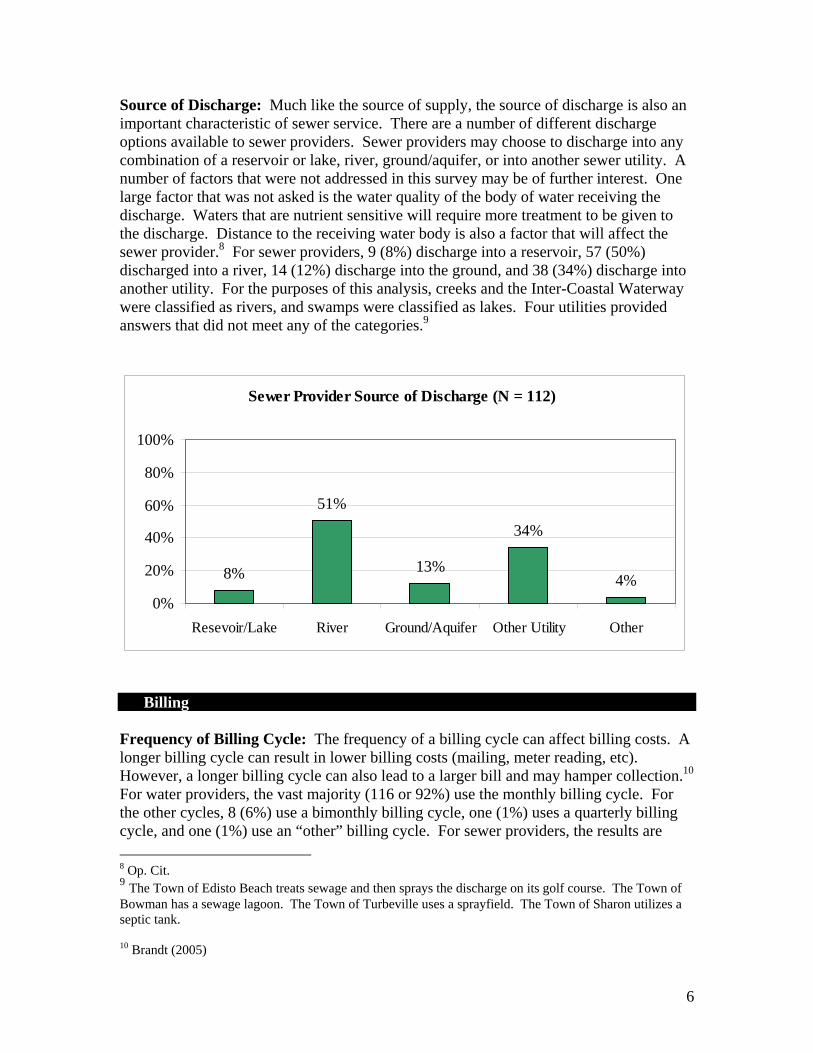
Source of Discharge: Much like the source of supply, the source of discharge is also an important characteristic of sewer service. There are a number of different discharge options available to sewer providers. Sewer providers may choose to discharge into any combination of a reservoir or lake, river, ground/aquifer, or into another sewer utility. A number of factors that were not addressed in this survey may be of further interest. One large factor that was not asked is the water quality of the body of water receiving the discharge. Waters that are nutrient sensitive will require more treatment to be given to the discharge. Distance to the receiving water body is also a factor that will affect the sewer provider.8 For sewer providers, 9 (8%) discharge into a reservoir, 57 (50%) discharged into a river, 14 (12%) discharge into the ground, and 38 (34%) discharge into another utility. For the purposes of this analysis, creeks and the Inter-Coastal Waterway were classified as rivers, and swamps were classified as lakes. Four utilities provided answers that did not meet any of the categories.9
Sewer Provider Source of Discharge (N = 112)
8%
51%
13%
34%
4%0%
20%
40%
60%
80%
100%
Resevoir/Lake River Ground/Aquifer Other Utility Other
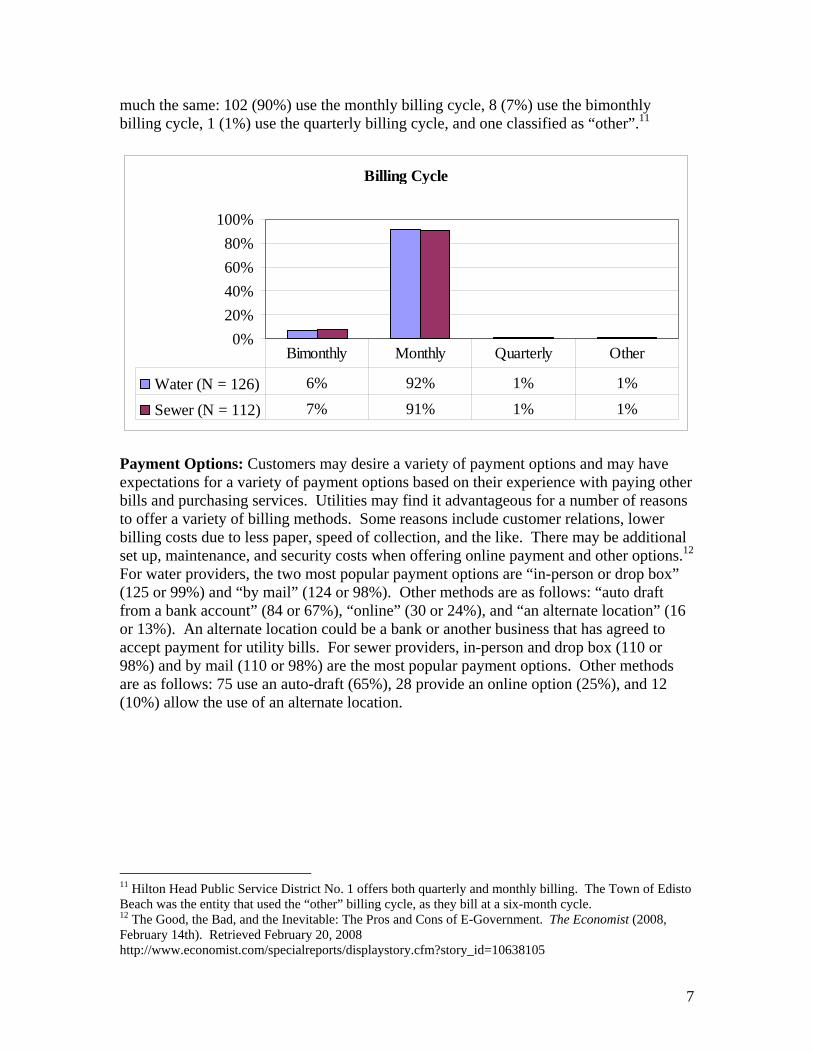
Billing Frequency of Billing Cycle: The frequency of a billing cycle can affect billing costs. A longer billing cycle can result in lower billing costs (mailing, meter reading, etc). However, a longer billing cycle can also lead to a larger bill and may hamper collection.10 For water providers, the vast majority (116 or 92%) use the monthly billing cycle. For the other cycles, 8 (6%) use a bimonthly billing cycle, one (1%) uses a quarterly billing cycle, and one (1%) use an “other” billing cycle. For sewer providers, the results are 8 Op. Cit. 9 The Town of Edisto Beach treats sewage and then sprays the discharge on its golf course. The Town of Bowman has a sewage lagoon. The Town of Turbeville uses a sprayfield. The Town of Sharon utilizes a septic tank. 10 Brandt (2005)
7
much the same: 102 (90%) use the monthly billing cycle, 8 (7%) use the bimonthly billing cycle, 1 (1%) use the quarterly billing cycle, and one classified as “other”.11
Billing Cycle
0%20%40%60%80%
100%
Water (N = 126) 6% 92% 1% 1%
Sewer (N = 112) 7% 91% 1% 1%
Bimonthly Monthly Quarterly Other
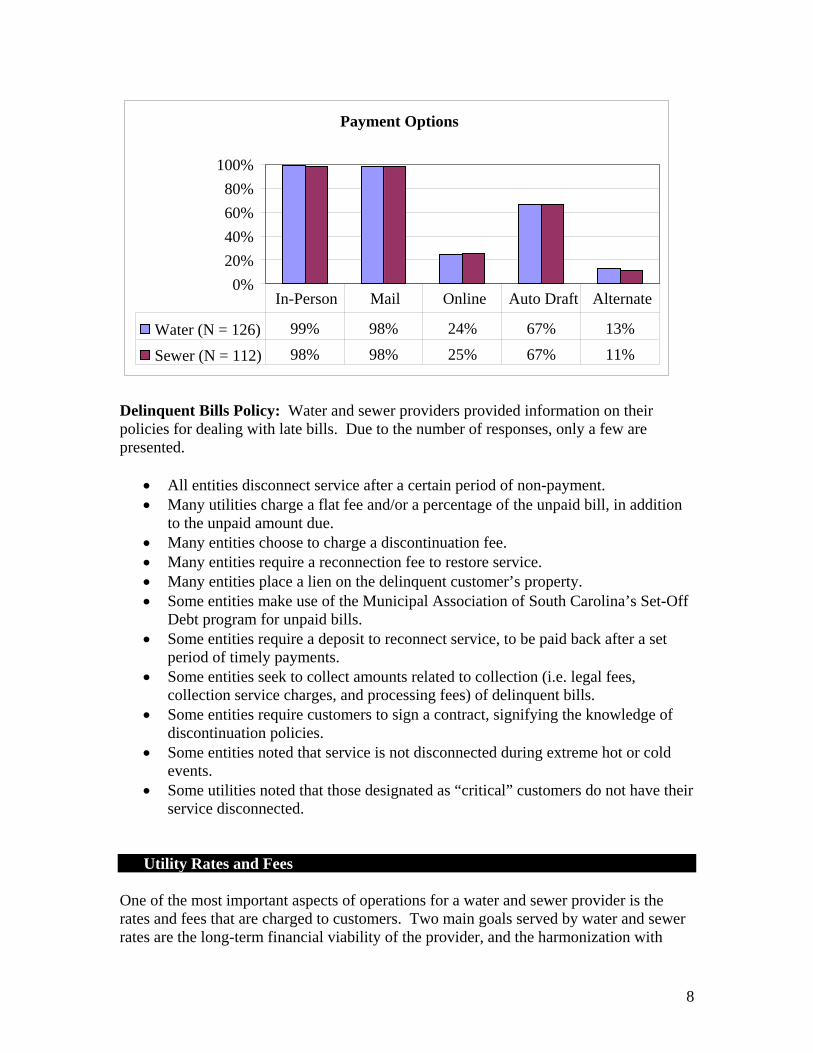
Payment Options: Customers may desire a variety of payment options and may have expectations for a variety of payment options based on their experience with paying other bills and purchasing services. Utilities may find it advantageous for a number of reasons to offer a variety of billing methods. Some reasons include customer relations, lower billing costs due to less paper, speed of collection, and the like. There may be additional set up, maintenance, and security costs when offering online payment and other options.12 For water providers, the two most popular payment options are “in-person or drop box” (125 or 99%) and “by mail” (124 or 98%). Other methods are as follows: “auto draft from a bank account” (84 or 67%), “online” (30 or 24%), and “an alternate location” (16 or 13%). An alternate location could be a bank or another business that has agreed to accept payment for utility bills. For sewer providers, in-person and drop box (110 or 98%) and by mail (110 or 98%) are the most popular payment options. Other methods are as follows: 75 use an auto-draft (65%), 28 provide an online option (25%), and 12 (10%) allow the use of an alternate location.
11 Hilton Head Public Service District No. 1 offers both quarterly and monthly billing. The Town of Edisto Beach was the entity that used the “other” billing cycle, as they bill at a six-month cycle. 12 The Good, the Bad, and the Inevitable: The Pros and Cons of E-Government. The Economist (2008, February 14th). Retrieved February 20, 2008 http://www.economist.com/specialreports/displaystory.cfm?story_id=10638105
8
Delinquent Bills Policy: Water and sewer providers provided information on their policies for dealing with late bills. Due to the number of responses, only a few are presented.
• All entities disconnect service after a certain period of non-payment. • Many utilities charge a flat fee and/or a percentage of the unpaid bill, in addition
to the unpaid amount due. • Many entities choose to charge a discontinuation fee. • Many entities require a reconnection fee to restore service. • Many entities place a lien on the delinquent customer’s property. • Some entities make use of the Municipal Association of South Carolina’s Set-Off
Debt program for unpaid bills. • Some entities require a deposit to reconnect service, to be paid back after a set
period of timely payments. • Some entities seek to collect amounts related to collection (i.e. legal fees,
collection service charges, and processing fees) of delinquent bills. • Some entities require customers to sign a contract, signifying the knowledge of
discontinuation policies. • Some entities noted that service is not disconnected during extreme hot or cold
events. • Some utilities noted that those designated as “critical” customers do not have their
service disconnected. Utility Rates and Fees One of the most important aspects of operations for a water and sewer provider is the rates and fees that are charged to customers. Two main goals served by water and sewer rates are the long-term financial viability of the provider, and the harmonization with
Payment Options
0%20%40%60%80%
100%
Water (N = 126) 99% 98% 24% 67% 13%
Sewer (N = 112) 98% 98% 25% 67% 11%
In-Person Mail Online Auto Draft Alternate

9
other community goals.13 Community goals in this case are typically public health, economic development, and water conservation. A note of caution must be given to those who seek to compare data on water and sewer rates and charges. Rate and fees will naturally differ among entities. Brandt (2005) found two main factors that affect pricing to be “the costs to be recovered through water and waste water pricing, and the pricing structure.” Other factors that can influence fees and charges are: geographic location to the source of water or discharge; topography; demand; customer constituency; level of treatment; level of general fund subsidization; level of grant funding; age of the system; and infiltration and inflow levels.14 Thus, making a statement of the financial health of an entity, or determining that a rate or fee should be raised or lowered based on this data would be improper.15 For the purposes of this report, only rate and fee amounts as it relates to residential customers are reported. Anytime a dollar figure is reported, it refers to residential customers, unless otherwise noted. Tap or Connection Fees: A tap or connection fee is a common fee charged to new customers of a water or wastewater entity. Such charges are only charged for a new connection to the system. The main goal of a tap fee is to recover the costs of service line installation.16 All water and sewer providers responded that they charge a water or sewer tap fee. The basis for the tap fee can vary however. Entities may chose to charge customers at a fixed cost, where every customer pays the same tap fee. Some customers may chose to vary the tap cost by meter or line size. Finally, some entities may simply charge the customer the cost of tap installation. For water providers, 33 (27%) charge a fixed fee for a new tap. Seventy-four (60%) vary the cost by meter size. And, 15 (12%) use cost recovery. Finally, 2 (2%) did not fall under classification system.17 For sewer providers, 41 (37%) charge a fixed fee for a tap connection; 48 (43%) vary the fee by meter; 17 (15%) use cost recovery; and, 5 (5%) classified as “other”.18
13 Warmath, A. (2005) Water and Wastewater Pricing Policies. In Raftelis, G. (2005) (p 176) 14 Brandt (2005) 15 A special note must be made on two utilities: the City of Fountain Inn, the Wade Hampton Fire and Sewer District, and Metropolitan Sewer Sub District use a mileage rate to support the sewer system instead of rates; as such, there responses were not included in the analysis of sewer fees. 16 Westbrook A, (2006) “One-Time Fees for Residential Water and Sewer Connections in North Carolina.” Environmental Finance Center at the University of North Carolina Chapel Hill. Retrieved on February 27, 2008 from http://www.efc.unc.edu/projects/tap_impactfee.htm. 17 Seabrook Island Utility Commission charges a water tap fee per ERU. The Clearwater Water and Sewer District charges a water tap fee using building square footage as a basis. 18 Seabrook Island and Clearwater again classified as “other.” The North Charleston Sewer District uses the ERU as its sewer tap fee basis. The City of Columbia uses a fixed fee for single family homes and usage for all other sewer tap fees. The Isle of Palms Water and Sewer Commission bases its sewer tap fees on ERU.

10
Tap Fee Basis
0%
20%
40%
60%
80%
100%
Water (N = 124) 27% 60% 12% 2%
Sewer (N = 111) 37% 43% 15% 5%
Fixed Varies By Meter
Cost Recovery Other
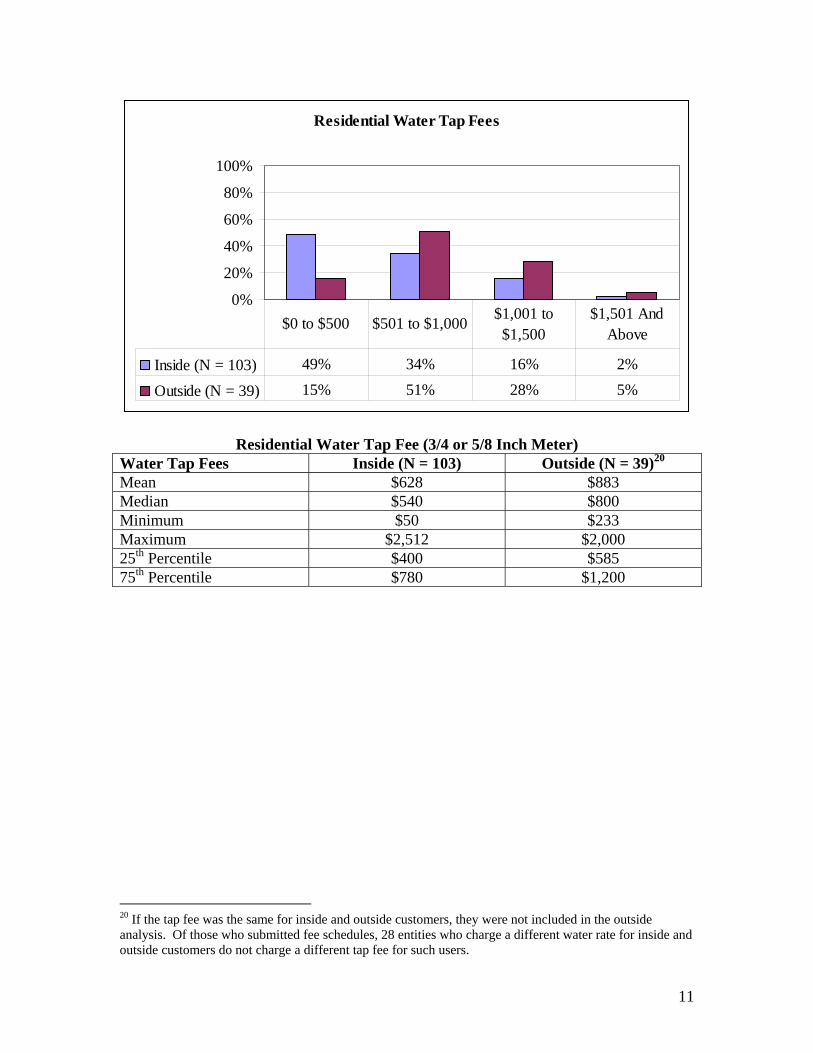
The information on water and sewer residential tap fee amounts is presented in the following tables and graphs. The average residential water tap fee inside the jurisdiction is $628, with a median of $540. Outside of the jurisdiction, the average residential water tap fee is $883 with a median of $800. The average residential sewer tap fee inside the jurisdiction is $732, with a median of $575. Outside of the jurisdiction, the average residential sewer tap fee is $1,025, with a median of $750.19
19 The level of detail provided for tap fees varied by response. For the purpose of this analysis, separate fees related to new connections (i.e administrative fees, application fees, deposits, etc) were not included. It may be possible that some of these charges were reported in the tap fee amount given by some respondents. Also, fees were calculated separately, some entities provide a discount if one connects to the water and sewer system at the same time. This analysis does not reflect such as discount.
11
Residential Water Tap Fees
0%
20%
40%
60%
80%
100%
Inside (N = 103) 49% 34% 16% 2%
Outside (N = 39) 15% 51% 28% 5%
$0 to $500 $501 to $1,000 $1,001 to $1,500
$1,501 And Above
Residential Water Tap Fee (3/4 or 5/8 Inch Meter) Water Tap Fees Inside (N = 103) Outside (N = 39)20 Mean $628 $883 Median $540 $800 Minimum $50 $233 Maximum $2,512 $2,000 25th Percentile $400 $585 75th Percentile $780 $1,200
20 If the tap fee was the same for inside and outside customers, they were not included in the outside analysis. Of those who submitted fee schedules, 28 entities who charge a different water rate for inside and outside customers do not charge a different tap fee for such users.

12
Residential Sewer Tap Fees
0%
20%
40%
60%
80%
100%
Inside (N = 85) 46% 34% 15% 5%
Outside (N = 34) 12% 56% 15% 18%
$0 to $500 $501 to $1,000 $1,001 to $1,500
$1,501 And Above
Residential Sewer Tap Fee (4 Inch Tap) Sewer Tap Fees Inside (N = 86) Outside (N = 34)21 Mean $732 $1,025 Median $575 $750 Minimum $200 $233 Maximum $2,867 $3,900 25th Percentile $407 $600 75th Percentile $1,000 $1,350 Impact Fees: Some capital costs for water and sewer systems are the result of population growth, and thus new accounts, in the service area. To the extent that new growth leads to increased capital expenditures to increase system, entities may seek to charge impact fees to new connections to the system. Impact fees are also known as system development charges, facility expansion fees, and capital recovery charges. For the purposes of this study, they will be referred to as impact fees for the remainder of the report.22 Equity is a primary concern in the development of impact fees. On the one hand, it may be inequitable to charge existing customers for capital costs attributable to new customers. On the other hand, it would also be inequitable to aggressively charge new customers more than the cost their additional demand imposes on the system. The decision of Nollan vs. California Coastal Commission (1987)23 founded what is termed as
21 If the tap fee was the same for inside and outside customers, they were not included in the outside analysis. Of those who submitted fee schedules, 20 entities who charge a different sewer rate for inside and outside customers do not charge a different tap fee for such users. 22 Westbrook, A. (2006). 23 Nollan vs. California Coastal Commission, 483 U.S. 825 (1987).
13
the “Rational Nexus Test.”24 Using the logic of the decision, those charging an impact fee would have to ensure that a specific public purpose was addressed by the impact fee, and that the fee be connected to the new customer. In the subsequent decision of Dolan vs. the City of Tigard (1994) the “rough proportionality test” was founded. 25 Under the ruling, an entity charging and impact fee “must make some sort of individualized determination that the required dedication is related both in nature and extent to the impact of the proposed development.”26 Furthermore, under the South Carolina State Code, entities charging an impact fee must have both a capital improvement plan and an impact fee ordinance. The fees charged must be based on the accepted capital improvement plan.27 There are a number of ways that entities may chose to assess impact fees. These methods are a fixed fee, lot size, building size, meter size, the equivalent residential unit (ERU), and usage approach. The fixed fee method charges all new customers the same fee. Under the lot and building size method, the fee is based on the size of the lot or building, with larger customers paying a greater fee. The meter size approach would vary the fee on the basis of the size of the meter – those with a larger meter would typically pay a higher fee. An ERU is typically the size of an average residential lot, and may be similar to charging an impact fee based on lot size.28 Finally, some utilities may want to charge on the basis of forecast usage.29 For the South Carolina respondents, 47 (37%) water providers charge an impact fee, and 50 (45%) sewer providers charge an impact fee. The basis for the impact fee varies. Some providers use a fixed charge for all new connections to the system. For water, 12 (26%) providers use this method. For sewer, 12 (24%) use the fixed fee method. Some providers chose to use the building size chose method – two providers for both water and sewer used this method (4%). Some providers vary their charge by meter size, with 11 (23%) water providers and 8 (16%) sewer providers choosing this method. Using the ERU as the basis was the most popular, with 15 (32%) of water providers and 17 (35%) using this method. Forecast usage was used by 7 (13%) water providers and 10 (18%) sewer providers. Finally, one water and sewer provider uses a method that was not classified.30
24 Davis, Frank (2005). System Development Charges.” In G. Raftelis (Ed.), Water and Wastewater Finance and Pricing: A Comprehensive Guide (3rd ed, pp. 79-101). Boca Raton: Taylor and Francis. 25 Dolan vs. the City of Tigard, 512 US 687 (1994) 26 Op. Cit. 27 Sections 6-1-910 to 6-1-2010 of the South Carolina State Code, as amended, 1976. 28 Berger, A. & Tomes, B. (2006). An Analysis of Stormwater Rates and Practices – 2006. Institute for Public Service and Policy Research, University of South Carolina. Retrieved on February 25, 2008 http://www.ipspr.sc.edu/publication/Stormwater%20Final%20Report.pdf. 29 Westbrook (2006). For our purposes, the South Carolina Department of Health and Environmental Control’s Unit Contributory Loading Guide was classified as “usage.” 30 The City of North Myrtle Beach based their impact fee on the type of use (single home, restaurant, hotel/motel, etc).

14
Entities Charging an Impact Fee
37%45%
63%55%
0%
20%
40%
60%
80%
100%
Water (N = 126) Sewer (N = 112)
YesNo
Impact Fee Basis
0%
10%
20%
30%
40%
Water (N = 47) 26% 4% 23% 32% 13% 2%
Sewer (N = 50) 24% 4% 16% 35% 20% 2%
Fixed Building Meter Size ERU Usage Other
The information on water and sewer residential impact fee amounts is presented in the following tables and graphs. The average residential water impact fee inside the jurisdiction is $938, with a median of $635. Outside of the jurisdiction, the average residential water impact fee is $872 with a median of $735. The average residential sewer impact fee inside the jurisdiction is $1,341, with a median of $920. Outside of the jurisdiction, the average residential sewer impact fee is $1,467, with a median of $1,365.31
31 State law and federal court decisions require impact fees be related to the specific area charging them, specifically the capital improvement plan under state law. Thus, it would be improper to compare two entities based solely on the information presented in this report. For example, raising or lowering a fee on the basis of a neighboring area would be improper, as fees are required to be based on the capital improvement plans specific to the area.

15
Water Residential Impact Fees
0%
20%
40%
60%
80%
100%
Inside (N = 42) 40% 29% 14% 17%
Sewer (N = 13) 15% 69% 0% 15%
$0 to $500 $501 to $1,000 $1,001 to $1,500
$1,501 And Above
Residential Water Impact Fees32 Water Impact Fees Inside (N = 42) Outside (N = 13)33 Mean $938 $872 Median $635 $735 Minimum $100 $150 Maximum $4,400 $2,050 25th Percentile $428 $600 75th Percentile $1,162 $915
32 The rates were calculated for a standard residential customer. When ERU was the basis for rates, one ERU was used. When usage was the basis for rates, 1,000 cubic feet was used. The Isle of Palms Water and Sewer Authority provided a set of fees based on building square footage (2,000 or less square feet was used in the calculation). The City of Rock Hill charges an additional impact fee for fire protection, which was not included in these calculations. 33 If the impact fee was the same for inside and outside customers, they were not included in the outside analysis. Of those who submitted fee schedules, 16 entities charge a different water rate for inside and outside customers and do not charge a different impact fee for such customers.

16
Residential Sewer Impact Fees
0%
10%
20%
30%
40%
Inside (N = 45) 22% 36% 9% 33%
Outside (N = 15) 7% 33% 27% 33%
$0 to $500 $501 to $1,000 $1,001 to $1,500
$1,501 And Above
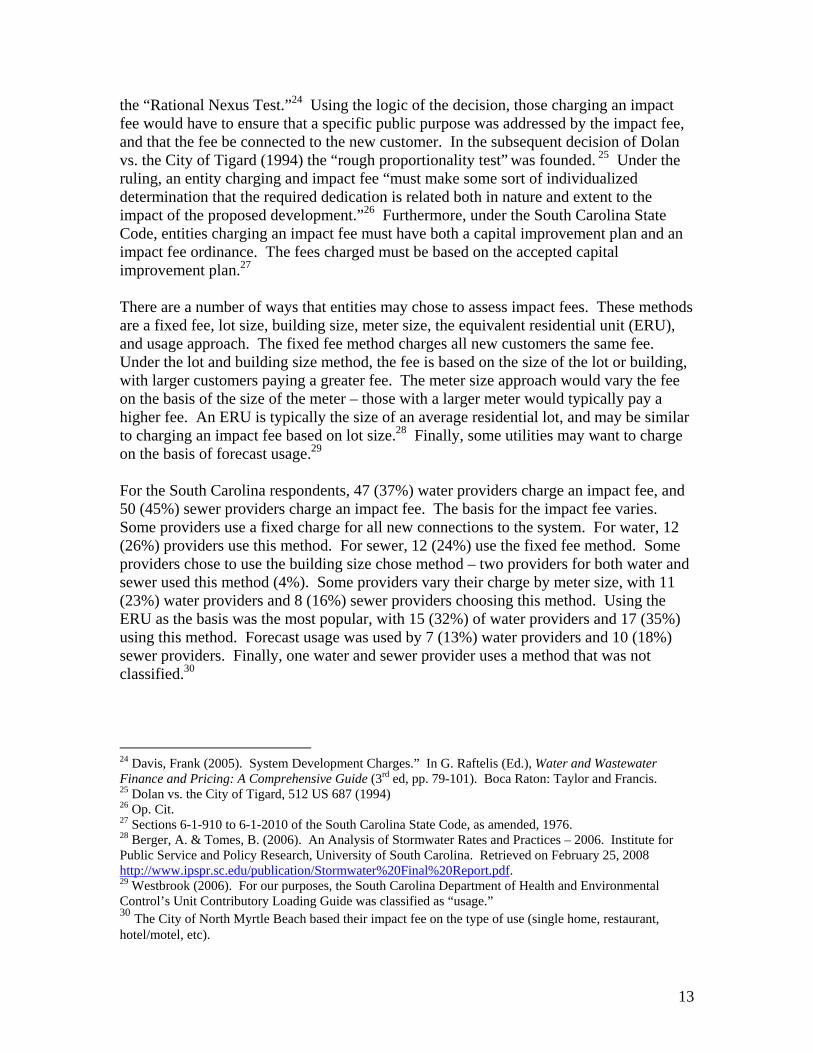
Residential Sewer Impact Fees34 Sewer Impact Fees Inside (N = 45) Outside (N = 15)35 Mean $1,341 $1,467 Median $920 $1,365 Minimum $100 $321 Maximum $4,500.00 $3,700 25th Percentile $550 $1,000 75th Percentile $2,047 $1,908 Rates: As mentioned above, rates are usually the primary method to finance a water and sewer entity. There are two different ways to charge rates. The two different methods are known as a base and a minimum charge. Under the base charge, entities charge a fixed amount that does not include consumption. After paying the charge, customers pay a rate per consumption. Under the minimum charge, entities include a certain amount of water or sewer use in the charge. After consuming the minimum amount, customers pay for additional consumption. The typical purpose of both fees, regardless of the inclusion of consumption, is to cover billing and customer service, fixed capital costs, and fixed operation and maintenance costs.36 Of the respondents, 43 (35%) water providers and 52 (48%) sewer providers charge a base charge with no consumption. 34 The rates were calculated for a standard residential customer. When ERU was the basis for rates, one ERU was used. When usage was the basis for rates, 1,000 cubic feet was used, unless a standard charge was provided. The Isle of Palms Water and Sewer Authority provided a set of fees based on building square footage, (2,000 or less square feet was used in this calculation). The City of Rock Hill charges an additional impact fee for fire protection, which was not included in these calculations. 35 If the impact fee was the same for inside and outside customers, they were not included in the outside analysis. Of those who submitted fee schedules, 16 entities who charge a different sewer rate for inside and outside customers do not charge a different impact fee for such customers. 36 Warmath, A. (2006)
17
Entities Including Consumption in the Minimum Charge
35%47%
65%53%
0%
20%
40%
60%
80%
100%
Water (N = 124) Sewer (N = 108)
No ConsumptionConsumption Included
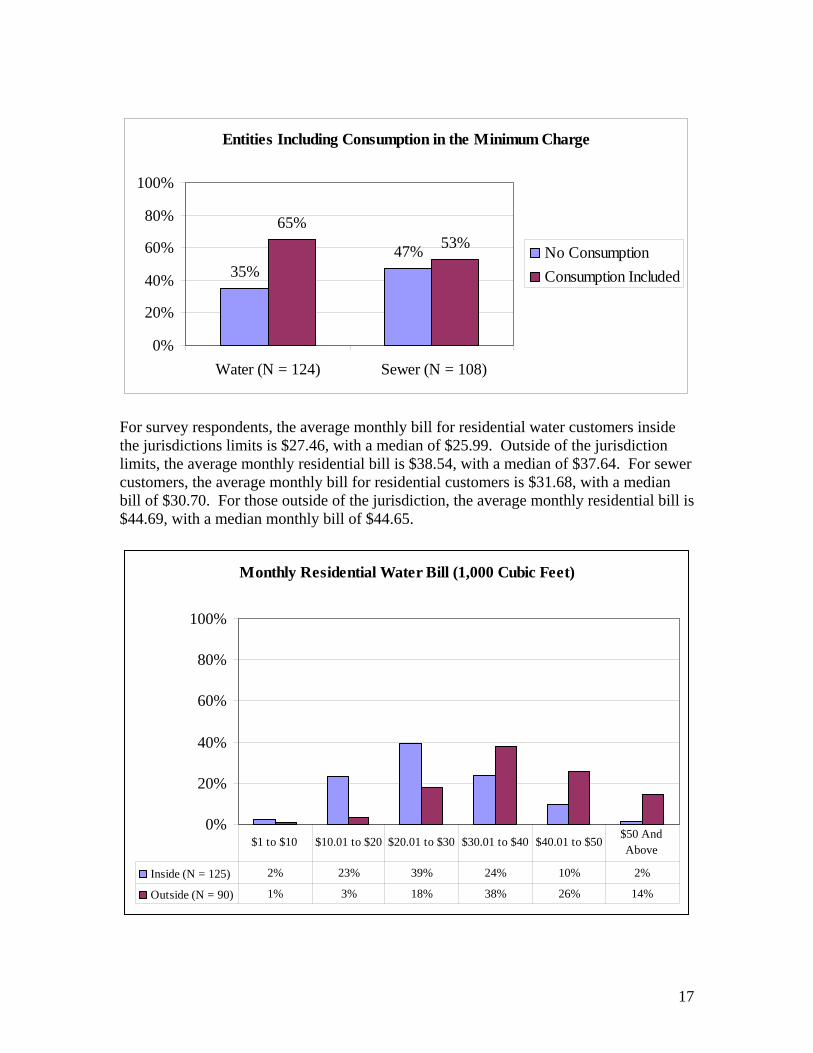
For survey respondents, the average monthly bill for residential water customers inside the jurisdictions limits is $27.46, with a median of $25.99. Outside of the jurisdiction limits, the average monthly residential bill is $38.54, with a median of $37.64. For sewer customers, the average monthly bill for residential customers is $31.68, with a median bill of $30.70. For those outside of the jurisdiction, the average monthly residential bill is $44.69, with a median monthly bill of $44.65.
Monthly Residential Water Bill (1,000 Cubic Feet)
0%
20%
40%
60%
80%
100%
Inside (N = 125) 2% 23% 39% 24% 10% 2%
Outside (N = 90) 1% 3% 18% 38% 26% 14%
$1 to $10 $10.01 to $20 $20.01 to $30 $30.01 to $40 $40.01 to $50$50 And Above

18
Water System Monthly Residential Rate (1,000 cubic feet) Inside (N = 125) Outside (N = 76) Mean $27.46 $38.63 Median $25.99 $37.63 Low $5.13 $6.92 High $51.98 $82.79 25th Percentile $19.98 $30.63 75th Percentile $34.20 $44.71
Monthly Residential Sewer Bill (1,000 Cubic Feet)
0%
20%
40%
60%
80%
100%
Inside (N = 107) 3% 10% 34% 31% 18% 5% 0%
Outside (N = 76) 0% 3% 12% 26% 26% 20% 13%
$1 to $10$10.01 to
$20$20.01 to
$30$30.01 to
$40$40.01 to
$50$50.01 to
$60$60.01 And
Above
Sewer Monthly Residential Rate (1,000 cubic feet) Inside (N = 107) Outside (N = 76) Mean $31.68 $44.69 Median $30.70 $44.65 Low $7.70 $10.67 High $56.93 $82.39 25th Percentile $25.00 $34.80 75th Percentile $39.09 $53.81 Customers are typically charged per volume of water or waste water used. These rates can be structured in three different ways: uniform, declining, and increasing blocks. Under uniform block rates, the customer pays the same amount per some amount of usage. Thus, the 100,000th gallon would cost the same amount as the 1,000th gallon. Under the declining block rate, customers pay less per additional amount of water used. Under increasing block rates, customers pay more per each block used. These rate
19
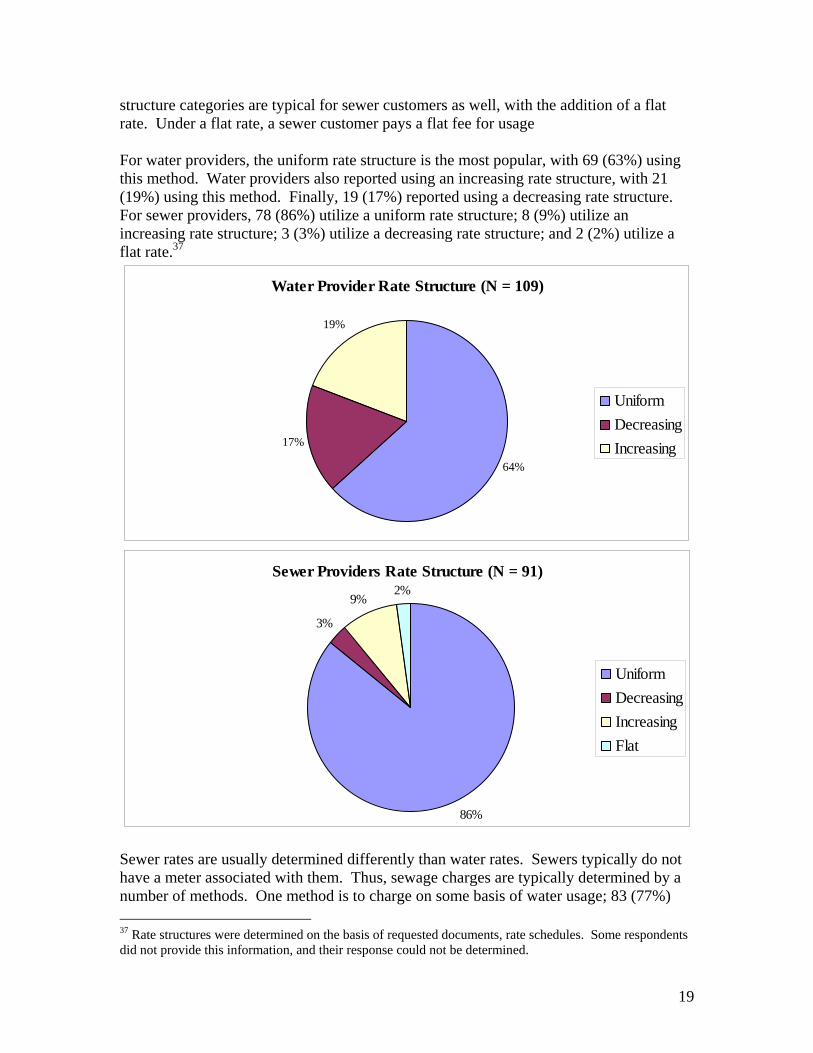
structure categories are typical for sewer customers as well, with the addition of a flat rate. Under a flat rate, a sewer customer pays a flat fee for usage For water providers, the uniform rate structure is the most popular, with 69 (63%) using this method. Water providers also reported using an increasing rate structure, with 21 (19%) using this method. Finally, 19 (17%) reported using a decreasing rate structure. For sewer providers, 78 (86%) utilize a uniform rate structure; 8 (9%) utilize an increasing rate structure; 3 (3%) utilize a decreasing rate structure; and 2 (2%) utilize a flat rate.37
Water Provider Rate Structure (N = 109)
64%
17%
19%
UniformDecreasingIncreasing
Sewer Providers Rate Structure (N = 91)
86%
3%
9%2%
UniformDecreasingIncreasingFlat
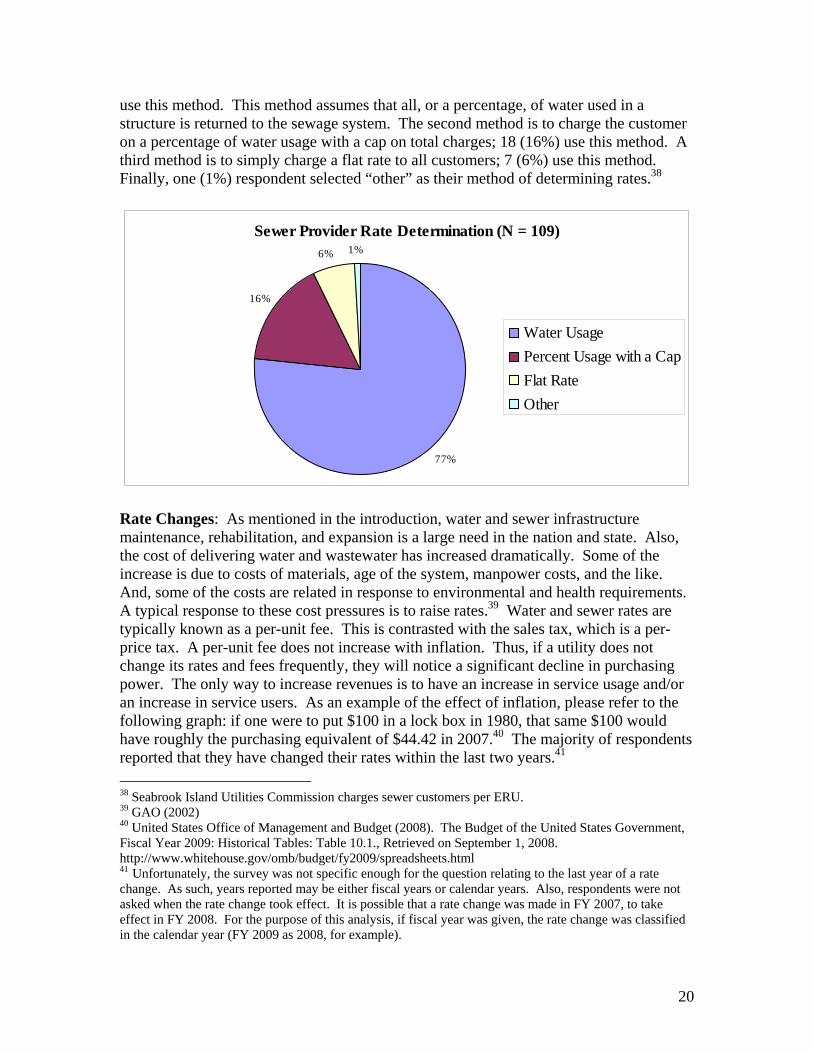
Sewer rates are usually determined differently than water rates. Sewers typically do not have a meter associated with them. Thus, sewage charges are typically determined by a number of methods. One method is to charge on some basis of water usage; 83 (77%) 37 Rate structures were determined on the basis of requested documents, rate schedules. Some respondents did not provide this information, and their response could not be determined.
20
use this method. This method assumes that all, or a percentage, of water used in a structure is returned to the sewage system. The second method is to charge the customer on a percentage of water usage with a cap on total charges; 18 (16%) use this method. A third method is to simply charge a flat rate to all customers; 7 (6%) use this method. Finally, one (1%) respondent selected “other” as their method of determining rates.38
Sewer Provider Rate Determination (N = 109)
77%
16%
6% 1%
Water UsagePercent Usage with a CapFlat RateOther
Rate Changes: As mentioned in the introduction, water and sewer infrastructure maintenance, rehabilitation, and expansion is a large need in the nation and state. Also, the cost of delivering water and wastewater has increased dramatically. Some of the increase is due to costs of materials, age of the system, manpower costs, and the like. And, some of the costs are related in response to environmental and health requirements. A typical response to these cost pressures is to raise rates.39 Water and sewer rates are typically known as a per-unit fee. This is contrasted with the sales tax, which is a per-price tax. A per-unit fee does not increase with inflation. Thus, if a utility does not change its rates and fees frequently, they will notice a significant decline in purchasing power. The only way to increase revenues is to have an increase in service usage and/or an increase in service users. As an example of the effect of inflation, please refer to the following graph: if one were to put $100 in a lock box in 1980, that same $100 would have roughly the purchasing equivalent of $44.42 in 2007.40 The majority of respondents reported that they have changed their rates within the last two years.41 38 Seabrook Island Utilities Commission charges sewer customers per ERU. 39 GAO (2002) 40 United States Office of Management and Budget (2008). The Budget of the United States Government, Fiscal Year 2009: Historical Tables: Table 10.1., Retrieved on September 1, 2008. http://www.whitehouse.gov/omb/budget/fy2009/spreadsheets.html 41 Unfortunately, the survey was not specific enough for the question relating to the last year of a rate change. As such, years reported may be either fiscal years or calendar years. Also, respondents were not asked when the rate change took effect. It is possible that a rate change was made in FY 2007, to take effect in FY 2008. For the purpose of this analysis, if fiscal year was given, the rate change was classified in the calendar year (FY 2009 as 2008, for example).
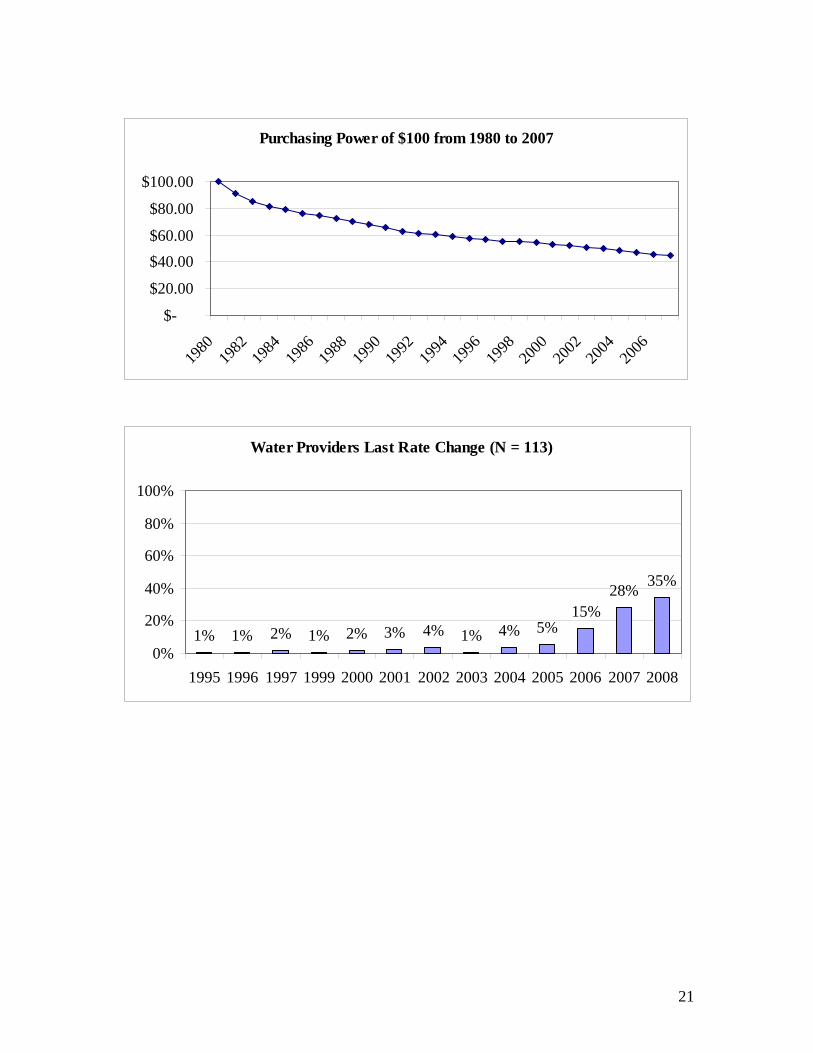
21
Purchasing Power of $100 from 1980 to 2007
$-
$20.00
$40.00$60.00
$80.00
$100.00
1980
1982
1984
1986
1988
1990
1992
1994
1996
1998
2000
2002
2004
2006
Water Providers Last Rate Change (N = 113)
1% 1% 2% 1% 2% 3% 4% 1% 4% 5%15%
28% 35%
0%
20%
40%
60%
80%
100%
1995 1996 1997 1999 2000 2001 2002 2003 2004 2005 2006 2007 2008

22
Sewer Providers Last Year of Rate Change (N = 98)
1% 1% 1% 2% 2% 2% 5%15%
30%41%
0%
20%
40%
60%
80%
100%
1984 1996 2001 2002 2003 2004 2005 2006 2007 2008
Debt Authority: Water and sewer provision is a highly capital intensive operation. The ability to issue debt is one way that water and waste water entities invest in capital. Water and sewer providers were asked if they had the ability to issue debt on their own. For water providers, 79 (69%) responded that they have the authority to issue debt, as opposed to 36 (31%) that do not. For sewer providers, 71 (68%) have the authority to issue debt, while 33 (32%) do not.
Entities Ability to Issue Debt
69% 68%
31% 32%
0%
20%
40%
60%
80%
100%
Water (N = 115) Sewer (N = 104)
YesNo
Transfers to the General Fund: Transfers to the general fund may be problematic for water and sewer providers that are part of a city or county government. Water and waste water operations should be established as an enterprise funds. Enterprise funds are used in government for operations that are intended to be run as business (i.e. the rates and fees charged by entities should allow the entity to “operate on a self-sustaining basis”).42 42 Warmath, A. (2005)

23
It is normal to transfer funds from the enterprise fund to other funds within the government, if it is to pay for a service within the government. For example, if a city water utility uses the city fleet maintenance facility, it pays for this service. For water providers, 25 (26%) report that funds generated by rates and fees are transferred to other governmental departments for programs unrelated to water, while 73 (74%) did not report this practice. For sewer providers, 25 (26%) reported that they support general fund activities with rates and fees, while 72 (74%) reported that they do.43
Entities Transferring Funds to the General Fund
26% 26%
74% 74%
0%
20%
40%
60%
80%
100%
Water (N = 98) Sewer (N = 93)
YesNo
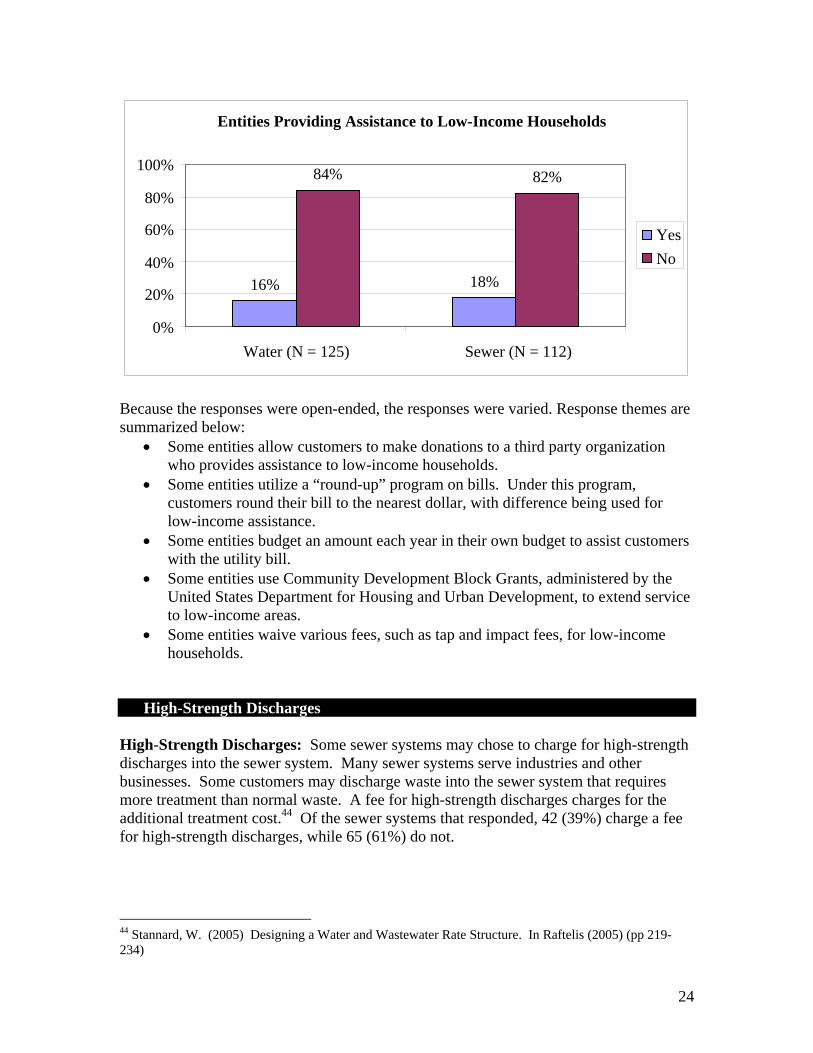
Low-Income Assistance As mentioned in the introduction, water and sewer services serve many goals, one of which is public health. As such, it may be beneficial to assist those who may have difficulty paying for water and sewer services. Respondents were asked if they had any such program, and if so to provide details. For water providers, 20 (16%) provide some form of low-income assistance, while 105 (84%) do not. For sewer providers, 20 (18%) provide low-income assistance, while 92 (82%) do not.
43 Special purpose districts were not included in the analysis.
24
Because the responses were open-ended, the responses were varied. Response themes are summarized below:
• Some entities allow customers to make donations to a third party organization who provides assistance to low-income households.
• Some entities utilize a “round-up” program on bills. Under this program, customers round their bill to the nearest dollar, with difference being used for low-income assistance.
• Some entities budget an amount each year in their own budget to assist customers with the utility bill.
• Some entities use Community Development Block Grants, administered by the United States Department for Housing and Urban Development, to extend service to low-income areas.
• Some entities waive various fees, such as tap and impact fees, for low-income households.
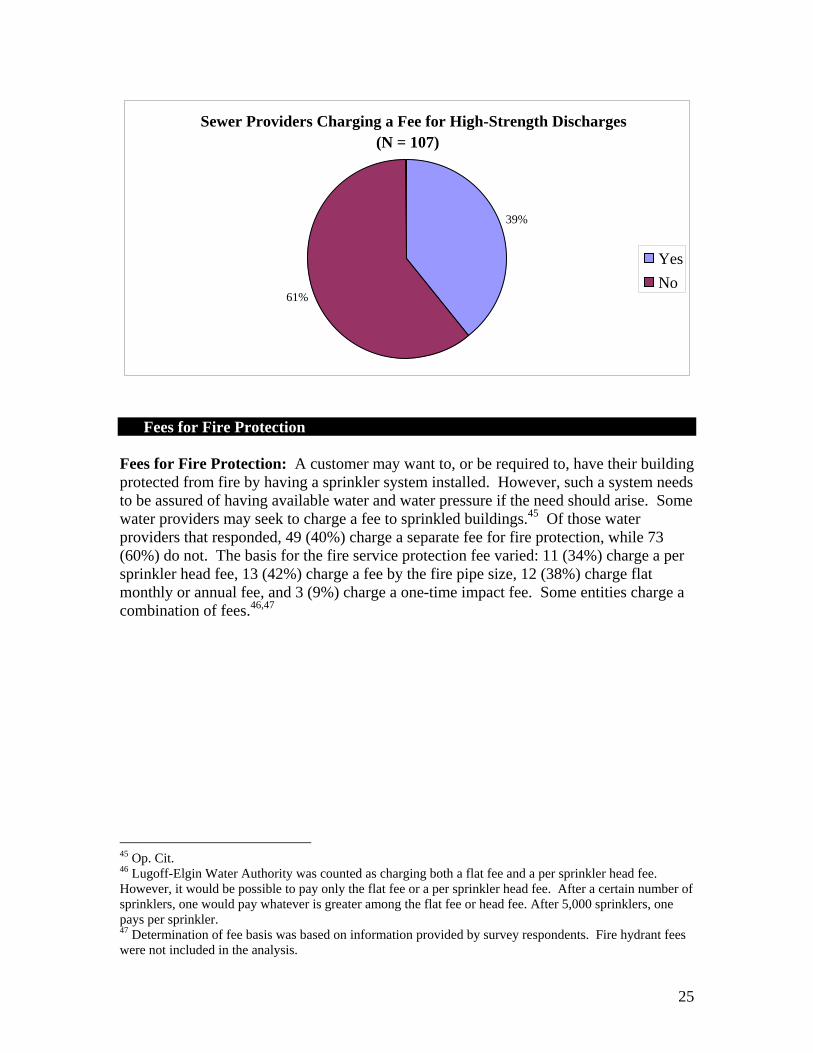
Infrastructure s High-Strength Discharges High-Strength Discharges: Some sewer systems may chose to charge for high-strength discharges into the sewer system. Many sewer systems serve industries and other businesses. Some customers may discharge waste into the sewer system that requires more treatment than normal waste. A fee for high-strength discharges charges for the additional treatment cost.44 Of the sewer systems that responded, 42 (39%) charge a fee for high-strength discharges, while 65 (61%) do not.
44 Stannard, W. (2005) Designing a Water and Wastewater Rate Structure. In Raftelis (2005) (pp 219-234)
Entities Providing Assistance to Low-Income Households
16% 18%
84% 82%
0%
20%
40%
60%
80%
100%
Water (N = 125) Sewer (N = 112)
YesNo
25
Fees for Fire Protection Fees for Fire Protection: A customer may want to, or be required to, have their building protected from fire by having a sprinkler system installed. However, such a system needs to be assured of having available water and water pressure if the need should arise. Some water providers may seek to charge a fee to sprinkled buildings.45 Of those water providers that responded, 49 (40%) charge a separate fee for fire protection, while 73 (60%) do not. The basis for the fire service protection fee varied: 11 (34%) charge a per sprinkler head fee, 13 (42%) charge a fee by the fire pipe size, 12 (38%) charge flat monthly or annual fee, and 3 (9%) charge a one-time impact fee. Some entities charge a combination of fees.46,47
45 Op. Cit. 46 Lugoff-Elgin Water Authority was counted as charging both a flat fee and a per sprinkler head fee. However, it would be possible to pay only the flat fee or a per sprinkler head fee. After a certain number of sprinklers, one would pay whatever is greater among the flat fee or head fee. After 5,000 sprinklers, one pays per sprinkler. 47 Determination of fee basis was based on information provided by survey respondents. Fire hydrant fees were not included in the analysis.
Sewer Providers Charging a Fee for High-Strength Discharges (N = 107)
39%
61%
YesNo

26
Water Providers Charging A Seperate Fee for the Maintenance of a Fire Protection Systems (N = 122)
40%
60%
YesNo
Water Provider Fire Service Charge Basis (N = 32)
34% 41% 38%
9%
0%
20%
40%
60%
80%
100%
Per Sprinkler Head By Line Size Flat Fee Impact Fee
Act 357, regarding fire sprinklers, was passed in the 117th South Carolina Legislative Session. Under this act, cost recovery is the only method that can be used for tap fees relating to fire sprinkler systems. The Act does not require a utility to provide service to a private sprinkler system. The Act prohibits sprinkler systems, not required by law, to be counted as improvements on property for the purpose of assessment, until there is an “assessable transfer.” If the local property taxing entity so chooses, it may enact a property tax credit for 25% of the cost of the sprinkler system for buildings not required by law to have such a system. At such time, the individual can claim a state income tax credit equal to the property tax credit.48 48 A.357, (2007-2008 Session of the General Assembly)
27
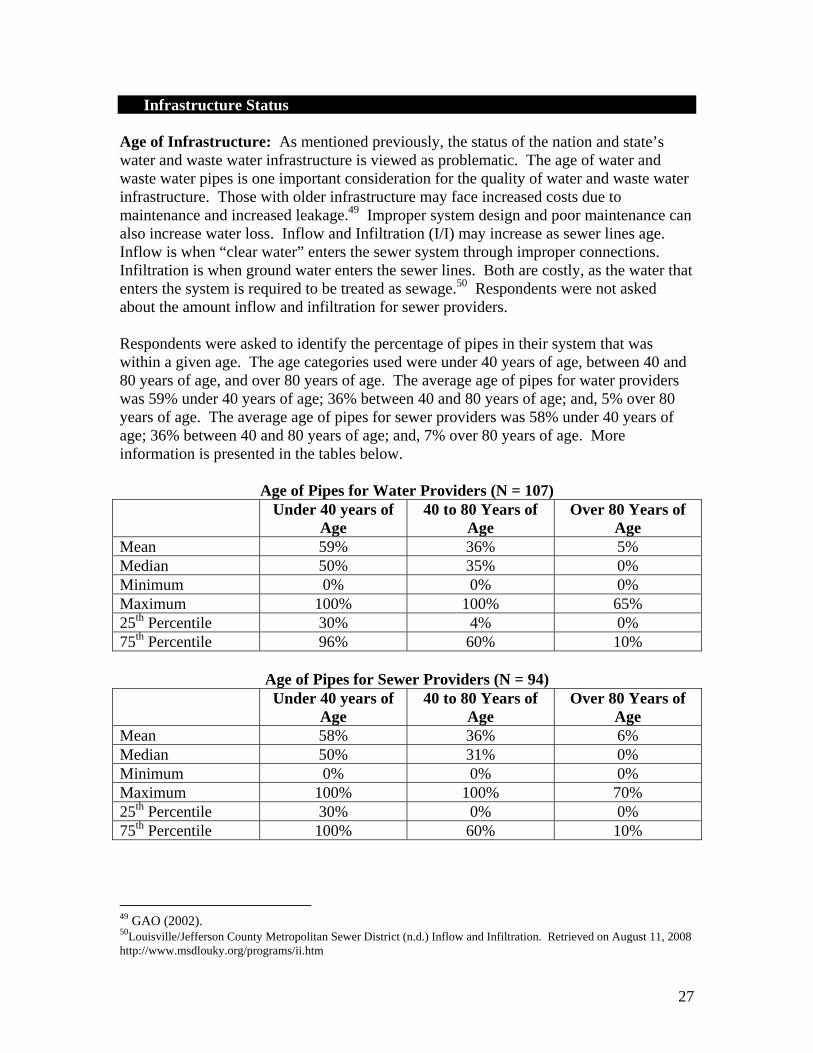
Infrastructure Status Age of Infrastructure: As mentioned previously, the status of the nation and state’s water and waste water infrastructure is viewed as problematic. The age of water and waste water pipes is one important consideration for the quality of water and waste water infrastructure. Those with older infrastructure may face increased costs due to maintenance and increased leakage.49 Improper system design and poor maintenance can also increase water loss. Inflow and Infiltration (I/I) may increase as sewer lines age. Inflow is when “clear water” enters the sewer system through improper connections. Infiltration is when ground water enters the sewer lines. Both are costly, as the water that enters the system is required to be treated as sewage.50 Respondents were not asked about the amount inflow and infiltration for sewer providers. Respondents were asked to identify the percentage of pipes in their system that was within a given age. The age categories used were under 40 years of age, between 40 and 80 years of age, and over 80 years of age. The average age of pipes for water providers was 59% under 40 years of age; 36% between 40 and 80 years of age; and, 5% over 80 years of age. The average age of pipes for sewer providers was 58% under 40 years of age; 36% between 40 and 80 years of age; and, 7% over 80 years of age. More information is presented in the tables below.
Age of Pipes for Water Providers (N = 107) Under 40 years of
Age 40 to 80 Years of
Age Over 80 Years of
Age Mean 59% 36% 5% Median 50% 35% 0% Minimum 0% 0% 0% Maximum 100% 100% 65% 25th Percentile 30% 4% 0% 75th Percentile 96% 60% 10%
Age of Pipes for Sewer Providers (N = 94) Under 40 years of
Age 40 to 80 Years of
Age Over 80 Years of
Age Mean 58% 36% 6% Median 50% 31% 0% Minimum 0% 0% 0% Maximum 100% 100% 70% 25th Percentile 30% 0% 0% 75th Percentile 100% 60% 10%
49 GAO (2002). 50Louisville/Jefferson County Metropolitan Sewer District (n.d.) Inflow and Infiltration. Retrieved on August 11, 2008 http://www.msdlouky.org/programs/ii.htm
28
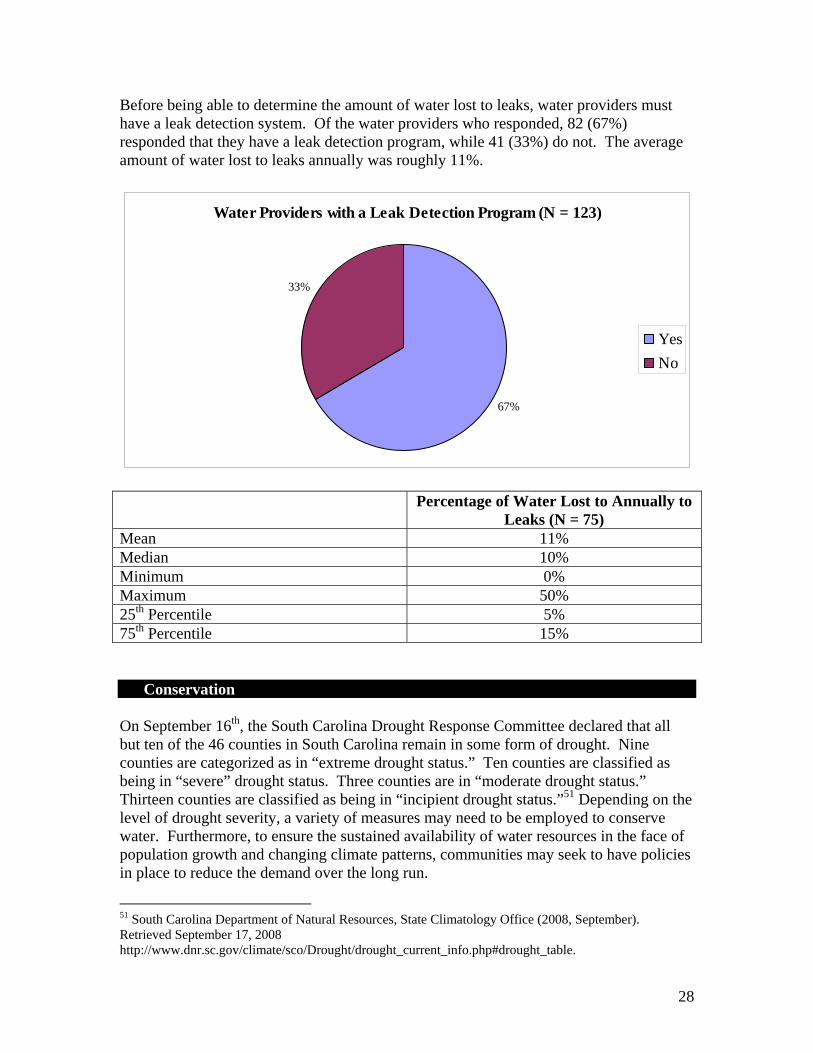
Before being able to determine the amount of water lost to leaks, water providers must have a leak detection system. Of the water providers who responded, 82 (67%) responded that they have a leak detection program, while 41 (33%) do not. The average amount of water lost to leaks annually was roughly 11%.
Water Providers with a Leak Detection Program (N = 123)
67%
33%
YesNo
Percentage of Water Lost to Annually to
Leaks (N = 75) Mean 11% Median 10% Minimum 0% Maximum 50% 25th Percentile 5% 75th Percentile 15% Conservation On September 16th, the South Carolina Drought Response Committee declared that all but ten of the 46 counties in South Carolina remain in some form of drought. Nine counties are categorized as in “extreme drought status.” Ten counties are classified as being in “severe” drought status. Three counties are in “moderate drought status.” Thirteen counties are classified as being in “incipient drought status.”51 Depending on the level of drought severity, a variety of measures may need to be employed to conserve water. Furthermore, to ensure the sustained availability of water resources in the face of population growth and changing climate patterns, communities may seek to have policies in place to reduce the demand over the long run.
51 South Carolina Department of Natural Resources, State Climatology Office (2008, September). Retrieved September 17, 2008 http://www.dnr.sc.gov/climate/sco/Drought/drought_current_info.php#drought_table.
29
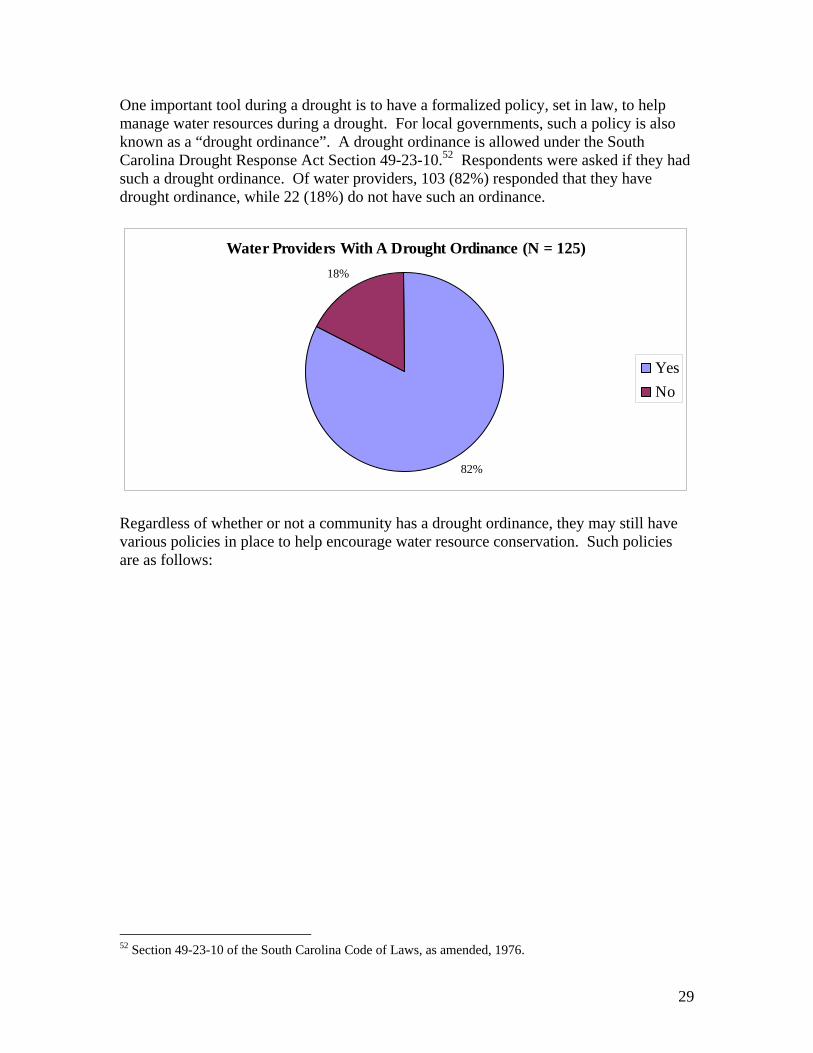
One important tool during a drought is to have a formalized policy, set in law, to help manage water resources during a drought. For local governments, such a policy is also known as a “drought ordinance”. A drought ordinance is allowed under the South Carolina Drought Response Act Section 49-23-10.52 Respondents were asked if they had such a drought ordinance. Of water providers, 103 (82%) responded that they have drought ordinance, while 22 (18%) do not have such an ordinance.
Water Providers With A Drought Ordinance (N = 125)
82%
18%
YesNo
Regardless of whether or not a community has a drought ordinance, they may still have various policies in place to help encourage water resource conservation. Such policies are as follows:
52 Section 49-23-10 of the South Carolina Code of Laws, as amended, 1976.
30
Water Provider Drought Practices (N = 126)
4%
29%
9%
55%
84%
4%
19%
9%
58%
0% 20% 40% 60% 80% 100%
Other
Theft Prevention
Land Use Restrictions
Mandatory Water Use Restrictions
Voluntary Water Use Restrictions
Mandate Low-Flow Devices
Encourage Low-Flow
Encourage Xeriscaping
Public Education
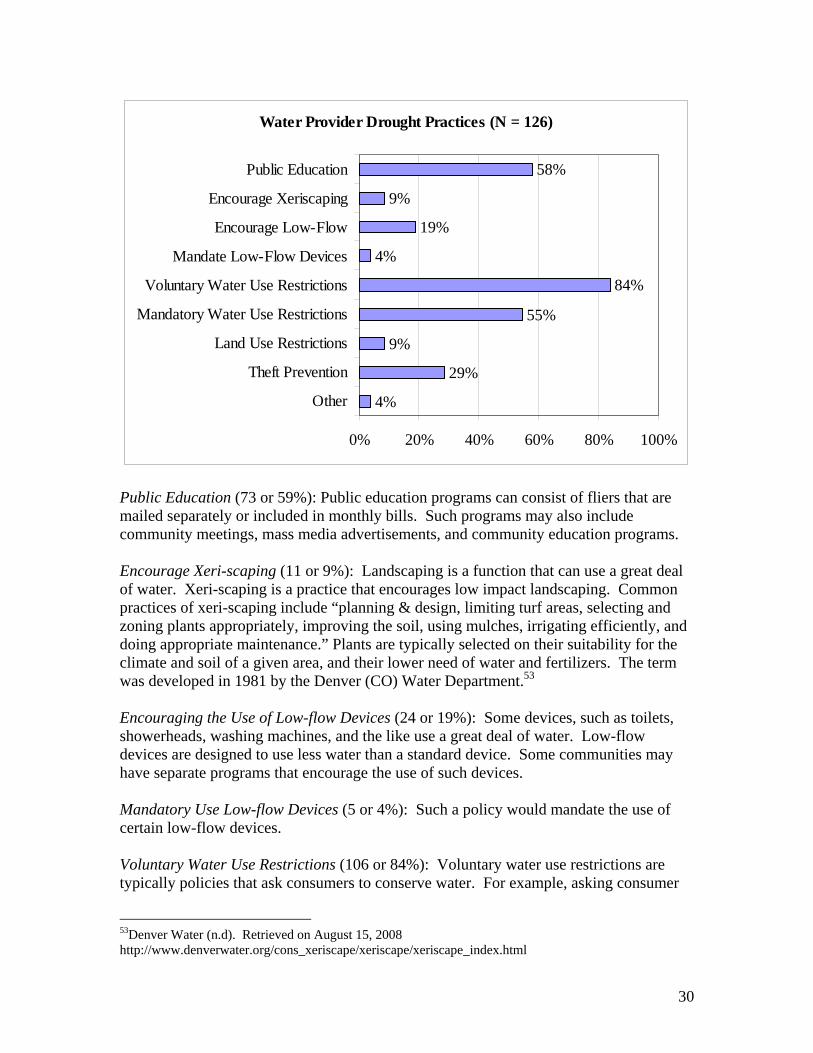
Public Education (73 or 59%): Public education programs can consist of fliers that are mailed separately or included in monthly bills. Such programs may also include community meetings, mass media advertisements, and community education programs. Encourage Xeri-scaping (11 or 9%): Landscaping is a function that can use a great deal of water. Xeri-scaping is a practice that encourages low impact landscaping. Common practices of xeri-scaping include “planning & design, limiting turf areas, selecting and zoning plants appropriately, improving the soil, using mulches, irrigating efficiently, and doing appropriate maintenance.” Plants are typically selected on their suitability for the climate and soil of a given area, and their lower need of water and fertilizers. The term was developed in 1981 by the Denver (CO) Water Department.53 Encouraging the Use of Low-flow Devices (24 or 19%): Some devices, such as toilets, showerheads, washing machines, and the like use a great deal of water. Low-flow devices are designed to use less water than a standard device. Some communities may have separate programs that encourage the use of such devices. Mandatory Use Low-flow Devices (5 or 4%): Such a policy would mandate the use of certain low-flow devices. Voluntary Water Use Restrictions (106 or 84%): Voluntary water use restrictions are typically policies that ask consumers to conserve water. For example, asking consumer
53Denver Water (n.d). Retrieved on August 15, 2008 http://www.denverwater.org/cons_xeriscape/xeriscape/xeriscape_index.html
31
to limit water usage by washing (or not washing) cars on given days, watering lawns on given days, or not to wash off sidewalks. Mandatory Water Use Restrictions (69 or 55%): Mandatory water use restrictions are typically policies that make voluntary water use restrictions required and enforceable. Penalties are limited by the South Carolina Drought Response Act (Section 49-23-10). Land-Use Restrictions (11 or 9%): Areas may choose to limit the setting of various entities that are more water intensive, perhaps golf courses or water parks. Other restrictions may be to restrict population growth in certain areas. Theft Prevention (36 or 29%): Theft prevention programs are designed to detect and punish those who illegally connect and withdraw water from the water system. Other (5 or 4%): Several entities listed additional practices conservation practices, and drought management practices. The City of Florence and the Lugoff-Elgin Water Authority both use the conservation pricing of water during a drought. Edgefield County Water and Sewer Authority listed their permit program for fire hydrants as a conservation measure. The Isle of Palms Water and Sewer Commission charges punitive rates. Conclusion Water and sewer service provision is an important issue in South Carolina, as well as the nation as a whole. Water and sewer infrastructure maintenance, improvement, and expansion appear to be an issue requiring large capital expenditures in the future. However, it is important to note that water and sewer service provision also meets community goals related to economic development, conservation, the environment, and public health. Thus, rates, fees, and practices must be harmonized so that financial sustainability and broad community goals can be achieved. The goal of the Institute for Public Service and Policy Research is not to render judgment on practices, rates, and fees, but to serve as a tool to provide basic information on water and sewer services in the state, as well as facilitate a dialogue on practices within water and sewer service.
South Carolina Water and Sewer Rate and Practice Survey Please save the completed survey on your computer. After completing the survey, please email your saved copy as a Microsoft Word attachment to Mark Bondo at [email protected]. Organization Name: Contact Information: Name: Address: Phone: Email: 1. What service(s) does your organization provide?
Water Only Sewer Only Water and Sewer
2. What best describes your organization’s service area?
Part of a city/county government A special purpose district A private company
3. Please list the areas to which your organization provides direct service. If applicable, please indicate whether some areas receive service, but at a different rate. These rates may be known as inside or outside rate.
Jurisdiction Inside Outside City of Columbia (Example)
X
Parts of Lexington County (Example)
X
4. How many active accounts do you have?

5. How many employees does your organization currently employ (Please include unfilled positions)?
Full-Time:
Part-Time:
6. Please check all account categories that you provide service to:
Water Sewer Residential Residential Commercial Commercial Industrial Industrial
7. What is the source of your water supply/discharge (Check all that apply)?
Water Sewer
Reservoir or Lake Reservoir or Lake River River Ground/Aquifer Ground/Aquifer Purchased from another water utility
(Please List) Discharge into another sewer utility (Please List)
8. What is the frequency of your billing cycle?
Water Sewer
Bimonthly Bimonthly Monthly Monthly Quarterly Quarterly
9. What payment options do you offer to customers (Check all that Apply)?
Water Sewer In Person/Drop Box In Person/Drop Box By Mail By Mail Online Online Auto Draft from Bank Account Auto Draft from Bank Account Alternate Locations (such as a
bank) Alternate Locations (such as a
bank)
10. What is your policy for dealing with delinquent bills (Please Explain)? 11. Does your organization charge a tap or connection fee for connecting new accounts to the system?
Water Sewer
Yes (Please provide a fee schedule for these tap fees)
Yes (Please provide a fee schedule for these tap fees)
No No 12. What is the basis for these tap fees?
Water Sewer A fixed amount A fixed amount Varies by meter size Varies by meter size Cost recovery Cost recovery Other (Please Explain):
Other (Please Explain):
13. Does your organization charge an impact fee for new connections to the system? Such an impact fee may also be known as a “system development charge” or a “capital recovery charge.”
Water Sewer Yes (Please provide a fee schedule for these impact fees)
Yes (Please provide a fee schedule for these impact fees)
No No 14. What is the basis for these impact fees?
Water Sewer Fixed fee Fixed fee Lot size Lot size Building size Building size Meter size Meter size Other (Please Explain):
Other (Please Explain):

15. Please check the statement that best defines your organization.
Water Sewer We charge a minimum, fixed, or base charge for customers that does not include water consumption
We charge a minimum, fixed or base charge, for customers that does not include sewer consumption
We charge a minimum, fixed, or base charge for customers that includes a set amount of water consumption
We charge a minimum, fixed or base charge, for customers that includes sewer consumption
• Please include a copy of your meter charge schedule. • Please include a copy of your rate schedule.
16. What would the bill be for a residential customer who consumes 1,000 cubic feet (7,480 gallons) of water a month?
INSIDE RATES
Water
$
Sewer
$
OUTSIDE RATE
Water
$
Sewer
$
Last year of rate change:
Water: Sewer: 17. If your organization is part of a city or county government, does revenue generated by rates and fees support programs in other government departments, unrelated to water service functions? (Please exclude payments relating to internal services provided by the city and county to the department; such as human resources, fleet maintenance, or information technology). Yes No
18. Does your organization have the authority to issue debt? Yes No 19. What percentage of the total length in pipe in the distribution is less than 40 years old, between 40 and 80 years old, and more than 80 years old (Totals 100%)?
Water Sewer
Less than 40 years old Less than 40 years old Between 40 and 80 years old Between 40 and 80 years old More than 80 years old More than 80 years old 20. Does your organization have a leak detection program? Yes No If yes, what is the percentage of water lost due to leaks in a year? % 21. Does your organization provide assistance to low-income households?
Yes No If yes, what types of assistance does your organization provide? (Please describe)
22. Does your organization charge a separate fee related to maintaining a fire protection system (such as an indoor sprinkler system)?
Yes (Please provide the rate schedule) No N/A
23. How are sewer rates determined?
Based on water usage Based on a percentage of water usage with a cap Flat rate Other N/A 24. Does your organization charge a fee for high strength discharges into the system to
industrial customers?
Yes No
Drought/Conservation Practices: 25. Does your organization have a drought ordinance?
Yes
No 26. Which of the following activities does your organization practice/encourage during a
drought (Please check all that apply):
Public Education Programs (Such as fliers, brochures, advertisements, meetings, etc)
Programs to encourage the use of low flow, water saving devices Programs to encourage xeriscaping or low impact landscaping Voluntary Water Use Restrictions Mandatory Water Use Restrictions
Mandated use of low flow, water saving devices Land Use Restrictions Water Theft Detection and Enforcement Program Other (Please Describe): Thank You for completing the survey. Please save the completed survey on your computer. After saving, please email your saved copy as a Microsoft Word attachment to Mark Bondo at [email protected].
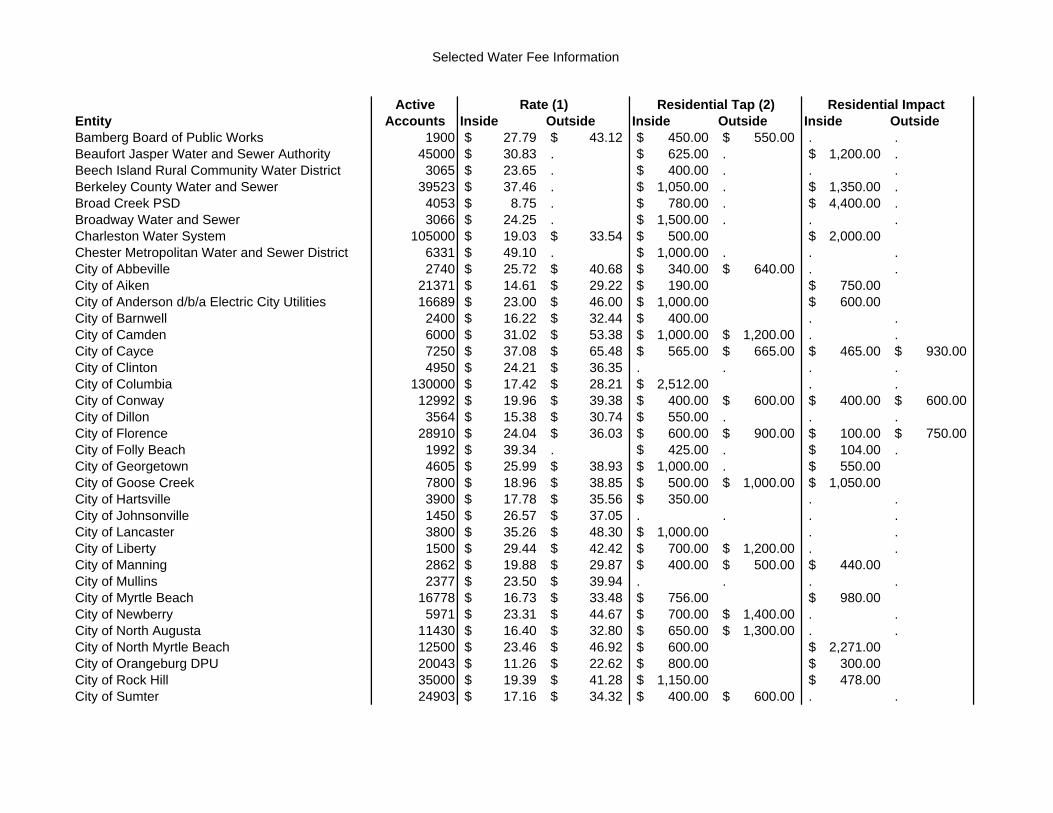
Selected Water Fee Information
Active Rate (1) Residential Tap (2) Residential Impact Entity Accounts Inside Outside Inside Outside Inside OutsideBamberg Board of Public Works 1900 27.79$ 43.12$ 450.00$ 550.00$ . .Beaufort Jasper Water and Sewer Authority 45000 30.83$ . 625.00$ . 1,200.00$ .Beech Island Rural Community Water District 3065 23.65$ . 400.00$ . . .Berkeley County Water and Sewer 39523 37.46$ . 1,050.00$ . 1,350.00$ .Broad Creek PSD 4053 8.75$ . 780.00$ . 4,400.00$ .Broadway Water and Sewer 3066 24.25$ . 1,500.00$ . . .Charleston Water System 105000 19.03$ 33.54$ 500.00$ 2,000.00$ Chester Metropolitan Water and Sewer District 6331 49.10$ . 1,000.00$ . . .City of Abbeville 2740 25.72$ 40.68$ 340.00$ 640.00$ . .City of Aiken 21371 14.61$ 29.22$ 190.00$ 750.00$ City of Anderson d/b/a Electric City Utilities 16689 23.00$ 46.00$ 1,000.00$ 600.00$ City of Barnwell 2400 16.22$ 32.44$ 400.00$ . .City of Camden 6000 31.02$ 53.38$ 1,000.00$ 1,200.00$ . .City of Cayce 7250 37.08$ 65.48$ 565.00$ 665.00$ 465.00$ 930.00$ City of Clinton 4950 24.21$ 36.35$ . . . .City of Columbia 130000 17.42$ 28.21$ 2,512.00$ . .City of Conway 12992 19.96$ 39.38$ 400.00$ 600.00$ 400.00$ 600.00$ City of Dillon 3564 15.38$ 30.74$ 550.00$ . . .City of Florence 28910 24.04$ 36.03$ 600.00$ 900.00$ 100.00$ 750.00$ City of Folly Beach 1992 39.34$ . 425.00$ . 104.00$ .City of Georgetown 4605 25.99$ 38.93$ 1,000.00$ . 550.00$ City of Goose Creek 7800 18.96$ 38.85$ 500.00$ 1,000.00$ 1,050.00$ City of Hartsville 3900 17.78$ 35.56$ 350.00$ . .City of Johnsonville 1450 26.57$ 37.05$ . . . .City of Lancaster 3800 35.26$ 48.30$ 1,000.00$ . .City of Liberty 1500 29.44$ 42.42$ 700.00$ 1,200.00$ . .City of Manning 2862 19.88$ 29.87$ 400.00$ 500.00$ 440.00$ City of Mullins 2377 23.50$ 39.94$ . . . .City of Myrtle Beach 16778 16.73$ 33.48$ 756.00$ 980.00$ City of Newberry 5971 23.31$ 44.67$ 700.00$ 1,400.00$ . .City of North Augusta 11430 16.40$ 32.80$ 650.00$ 1,300.00$ . .City of North Myrtle Beach 12500 23.46$ 46.92$ 600.00$ 2,271.00$ City of Orangeburg DPU 20043 11.26$ 22.62$ 800.00$ 300.00$ City of Rock Hill 35000 19.39$ 41.28$ 1,150.00$ 478.00$ City of Sumter 24903 17.16$ 34.32$ 400.00$ 600.00$ . .
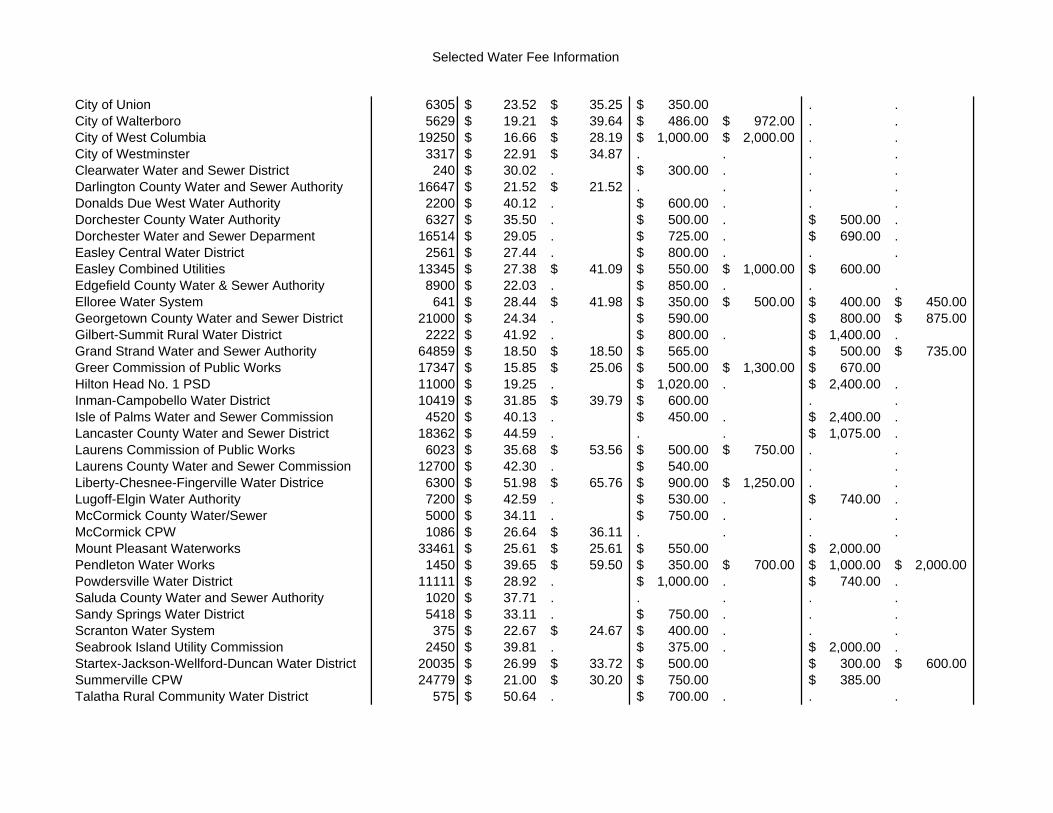
Selected Water Fee Information
City of Union 6305 23.52$ 35.25$ 350.00$ . .City of Walterboro 5629 19.21$ 39.64$ 486.00$ 972.00$ . .City of West Columbia 19250 16.66$ 28.19$ 1,000.00$ 2,000.00$ . .City of Westminster 3317 22.91$ 34.87$ . . . .Clearwater Water and Sewer District 240 30.02$ . 300.00$ . . .Darlington County Water and Sewer Authority 16647 21.52$ 21.52$ . . . .Donalds Due West Water Authority 2200 40.12$ . 600.00$ . . .Dorchester County Water Authority 6327 35.50$ . 500.00$ . 500.00$ .Dorchester Water and Sewer Deparment 16514 29.05$ . 725.00$ . 690.00$ .Easley Central Water District 2561 27.44$ . 800.00$ . . .Easley Combined Utilities 13345 27.38$ 41.09$ 550.00$ 1,000.00$ 600.00$ Edgefield County Water & Sewer Authority 8900 22.03$ . 850.00$ . . .Elloree Water System 641 28.44$ 41.98$ 350.00$ 500.00$ 400.00$ 450.00$ Georgetown County Water and Sewer District 21000 24.34$ . 590.00$ 800.00$ 875.00$ Gilbert-Summit Rural Water District 2222 41.92$ . 800.00$ . 1,400.00$ .Grand Strand Water and Sewer Authority 64859 18.50$ 18.50$ 565.00$ 500.00$ 735.00$ Greer Commission of Public Works 17347 15.85$ 25.06$ 500.00$ 1,300.00$ 670.00$ Hilton Head No. 1 PSD 11000 19.25$ . 1,020.00$ . 2,400.00$ .Inman-Campobello Water District 10419 31.85$ 39.79$ 600.00$ . .Isle of Palms Water and Sewer Commission 4520 40.13$ . 450.00$ . 2,400.00$ .Lancaster County Water and Sewer District 18362 44.59$ . . . 1,075.00$ .Laurens Commission of Public Works 6023 35.68$ 53.56$ 500.00$ 750.00$ . .Laurens County Water and Sewer Commission 12700 42.30$ . 540.00$ . .Liberty-Chesnee-Fingerville Water Districe 6300 51.98$ 65.76$ 900.00$ 1,250.00$ . .Lugoff-Elgin Water Authority 7200 42.59$ . 530.00$ . 740.00$ .McCormick County Water/Sewer 5000 34.11$ . 750.00$ . . .McCormick CPW 1086 26.64$ 36.11$ . . . .Mount Pleasant Waterworks 33461 25.61$ 25.61$ 550.00$ 2,000.00$ Pendleton Water Works 1450 39.65$ 59.50$ 350.00$ 700.00$ 1,000.00$ 2,000.00$ Powdersville Water District 11111 28.92$ . 1,000.00$ . 740.00$ .Saluda County Water and Sewer Authority 1020 37.71$ . . . . .Sandy Springs Water District 5418 33.11$ . 750.00$ . . .Scranton Water System 375 22.67$ 24.67$ 400.00$ . . .Seabrook Island Utility Commission 2450 39.81$ . 375.00$ . 2,000.00$ .Startex-Jackson-Wellford-Duncan Water District 20035 26.99$ 33.72$ 500.00$ 300.00$ 600.00$ Summerville CPW 24779 21.00$ 30.20$ 750.00$ 385.00$ Talatha Rural Community Water District 575 50.64$ . 700.00$ . . .
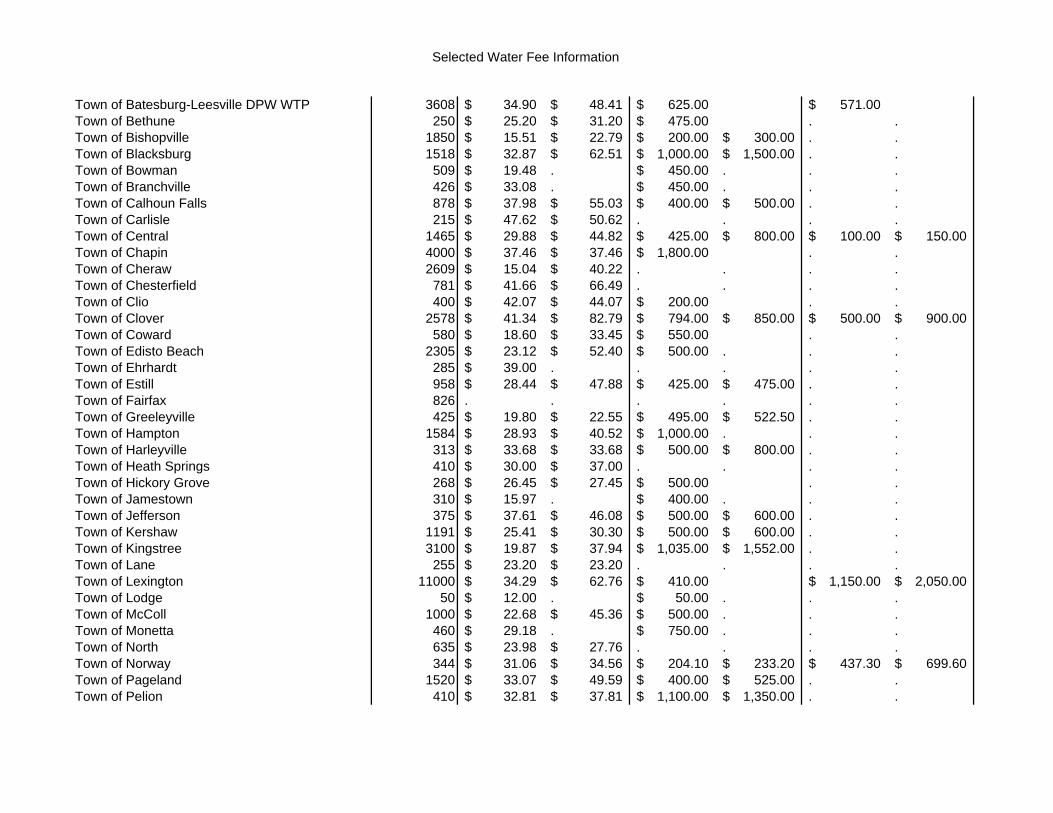
Selected Water Fee Information
Town of Batesburg-Leesville DPW WTP 3608 34.90$ 48.41$ 625.00$ 571.00$ Town of Bethune 250 25.20$ 31.20$ 475.00$ . .Town of Bishopville 1850 15.51$ 22.79$ 200.00$ 300.00$ . .Town of Blacksburg 1518 32.87$ 62.51$ 1,000.00$ 1,500.00$ . .Town of Bowman 509 19.48$ . 450.00$ . . .Town of Branchville 426 33.08$ . 450.00$ . . .Town of Calhoun Falls 878 37.98$ 55.03$ 400.00$ 500.00$ . .Town of Carlisle 215 47.62$ 50.62$ . . . .Town of Central 1465 29.88$ 44.82$ 425.00$ 800.00$ 100.00$ 150.00$ Town of Chapin 4000 37.46$ 37.46$ 1,800.00$ . .Town of Cheraw 2609 15.04$ 40.22$ . . . .Town of Chesterfield 781 41.66$ 66.49$ . . . .Town of Clio 400 42.07$ 44.07$ 200.00$ . .Town of Clover 2578 41.34$ 82.79$ 794.00$ 850.00$ 500.00$ 900.00$ Town of Coward 580 18.60$ 33.45$ 550.00$ . .Town of Edisto Beach 2305 23.12$ 52.40$ 500.00$ . . .Town of Ehrhardt 285 39.00$ . . . . .Town of Estill 958 28.44$ 47.88$ 425.00$ 475.00$ . .Town of Fairfax 826 . . . . . .Town of Greeleyville 425 19.80$ 22.55$ 495.00$ 522.50$ . .Town of Hampton 1584 28.93$ 40.52$ 1,000.00$ . . .Town of Harleyville 313 33.68$ 33.68$ 500.00$ 800.00$ . .Town of Heath Springs 410 30.00$ 37.00$ . . . .Town of Hickory Grove 268 26.45$ 27.45$ 500.00$ . .Town of Jamestown 310 15.97$ . 400.00$ . . .Town of Jefferson 375 37.61$ 46.08$ 500.00$ 600.00$ . .Town of Kershaw 1191 25.41$ 30.30$ 500.00$ 600.00$ . .Town of Kingstree 3100 19.87$ 37.94$ 1,035.00$ 1,552.00$ . .Town of Lane 255 23.20$ 23.20$ . . . .Town of Lexington 11000 34.29$ 62.76$ 410.00$ 1,150.00$ 2,050.00$ Town of Lodge 50 12.00$ . 50.00$ . . .Town of McColl 1000 22.68$ 45.36$ 500.00$ . . .Town of Monetta 460 29.18$ . 750.00$ . . .Town of North 635 23.98$ 27.76$ . . . .Town of Norway 344 31.06$ 34.56$ 204.10$ 233.20$ 437.30$ 699.60$ Town of Pageland 1520 33.07$ 49.59$ 400.00$ 525.00$ . .Town of Pelion 410 32.81$ 37.81$ 1,100.00$ 1,350.00$ . .
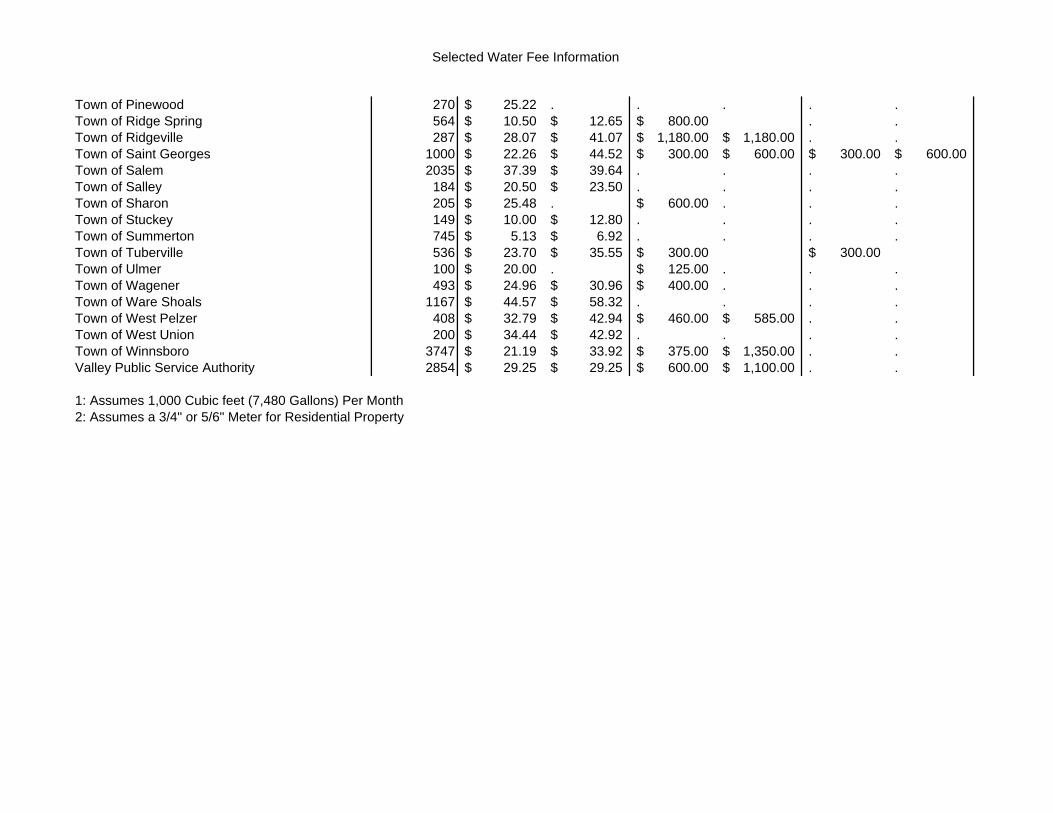
Selected Water Fee Information
Town of Pinewood 270 25.22$ . . . . .Town of Ridge Spring 564 10.50$ 12.65$ 800.00$ . .Town of Ridgeville 287 28.07$ 41.07$ 1,180.00$ 1,180.00$ . .Town of Saint Georges 1000 22.26$ 44.52$ 300.00$ 600.00$ 300.00$ 600.00$ Town of Salem 2035 37.39$ 39.64$ . . . .Town of Salley 184 20.50$ 23.50$ . . . .Town of Sharon 205 25.48$ . 600.00$ . . .Town of Stuckey 149 10.00$ 12.80$ . . . .Town of Summerton 745 5.13$ 6.92$ . . . .Town of Tuberville 536 23.70$ 35.55$ 300.00$ 300.00$ Town of Ulmer 100 20.00$ . 125.00$ . . .Town of Wagener 493 24.96$ 30.96$ 400.00$ . . .Town of Ware Shoals 1167 44.57$ 58.32$ . . . .Town of West Pelzer 408 32.79$ 42.94$ 460.00$ 585.00$ . .Town of West Union 200 34.44$ 42.92$ . . . .Town of Winnsboro 3747 21.19$ 33.92$ 375.00$ 1,350.00$ . .Valley Public Service Authority 2854 29.25$ 29.25$ 600.00$ 1,100.00$ . .
1: Assumes 1,000 Cubic feet (7,480 Gallons) Per Month2: Assumes a 3/4" or 5/6" Meter for Residential Property

Selected Sewer Fee Information
Active Rate (1) Residential Tap (2) Residential Impact Entity Accounts Inside Outside Inside Outside Inside OutsideAnderson County Wastewater Management 3880 39.70$ . 800.00$ . 1,000.00$ .Bamberg Board of Public Works 1900 37.16$ 53.80$ 400.00$ 500.00$ . .Beaufort Jasper Water and Sewer Authority 45000 45.00$ . . . 2,760.00$ .Berkeley County Water and Sewer 39523 44.00$ . 1,200.00$ . 2,500.00$ .Broad Creek PSD 4053 31.00$ . 1,550.00$ . 4,400.00$ .Broadway Water and Sewer 3066 34.40$ . . . . .Charleston Water System 105000 56.28$ 78.42$ 200.00$ 2,650.00$ Chester Metropolitan Water and Sewer District 6331 42.90$ . 1,000.00$ . . .City of Abbeville 2450 27.50$ 44.54$ 400.00$ 575.00$ . .City of Aiken 21371 25.11$ 50.22$ 500.00$ 400.00$ City of Anderson d/b/a Electric City Utilities 16689 29.87$ 59.74$ 1,000.00$ 600.00$ City of Barnwell 2400 16.22$ 32.44$ 500.00$ . .City of Camden 6000 29.70$ 35.13$ 1,200.00$ 1,800.00$ . .City of Cayce 9850 28.26$ 56.52$ 810.00$ 830.00$ 785.00$ 1,570.00$ City of Chesnee 532 37.92$ 53.27$ 400.00$ . .City of Clinton 4950 43.20$ 62.45$ . . . .City of Columbia 70000 30.32$ 54.57$ 1,300.00$ . 2,640.00$ 2,640.00$ City of Conway 12992 24.02$ 48.04$ 500.00$ 600.00$ 550.00$ 1,100.00$ City of Dillon 3564 28.01$ 56.02$ 550.00$ . . .City of Florence 18510 34.41$ 52.05$ 550.00$ 825.00$ 100.00$ 750.00$ City of Folly Beach 1992 56.93$ . 410.00$ . 2,094.00$ .City of Fountain Inn 3000 . . 500.00$ . . .City of Georgetown 4192 33.84$ 61.02$ 900.00$ . 850.00$ City of Hartsville 3900 24.32$ 48.64$ 395.00$ . .City of Johnsonville 1450 25.64$ 35.90$ . . . .City of Lancaster 3800 37.52$ 53.81$ 1,200.00$ . .City of Liberty 1500 44.86$ 58.70$ 1,100.00$ 1,600.00$ . .City of Manning 2862 24.37$ 42.75$ 400.00$ 500.00$ 440.00$ City of Mullins 2377 22.72$ 36.06$ . . . .City of Myrtle Beach 16778 19.91$ 39.83$ 2,867.00$ 1,272.00$ 1,908.00$ City of Newberry 5971 31.60$ 63.20$ 600.00$ 1,200.00$ . .City of North Augusta 10306 28.77$ 35.94$ 650.00$ 1,300.00$ . .City of North Myrtle Beach 12500 20.82$ 41.64$ 450.00$ 1,906.00$ City of Orangeburg DPU 10094 18.00$ 32.40$ 1,100.00$ 350.00$ City of Rock Hill 35000 34.80$ 48.80$ 1,460.00$ 850.00$

Selected Sewer Fee Information
City of Sumter 24903 26.26$ 52.52$ 400.00$ 600.00$ . .City of Union 5074 27.61$ 39.96$ 300.00$ . . .City of Walterboro 5629 25.31$ 47.72$ 311.00$ 622.00$ . .City of West Columbia 19520 9.78$ 16.02$ 1,000.00$ 2,000.00$ . .City of Westminster 3317 41.49$ 28.71$ 700.00$ 300.00$ City of Woodruff 1636 28.30$ . . . . .Clearwater Water and Sewer District 240 8.50$ . 300.00$ . . .Darlington County Water and Sewer Authority 16647 40.17$ 40.17$ . . . .Donalds Due West Water Authority 2200 . . 800.00$ . . .Dorchester County Water and Sewer Dept 16514 34.80$ . 1,145.00$ . 2,600.00$ .Easley Combined Utilities 9970 33.68$ 50.52$ 300.00$ 850.00$ 900.00$ Edgefield County Water & Sewer Authority 8900 26.23$ . 1,015.00$ . . .Elloree Water System 641 36.44$ 49.98$ 350.00$ 600.00$ 600.00$ 750.00$ Georgetown County Water and Sewer District 21000 30.70$ . . . 1,050.00$ 1,400.00$ Grand Strand Water and Sewer Authority 64859 21.99$ 21.99$ 750.00$ 1,100.00$ 1,365.00$ Greer Commission of Public Works 10244 35.78$ 49.91$ 500.00$ 650.00$ 670.00$ Hilton Head No. 1 PSD 11000 25.30$ . 1,200.00$ . 3,040.00$ .Inman-Campobello Water District 10419 30.00$ 45.00$ . . . .Isle of Palms Water and Sewer Commission 4520 50.92$ . 400.00$ . 2,500.00$ .James Island Public Service District 12779 34.75$ 34.75$ . . . .Kershaw County 1295 36.65$ . 750.00$ . 2,250.00$ .Lancaster County Water and Sewer District 8275 36.74$ . . . 1,350.00$ .Laurens Commission of Public Works 750 42.32$ . 500.00$ . 500.00$ 1,500.00$ Laurens County Water and Sewer Commission 6023 27.90$ 41.89$ 600.00$ . .McCormick County Water/Sewer 5000 51.91$ . 750.00$ . . .McCormick CPW 1086 26.50$ 38.91$ . . . .Metropolitan Sewer Sub-district . . . 600.00$ . 897.00$ .Mount Pleasant Waterworks 28584 34.37$ 34.37$ . . 4,500.00$ North Charleston Sewer District 27306 44.49$ . 1,250.00$ . . .Pendleton Water Works 1450 43.39$ 65.09$ 300.00$ 600.00$ 1,000.00$ 2,000.00$ Saluda County Water and Sewer Authority 1020 41.40$ . . . . .Seabrook Island Utility Commission 2450 34.10$ . 300.00$ . 2,000.00$ .Summerville CPW 24779 19.00$ 24.00$ 450.00$ 675.00$ 920.00$ Town of Batesburg-Leesville DPW WTP 3608 37.45$ 56.21$ 625.00$ 722.00$ Town of Bishopville 1850 18.48$ 27.76$ . . . .Town of Blacksburg 805 42.20$ 82.39$ 1,000.00$ 1,500.00$ . .Town of Bowman 509 21.98$ . 950.00$ . . .
Selected Sewer Fee Information
Town of Branchville 426 38.16$ . 450.00$ . . .Town of Calhoun Falls 841 31.03$ 42.30$ 450.00$ 550.00$ . .Town of Carlisle 215 45.62$ . . . . .Town of Central 1465 49.49$ 60.55$ 900.00$ 1,200.00$ 625.00$ 1,000.00$ Town of Chapin 4000 18.00$ 28.00$ 2,600.00$ 3,900.00$ . .Town of Cheraw 2609 16.30$ 36.30$ . . . .Town of Chesterfield 781 41.66$ 66.49$ . . . .Town of Clio 400 42.74$ 44.74$ 200.00$ . .Town of Clover 2578 40.97$ 82.02$ 550.00$ 600.00$ 550.00$ 1,000.00$ Town of Due West 349 23.37$ . 500.00$ . . .Town of Edisto Beach 2305 40.44$ . 2,500.00$ . . .Town of Ehrhardt 285 39.31$ . . . . .Town of Estill 958 30.34$ 44.56$ 300.00$ 450.00$ . .Town of Fairfax 826 . . . . . .Town of Great Falls 1000 25.70$ 58.31$ . . . .Town of Greeleyville 425 24.24$ 30.48$ . . . .Town of Hampton 1584 43.00$ . 1,000.00$ . 1,000.00$ .Town of Harleyville 313 54.86$ 54.86$ 850.00$ 1,500.00$ . .Town of Heath Springs 410 30.00$ 37.00$ . . . .Town of Hollywood 965 . . 500.00$ . 1,750.00$ .Town of Jefferson 375 28.21$ 34.56$ 500.00$ 600.00$ . .Town of Kershaw 1013 23.41$ 28.30$ 700.00$ 800.00$ . .Town of Kingstree 3100 22.54$ 29.89$ 1,035.00$ 1,552.00$ . .Town of Lexington 11000 39.09$ 47.65$ 324.00$ 1,900.00$ 3,700.00$ Town of Lyman 1340 28.78$ 38.20$ 1,200.00$ 2,400.00$ . .Town of McColl 1000 18.08$ 36.16$ 500.00$ . . .Town of North 635 17.89$ . . . . .Town of Norway 344 33.79$ 33.79$ 204.10$ 233.20$ 262.40$ 320.70$ Town of Pageland 1520 32.67$ 49.94$ 450.00$ 525.00$ . .Town of Pinewood 270 32.20$ . . . . .Town of Ridge Spring 564 16.00$ 20.80$ 800.00$ . .Town of Saint George 1000 37.15$ 74.30$ 500.00$ 1,000.00$ 500.00$ 1,000.00$ Town of Sharon 205 25.00$ . 600.00$ . . .Town of Summerton 745 7.70$ 10.67$ . . . .Town of Tuberville 536 30.44$ 45.66$ 300.00$ 300.00$ Town of Wagener 493 28.70$ 34.95$ 400.00$ . . .Town of Ware Shoals 1167 14.76$ 30.07$ . . . .
Selected Sewer Fee Information
Town of West Pelzer 408 32.58$ 45.23$ 635.00$ . .Town of West Union 200 . . . . . .Town of Winnsboro 2436 27.98$ 44.81$ 600.00$ 700.00$ . .Valley Public Service Authority 2854 22.10$ 22.10$ 450.00$ 1,000.00$ 400.00$ Wade Hampton Fire & Sewer District . . . . . . .
1: Assumes 1,000 Cubic feet (7,480 Gallons) Per Month2: Assumes a 4" Meter for Residential Property

Entity Name Contact Phone EmailAnderson County Wastewater Management Jerry Singleton 864-260-4023Bamberg Board of Public Works Will Martin 803-245-5128 [email protected] Jasper Water and Sewer Authority Libby Breland 843-987-9211 [email protected] Island Rural Community Water District Connie Freeman 803-827-1004 [email protected] County Water and Sewer Doug Tompkins 843-719-2337 [email protected] Creek PSD Russell Hildebrand 843-785-7582 [email protected] Water and Sewer Jerry Cox 864-225-3821 [email protected] Water System Karla Beard 843-727-6967 [email protected] Metropolitan Water and Sewer District Mike Medlia 803-385-5123 [email protected] of Abbeville R. Mark Hall 864-366-4518 [email protected] of Aiken Kimberly Abney 803-642-7640 [email protected] of Anderson d/b/a Electric City Utilities Margot Martin 864-231-2207 [email protected] of Barnwell John Zawacki 803-259-3266 [email protected] of Camden Mel Pearson 803-432-2421 [email protected] of Cayce Frank Robinson 803-796-9020 [email protected] of Chesnee Rebecca Hood 864-461-2225 [email protected] of Clinton Renee Morrow 864-833-2790 [email protected] of Columbia John Dooley 803-545-3400 [email protected] of Conway Michael Hardee 843-248-1780City of Dillon Janet Bethea 843-774-0040 [email protected] of Florence Thomas Chandler 843-665-3162 [email protected] of Folly Beach Belle Condon 843-588-2447 [email protected] of Fountain Inn Roger Case 864-409-3334 [email protected] of Georgetown Debra Bivens 843-545-4036 [email protected] of Goose Creek Michelle Soderberg 843-797-6220 [email protected] of Hartsville Renee Douglas 843-383-3017 [email protected] of Johnsonville Scott Tanner 843-386-2069 [email protected] of Lancaster Jim Wilson 803-289-1470 [email protected] of Liberty Gloria Turner 864-843-3177 [email protected] of Manning L. Rubin Hardy 803-435-8477 [email protected] of Mullins Holly Jackson 843-464-9583 [email protected] of Myrtle Beach Maria Baisden 843-918-1150 [email protected] of Newberry Marie Hickman 803-321-1007 [email protected] of North Augusta John Potter 803-441-4210 [email protected] of North Myrtle Beach Darwin Reed 843-280-5681 [email protected] of Orangeburg DPU Fred Boatwright 803-268-4001 [email protected]

City of Rock Hill Lori Thomas 803-329-7071 [email protected] of Sumter Candi Healon 803-774-3978 [email protected] of Union Walker Gallman 864-429-1727 [email protected] of Walterboro William Floyd 843-549-2548 [email protected] of West Columbia Jenny Cunningham 803-939-8600 [email protected] of Westminster David Smith 864-647-3232 [email protected] of Woodruff Kay Lawson 864-476-8154 [email protected] Water and Sewer District Marvin Herndon 803-593-3509 [email protected] County Water and Sewer Authority Brenda Rouse 843-393-8131 [email protected] Due West Water Authority Robert Gary 843-379-2226Dorchester County Water Authority Oscar Black 843-875-0140 [email protected] Water and Sewer Deparment Jackie Canaday 843-832-0062 [email protected] Central Water District Joe Bracken 864-639-2883 [email protected] Combined Utilities Ginnye Lusk 864-859-4013 [email protected] County Water & Sewer Authority Richard Shafer 803-627-3011 [email protected] Water System Larry McDowell 803-897-1066 [email protected] County Water and Sewer District Lorry Dickerson 843-237-9727 [email protected] Rural Water District Mark Forrester 803-892-5544 [email protected] Strand Water and Sewer Authority Rick King 843-443-8240 [email protected] Commission of Public Works Jerry Balding 864-848-5505 [email protected] Head No. 1 PSD Brian Cronin 843-681-5525 [email protected] Water District Sharon Hodge 864-472-2858 [email protected] of Palms Water and Sewer Commission Lynne Stonesifer 843-886-6148 [email protected] Island Public Service District Sarah Haig 843-795-9060 [email protected] County Russell Wright 803-425-1500 [email protected] County Water and Sewer District Stephen White 803-416-5257 [email protected] Commission of Public Works John Young 864-984-0481 [email protected] County Water and Sewer Commission Jeff Field 864-682-3250 [email protected] Water Districe Johnny Jackson 864-461-2231 [email protected] Water Authority Michael Hancock 803-438-2991 [email protected] County Water/Sewer Stacey Wilson 864-852-2807 [email protected] CPW David Kremwiede 864-852-2224 [email protected] Sewer Sub-district Joseph Thompson 864-277-4442 [email protected] Pleasant Waterworks Ed Pierce 843-971-7507 [email protected] Charleston Sewer District Mary Trussell 843-756-3072 [email protected] Water Works Richard Bork 864-646-9073 [email protected] Water District Dyke Spencer 864-269-5440 [email protected]

Saluda County Water and Sewer Authority Brian Burgess 864-445-9572 [email protected] Springs Water District Phillip Cahaly 864-646-7729 [email protected] Water System Kay Hop 843-389-2222Seabrook Island Utility Commission Joseph Hall 843-768-1360 [email protected] Water District 864-439-4423 [email protected] CPW Charles Cuzzell 843-875-8754 [email protected] Rural Community Water District Paul Johns 803-652-1381 [email protected] of Batesburg-Leesville DPW WTP Jimmy Boatwright 803-532-6410 [email protected] of Bethune Janice Hunter 843-334-6238Town of Bishopville Mike Deas 803-484-5948 [email protected] of Blacksburg Dell Bagwell 864-839-2332 [email protected] of Bowman 803-829-2666 [email protected] of Branchville Rhonda Thompson 803-274-8820 [email protected] of Calhoun Falls Donna Bell 864-418-8512 [email protected] of Carlisle Shannon McBride 864-427-1505 [email protected] of Central Phillip Mishoe 864-639-6381 [email protected] of Chapin Marge Lowe 803-345-2944 [email protected] of Cheraw Helen Funderburk 843-537-7283 [email protected] of Chesterfield David Huntley 843-326-9099 [email protected] of Clio 843-586-9426 [email protected] of Clover Judy Faulkner 803-222-9495 [email protected] of Coward Vivian Pate 843-389-2585Town of Due West 864-379-2385 [email protected] of Edisto Beach Bob Doub 843-869-2505Town of Ehrhardt Scott Neely 803-267-5335 [email protected] of Estill Danny Lucas 803-625-3243 [email protected] of Fairfax Pamela Flowers 803-632-3111 [email protected] of Great Falls Julie Blacknell 803-482-2055 [email protected] of Greeleyville Virginia Moore 843-426-2111 [email protected] of Hampton W.C. Hudson 803-943-2951 [email protected] of Harleyville Amanda Childers 843-462-7676 [email protected] of Heath Springs 803-273-2066Town of Hickory Grove Don Rhodes 803-925-2625 [email protected] of Hollywood Niema Gantt-Brown 843-889-3222 [email protected] of Jamestown Chris Pipkin 843-252-2233Town of Jefferson Dianne Kirkley 843-658-7600 [email protected] of Kershaw Tony Starnes 803-475-6065
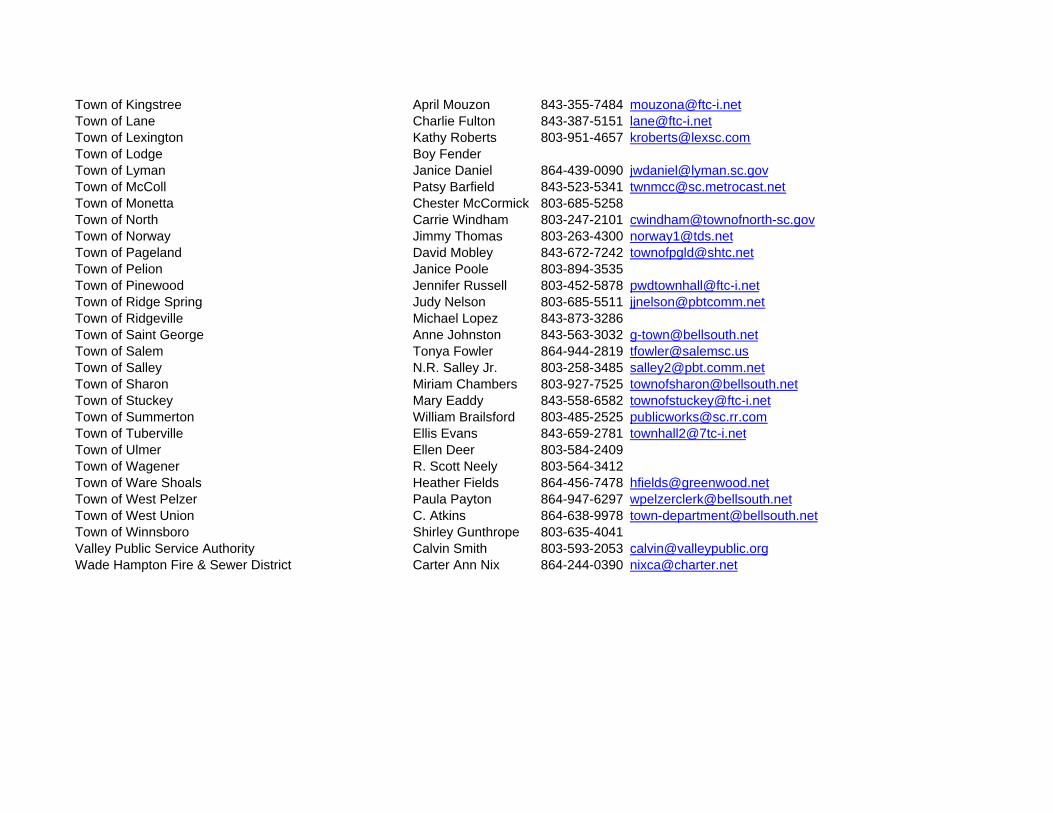
Town of Kingstree April Mouzon 843-355-7484 [email protected] of Lane Charlie Fulton 843-387-5151 [email protected] of Lexington Kathy Roberts 803-951-4657 [email protected] of Lodge Boy FenderTown of Lyman Janice Daniel 864-439-0090 [email protected] of McColl Patsy Barfield 843-523-5341 [email protected] of Monetta Chester McCormick 803-685-5258Town of North Carrie Windham 803-247-2101 [email protected] of Norway Jimmy Thomas 803-263-4300 [email protected] of Pageland David Mobley 843-672-7242 [email protected] of Pelion Janice Poole 803-894-3535Town of Pinewood Jennifer Russell 803-452-5878 [email protected] of Ridge Spring Judy Nelson 803-685-5511 [email protected] of Ridgeville Michael Lopez 843-873-3286Town of Saint George Anne Johnston 843-563-3032 [email protected] of Salem Tonya Fowler 864-944-2819 [email protected] of Salley N.R. Salley Jr. 803-258-3485 [email protected] of Sharon Miriam Chambers 803-927-7525 [email protected] of Stuckey Mary Eaddy 843-558-6582 [email protected] of Summerton William Brailsford 803-485-2525 [email protected] of Tuberville Ellis Evans 843-659-2781 [email protected] of Ulmer Ellen Deer 803-584-2409Town of Wagener R. Scott Neely 803-564-3412Town of Ware Shoals Heather Fields 864-456-7478 [email protected] of West Pelzer Paula Payton 864-947-6297 [email protected] of West Union C. Atkins 864-638-9978 [email protected] of Winnsboro Shirley Gunthrope 803-635-4041Valley Public Service Authority Calvin Smith 803-593-2053 [email protected] Hampton Fire & Sewer District Carter Ann Nix 864-244-0390 [email protected]


![Sewer Processes and Design - SKYSCRAPERS · 2018-09-02 · SANITARY SEWER SYSTEM [Foul Sewer] I. Storm Sewer System STORM SEWER is designed to drain excess rainfall and groundwater](https://static.fdocuments.in/doc/165x107/5e9b180035942256b30ec806/sewer-processes-and-design-skyscrapers-2018-09-02-sanitary-sewer-system-foul.jpg)