An Analysis of New Performance Metrics in the NBA and …thesis.honors.olemiss.edu/137/1/Dan Rust...
29
1 An Analysis of New Performance Metrics in the NBA and Their Effects on Win Production and Salary By Daniel McGehee Rust A thesis submitted to the faculty of the University of Mississippi in partial fulfillment of the requirements of the Sally McDonnell Barksdale Honors College Oxford May 2014 Approved By: ___________________________ Advisor: Dr. Joshua Hendrickson ____________________________ Reader: Dr. Carl Kitchens ____________________________ Reader: Dr. Tony Ammeter
Transcript of An Analysis of New Performance Metrics in the NBA and …thesis.honors.olemiss.edu/137/1/Dan Rust...

1
An Analysis of New Performance Metrics in the NBA and Their Effects on Win Production and Salary
By Daniel McGehee Rust
A thesis submitted to the faculty of the University of Mississippi in partial fulfillment of the requirements of the Sally McDonnell Barksdale Honors College
Oxford May 2014
Approved By:
___________________________ Advisor: Dr. Joshua Hendrickson
____________________________ Reader: Dr. Carl Kitchens
____________________________ Reader: Dr. Tony Ammeter

2
© 2014 Daniel McGehee Rust
ALL RIGHTS RESERVED

3
This thesis is dedicated to my mother, Rebecca Rust, who has always inspired me to pursue perfection, and has given me more support than I’ve deserved throughout my life. It is also dedicated to my father, Kevin Rust, who taught me to be more inquisitive and curious about the world in which we live. It is dedicated to my brother, William Rust, and sister, Kathryn Rust, both of whom have helped mold me into the person I am today.

4
ACKNOWLEDGEMENTS
I would like to express my deepest gratitude to my advisor, Dr. Josh Hendrickson, for his unwavering support and patience with this project. He helped guide and shape this thesis and none of it would have been possible without him. I would also like to thank my readers, Dr. Carl Kitchens and Dr. Tony Ammeter, for their valuable contributions, and also for participating in the defense of my thesis. The Sally McDonnell Barksdale Honors College also receives my deepest thanks for allowing me to pursue and research a topic about which I am very passionate, and also for providing me with a truly first rate academic experience throughout my time on campus. I would also like to thank Synergy Sports Technology for providing their truly revolutionary basketball statistics.
5
ABSTRACT An Analysis of New Performance Metrics in the NBA and Their Effects on Win
Production and Salary
In this study I perform statistical analysis on new metrics in the NBA
designed to expose information about the inputs of basketball production. These input
data were collected manually for every NBA player in the 2012-13 season, along with
common advanced statistics. With these new metrics regression analysis is used to
separately determine their effects on existing win production metrics and salary. In
this analysis I control for team and position effects. Once these effects were
determined, I was able to compare them and look for specific skills or strategies that
may be undervalued or overvalued by NBA teams relative to their impact on
producing wins. Offensive rebounding (ORB%) and usage rate (USG%) are found to
be undervalued and overvalued, respectively. Teams generally allocated salary
consistent with the effects identified by the input data from Synergy. Nonetheless
further study, chiefly expanding the sample and controlling for individual
heterogeneity among players, needs to be conducted.

6
TABLE OF CONTENTS
LIST OF TABLES AND FIGURES……………………………………….. vii
LIST OF ABBREVIATIONS………………………………………...……. viii
INTRODUCTION………………………………………………………….. 1
INSIGHT INTO ADVANCED METRICS IN BASKETBALL………...… 5
METHODS AND REGRESSION MODEL……….…………………...….. 8
RESULTS………………………………………………………………….. 10
CONCLUSION…………………………………………………………….. 12
BIBLIOGRAPHY………………………………………………………….. 16
APPENDIX………………………………………………………………… A-1

7
LIST OF TABLES AND FIGURES
TABLE 1 REGRESSION TEST WITH INPUT EFFECTS ON WS………… A-1
TABLE 2 REGRESSION TEST WITH INPUT EFFECTS ON WP………… A-2
TABLE 3 REGRESSION TEST WITH INPUT EFFECTS ON SALARY….. A-3
TABLE 4 COMPARING EFFECTS ON WS, WP, AND SALARY………… A-4
TABLE 5 MEAN SYNERGY SPORTS DATA…………………………….... A-5

8
LIST OF ABBREVIATIONS
WS Win Shares
WP Wins Produced
TS% True Shooting Percentage
eFG% Effective Field Goal Percentage
ORB% Offensive Rebound Percentage
DRB% Defensive Rebound Percentage
AST% Assist Percentage
STL% Steal Percentage
BLK% Block Percentage
TOV% Turnover Percentage
USG% Usage Percentage
ORtg Offensive Rating per 100 possessions
DRtg Defensive Rating per 100 possessions
9
Introduction
This purpose of this study is to use new statistics produced by Synergy Sports
Technology, commonly used by NBA front offices, to determine if some metrics
created to discover how many wins an NBA player is worth to his team fall short of
accurately portraying what goes on during a game. More importantly, I want to see
how these new statistics correlate with salary, and see if there are any specific skill
sets or strategies NBA front offices may be under or overvaluing.
Two common metrics that measure a player’s value in terms of how many
wins he contributes to his team are used in this study. The first, Wins Produced (WP),
created by economists David J. Berri and Martin B. Schmidt, was one of the first
metrics that claimed to pinpoint exactly how many wins a player was worth to his
team. A measure of this type should have become a cornerstone of advanced metrics
in basketball, many discussions of player value in baseball now begin and end with
the well-established Wins Above Replacement metric. But while Berri and Schmidt
created a model that accurately determined the relationship between traditional box
score stats (such as Points, Rebounds, Assists and Turnovers) and winning
percentage, they were limited by the lack of information inherent in box scores. NBA
teams now understand that these traditional stats fail to capture all of a player’s
contributions on the court. Daryl Morey, general manager of the Houston Rockets,
famously once said, “Someone created the box score, and he should be shot.”1
1 Michael Lewis, “The No-Stats All-Star.” New York Times Magazine. February 13, 2009.

10
Another metric that tries to determine how many wins a player contributes to
his team is Win Shares (WS) developed by Jason Kubatko for the website Basketball-
Reference.com. Kubatko’s metric is founded on the same principles as a similar
metric that Bill James created for use in baseball. Win Shares is split into two
categories, offensive and defensive, and attempts to define a player’s value by how
many points the player produces or gives up relative to league average. This metric
has a distinct advantage over Wins Produced in that it accounts for possessions, or
how many times within a game a team has the opportunity to score, now established
as a foundation of analysis in the sport.
NBA teams have dramatically increased their focus on analytics over the past
decade. Encouraged by the success of the Oakland Athletics in Major League
Baseball and their “Moneyball” approach, teams in professional sports leagues
throughout the world started investing in analytics and trying to discover a similar
edge. Increasing the amount of information available is crucial, and in this regard the
NBA has been one of the most proactive leagues. NBA analytics personnel use vast
amounts of data that isn’t available to the public, and have been able to adopt much
better metrics as a result. However, teams were still frustrated by the amount of the
game they were unable to quantify. To address the growing need for new information
the NBA outfitted every one of its stadiums with a data collection system called
SportVU. This system uses optical tracking, through six small cameras placed in the
rafters of the arena, to record data about player and ball location throughout the
course of a game. Everything from how fast a player runs to how many times he
dribbles or passes is recorded. The sample size for this data needs time to grow, but

11
experts have already begun making interesting discoveries from these massive
datasets.2
The new performance statistics used in this study are provided by Synergy
Sports Technology. These statistics are only partially available to the public, but
teams have access to more data and are able to retrieve it much more effectively.
However, Synergy’s fan database provides some information about the inputs of
basketball production, in that they describe types of plays, or actions, NBA and
NCAA teams use to score. The objective goal of any team in a basketball game is to
score on offense and prevent the other team from scoring on defense. Knowing the
input values for scoring, and the probability that a player will score on a specific type
of play, could potentially allow teams to find the marginal products of individual
players. This makes Synergy’s data unique, and yields a distinct advantage over
measuring simple outputs of production such as traditional box score stats. Output
data recorded in the traditional box score and advanced box score data can still be
useful, if applied in the right way, but teams need to augment this limited
information. Teams can potentially use these inputs to better allocate their salary cap
however, if they understand how these inputs impact expected wins.
Synergy analyzes NBA and NCAA game film to determine which specific
plays, or actions, on the court yield points. They do this for offense and defense at
both the team and player levels. Synergy breaks offensive plays into eleven categories
(such as Isolation, Transition, or Post-Up) and defensive plays into seven categories
(the same as offensive, excluding four of those categories). For example, if you 2 Dan Cervone, Alexander D’Amour, Luke Bornn, and Kirk Goldsberry. “Pointwise: Predicting Points and Valuing Decisions in Real Time with NBA Optical Tracking Data.” 2014. Presented at Sloan Sports Analytics Conference.

12
wanted to know a player’s field goal percentage or points per play on post ups,
Synergy’s database could give us that exact number. This data could also be crucial in
potentially quantifying coaching and schemes.
Analyzing win production for players is critical in the sports world because
these teams and clubs may be unique in that they seek to optimize wins rather than
profits3. The findings are not concrete, and some economists believe these two may
be related. There are certainly examples of teams that take cost-cutting measures to
ensure larger profits, but generally accumulating wins leads to more long-term
viability for teams rather than accumulating profits. A reason for this could be that
these individual firms operate within and are dependent upon the leagues or
associations to which they belong. Teams are allowed to make their own hires and are
responsible for filling their stadiums, but the leagues regulate many of the business
practices. Most professional sports leagues can be described as cartels that seek to
maximize joint profits, and this is precisely why leagues disperse revenue from TV
deals according to market share and engage in other common practices to promote
equity among their teams. The structure and stability a league provides allow teams to
covet winning over profits. Ultimately, wins help fill the seats, attract better players,
and make for a better overall product that these teams sell to the consumer.
3 Stefan Szymanski and Pedro Garcia del Barro, “Goal! Profit Maximization and Win Maximization in Football Leagues.” 2006. Paper presented by International Association of Sports Economists.

13
Insight into Advanced Metrics in Basketball
Advanced metrics or analytics, as in-depth statistical analysis in sports has
come to be known, have taken huge strides in the last twenty years. Bill James is
often cited as one of the pioneers of analytics in baseball, and his Baseball Abstracts
inspired experts to apply this type of thinking to other sports. James spent years
creating new statistics and constructing models in order to better understand a game
that was being misrepresented by traditional statistics; and this was well before any of
his methods became accepted practices in MLB front offices. This was a decided
advantage for baseball over other sports, in that analysts like Bill James had ample
time to correct mistakes and improve methods before demand for this type of work
soared. In other sports the need for advanced metrics came on much more rapidly.
Basketball can be a difficult sport to analyze. A sport such as baseball can
essentially be broken down into a series of one on one interactions and teammates do
very little to affect the outcomes of those situations. The effects they do have are
small and easily quantifiable (i.e. runners on base). In basketball, teammates
contribute a great deal to what happens throughout the course of a game, and their
impact can be hard to discern quantitatively. Consider a player such as J.J. Redick
who was traded to the Los Angeles Clippers over the summer. Redick saw his output
improve because he plays with a premier point guard, Chris Paul, and a top power
forward, Blake Griffin. Redick benefits by having a great point guard throw accurate
passes to him, which allows him to take a shot faster and with less difficulty, and also
because opposing defenses concentrate so much of their efforts defending the duo of
14
Chris Paul and Blake Griffin. As a result, his effective field goal percentage (eFG%)
and true shooting percentage (TS%), both advanced stats that weight field goal
percentage for three point attempts and free throws, have risen this season by 1.8%
and 2.7% respectively. So this represents our dilemma, how much of this is due to
playing with great teammates and how much is due to increased individual
performance?
The Redick example of why applying statistical analysis to basketball is
difficult. One area where basketball is especially difficult to quantify is on defense.
Traditional stats like steals and blocks give us some information about how a player
performs defensively, but these are a relatively rare occurrences in a game and
defense is as much about forcing teams to take bad shots as it is taking shots away
from them. The NBA understands that this lack of quantitative information to
evaluate defense poses a problem. As I stated earlier, this one they’re trying to
address with the implementation of systems like SportVU. Plus-minus statistics are
some of the only tools available to the general public for analysts to use to determine
defensive value. However, those are simple tallies of a team’s point differential while
a specific player is on the court. These statistics make it difficult to know just how
much the specific player contributes to this differential. Statistical methods have been
applied to these stats to help tease out individual offensive and defensive value.
Advanced Statistical Plus Minus4 developed by Daniel Myers does this effectively,
and ESPN also just released data on a new metric they’ve created that performs
similarly called Real Plus Minus.5
4 Daniel Myers, “ASPM and VORP.” GodismyJudgeOK.com. 5 Steve Ilardi, “The Next Big Thing: Real Plus Minus.” ESPN.com. April 7, 2014

15
Despite the hindrances I’ve discussed, our understanding of the game of
basketball has increased greatly thanks to the advancement of analytics. The corner
three was discovered to be one of the more valuable shots in the NBA because of its
reduced distance from the goal, and because it offers teams optimal spacing on the
floor to run sets. Midrange shots have been found to be less valuable because they
typically fall at lower rates than closer shots, but without the benefit of the extra point
that a shot from an extra few feet away provides. Teams have recognized these facts
and have managed their rosters accordingly.6
6 Kirk Goldsberry, “CourtVision: How the Spurs and Heat Use the Most Important Shot in Basketball.” Grantland.com. June 5, 2013.

16
Methods and Regression Model
In order to perform this study I collected data from Synergy’s online database
for the 2012-13 NBA season. For each player in the NBA during this season I
compiled points per play in every offensive and defensive category, along with total
number and percentage of plays used7. The sample size for this study is 524 players,
and I collected rosters from Basketball-Reference.com, which includes all players
activated for a team throughout the season, and this means that players on 10-day
contracts or called up from the NBA Development League are included as well. In
addition, to simplify things I treat players traded during the season as separate
players, which was crucial in order to control for team effects. I also collected
advanced statistics, including the Win Shares metric, for the 2012-13 season from
Basketball-Reference.com8. The Wins Produced data comes from
BoxScoreGeeks.com and the model from Berri’s and Schmidt’s website
WagesofWins.com as well as their two books, The Wages of Wins and Stumbling on
Wins. Figures for player salary for the 2012-13 season comes from the website
ShamSports.com.
The next step is using multiple linear regression analysis to determine if
there’s a relationship between these win production metrics and the Synergy data. I
expect there should be, since as I stated previously the win production metrics use
7 The term “used” has a specific application in basketball analysis, as a used possession is one that ends in a FGA, FT, TO, or ORB. Synergy catalogues plays instead of possessions, and they define a used play as one that ends in a FGA, FT, or TO; they exclude ORB because it is listed as one of these plays. 8 Basketball Reference calculates the advanced stats I used for the study and they consist of eFG%, TS%, ORB%, DRB%, AST%, STL%, BLK%, TOV%, USG%, ORtg, and DRtg.

17
output data which still serves as a useful proxy for the input skills Synergy records. I
also apply the multiple linear regression method to determine if there’s a correlation
between the Synergy statistics and salary. Given these estimates, I can then compare
whether the skills with the largest marginal product are also the most important
determinant of salaries.
I used the standard ordinary least squares regression function to define this
relationship and performed the analysis using R statistical software.
Y = β0 + β1x1 + … + βpxp + ε
The regression is estimated using WP, WS, and salary as separate dependent
variables. The independent variables (x1, xp) are the Synergy statistics, advanced
statistics, height, and dummy variables for teams, β0 is an intercept term, and ε is an
error term. Thus, in this model we can determine the effects each of these
independent variables has on WP, WS, and salary. Salary is measured per $100,000,
and the inputs are measured in terms of total points per 100 plays.
Crucially, in the final step I compared the effects of these statistics on win
production and salary to determine if there may be specific input skills that are
undervalued or overvalued in the NBA. I compared only the significant independent
variables, minimum 10% significance level, from each test.

18
Results
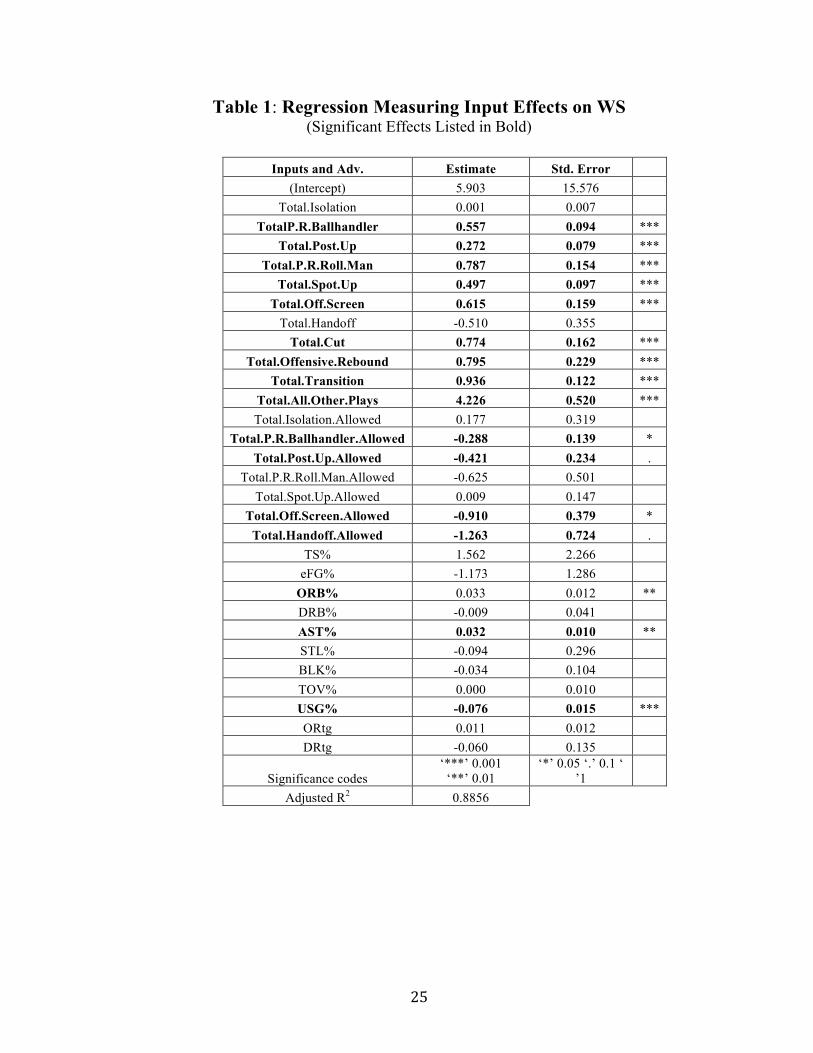
In the first regression, full results in Table 1, I examine the effects of the input
data on WS. Thirteen of the input categories have significant effects on WS. Points
scored on All Other Plays has the largest positive effect, with a marginal effect of
4.226. This is more than four times the effect of any other input category. All of the
offensive input categories Synergy defines have positive effects of WS, and all of the
defensive categories have negative effects on WS. This gives us more evidence that
these inputs explain WS with some accuracy. Points allowed on Handoffs has the
largest negative effect, with a marginal effect of -1.263. The adjusted R2 value for this
model is 0.89.
In the second regression, full results in Table 2, I examine the effects of input
data on WP. Of the eighteen input categories, nine have significant effects. Points
scored on All Other Plays has the largest positive effect on WP, with a marginal
effect of 5.353. This effect is not as large relative to the other offensive input
categories as it is for WS. Points scored on Post-Ups is the only offensive input
category with a negative impact on WP, one of -0.229. Other than points on Post-Ups,
all other offensive input categories have positive effects on WP. All of the defensive
categories have a negative effect on WP. Points allowed on Post Ups has the largest
negative effect, with a marginal effect of -1.427. The adjusted R2 value for this model
is 0.74.
With the third regression, full results in Table 3, I determine the effects of
input data on player salary. Nine of the input categories have significant effects on

19
salary, with points scored on All Other Plays having the largest, with a marginal
effect of 58.296. The offensive input categories all have positive marginal effects on
salary, and all of the defensive input categories have negative marginal effects on
salary. Points allowed on post ups has the largest negative effect, with a value of -
17.09. The adjusted R2 value for this model is 0.47.
To evaluate how effectively NBA teams are spending relative to these inputs I
compare the effects of these measures between WS, WP, and salary; the full results
can be found in Table 4. I also include the advanced stats in this comparison to
determine if any of these are misrepresented in salary relative to their impact on win
production. There are 13 variables with significant effects on salary and 9 of those
also have significant effects on WS and WP. Points allowed on post ups and points
allowed on pick and rolls where the ball handler shoots both have negative effects on
all dependent variables. USG% has a positive correlation with salary, while
negatively affecting both WS and WP. ORB% has a negative effect on salary, but
correlates positively with WS and WP.

20
Conclusion
First, in interpreting these results I need to reiterate that this study is only
performed for one season, so the sample size is relatively small and single season
anomalies such as injuries can have an impact. Now, the high adjusted R2 values for
regressions with WP and WS demonstrate that these input variables are correlated
with these win productions metrics, as I suspected they would be. Generally, the
points allowed categories also had negative effects on WP and WS. This makes sense
intuitively, as giving up more points tends to reduce wins a player produces.
To my surprise, points from All Other Plays consistently has relatively large
effects on WS and WP. Originally, I was very dubious of this result, because “All
Other Plays” is the most loosely defined category in Synergy’s database, and I’m not
even sure of all the play types they consider to be in this category. These values are
also consistently low relative to other Synergy data. The mean points per play for All
Other Plays is only 0.35, much smaller than means in other categories, and on
average these plays only occurs 7% of the time. However, there are certainly other
possibilities. This All Other Plays category could capture shots that come after a play
has broken down and a player is forced to improvise. If this is the case, then All Other
Plays should definitely correlate well to WS, WP, and salary because this measure
could capture a player’s ability to create his own shot and score in unlikely
circumstances, decidedly valuable attributes. Further study needs to be completed in
order to discern what types of plays fall in this category, and how it affects win
production overall.

21
Another intriguing discovery in this study is that ORB% is undervalued by the
NBA relative to its impact on win production. Generating offensive rebounds can
lead to shots close to the rim or open looks on the perimeter as a result of the defense
scrambling to get back into position, and this is why players convert on these plays at
a relatively high rate compared to other input categories Synergy defines. I’ve often
suspected that this would be an undervalued attribute, and this study provides some
evidence of that. Typically, offensive rebounds are grabbed by larger post players,
and players who hustle and venture into areas they may not naturally be within the
offense. Some coaches also place less value on offensive rebounds because they
would rather have players in better position to defend in transition. Synergy’s data
could shed much more light on this subject because it allows us to compare how
effective these two plays are and the impact they have on producing wins, and this
could help coaches choose the optimal strategy.
Two of the three significant defensive categories Synergy records have
negative effects on WS, WP, and salary; and this tells us that teams recognize the
effects of bad defense in these areas and allocate their salary accordingly. It is
interesting to note that points given up on pick and roll plays where the screener takes
the shot has a relatively large positive effect on salary. Unfortunately, this category
does not have a significant relationship with WS and WP, so we can’t be sure how it
affects these dependent variables. This could be that players who give up more of
these types of points are simply on the court longer and provide for their teams in
other areas and are compensated thusly.

22
Generally teams are spending efficiently when it comes to offense. They
recognize the impacts of scoring in areas like spot-up plays, post-ups, and points from
cuts within the offense. It is surprising however that points from post-ups have
positive effects on salary and WS, but negatively correlate with WP. I cannot speak as
to why this is the case, but simply recommend that further study should be conducted
for this category.
Usage rate (USG%) also provided an intriguing result in this study. Usage rate
is the amount of possessions a player “uses” in a game. Therefore, players at the focal
point of offenses, i.e. point guards, Kevin Durant, LeBron James, typically have high
usage rates. USG% corresponds positively with salary, and this result is not surprising
because increasing usage rate means a player is taking more of his team’s shots.
Therefore teams feel they must compensate these players more heavily. USG% has a
negative effect on WS and WP however, and this is because simply taking more shots
usually means players become less efficient and take away better shots from
teammates. On bad teams this may not be the case because the efficient scoring
options are scarce. Also this result could be evidence of bad teams, ostensibly
producing less wins, relying too heavily on a few players and eschewing healthy and
efficient shot distributions.
Ultimately the results of this study are not entirely conclusive, and more tests
need to be conducted to better determine the effects of these input categories. In
further study I would need to better account for the effectiveness of each of each of
these categories regardless of playing time. With more time I could also get the full
details about how Synergy defines these play types and better understand how these

23
inputs demonstrate team strategies and player skills. What excited me most about the
project however was not what I’d be able to accomplish with my first exposure to this
new data, but simply learning how to manipulate this data to discover what’s relevant.
I believe these datasets that Synergy is compiling have extremely useful applications
in furthering our understanding of the game of basketball. The problem remains that
this data is still proprietary and the general public may not get a chance to see its full
analytical capabilities. NBA teams and college programs are already charging their
analytics personnel with the same types of tasks I tried to tackle with this study. They
have the benefit of full-time employment and full access to Synergy’s database. I for
one am very hopeful that this new knowledge does not stay confined to the front
office, but eventually pervades the public sphere so anyone may attempt to learn more
about the game of basketball.

24
BIBLIOGRAPHY
1. Lewis, Michael. “The No-Stats All-Star.” New York Times Magazine, February 13, 2009. Accessed March 25, 2014. http://www.nytimes.com/2009/02/15/magazine/ 15Battier-t.html?pagewanted=all. 2. Cervone, Dan, D’Amour, Alexander, Bornn, Luke, and Goldsberry, Kirk. “Pointwise: Predicting Points and Valuing Decisions in Real Time with NBA Optical Tracking Data.” 2014. Paper presented at MIT Sloan Sports Analytics Conference. 3. Garcia-del-Barro, Pedro, and Szymanski, Stefan. "Goal! Profit maximization and win maximization in football leagues." 2006. Working Papers 0621, International Association of Sports Economists & North American Association of Sports Economists. 4. Myers, Daniel. “ASPM and Vorp.” GodismyJudgeOK.com. Accessed February 20, 2014. http://godismyjudgeok.com/DStats/aspm-and-vorp/. 5. Ilardi, Steve. “The Next Big Thing: Real Plus Minus. ESPN.com. April 7, 2014. http://espn.go.com/nba/story/_/id/10740818/introducing-real-plus-minus. 6. Goldsberry, Kirk. “Courtvision: How the Spurs and Heat Use the Most Important Shot in Basketball.” Grantland.com, June 13, 2009. Accessed March 25, 2014. http://grantland.com/the-triangle/courtvision-how-the-spurs-and-heat-use-the-most important-shot-in-basketball/. 7. Berri, David J., Brook, Stacey L., and Schmidt, Martin B. Wages of Wins, Taking Measure of the Many Myths in Modern Sport. Stanford: Stanford University Press, 2007 8. Berri, David J., and Schmidt, Martin B. Stumbling on Wins, Two Economists Expose the Pitfalls on the Road to Victory in Professional Sports. Upper Saddle River, NJ: FT Press, 2010 9. Oliver, Dean. Basketball on Paper, Rules and Tools for Performance Analysis. Dulles, VA: Potomac Books, 2004. 10. James, Bill. The New Historical Bill James Baseball Abstract. Free Press, 2003.
25
Table 1: Regression Measuring Input Effects on WS (Significant Effects Listed in Bold)
Inputs and Adv. Estimate Std. Error
(Intercept) 5.903 15.576 Total.Isolation 0.001 0.007
TotalP.R.Ballhandler 0.557 0.094 *** Total.Post.Up 0.272 0.079 ***
Total.P.R.Roll.Man 0.787 0.154 *** Total.Spot.Up 0.497 0.097 ***
Total.Off.Screen 0.615 0.159 *** Total.Handoff -0.510 0.355
Total.Cut 0.774 0.162 *** Total.Offensive.Rebound 0.795 0.229 ***
Total.Transition 0.936 0.122 *** Total.All.Other.Plays 4.226 0.520 *** Total.Isolation.Allowed 0.177 0.319
Total.P.R.Ballhandler.Allowed -0.288 0.139 * Total.Post.Up.Allowed -0.421 0.234 .
Total.P.R.Roll.Man.Allowed -0.625 0.501 Total.Spot.Up.Allowed 0.009 0.147
Total.Off.Screen.Allowed -0.910 0.379 * Total.Handoff.Allowed -1.263 0.724 .
TS% 1.562 2.266 eFG% -1.173 1.286
ORB% 0.033 0.012 ** DRB% -0.009 0.041 AST% 0.032 0.010 ** STL% -0.094 0.296 BLK% -0.034 0.104 TOV% 0.000 0.010 USG% -0.076 0.015 *** ORtg 0.011 0.012 DRtg -0.060 0.135
Significance codes ‘***’ 0.001
‘**’ 0.01 ‘*’ 0.05 ‘.’ 0.1 ‘
’1 Adjusted R2 0.8856

26
Table 2: Regression Measuring Input Effects on WP
Inputs and Adv. Estimate Std. Error (Intercept) -25.758 27.339
Total.Isolation -0.007 0.012 TotalP.R.Ballhandler 0.245 0.164
Total.Post.Up -0.229 0.138 . Total.P.R.Roll.Man 0.364 0.270
Total.Spot.Up 0.005 0.170 Total.Off.Screen 0.595 0.280 *
Total.Handoff -0.810 0.623 Total.Cut 1.124 0.284 ***
Total.Offensive.Rebound 1.917 0.401 *** Total.Transition 0.843 0.214 ***
Total.All.Other.Plays 5.353 0.912 *** Total.Isolation.Allowed 0.743 0.560
Total.P.R.Ballhandler.Allowed -0.414 0.245 . Total.Post.Up.Allowed -1.427 0.410 ***
Total.P.R.Roll.Man.Allowed -0.233 0.879 Total.Spot.Up.Allowed 0.403 0.259
Total.Off.Screen.Allowed 1.143 0.665 . Total.Handoff.Allowed -1.200 1.270
TS% 4.847 3.978 eFG% 0.039 2.258
ORB% 0.092 0.021 *** DRB% 0.141 0.072 * AST% 0.073 0.017 *** STL. 0.793 0.519 BLK. 0.134 0.183 TOV. -0.010 0.018
USG% -0.179 0.026 *** ORtg -0.019 0.020 DRtg 0.258 0.236
Significance codes ‘***’ 0.001 ‘**’ 0.01
‘*’ 0.05 ‘.’ 0.1 ‘ ’1
Adjusted R2 0.7428

27
Table 3: Regression Measuring Input Effects on Salary
Inputs and Adv. Estimate Std. Error (Intercept) -812.6615 512.1244
Total.Isolation -0.4807 0.2254 * TotalP.R.Ballhandler 4.1989 3.081
Total.Post.Up 10.4878 2.5823 *** Total.P.R.Roll.Man -1.8358 5.0595
Total.Spot.Up 5.5569 3.1828 . Total.Off.Screen 6.5725 5.2389 Total.Handoff 20.3934 11.6704 .
Total.Cut 18.8844 5.3265 *** Total.Offensive.Rebound -10.1139 7.5205
Total.Transition -5.4351 4.0055 Total.All.Other.Plays 58.2955 17.0883 *** Total.Isolation.Allowed 3.5104 10.493
Total.P.R.Ballhandler.Allowed -11.9249 4.5865 ** Total.Post.Up.Allowed -17.0896 7.6782 *
Total.P.R.Roll.Man.Allowed 30.9865 16.4577 . Total.Spot.Up.Allowed -6.2638 4.849
Total.Off.Screen.Allowed 4.0692 12.4582 Total.Handoff.Allowed 34.017 23.7894
TS% -110.0036 74.5109 eFG% 11.9388 42.2936
ORB% -0.8091 0.3999 * DRB% 1.2872 1.3485 AST% 1.0381 0.324 ** STL% 9.8326 9.7182 BLK% 4.12 3.419 TOV% 0.3177 0.3439 USG% 1.217 0.4937 * ORtg 0.746 0.3826 . DRtg 4.6011 4.4273
Significance codes ‘***’ 0.001
‘**’ 0.01 ‘*’ 0.05 ‘.’ 0.1 ‘
’ 1 Adjusted R2 0.4653

28
Table 4: Comparing Significant Effects on WS, WP, and Salary
Inputs WS WP Salary
All Other Plays 4.226 5.353 58.296 Cut 0.774 1.124 18.884
Spot-Up 0.497 ⎯ 5.557 Post-Up 0.272 -0.229 10.488 ORB% 0.033 0.092 -0.809
AST% 0.032 0.073 1.038 USG% -0.076 -0.179 1.217
P&R Ballhandler Allowed -0.288 -0.414 -11.925 Post-Up Allowed -0.421 -1.427 -17.09

29
Table 5: Mean Synergy Sports Data
Variable Mean Standard Deviation Total Plays 528.3 497.5 PPP Overall 0.843 0.211 PPP Isolation 0.659 0.424 PPP P&R Ball Handler 0.498 0.484 PPP Post-UP 0.574 0.519 PPP P&R Roll Man 0.619 0.64 PPP Spot-Up 0.818 0.357 PPP Off Screen 0.621 0.55 PPP Handoff 0.614 0.604 PPP Cut 1.01 0.478 PPP Offensive Rebound 0.939 0.51 PPP Transition 0.999 0.403 PPP All Other Plays 0.351 0.258 Total Plays Against 335.5 281.3 PAPP Overall 0.864 0.228 PAPP Isolation 0.777 0.325 PAPP P&R Ball Handler 0.718 0.522 PAPP Post-Up 0.796 0.36 PAPP P&R Roll Man 0.773 0.539 PAPP Spot-Up 0.937 0.337 PAPP Off Screen 0.828 0.522 PAPP Handoff 0.745 0.591