An Analysis of J.C. Penney - Whitney Tilson · “Retailer J.C. Penney is discontinuing its...
58
An Analysis of J.C. Penney Value Investing Congress October 18, 2011
-
Upload
duongnguyet -
Category
Documents
-
view
222 -
download
0
Transcript of An Analysis of J.C. Penney - Whitney Tilson · “Retailer J.C. Penney is discontinuing its...

An Analysis of J.C. Penney
Value Investing Congress
October 18, 2011

T2 Partners Management L.P.
Manages Hedge Funds and Mutual Funds
and is a Registered Investment Advisor
The General Motors Building
767 Fifth Avenue, 18th Floor
New York, NY 10153
(212) 386-7160
[email protected] www.T2PartnersLLC.com
-3-
Disclaimer
THIS PRESENTATION IS FOR INFORMATIONAL AND EDUCATIONAL PURPOSES ONLY AND SHALL NOT BE CONSTRUED TO CONSTITUTE INVESTMENT ADVICE. NOTHING CONTAINED HEREIN SHALL CONSTITUTE A SOLICITATION, RECOMMENDATION OR ENDORSEMENT TO BUY OR SELL ANY SECURITY OR OTHER FINANCIAL INSTRUMENT.
INVESTMENT FUNDS MANAGED BY WHITNEY TILSON AND GLENN TONGUE OWN STOCK IN MANY OF THE COMPANIES DISCUSSED HEREIN. THEY HAVE NO OBLIGATION TO UPDATE THE INFORMATION CONTAINED HEREIN AND MAY MAKE INVESTMENT DECISIONS THAT ARE INCONSISTENT WITH THE VIEWS EXPRESSED IN THIS PRESENTATION.
WE MAKE NO REPRESENTATION OR WARRANTIES AS TO THE ACCURACY, COMPLETENESS OR TIMELINESS OF THE INFORMATION, TEXT, GRAPHICS OR OTHER ITEMS CONTAINED IN THIS PRESENTATION. WE EXPRESSLY DISCLAIM ALL LIABILITY FOR ERRORS OR OMISSIONS IN, OR THE MISUSE OR MISINTERPRETATION OF, ANY INFORMATION CONTAINED IN THIS PRESENTATION.
PAST PERFORMANCE IS NO GUARANTEE OF FUTURE RESULTS AND FUTURE RETURNS ARE NOT GUARANTEED.
-4-
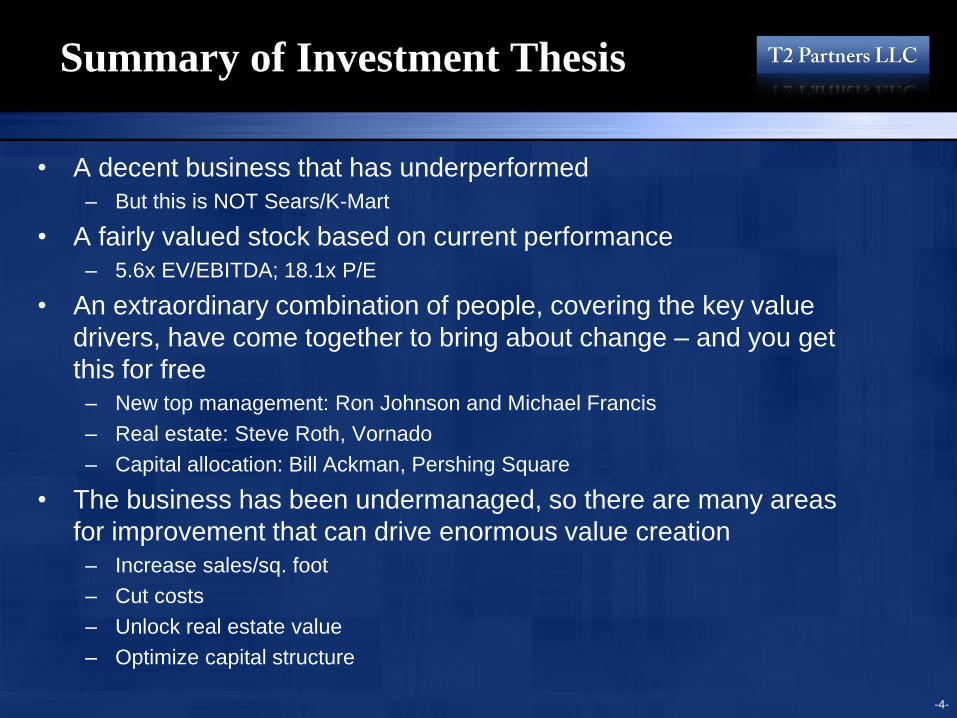
Summary of Investment Thesis
• A decent business that has underperformed
– But this is NOT Sears/K-Mart
• A fairly valued stock based on current performance
– 5.6x EV/EBITDA; 18.1x P/E
• An extraordinary combination of people, covering the key value
drivers, have come together to bring about change – and you get
this for free
– New top management: Ron Johnson and Michael Francis
– Real estate: Steve Roth, Vornado
– Capital allocation: Bill Ackman, Pershing Square
• The business has been undermanaged, so there are many areas
for improvement that can drive enormous value creation
– Increase sales/sq. foot
– Cut costs
– Unlock real estate value
– Optimize capital structure
-5-
The Basics
• Stock price (10/17/11): $29.99
• Shares outstanding: 213.3 million
• Options and warrants: 24.8 million
• Market cap: $6.4 billion
• Enterprise Value: $7.9 billion
• Book value per share (7/31/11): $22
• Sales: $17.7 billion
• P/E (LTM): 18.1x
• EV/EBITDA (LTM): 5.6x
• P/S: 0.36x
-6-
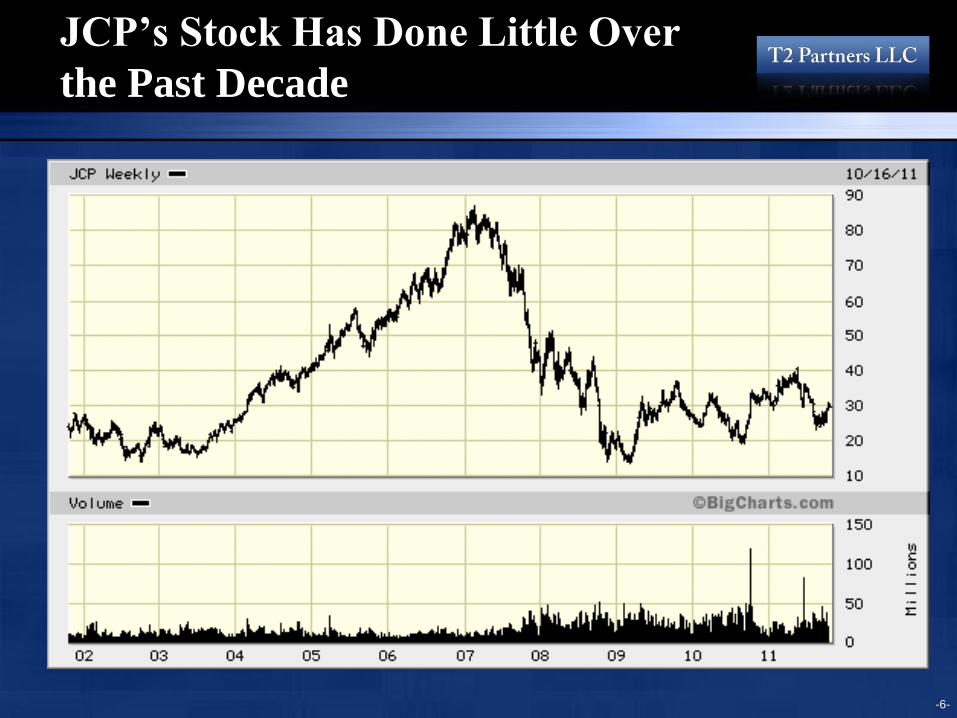
JCP’s Stock Has Done Little Over
the Past Decade
-7-
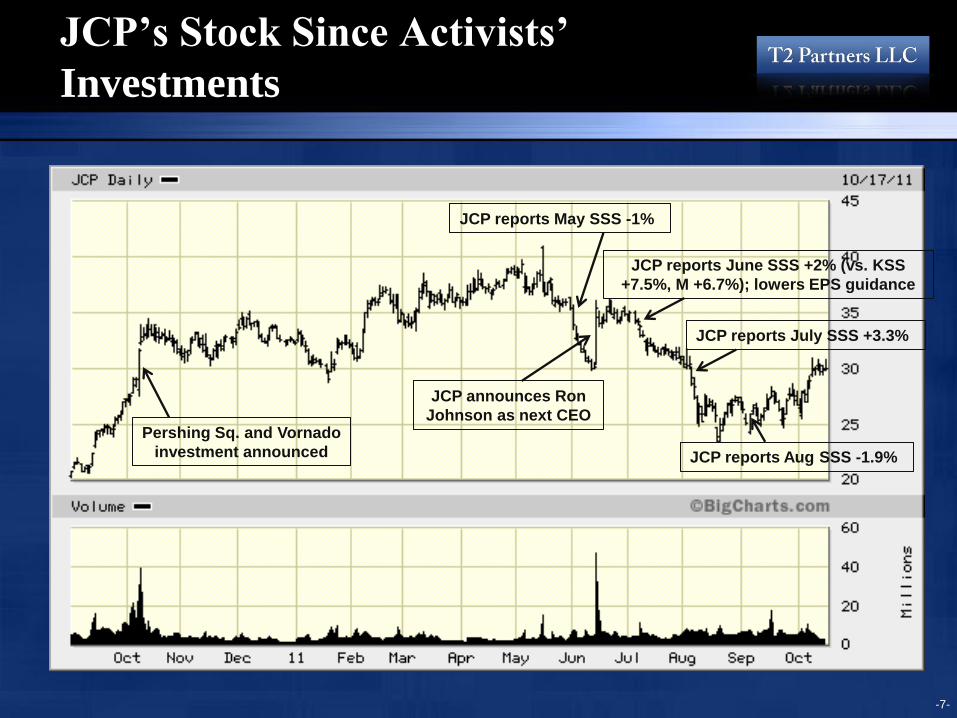
JCP’s Stock Since Activists’
Investments
JCP reports May SSS -1%
JCP announces Ron
Johnson as next CEO
JCP reports June SSS +2% (vs. KSS
+7.5%, M +6.7%); lowers EPS guidance
JCP reports July SSS +3.3%
JCP reports Aug SSS -1.9%
Pershing Sq. and Vornado
investment announced
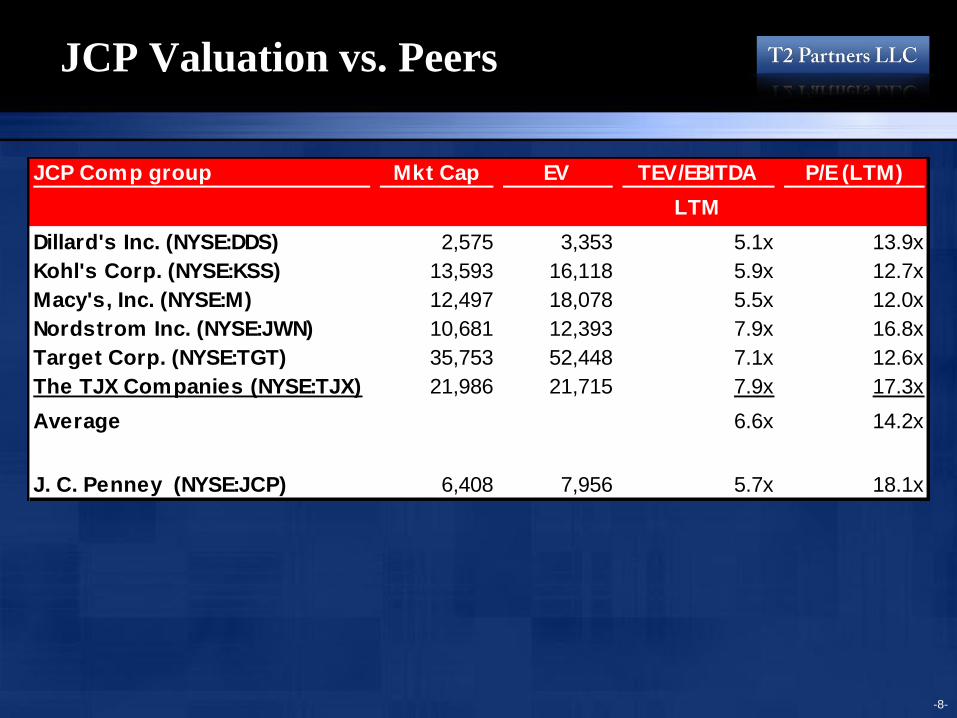
JCP Valuation vs. Peers
-8-
JCP Comp group Mkt Cap EV TEV/EBITDA
LTM
P/E (LTM)
Dillard's Inc. (NYSE:DDS) 2,575 3,353 5.1x 13.9x
Kohl's Corp. (NYSE:KSS) 13,593 16,118 5.9x 12.7x
Macy's, Inc. (NYSE:M) 12,497 18,078 5.5x 12.0x
Nordstrom Inc. (NYSE:JWN) 10,681 12,393 7.9x 16.8x
Target Corp. (NYSE:TGT) 35,753 52,448 7.1x 12.6x
The TJX Companies (NYSE:TJX) 21,986 21,715 7.9x 17.3x
Average 6.6x 14.2x
J. C. Penney (NYSE:JCP) 6,408 7,956 5.7x 18.1x
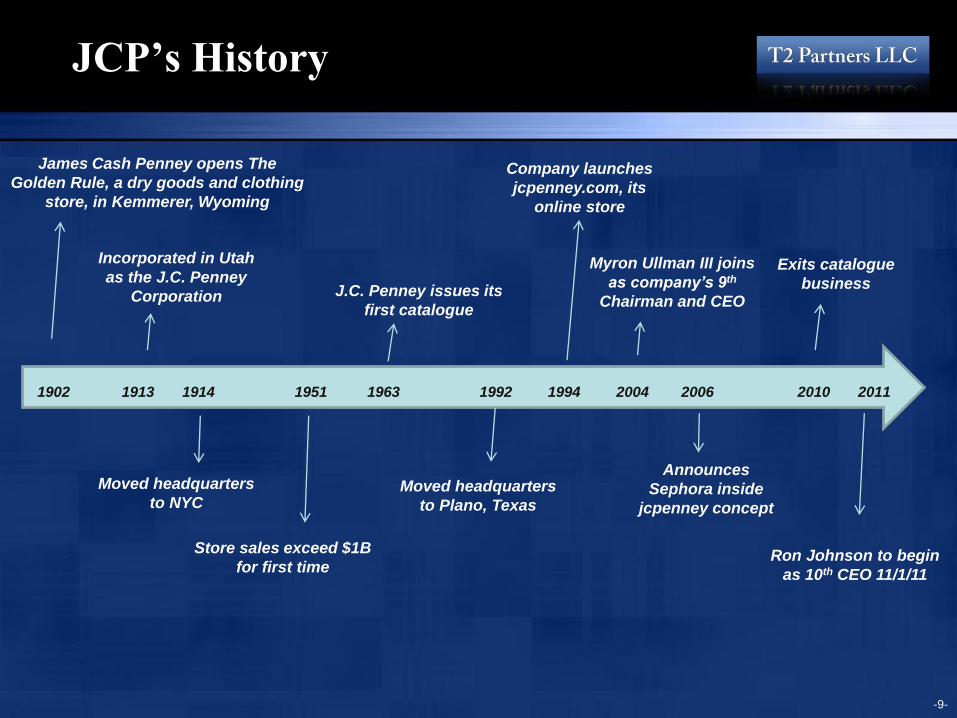
JCP’s History
-9-
James Cash Penney opens The
Golden Rule, a dry goods and clothing
store, in Kemmerer, Wyoming
Store sales exceed $1B
for first time
J.C. Penney issues its
first catalogue
Company launches
jcpenney.com, its
online store
Incorporated in Utah
as the J.C. Penney
Corporation
Moved headquarters
to NYC Moved headquarters
to Plano, Texas
Exits catalogue
business
Announces
Sephora inside
jcpenney concept
Myron Ullman III joins
as company’s 9th
Chairman and CEO
1902 1913 1914 1951 1963 1992 1994 2004 2006 2010 2011
Ron Johnson to begin
as 10th CEO 11/1/11
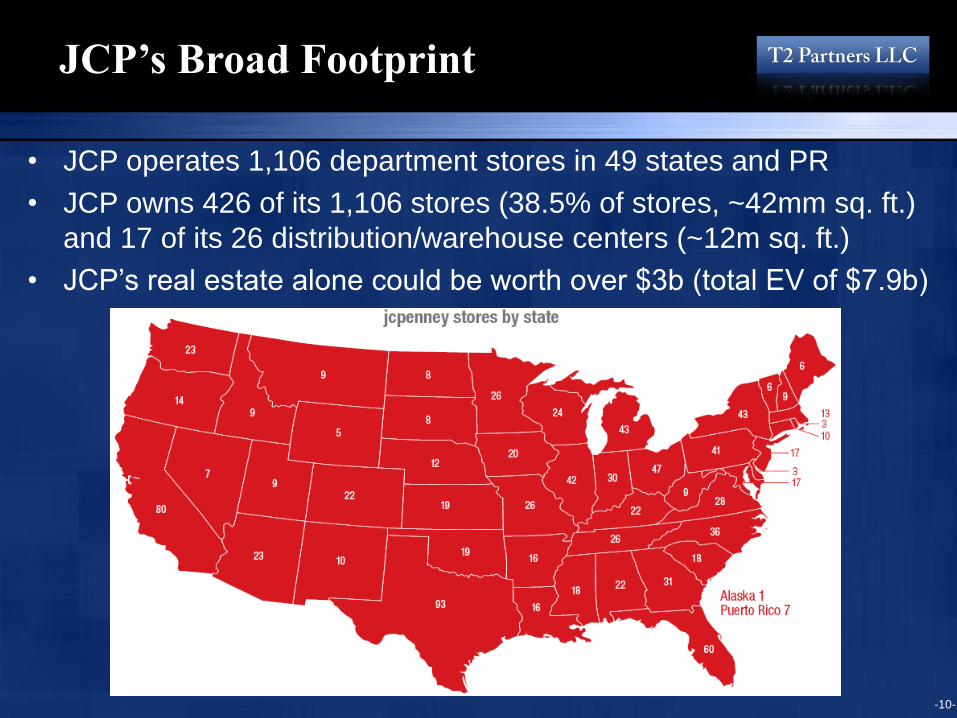
• JCP operates 1,106 department stores in 49 states and PR
• JCP owns 426 of its 1,106 stores (38.5% of stores, ~42mm sq. ft.)
and 17 of its 26 distribution/warehouse centers (~12m sq. ft.)
• JCP’s real estate alone could be worth over $3b (total EV of $7.9b)
JCP’s Broad Footprint
-10-
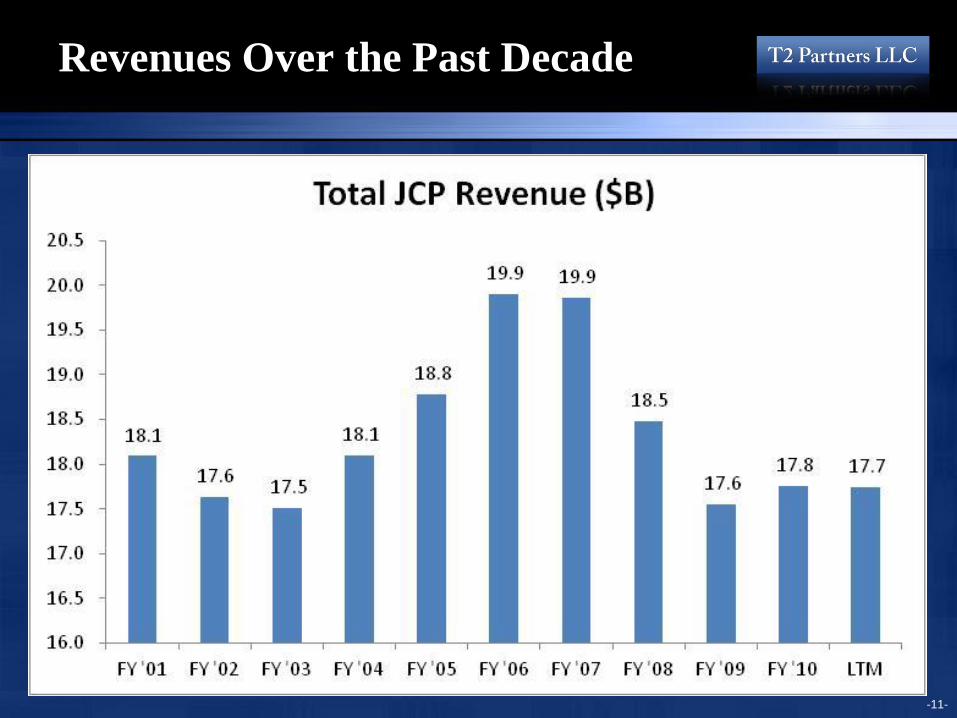
Revenues Over the Past Decade
-11-
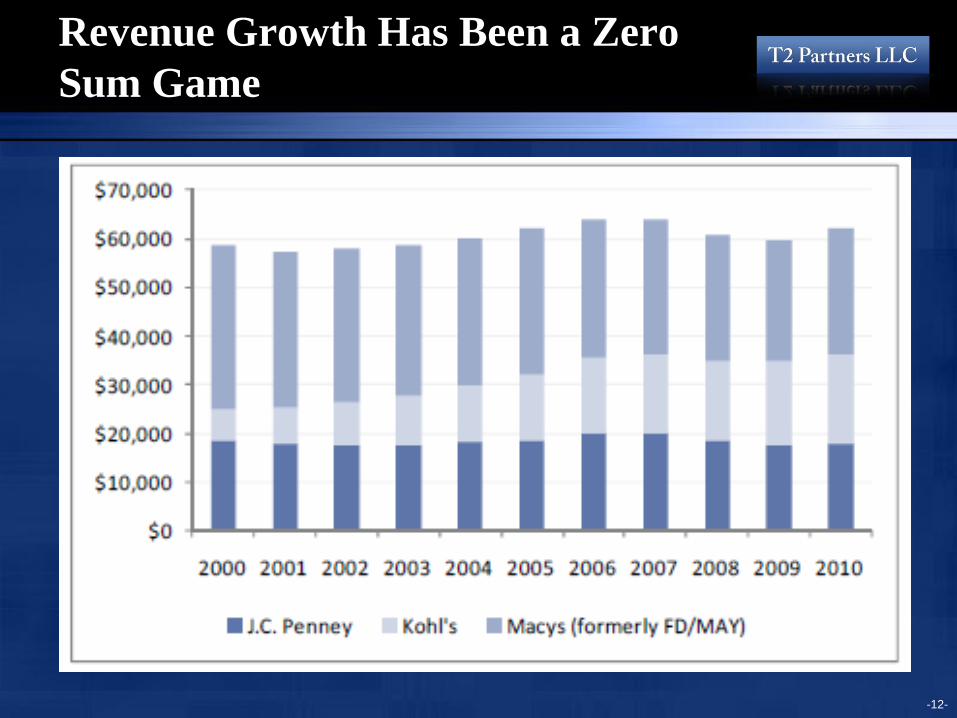
Revenue Growth Has Been a Zero
Sum Game
-12-
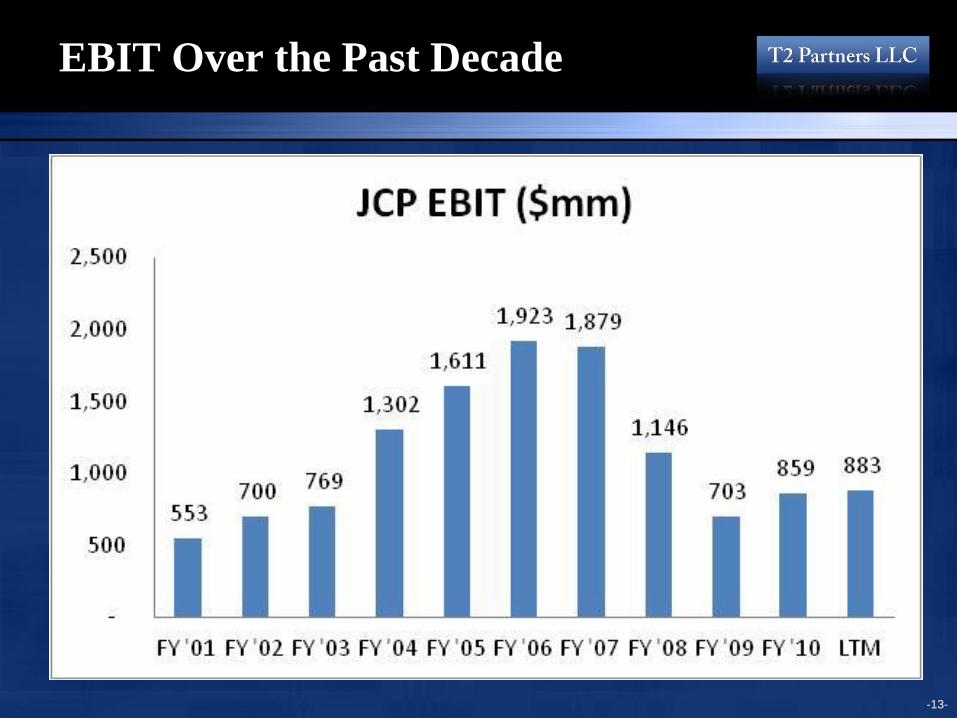
EBIT Over the Past Decade
-13-
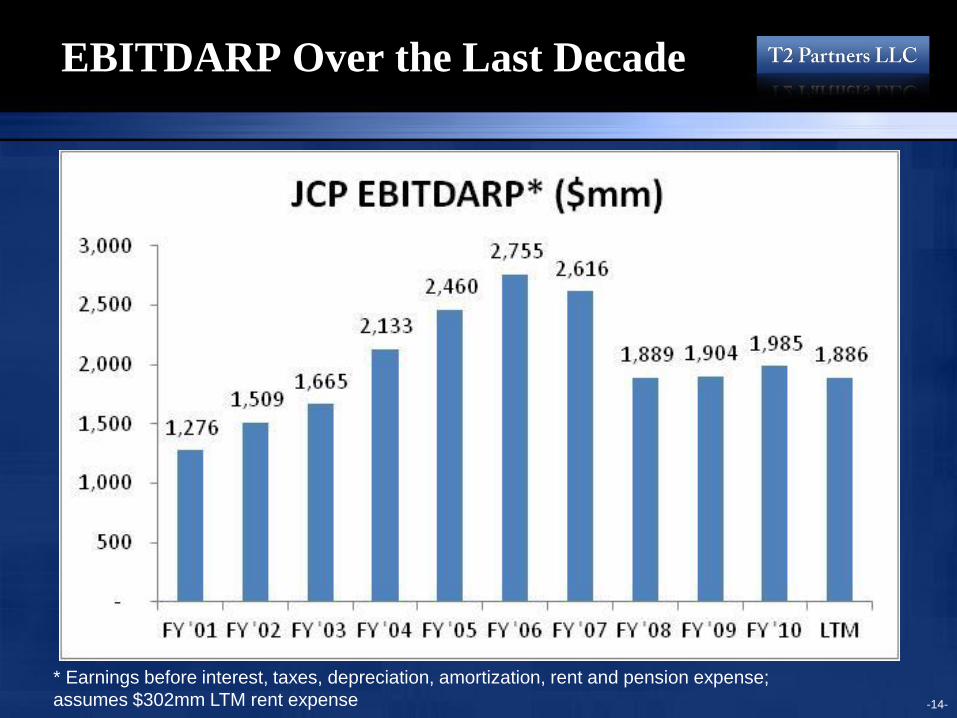
EBITDARP Over the Last Decade
-14-
* Earnings before interest, taxes, depreciation, amortization, rent and pension expense;
assumes $302mm LTM rent expense
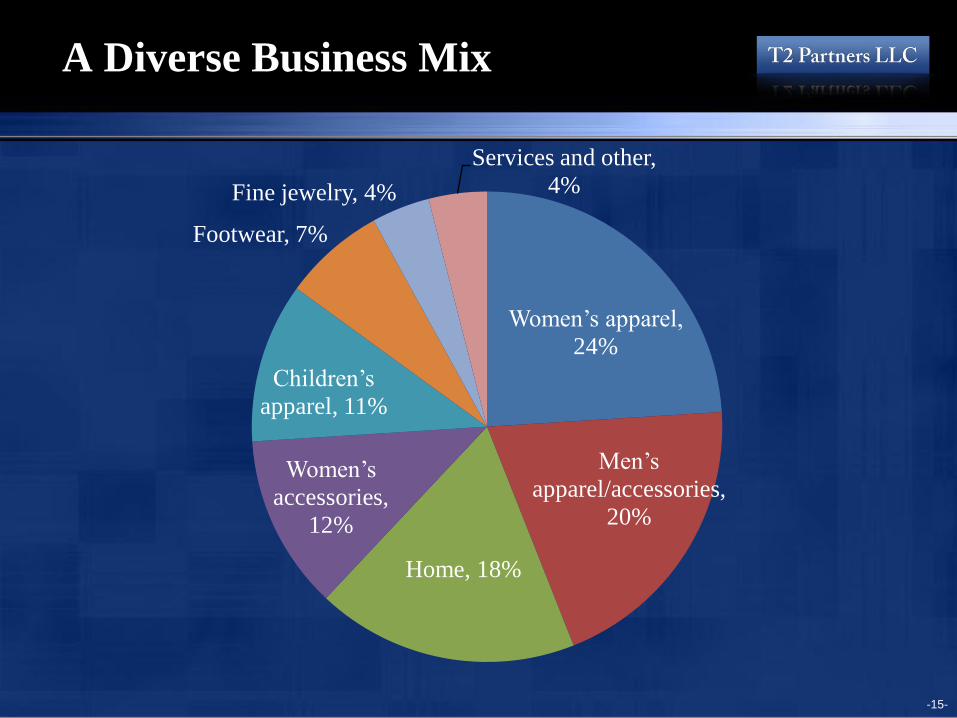
A Diverse Business Mix
-15-
Women’s apparel,
24%
Men’s
apparel/accessories,
20%
Home, 18%
Women’s
accessories,
12%
Children’s
apparel, 11%
Footwear, 7%
Fine jewelry, 4%
Services and other,
4%
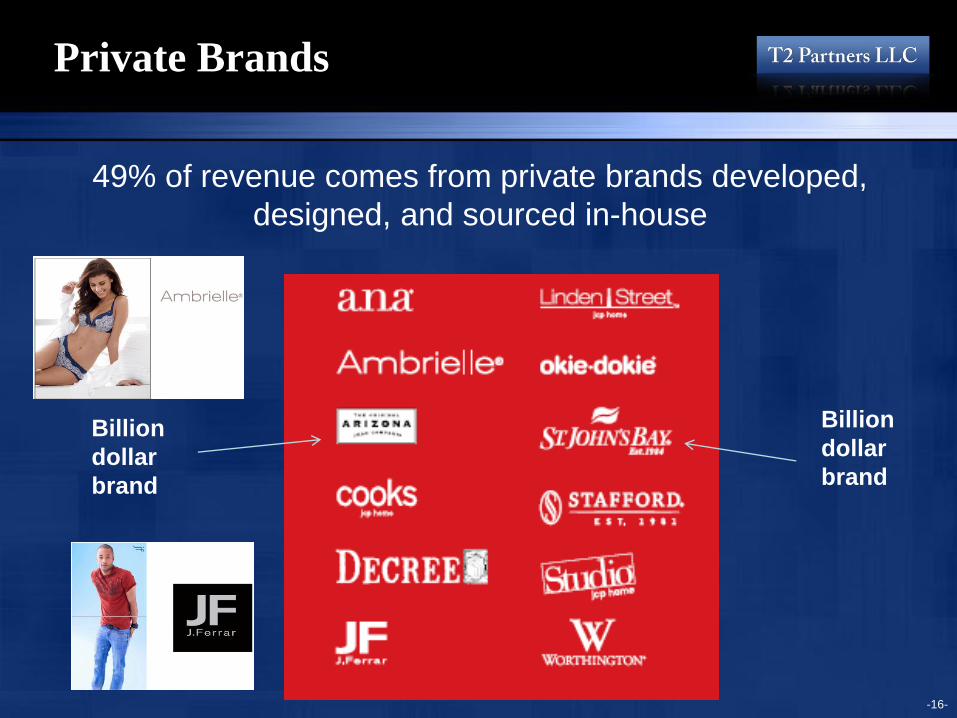
Private Brands
-16-
49% of revenue comes from private brands developed,
designed, and sourced in-house
Billion
dollar
brand
Billion
dollar
brand
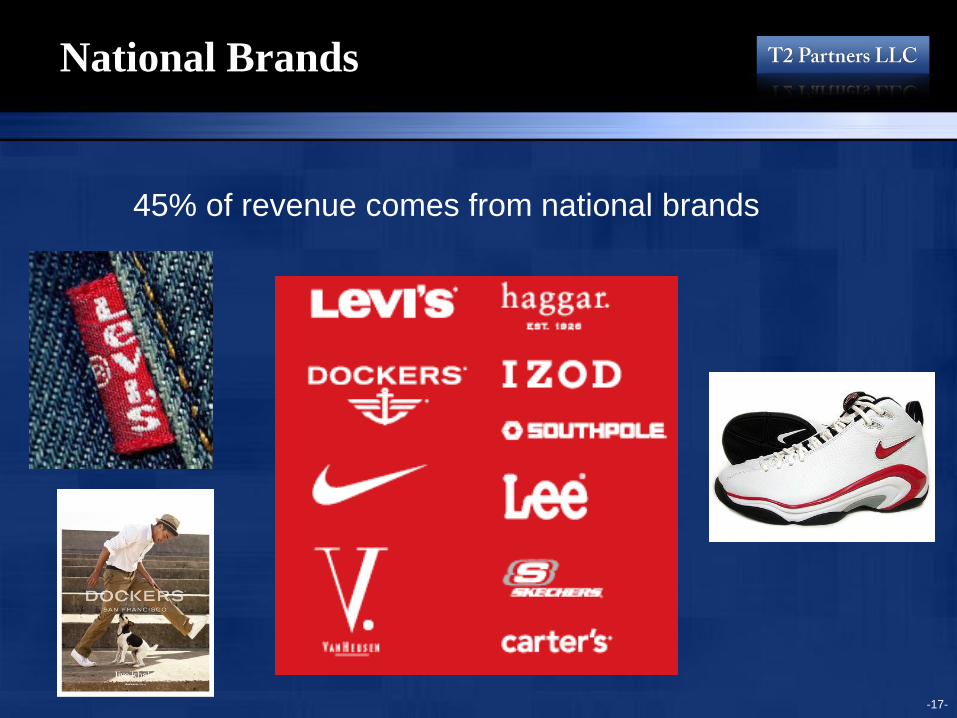
National Brands
-17-
45% of revenue comes from national brands
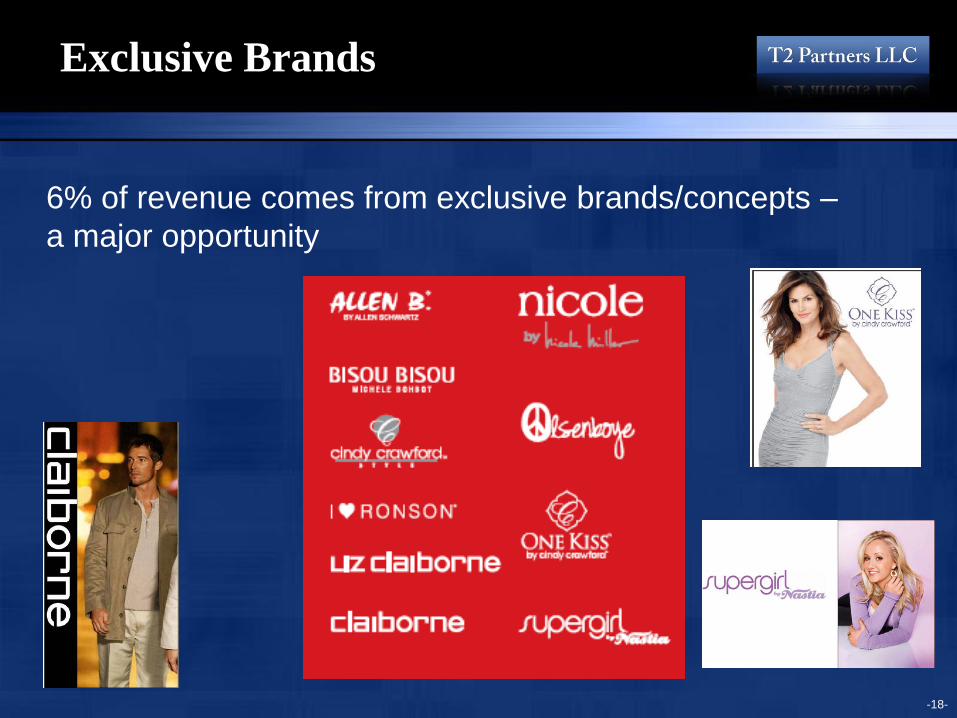
Exclusive Brands
-18-
6% of revenue comes from exclusive brands/concepts –
a major opportunity
Investment Thesis
• New management team & active Board of Directors
• Opportunity for operational improvement
• Significant real estate value
• Capital structure optimization
-19-
Investment Thesis
• New management team & active Board of Directors
• Opportunity for operational improvement
• Significant real estate value
• Capital structure optimization
-20-
Ron Johnson Left Apple for JCP
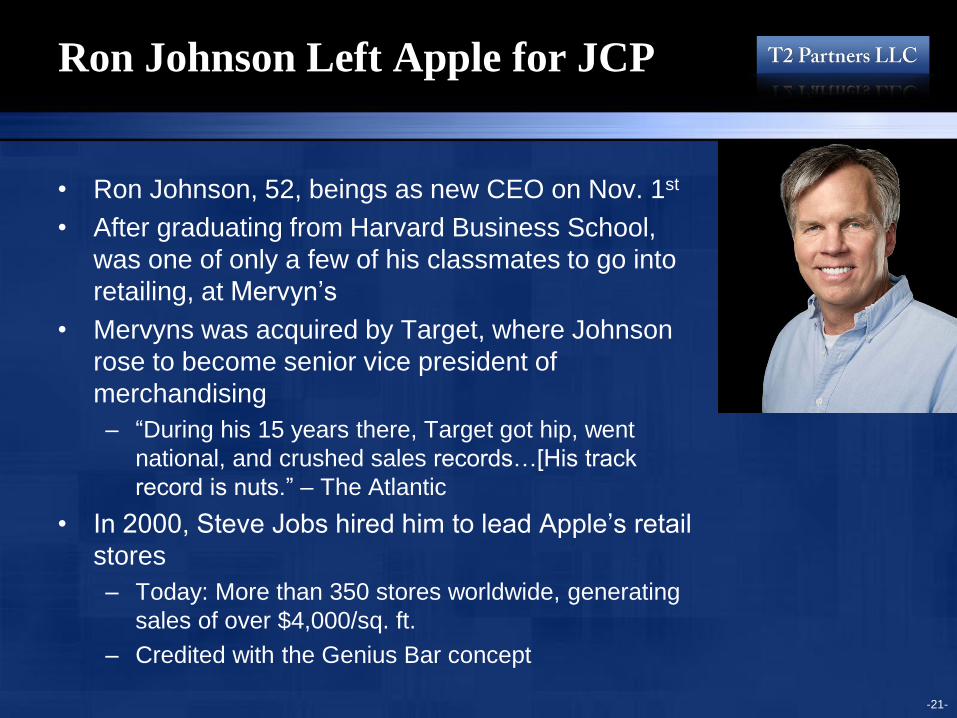
• Ron Johnson, 52, beings as new CEO on Nov. 1st
• After graduating from Harvard Business School,
was one of only a few of his classmates to go into
retailing, at Mervyn’s
• Mervyns was acquired by Target, where Johnson
rose to become senior vice president of
merchandising
– “During his 15 years there, Target got hip, went
national, and crushed sales records…[His track
record is nuts.” – The Atlantic
• In 2000, Steve Jobs hired him to lead Apple’s retail
stores
– Today: More than 350 stores worldwide, generating
sales of over $4,000/sq. ft.
– Credited with the Genius Bar concept
-21-
Ron Johnson’s Motivation, Incentives
and Alignment With Shareholders
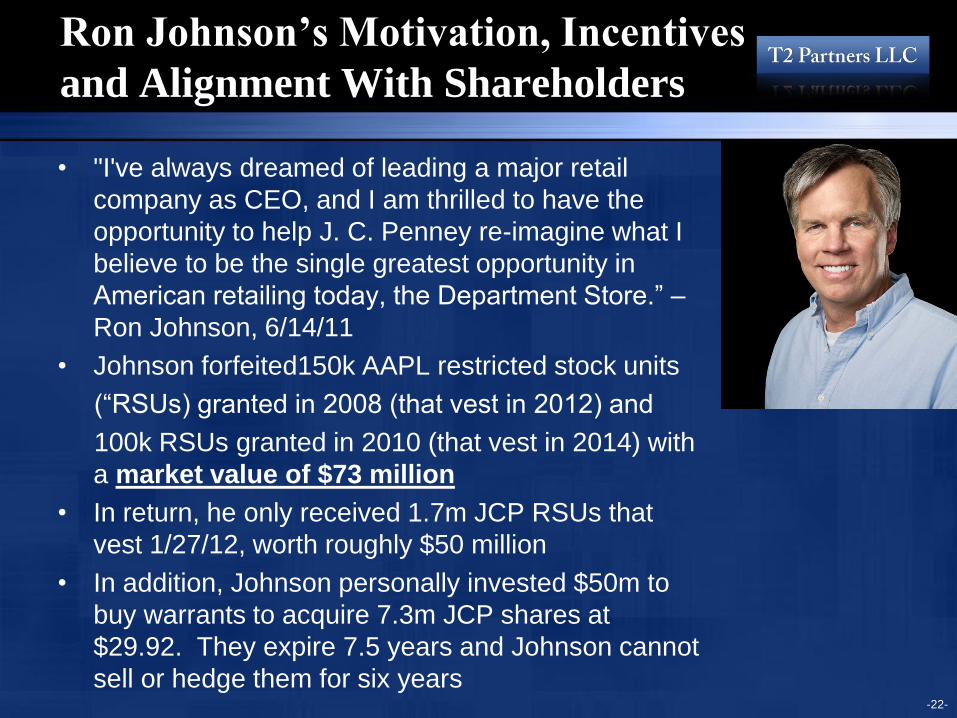
• "I've always dreamed of leading a major retail
company as CEO, and I am thrilled to have the
opportunity to help J. C. Penney re-imagine what I
believe to be the single greatest opportunity in
American retailing today, the Department Store.” –
Ron Johnson, 6/14/11
• Johnson forfeited150k AAPL restricted stock units
(“RSUs) granted in 2008 (that vest in 2012) and
100k RSUs granted in 2010 (that vest in 2014) with
a market value of $73 million
• In return, he only received 1.7m JCP RSUs that
vest 1/27/12, worth roughly $50 million
• In addition, Johnson personally invested $50m to
buy warrants to acquire 7.3m JCP shares at
$29.92. They expire 7.5 years and Johnson cannot
sell or hedge them for six years
-22-
Michael Francis Left Target for
JCP
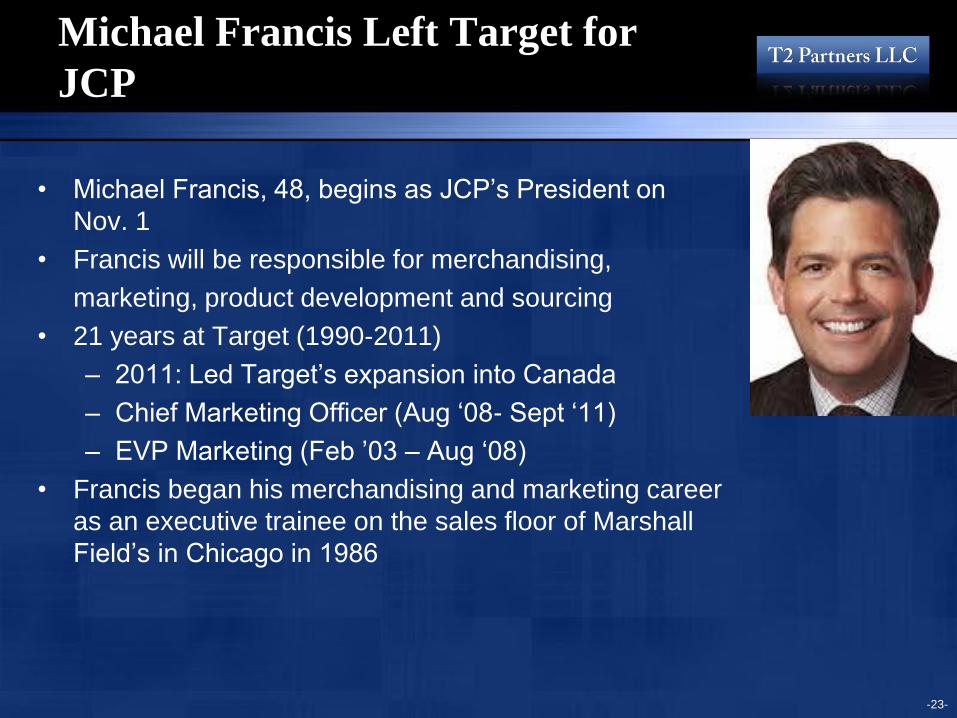
• Michael Francis, 48, begins as JCP’s President on
Nov. 1
• Francis will be responsible for merchandising,
marketing, product development and sourcing
• 21 years at Target (1990-2011)
– 2011: Led Target’s expansion into Canada
– Chief Marketing Officer (Aug ‘08- Sept ‘11)
– EVP Marketing (Feb ’03 – Aug ‘08)
• Francis began his merchandising and marketing career
as an executive trainee on the sales floor of Marshall
Field’s in Chicago in 1986
-23-
-24-
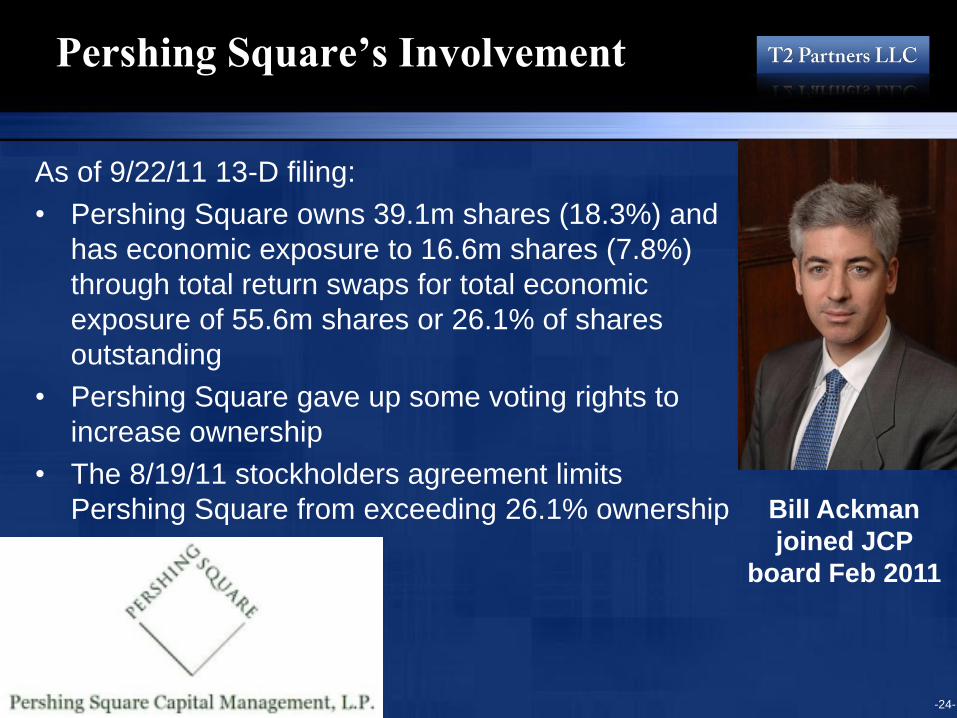
Pershing Square’s Involvement
As of 9/22/11 13-D filing:
• Pershing Square owns 39.1m shares (18.3%) and
has economic exposure to 16.6m shares (7.8%)
through total return swaps for total economic
exposure of 55.6m shares or 26.1% of shares
outstanding
• Pershing Square gave up some voting rights to
increase ownership
• The 8/19/11 stockholders agreement limits
Pershing Square from exceeding 26.1% ownership
Bill Ackman
joined JCP
board Feb 2011
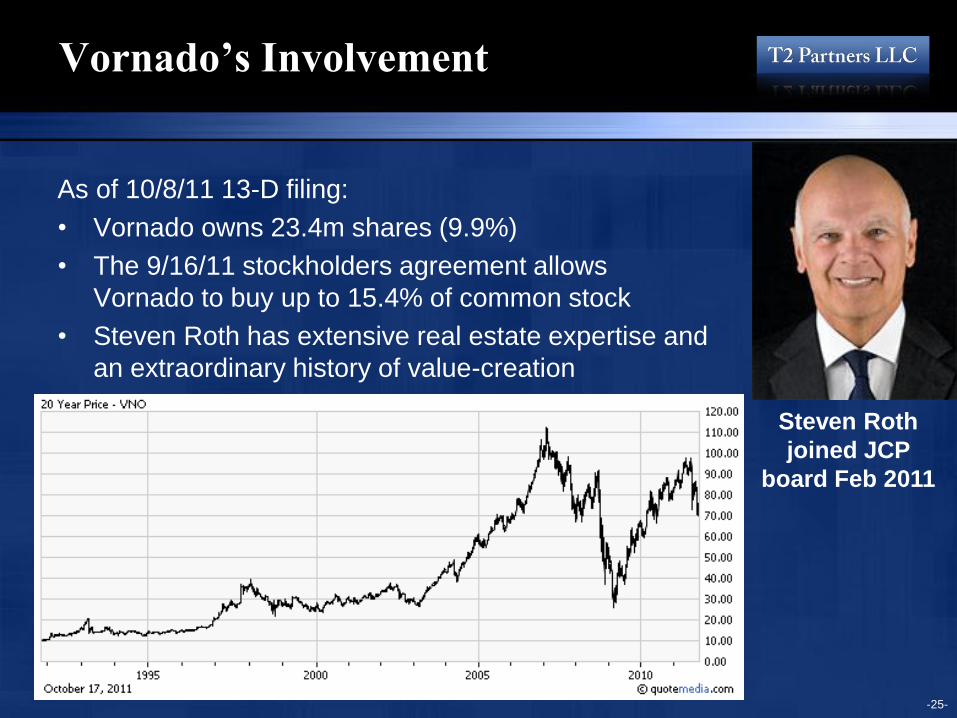
Vornado’s Involvement
As of 10/8/11 13-D filing:
• Vornado owns 23.4m shares (9.9%)
• The 9/16/11 stockholders agreement allows
Vornado to buy up to 15.4% of common stock
• Steven Roth has extensive real estate expertise and
an extraordinary history of value-creation
-25-
Steven Roth
joined JCP
board Feb 2011
Current Equity Price: $30 per share
-26-
Market
value of
equity
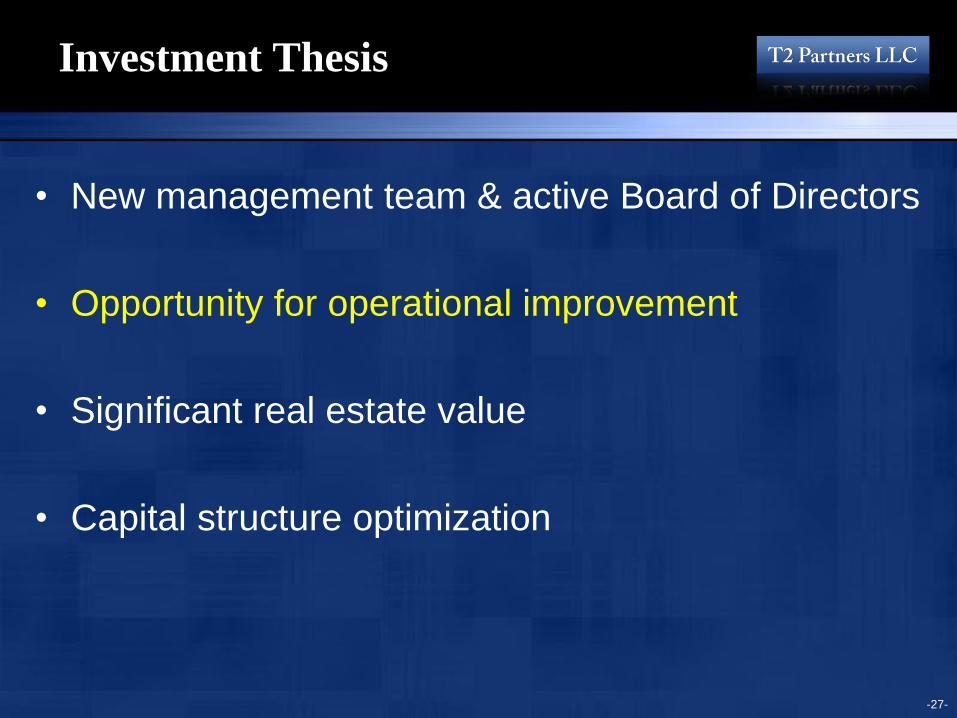
Investment Thesis
• New management team & active Board of Directors
• Opportunity for operational improvement
• Significant real estate value
• Capital structure optimization
-27-
-28-
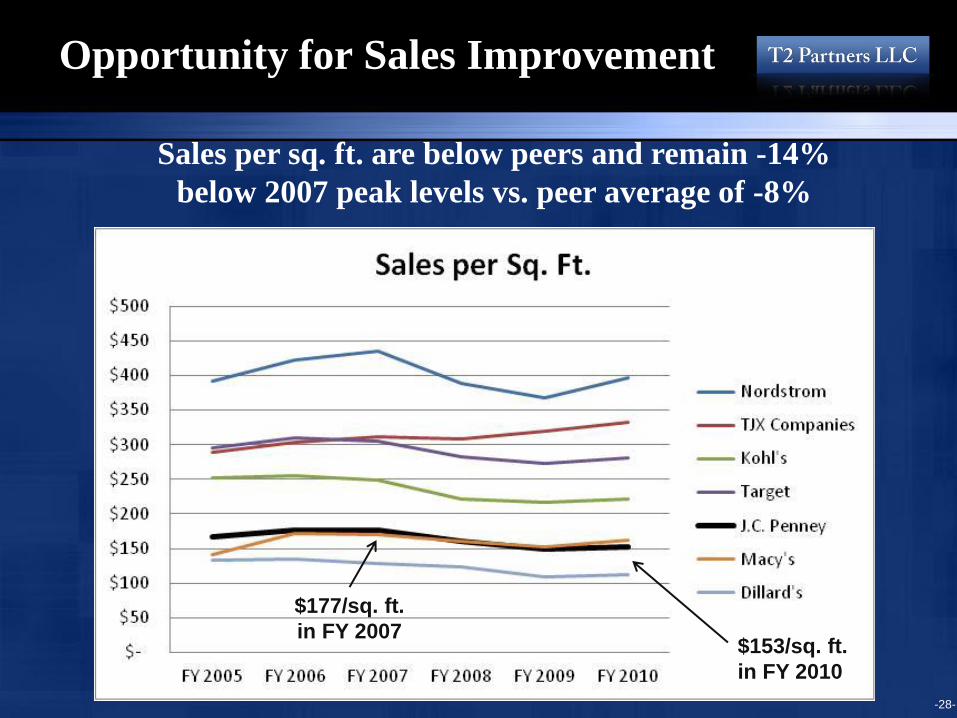
Opportunity for Sales Improvement
Sales per sq. ft. are below peers and remain -14%
below 2007 peak levels vs. peer average of -8%
$177/sq. ft.
in FY 2007 $153/sq. ft.
in FY 2010
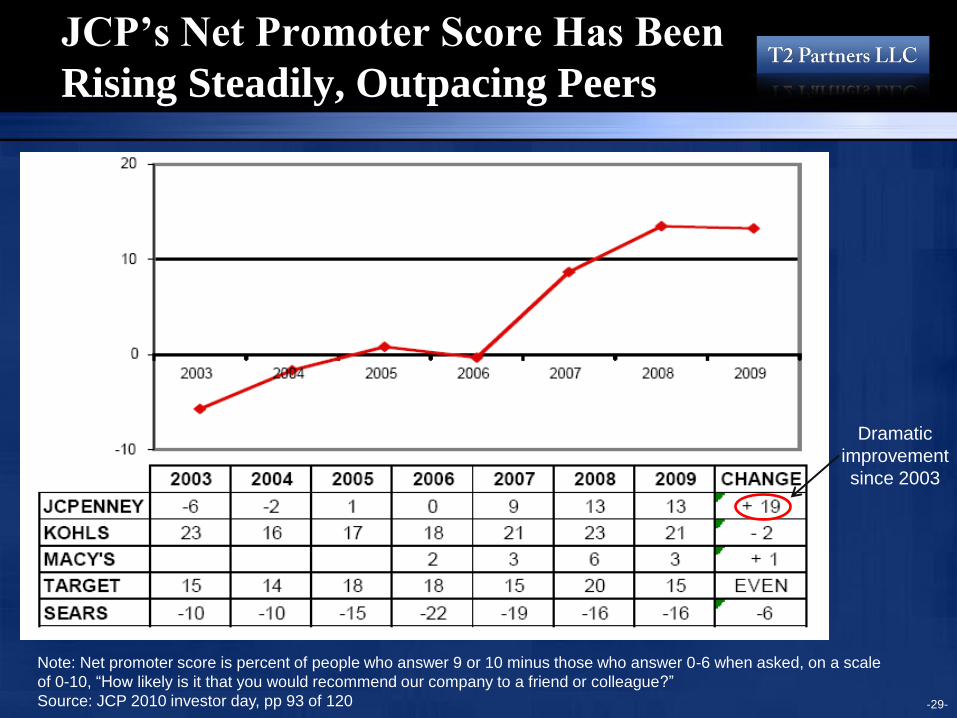
JCP’s Net Promoter Score Has Been
Rising Steadily, Outpacing Peers
-29-
Note: Net promoter score is percent of people who answer 9 or 10 minus those who answer 0-6 when asked, on a scale
of 0-10, “How likely is it that you would recommend our company to a friend or colleague?”
Source: JCP 2010 investor day, pp 93 of 120
Dramatic
improvement
since 2003
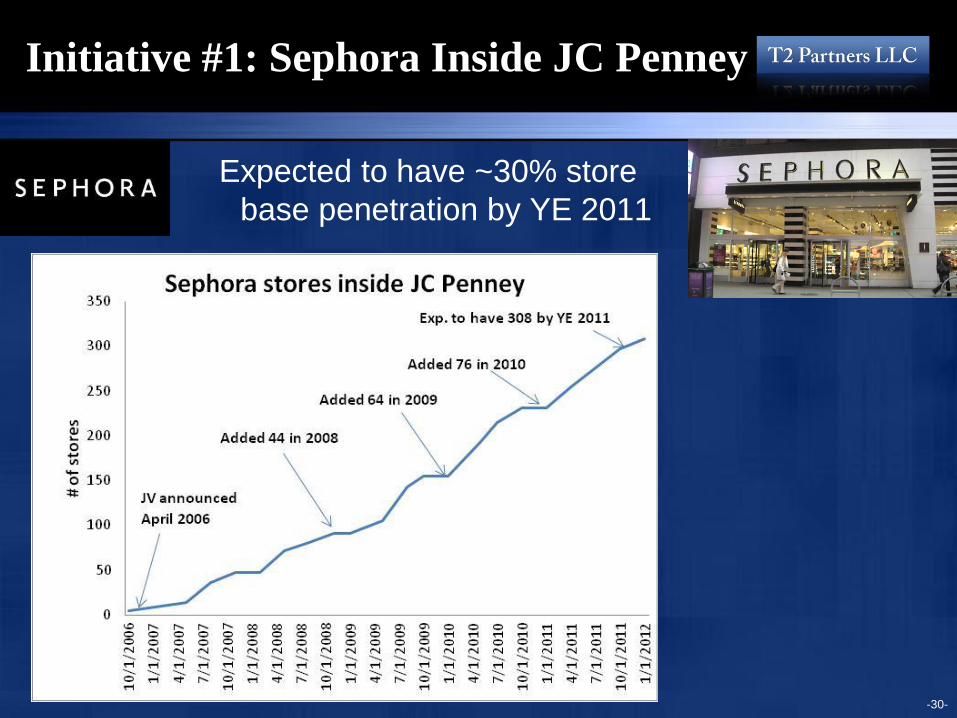
Initiative #1: Sephora Inside JC Penney
Expected to have ~30% store
base penetration by YE 2011
-30-
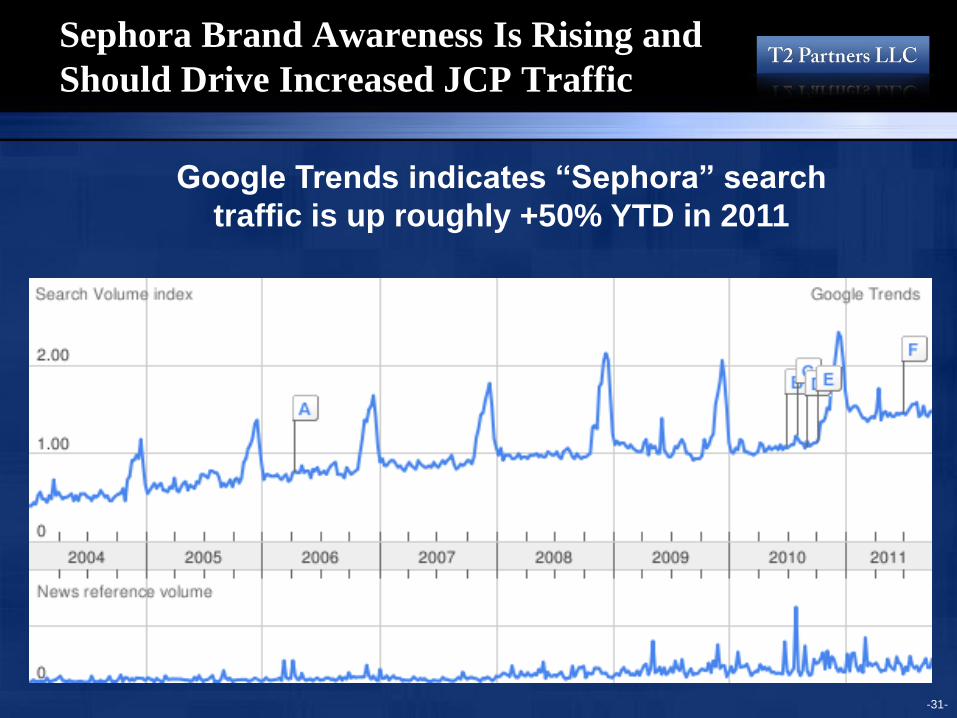
Sephora Brand Awareness Is Rising and
Should Drive Increased JCP Traffic
-31-
Google Trends indicates “Sephora” search
traffic is up roughly +50% YTD in 2011
-32-
Initiative #2: Liz Claiborne
“Liz Claiborne is one of the most recognized brands in the history of
American apparel retailing with a deeply loyal following, and our
research shows that it is among the most desired by the J.C. Penney
customer.” – CEO Myron Ullman
October 2011: “J.C. Penney acquires worldwide rights for the Liz Claiborne
family of brands as well as the U.S. and Puerto Rico rights for the
Monet brand for $267.5 million.”
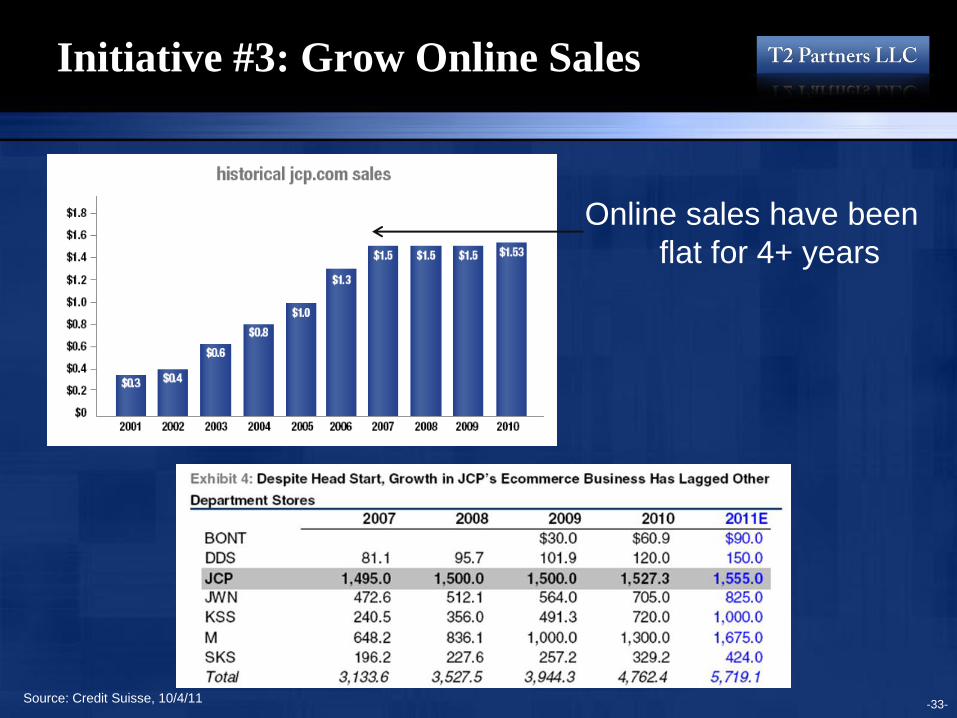
Initiative #3: Grow Online Sales
Online sales have been
flat for 4+ years
-33- Source: Credit Suisse, 10/4/11
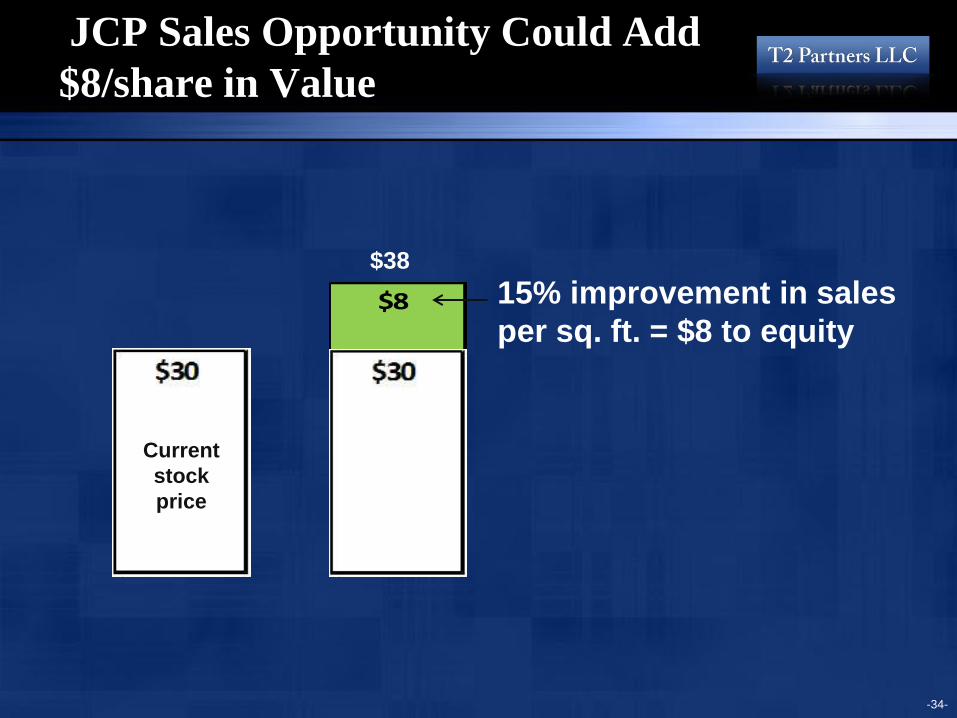
JCP Sales Opportunity Could Add
$8/share in Value
-34-
Current
stock
price
$8
$38
15% improvement in sales
per sq. ft. = $8 to equity
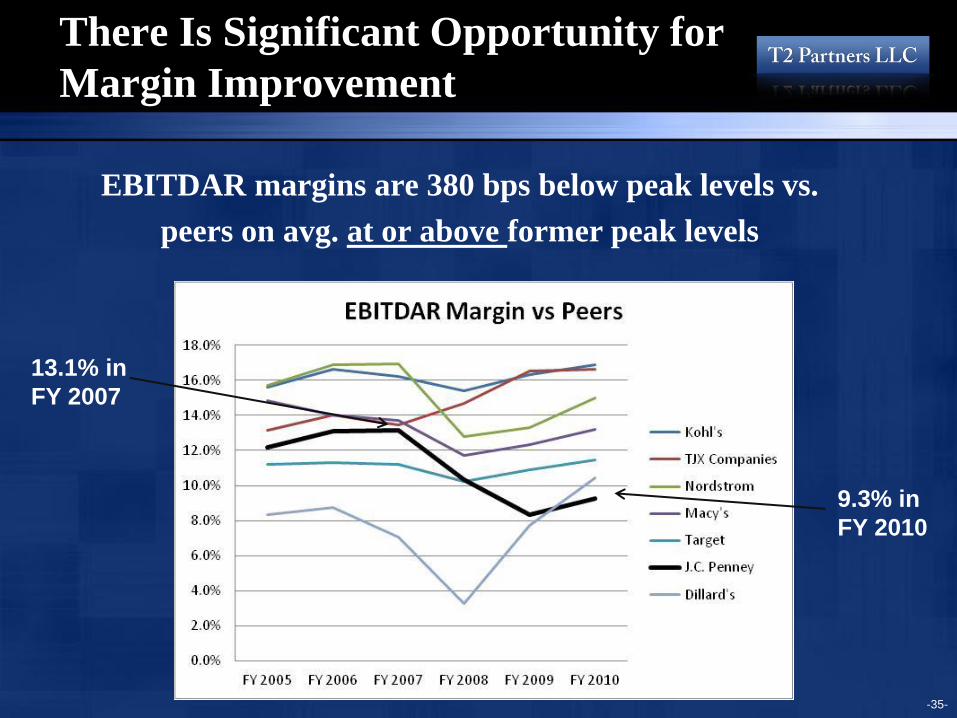
There Is Significant Opportunity for
Margin Improvement
EBITDAR margins are 380 bps below peak levels vs.
peers on avg. at or above former peak levels
-35-
13.1% in
FY 2007
9.3% in
FY 2010
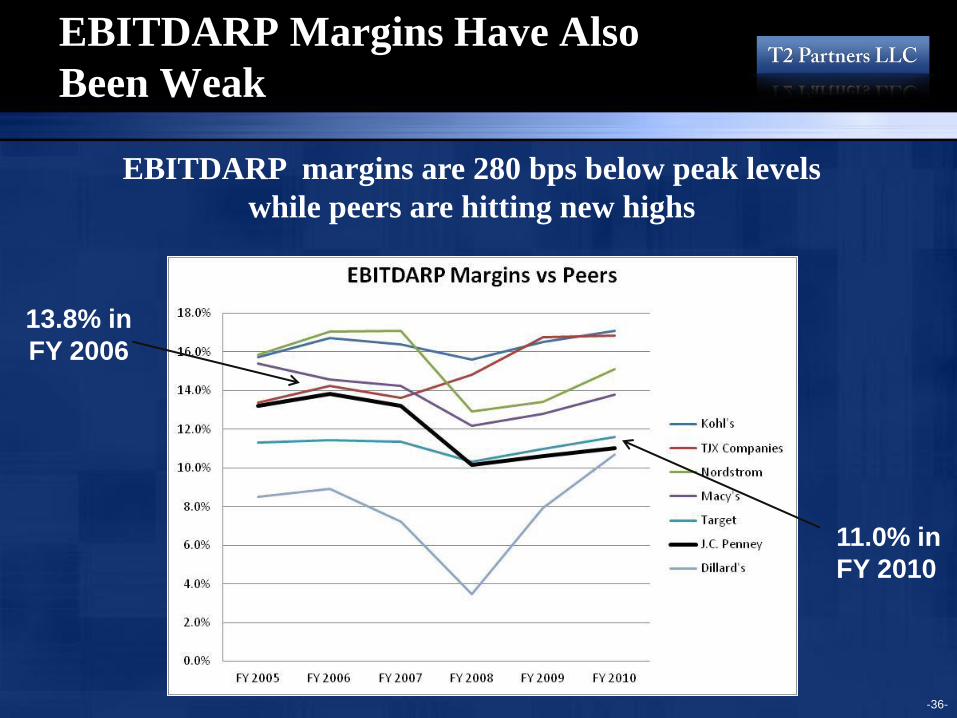
EBITDARP Margins Have Also
Been Weak
-36-
EBITDARP margins are 280 bps below peak levels
while peers are hitting new highs
13.8% in
FY 2006
11.0% in
FY 2010
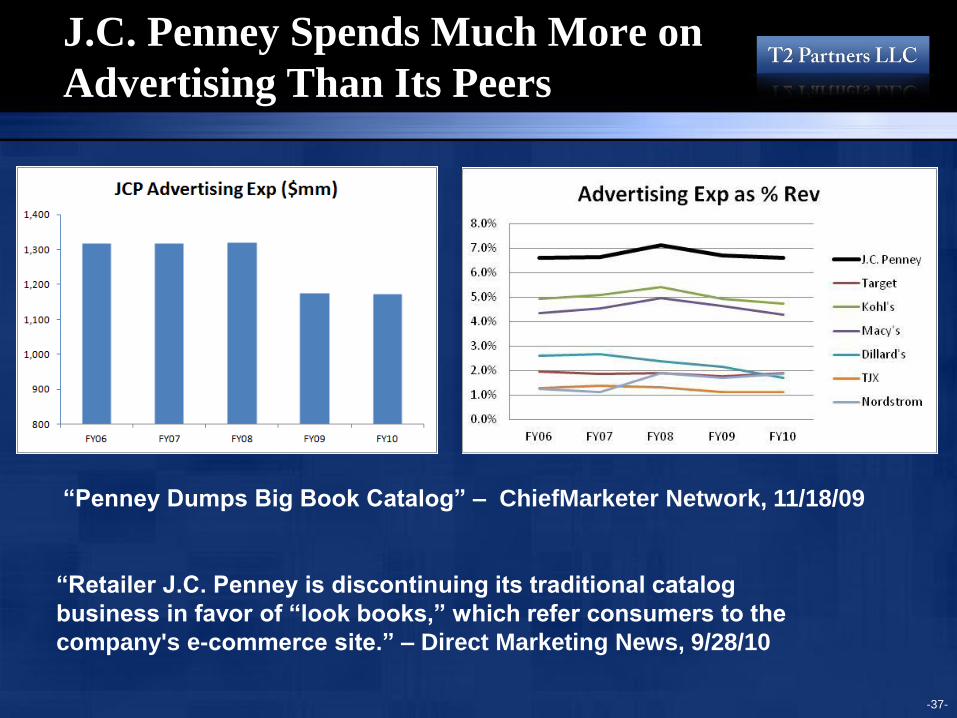
J.C. Penney Spends Much More on
Advertising Than Its Peers
-37-
“Penney Dumps Big Book Catalog” – ChiefMarketer Network, 11/18/09
“Retailer J.C. Penney is discontinuing its traditional catalog
business in favor of “look books,” which refer consumers to the
company's e-commerce site.” – Direct Marketing News, 9/28/10
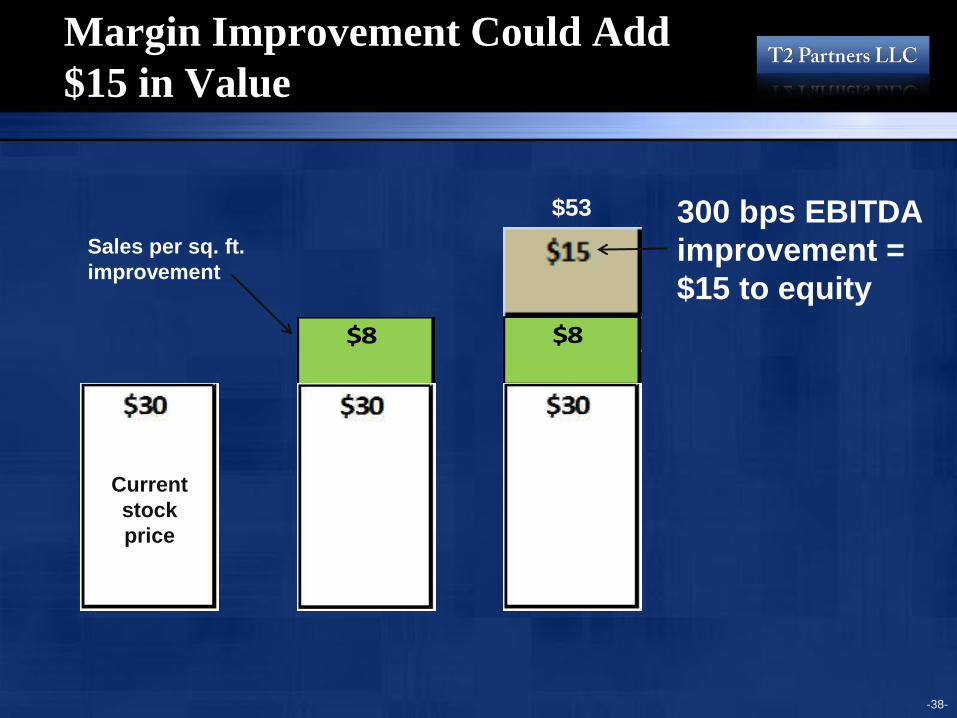
Margin Improvement Could Add
$15 in Value
-38-
Sales per sq. ft.
improvement
300 bps EBITDA
improvement =
$15 to equity
$53
Current
stock
price
$8
$8
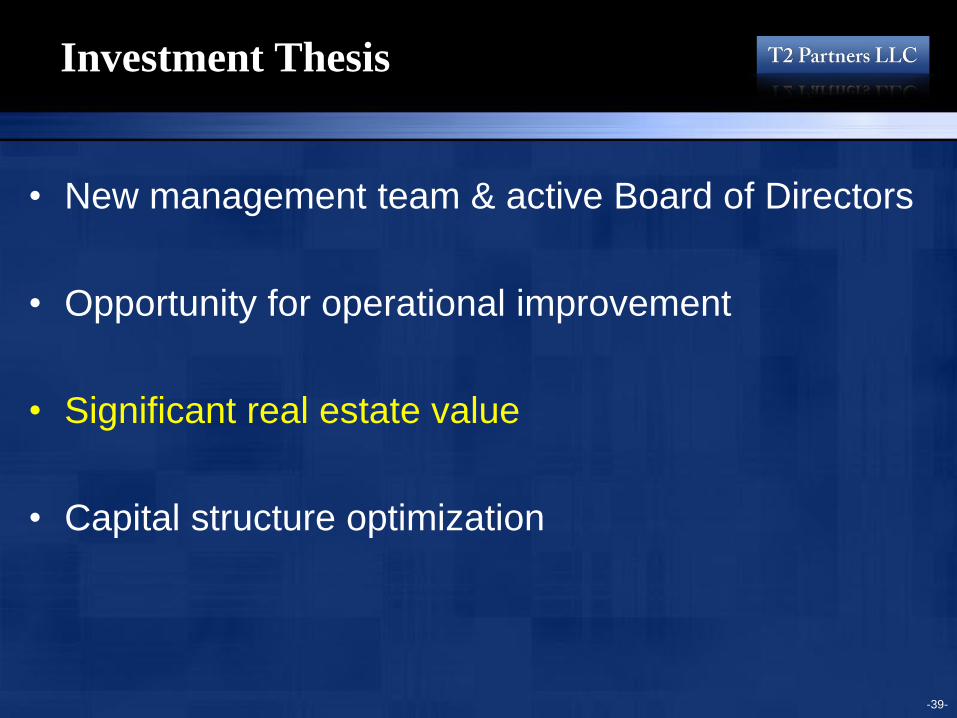
Investment Thesis
• New management team & active Board of Directors
• Opportunity for operational improvement
• Significant real estate value
• Capital structure optimization
-39-
-40-
JCP Real Estate Portfolio (1)
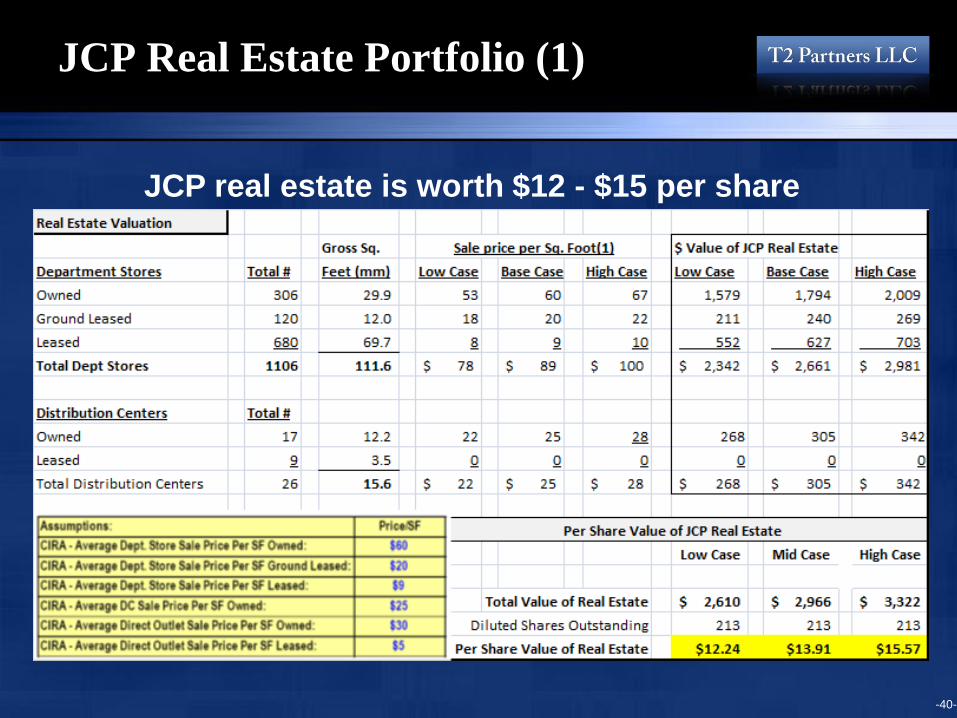
JCP real estate is worth $12 - $15 per share
JCP Real Estate Portfolio (2)
-41-
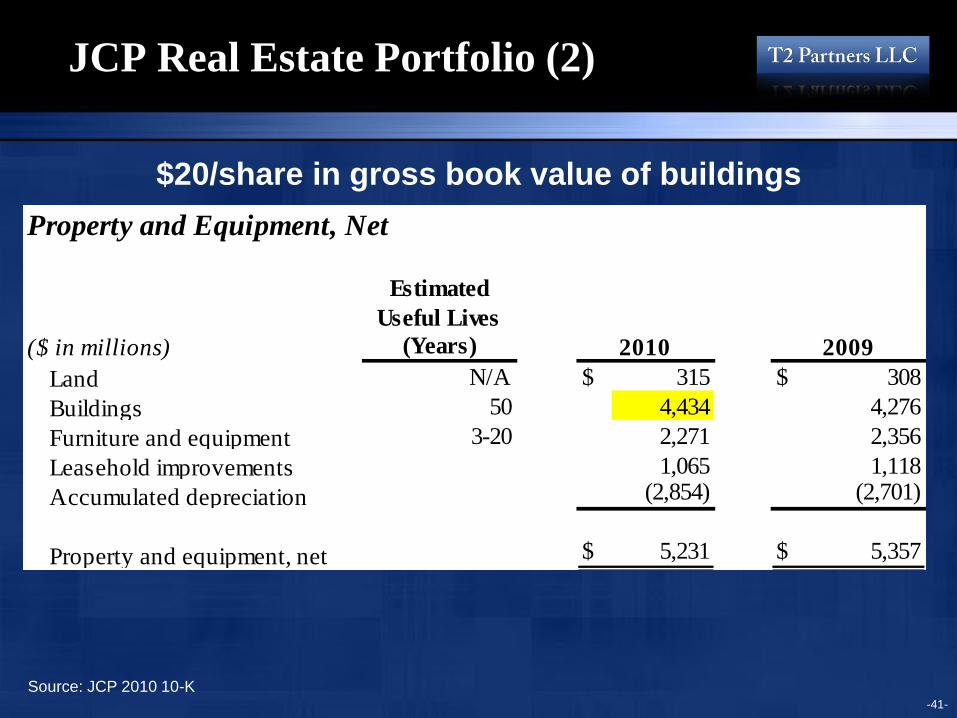
Property and Equipment, Net
Land N/A $ 315 $ 308
Buildings 50 4,434 4,276
Furniture and equipment 3-20 2,271 2,356
Leasehold improvements 1,065 1,118
Accumulated depreciation (2,854) (2,701)
Property and equipment, net $ 5,231 $ 5,357
2010 2009($ in millions)
Estimated
Useful Lives
(Years)
Source: JCP 2010 10-K
$20/share in gross book value of buildings
JCP Real Estate Portfolio (3)
• JCP spends ~$300m/yr to rent the 62% of stores it does
not own
• JCP pays itself ~$180mm in “synthetic rent” for the 38%
of company-owned stores
• $2.3b of owned real estate value (owned stores, ground
leased stores, owned distribution centers) implies 8%
cap rate on the “synthetic rent”
-42-
Valuation Based on Separate Retailer
and Real Estate Earnings Stream
-43-
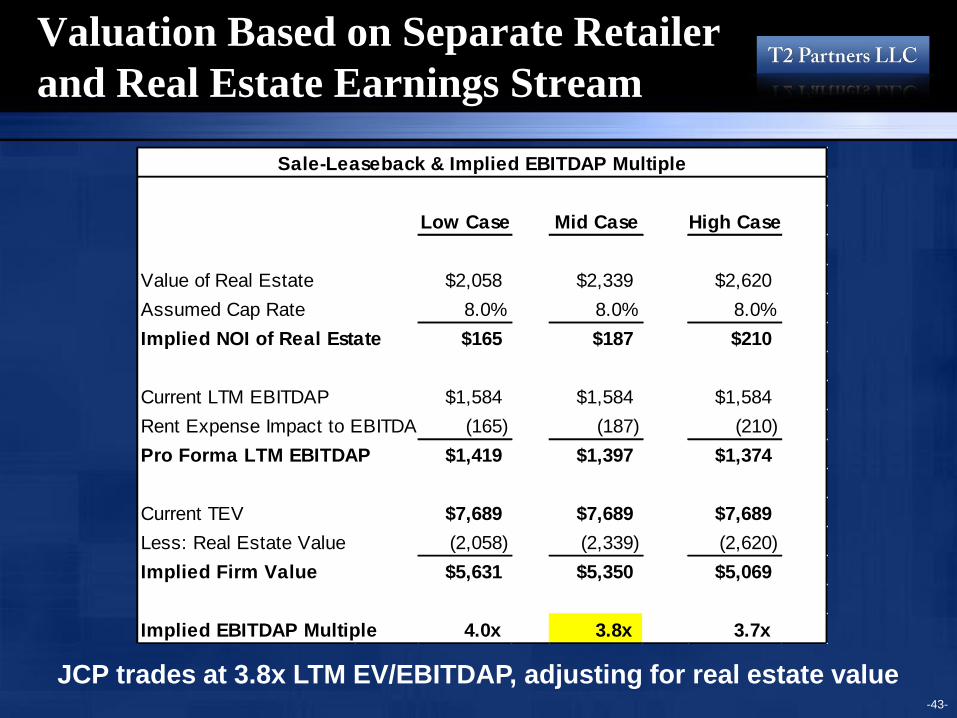
JCP trades at 3.8x LTM EV/EBITDAP, adjusting for real estate value
Sale-Leaseback & Implied EBITDAP Multiple
Low Case Mid Case High Case
Value of Real Estate $2,058 $2,339 $2,620
Assumed Cap Rate 8.0% 8.0% 8.0%
Implied NOI of Real Estate $165 $187 $210
Current LTM EBITDAP $1,584 $1,584 $1,584
Rent Expense Impact to EBITDAP (165) (187) (210)
Pro Forma LTM EBITDAP $1,419 $1,397 $1,374
Current TEV $7,689 $7,689 $7,689
Less: Real Estate Value (2,058) (2,339) (2,620)
Implied Firm Value $5,631 $5,350 $5,069
Implied EBITDAP Multiple 4.0x 3.8x 3.7x
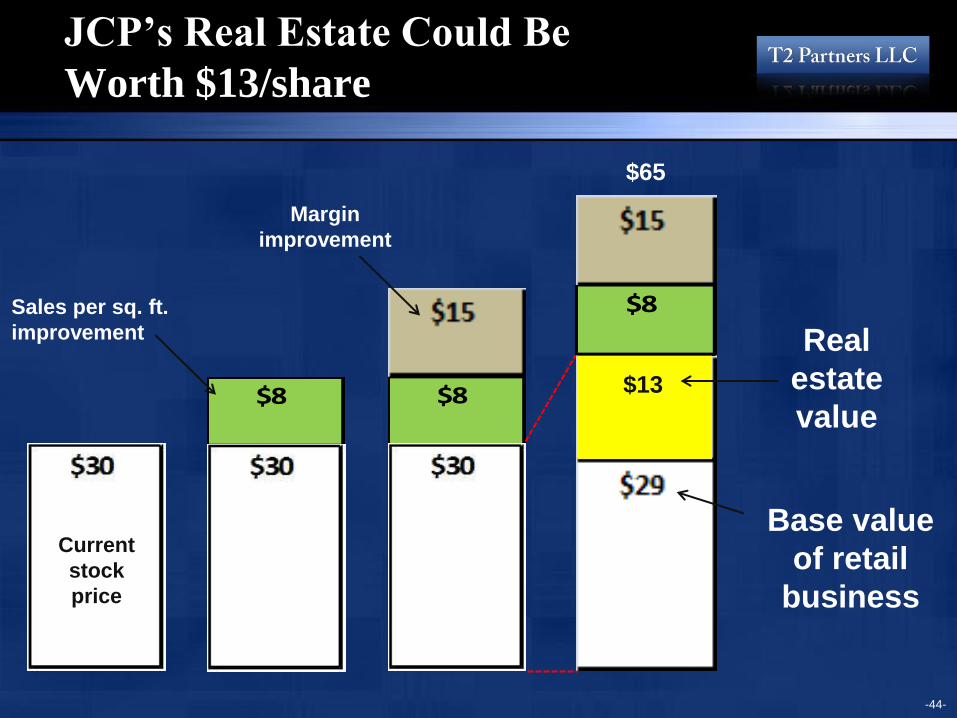
JCP’s Real Estate Could Be
Worth $13/share
-44-
Base value
of retail
business
Margin
improvement
Real
estate
value
Sales per sq. ft.
improvement
Current
stock
price
$8
$8
$8
$65
$13
Investment Thesis
• New management team & active Board of Directors
• Opportunity for operational improvement
• Significant real estate value
• Capital structure optimization
-45-
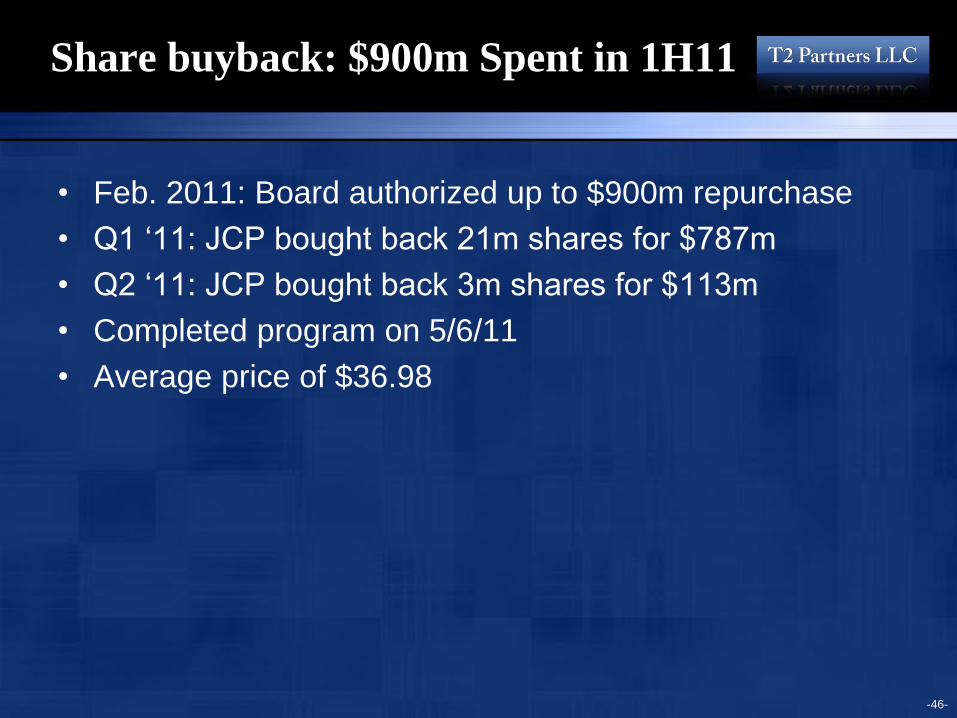
Share buyback: $900m Spent in 1H11
• Feb. 2011: Board authorized up to $900m repurchase
• Q1 ‘11: JCP bought back 21m shares for $787m
• Q2 ‘11: JCP bought back 3m shares for $113m
• Completed program on 5/6/11
• Average price of $36.98
-46-
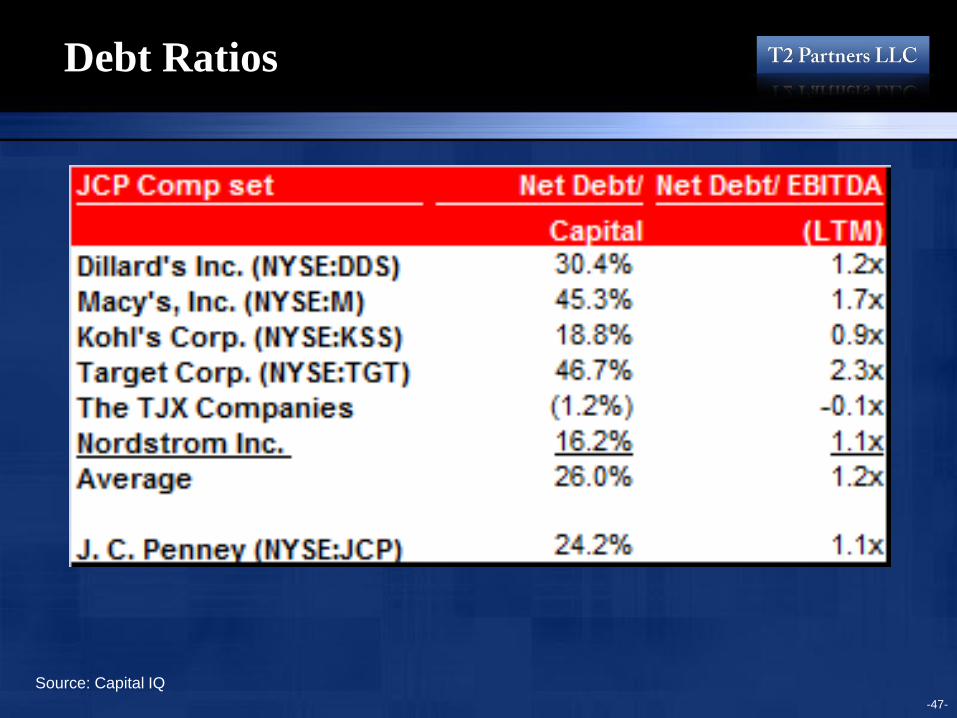
Debt Ratios
-47-
Source: Capital IQ
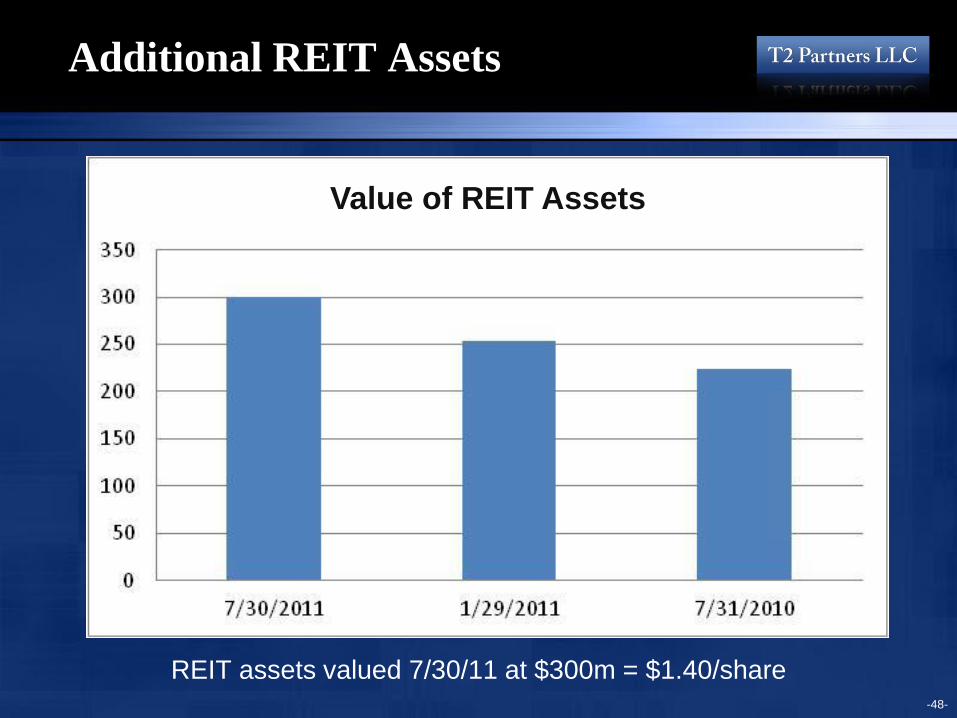
Additional REIT Assets
REIT assets valued 7/30/11 at $300m = $1.40/share
-48-
Value of REIT Assets
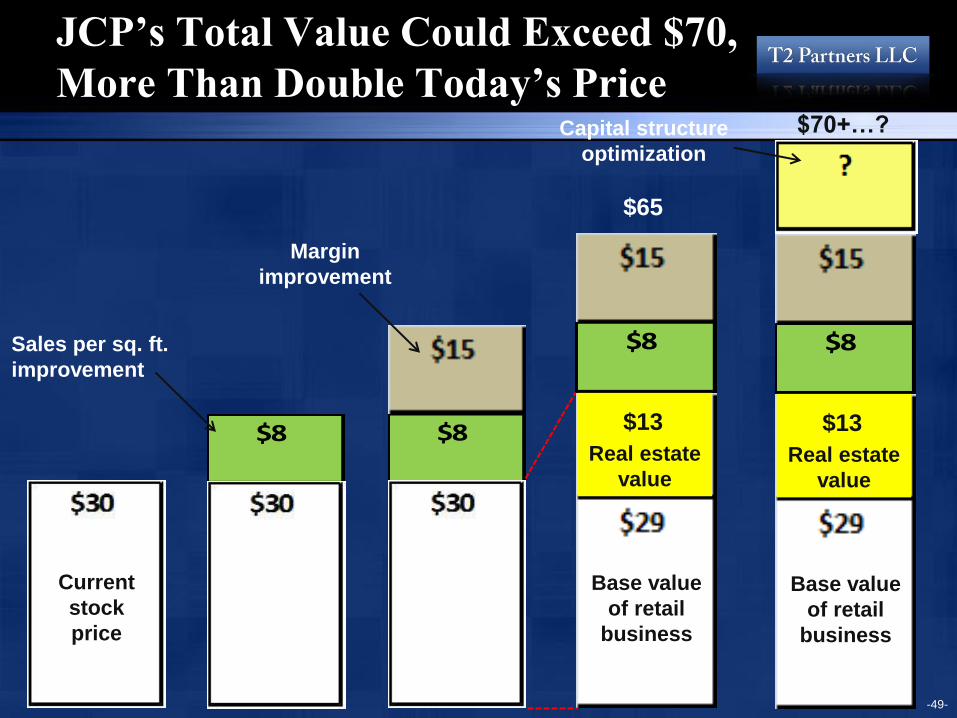
JCP’s Total Value Could Exceed $70,
More Than Double Today’s Price
-49-
Capital structure
optimization
$70+…?
Margin
improvement
Sales per sq. ft.
improvement
Current
stock
price
$8
$8
$8
$13
Real estate
value
Base value
of retail
business
$8
$13
Real estate
value
Base value
of retail
business
$65
-50-
Conclusion: Many Ways to Win
• Buy a decent, undermanaged business at a fair price
and get an extraordinary combination of people,
representing significant optionality, for free

Appendix
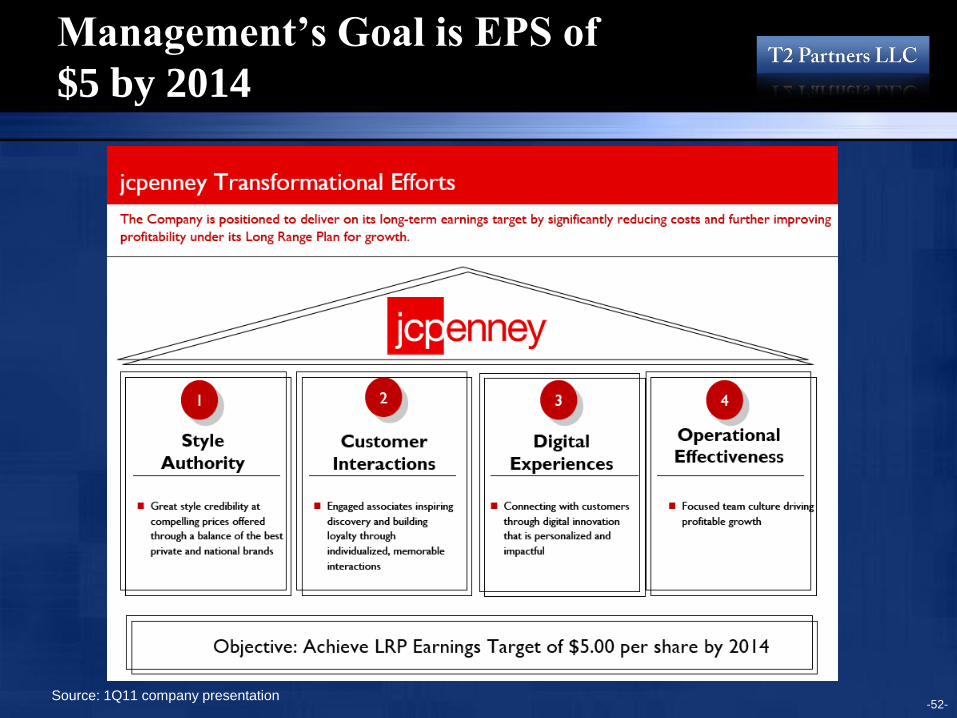
Management’s Goal is EPS of
$5 by 2014
-52- Source: 1Q11 company presentation
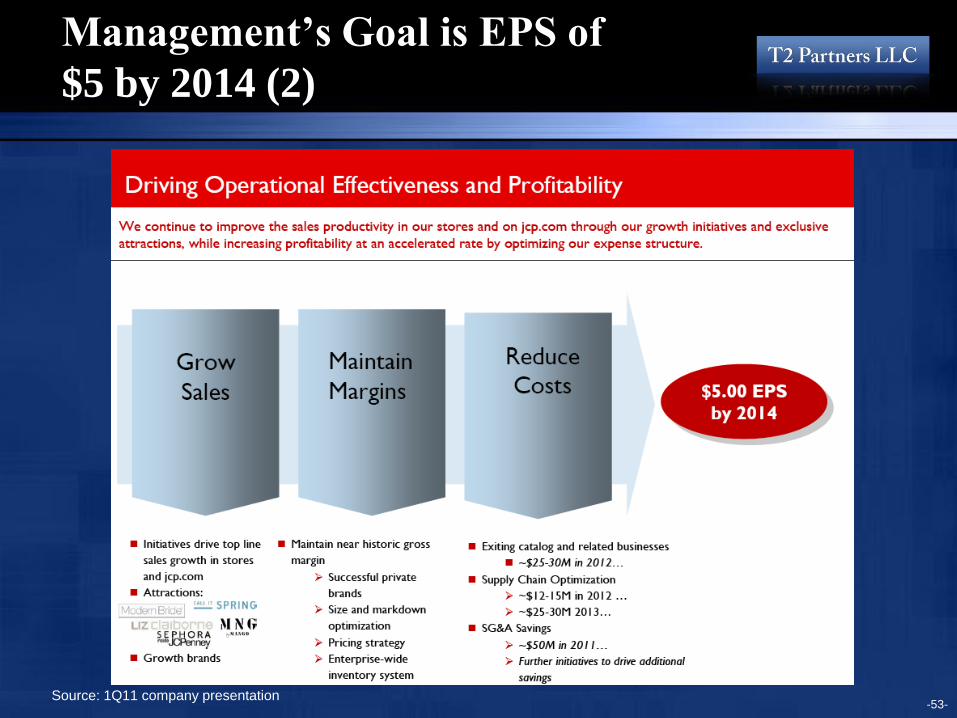
Management’s Goal is EPS of
$5 by 2014 (2)
-53- Source: 1Q11 company presentation
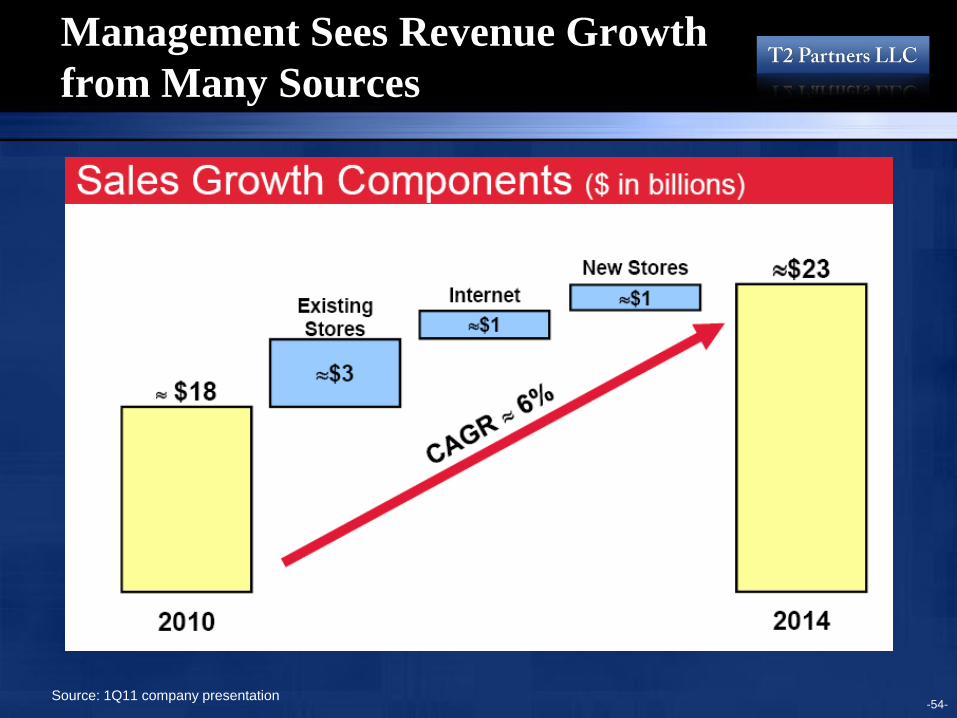
Management Sees Revenue Growth
from Many Sources
-54- Source: 1Q11 company presentation
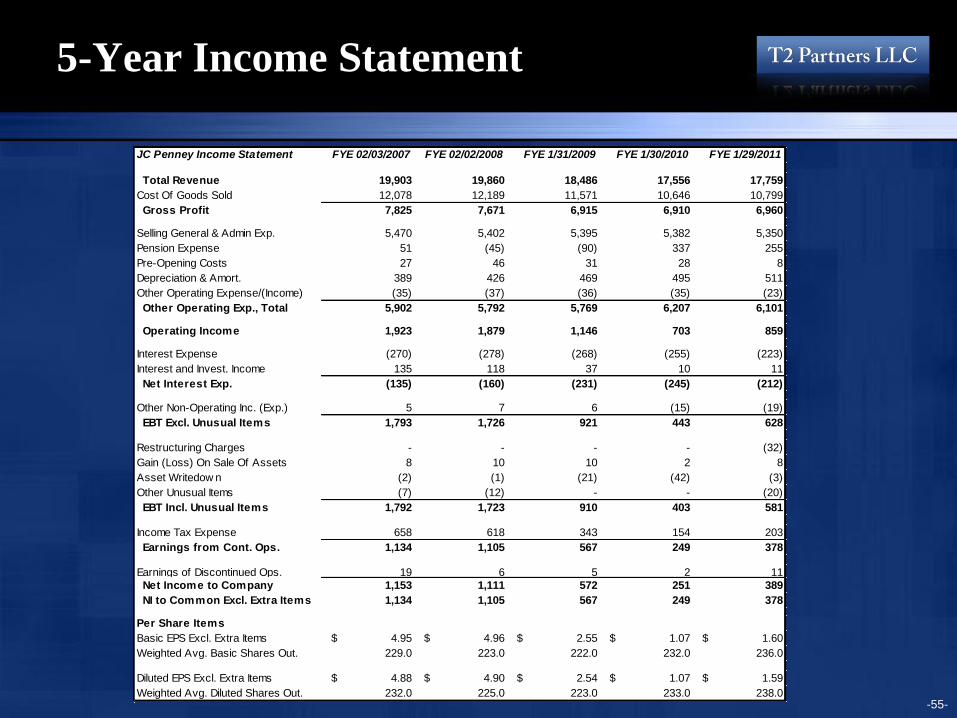
5-Year Income Statement
-55-
JC Penney Income Statement FYE 02/03/2007 FYE 02/02/2008 FYE 1/31/2009 FYE 1/30/2010 FYE 1/29/2011
Total Revenue 19,903 19,860 18,486 17,556 17,759
Cost Of Goods Sold 12,078 12,189 11,571 10,646 10,799
Gross Profit 7,825 7,671 6,915 6,910 6,960
Selling General & Admin Exp. 5,470 5,402 5,395 5,382 5,350
Pension Expense 51 (45) (90) 337 255
Pre-Opening Costs 27 46 31 28 8
Depreciation & Amort. 389 426 469 495 511
Other Operating Expense/(Income) (35) (37) (36) (35) (23)
Other Operating Exp., Total 5,902 5,792 5,769 6,207 6,101
Operating Income 1,923 1,879 1,146 703 859
Interest Expense (270) (278) (268) (255) (223)
Interest and Invest. Income 135 118 37 10 11
Net Interest Exp. (135) (160) (231) (245) (212)
Other Non-Operating Inc. (Exp.) 5 7 6 (15) (19)
EBT Excl. Unusual Items 1,793 1,726 921 443 628
Restructuring Charges - - - - (32)
Gain (Loss) On Sale Of Assets 8 10 10 2 8
Asset Writedow n (2) (1) (21) (42) (3)
Other Unusual Items (7) (12) - - (20)
EBT Incl. Unusual Items 1,792 1,723 910 403 581
Income Tax Expense 658 618 343 154 203
Earnings from Cont. Ops. 1,134 1,105 567 249 378
Earnings of Discontinued Ops. 19 6 5 2 11
Net Income to Company 1,153 1,111 572 251 389
NI to Common Excl. Extra Items 1,134 1,105 567 249 378
Per Share Items
Basic EPS Excl. Extra Items $ 4.95 $ 4.96 $ 2.55 $ 1.07 $ 1.60
Weighted Avg. Basic Shares Out. 229.0 223.0 222.0 232.0 236.0
Diluted EPS Excl. Extra Items $ 4.88 $ 4.90 $ 2.54 $ 1.07 $ 1.59
Weighted Avg. Diluted Shares Out. 232.0 225.0 223.0 233.0 238.0
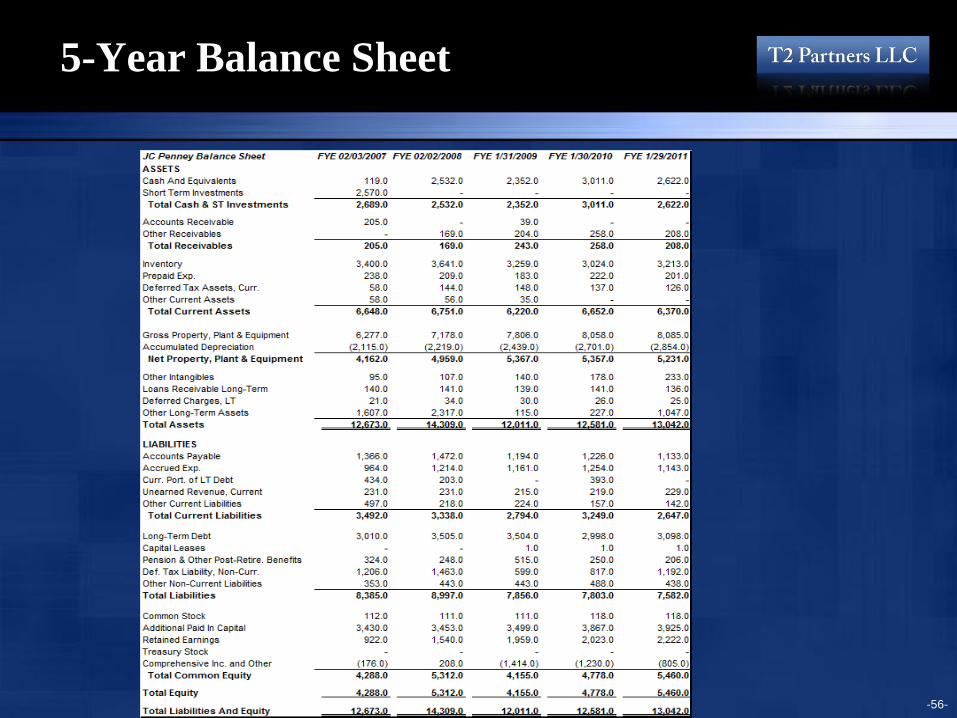
5-Year Balance Sheet
-56-
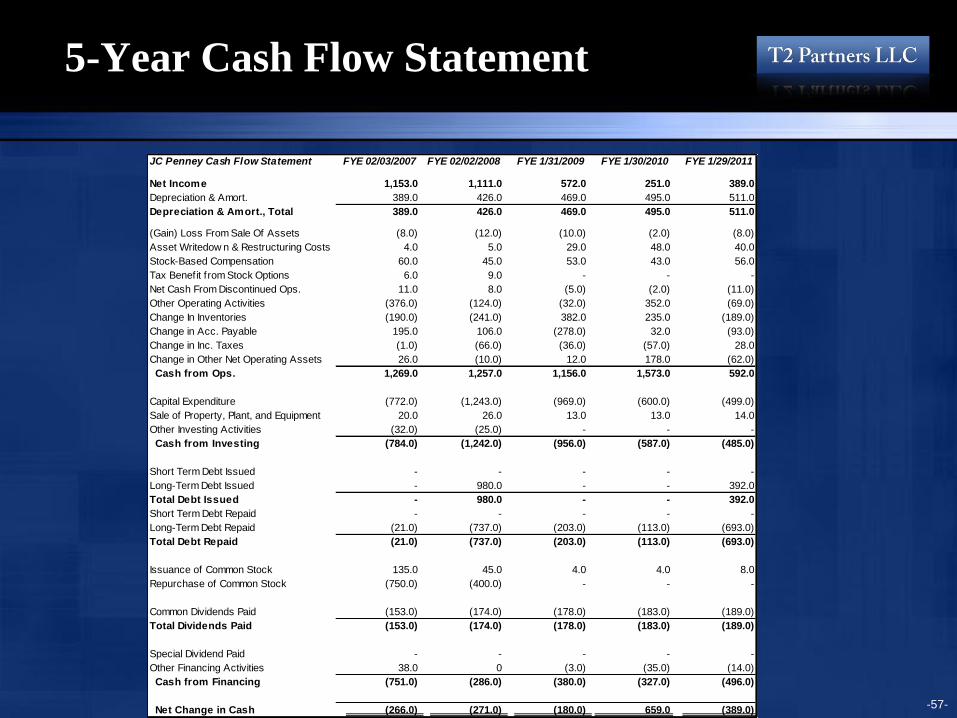
5-Year Cash Flow Statement
-57-
JC Penney Cash Flow Statement FYE 02/03/2007 FYE 02/02/2008 FYE 1/31/2009 FYE 1/30/2010 FYE 1/29/2011
Net Income 1,153.0 1,111.0 572.0 251.0 389.0
Depreciation & Amort. 389.0 426.0 469.0 495.0 511.0
Depreciation & Amort., Total 389.0 426.0 469.0 495.0 511.0
(Gain) Loss From Sale Of Assets (8.0) (12.0) (10.0) (2.0) (8.0)
Asset Writedow n & Restructuring Costs 4.0 5.0 29.0 48.0 40.0
Stock-Based Compensation 60.0 45.0 53.0 43.0 56.0
Tax Benefit from Stock Options 6.0 9.0 - - -
Net Cash From Discontinued Ops. 11.0 8.0 (5.0) (2.0) (11.0)
Other Operating Activities (376.0) (124.0) (32.0) 352.0 (69.0)
Change In Inventories (190.0) (241.0) 382.0 235.0 (189.0)
Change in Acc. Payable 195.0 106.0 (278.0) 32.0 (93.0)
Change in Inc. Taxes (1.0) (66.0) (36.0) (57.0) 28.0
Change in Other Net Operating Assets 26.0 (10.0) 12.0 178.0 (62.0)
Cash from Ops. 1,269.0 1,257.0 1,156.0 1,573.0 592.0
Capital Expenditure (772.0) (1,243.0) (969.0) (600.0) (499.0)
Sale of Property, Plant, and Equipment 20.0 26.0 13.0 13.0 14.0
Other Investing Activities (32.0) (25.0) - - -
Cash from Investing (784.0) (1,242.0) (956.0) (587.0) (485.0)
Short Term Debt Issued - - - - -
Long-Term Debt Issued - 980.0 - - 392.0
Total Debt Issued - 980.0 - - 392.0
Short Term Debt Repaid - - - - -
Long-Term Debt Repaid (21.0) (737.0) (203.0) (113.0) (693.0)
Total Debt Repaid (21.0) (737.0) (203.0) (113.0) (693.0)
Issuance of Common Stock 135.0 45.0 4.0 4.0 8.0
Repurchase of Common Stock (750.0) (400.0) - - -
Common Dividends Paid (153.0) (174.0) (178.0) (183.0) (189.0)
Total Dividends Paid (153.0) (174.0) (178.0) (183.0) (189.0)
Special Dividend Paid - - - - -
Other Financing Activities 38.0 0 (3.0) (35.0) (14.0)
Cash from Financing (751.0) (286.0) (380.0) (327.0) (496.0)
Net Change in Cash (266.0) (271.0) (180.0) 659.0 (389.0)
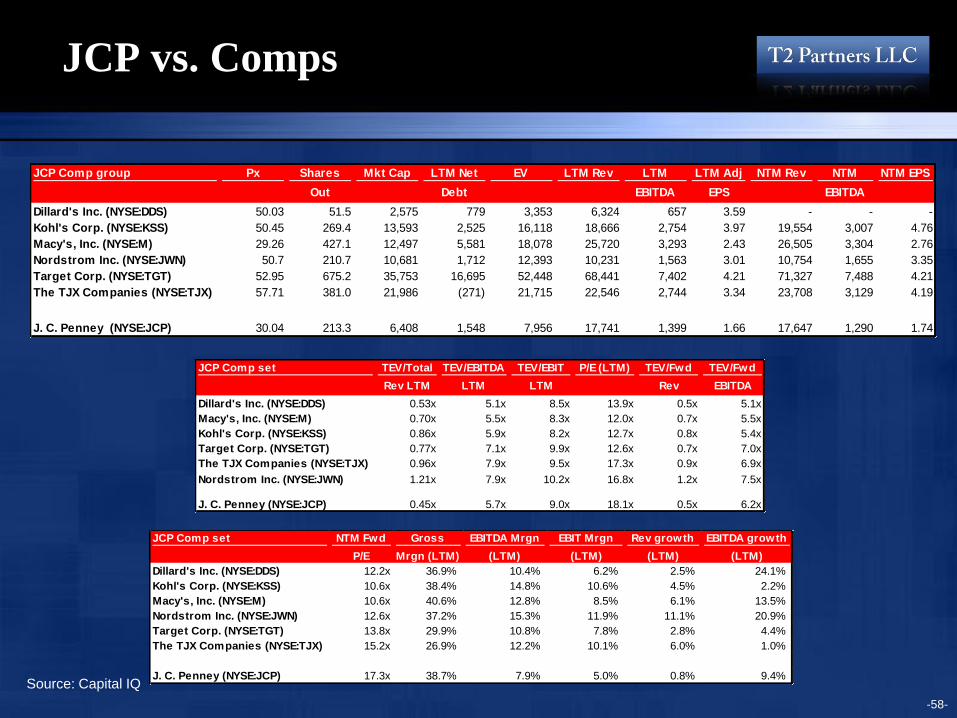
JCP vs. Comps
-58-
JCP Comp group Px Shares
Out
Mkt Cap LTM Net
Debt
EV LTM Rev LTM
EBITDA
LTM Adj
EPS
NTM Rev NTM
EBITDA
NTM EPS
Dillard's Inc. (NYSE:DDS) 50.03 51.5 2,575 779 3,353 6,324 657 3.59 - - -
Kohl's Corp. (NYSE:KSS) 50.45 269.4 13,593 2,525 16,118 18,666 2,754 3.97 19,554 3,007 4.76
Macy's, Inc. (NYSE:M) 29.26 427.1 12,497 5,581 18,078 25,720 3,293 2.43 26,505 3,304 2.76
Nordstrom Inc. (NYSE:JWN) 50.7 210.7 10,681 1,712 12,393 10,231 1,563 3.01 10,754 1,655 3.35
Target Corp. (NYSE:TGT) 52.95 675.2 35,753 16,695 52,448 68,441 7,402 4.21 71,327 7,488 4.21
The TJX Companies (NYSE:TJX) 57.71 381.0 21,986 (271) 21,715 22,546 2,744 3.34 23,708 3,129 4.19
J. C. Penney (NYSE:JCP) 30.04 213.3 6,408 1,548 7,956 17,741 1,399 1.66 17,647 1,290 1.74
JCP Comp set TEV/Total
Rev LTM
TEV/EBITDA
LTM
TEV/EBIT
LTM
P/E (LTM) TEV/Fwd
Rev
TEV/Fwd
EBITDA
Dillard's Inc. (NYSE:DDS) 0.53x 5.1x 8.5x 13.9x 0.5x 5.1x
Macy's, Inc. (NYSE:M) 0.70x 5.5x 8.3x 12.0x 0.7x 5.5x
Kohl's Corp. (NYSE:KSS) 0.86x 5.9x 8.2x 12.7x 0.8x 5.4x
Target Corp. (NYSE:TGT) 0.77x 7.1x 9.9x 12.6x 0.7x 7.0x
The TJX Companies (NYSE:TJX) 0.96x 7.9x 9.5x 17.3x 0.9x 6.9x
Nordstrom Inc. (NYSE:JWN) 1.21x 7.9x 10.2x 16.8x 1.2x 7.5x
J. C. Penney (NYSE:JCP) 0.45x 5.7x 9.0x 18.1x 0.5x 6.2x
JCP Comp set NTM Fwd
P/E
Gross
Mrgn (LTM)
EBITDA Mrgn
(LTM)
EBIT Mrgn
(LTM)
Rev growth
(LTM)
EBITDA growth
(LTM)
Dillard's Inc. (NYSE:DDS) 12.2x 36.9% 10.4% 6.2% 2.5% 24.1%
Kohl's Corp. (NYSE:KSS) 10.6x 38.4% 14.8% 10.6% 4.5% 2.2%
Macy's, Inc. (NYSE:M) 10.6x 40.6% 12.8% 8.5% 6.1% 13.5%
Nordstrom Inc. (NYSE:JWN) 12.6x 37.2% 15.3% 11.9% 11.1% 20.9%
Target Corp. (NYSE:TGT) 13.8x 29.9% 10.8% 7.8% 2.8% 4.4%
The TJX Companies (NYSE:TJX) 15.2x 26.9% 12.2% 10.1% 6.0% 1.0%
J. C. Penney (NYSE:JCP) 17.3x 38.7% 7.9% 5.0% 0.8% 9.4%Source: Capital IQ