An Analysis of Hazardous Materials Spills with a … Analysis of Hazardous Materials Spills with a...
70
1 An Analysis of Hazardous Materials Spills with a Focus on Oil and Gas Production A 2015 Undergraduate Practicum Project for the UCLA Institute of the Environment and Sustainability Client: Natural Resources Defense Council Advisor: Dr. Felicia Federico Team: Alex Caryotakis, Ian Davies, Sarah Hafiz, Justine Niketen, Daniel Noakes, Ruoyu Wang, Alison Wu
Transcript of An Analysis of Hazardous Materials Spills with a … Analysis of Hazardous Materials Spills with a...

1
An Analysis of Hazardous Materials Spills with a Focus on Oil and Gas Production A 2015 Undergraduate Practicum Project for the UCLA Institute of the Environment and Sustainability
Client: Natural Resources Defense Council
Advisor: Dr. Felicia Federico
Team: Alex Caryotakis, Ian Davies, Sarah Hafiz, Justine Niketen, Daniel Noakes, Ruoyu Wang, Alison Wu

2
Table of Contents
I. Executive Summary ........................................................................................................................ 4 II. Introduction ................................................................................................................................... 5 III. Background ................................................................................................................................... 5
A. Non-Traditional Oil and Gas Production: Well Stimulation Treatments ........................ 5 1. Production Process ............................................................................................................... 5 2. Chemicals Used ..................................................................................................................... 5 3. Pollution Pathways ................................................................................................................ 6
B. Public Health and Environmental Effects of Well Stimulation Treatments ................... 8 1. Water Pollution: ..................................................................................................................... 8 2. Air Pollution: ........................................................................................................................ 10
C. Environmental Justice ............................................................................................................ 10 D. Regulatory Background ......................................................................................................... 11
1. Hazardous Materials and Oil and Gas Regulation ......................................................... 11 IV. Methodology ............................................................................................................................... 17
A. Data Sources ............................................................................................................................ 17 1. Spill Data .............................................................................................................................. 17
B. Spill Volume vs. Spill Count .................................................................................................. 19 C. Number and Volume of Spills .............................................................................................. 20
1. Spill Count ............................................................................................................................ 20 2. Volumetric Analysis ............................................................................................................ 20
D. Spill Characteristics ................................................................................................................ 21 1. What types of hazardous materials were released? ........................................................ 21 2. What percentage of releases were contained? ................................................................. 21 3. What percentage of releases affected waterbodies? ....................................................... 22 4. Were there reported injuries or fatalities? ........................................................................ 22 5. Who provided clean-up services? ..................................................................................... 22
E. Spatial Analysis ........................................................................................................................ 22 1. Distribution of Oil and Gas Related Spills in Kern County ......................................... 22 2. Geocoding Oil and Gas Related Spills in Kern County ................................................ 23 3. Visualizing Well Data ......................................................................................................... 24 4. Spill and Well Density ........................................................................................................ 25 5. Land Use Analysis ............................................................................................................... 25

3
F. Spills from Conventional and Unconventional Oil and Gas Production ....................... 25 1. Spill volume per unit production in Los Angeles and Kern Counties ........................ 25 2. Effect of Hydraulic Fracturing on Spill Frequency ....................................................... 26
V. Results ........................................................................................................................................... 27 A. Number and Volume of Spills .............................................................................................. 27
1. Number of Reported Spills ................................................................................................ 27 2. Annual Volumetric Analysis of Spills .............................................................................. 28 3. Statistical Distribution of Spill Volumes ......................................................................... 31
B. Spill Characteristics ................................................................................................................. 33 1. What types of hazardous materials were released? ........................................................ 33 2. What percentage of releases were contained? ................................................................. 34 3. What percentage of releases affected waterbodies? ....................................................... 35 4. Were there reported injuries or fatalities? ........................................................................ 35 5. Who provided clean-up services? ..................................................................................... 37
C. Spatial Analysis ........................................................................................................................ 38 1. Spatial Distribution of Oil and Gas Related Spills in Kern County ............................ 38 2. Spill and Well Density ........................................................................................................ 39 3. Land Use Analysis ............................................................................................................... 42
D. Spills from Conventional and Unconventional Oil and Gas Production ...................... 43 1. Spill volume per unit production in Los Angeles and Kern Counties ........................ 43 2. Effect of Hydraulic Fracturing on Spill Frequency ....................................................... 44
VI. Discussion and Conclusions .................................................................................................... 46 VII. Recommendations ................................................................................................................... 47
A. The California Office of Emergency Services (Cal OES) ................................................ 47 B. The California Division of Oil, Gas, and Geothermal Resources (DOGGR) .............. 48
VII. Appendices ................................................................................................................................ 49 Appendix A: ............................................................................................................................. 49 Appendix B: .............................................................................................................................. 49 Appendix C: ............................................................................................................................. 49 Appendix D: ............................................................................................................................. 49 Appendix E: ............................................................................................................................. 50
VI. References .............................................................................................................................. 65
4
I. Executive Summary Our team analyzed reported hazardous material releases in California to assess the
number, volume, characteristics and trends over time, with particular attention paid to oil and gas related releases. Within a nine-year period from 2006 to 2014, we analyzed characteristics that included substance, location, site characteristics, containment, water body impacts, injuries or fatalities, and cleanup services. Our analysis found that spill frequency remained constant in California from 2006 to 2014, but total spill volume increased 69% from 2013 to 2014. Oil and gas spills in Kern County decreased, mirroring the decrease in California oil production. We also sought to determine if there were differences in the number of spills associated with unconventional oil and gas production (hydraulic fracturing) compared to conventional production; however, we were unable to conduct a meaningful statistical analysis due to data limitations relating to both spills and oil wells. We include recommendations for the Division of Oil, Gas, and Geothermal Resources (DOGGR) and the California Office of Emergency Services (Cal OES) around improving the quality and accessibility of their data.

5
II. Introduction The United States’ oil production is at a 15 year high (Heinberg, 2013). New
methods of oil extraction, namely hydraulic fracturing, have allowed oil and gas producers across the nation and in California to extract more oil than was possible in decades before. However, with these new methods of extraction come a host of new concerns, including the potential for groundwater contamination and hazardous chemical spills.
The goal of this project was to analyze hazardous materials spills in California, to understand their frequency, location, and characteristics, and to determine if there are relationships between oil and gas production methods and hazardous materials spills.
This report provides: a background on the processes and regulations relating to oil and gas production and hazardous material releases (Section C), our analysis methodology (Section D), and the results, conclusions and recommendations resulting from our research (Sections E-H).
III. Background
A. Non-Traditional Oil and Gas Production: Well Stimulation Treatments 1. Production Process
Hydraulic fracturing, often called “fracking”, is a well stimulation process used to extract oil and natural gas from reservoir rocks of low permeability, usually fine-grained sandstones and shales (FracFocus, 2015a). In hydraulic fracturing, large amounts of water and chemical additives are injected into a well at high pressures to fracture the rock formation and allow for extraction of the trapped hydrocarbons.
After hydraulic fracturing has occurred but before production begins (i.e. before oil or gas begins flowing through the well), fracturing fluid may return through the wellbore to the surface as flowback water which is then stored and reused in other drilling operations. However, up to 90% of fracking fluid may remain underground (Lutz et al., 2013). After production has begun, “produced water”, which has had contact with oil and gas, returns to the surface (Geological Society of America, 2015; EPA, 2012b).
Based on available well data, an estimated 100 to 150 wells per month are hydraulically fractured in California, mostly for heavy crude oil (Jordan et al., 2014).
2. Chemicals Used

6
Although water comprises over 99% of fracking fluid by weight, a variety of chemicals are also used. The composition of fracking fluid is adapted to the requirements of each well. Common components include acids to dissolve material and reduce clogging, friction reducers, and surfactants to improve flow through pipes (Colborn et al, 2011).
A study conducted by Congressional Committee on Energy and Commerce shows that a about 2500 products and 750 chemicals are used by 14 companies (Waxman, 2011). The most widely used chemical was methanol (found in 342 products), followed by isopropyl alcohol (274 products), 2-butoxyethanol (126 products) and ethylene glycol (119 products). (Waxman, 2011). Twenty-nine of the reported products were known or possible carcinogens, regulated contaminants under the Safe Drinking Water Act, or hazardous air pollutants under the Clean Air Act. Additionally, many unconventional oil and gas operators use proprietary chemicals in their fracking fluids. These “trade secret” chemicals are protected from disclosure (Waxman, 2011).
When flowback water returns to the surface, it is made up mostly of the original fluid and chemical mix with a salinity content that increases as a function of time since initial injection. Produced water, on the other hand, contains hydrocarbons as well as naturally occurring chemicals from within the rock formations. These chemicals typically include hyper saline reservoir water, oil and other hydrocarbons, and toxic elements like radium, barium and strontium. All of these chemical characteristics vary with the geology of the exploited formation (Vengosh et al., 2014).
Due to the overlap of many chemicals used in both processes, it is difficult to differentiate between spills and contamination from traditional oil and gas operations and those from WSTs. However, efforts have been made to more effectively and appropriately attribute spills to WSTs, such as using boron and lithium as tracers from shale formations (Warner et al., 2014). These techniques, coupled with greater transparency for proprietary chemical disclosures, are promising advances in tracing spills and contaminant migration to unconventional oil and gas sources.
3. Pollution Pathways In hydraulic fracturing, waste materials are generated during both the fracturing and
production phases. The main areas of concern lie in pollution from above ground spills during the handling, transport, and storage of waste and in the potential for unrecovered subsurface fracturing fluid to migrate to aquifers, and groundwater contamination from natural gas leaks around fractured wells (Vengosh et al., 2014). Pollution pathways are divided into direct and indirect processes.

7
Figure 1: Potential pollution pathways from hydraulic fracturing. (Source: Rozell & Reavan, 2012)
a) Direct Pollution
Direct pollution is the (mostly subsurface) contamination of soil or groundwater resulting from high-pressure fracturing and the withdrawal of fluids and hydrocarbons. There is concern that the high-pressure fracturing process can create pathways for fracking fluid and hydrocarbons, especially methane, to migrate into aquifers used for drinking water and irrigation. Other pathways are well-casing failures and seal failure near the mouth of the wellbore. Statistical analysis of hydraulic fracturing contamination events suggests that well failure, not high-pressure fracturing, causes most groundwater pollution (Darrah et al., 2014).
Another study suggested that fluid migration through fractures is a high potential risk, but waste disposal contamination risk is several orders of magnitude larger (Rozell et al., 2012). In nearly all studies of this kind, uncertainty over pollution pathways made it difficult to determine the degree of threat posed by fluid migration. Nearly all studies emphasize the much greater risk that mishandling, illicit dumping, and unregulated disposal of produced water waste poses to natural resources in the U.S.
b) Indirect Pollution
Indirect pollution is soil or water contamination resulting from processes related to hydraulic fracturing that occur beyond the fracturing and withdrawal process. This includes the transport, storage, and disposal of flowback and produced water.
Although hydraulic fracturing generates less wastewater than conventional methods per unit of resource produced, especially in California, proper disposal of produced water from unconventional oil and gas operations is a serious environmental concern (Lutz et al., 2013). According to an EPA study, the most common disposal process for hydraulic fracturing waste involves separating fracturing fluids from the recovered oil and gas, pumping it into trucks, treating it to proper disposal standards at a plant, and injecting it into wells (California Research Bureau, 2014). Every step of this process presents a possible pollution pathway for produced water. Wastewater treatment facilities are sometimes used for disposal, but are often unable to completely remove the radioactive elements and total

8
dissolved solids (TDS) that produced water carries (Lutz et al., 2013). Because of this, between 95-98% of wastewater from fracking in the US is injected into Safe Drinking water Act (SDWA) Class II underground injection control (UIC) wells (see section Oil and Gas Regulations) (Lutz et al., 2013).
Offsite commercial disposal is used mostly by small operators for whom building, running, and closing an onsite disposal facility is not economically feasible (Argonne, 2009). In California, the water that is not injected underground is mostly disposed of through settling ponds or is treated for beneficial reuse, such as agriculture (Argonne, 2009). In Kern County, increased scrutiny has fallen on the use of unlined ponds for produced water disposal. Several studies, including one in 2014 by Clean Water Action, demonstrated that waste in unlined pits near McKittrick, CA migrated into wells used for irrigation and drinking water (Clean Water Action, 2014).
B. Public Health and Environmental Effects of Well Stimulation Treatments 1. Water Pollution:
This review looked for instances of the release of chemicals from fracturing operations into water resources via the pathways previously discussed. Excluded were studies on the disposal of treated hydraulic fracturing wastewater directly into surface waters, as the majority of fracturing fluid in California is disposed of via underground injection or in wastewater pits (DOGGR, 2014). The discussion below includes two studies on contamination of water resources via underground pathways, one on surface spills, and one on instances of improper underground injection disposal of hydraulic fracturing waste.
a) Indirect:
A study by Gross et al., in the Journal of the Air and Waste Management Association analyzed whether surface spills at hydraulic fracturing operations led to groundwater contamination, specifically of benzene, toluene, ethylbenzene, and xylene (BTEX) chemicals. The Colorado Oil and Gas Conservation Commission (COGCC) database provided data on surface spills at sites in Weld County, Colorado between July 2010 and July 2011 (Gross et al, 2013). Researchers analyzed 77 spills. Groundwater samples collected at the spill sites showed that benzene levels were 2.2 times higher, toluene levels 3.3 times higher, ethylbenzene levels 1.8 times higher, and xylene levels 3.5 times higher than groundwater samples collected outside the spill area. BTEX levels tended to decrease rapidly with time and distance from the spill site (Gross et al, 2013). However, the study serves as a demonstration of the potential of surface spills to directly affect groundwater quality.
The second study provides a recent example of mismanagement of underground fracking wastewater disposal occurred within Californian Class II injection wells. In September 2014, the State Water Board conceded to the EPA that 9 underground injection control wells injected wastewater from natural gas operations into drinking water aquifers

9
protected under the Safe Drinking Water Act. The board tested 8 public wells within a 1 mile radius of the UIC wells in question and found that four exceeded the Maximum Contaminant Level (MCL) for nitrate, arsenic, and thallium (Bishop, 2014; Schon, 2014).
b) Direct:
A study by Fontenot et al., in Environmental Science and Technology looked at water quality in 100 private wells surrounding the Barnett Shale formation in North Texas. Historic levels of arsenic, nitrates and volatile organic compounds (VOCs) from the United States Geological Survey were compared to current groundwater quality in 91 wells within a 5 kilometer radius of active natural gas extraction operations, 4 wells with no active operations within a 14 kilometer radius, and 5 inactive, control wells (Fontenot et al, 2013). The results showed that mean total dissolved solids (TDS) in active extraction areas exceeded the maximum contaminant level (MCL) set by the EPA, but historical data indicated similar levels for the region. Similarly, researchers observed methanol and ethanol in samples from both the active and inactive study areas. The chemicals were not correlated with distance to the nearest gas well (Fontenot et al, 2013). The constituents found to be higher in active areas than inactive areas were arsenic, selenium, and strontium. The researchers suggest a variety of contributing factors to this contamination, including mechanical disturbances from drilling activity, reduction of the water table from groundwater withdrawals, and faulty drilling equipment and well casings (Fontenot et al, 2013).
A study by Osborn et al., in the Proceedings of the National Academy of Science looked at methane contamination in drinking-water wells in the Marcellus and Utica shale formations in northeastern Pennsylvania and upstate New York, comparing wells within areas of active natural gas exploration and wells in inactive areas. Of 60 wells studied, 51 showed methane contamination. Concentrations of methane were 17-times higher nearby natural gas drilling operations (Osborn et al, 2011). Even more, the authors used stable isotope analysis to differentiate between shallow, naturally occurring methane and deep, thermogenic methane associated with fracking. Thermogenic methane was found to be the source of contamination at active sites, while biogenic methane was common at inactive sites (Osborn et al, 2011). The study also looked at general groundwater contamination associated with fracturing fluids. Using a contemporary sample of 68 wells and the historical data of 124 wells in the Catskill and Lockhaven aquifers, the researchers used three indicators of contamination: major inorganic chemicals, stable isotope signatures of water, and isotopes of dissolved constituents. The study found no connection between active drilling areas and general contamination in nearby wells (Osborn et al, 2011).
It is important to keep in mind that much of the literature on public health effects of WST fluid or spill contamination is limited by knowledge of the specific chemical composition of fracturing fluid. Incomplete MSDS information, a lack of Chemical Abstract Service (CAS) numbers to uniquely identify chemicals and chemical mixes, and trade secret claims by operators limited the all of the above studies and others of their kind. In addition, without baseline information on water quality or isotope tracking, it is difficult to impossible to causally link hydraulic fracturing operations to groundwater contamination. The study by Gross et al provided no measure of historical background levels of BTEX, therefore causality is not certain. In fact, a review by Samuel Schon faults the study by

10
Osborn et al., for not providing geochemical measurements of dissolved methane (Schon, 2014).
Next, it is worthy to note that many of the studies on hydraulic fracturing chemicals and accidental release come from outside California. The study from the Journal of Human and Ecological Risk Assessment obtained product and chemical information from Colorado, Wyoming, New Mexico, Texas, Washington, Montana, Pennsylvania, and New York. The three other cited studies come from the Barnett, Marcellus, and Utica shale formations. In all, much of the published literature on hydraulic fracturing and its effects on groundwater are from study areas outside of California, likely due to the fact that the state does not have as extensive of a hydraulic fracturing industry as other parts of the US (US Department of Energy, 2011). Thus, one should keep in mind the difference between California fracking and general American fracking amount when weighing the probability of groundwater quality damage from fracking.
In all, the above studies give context for the public health concerns of hydraulic fracturing fluid and the ways in which it may enter groundwater. More research is needed to steadfastly claim a causal connection between fracking and groundwater contamination; however, data point to probable risk.
2. Air Pollution: A recent independent study by P. Macey et al, “Air Concentrations of Volatile
Compounds near Oil and Gas Production” examined the air concentrations of volatile compounds in hydraulic fracturing sites through a community-based exploratory study in five American states: Ohio, Pennsylvania, Arkansas, Colorado, and Wyoming. A total of 75 volatile organics were measured through passive air samples near industrial operations. Levels of eight of these volatile chemicals were found to exceed federal guidelines (Macey, 2014). Benzene, formaldehyde, and hydrogen sulfide were the most common compounds to exceed acute and other health-based risk levels (Macey, 2014). For instance, the exposure to benzene experienced in five minutes at one Wyoming site was equal to the exposure experienced living in LA for two years. Benzene is known to cause irritation of the skin, eyes, and upper respiratory tract (U.S. EPA 2011). Long-term exposure may cause blood disorders, reproductive and developmental disorders, and cancer (Outdoor Air, 2011). Hydrogen sulfide levels in the Wyoming site were also 90 to 60,000 times greater than the recommended levels at one given time during the study period (Francis, 2014). Hydrogen sulfide can cause respiratory tract and eye irritation, headaches, poor memory, and loss of appetite among other symptoms (Francis, 2014).
C. Environmental Justice According to the EPA, environmental justice is the fair treatment and meaningful
involvement of all people regardless of race, color, national origin, or income with respect to the development, implementation, and enforcement of environmental laws, regulations, and policies (U.S. EPA, 2014a).
A study by Srebotnjak et al. examined which communities were the most disproportionately at risk due to oil and gas drilling in California. According to their research, approximately 5.4 million Californians (14 % of the state's population) live within

11
one mile of an existing oil and gas well (Srebotnjak, 2014). In addition, 1.8 million of these individuals live in already environmentally polluted areas (Rotkin-Ellman, 2014). Approximately 92% of the individuals within those 1.8 million are people of color. The demographics of the population living near wells in California consist primarily of Hispanics/ Latinos (Srebotnjak, 2014).
A separate study analyzed one particular oil and gas community in Kern County, California. Kern County has more than 63,000 of the state’s 84,434 active and new oil and gas wells (Rotkin-Ellman, 2014). The researchers found that one in three residents live within one mile of an oil or gas well (35% of the county’s population) (Rotkin-Ellman, 2014). These individuals are at a greater risk of potential health impacts. According to the Desert Renewable Energy Conservation Plan, Kern County’s total population size is about 839,153 with 61.4% belonging to a minority group (Desert Renewable Energy Conservation Plan, 2014). The percent of low-income individuals in Kern County is 22.5%. California as a whole has a minority population of 59.9%, with 15.3% falling within the low-income population. (Desert Renewable Energy Conservation Plan, 2014)
D. Regulatory Background
1. Hazardous Materials and Oil and Gas Regulation
a) Hazardous Material Release Regulations
Reporting is to be made to the Office of Emergency Services. The California Code hat the immediate reporting of a hazardous material spill to land is only required if there is “reasonable belief” that the spill may pose a threat to public health, property, or the environment. A written report of the spill initially called into OES is required 30 days after the release and sent to the Chemical Emergency Planning and Response Commission. The reportable quantities of chemicals can be found on two lists. The first is the Extremely Hazardous Substances list. The second is the more detailed Consolidated List of Chemicals (California Office of Emergency Services, 2014a).
b) Oil and Gas Regulations
i. Federal Level Regulations Some hazardous material from conventional oil and gas production has been
exempted from CERCLA, CWA, and RCRA. CERCLA requires the clean up of hazardous substances, however, substances derived from oil and gas production are not required to be reported under CERCLA unless reaching waters of the United States and creating a “sheen” or “film”. The Clean Water Act regulates the discharges of pollutants into the waters of the United States. It excludes sediment as a pollutant when it is generated from oil and gas production. Last, RCRA governs the disposal of hazardous wastes. It exempt oil and gas produced water and drilling fluids from monitoring and disposal requirements (U.S. EPA, 2002, 2012, 2014b).

12
ii. State Level regulations: In California, DOGGR monitors oil and gas production in California. DOGGR
oversees the drilling, operation, maintenance, and plugging and abandonment of oil, natural gas, and geothermal wells (California Department of Conservation, 2014).In recent years, DOGGR acknowledged the gaps in regulations placed on oil and gas production and the information provided to the division about hydraulic fracturing (California Department of Conservation, Division of Oil Gas and Geothermal Resources (DOGGR), 2014). In 2011, Senator Pavley drafted Senate Bill 4 in 2013, passed in September 2013, which directly deals with WST reporting. Senate Bill 4 was enacted by the California legislature due to five concerns: (1) Hydraulic fracturing and well stimulation treatments are increasing in California. (2) The state considers current scientific information on the risks of well stimulation treatments incomplete. (3) The legislature believes that government and industry transparency is vital. (4) Public disclosure is important so as to allow the public to determine if they are being exposed to WST chemicals, (5) the legislature would like to understand the components of produced water used in WST so that it may be reused or treated (California Environmental Law and Policy Center, 2015)
SB4 requires: (1) an independent scientific study on well stimulation treatments to be conducted by the Secretary of California’s Natural Resources Agency, (2) development of WST regulations by DOGGR including threshold values for acid volume used, disclosure requirements of chemical composition of well stimulation fluids, and source and volume information of all water used, (3) public disclosure of WST fluid composition (4) an end to the ability of operators and suppliers to claim trade secret protections on many of their products, (5) the creation of a permitting process for WST operation, (6) that landowners within 500 feet of a horizontal project of a WST or within a 1500 foot radius of the wellhead be notified of treatment, (6) that SWRCB to develop regional or well specific groundwater monitoring criteria by July 15, 2015 (California Environmental Law and Policy Center, 2015).
Currently, the California Office of Emergency Services (Cal OES) is responsible for receiving spill reports. The Comprehensive Environmental Response and Liability Act, the Emergency Planning and Community Right-to-Know Act, and various California laws require that hazardous substance releases in excess of reportable quantities must be reported by the responsible party to the National Response Center. Furthermore, if there is an accidental release that exceeds minimum reportable quantities, it must be reported to the State Emergency Response Commission and to the Local Emergency Planning Committees. This includes any spills relating to oil and gas. Regarding oil and gas spills, any release that has caused harm or the potential to cause harm must be reported to Cal OES. Any discharge of oil into state waters must be immediately reported. The federal and state regulations on spill reporting, along with regulations specific to oil and gas spills, are summarized in the below tables.
Table 1: Summary of US Federal and State regulations governing spill reporting (Farella, Braun, and Martel, 2013).
Type of Release Law When to Report & to Whom Who Reports
Oil discharge Clean Water Act Immediately report to Any person in

13
(film/sheen/discoloration) to water surface or shoreline, or violation of
water quality standards and discharge of hazardous substance [equal to or above Reportable
Quantity (RQ)]
311 Code of Federal Regulations Title 33: 153.203, Title 40: 110.6
National Response Center: (800) 424-‐8802 or (202) 267-‐2675
charge of a vessel or facility (offshore or onshore)
Discharge of oil or petroleum product to surface or groundwater of the
state
Water Quality Control Act California Water Code: 13272
Immediately report to the Cal OES (800)852-‐7550 or the appropriate Regional Water Quality Control Board
The person who causes or permits the discharge
Discharge of oil or petroleum product to marine water of the state
Oil Spill Prevention And Response Act California Government Code: 8670.25.5, 8670.26, 8670.64-‐8670.67, California Health And Safety Code: 25501, 25507, California Code Of Regulations: 2703, 2705
Immediately provide verbal report to Cal OES, but not later than 30 minutes after discovery of the spill or threatened release; Submit written emergency release follow-‐up notice within 30 days of the release and sent to Chemical Emergency Planning and Response Commission Local Emergency Planning Committee (LEPC) Notify Coast Guard in certain circumstances (800) 424-‐8802
Any party responsible for the discharge or threatened discharge; Responding local or state agency
Discharge of one barrel or more oil (cannot pass into or threaten the
waters) in the gas and oil lease fields.
California Public Resources Code 3233
Immediately report to the Cal OES
Facility owner or operator
5 barrels or more uncontained in certain San Joaquin Valley oil fields -‐
if no threat to state waters; 10 barrels or more contained in certain
San Joaquin Valley oil fields if identified in spill contingency plan -‐ if
no threat to state waters.
San Joaquin Valley Field Rule (August 1998)
Every rupture, explosion, or fire involving a pipeline
Elder California Pipeline Safety Act of 1981 California Government Code 51018
Immediately report to the fire department having fire suppression responsibilities and to the Cal OES.
Pipeline operator

14
Unauthorized release of a flammable or combustible liquid, including petroleum products and oil that
escapes from secondary containment of a underground storage tank, or from primary containment if no secondary containment exists; increases the hazard of fire or
explosion; or causes deterioration of the secondary containment
Underground Storage Tank Law California Health and Safety Code, 25295, 25299 California Code Of Regulations, Title 23: 2650-‐2652
Verbal report within 24 hours after the release was detected or should have been detected; written report within 5 working days of the release
Owners and operators of USTs
Spill or other release of one barrel (42 gallons) or more of petroleum from an aboveground storage tank, that is required to be reported
Aboveground Petroleum Storage Tank Act California Health and Safety Code 25270., 25270.12
Immediately report to the Cal OES and the CUPA/AA using the appropriate 24-‐hour emergency number or the 911 number, as established by the CUPA, or by the governing body of the CUPA
Owner or operator of aboveground tank facility
Any facility that accidentally releases into the environment one of the following types of chemicals in an
amount greater than or equal to the minimum reportable quantity as
required by the Emergency Planning and Notification regulation
http://www.gpo.gov/fdsys/pkg/CFR-1996-title40-
vol14/pdf/CFR-1996-title40-vol14-part355.pdf
Emergency Planning and Community Right-‐to-‐Know Act Section 304
Immediately report to the State Emergency Response Commissions and the National Response Center for any area that is likely to be affected by the release. A written follow-‐up is required.
Facility
PCB spill (equal to or greater than 50 parts per million) with release to surface water, drinking water
supplies, sewers, grazing lands, etc.
Toxic Substances Control Act (TSCA) 40 CFR 761.120 & 761.125
Report within 24 hours to National Response Center (NRC) at 1-‐800-‐424-‐8802, EPA Region 7 Spill Line at 913-‐281-‐0991, and LEPC, SERC,TERC. Follow up as required by agency.
Person in charge
Hazardous substance release (equal to or greater than RQ)
Comprehensive Environmental, Response, Compensation, and Liability Act (CERCLA or Superfund) 40 CFR 302.6(a)
Report within 15 minutes to LEPC, SERC, TERC or local emergency response personnel (911 in case of transportation-‐related release)
Person in charge of vessel or facility

15
Release, fire, or facility explosion that threatens health outside the facility
Resource Conservation and Recovery Act (RCRA) 40 CFR 262.34; 263.30; 264.56 & .196; 265.56 & .196; 270.14 & .30; 273.17, .37 & .54; 279.43 & .53; 280.50, .52, .53, .60 & .61
Report within 24 hours to National Response Center (NRC) at 1-‐800-‐424-‐8802, EPA Region 7 Spill Line at 913-‐281-‐0991, and LEPC, SERC,TERC
Emergency coordinator or owner/operator
At the state level, hazardous material releases are regulated by three California
codes: the California Government Code, the California Health and Safety Code, and the California Code of Regulations. These regulations establish the Office of Emergency Services as responsible for coordinating the reporting of spills in the state. The follow-up reporting on these spills is the responsibility of the Chemical Emergency Planning and Response Commission. The table below summarizes the most important regulations that govern spill reporting in California (Cal OES, 2014).
Table 2: California regulations governing spill reporting (Cal OES, 2014).
Law Content
California Government Code (GC) 8589.7
The Office of Emergency Services (OES) shall serve as the central point in state government for the emergency reporting of spills, unauthorized releases, or other accidental releases of hazardous materials and OES shall coordinate the notification of the appropriate state and local administering agencies that may be required to respond (the State Lands Commission, Coastal Commission, or regional water boards for oil spills; the State Fire Marshal for a rupture or explosion involving a pipeline, DOGGR for a crude oil spill, etc) Any person subject to Section 25510 of the Health and Safety Code shall immediately report all releases to the local administering agency and each local administering agency shall notify OES.
California Health and Safety Code (HSC) Sections 25500-‐25519: Legislative Intent
Establishes business and area plans relating to the handling and release or threatened release of hazardous materials. Basic information on the location, type, quantity, and health risks of hazardous materials in the state is required to be submitted to firefighters, health officials, planners, and other interested persons.
HSC 255510: Release Reporting Requirements
The handler or an employee, representative, agent, etc, shall immediately report any release or threatened release of a hazardous material to the unified program agency.
HSC 25515.2: Administrative Enforcement
A business that violates the HSC article is liable to a penalty not greater than $2,000 for each day in which the violation occurs. If the violation results in or contributes to an emergency, including a fire or health problem, the business shall also be assessed the full cost of the county,

16
city, fire district, or local EMS agency emergency response as well as the cost of cleaning up the hazardous materials.
California Code of Regulations, Title 19, Division 2, Chapter 4,
Section 2701: Reporting Requirements
A person shall provide an immediate verbal report of any release to the administering agency and the California Emergency Management Agency as soon as (1) a persons had knowledge of the release, (2) notification can be provided without impeding control of the release (3) notification can be provided without impeding medical measures. The reporting shall include at a minimum (1) the exact location (2) the name of the person reporting, (3) the hazardous materials involved, (4) an estimate of the quantity, (5) the potential hazards involved in the release or threatened release Immediate reporting is not required if there is reasonable belief that the release poses no significant present or potential hazards to human health and safety, property, or the environment.
California Code of Regulations, Title 19, Division 2, Chapter 4,
Section 2705
A written emergency release follow-‐up notice pursuant to 42 U.S.C section 11004(c) shall be prepared using the form specified in subsection (c) of this section and shall be sent to the Chemical Emergency Planning and Response Commission (CEPRC) no more than one month after the release.
A copy of the Emergency Release Follow-Up Notice Reporting Form can be found
in Appendix A. Continuous releases, or those releases that are continuous and stable in quantity and
rate, occur without interruption or abatement, or are routine, anticipated, or intermittent, are subject to different reporting requirements than discrete hazardous material releases (EPA, 2015). Regulated federally under CERCLA and EPCRA, these releases may be subject to reduced reporting requirements. The responsible party must notify the National Response Center, or the respective State Emergency Response Commission, when the release is first identified. Afterwards, a first-year anniversary report is required to be submitted to quantify the total effect of the continuous release over the year. A complete guide to the reporting requirements for continuous releases can be found in the Appendix E.

17
IV. Methodology
A. Data Sources 1. Spill Data
We used data from the California Office of Emergency Services, now called California Office of Emergency Services, for hazardous material release information. The data was downloaded in January 2015 from the Cal OES website for the years 2006-2014. Recently, the data was moved to the CA OES website, however the formatting is the same. Each Microsoft Excel spreadsheet file for a specific year contains a list of all spills called into the CA OES Warning Center for the given year. . Appendix A has a link to the new data location on the CA OES website.
The following table explains the different columns within the Historical Hazmat Spill Notification spreadsheet. “Column Name” provides the spreadsheet letter and heading of each column. “Column Description” provides a definition for each column’s content (written by the team and not provided by Cal EMA). “Example Entries” gives real examples of entries within each column and clarifies the idiosyncrasies and challenges of the dataset.
Not every column in the dataset is listed below, only those that were used in this project and referred to throughout this paper.
Table 2: Denoted below is the column name, a description of the data found in that column, a few examples for each column, and the analyses in which we used data from that column.
Column Name Column Description Example Entries Analyses Used
A: Control # A unique number identifier for each spill; the first two digits of the control number indicate the
spill year.
’13-‐2536, ’06-‐2805, ‘11-‐6123 None
D: 1. Substance The primary substance released. Self-‐reported, one substance may be reported in several
different ways.
Crude Oil, Oil-‐Crude, Diesel, Paint Flakes, Antifreeze
Types of substances spilled
E: 1. Quantity The amount of material spilled, if known. May be a finite number, a range, or other format (such as
date or time-‐dependent).
0.4, 500, 120-‐140, Apr-‐4, 4 GPM, a drop, N/A
Annual spill volume and box and whisker
F: 1. Measure The unit a spill is measured in. May be volumetric or mass-‐
based.
Bbl. (s), gallons, cups, pints, grams, pounds, tons, sheen,
N/A, unknown
Annual spill volume and box and whisker

18
G: 1. Type A broader category than Substance that specifies the kind
of substance spilled.
Petroleum, Radiological, Railroad, Vapor, Chemical,
Other, Unspecified
Types of substances
spilled, number of spills, spill volume
Y: Description Detailed description of the situation surrounding the spill.
“Caller states substance is seeping from the ground at two locations approximately 150 ft apart in an area that is known for this to occur…”
Kern oil and gas spill filtering process
Z: Contained Indicates whether the spill was contained or not.
Yes, No, Unknown, 80%, 50% Containment analysis
AA: Water? Indicates whether the spill affected waterbodies or not.
Yes, No, Unknown Spills affecting waterbodies
AC: Location Street address, PLSS section, or rough location of the spill.
Section 3 Township 31S Range 22E, ½ Mile off
Highway 65
Kern oil and gas spills spatial analysis
AD: City City in which the spill occurred Fellows, Orcutt, Unincorporated Kern County
None
AE: County County in which the spill occurred.
Kern County, Los Angeles County, Santa Barbara County
Annual spill volume, box and whiskers, spill characteristic
analyses
AI: Spill Site General category that specifies the type of location the spill
occurred in.
Oil Field, Refinery, Pipe Line, Merchant/Business,
Residence
Spill frequency in Los Angeles and Kern counties
AS: Cleanup Indicates who cleaned up the spill.
Contractor, Responsible Party, Site Personnel
Clean up analysis
19
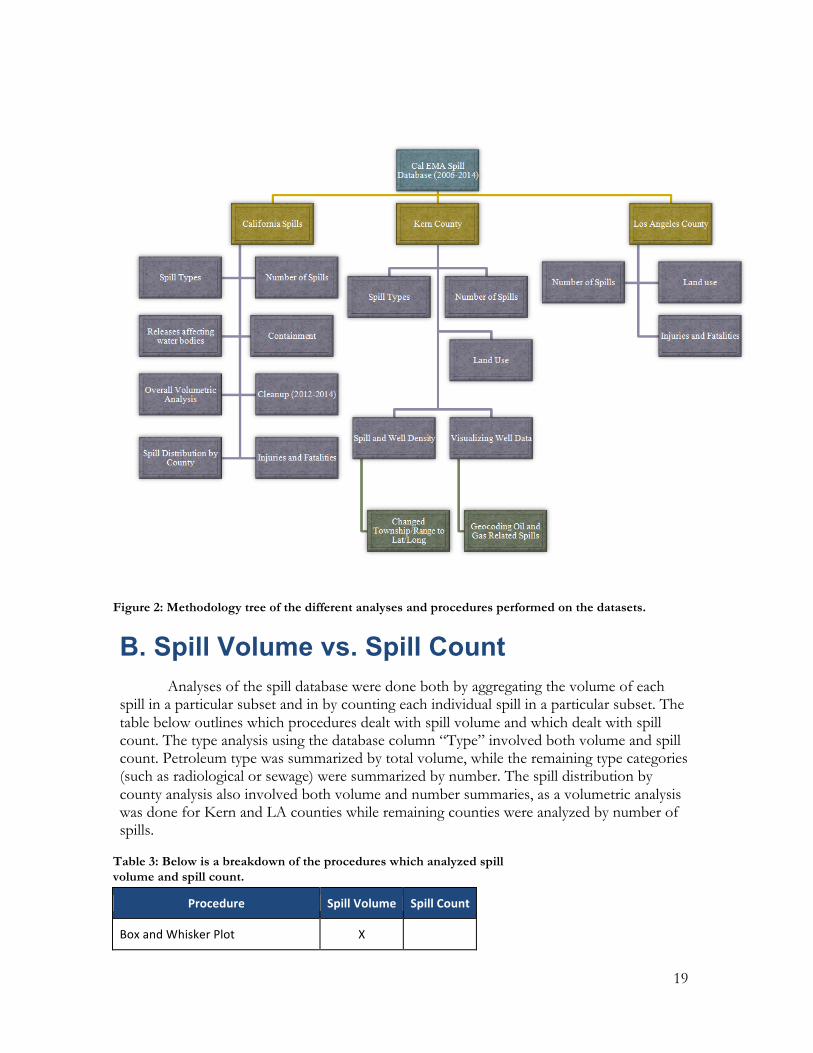
Figure 2: Methodology tree of the different analyses and procedures performed on the datasets.
B. Spill Volume vs. Spill Count
Analyses of the spill database were done both by aggregating the volume of each spill in a particular subset and in by counting each individual spill in a particular subset. The table below outlines which procedures dealt with spill volume and which dealt with spill count. The type analysis using the database column “Type” involved both volume and spill count. Petroleum type was summarized by total volume, while the remaining type categories (such as radiological or sewage) were summarized by number. The spill distribution by county analysis also involved both volume and number summaries, as a volumetric analysis was done for Kern and LA counties while remaining counties were analyzed by number of spills.
Table 3: Below is a breakdown of the procedures which analyzed spill volume and spill count.
Procedure Spill Volume Spill Count
Box and Whisker Plot X

20
Type Analysis X X
Containment Analysis X
Waterbody Analysis X
Injuries and Fatalities Analysis X
Cleanup Analysis X
Spill Frequency Analysis X
Spill Distribution by County Analysis X X
C. Number and Volume of Spills
1. Spill Count The first step in analyzing spills in California was to understand the total number of
spills reported each year. This analysis was done for all of California as well as for Kern County, Los Angeles County, Kern County oil and gas production spills, and petroleum spills (denoted as Type-Petroleum in Column G). Kern and Los Angeles counties were chosen for additional analysis since these are the two top oil producing counties in the state, accounting for 75 and 12 percent of the state’s oil production, respectively, in 2009 (California Department of Conservation, 2009). Kern County oil and gas production was chosen as it provides more specific insight into oil and gas spills in Kern County. Petroleum type was chosen for additional analysis for an overall picture of oil and gas spills across the state, since oil and gas spills could not be individually filtered out for the entire state due to time limitations. We also calculated the annual number of spill incidents for each county in California from 2006 to 2014.
The analysis of spill count and all subsequent analyses excluded vapor and railroad incidents. We had insufficient data to convert vapor releases to a liquid equivalent; furthermore, such releases are likely to have impacted air quality only rather than soils or surface/ground water and therefore did not fit the traditional definition of “spills”. Railroad incidents rarely involved spills, but rather were primarily train collisions involving automobiles or humans.
2. Volumetric Analysis The total volume of spills was calculated for each year from 2006 to 2014 for all of
California in addition to subtotals for Kern County, Los Angeles County, TYPE = Petroleum (Column G), and Kern County oil and gas production spills. Excluded from the calculation of petroleum spills in California is a spill of nearly 3 million gallons of kerosene in 2011. The description of this spill, number ‘11-5972, repeatedly refers to the spill as a “drill”.
Spill quantity was reported in 12 different units (excluding “Unknown” or “N/A” values) some of which were volumetric and some of which were mass measures. To solve this problem, all volumetric measures were converted to gallons as it was the most

21
frequently used unit for volume. All volumetric measures had direct conversion factors to gallons except barrels; the team used the standard 42:1 gallon to barrel conversion factor used in the oil and gas industry. Spill reported in units of mass (e.g. tons, pounds, ounces, and grams) were left out of the analysis, along with “N/A” and “Unknown” measures, due to time constraints and uncertainties related to converting from mass to volume. We believe that, despite this omission, the volumetric analysis provides a good representation of the data. On average, spills reported in mass units comprised only 5.2% of all reported spills with a maximum of 9.2% in 2006 and a minimum of 3.9% in 2012. In the volumetric calculation process, several formatting changes had to be made to values in “1. Quantity” (Column E), in order for the addition function to work properly. A summary of these formatting changes can be found in the Appendix B.
We generated box and whisker plots in R to examine the statistical distribution of spill volumes across years. Each individual datum from the “Quantity” column was converted into gallons and then analyzed in R. Data that could not be analyzed in volumetric form, such as unclear quantities and mass measures, were omitted for this analysis.
D. Spill Characteristics 1. What types of hazardous materials were released?
We generated pivot tables in Microsoft Excel to analyze spill count per type category. On average, there were 18 type categories per year in California overall, which we consolidated into 7 categories: petroleum, chemical, radiological, railroad, sewage, vapor, and unspecified/other. Identical type categories were generated for Kern County and Los Angeles County spills.
We created tables to show the top 20 substances spilled each year. The tables summarized the column “1.Substance” (Column D) by spill frequency. However, inconsistent data entry into the Cal OES database required significant reformatting before the data could be analyzed.
First, many substances were reported as “unknown”, “N/A”, “unknown material”, etc. These substances were discarded.
Second, one substance might be reported in multiple ways. It was therefore necessary to merge repeated instances of a given substance type into the summarized row by adding all the counts (e.g. “Diesel”, “Diesel Fuel”, “Diesel Oil”, “Fuel – Diesel”, “#2 Diesel”, into “Diesel”). Merging all instances of repeat substance for all eight years was prohibitively time-consuming, so only rows with more than 5 counts were merged. Finally, we calculated what portion of the total yearly volume of spills these substances represented.
Through this analysis, we also want to see how well all the spills are categorized. Among those most frequently reported substances, substances such as motor oil or mineral oil are also classified into the petroleum type in Cal OES database. Although these substances are petroleum products, they are not necessary related to oil and gas production. Therefore, spills of the petroleum type cannot be used to analyze the spills of oil and gas production, since this would be an overestimation.
2. What percentage of releases were contained? Possible responses in the “Contained” column (Column Z) within the Cal OES
spills database included: “Yes”, “No”, “Unknown”, or “X%” (see Fig. 1). Partially

22
contained spills were difficult to categorize based on their percentage and only accounted for <1 % of total data, so we excluded them from our analysis. We use pivot tables to generate summary statistics on spill containment.
3. What percentage of releases affected waterbodies? The “Water?” column (Column AA) within the Cal OES spills database contained a
“Yes”, “No”, or “Unknown” with regards to whether a spill involved water when it was released (see Fig. 1). We used pivot tables to count the annual total of each response and summarize their results.
4. Were there reported injuries or fatalities? An analysis of injuries, fatalities, and evacuations was performed on three levels: all
California spills, all Kern County Spills, and all Kern County oil and gas spills. This was done using columns “Injuries #” (Column AN), “Fatals #” (Column AP), and “Evacs” (Column AR) from the Cal OES spills database.
5. Who provided clean-‐up services? The “Cleanup” column (Column AS) within the Cal OES spills database was
analyzed in a grouped pivot table. This time-intensive analysis was only done on a subset of years from 2012 to 2014. Before grouping in the pivot table, an average of 7,453 unique clean-up descriptions existed for each year from 2012 to 2014. The entries frequently described the same yet reworded cleanup method and thus were ultimately grouped into 9 categories. In order from highest to lowest occurrence, the following categories were chosen: N/A, onsite, contractor, public agency, fire department, county, city, private company, and other. Explanations for each category and sample entries found within each can be found in the Appendix C. These 9 categories were chosen to organize the cleanup responses in a more understandable manner and to better understand spill severity.
E. Spatial Analysis 1. Distribution of Oil and Gas Related Spills in Kern County
Understanding the more detailed spatial characteristics of spills in California was limited by our available time, so we focused on spills related to oil and gas production in Kern County, by far the most productive county in the state.
We began with the complete Cal OES spills database and conducted a number of steps to remove all spills that were not associated with oil and gas production in Kern County. These steps were done successively from general to more specific details and only spills that were clearly not associated with oil and gas production were removed. The steps are as follows:
Filter 1: Remove all spills where the “County” column ≠ Kern Filter 2: Sort the “1.Substance” column to remove spills where the involved
substances were not oil or gas products.

23
Filter 3: Sort the “Agency” column to remove spills where the responsible reporting agency is not an oil or gas well operator.
Filter 4: Sort through the “Description” columns to further remove spills unrelated to oil and gas production. We used our best judgment to remove spills that did not occur on a production site.
Filter 5: Lastly, the “Spill Site” column was sorted through to remove spills containing the following keywords which indicated they did not occur on a production site: Service Station, Utility Substation, Railroad, Road Collision, Pipeline, Merchant Business, Refinery.
To verify that no spills were improperly removed from our final set of Kern County Oil and Gas Production Related Spills, we sorted the set of removed spills by “Spill Site” and added any spills with keywords “well” or “oil field” back into the dataset.
The table below shows the total spills remaining in the dataset after each successive filter was applied.
Table 4: Spills that were not directly involved with the production of oil or gas were removed from the database with each successive filter.
Year No Filter Filter #1 Filter #2 Filter # 3 Filter # 4
Original Data
Filtered by “Type” column
Filtered by “County” = Kern
Filtered by spills related to oil and gas production
Excluding refinery and pipeline spills**
2006 7424 5599 291 186 158
2007 7769 5764 322 207 207
2008 8812 6146 321 181 172
2009 8391 5967 261 133 117
2010 7713 5370 223 141 121
2011 7358 5146 288 131 125
2012 7687 5396 273 97 90
2013 7630 5554 248 94 80
2014 7013 5209 218 89 77
2. Geocoding Oil and Gas Related Spills in Kern County Responses for the “Location” column of the Cal EMA spills database were
predominantly reported using the Public Land Survey System (PLSS) and were thus formatted as Township-Range-Section (TRS). For the data to be spatially represented using ArcGIS, these TRS entries needed to be converted to latitude and longitude. Because of irregular formatting of TRS entries in the database, locations were manually converted to Latitude and Longitude using the EarthPoint online conversion service (see Appendix D). Any data that was either incomplete or unreadable by EarthPoint was discarded. Due to accuracy limitations in the PLSS (where the smallest geographical units – sections – are roughly 1 square mile) the converted spills were given the latitude and longitude for the centroid of their respective PLSS section.
Additionally, locations reported as addresses or in Degrees-Minutes-Seconds were formatted so that they could be properly geocoded in ArcMap. All addresses that were

24
incomplete or improperly entered into the database were discarded. After conversion and formatting, all remaining data was geocoded in ArcMap 10.2/10.3 using the US-Composite Address Locator available from UCLA MapShare.
Table 5: Geocoding success.
Year Spills Visualized
Success Rate
2014 77/89 86.9%
2013 88/94 93.6%
2012 91/96 94.8%
2011 111/125 88.8%
2010 129/141 91.5%
2009 127/160 79.4%
2008 171/215 79.5%
2007 179/206 86.9%
2006 133/148 89.9%
Total 1106/1274 86.8%
3. Visualizing Well Data We acquired the data for conventional wells from the DOGGR AllWells database. Unconventional well data was acquired from Appendix M of the SB 4-mandated interim report conducted by the California Council on Science and Technology (CCST). Appendix M combined data from FracFocus, South Coast Air Quality Management District, Central Valley Regional Water Quality Control Board, and DOGGR and was composed entirely of hydraulically fractured wells mostly spanning 2002 to 2014. These sources contained data of varying accuracy and breadth, as different agencies have varying reporting requirements. Using their best judgment, CCST integrated the most accurate of these data based on how comprehensive reporting requirements were for a source. For this analysis, we focused on wells that were active as of May 2015. We assumed that wells that are active have been active for at least 9 years (since 2006) and that wells which have been plugged, cancelled, buried, or idle have been so for 9 years. This assumption introduces error but is necessary because there is no date of abandonment on the majority of wells, and the list spans over 100 years. This reduces the list of traditional wells we are interested in from 138,959 to 68,129. The AllWells data included 144 wells where longitude = 0, so they were removed, bringing the total number of active conventional wells in Kern County to 67,985. Hydraulically fractured wells from Appendix M lack a similar status column, so we assume that all listed wells have been active throughout our study period.
25
The AllWells database contained both conventional and hydraulically fractured wells, so we eliminated the latter by deleting features from AllWells which spatially overlapped with the hydraulically fractured wells from Appendix M. We assume the accuracy of well coordinates from both AllWells and Appendix M is high enough that overlapping wells are indeed hydraulically fractured. A total of 2,965 wells were designated as hydraulically fractured and erased from AllWells. The total number of hydraulically fractured wells from AppendixM was 3,922.
4. Spill and Well Density The accuracy of our spills was limited to anywhere within the roughly 1 square mile
area of their PLSS section. To avoid overstating the accuracy of our data, we represented spill density as the number of spills within a PLSS section square. The densities of both conventional and hydraulically fractured wells were represented in the same way for the PLSS sections on which they were sited.
5. Land Use Analysis Land use designation data was acquired from Kern County Engineering, Surveying,
and Permit Services and from Bakersfield IT Division. The land use data for Kern County and the City of Bakersfield did not overlap, so they were joined and similar land-use designations were merged into large, generic classes for more coherent analysis. Wells and spills sited on lands designated for human habitation pose a greater public health risk than those on vacant land. With this in mind, we grouped land designated specifically for human habitation – like “Mobile Home”, “High-density Residential”, or “Suburban” – into a group to identify the frequency of high-risk spills and wells. The land use designation for every parcel on which wells and spills occurred was summed, generating a list that indicates where, according to official zoning, all spills and wells are sited.
F. Spills from Conventional and Unconventional Oil and Gas Production 1. Spill volume per unit production in Los Angeles and Kern Counties
The largest oil producing counties in the state, Los Angeles and Kern, differ in the fraction of wells which are hydraulically fractured. If hydraulic fracturing has an effect on spills, it might manifest in a comparison between these two counties. The team compared the ratio of oil spill volume to annual oil production in Los Angeles and Kern counties.
For purposes of this analysis, we looked oil spills in which the reported “Spill Site” (Column AI) was “Oil Field”. To ensure that no natural gas spills were included in this sample of the data, the Type column (Column D) was filtered to exclude “vapor” spills. Spills at oil fields were used as a proxy for spills known to be associated with oil production. It was beyond the scope of this project to use the filtering process described in section 4B to identify oil production spills in areas aside from Kern County.
Oil production statistics (annual barrels produced) were obtained from the California Department of Conservation website. California oil production was reported by

26
county for the years 2006-2009 in the Annual Reports of the State Oil & Gas Supervisor. For the years 2010-2013, an annual report was not provided on the Department of Conservation website. To account for this gap, we took the average portion of California oil production that Los Angeles and Kern Counties accounted for over the years 2006-2009. This portion, calculated as a percentage, was then used to estimate the oil production for LA and Kern counties for the years 2010-2013. We found that, on average, LA County represents 12% percent of California oil production while Kern County represents 77% of California oil production.
The last step in this analysis was to divide annual oil field spill volume for California, Kern County, and Los Angeles county by each area’s respective annual oil production. In the process of this analysis, we chose to also look at these ratios for Ventura and Santa Barbara counties, the 3rd and 4th largest oil producing counties in the state after Kern and LA counties.
2. Effect of Hydraulic Fracturing on Spill Frequency To ascertain any effect which hydraulic fracturing may have on the frequency of
spills, we calculated the number of spills per well in every PLSS section for each year from 2006 to 2014. We first looked at spills that occurred in PLSS sections with hydraulically fractured wells, then we looked at spills in sections with conventional wells but no hydraulically fractured wells. If hydraulic fracturing leads to a greater frequency of spills, we would expect the first set of spills per well to be greater than the second set occurring only due to conventional oil production.

27
V. Results
A. Number and Volume of Spills 1. Number of Reported Spills
Table 6 breaks down the number of spills by the subsets of primary interest – all spills, LA County, Kern County, Kern County oil and gas production spills, and petroleum spills.
Table 6: Number of spills for LA County, Kern County, California overall, and petroleum type.
Year California – All Spills
LA County – All Spills
Kern County – All Spills
Kern County Oil and Gas Production
Petroleum Spills
2006 6,301 952 277 131 3,607
2007 6,927 1,296 310 157 3,813
2008 7,941 1,253 317 147 4,127
2009 7,126 1,083 225 112 3,654
2010 6,863 1,094 223 136 3,646
2011 6,472 983 247 110 3,449
2012 6,794 1,039 225 93 3,584
2013 6,639 1,140 240 93 3,654
2014 6,024 977 204 71 3,387
In general, Los Angeles County has the highest number of spills each year, ranging
from 1,139 to 1,538 spills per year (Table 8). The second highest spills location is San Diego County, about 545 to 909 spills per year. The number of spills occurred in Kern County ranges from 254 to 358 spills per year.
The number of spills in California each year ranges between about 6,500 and 8,000 (Table 6). On average, petroleum spills account for about half of all spills in the state each year.

28
Figure 3: Number of Spills: All and Petroleum.
The number of spills in Los Angeles fluctuates over the years but shows no
increasing or decreasing trend. Kern County spills have generally decreased compared to before 2008, while Kern County oil and gas spills show a fairly consistent decrease since 2008.
Figure 4: Number of Spills for LA County, Kern County, and Kern County Oil and Gas.
2. Annual Volumetric Analysis of Spills

29
The results below describe spill volume in California, Kern County, Los Angeles County, Petroleum, and Kern Oil and Gas calculations. As was mentioned in Methods, the spill volume calculations exclude vapor releases and railroad incidents.
Annual hazardous spill volume in California peaks in 2007, is fairly stable from 2008 to 2012, and rises from 2013 to 2014. The peak in 2007 is due to a spill of 160 million gallons of treated sewage at the Terminal Island wastewater treatment plant. Since this spill skewed the shape of the graph of California spill volume, it is removed in Figure 5 below.
Figure 5: California Spill Volume
Kern County spill volume is fairly stable from 2007 to 2014 except for a spike in
2009 (Figure 6). This spike is primarily due to a spill of 3 million gallons of sewage.
Figure 6: Kern County Spill Volume
LA County spill volume is similar to Kern County’s, fairly stable with a spike in one year (Figure 7). LA spill volume also spiked in 2007 due to the large Terminal Island sewage spill seen in the California analysis, but the release is left out of this analysis so trends in LA spills can be seen more clearly. The smaller spike in LA County spill volume in 2014 is due

30
to spill ‘14-4269 of 20 million gallons of “drinking water” into Ballona Creek, reported by the LA City Watershed Protection Division.
Figure 7: LA County Spill Volume
The annual volume of petroleum spilled in California exhibits a decreasing trend,
falling from about 800 millions gallons in 2006 to about 500 million gallon in 2014 (Figure 8). Excluded from the calculation of petroleum spills in California is a spill of nearly 3 million gallons of kerosene in 2011. The description of this spill, number ‘11-5972, repeatedly refers to the spill as a “drill”. During the same time period, California oil production also exhibited a downward trend.
Figure 8: California Petroleum Spill Volume and California Oil Production
Oil and gas spills in Kern County for the years 2006-2014 show a general downward
trend as well (Figure 9). Kern County spills predictably track the petroleum spills trend, since Kern County accounts for about 77% of the state’s oil production from 2006-2013 (see section 3A).

31
Figure 9: Kern County Oil and Gas Spills and California Oil Production
3. Statistical Distribution of Spill Volumes Box and whisker plots of spill volume were created for all of California, Kern
County, and Los Angeles County (Figures 10-12) exhibit distinct characteristics, with Kern County showing the highest median spill volume on average, followed by Los Angeles and all of California, which are very similar. Each year was also fairly consistent for all of California and Los Angeles County, with the most variation from Kern County.
The box and whiskers revealed that for all of California the median for spills from 2006-2014 stays consistent year after year. Furthermore, the plots show that there is little variation in the interquartile range. When looking at the outliers, there is one in 2007 that is higher than the rest. This is due to a large sewage spill in Los Angeles.
Figure 10: Box and Whisker Plot of All Spills in California

32
Kern County’s median spill volume was higher than both LA county and California. Nevertheless, the median was still consistent for all years. However, the interquartile ranges are much higher than for all of California and for Los Angeles County. The interquartile ranges were roughly the same for all years, but did show some variation.
Figure 11: Box and Whisker Chart of Kern County Spill Volume
Los Angeles County’s median is on a slight decreasing trend after 2007, indicating
the spill volume is decreasing through time. 2007 has the highest median value and the maximum whisker length. Additionally, there is more variation in the interquartile range and the whisker lengths. The spill volume stays relatively constant throughout time.
Figure 12: Box and Whisker Chart for LA County Spill Volume

33
B. Spill Characteristics 1. What types of hazardous materials were released?
The number of petroleum spills was greatest amongst the six categories (petroleum, sewage, chemical, other, unspecified, and radiological). Petroleum spills occurred at an average of 54% for California overall (Figure 13), 81% for Kern County (Figure 14), and 52% for Los Angeles County (Figure 15). The second highest category of spill by count reported for California overall and for Los Angeles County was sewage spills, followed by chemical. For Kern County the second highest category was chemical, followed by sewage.
Figure 13: Average spill count by type in California (2006 - 2014)
Figure 14: Average spill count by type in Kern County (2006 - 2014)

34
Figure 15: Average spill count by type in Los Angeles County (2006 - 2014)
Figure 16: Most frequently reported substances by average number of spills (2006 - 2014)
The specific substance most reported in each year is sewage, followed by diesel
(Figure 16). Overall, substances related to oil production have the second highest occurrence. In fact, those most frequently reported substances represent a large portion of all the hazardous materials reported. By count, on average, about 60% of reports are for a petroleum-type substance. The remaining 40% include substances with lower reported occurrences or those frequent petroleum-type substances reported using different descriptors, or both.
2. What percentage of releases were contained?

35
The percentage of spills that were contained after release is relatively constant from 2006 to 2014. On average, about 10% of total spills that occurred in California were reported as not contained, about 73% of total spills were contained, and about 17% were unknown.
Figure 17: Percentage of spills in California by containment status as reported (2006 - 2014)
3. What percentage of releases affected waterbodies? The percentage of releases that affected waterbodies is also relatively constant from
2006 to 2014. On average, about 37% of total spills affected water bodies (Figure 17).
Figure 18: Average number of spills and their relation to waterbodies in California (2006 - 2014)
Of those spill that affected waterbodies, about 16% on average were not contained
when reported, and about 29% have no information about containment.
4. Were there reported injuries or fatalities? The number of injuries, fatalities, and evacuations that occurred due to hazardous
spills in California was relatively consistent from 2006-2014. Some minor spikes in the data are observed, especially with the Total Evacuations line, but no discernable trend can be ascertained.

36
Table 7: Total counts of injuries, fatalities, and evacuations associated with spills in California and Kern County from 2006 to 2014
Location Total Spills Total Injuries Total Fatalities Total Evacuations
California 58,035 2,935 506 15,714
Kern County 2,189 137 17 611
Kern County Oil and Gas 1,213 43 3 150
Figure 19: Injuries, fatalities, and evacuations in California from hazardous materials spills (2006 - 2014)
The number of injuries, fatalities, and evacuations that occurred due to hazardous
spills in Kern County was highly variable from 2006-2014. There are major spikes in the data that do not follow any meaningful trend. This dataset has a much smaller sample size than the complete California data, so there is more volatility in the data over the years. The extreme volatility of the number of evacuations per year is generally a byproduct of one or two spills in a certain year resulting in the evacuation of 50-100 people.

37
Table 8: Injuries, fatalities, and evacuations in Kern County from Oil and Gas Production from 2006 – 2014.
Year Total Spills Total Injuries Total Fatalities Total People Evacuated
2006 182 2 0 0
2007 203 40 3 0
2008 171 0 0 0
2009 128 0 0 0
2010 133 0 0 0
2011 121 0 0 50
2012 95 0 0 0
2013 92 0 0 100
2014 88 1 0 0
5. Who provided clean-‐up services? In California overall, 42% of spills were cleaned-up on site, usually by onsite
personnel or attendants. 28% of spills were grouped as N/A, meaning these spills were either not cleaned up at the time of the call, dissipated, or a clean up was not necessary according to the reporting party. 23% of spills were cleaned by an outside contractor that could be identified as a separate entity from the responsible party. 4% of spills were cleaned by a public agency such as public works, sewer districts, or environmental health departments. The remainder of spills, less than 4%, were cleaned by the fire department, city, or county.
Table 9: Parties responsible for cleaning up hazardous releases in California (2006 – 2014)
Onsite N/A Contractor Agency Fire Dept
City County Blank Total
2012 2,894 2,053 1,420 254 100 53 23 7 6,804
2013 2,703 1,836 1,642 290 94 54 24 22 6,665
2014 2,580 1,539 1,454 274 80 67 17 13 6,024
All 8,177 5,428 4,516 818 274 174 64 42 19,493
Percent of Total
42% 28% 23% 4% 1% 1% 0.3% 0.2% 100%

38
C. Spatial Analysis 1. Spatial Distribution of Oil and Gas Related Spills in Kern County Due to spill locations that were converted from PLSS to latitude and longitude, the highest spatial resolution shared by all spill and well data is approximately 1 square mile. We represented these data as PLSS sections with values for the number of overlying events. The distribution of these PLSS sections can be seen in Figures 20-22.
Figure 20: Distribution of hazardous material releases across Kern County PLSS sections (2006 – 2014)

39
Figure 21: Distribution of convention wells across Kern County PLSS sections (2006 – 2014)
Figure 22: Distribution of hydraulically fractured wells across Kern County PLSS sections (2006 – 2014)
To maintain a scale for these histograms at which all values were visible, PLSS sections with no spills were omitted. The distribution of conventional wells, hydraulically fractured wells, and spills across PLSS sections are strongly positively skewed. This is a consequence of the spatial clustering of wells and spills – there are many PLSS sections with few or no events, and a small number of sections with a great number of clustered events.
2. Spill and Well Density
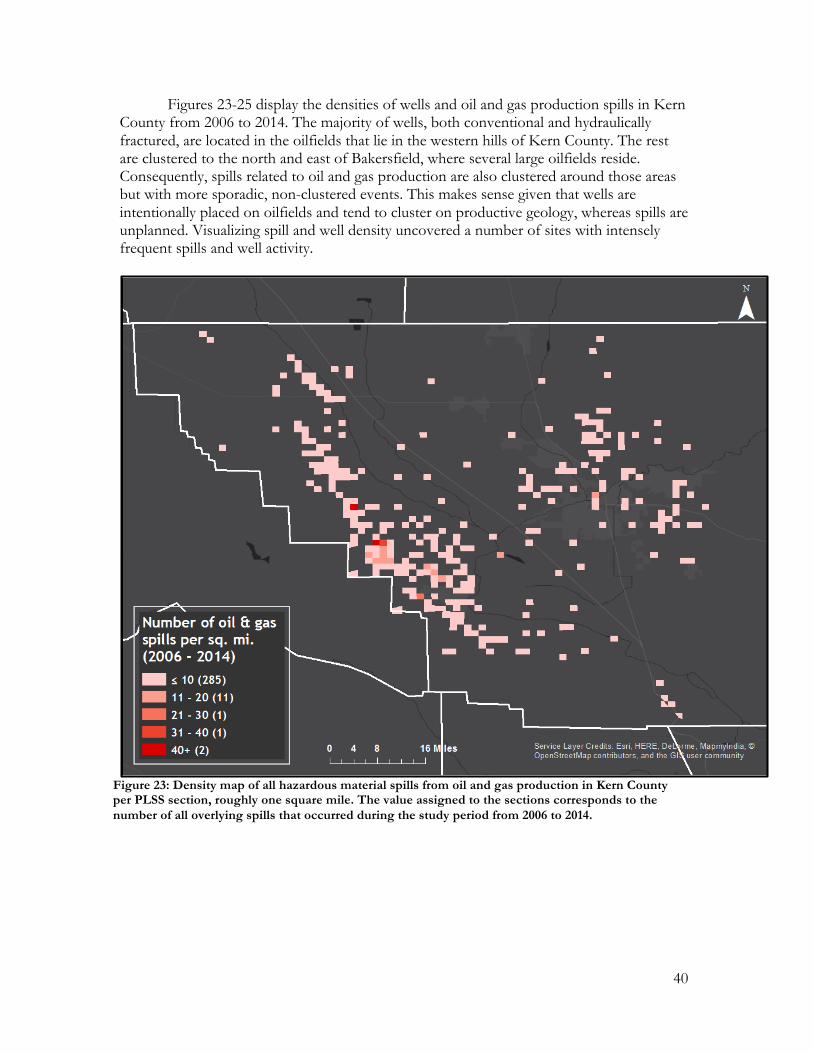
40
Figures 23-25 display the densities of wells and oil and gas production spills in Kern County from 2006 to 2014. The majority of wells, both conventional and hydraulically fractured, are located in the oilfields that lie in the western hills of Kern County. The rest are clustered to the north and east of Bakersfield, where several large oilfields reside. Consequently, spills related to oil and gas production are also clustered around those areas but with more sporadic, non-clustered events. This makes sense given that wells are intentionally placed on oilfields and tend to cluster on productive geology, whereas spills are unplanned. Visualizing spill and well density uncovered a number of sites with intensely frequent spills and well activity.
Figure 23: Density map of all hazardous material spills from oil and gas production in Kern County per PLSS section, roughly one square mile. The value assigned to the sections corresponds to the number of all overlying spills that occurred during the study period from 2006 to 2014.

41
Figure 24: Density map of all conventional oil and gas wells in Kern County per PLSS section, roughly one square mile. The value assigned to the sections corresponds to the number of all overlying active conventional wells as of 2014.

42
Figure 25: Density map of all hydraulically fractured oil and gas wells in Kern County per PLSS section, roughly one square mile. The value assigned to the sections corresponds to the number of all overlying active hydraulically fractured wells as of 2014.
3. Land Use Analysis Land designated for human habitation contained 226 conventional wells, 1
hydraulically fractured well, and witnessed 52 spills related to oil and gas production from 2006 to 2014. The overwhelming number of wells and spills were sited on land that was designated by the City of Bakersfield and the County of Kern as agricultural.
Table 10: Land use designations for spills and wells in Kern County (2006 - 2014)
Land Use Type Number of conventional wells
(2006 – 2014) Number of hydraulically
fractured wells (2006 – 2014) Number of spills (2006 – 2014)
Agriculture 56480 3894 972 Mineral Petroleum 0 0 19 Resource Management Area
3402 22 57
Heavy Industrial 632 0 38 Light Industrial 314 1 9 Service Industrial 242 1 16 Parks and Rec 298 0 1 Low Density 105 2 21
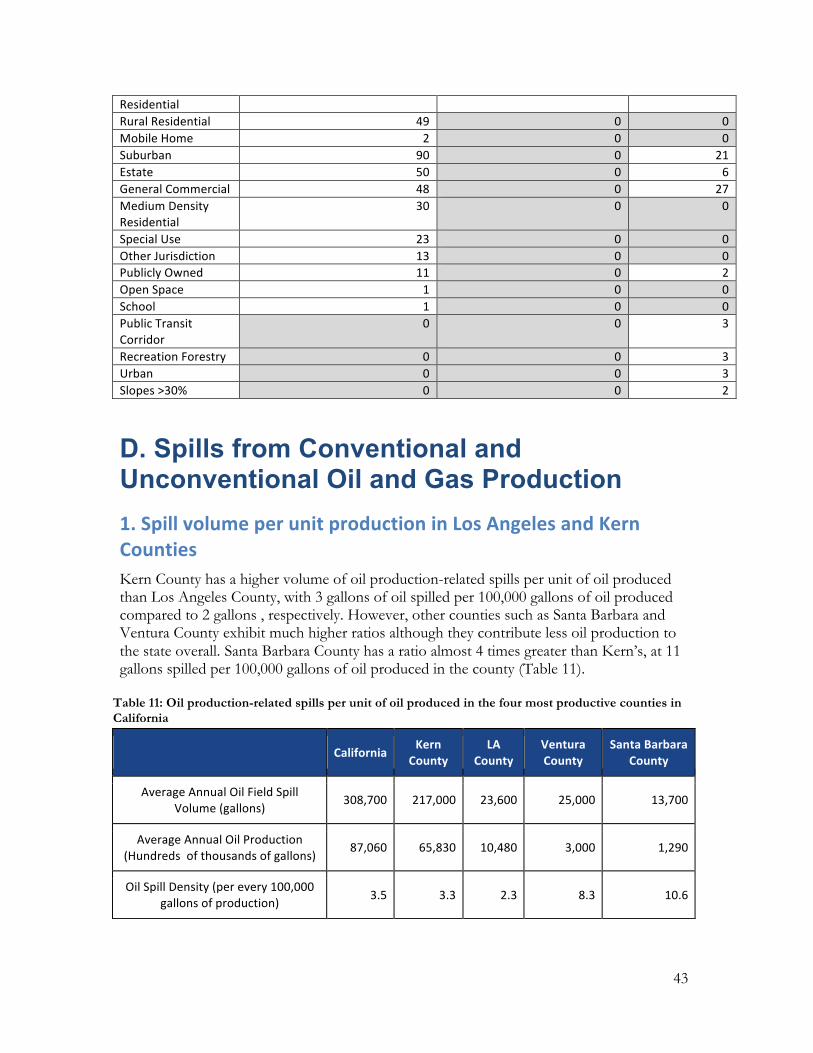
43
Residential Rural Residential 49 0 0 Mobile Home 2 0 0 Suburban 90 0 21 Estate 50 0 6 General Commercial 48 0 27 Medium Density Residential
30 0 0
Special Use 23 0 0 Other Jurisdiction 13 0 0 Publicly Owned 11 0 2 Open Space 1 0 0 School 1 0 0 Public Transit Corridor
0 0 3
Recreation Forestry 0 0 3 Urban 0 0 3 Slopes >30% 0 0 2
D. Spills from Conventional and Unconventional Oil and Gas Production 1. Spill volume per unit production in Los Angeles and Kern Counties Kern County has a higher volume of oil production-related spills per unit of oil produced than Los Angeles County, with 3 gallons of oil spilled per 100,000 gallons of oil produced compared to 2 gallons , respectively. However, other counties such as Santa Barbara and Ventura County exhibit much higher ratios although they contribute less oil production to the state overall. Santa Barbara County has a ratio almost 4 times greater than Kern’s, at 11 gallons spilled per 100,000 gallons of oil produced in the county (Table 11).
Table 11: Oil production-related spills per unit of oil produced in the four most productive counties in California
California Kern
County LA
County Ventura County
Santa Barbara County
Average Annual Oil Field Spill Volume (gallons)
308,700 217,000 23,600 25,000 13,700
Average Annual Oil Production (Hundreds of thousands of gallons)
87,060 65,830 10,480 3,000 1,290
Oil Spill Density (per every 100,000 gallons of production) 3.5 3.3 2.3 8.3 10.6

44
2. Effect of Hydraulic Fracturing on Spill Frequency Table 12 displays the median and average number of spills per well for two sets of
PLSS sections – those with hydraulically fractured wells, and those with only conventional wells. The median number of spills per well for each PLSS section is the same for sections with hydraulically fractured wells as it is for those with only conventional wells. The average number of spills per well also does not show an appreciable difference between the two sets of PLSS sections.
Table 12: Average ratio of spills per well for two sets of 1 sq. mi. PLSS sections – those with hydraulically fractured wells, and those with conventional wells but no hydraulically fractured wells.
Spills per well in PLSS sections with
hydraulically fractured wells
Spills per well in PLSS sections with conventional wells but no hydraulically
fractured wells
2006 1.69 1.69
2007 6.76 2.14
2008 3.76 3.99
2009 0.78 1.60
2010 7.81 11.26
2011 0.29 1.34
2012 5.33 7.63
2013 0.22 0.25
2014 0.86 0.36
Median 1.69 1.69
Average 3.05 3.36
Our analysis of spill volume per spill for each set of PLSS sections yielded similar
results, with slightly lower average spill volume for PLSS sections with hydraulically fractured wells (Table 13).
Table 13: Average ratio of spill volume per spill for two sets of 1 sq. mi. PLSS sections – those with hydraulically fractured wells, and those with conventional wells but no hydraulically fractured wells.
Average volume per spill in PLSS sections with hydraulically fractured wells
(gallons)
Average volume per spill in PLSS sections with
conventional wells but no hydraulically fractured wells
(gallons)

45
2006 1361.7 770.3
2007 1777.8 2027.6
2008 2302.5 1556.5
2009 4599.6 1457.4
2010 3664.4 8826.1
2011 2008.2 1233.2
2012 2048.7 4741.0
2013 1476.3 578.9
2014 1542.7 549.5
Average 2309.1 2415.7

46
VI. Discussion and Conclusions NRDC proposed eleven research questions for our project, including: the total
number and volume of releases reported annually in California, differences in characteristics between unconventional and conventional oil and gas production operations, and seven different general characteristics of hazardous spills including substance, health and environmental effects, location, site characteristics, containment, water body impacts, injuries or fatalities, and clean-up services. The last research objective was to provide conclusions and recommendations to reduce the frequency and severity of spills in California’s oil and gas industry.
In general, we were able to definitively answer several questions about spill number, volume, and characteristics. The annual number of spills for all spills, petroleum spills, and LA County spills stays fairly constant throughout the study period. The number of spills for Kern County and Kern County oil and gas, however, decreases over the study period. Likewise, annual spill volume in Kern County and for Kern oil and gas spills is decreasing, mirroring the decrease in California oil production from 207 million barrels in 2009 to 199 million barrels in 2013 (California 2013 Annual Report). The volume of petroleum spills is also decreasing with time, although the number of petroleum spills stays roughly constant.
It is interesting that the number of petroleum spills does not decrease with time but the number of Kern County spills does. This could be due to the fact that petroleum spills also result from highway crashes, spills at gas stations, pipeline leaks, etc. Thus, the petroleum spill and volume analyses do not necessarily imply similar results for oil and gas production.
Our team was also asked to discern any difference in characteristics between conventional and unconventional oil and gas production. Because we were unable to associate specific spills with either mode of production-- no distinction was made in the database-- and the spatial resolution of geocoded spills was limited to one square mile, we were unable to answer this question. A lack of comprehensive data on the year in which wells were drilled also made it difficult for the team to attribute spills in certain years to certain wells.
The database did allow us to answer many questions on spill characteristics. Broadly, about half of all spills are of a petroleum substance, followed by about a quarter of sewage. Looking more closely at spill substance, we found that petroleum spills are heavily split between substances such as diesel, motor oil, or “unknown” oil.
The county with the highest annual number of releases is Los Angeles, followed by San Diego and San Bernardino. Kern County is the seventh highest county in terms of annual spill count.
73% of spills were contained, although it is unclear what exactly that may mean. It is unknown whether the 10% of spills not contained and the 17% unknown were contained after the call or simply were released into the environment without clean-up efforts. When spills were cleaned, efforts were mostly undertaken on-site by the responsible party or not at all, indicating that most spills are smaller in nature and do not require the assistance of the city, county, local government agency, or the fire department.

47
Our analysis of injuries and fatalities indicates that these spill events are significant and likely disruptive to businesses and local economies, since from 2006-2014 there were a total 15,714 evacuations.
We were not able to answer the questions of spill characteristics that related to health and environmental effects and site characteristics. The spills reported to the database are highly variable, thus it is difficult to predict what kinds of sites are prone to spills or to sum up the wide variety of health and environmental risks that may result from California’s hazardous material releases.
An overall conclusion resulting from our study process is that the CA OES data format is incomplete, disorganized, and difficult to analyze effectively. The numerous entries of “unknown” or “N/A” indicate a lack of follow-up data entry. Although follow-up reports are required to be sent to CEPRC, these reports are apparently not coordinated with OES data collection and are not publicly available in an aggregate form. Further, a more user-friendly reporting process, such as online submittal or a mobile application, may fix some of these issues by allowing for more accurate location and substance data.
Similarly, we conclude that more user-friendly DOGGR well data could allow for a more conclusive study on the connection between unconventional oil and gas production and hazardous spills. The team acknowledges the budgetary barriers to modifying the DOGGR website to allow users to download data on specific wells across the state. However, we hope that at least new regulations under SB4 on fracking disclosure will allow for more transparent well locations in the future.
Last, our understanding of spill reporting requirements indicates that the higher spill frequency in Santa Barbara and Ventura Counties may be due to releases entering water and thus forcing the responsible parties to report, even if a spill is under the required reporting threshold. 59% of spills in Santa Barbara affected water, and if these spills had large enough volumes, spill volume per oil production could be affected. Another potential explanation for this pattern is that Kern and LA counties, being the top two oil-producing locations in the state, are more experienced in oil production so as to lower incidents and releases as barrels of production increase.
VII. Recommendations
A. The California Office of Emergency Services (Cal OES)
Compared to the call center currently used to report spills, an online reporting system might be more efficient for both Cal OES and response parties. Instead of doing the calling, people can simply report a spill by filling an online form. In order to make the reporting process more convenient, we suggest designing a mobile application as well.
When reporting the spilled substance, there should be a drop down list for the reporter to choose from in order to avoid the problem of one substance reported in multiple ways. One major reason for one substance reported in multiple ways is the lack of standardization of substance names. For example, hydraulic oil can be reported as
48
“hydraulic fuel” or “oil - hydraulic type”. This can be solved if the drop down list is better constructed and adding searching functions when choosing the substance. Another reason for one substance reported in multiple ways is that people try to add the details of the substances when they report it. For example, diesel can be reported as “diesel, unleaded” or “#2 diesel”. Instead of putting these details into the substance name, the new reporting system should allow people to add details of a substance in another field after they choose it from the drop down list.
One major obstacle we encountered when doing the spatial analysis was the inaccuracy of the spill location, especially those spills reported with township and range, because this has extremely low spatial resolution (one square mile). Therefore, it is recommended to require reporting of the well number (where applicable) as well as latitude and longitude. That is another important reason for using an mobile application since it is much easier to report one’s latitude and longitude using a smartphone.
Moreover, too many of the database’s fields are listed as “unknown” when describing the material, the amount released or clean-up methods. It is possible that sometimes the caller is unsure about the spill volume and doesn’t know who is responsible for the cleanup, but this information needs to eventually be provided. There should be a follow-up requirement, especially for spills over threshold volume (e.g. oil spills over 42 gallons). to provide the data initially missing, thereby improving the completeness and utility of the database.
Finally, CA OES should produce an annual report of hazardous material spills and make it publically available. Currently, this information is not being disseminated or discussed.
B. The California Division of Oil, Gas, and Geothermal Resources (DOGGR)
Any robust analysis of well activity in California is severely limited by the data made available through DOGGR. Although the AllWells database included comprehensive identifying information for each well, like API number, operator, and spud date (when drilling begins on a well), there is no production information, drilling completion date, and the vast majority of abandonment dates are left blank. This information exists on DOGGR Well Finder, but the configuration of that database is such that users must click on wells individually in the interactive map to access information. Both our research and the SB 4 interim report conducted by CCST found that accessing this information in any large quantity was impossible. So that their data is useful to interested parties, we recommend that DOGGR allow users to download this information in bulk. To reduce downloads to a reasonable size while still encouraging bulk download for holistic research, DOGGR could restrict bulk download to individual oil fields or survey townships.

49
VII. Appendices Appendix A:
Cal OES updated spills notification database: http://www.caloes.ca.gov/cal-oes-divisions/fire-rescue/hazardous-materials/spill-release-reporting
Appendix B:
Formatting changes to spill quantity. • Taking the midpoint of any quantities given in range format, such as 10-20 (changed to 15)
or Apr-5 (actually Excel mis-formatting for 4-5, changed to 4.5) • Taking the midpoint of any “less than” quantities (Less than 100 changed to 50) • Making conversions where possible, such as changing 100 cubic yards to cubic feet • Making positive any negative quantities • Some quantities had to be thrown out, such as “more than” quantities, unknown quantities,
sheen, time dependent values such as gallons per minute, concentrations, such as parts per million, or estimations such as “a drop” or “several thousand”.
Appendix C:
Determining the party responsible for spill cleanups. • N/A: entries including “n/a”, “no”, “not necessary”, “substance dissipated”, etc • Onsite: entries including “onsite”, “personnel”, “attendant onsite”, etc • Contractor: entries including the keyword “contractor” or the name of a confirmed
environmental contractor • Public Agency: entries including public works, sewer districts, environmental health
departments • Fire Department: City or County fire department • Private Company: A private entity cleaned the spill, aside from a private contractor, such as
“Chevron” or “SoCal Gas” • Other: entries that did not fall into any of the above category, less than 10 per year
Appendix D: EarthPoint PLSS Conversion service used to get the latitude and longitude for Kern County oil and gas production releases that were reported as township and range.
http://www.earthpoint.us/TownshipsSearchByDescription.aspx

50
Appendix E:
Extended background research.
I. Introduction In recent years there has been a rapid development of well stimulation treatment
(WST) technologies such as hydraulic fracturing, acid fracturing, and matrix acidizing within the United States (Long et al, 2015). In California, for more than 30 years, oil and gas companies have utilized WSTs as production stimulation methods to increase recovery of conventional oil and natural gas reservoirs (Long et al., 2015). An independent assessment by the Lawrence Berkeley National Laboratory on the subject of WSTs found that, in the last decade, this unconventional oil production method has grown to about one fifth of total production in the state (Long et al, 2015).This assessment found that operators have used hydraulic fracturing on 125 to 175 wells out of the approximately 300 wells drilled each month in California. The independent assessment also concludes that almost all hydraulic fracturing in California occurs primarily in the fields of the San Joaquin Basin, particularly in Kern County, where oil is the primary resource obtained.
Of particular importance to this literature review is a 2014 study conducted by EnergyWire (Soraghan, 2014) that found that, although drilling activity decreased in 2013 across the country, the number of spills at oil and gas production sites increased by about 17%. This study determined that the combined volume of spills in 2013 included more than 26 million gallons of oil, hydraulic fracturing fluid, wastewater, and other miscellaneous fluids, all of which are dangerous to humans, animals, and the environment. Although the study states that the increase in spills may be caused by changes in reporting practices, such as lower spill reporting thresholds, there has been no quantitative examination of the cause for the increase in spills. Therefore, an analysis of the relationship between unconventional oil and gas production technologies and the increased frequency of hazardous material gas spills is urgently required.
Our research will attempt to address this need. [for your final paper, this is where you would expand to include an overview of the entire report, but this is fine for now] After reading this literature review, the reader should better understand (1) how conventional and unconventional oil and gas production processes differ, (2) the potential environmental and public health risks are of both types of production, and (3) the regulatory landscape of oil and gas production and hazardous material spills in California.
II. Traditional Oil and Gas Production A. Production Process
Once an oil or natural gas reserve is identified, the process of preparing the land for production begins. First, the land must be researched to compile an environmental impact assessment. To prepare the location for drilling to commence, the area must be cleared and

51
leveled to accommodate the drilling platform. In remote regions, access roads will be constructed (Freudenrich, 2010).
Once the land is ready, drilling can begin. To start the drilling, first a large shallow hole is constructed and lined with a conductor pipe (Freudenrich, 2010). There are seven primary components to an oilrig. The power system includes a powerful engine to provide the power for drilling. The mechanical aspect of the rig is made up of a hoisting apparatus and a turntable. The mechanism that enables rotary drilling is composed of a swivel, Kelly (polygonal tubing), turntable, drill pipe, drill collars, and drill bits. Casings provide structural support for the well. The circulation system of the rig pumps the drilling slurry into the earth at strong pressures. The derrick is the most visually recognizable aspect of the oilrig apparatus. This structure is the tall support structure that can be seen for a distance. To prevent hazards, blowout preventers mitigate pressure buildups that can lead to spills (Freudenrich, 2010)
Figure 1: Oil Right Anatomy. (Source: California Department of Conservation, 2013).
Once this rig is constructed, drilling begins. Operators drill to a depth known to be
above the depth that oil is expected. Once this depth is reached, cement casings are installed in the well hole to provide structural support for the system. From here on, drilling is done incrementally. Operators drill, then reinforce, then drill, and so on until they reach the oil reserves (Borchart, 1989). Once the well casing is in place, oil flow can be established through the rig. This is achieved by using a device called a perforating gun to create holes, which allow oil to flow into the well casing (Borchart, 1989). Tubing is lowered into the

52
well to bring oil and gas to the earth’s surface. To initiate the flow of oil or gas through the well, a perforating gun is lowered into the depths of the well and used to puncture holes in the well walls. This gun often uses high-pressure gas or fires some sort of projectile to perform this function (Borchart, 1989). With the oil flowing, the oilrig is removed and the extraction process beings.
With the removal of the oilrig, a pump is installed on the well. This pump has a lever that is driven by an electric motor. The pump brings oil up the well by creating suction. In cases where the oil is too thick to pump up the well by these means, a process called enhanced oil recovery is applied. Enhanced oil recovery may be able to assist in the capture of 20-40% of the reservoir’s original capacity (U.S. Department of Energy, 2015). In this process, a second hole is drilled into the same oil reserve. Steam is injected into this hole, which loosens the thick oil making it less viscous and freer flowing up the well (Freudenrich, 2010). Gas injections are sometimes used to assist in pushing the oil to the Earth’s surface.
B. Chemicals Used There are a multitude of chemicals used in the process of traditional oil and gas
production. Over the lifetime of an average oil or gas production well, hundreds of different chemicals will have been injected. There are four primary chemical classes used in the oil and gas production industry, seen below in Table 1.
Drilling Completion Fluid Additives, commonly referred to as drilling muds, serve the purpose in assisting the drill bit in performing its duty. These chemicals lubricate and cool the drill bit. By doing so, drilling can be faster, safer, and reach greater depths. (Borchart, 1989)
Cementing additives are used in the cement slurry used to make the well walls. These chemicals serve the primary purpose of controlling the amount of time the cement takes to set and the strength of the cement once it is set. The cement casing must be capable of sustaining immense pressure along with a great amount of wear and tear over the lifetime of the well (Borchart, 1989). These cement additives are intended to make the well more durable, enabling the cement to survive against corrosion and other natural occurring phenomenon that can damage the well structure over time.
Completion Fluids are used in the final stages of preparing the well for production and continue to be used throughout the well’s lifespan. Their first function is assisting the perforating tool in penetrating the well wall in a controlled and effective way. Once this is complete, different chemicals are used during the extraction of oil and gas. These chemicals serve a wide variety of purposes, including reducing loss of fluids, altering viscosity of the product, and maintaining the well in working condition. (Borchart, 1989)
Table 1: Chemicals used at oilfield well sites (Source: Ailey, Clouse, Hill, 1997)
Drilling Completion Fluid Additives
Cementing Additives
Stimulation Fluid Additives
Production Chemicals
Deflocculants Accelerators Bactericides Bactericides
Defoamers/Foamers Dispersants Breakers Demulsifiers

53
Fluid-‐loss reducers Extenders Clay stabilizers Gels
Lubricants Fluid-‐loss reducers Corrosion inhibitors Inhibitors
pH controllers Gas migration controllers
Crosslinkers Oxygen Scavengers
Pipe-‐freeing agents Retarders Diverting agents Surfactants
Polymeric viscosifiers Spacers and chemical washes
Fluid-‐loss reducers
Shale inhibitors Mutual solvents
Specialty Salts pH controllers
Surfactants Polymeric viscosifiers
C. Potential Pollution Pathways There are a variety of negative environmental effects that come as a byproduct of
the normal process of drilling, extracting, transporting refining, and using these resources (Soraghan, 2014). However, for the sake of this study, it is relevant for us to focus only on the pollution that can occur on oil fields as a result of oil and gas production. These oil and gas reserves are under severely pressurized conditions, so once drilling reaches the reserve these substances can escape their previous confinement with great force.
In the event of an abnormal event at an oil or natural gas extraction site, catastrophic effects to the environment may be incurred. Despite improved technology in drilling and extraction techniques, spills do still occur. Regions exposed to major oil spills have historically taken a great period of time to recover (Office of Indian Energy and Economic Development, 2015). In the case of oil spills, there are a few natural processes that work to rid the area of the spilled material. Firstly, some evaporation of hydrocarbons with low boiling points occurs over the course of a few months. Similarly, dissolution of hydrocarbons also targets the molecules with low boiling points. Dissolution is an extremely slow process, though. Biochemical degradation of the spill is dependent upon the presence of proper nutrients to support the necessary plant or bacterial organisms. If these nutrients are present, this process can occur very quickly (Blumer, Ehrhardt, and Jones, 1973). The Office of Response and Restoration is responsible for responding to hazardous materials spills. Under the National Contingency Plan, the National Oceanic and Atmospheric Administration is charged with providing scientific support for spills. Implications of oil spills linger for many years and have irreversible effects on the environment. (U.S. Environmental Protection Agency, 2014b)

54
III. Non-Traditional Oil and Gas Production: Well Stimulation Treatments A. Production Process
Hydraulic fracturing, often called “fracking”, is a well stimulation process used to extract oil and natural gas from reservoir rocks of low permeability, usually fine-grained sandstones and shales (FracFocus, 2015a). In hydraulic fracturing, large amounts of water and chemical additives are injected into a well at high pressures to fracture the rock formation and allow for extraction of the trapped hydrocarbons. These rock formations lay thousands of feet below the water table (Halliburton, 2015). The amount of water used can vary from 50,000 - 350,000 gallons for tight formations and up to 5 million gallons for shale formations (EPA, 2012b). Once the rock is fractured, the pressure between the petroleum-bearing rock pores and the wellbore must be equalized, so proppants such as sand or ceramic beads are pumped in to prop fractures open and allow for oil or gas to flow up the well (Daneshy, 2010).
After hydraulic fracturing has occurred but before production begins (i.e. before oil or gas begins flowing through the well), fracturing fluid may return through the wellbore to the surface as flowback water which is then stored and reused in other drilling operations. However, up to 90% of fracking fluid may remain underground (Lutz et al., 2013). After production has begun, “produced water”, which has had contact with oil and gas, returns to the surface (Geological Society of America, 2015; EPA, 2012b).
California’s largest shale plays are the Monterey and Monterey-Temblor formations. These make up an active drilling area of 1,752 square miles across the San Joaquin and Los Angeles basins. Based on available well data, an estimated 100 to 150 wells per month are hydraulically fractured in California, mostly for heavy crude oil (Jordan et al., 2014). Some wells are stimulated using acidization in which acids, generally hydrochloric (HCl) or hydrofluoric (HF), are injected into wells to dissolve rocks and permit access to oil and gas reserves (Jordan et al, 2014). Currently, acidizing occurs about 10% as often as fracking in California, and like fracking, is concentrated almost entirely in the San Joaquin Basin. Most experts do not foresee acidizing becoming a significant WST in California on par with fracking, mainly due to the lack of carbonate reservoirs in which acidizing is most effective (Jordan et al., 2014). For this reason, the literature review will focus mostly on the environmental hazards of hydraulic fracturing which accounts for about 20% of oil production in California (California Council on Science and Technology, 2015).

55
Figure 2: Potential pathways for fluid migration in horizontal hydraulic fracturing well (Source: Geological Society of America, 2015).
B. Chemicals Used Although water comprises over 99% of fracking fluid by weight, a variety of
chemicals are also used. The composition of fracking fluid is adapted to the requirements of each well. Common components include acids to dissolve material and reduce clogging, friction reducers, and surfactants to improve flow through pipes (Colborn et al, 2011).
In 2011 the Congressional Committee on Energy and Commerce conducted a study on chemicals in hydraulic fracturing products. The committee sent letters to 14 oil and gas companies asking for the chemical content of their fluid between 2005 and 2009. They received a list of 2500 products and 750 chemicals used by 14 companies (Waxman, 2011). Ingredients ranged from salt and citric acid, to instant coffee and walnut hulls, to the very toxic chemicals benzene and lead. The most widely used chemical was methanol (found in 342 products), followed by isopropyl alcohol (274 products), 2-butoxyethanol (126 products) and ethylene glycol (119 products). BTEX chemicals (benzene, toluene, ethylbenzene, and xylene) were found in 60 products (Waxman, 2011). Twenty-nine of the reported products were known or possible carcinogens, regulated contaminants under the Safe Drinking Water Act, or hazardous air pollutants under the Clean Air Act. Additionally, many unconventional oil and gas operators use proprietary chemicals in their fracking fluids. These “trade secret” chemicals are protected from disclosure (Waxman, 2011).
When flowback water returns to the surface, it is made up mostly of the original fluid and chemical mix with a salinity content that increases as a function of time since initial injection. Produced water, on the other hand, contains hydrocarbons as well as naturally occurring chemicals from within the rock formations. These chemicals typically include hyper saline reservoir water, oil and other hydrocarbons, and toxic elements like radium, barium and strontium. All of these chemical characteristics vary with the geology of the exploited formation (Vengosh et al., 2014).

56
Due to the overlap of many chemicals used in both processes, it is difficult to differentiate between spills and contamination from traditional oil and gas operations and those from WSTs. However, efforts have been made to more effectively and appropriately attribute spills to WSTs, such as using boron and lithium as tracers from shale formations (Warner et al., 2014). These techniques, coupled with greater transparency for proprietary chemical disclosures, are promising advances in tracing spills and contaminant migration to unconventional oil and gas sources.
C. Pollution Pathways In hydraulic fracturing, waste materials are generated during both the fracturing and
production phases. The main areas of concern lie in pollution from aboveground spills during the handling, transport, and storage of waste and in the potential for unrecovered subsurface fracturing fluid to migrate to aquifers. Similar concerns surround the potential for groundwater contamination from natural gas leaks around fractured wells (Vengosh et al., 2014). Pollution pathways are divided into direct and indirect processes.
Figure 3: Potential pollution pathways for hydraulic fracturing. (Source: Rozell & Reavan, 2012)
1. Direct Pollution
Direct pollution is the (mostly subsurface) contamination of soil or groundwater resulting from high-pressure fracturing and the withdrawal of fluids and hydrocarbons. There is concern that the high-pressure fracturing process can create pathways for fracking fluid and hydrocarbons, especially methane, to migrate into aquifers used for drinking water and irrigation.
Well-casing failures represent another subsurface pollution pathway. The wellbore for hydraulic fracturing consists of multiple concentric steel tubes surrounded by cement for multiple layers of protection against leakage (FracFocus, 2015b). The outer cement layer is often the weakest link in a fracking wellbore, with as much as 10 - 50% of shale wells in parts of Pennsylvania suffering cement damage (Vengosh et al., 2014). Even without casing leaks, seal failure near the mouth of the wellbore are common in the petroleum industry and can allow stray gases to flow up through the gaps between concentric pipes (Darrah et al., 2014). According to one estimate, the rate of seal failure is 1-3% in the Marcellus Shale (Vidic et al., 2013). Consistent with the studies above, statistical analysis of hydraulic fracturing contamination events suggests that well failure, not high-pressure fracturing, causes most groundwater pollution (Darrah et al., 2014).
Another study, which analyzed pollution risk using models based on best and worst case probability bounds, suggested that fluid migration through fractures is a high potential

57
risk, but waste disposal contamination risk is several orders of magnitude larger (Rozell et al., 2012). In nearly all studies of this kind, uncertainty over pollution pathways made it difficult to determine the degree of threat posed by fluid migration. Nearly all studies emphasize the much greater risk that mishandling, illicit dumping, and unregulated disposal of produced water waste poses to natural resources in the U.S.
2. Indirect Pollution
Indirect pollution is soil or water contamination resulting from processes related to hydraulic fracturing that occur beyond the fracturing and withdrawal process. This includes the transport, storage, and disposal of flowback and produced water.
Although hydraulic fracturing generates less wastewater than conventional methods per unit of resource produced, especially in California, proper disposal of produced water from unconventional oil and gas operations is a serious environmental concern (Lutz et al., 2013). According to an EPA study, the most common disposal process for hydraulic fracturing waste involves separating fracturing fluids from the recovered oil and gas, pumping it into trucks, treating it to proper disposal standards at a plant, and injecting it into wells (California Research Bureau, 2014). Every step of this process presents a possible pollution pathway for produced water. Wastewater treatment facilities are sometimes used for disposal, but are often unable to completely remove the radioactive elements and total dissolved solids (TDS) that produced water carries (Lutz et al., 2013). Because of this, between 95-98% of wastewater from fracking in the US is injected into Safe Drinking water Act (SDWA) Class II underground injection control (UIC) wells (see section Oil and Gas Regulations) (Lutz et al., 2013).
Offsite commercial disposal is used mostly by small operators for whom building, running, and closing an onsite disposal facility is not economically feasible (Argonne, 2009). In California, the water that is not injected underground is mostly disposed of through settling ponds or is treated for beneficial reuse, such as agriculture (Argonne, 2009). In Kern County, increased scrutiny has fallen on the use of unlined ponds for produced water disposal. Several studies, including one in 2014 by Clean Water Action, demonstrated that waste in unlined pits near McKittrick, CA migrated into wells used for irrigation and drinking water (Clean Water Action, 2014).
IV. Public Health and Environmental Effects of Well Stimulation Treatments A. Water Pollution:
This review looked for instances of the release of chemicals from fracturing operations into water resources via the pathways previously discussed. Excluded were studies on the disposal of treated hydraulic fracturing wastewater directly into surface waters, as the majority of fracturing fluid in California is disposed of via underground injection or in wastewater pits (DOGGR, 2014). The discussion below includes two studies on contamination of water resources via underground pathways, one on surface spills, and one on instances of improper underground injection disposal of hydraulic fracturing waste.

58
1. Indirect:
A study by Gross et al., in the Journal of the Air and Waste Management Association analyzed whether surface spills at hydraulic fracturing operations led to groundwater contamination, specifically of benzene, toluene, ethylbenzene, and xylene (BTEX) chemicals. The Colorado Oil and Gas Conservation Commission (COGCC) database provided data on surface spills at sites in Weld County, Colorado between July 2010 and July 2011 (Gross et al, 2013). Researchers analyzed 77 spills. Groundwater samples collected at the spill sites showed that benzene levels were 2.2 times higher, toluene levels 3.3 times higher, ethylbenzene levels 1.8 times higher, and xylene levels 3.5 times higher than groundwater samples collected outside the spill area. BTEX levels tended to decrease rapidly with time and distance from the spill site (Gross et al, 2013). However, the study serves as a demonstration of the potential of surface spills to directly affect groundwater quality.
The second study provides a recent example of mismanagement of underground fracking wastewater disposal occurred within Californian Class II injection wells. In September 2014, the State Water Board conceded to the EPA that 9 underground injection control wells injected wastewater from natural gas operations into drinking water aquifers protected under the Safe Drinking Water Act. The board tested 8 public wells within a 1 mile radius of the UIC wells in question and found that four exceeded the Maximum Contaminant Level (MCL) for nitrate, arsenic, and thallium (Bishop, 2014; Schon, 2014).
2. Direct:
A study by Fontenot et al., in Environmental Science and Technology looked at water quality in 100 private wells surrounding the Barnett Shale formation in North Texas. Historic levels of arsenic, nitrates and volatile organic compounds (VOCs) from the United States Geological Survey were compared to current groundwater quality in 91 wells within a 5 kilometer radius of active natural gas extraction operations, 4 wells with no active operations within a 14 kilometer radius, and 5 inactive, control wells (Fontenot et al, 2013). The results showed that mean total dissolved solids (TDS) in active extraction areas exceeded the maximum contaminant level (MCL) set by the EPA, but historical data indicated similar levels for the region. Similarly, researchers observed methanol and ethanol in samples from both the active and inactive study areas. The chemicals were not correlated with distance to the nearest gas well (Fontenot et al, 2013). The constituents found to be higher in active areas than inactive areas were arsenic, selenium, and strontium. The researchers suggest a variety of contributing factors to this contamination, including mechanical disturbances from drilling activity, reduction of the water table from groundwater withdrawals, and faulty drilling equipment and well casings (Fontenot et al, 2013).
A study by Osborn et al., in the Proceedings of the National Academy of Science looked at methane contamination in drinking-water wells in the Marcellus and Utica shale formations in northeastern Pennsylvania and upstate New York, comparing wells within areas of active natural gas exploration and wells in inactive areas. Of 60 wells studied, 51 showed methane contamination. Concentrations of methane were 17-times higher nearby natural gas drilling operations (Osborn et al, 2011). Even more, the authors used stable isotope analysis to differentiate between shallow, naturally occurring methane and deep, thermogenic methane

59
associated with fracking. Thermogenic methane was found to be the source of contamination at active sites, while biogenic methane was common at inactive sites (Osborn et al, 2011). The study also looked at general groundwater contamination associated with fracturing fluids. Using a contemporary sample of 68 wells and the historical data of 124 wells in the Catskill and Lockhaven aquifers, the researchers used three indicators of contamination: major inorganic chemicals, stable isotope signatures of water, and isotopes of dissolved constituents. The study found no connection between active drilling areas and general contamination in nearby wells (Osborn et al, 2011).
It is important to keep in mind that much of the literature on public health effects of WST fluid or spill contamination is limited by knowledge of the specific chemical composition of fracturing fluid. Incomplete MSDS information, a lack of Chemical Abstract Service (CAS) numbers to uniquely identify chemicals and chemical mixes, and trade secret claims by operators limited the all of the above studies and others of their kind. In addition, without baseline information on water quality or isotope tracking, it is difficult to impossible to causally link hydraulic fracturing operations to groundwater contamination. The study by Gross et al provided no measure of historical background levels of BTEX, therefore causality is not certain. In fact, a review by Samuel Schon faults the study by Osborn et al., for not providing geochemical measurements of dissolved methane (Schon, 2014).
Next, it is worthy to note that many of the studies on hydraulic fracturing chemicals and accidental release come from outside California. The study from the Journal of Human and Ecological Risk Assessment obtained product and chemical information from Colorado, Wyoming, New Mexico, Texas, Washington, Montana, Pennsylvania, and New York. The three other cited studies come from the Barnett, Marcellus, and Utica shale formations. In all, much of the published literature on hydraulic fracturing and its effects on groundwater are from study areas outside of California, likely due to the fact that the state does not have as extensive of a hydraulic fracturing industry as other parts of the US (US Department of Energy, 2011). Thus, one should keep in mind the difference between California fracking and general American fracking amount when weighing the probability of groundwater quality damage from fracking.
In all, the above studies give context for the public health concerns of hydraulic fracturing fluid and the ways in which it may enter groundwater. More research is needed to steadfastly claim a causal connection between fracking and groundwater contamination; however, data point to probable risk.
B. Air Pollution: A recent independent study by P. Macey et al, “Air Concentrations of Volatile
Compounds near Oil and Gas Production” examined the air concentrations of volatile compounds in hydraulic fracturing sites through a community-based exploratory study in five American states: Ohio, Pennsylvania, Arkansas, Colorado, and Wyoming. A total of 75 volatile organics were measured through passive air samples near industrial operations. Levels of eight of these volatile chemicals were found to exceed federal guidelines (Macey, 2014). Benzene, formaldehyde, and hydrogen sulfide were the most common compounds to exceed acute and other health-based risk levels (Macey, 2014). For instance, the exposure to benzene experienced in five minutes at one Wyoming site was equal to the exposure experienced living in LA for two years. Benzene is known to cause irritation of the skin, eyes, and upper respiratory tract (U.S. EPA 2011). Long-term exposure may cause blood

60
disorders, reproductive and developmental disorders, and cancer (Outdoor Air, 2011). Hydrogen sulfide levels in the Wyoming site were also 90 to 60,000 times greater than the recommended levels at one given time during the study period (Francis, 2014). Hydrogen sulfide can cause respiratory tract and eye irritation, headaches, poor memory, and loss of appetite among other symptoms (Francis, 2014).
C. Environmental Justice According to the EPA, environmental justice is the fair treatment and meaningful
involvement of all people regardless of race, color, national origin, or income with respect to the development, implementation, and enforcement of environmental laws, regulations, and policies (U.S. EPA, 2014a).
A study by Srebotnjak et al. examined which communities were the most disproportionately at risk due to oil and gas drilling in California. According to their research, approximately 5.4 million Californians (14 % of the state's population) live within one mile of an existing oil and gas well (Srebotnjak, 2014). In addition, 1.8 million of these individuals live in already environmentally polluted areas (Rotkin-Ellman, 2014). Approximately 92% of the individuals within those 1.8 million are people of color. The demographics of the population living near wells in California consist primarily of Hispanics/ Latinos (Srebotnjak, 2014).
A separate study analyzed one particular oil and gas community in Kern County, California. Kern County has more than 63,000 of the state’s 84,434 active and new oil and gas wells (Rotkin-Ellman, 2014). The researchers found that one in three residents live within one mile of an oil or gas well (35% of the county’s population) (Rotkin-Ellman, 2014). These individuals are at a greater risk of potential health impacts. According to the Desert Renewable Energy Conservation Plan, Kern County’s total population size is about 839,153 with 61.4% belonging to a minority group (Desert Renewable Energy Conservation Plan, 2014). The percent of low-income individuals in Kern County is 22.5%. California as a whole has a minority population of 59.9%, with 15.3% falling within the low-income population. (Desert Renewable Energy Conservation Plan, 2014)
V. Oil and Gas and Hazardous Material Regulation A. Oil and Gas Regulation
Oil and gas production is subject to regulation at the state and federal level, although with many exemptions as described further below. Those regulations include the Comprehensive Environmental Response, Compensation, and Liability Act (CERCLA), the Clean Water Act (CWA), the Safe Water Drinking Act (SDWA), and the Resource Conservation and Recovery Act (RCRA) (U.S. EPA 2014b; U.S. EPA, 2006). A specific point of concern is the regulation of hydraulic fracturing, which is also occasionally exempted from regulations placed on conventional production. There are many agencies that intersect with oil and gas production regulation, including the US Environmental Protection Agency (EPA), the Department of Oil, Gas, and Geothermal Resources (DOGGR), the Department of Energy, and the Department of Conservation. At the federal level, the US EPA has constructed some legislation that applies to oil and gas

61
production. At the California state level, regulation was nearly nonexistent until the passage of Senate Bill 4 (signed into law on Sept 20, 2013).
The US EPA monitors conventional oil and gas production. The oil and gas industry is subject to regulation under the CWA and the SDWA. Under Section 311 of the CWA, regulations mandate prevention and preparedness for oil discharges into navigable waters of the US. A 1994 amendment also requires that storage facilities prepare Facility Response Plans for such an event (U.S. EPA, 2014b). In addition, oil companies may apply for National Pollutant Discharge Elimination System (NPDES) permits for the discharge of wastewater, under section 402 of the CWA (U.S. EPA, 2012). Furthermore, conventional oil and gas production is subject to air pollution standards under the CAA that reduce emissions of smog-forming volatile organic compounds. (U.S. EPA, 2015).
Hydraulic fracturing and other WSTs have been exempted from major components of environmental legislation. This includes exemption from the Safe Water Drinking Act and the Clean Water Act (Brady, 2012). This exemption was placed into effect after 2005 amendments to the Energy and Policy Act freed water contamination from WSTs from regulation (Rabe, 2013). The exemption states that underground injection control requirements do not have to be adhered to unless diesel fuels are part of the mixture being injected to frack the well (Clean Water Action, 2014). However, the EPA mandates that storm water regulation and spill prevention, control, and countermeasure plans be created to prevent the release of toxic chemical discharge into water supplies.
In California, the Division of Oil, Gas and Geothermal Resources (DOGGR), which is a subdivision of the Department of Conservation, monitors oil and gas production in California. DOGGR oversees the drilling, operation, maintenance, and plugging and abandonment of oil, natural gas, and geothermal wells (California Department of Conservation, 2014). DOGGR is also responsible for the administration of the California Environmental Quality Act (CEQA) over oil and gas development in the state. CEQA is designed to identify potential environmental impacts and to avoid or mitigate environmental damage (California Natural Resources Agency, 2014). Similar to CEQA notification is the Emergency Planning and Community Right-to-Know Act. This requires that companies and manufacturers release a detailed Toxic Release Inventory for chemicals utilized and released into the environment. However, the oil and gas industry is completely exempted from this TRI reporting.
In recent years, DOGGR acknowledged the gaps in regulations placed on oil and gas production and the information provided to the division about hydraulic fracturing (California Department of Conservation, Division of Oil Gas and Geothermal Resources (DOGGR), 2014). In 2011, Fran Pavley, a California state senator, requested information on hydraulic fracturing in California from DOGGR. The agency had “no information” on water use, “no data on the safety, efficacy and necessity” of WSTs and “no permitting process” relating to hydraulic fracturing (Sharp, 2012). In response, Pavley drafted Senate Bill 4 in 2013, passed in September 2013, which directly deals with WST reporting. SB4 will be discussed in detail in the next subsection.
Table 2: Regulations on Oil and Gas in California and the United States. (Source: U.S. EPA, 2002, 2012, 2014b; Brady, 2012; Clean Water Action, 2014; California Natural Resources Agency, 2014)
Regulation Content Traditional Production Non-‐Traditional Production

62
CERCLA Cleans up controlled releases of specified hazardous substances.
Regulated when oil discharge reaches waters of the United States. Must be reported if discharge creates a “sheen” or “film.” However, some toxic chemicals included on the hazardous substances list are exempted if they are included in oil and gas
production.
Same as traditional production.
Clean Water Drinking Act
Regulates discharges of pollutants into waters of the United States.
Excludes sediment as a pollutant when it is
generated from oil and gas production.
Same as traditional production.
Safe Water Drinking Act
Protects America’s drinking water from pollutants, whether it is from groundwater or above ground resources.
Not exempted from regulation.
Exempted from SWDA. However, if diesel is used to frack a well, a
SWDA permit must be issued.
RCRA Governs disposal of solid and hazardous wastes.
Exempts oil and gas produced water, and drilling fluids from requirements for monitoring
and disposal.
Hydraulic fracturing fluids and produced waters are exempted.
Emergency Planning and
Community Right-‐to-‐Know Act
Requires companies and manufacturers meeting specified criteria to report detailed Toxic Chemical Reports.
Exempted, even if criteria is met.
Exempted, even if criteria is met.
Senate Bill 4 Specific to WSTs. Requires filing of satisfactory certifications under penalty of law. This includes monitoring of groundwater before and after drilling, neighbor notification, and public disclosure of chemicals.
Not included. Subject to regulation.
CEQA Requires that environmental impact reports be generated.
Subject to regulation Subject to regulation
1. Senate Bill 4

63
Senate Bill 4 was enacted by the California legislature due to five concerns enumerated within the legislation. First, hydraulic fracturing and well stimulation treatments are increasing in California. Second, the state considers current scientific information on the risks of well stimulation treatments incomplete. Third, the legislature believes that government and industry transparency are vital. Fourth, public disclosure is important so as to allow the public to determine if they are being exposed to WST chemicals. Fifth, the legislature would like to understand the components of produced water used in WST so that it may be reused or treated (California Environmental Law and Policy Center, 2015)
First, SB4 requires an independent scientific study on well stimulation treatments to be conducted by the Secretary of California’s Natural Resources Agency. The study will provide information on existing and potential oil and gas reserves and analyze risks of WSTs (California Environmental Law and Policy Center, 2015). Study completion was set for January 1st, 2015. On January 14th, 2015, the department of Conservation released Volume I of the study, titled “An Independent Scientific Assessment of Well Stimulation Technologies in California: Well Stimulation Technologies and their Past, Present, and Potential Future Use in California.” (California Council on Science and Technology, 2015). It describes what WSTs are, the operations involved, and where they are practiced. The California Council on Science and Technology and the Lawrence Berkeley National Laboratory prepared the study. Volumes II and III of the study are set to be released in July 2015. Volume II is of most interest to our project; it will detail the effects of WSTs on water bodies, among other natural resources. Volume III will focus on how WSTs will affect the environment in specific geographic regions (California Council on Science and Technology, 2015)
Next, SB4 requires the development of WST regulations by DOGGR. These include threshold values for acid volume used, disclosure requirements of chemical composition of well stimulation fluids, and source and volume information of all water used, be it base or waste fluid (California Environmental Law and Policy Center, 2015).
Third, SB4 requires public disclosure of WST fluid composition. The composition must be provided online within 60 days of the termination of treatment on a well. This information is to be posted on the DOGGR website beginning in January 1, 2016. Currently, the information is required to be posted via FracFocus.org (California Environmental Law and Policy Center, 2015)
Fourth, SB4 ends the ability of operators and suppliers to claim trade secret protections on many of their products. It requires that the supplier disclose all chemical additives or constituents used in well stimulation treatment to DOGGR, even if the information is claimed as trade secret. If DOGGR finds that a trade secret claim is invalid, it may release the information to the public. Under the New Public Resources Code section 3160(J)(2) the following may no longer be protected as a trade secret:
1. The identities of the chemical constituents of additives 2. The concentration of additives in the well stimulation treatment fluid 3. Air or other pollution monitoring data 4. Health and safety data associated with WST fluids; and 5. The chemical composition of flowback fluid Fifth, SB4 creates a permitting process for WST operations. A well operator must
provide in the well permit application the time and location of the WST, a complete list of chemicals to be used, water management and groundwater monitoring plans, and the source and disposal method of fluids used in the operation. The permit is valid for one year from

64
DOGGR’s approval date. Permits are made available online by DOGGR five days after approval date (California Environmental Law and Policy Center, 2015).
Sixth, SB4 requires that landowners within 500 feet of a horizontal project of a WST or within a 1500 foot radius of the wellhead be notified of treatment. Operations may not commence until 30 days after notification of nearby landowners.
Last, SB4 directs the SWRCB to develop regional or well specific groundwater monitoring criteria by July 15, 2015. DOGGR along with industry and agriculture stakeholders are responsible for providing input into the monitoring plan (California Environmental Law and Policy Center, 2015)
Environmental groups withdrew support of SB4 when a provision was added that would allow the continuance of WSTs while DOGGR finalizes its comprehensive fracturing regulations. In addition, Section 3161, which requires DOGGR to complete an Environmental Impact Report (EIR) on WST across the state by July 1, 2015 allowed some local governments, namely Kern County, to attempt to complete their own independent EIRs before the statewide report could be finalized (California Environmental Law and Policy Center, 2015).
Kern County has not yet released an approved EIR. In August 2013, however, Kern County released a notice of preparation of a draft EIR. This EIR will be programmatic, that is environmental conditions of the entirety of Kern County will be considered, not conditions specific to each well. Should a Kern County oil and gas EIR be approved, DOGGR must consider only Kern’s EIR instead of the statewide EIR when approving WST permit applications (Kern County Planning and Community Development Department, 2013).
B. Hazardous Material Release Regulations The federal law that regulates hazardous materials spills is the Comprehensive
Environmental Response, Compensation, and Liability Act (CERCLA). It requires hazardous materials spills which exceed minimal reportable amounts to be reported to the National Response Center by any responsible parties (U.S. EPA, 2006).
In California, hazardous material spills are regulated by two pieces of law: the California Water Code section 13271 and the California Code of Regulations Title 19, Division 2, Chapter 4, Hazardous Material Release Reporting (California Water Code, 2015; California Code of Regulations, 2008)
The California Water Code section 13271 requires that any release of hazardous substances or sewage to the waters of the state must be verbally reported immediately to the California Emergency Management Agency, or once knowledge of the discharge is available or notification is possible without impeding cleanup and emergency measures (California Water Code, 2015). The California Emergency Management Agency is responsible for notifying the local health officer and director of environmental health of the spill. If the spill is of high enough concern to the health board, the public will be notified. Failure to comply with the notification requirements will result in misdemeanor charge or a fine of up to $20,000 to involved parties. Substances that are listed as hazardous wastes in Section 25410 of the Health and Safety code are assigned reportable quantities by the department of Toxic Substances Control (California Water Code, 2015). Sewage is assigned reportable quantities by the California State Water Board.

65
The California Code of Regulations chapter on hazardous materials expands on the reporting requirements to include the minimum information required in the release report (California Code of Regulations, 2008). This includes the
1. Exact location of the release or threatened release; 2. The name of the person reporting the release or threatened release; 3. The hazardous materials involved in the release or threatened release; 4. An estimate of the quantity of hazardous materials involved; and 5. If known, the potential hazards presented by the hazardous material involved in
the release or threatened release; Reporting is to be made to the Office of Emergency Services and a telephone
number is provided. Interestingly, the California Code adds to the Water Code by clarifying that the immediate reporting of a hazardous material spill to land is only required in there is “reasonable belief” that the spill may pose a threat to public health, property, or the environment. Written reporting is only sometimes required, pursuant to 42 U.S.C. section 11004(c). If required, the written notice is sent to the Chemical Emergency Planning and Response Commission no later than 30 days after the release. The written notice form can be found on the next page figure 4 (California Code of Regulations, 2008).
The reportable quantities of chemicals can be found on two lists (California Office of Emergency Services, 2014a). The first is the Extremely Hazardous Substances list. The second is the more detailed Consolidated List of Chemicals. However, besides these two lists, according to California Hazardous Materials Spill / Release Notification Guidance, if the responsible parties are doubtful of whether or not the release should be reported, the release should be reported (California Office of Emergency Services, 2014a).
VI. References Ailey, B., Clouse, D., Hill, D., Catreet, M., Kubala, G., 1997. “Specialty Chemicals in the Oil
Field” Oilfield Review. https://www.slb.com/~/media/Files/resources/oilfield_review/ors97/spr97/specialty_chemicals.pdf
Argonne National Laboratory, 2009. Produced Water Volumes and Management Practices in the US.
<http://www.circleofblue.org/waternews/wpcontent/uploads/2010/09 /ANL_EVS__R09_produced_water_volume_report_2437.pdf> Bishop, J., 2014. “Re: Underground Injection Control Drinking Water Source Evaluation.”
California State Water Resources Control Board. http://www.biologicaldiversity.org/campaigns/california_fracking/pdfs/20140915_Bishop_letter_to_Blumenfeld_Responding_to_July_17_2014_UIC_Letter.pdf
Blumer, M., Ehrhardt, M., Jones, J., 1973. “The Environmental Fate of Stranded Crude Oil.”
Deep Sea Research and Oceanographic Abstracts, 20 (3) 239-259. Borchart, J., 1989. “Chemicals Used in Oil Field Operations” Shell Development
Company http://pubs.acs.org/doi/pdfplus/10.1021/bk-1989-0396.ch001
66
Brady, W., Crannell, J., 2012 “Hydraulic Fracturing Regulation in the United States: The Laissez-Faire Approach of the Federal Government and Varying State Regulations.” Vermont Journal of Environmental Law. 14(1): 1-19.
Burford, T., 2010. “Onshore Oil Disasters.” National Wildlife Federation. <http://www.nwf.org/pdf/Global-Warming/Onshore Oil Disasters 8-26-10.pdfNegro, S., 2012.
California Code of Regulations, 2008. California Code of Regulations, Title 19, Public Safety,
Division 2, Office of Emergency Services, Chapter 4, Hazardous Material Release Reporting, Inventory, and Response Plans. http://develop.oes.ca.gov/WebPage/oeswebsite.nsf/ClientOESFileLibrary/Recovery%20-%20Public%20Assistance%20Section%20/$file/Chapter%204.%20Hazard.pdf
California Council on Science and Technology, 2015. “CCST Well Stimulation Project (SB4)”
<http://www.ccst.us/projects/hydraulic_fracturing_public/SB4.php> California Department of Conservation, 2013. “Well Permitting”
<http://www.conservation.ca.gov/dog/Pages/WellPermitting.aspx#drillnewwells> California Department of Conservation, Division of Oil Gas and Geothermal Resources
(DOGGR), 2014. “Hydraulic Fracturing in California” <http://www.conservation.ca.gov/dog/general_information/Pages/HydraulicFracturing.aspx
California Department of Conservation, Division of Oil, Gas, and Geothermal Resources
(DOGGR), 2013. “Water Use Reporting for Oil and Gas Production.” <http://www.conservation.ca.gov/dog/SB 1281/Pages/Index.aspx>
California Environmental Law and Policy Center, 2015. “Well Stimulation in California”
http://www.ccst.us/projects/hydraulic_fracturing_public/SB4.php California Natural Resources Agency, 2014. “Frequently Asked Questions about CEQA”
<http://resources.ca.gov/ceqa/more/faq.html> California Office of Emergency Services 1, 2014a. “California Hazardous Materials Spill /
Release Notification Guidance” <http://www.calema.ca.gov/hazardousmaterials/pages/spill-release-reporting.aspx>
California Research Bureau, 2014. “Sources, Uses, and Disposal of Water in Hydraulic
Fracturing.” <http://www.library.ca.gov/crb/14/S-14-014.pdf> California Water Code, 2015. California Water Code Division 7, Chapter 4, Article 4, Section
13271. < http://codes.lp.findlaw.com/cacode/WAT/1/d7/4/4/s13271> Clean Water Action, 2014. “Fracking: Laws and Loopholes”
<http://cleanwater.org/page/fracking-laws-and-loopholes>

67
Clean Water Action, 2014. “In the Pits - Oil and Gas Wastewater in California” <http://www.cleanwateraction.org/publication/pits>
Colborn, T., Kwiatkowski, K., Bachran, M., 2011. “Natural Gas Operations from a Public
Health Perspective.” Human and Ecological Risk Assessment: An International Journal 17:5 1039–1056.
Daneshy, A., 2010. “Hydraulic Fracturing to Improve Production,” Society of Petroleum Engineers
6(3) http://www.spe.org/twa/print/archives/2010/2010v6n3/09_Tech101.pdf. Darrah, T., Vengosh, A., Robert J., Warner, N., & Poreda, R., 2014. “Noble Gases Identify the
Mechanisms of Fugitive Gas Contamination in Drinking-Water Wells Overlying the Marcellus and Barnett Shales.” Proceedings of the National Academy of Sciences 111:39: 14076–81.
Desert Renewable Energy Conservation Plan, 2014. “Socioeconomics and Environmental
Justice.” <http://www.drecp.org/draftdrecp/files/d_Volume_III/III.23_Socioeconomics_and_Environmental_Justice.pdf>
Farella, Braun, Martel., 2013. “Summary of Major California Release Reporting Requirements.”
Powerpoint. Fontenot, B., Hunt, L., Hildenbrand, Z., Carlton, D., Oka, H., Walton, J., Hopkins, D., Osorio,
A., Bjorndal, B., Hu, Q., Schug, K., 2013. “An Evaluation of Water Quality in Private Drinking Water Wells Near Natural Gas Extraction Sites in the Barnett Shale Formation.” Environmental Science & Technology 47(17): 10032–40.
FracFocus, 2015a. “Chemical Use in Hydraulic Fracturing”, <http://fracfocus.org/water-
protection/drilling-usage> FracFocus, 2015b. “Hydraulic Fracturing: Casing”, <http://fracfocus.org/hydraulic-fracturing-
how-it-works/casing> Francis, R., 2014. “Air Quality and Unconventional Oil and Gas Sites.” BioMed Central: The Open
Access Publisher. <http://www.biomedcentral.com/presscenter/pressreleases/30102014> Freudenrich, C., 2010. “How Oil Drilling Works”. Elliots Land Company.
http://www.elsandcompany.com/howdrillingworks.htm GSA – Geological Society of America, 2015. “GSA Critical Issue: Hydraulic Fracturing”
http://www.geosociety.org/criticalissues/hydraulicFracturing/documents/GSA-HydroFracking.pdf
Gross, S., Avens, H., Banducci, A., Sahmel, J., Panko, J., Tvermoes, B., 2013. “Analysis of
BTEX Groundwater Concentrations from Surface Spills Associated with Hydraulic Fracturing Operations.” Journal of the Air & Waste Management Association. 63(4): 424–432.

68
Halliburton, 2015. “Fracturing 101,” <http://www.halliburton.com/public/projects/pubsdata/hydraulic
_fracturing/fracturing_101.html> Kern County Planning and Community Development Department, 2013. “Notice Of
Preparation of a Draft Environmental Impact Report For an Amendment To Title 19 – Kern County Zoning Ordinance, Focused On Chapter 19.98 (Oil And Gas Production) For Oil And Gas Local Permitting.” <http://pcd.kerndsa.com/planning/oil-gas-zoning-amendment>
Long, J., Feinstein, L., Birkholzer, J., Jordan, P., Houseworth, J., Dobson, P., Gautier, D.,
2015. “Independent Scientific Assessment of Well Stimulation in California” The California Council on Science and Technology <http://www.ccst.us/publications/2015/2015SB4-v1.pdf>
Lutz, B., Aurana L., Martin D., 2013. “Generation, Transport, and Disposal of Wastewater
Associated with Marcellus Shale Gas Development.” Water Resources Research 49(2): 647–56.
Macey, G., Breech, R., Chernaik, M., Cox, C., Larson, D. Thomas, D., O’Carpenter, D., 2014.
“Air Concentrations of Volatile Compounds Near Oil And Gas Production:A Community-Based Exploratory Study.” Environmental Health. 13(7).
National Oceanic and Atmospheric Administration, 2013. “News & Events -
2013.” <http://www.esrl.noaa.gov/csd/news/2013/129_0114.html> National Petroleum Council, 2011. “Sustainable Drilling of Onshore Oil and Gas Wells.” North
American Resource Development Study, Paper #2-23, 5-19. <http://www.npc.org/prudent_development-topic_papers/2-23_sustainable_drilling_of_onshore_oil_and_gas_wells_paper.pdf>
Office of Indian Energy and Economic Development, 2015. “Oil and Gas Drilling/Development Impacts.” <http://teeic.indianaffairs.gov/er/oilgas/impact/drilldev/index.html>
Osborn, S., Vengosh, A., Warner, N., Jackson, R., 2011. “Methane Contamination of Drinking
Water Accompanying Gas-Well Drilling and Hydraulic Fracturing” Proceedings of the National Academy of Sciences of the United States of America 108(20): 8172–6.
Rabe, B., Borick, C., 2013. “Conventional Politics for Unconventional Drilling? Lessons from
Pennsylvania's Early Move into Fracking Policy Development.” Review of Policy Research, 30(3): 321-340.
Rotkin-Ellman, M., 2014. “Fracking Threatens Health of Kern County Communities Already
Overburdened with Pollution.” Natural Resources Defense Council http://www.nrdc.org/health/files/california-fracking-risks-kern-FS.pdf

69
Rozell, D., Reaven, S., 2012. “Water Pollution Risk Associated with Natural Gas Extraction from the Marcellus Shale.” Risk Analysis 32:8. <http://dx.doi.org/10.1111/j.1539-6924.2011.01757.x>
Schon, S., 2014. “Hydraulic Fracturing Not Responsible for Methane Migration.” Proceedings of
the National Academy of Sciences of the United States of America. 108(37). Sharp, R., Allayaud, B., 2012. “California Regulators: See No Fracking, Speak No Fracking.”
Environmental Working Group, 1-26. <http://static.ewg.org/reports/2012/fracking/ca_fracking/ca_regulators_see_no_fracking.pdf>
Soraghan, M., 2014. “Oil and Gas: Spills up 17 Percent in U.S. in
2013.” <http://www.eenews.net/stories/1059999364> Srebotnjak, T., Rotkin-Ellman, M., 2014. “Drilling in California: Who’s at Risk?” Natural
Resources Defense Council. < http://www.nrdc.org/health/files/california-fracking-risks-report.pdf>
U.S. Department of Energy, 2015. “Enhanced Oil Recovery”. http://energy.gov/fe/science-
innovation/oil-gas-research/enhanced-oil-recovery U.S. Environmental Protection Agency (EPA), 2002. “Exemption of Oil and Gas Exploration
and Production Wastes from Federal Hazardous Waste Regulations.” <http://www.epa.gov/osw/nonhaz/industrial/special/oil/oil-gas.pdf>
U.S. Environmental Protection Agency (EPA), 2006. “Consolidated List of Chemicals Subject
to the Emergency Planning and Community Right to Know Act (EPCRA) and Section 112(r) of the Clean Air Act”. < http://www.epa.gov/osweroe1/docs/chem/title3_Oct_2006.pdf>
U.S. EPA, 2009. “Understanding the Safe Drinking Water Act.”
<http://water.epa.gov/lawsregs/guidance/sdwa/upload/2009_08_28_sdwa_fs_30ann_sdwa_web.pdf>
U.S. EPA., 2011. “Outdoor Air- Industry, Business, and Home: Oil and Natural Gas
Production- Additional Information.” <http://www.epa.gov/oaqps001/community/details/oil-gas_addl_info.html>
U.S EPA, 2012. “Study of the Potential Impacts of Hydraulic Fracturing on Drinking Water
Resources.” Office of Research and Development. http://www2.epa.gov/sites/production/files/documents/hf-report20121214.pdf
U.S. EPA, 2014a. “What is Environmental
Justice?”<http://www.epa.gov/environmentaljustice/> U.S. EPA, 2014b. “Oil Pollution Prevention Regulation Overview.”
<http://www.epa.gov/oem/content/lawsregs/opprover.htm>

70
U.S. EPA, 2015. “Oil and Natural Gas Air Pollution Standards.”
<http://www.epa.gov/airquality/oilandgas/> United States Department of Energy (DOE), 2011. “Review of Emerging Resources: US Shale
Gas and Shale Oil Plays.” <http://www.eia.gov/analysis/studies/usshalegas/ Vengosh, A., Jackson R., Warner N., Darrah T., Kondash A., 2014. “A Critical Review of the
Risks to Water Resources from Unconventional Shale Gas Development and Hydraulic Fracturing in the United States.” Environmental Science & Technology 48(15): 8340.
Vidic, R., Brantley, S., Vandenbossche, J., Yoxtheimer, D., Abad, J., 2013. “Impact of Shale Gas
on Regional Water Quality” Science. 340(6134) Warner, N., Darrah, T., Jackson R., Millot R., Kloppmann W., & Vengosh A., 2014. “New
Tracers Identify Hydraulic Fracturing Fluids and Accidental Releases from Oil and Gas Operations.” Environmental Science & Technology 48(21): 14790-14798.
Waxman H., Markey, E., DeGette D., 2011. “Chemicals Used in Hydraulic Fracturing” United
States House of Representatives COEAC <http://conservationco.org/admin/wp-content/uploads/2013/02/Final-Rebuttal-Exhibits.pdf-Adobe-Acrobat-Pro.pdf>