An analysis of factors influencing participation of ...
122
i AN ANALYSIS OF FACTORS INFLUENCING PARTICIPATION OF SMALLHOLDER FARMERS IN RED BEAN MARKETING IN HALABA SPECIAL DISTRICT, ETHIOPIA BY AGETE JERENA KABETO THESIS SUBMITTED IN PARTIAL FULFILLMENT OF THE REQUIREMENTS FOR THE DEGREE OF MASTER OF SCIENCE IN AGRICULTURAL AND APPLIED ECONOMICS DEPARTMENT OF AGRICULTURAL ECONOMICS FACULTY OF AGRICULTURE UNIVERSITY OF NAIROBI August, 2014
Transcript of An analysis of factors influencing participation of ...

i
AN ANALYSIS OF FACTORS INFLUENCING PARTICIPATION OF SMALLHOLDER
FARMERS IN RED BEAN MARKETING IN HALABA SPECIAL DISTRICT,
ETHIOPIA
BY
AGETE JERENA KABETO
THESIS SUBMITTED IN PARTIAL FULFILLMENT OF THE REQUIREMENTS FOR
THE DEGREE OF MASTER OF SCIENCE IN AGRICULTURAL AND APPLIED
ECONOMICS
DEPARTMENT OF AGRICULTURAL ECONOMICS
FACULTY OF AGRICULTURE
UNIVERSITY OF NAIROBI
August, 2014
ii
DECLARATION
This thesis is my original work and has not been presented in any university for the award of a
degree.
Agete Jerena Kabeto (Registration No: A56/73334/12)
Signature…………………………………… Date………………………………
Approval:
This thesis has been submitted to the board of postgraduate studies with the consent and approval
of the following supervisors:
Dr Rose Nyikal
Signature…………………………… Date……………..……....
Department of Agricultural Economics, University of Nairobi
Dr Patrick Irungu
Signature…………………………… Date………………………
Department of Agricultural Economics, University of Nairobi

iii
DEDICATION
This Work is dedicated to my wife Yaynabeba, for encouragement, support, and prayers that
eased the completion of this thesis. More so, my father Jerena Kabeto, and my Mother Achame
Benta for the work ethics they instilled and Exodus International Ministry of Nairobi, Kenya for
their continuous prayers that has helped me this far.

iv
ACKNOWLEDGMENTS
First, I acknowledge the Almighty God through his son Jesus Christ, who saved and inspired me
to pursue a master’s degree in Agricultural and Applied Economics as well as giving me
endurance to withstand the challenges, which I came across in life.
I would like to express my special gratitude to my advisors, Dr Rose A. Nyikal and Dr Patrick
Irungu for their encouragement, guidance, provision of important materials, and professional
expertise. Success and timely accomplishment of this study would have been very difficult
without their generous time devotion from the early design to the final write-up of the thesis.
I acknowledge my beloved wife Yaynabeba for her immense sacrifice to make this come to
reality. My sincere gratitude goes to my wonderful parents, Jerena Kabeto and Achame Benta for
enhancing a solid foundation and for all the love and care. I thank my siblings Adanch, Kefelech,
Martha, Alemayahu, Tarku, Senbetu, and Markos for their support in prayer. My deepest
gratitude extends to Dr Abayneh Ayele and Bekelech Tefera, Pastor Chaltu (Mami), Pastor
David, and all Exodus International Ministry members of Ngara, Nairobi, for the immense
support in this journey through continuous prayer and encouragement. I would like to extend my
sincere gratitude to Ms Fikir Alemayhu for her assistance in drawing the map of the study area
and encouragements from the beginning to this moment, Tedesse, Abenet and Wondimu for their
support in all aspects and encouragements.
My special appreciation goes to African Economic Research Consortium for their sponsorship to
pursue the MSc in Agricultural and Applied Economics.
My profound appreciation extends to red bean producers and traders in Halaba Special District
for their consideration, hospitality, and willingness to participate in the survey and spent many
hours explaining their livelihoods, which I cannot forget. I wish to convey my sincere gratitude
to Halaba Special District Cooperative and Marketing Department as well as the Agriculture and
Rural Development Office in the district that without their help and co-operation this study could
not have materialized. I am indebted to Girma Tesfaye for his assistance with the coordination of
data collection and Tedesse Haile for his encouragements. I would like to extend special thank to
all those District Agriculture and Rural Development experts who participated in data collection.

v
TABLE OF CONTENTS
DECLARATION ....................................................................................................................... ii
DEDICATION .......................................................................................................................... iii
ACKNOWLEDGMENTS ......................................................................................................... iv
TABLE OF CONTENTS ............................................................................................................v
LIST OF APPENDICES ......................................................................................................... viii
LIST OF TABLES .................................................................................................................... ix
LIST OF ABBREVIATIONS AND ACRONYMS ................................................................... xi
ABSTRACT ............................................................................................................................ xii
CHAPTER 1 ...............................................................................................................................1
INTRODUCTION ......................................................................................................................1
1.1 Background .......................................................................................................................1
1.2. Problem Statement ............................................................................................................3
1.3 Purpose and Objectives ......................................................................................................5
1.4 Research Questions ............................................................................................................5
1.5 Justification of the Study ....................................................................................................5
1.6 Organization of the Thesis .................................................................................................6
CHAPTER 2 ...............................................................................................................................7
LITERATURE REVIEW ............................................................................................................7
2.1 Economic Importance of Common Beans ..........................................................................7
2.2 Common Beans Production and Marketing in the World ....................................................7
2.3 Common Beans Production and Marketing in Ethiopia ......................................................8
2.4 Red Bean Production and Marketing in Ethiopia ................................................................9
2.5 Red Bean Production and Market in Halaba Special District ............................................ 11
2.6. Concept and Analytical Methods in Market Participation ................................................ 12
2.7 Importance of Market Participation for Rural Households Economic Development.......... 12
2.8 Empirical Studies on Factors Affecting Market Participation Decision and Extent of Participation in Agricultural Product Markets ........................................................................ 13
2.9 Summary ......................................................................................................................... 15

vi
CHAPTER 3 ............................................................................................................................. 17
METHODOLOGY.................................................................................................................... 17
3.1 Theoretical Framework .................................................................................................... 17
3.2 Marketing Margins .......................................................................................................... 19
3.3 Empirical Model .............................................................................................................. 20
3.4 Justification for Inclusion of Various Independent Variables ............................................ 22
3.5 Inverse Mill’s Ratio ......................................................................................................... 27
3.6 Diagnostic Tests .............................................................................................................. 27
3.6.1 MulticollinearityTest ................................................................................................. 27
3.6.2 Heteroskedasticity Test.............................................................................................. 28
3.6.3 Goodness-of-Fit Test ................................................................................................. 28
3.7 Study Area ....................................................................................................................... 29
3.8 Sampling Techniques ....................................................................................................... 30
3.8.1 Determination of Sample Size ................................................................................... 31
3.9 Data Sources .................................................................................................................... 32
3.10 Data Analysis................................................................................................................. 33
3.10.1 Analysis of Marketing Channels and Constraints of Farmers, Traders and Cooperatives ...................................................................................................................... 33
CHAPTER 4 ............................................................................................................................. 34
RESULTS AND DISCUSSION ................................................................................................ 34
4. 1 Comparison of Demographic and Socio-Economic Characteristics of Red Bean Farmers in Halaba Special District .......................................................................................................... 34
4.1.1 Demographic Characteristics of Farmers ................................................................... 34
4.2 Discussion ....................................................................................................................... 38
4.3 Access to Different Services ............................................................................................ 39
4.3.1 Access to Credit ........................................................................................................ 39
4.3.2 Access to Field Demonstrations ................................................................................. 41
4.3.3 Access to Market Information ................................................................................... 41
4.3.4 Membership in a Farmer Cooperative ........................................................................ 43
4.3.5 Awareness about Quality Standards and Production According to Quality Standards . 43
4.3.6 Discussion ................................................................................................................. 44

vii
4.4 Farmer Perception of Keeping of Farm Records in HSD .................................................. 46
4.5 Production and Supply of Red Bean in HSD .................................................................... 47
4.5.1 Main Sources of Labor .............................................................................................. 47
4.5.2 Sources of Planting Materials .................................................................................... 48
4.5.3 Discussion ................................................................................................................. 49
4.6 Red Bean Marketing in HSD............................................................................................ 49
4.6.1 The Red Bean Market Channels in HSD .................................................................... 49
4.6.2 Major Market Actors and their Role in Red Bean Marketing Chain in HSD ............... 51
4.6.3 Discussion ................................................................................................................. 59
4.6.4 Marketing Arrangements of Red Beans in HSD ......................................................... 59
4.7 Major Constraints in Red Bean Production and Marketing in HSD .................................. 62
4.7.1 Major Production Constraints .................................................................................... 62
4.7.2 Major Marketing Constraints ..................................................................................... 64
4.7.3 Discussion ................................................................................................................. 66
4.8 Factors Influencing Red Bean Farmers’ Market Participation and Extent of Participation in HSD ...................................................................................................................................... 67
4.8.1 Factors Influencing the Decision to Participate in Red Bean Market in HSD ............. 67
4.8.2 Factors Influencing the Extent of Red Bean Market Participation in HSD .................. 73
CHAPTER 5 ............................................................................................................................. 77
SUMMARY, CONCLUSIONS AND POLICY RECOMMENDATIONS................................. 77
5.1 Summary ......................................................................................................................... 77
5.2 Conclusion ....................................................................................................................... 78
5.3 Recommendations............................................................................................................ 79
REFERENCES ......................................................................................................................... 81
APPENDICES .......................................................................................................................... 89

viii
LIST OF APPENDICES
APPENDIX 1: Pearson correlation coefficients for testing for multicollinearity ....................... 89
APPENDIX 2: The results of variance Inflation factor (VIF) analysis ...................................... 90
APPENDIX 3: Results of heterokedasticity test........................................................................ 91
APPENDIX 4: Checklist for Focus Group Discussion .............................................................. 92
APPENDIX 5: Producers’ Survey Questionnaire...................................................................... 94
APPENDIX 6: Traders (urban collectors, rural collectors, wholesalers, primary cooperative and
union) survey questionnaire ............................................................................................. 100
APPENDIX 7: Percentage of members and non-members of primary cooperative in HSD ..... 104
APPENDIX 8: Relationships between different actors along red bean market chain in HSD .. 105
APPENDIX 9: Probit and OLS models test of fitness ............................................................. 107
APPENDIX 10: Lists of red bean farmers attended the FGD in HSD ..................................... 108

ix
LIST OF TABLES
Table 3.1: Description of variable in the empirical model…………………...………………….21
Table 3.2: Sample size of market traders surveyed in HSD …………………………………….32
Table 4. 1: Demographic characteristics of red bean farmers in HSD………………………….. 34
Table 4.2: Distribution of red bean farmers in HSD according to gender and marital status……35
Table 4.3: Summary of resource ownership and off-farm income by households in HSD……... 36
Table 4.4: Number of transportation means owned by red bean farmers in HSD………………. 37
Table 4. 5: Main sources of income for red bean farmers in HSD……………………………… 38
Table 4.6: Off-farm activities of red bean farmers in HSD……………………………………... 38
Table 4.7: Red bean farmers’ access to different services in HSD………………………………40
Table 4.8: Reasons of red bean farmers not to access formal credit in HSD…………………… 41
Table 4.9: Main sources of market information in HSD………………………………………... 42
Table 4.10: Information delivery channels on different red bean market attributes in HSD…… 43
Table 4.11: Membership, awareness and standard among red bean farmers in HSD…………... 44
Table 4.12: Major reasons for not keeping farm records in HSD………………………………..47
Table 4.13: Type of red bean planting material used in HSD…………………………………... 48
Table 4.14: Production, consumption, post harvest loss, gift and land allocation in HSD………52
Table 4.15: Selling price and marketing costs of red bean actors in HSD……………………… 54
Table 4.16: Marketing margins of traders for seven different channels………………………… 61
Table 4.17: Major production constraints experienced by red bean farmers in HSD……………63
Table 4.18: Frequency of major red bean marketing constraints in HSD……………………… 65
Table 4.19: Factors that influence farmers’ market participation - probit model result………… 69
Table 4.20: Factors influencing the extent of farmers’ participation in red bean market in HSD.74

x
LIST OF FIGURES
Figure 1.1: Average area and annual production of red bean in Halaba Special District ...............3
Figure 2.1: Common bean area and production trends in the world ……………………………7
Figure 2.2: Trends of total area and production of common beans in Ethiopia .............................8
Figure 3.1: Map of Halaba Special District ...………………………………………………30
Figure 4. 1: Percentage of main sources of labor in HSD ………………………………………48
Figure 4. 2: Marketing channels of red bean in HSD ................................................................. 50

xi
LIST OF ABBREVIATIONS AND ACRONYMS
ACOS Agricultural Commodity Supply CII Chemonics International Inc Co-SAERSAR Commission for Sustainable Agriculture and Environmental
Rehabilitation in Southern Administrative Region (Ethiopia) CSA Central Statistical Authority DA Development Agent ECX Ethiopian Commodity Exchange Authority EGTE Ethiopian Grain Trade Enterprise ERCA Ethiopian Revenue and Custom Authority ETB Ethiopian Birr (18.5 ETB= 1US$) EU European Union FAOSTAT Food and Agriculture Organization Statistics FGD Focus Group Discussion FTC Farmers’ Training Center NGO Non Governmental Organizations HSD Halaba Special District HSDMD HSD Marketing Department ILRI International Livestock Research Institute IPMS Improving Productivity and Market Success of Ethiopia Farmers JICA Japan International Cooperation Agency KA Kebeles Administration M.A.S.L Meter Above Sea Level MARD Ministry of Agriculture and Rural Development MT Metric Tons OLS Ordinary Least Squares SNNPR Southern Nations, Nationalities and People’s Region SSA Sub-Saharan Africa TLU Tropical Livestock Unit USA United States of America USD United States Dollars

xii
ABSTRACT
Market participation in rural households is a vital strategy in assuring better income and a key
factor to lifting rural households from poverty. Red bean is an important crop in Ethiopia,
especially Halaba Special District (HSD), but farmers are not participating in the market
adequately. The overall objective of the study was to assess the factors determining the
participation of smallholder farmers in the red bean market chain in HSD. The specific
objectives of the study were characterizing the marketing chain of red bean in HSD, identifying
constraints of red bean farmers, traders and cooperatives, examining the factors influencing
market participation decision and extent of participation in the district. A multi-stage sampling
procedure was employed to draw a random sample of 150 red bean producers, and stratified
sampling was employed to get 33 red bean traders. A two-stage Heckman model was used to
investigate factors affecting market participation decision for red bean and extent of market
participation decision. The study found that about 79, 0.8, 0.7, and 19.5 percent of the produce
was purchased by urban collectors, rural assemblers, primary cooperatives, and wholesalers
respectively. Traders graded the produce after purchase and sold to the next actors. Wholesalers
and a few assemblers used intermediaries to purchase red beans while urban collectors bought
directly from the farmers and conveyed to the next actors. It was reported that brokers were a
major obstacle to red bean marketing in the district because they confuse farmers with wrong
price information and compete benefits expected to be earned by the farmers. Red bean farmers
received higher returns when they sold their outputs directly to wholesalers. In the district,
major red bean farmers’ production and marketing constraints were brokers, price fluctuations,
access to improved seed and access to credit. On the other hand red bean traders marketing
bottlenecks were low quality, informal traders and shortage of finance. The market participation
decision was significantly influenced by price, ownership of transportation means, number of
extension visits per year, amount of red bean produced, awareness about quality standards;
market information, family size, access to credit, and gender. These suggest that there is an
urgent need for concerned organization to take part and improve the income and hence the
livelihood of red bean farmers. The extent of market participation was significantly influenced
by price, ownership of means of transport, amount of red bean produced and family size.
Awareness about quality standards influenced market participation decision positively, indicating
that farmers should be trained on red bean quality standards. Comprehensive extension work is

xiii
urgently needed to assist red bean farmers in post harvest handling, and linking them with
markets. Based on the findings, the study recommended creating good market networks, reliable
market information, strong extension intervention, and training farmers on methods of producing
high quality red bean. Attention should be given to brokers’ activities and access to improved
seeds, and the government should enhance credit supply.

1
CHAPTER 1
INTRODUCTION 1.1 Background
Market participation in rural households is an important strategy for poverty alleviation and food
security (Mathenge et al., 2010). It refers to the markets actors’ decision on whether to be
involved or not in the flow of products from producers to end users (Yaynabeba, 2013). Majority
of smallholder farmers in rural areas are trapped in a vicious circle of poverty characterized, inter
alia, by low economic returns due to low market participation. Poverty reduction and improving
the livelihood of the rural smallholders has strong relationships with their market participation
(Mathenge et al., 2010). Increased market participation by the poor has been found to be vital as
a means of breaking from the traditional semi-subsistence farming and a key factor to lifting
rural households from poverty. However, smallholders do not often participate much in food
crops markets due to subsistence production and also higher costs associated with searching for
markets (World Bank, 2008; Jayne et al., 2005).
In Ethiopia, pulses are important food crops that play a crucial role in the country’s economy.
Besides improving smallholders’ food security, pulses are an affordable source of protein and
make up approximately 15 percent of the average Ethiopian diet (Shahidur et al., 2010). In
addition, pulses offer natural soil maintenance benefits through nitrogen fixation, which
improves the cereals yield, consequently resulting in savings for smallholder farmers because of
less fertilizer use and increasing soil fertility. Pulses account for 13 percent of cultivated land and
approximately 10 percent of value addition (ibid). The most common pulses in Ethiopia include
common bean (Phaseolus vulgaris L.), horse bean, pea, lentil, and chickpea (Bindera, 2009).
Common beans are important for direct consumption because they grow all over the world and
are consumed as dry and snap beans. The world major common beans producers are India,
Brazil, Myanmar, and China. Ethiopia is the third largest producer of common beans in Eastern
and Southern Africa (COMESA) and the leading exporter in Africa. The country exported 40
percent of its common beans out of the total production in 2010 (FAOSTAT, 2013). Common
beans are increasingly becoming an important food security commodity particularly among the

2
smallholders (Bindera, 2009). For instance, consumption has increased from 98,065 tons to
242,100 tons between 2004 and 2009. In addition, it is important in the county’s balance of
payments (CII, 2010).
There is a wide range of common beans grown in Ethiopia such as mottled, red, white, and black
varieties (Ferris and Kaganzi, 2008). Among the four types of common beans, the commercial
varieties are pure red and pure white. These two varieties are becoming the most commonly
grown types with increasing market demand. Red bean are produced for both sale and home
consumptions. The white beans are exported to the European Union (EU) and United States of
America (USA). Red bean are exported to Asia, Africa, and some EU countries (ERCA, 2008).
In the last few years, domestic and international demands for red and white beans have
increased. For instance, in 2005 and 2009 the country got US$ 63 and 90 million respectively
from common beans export market (Shahidur et al., 2010). Despite the huge international
demand for red and white bean from Ethiopia, the country is unable to meet the demand whereas
there is huge un-marketed production in the country (CSA, 2011; Ferris and Kaganzi, 2008).
In Ethiopia, the quantity of red bean exported to different parts of the world is relatively lower
than that of white beans. For instance, in 2008 the total amount of white and red bean exported
was 78,271 and 8,911 metric tons (MT) respectively. Ethiopian red bean has high demand in
Africa, Arabia, Asia, and some EU countries, and are exported to the different part of the world
(Bindera, 2009). The increasing demand for quality red bean on the world export market is a
great opportunity for Ethiopia to boost its export earnings if smallholder farmers’ market
participation is increased and the farmers linked to markets. However, smallholders have not yet
taken full advantage of the opportunities on local and export market. Besides the increasing
demand, the country has a suitable climate, low production costs, availability of arable land and,
access to the port of Djibouti, making it possible to export large quantities all over the world
(Bisschop and Dijk, 2007). Furthermore, Ethiopia has both time and cost advantages over the
major exporting countries. For instance, it takes nine weeks for beans sea shipment from China
to EU markets whereas it only takes three weeks from Ethiopia to same markets (Legese et al.,
2006).
Red bean grow in almost all regions of Ethiopia, and are mostly produced by smallholder
farmers. The major red bean production region of the country is Southern Nation Nationality

3
People Region (SNNPR), as compared with other regions of the country (Bindera, 2009; IPMS,
2005). The crop is a principal food and cash crop particularly in SNNPR (Bisschop and Dijk,
2007). In SNNPR, Halaba Special District (HSD) is one of the largest red bean producers. Figure
1.1 below presents the trend of red bean production in HSD over the past half decade. In recent
years, red bean production and land allocation have been increasing. The average land area
covered by red bean was 19,262 hectares between 2008 and 2011 and in the district; area
coverage was not more than 10,000 hectares before 2008 (HSDMD, 2012). The average red bean
production increased from 28,000 MT in 2008 to 40,000 MT in 2011 (HSDMD, 2012).
Figure 1.1: Average area and annual production of red bean in Halaba Special District
Source: Halaba Special District Marketing Department (2013)
In Halaba Special District, producers’ relative market participation has been declining steadily.
In 1997, the proportion of red bean sold was 44 percent out of the total production and in 2004
the proportion supplied to the market was 54.5 percent. In the recent years, the proportion of red
bean marketed has declined (CSA, 2008; HSDMD, 2012). For instance, the total proportion of
red bean supplied to the market was 13.9, 9 and 10 percent in 2008, 2010, and 2011 respectively
(CSA, 2008; HSDMD, 2012).
1.2. Problem Statement
Despite the increase in production of and international demand for red bean from Ethiopia, and
the existence of cost and time advantages of the country over some major exporting countries,
farmer participation in red beans market has been declining steadily in HSD. Previous studies
indicate that the proportion of red bean sold from the district decreased from 44 percent to 10
percent of total production between 1997 and 2011 (Co-SAERSAR, 1997; IPMS, 2005; Shahidur
0
10,000
20,000
30,000
40,000
50,000
2008 2009 2010 2011
Area in hectares Production in ton

4
et al., 2010). Additionally, HSD Marketing Department also reported that while red bean
production is increasing, farmers’ market participation is declining (HSDMD, 2012). This
decline indicates that farmers’ participation in red bean market is not matching increasing
production and land allocation efforts.
In HSD, there are many brokers along the red bean marketing chain hence competing off the
benefits with smallholder farmers; the brokers were the ones setting red bean prices (HSDMD,
2012). Ethiopia formulated a strategy to develop its agricultural markets through registering it
under Ethiopian Commodity Exchange (ECX) whereby prices are determined based on force of
demand and supply, transparently (Bindera, 2009). Since, red bean is not among the
commodities handled under ECX, there is no channel to convey price information directly from
export markets to red bean farmers. Furthermore, there is lack of coordination between producers
and cooperatives and between cooperative and traders, which may jeopardize the transactions.
Moreover, the stakeholders have not fully understood marketing channels and constraints of
traders and other marketing actors along the red bean value chain (IPMS, 2005).
Previous studies on red bean in Ethiopia have concentrated on agronomic factors (Gidago et al.,
2011; Katungi et al., 2011), on factors affecting adoption of the crop (Ayalew, 2011; Negash,
2007) and on breeding. To date, information on factors influencing the participation of producers
in the red bean market in Ethiopia is lacking. In particular, in HSD, the constraints facing traders
and cooperatives while supplying the produce to the market have not been elucidated.
Understanding farmers’ market participation and trading channels in HSD is important as an
opportunity to increase smallholder farmer incomes.

5
1.3 Purpose and Objectives
The purpose of this study was to assess the factors determining the participation of smallholder
farmers in the red bean market chain in Halaba Special District, Ethiopia. The specific objectives
of the study were:
1. To characterize the red bean market channels in Halaba Special District.
2. To identify the constraints faced by farmers, traders and cooperatives in red bean
marketing in Halaba Special District.
3. To examine the factors that influence market participation decision and the extent of
participation of red bean farmers in Halaba Special District.
1.4 Research Questions
The research questions addressed were:
1. What are the main marketing channels for red bean in Halaba Special District?
2. What are the constraints of farmers, traders, and cooperatives in supplying red bean into
the market in Halaba Special District?
3. What are the factors that influence producers’ market participation and the extent of their
participation along the market chain of red bean in Halaba Special District?
1.5 Justification of the Study
In the past, the efforts in developing agriculture in Ethiopia mainly focused on the supply side of
the sub-sector without giving much attention to the demand side (Aysheshm, 2007). Experience
showed that smallholder farmers could not benefit from increased production of crops in the
absence of markets or demands. Different countries’ governments have learnt from the past
failure that the appropriate way out to the problem of food insecurity is to follow market-oriented
production systems by giving equal emphasis to both supply and demand issues.
Red bean play a central role in economic development and is a key contributor to poverty
reduction in Ethiopia. Because red bean constitute one of the major exportable pulses in
Ethiopia, identifying the factors that influence farmer participation in the market is important for
increasing their income. The results of this study could serve as a major input in the formulation
of appropriate marketing policies and strategies in HSD by identifying interventions that improve

6
efficiency of the marketing system. Furthermore, the findings of the study will be used as a
reference material by policy makers, NGOs (non-government organizations), red bean producers,
other market intermediaries along the value chain and serve as a benchmark for further related
studies. The study fills the gap in existing literature on factors affecting smallholder red bean
farmers’ market participation, their extent of participation, constraints of producers, traders,
cooperatives, and available marketing channels on red bean market chain at HSD.
1.6 Organization of the Thesis
This thesis is organized into five chapters. Chapter 1 deals with the introductory part, which
constitutes the background, problem statement, objectives, research questions, as well as the
justification of the study. Chapter 2 presents the literature review. Chapters 3 and 4 deal with the
methodology, and results and discussion, respectively. The final section summarizes the findings
of the study with some policy recommendations.
7
CHAPTER 2
LITERATURE REVIEW
2.1 Economic Importance of Common Beans
Common beans are the most important food legumes for direct consumption in the world.
Farmers grow common beans, which are consumed as dry bean, and snap beans (the green pods
are consumed as a vegetable). Common bean’s demand is increasing in the world because about
two-thirds of the world’s population relies on a largely vegetarian diet. Furthermore, production
and export of common beans are increasing due to new markets created in the developed world,
by the increasing number of vegetarian consumers (Ferris and Kaganzi, 2008; Wortmann, 2006;
Rubatzky and Yamaguchi, 1997). The crop is an important source of protein and income for
smallholder farmers. The residue of the crop is used as animal feed.
2.2 Common Beans Production and Marketing in the World
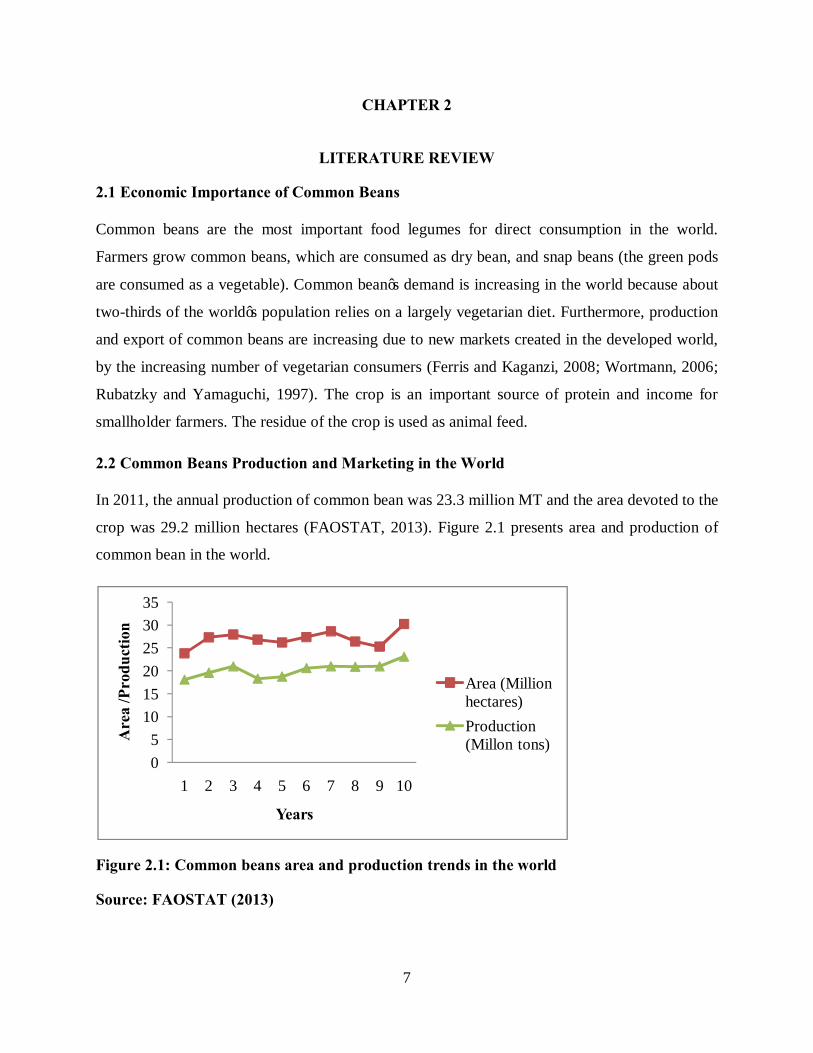
In 2011, the annual production of common bean was 23.3 million MT and the area devoted to the
crop was 29.2 million hectares (FAOSTAT, 2013). Figure 2.1 presents area and production of
common bean in the world.
Figure 2.1: Common beans area and production trends in the world
Source: FAOSTAT (2013)
05
101520253035
1 2 3 4 5 6 7 8 9 10
Are
a /P
rodu
ctio
n
Years
Area (Million hectares)Production (Millon tons)

8
Following increased demand for common beans, its production and area allocation is increasing
in the world. The world’s major common bean producers are India, Brazil, Myanmar, and China.
In 2010, China was the leading exporter of common beans followed by Myanmar. In Africa,
Kenya, Ethiopia, Uganda, and Cameron are the largest producers of common bean in their
respective order, and Ethiopia is the leading exporter in Africa (FAOSTAT, 2013).
2.3 Common Beans Production and Marketing in Ethiopia
Globally, in 2010 Ethiopia ranked the eleventh producer of common beans and eighth in amount
exported in the world. The country is the third largest producer and leading exporter of common
beans in Africa (FAOSTAT, 2013). Common bean is one of the crops whose production and
marketing could be a potential pathway for improving rural livelihoods. Figure 1.3 below
presents area and production trends of common beans in Ethiopia.
Figure 2.2: Trends of total area and production of common beans in Ethiopia
Source: FAOSTAT (2013)
Ethiopia produced 0.7 million MT of common bean in 2004 and in 2010 the country’s average
production increased to 0.36 million MT annually. The common bean is used as a source of
foreign currency, food crop, means of employment, source of cash, balance of payments and
plays great role in the country’s farming system. An increasing trend of common bean
production has been observed since 2006. This could probably be attributed to a number of
reasons including increased use of common bean as a substitute for long maturing crops and poor
00.050.1
0.150.2
0.250.3
0.350.4
2004 2005 2006 2007 2008 2009 2010
Are
a of
pro
duct
ion
/Pro
duct
ion
Years
Area of production (Million ha)Production (Million tons)
9
distribution and unreliability of rainfall. Moreover, common beans are important crops in various
intercropping systems in Ethiopia (Birachi et al., 2011; Bindera, 2009; Negash, 2007).
Furthermore, the Ethiopian government removed export restrictions with the aim of stimulating
domestic production to meet increasing international demand for common beans (MARD, 2011).
Additionally, investments by big companies from Italy, United Kingdom, and Turkey indicate
promising market prospects (Legese et al., 2006).
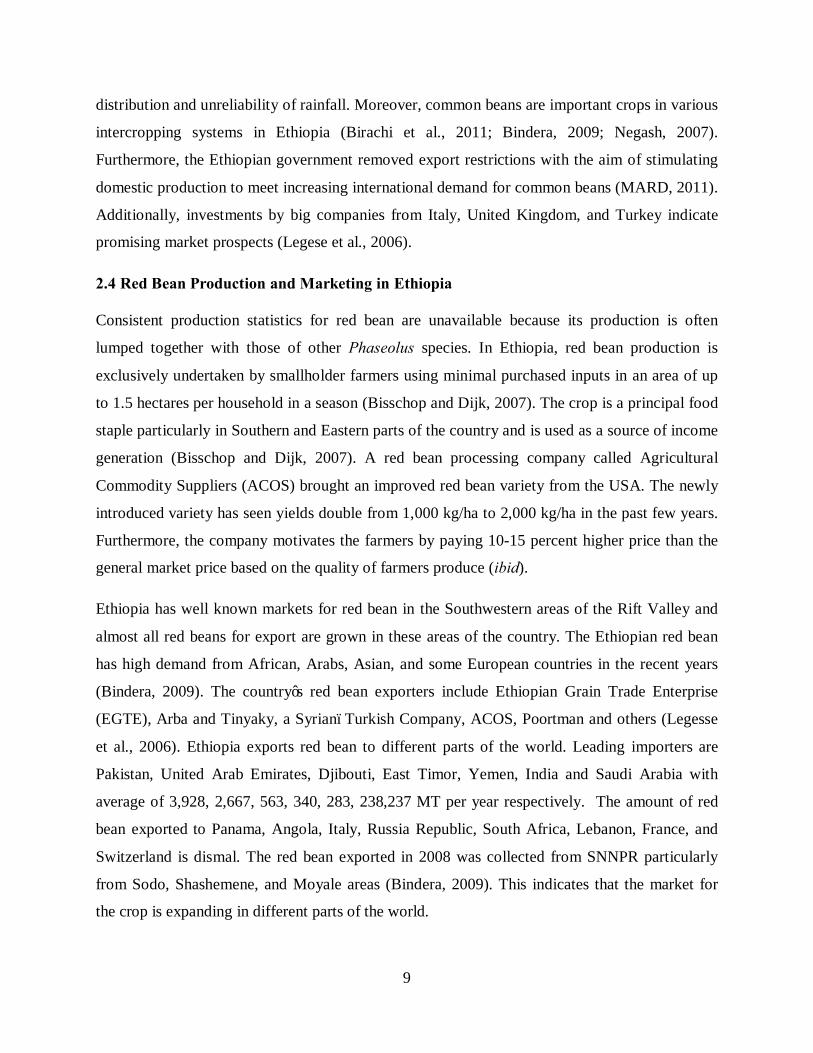
2.4 Red Bean Production and Marketing in Ethiopia
Consistent production statistics for red bean are unavailable because its production is often
lumped together with those of other Phaseolus species. In Ethiopia, red bean production is
exclusively undertaken by smallholder farmers using minimal purchased inputs in an area of up
to 1.5 hectares per household in a season (Bisschop and Dijk, 2007). The crop is a principal food
staple particularly in Southern and Eastern parts of the country and is used as a source of income
generation (Bisschop and Dijk, 2007). A red bean processing company called Agricultural
Commodity Suppliers (ACOS) brought an improved red bean variety from the USA. The newly
introduced variety has seen yields double from 1,000 kg/ha to 2,000 kg/ha in the past few years.
Furthermore, the company motivates the farmers by paying 10-15 percent higher price than the
general market price based on the quality of farmers produce (ibid).
Ethiopia has well known markets for red bean in the Southwestern areas of the Rift Valley and
almost all red beans for export are grown in these areas of the country. The Ethiopian red bean
has high demand from African, Arabs, Asian, and some European countries in the recent years
(Bindera, 2009). The country’s red bean exporters include Ethiopian Grain Trade Enterprise
(EGTE), Arba and Tinyaky, a Syrian–Turkish Company, ACOS, Poortman and others (Legesse
et al., 2006). Ethiopia exports red bean to different parts of the world. Leading importers are
Pakistan, United Arab Emirates, Djibouti, East Timor, Yemen, India and Saudi Arabia with
average of 3,928, 2,667, 563, 340, 283, 238,237 MT per year respectively. The amount of red
bean exported to Panama, Angola, Italy, Russia Republic, South Africa, Lebanon, France, and
Switzerland is dismal. The red bean exported in 2008 was collected from SNNPR particularly
from Sodo, Shashemene, and Moyale areas (Bindera, 2009). This indicates that the market for
the crop is expanding in different parts of the world.

10
There are few studies done in Ethiopia on beans; most of them focus on adoption, agronomic
aspects, breeding, and disease resistance aimed at increasing yield. A study conducted at Areka
Agricultural Research Center, in Ethiopia on the response of haricot beans to phosphorus
application revealed that phosphorus application significantly and positively influenced the grain
yield of haricot beans (Gidago et al., 2011). Ayalew (2011) found that attending field days,
demonstration, access to credit and membership in seed production groups had positive and
significant effect on adoption and intensity of adoption on haricot bean in Ethiopia.
Katungi et al. (2011) assessed common beans farmers’ access to market and its effect on
intensification and productivity and fertilizer application in Ethiopia. The objective of the study
was to evaluate the effect of market access and factors on the adoption of land-enhancing
technologies such as fertilizer and high yielding varieties on the productivity of common beans.
The study used Heckman two-stage econometric procedures to analyze factors that affect
producers’ input market participation. The study found that access to extension service, access to
credit services, farm size, adoption of improved varieties, and nearness to urban centers
significantly and positively market participation. The number of dependents per household had a
negative but significant effect on common beans farmers’ participation in the input market. The
study concluded that increasing access to credit and information, and reducing the risks and
uncertainties of using fertilizer through insurance could increase farmers’ fertilizer use. The
study was on the input market side, indicating farmers’ output market participation was not
studied. The current study addresses the factors that affect red bean farmers’ market participation
decision after production to fill the gap left by the previous study.
Ferris and Kangaze (2008) evaluated marketing opportunities for haricot beans in Ethiopia using
descriptive statistics. The study focused on evaluating market opportunities and laxity in
exploiting the existing opportunities. The study found a strong potential for growth in the
regional markets for Ethiopian red bean farmers to supply bean deficit countries such as Kenya
and other export markets overseas destination. Additionally, the study found that there was poor
investment on bean and that price volatility, weak trade associations, and weak market
information delivery, lack of finance, and poor infrastructure. These were identified to be the
major challenges on the red bean value chain. The study concluded that any intervention that
support increased production and marketing of this crop is likely to provide direct benefits to the

11
more vulnerable groups in the country. Ferris and Kangaze (2008) applied associative
relationship analysis whereas the current study uses causal (regression) analysis to assess which
factors affect producers’ market participation and to what extent those factors influence the
intensity of red bean producers’ participation in Ethiopia.
2.5 Red Bean Production and Market in Halaba Special District
HSD is one of highest red bean producer in SNNPR (IPMS, 2005). The annual average
production of the district was 34,170 MT between 2009 and 2011 while the average land
allocation in the same period was 19,262 ha. Furthermore, red bean production covers one third
of the total cultivated land area during the short rainy seasons. As shown in Figure 1.1,
production in the district was increased by about 70 percent between 2008 and 2011. The
increase in production is attributed to producers’ income generation from the crop and home
consumption (HSDMD, 2012). The crop is preferred by many farmers in the district because of
its suitability in intercropping with maize and other crops. In addition, its drought and disease
resistance compared to white bean, the relatively low cost of production, use of its residue as
animal feed, and its fast maturity (Bisschop and Dijk, 2007). Out of the 79 Kebele
administrations (KA) in HSD, 45 are well known producers of the crop (IPMS, 2005).
Negash (2007) assessed the determinants of adoption of improved haricot bean production
package in HSD. A Tobit model was used to identify factors affecting farmers’ adoption and
intensity of adoption of improved technology package on haricot bean. The study found that
access to extension service, credit, and market information had positive and significant influence
on adoption and intensity of adoption of the crop. It was concluded that development
interventions should be done to improve institutional support to improve adoption of the crop.
Fair attempt was done with regard to adoption of the crop in the district; however, post-
production issues on the crop were silent. The current study addressed post-production issues
like factors affecting red bean farmers’ market participation decision and extent of participation
and challenges of traders in red bean market. The previous study was used in identifying the gap
and the type of red beans adopted in the district.

12
2.6. Concept and Analytical Methods in Market Participation
Market participation is both a cause and a consequence of economic development (Reardon and
Timmer, 2005). It enhances the links between the input and output sides of agricultural markets
(Gebremedhin and Jaleta, 2010). Farmers with low market participation have low agricultural
productivity and they are also the poorest (Mathenge et al., 2010). Higher market participation
can drive productivity by providing incentives, information, and cash for purchasing inputs.
Higher productivity could drive market participation because farmers with high productivity
have surplus to participate in the market, ceteris paribus (Barrett, 2008; Rios et al., 2008).
Market renders producers the prospect to specialize based on their comparative advantage and
thus producers enjoy welfare gain from trade (Reardon and Timmer, 2005). According to the
theory of trade households participating in markets by selling surplus of their produce on a
comparative advantage base can benefit from direct welfare gains as well as opportunities that
emerge from economies of large-scale production (Barrett, 2008). Agricultural market
participation leads farmers from subsistence production to market oriented production, that
further increase their market participation (Haddad and Bouis, 1990).
Most empirical studies evaluating market participation and the extent of participation use the
Heckman’s (1979) sample selection model (e.g., Mussema and Dawit, 2012; Katungi et al.,
2011; Alene et al., 2008,) while some researchers used the more restrictive Tobit model to
analyze market participation and extent of participation (e.g., Holloway et al., 2000). In cases
where farmers have two types of decisions to make, the Heckman two-step model is more
appropriate (Heckman, 1979). This is because Heckman two-step model deals with a sample
selection bias by computing lambda (λ), or selection term, from the participation equation and
including it as an explanatory variable to correct for self-selection in the second stage regression.
The selection bias is viewed as an omitted variable and corrected by this procedure (Wooldridge,
2002). Due to its ability to correct for self-selection bias, the Heckman model was considered for
use in this study.
2.7 Importance of Market Participation for Rural Households Economic Development
The significance of participating in product markets is based on the premise that incomes and,
thus livelihoods of smallholder producers are likely to improve if they have better access to

13
markets for their produce (World Bank, 2008). Markets and improved market access for poor
rural households are a precondition for increasing agriculture-based economic development and
increasing rural household incomes (World Bank, 2008). Thus, commercialization is enhanced
with the establishment of efficient and well-functioning markets because they lower transaction
costs, minimize risk, and allow uniform information flow to all actors in a commodity value
chain. Hence, linking smallholder farmers to markets is vital for sustainable development of the
agricultural sector in agriculture-based economies (ibid).
Market participation is a major pathway for rural people in assuring better income and improving
their food security. Improving access to markets has paramount importance in increasing
smallholders’ market participation and the extent of their participation, ceteris paribus (World
Bank, 2008; Jayne et al., 2005; Key et al., 2000). Avoiding factors that limit access to markets by
smallholder producers will enhance market participation. For example, improving infrastructure
will enhance market access primarily limited by high transaction costs created by poor
infrastructure. Improving infrastructure will increase smallholders’ market participation and the
extent of their participation (ibid).
2.8 Empirical Studies on Factors Affecting Market Participation Decision and Extent of Participation in Agricultural Product Markets
Lapar et al. (2002) analyzed policy options promoting market participation of smallholder
livestock producers in Philippines with the objective of designing appropriate policies to effect
benefits to smallholders. The study used a Heckman two-stage model. The results revealed that,
number of animals, technology, availability of funds, availability of alternative occupations,
number of household members, and extension service significantly affected livestock keepers’
market participation. In addition, market search, making contract, and price negotiation affected
producers’ market participation. Moreover, except for the level of formal education, all factors
that affected market participation also affected the extent of market participation. In conclusion,
improving extension visitation appeared important in precipitating market participation and
appeared to be the most appropriate policy option. This study focused on red bean because
factors that affect livestock farmers’ market participation decision are likely to be different from
factors that affect red bean farmers’ market participation decision; beans are of shorter terms
than livestock in general.

14
Mathenge et al. (2010) examined the factors influencing market participation of crop producers
and their impacts on income and poverty among the poor and marginalized groups in Kenya. The
objective of study was examining most significant constraints to market participation for the
different social groups. The study used a Heckman two-stage model, and modeled participation
in input and output markets. The study found that female-headed households had higher bean
market participation than male-headed households. Land size, membership to a group; distance
to a tarmac road had positive and significant effects on bean market participation, while price
had a negative but significant effect. The study found that per capita land size had positive and
significant effect while crop price had negative and significant effect on extent of beans market
participation. Mathenge et al.’s study contributes to current one in identifying factors that affect
output market participation and specification of the model. The main difference is that while
Mathenge et al.’s study focused only on poor and marginalized farmers, the current study
considers all farmers producing red bean as no producer preference reported so far.
Masuku et al. (2001) assessed the factors influencing the decision to sell maize and choice of
marketing chain by smallholder farmers in Swaziland using a logistic regression. The study
found that the decision to participate in the maize market was influenced by off-farm income
activities, past experience, access to information, participation in agricultural schemes, family
members without education, and farm size. The choice of the maize marketing chain was
influenced by transportation costs and farm size. Accordingly, efforts to enable farmers to easily
access agricultural information in a manner that they can understand would be among the other
factors that needed improvement. In addition, the study recommended that policies that would
enable farmers to organize themselves and their marketing activities to reduce transportation
costs and increase the area under cultivation be designed to ensure efficient utilization of the
formal markets and subsequently improve farmers’ income. Masuku’s study concentrated on
market participation decision only whereas the current study stretched its objective to encompass
market participation decision and extent of their participation. The previous study was benefited
the current study in identifying factors affecting market participation decision.
Gebremedhin and Hoekstra (2007) studied cereal marketing and household market participation
in Ethiopia, with respect to teff, wheat, and rice. The study aimed at analyzing the market
participation of farm households, market actors, market channels, and determinants of household

15
market participation for these crops. Descriptive statistics and regression analysis were used. The
study found that smallholder farmers’ participation in agricultural marketing had a significant
role in improving the use of agricultural inputs and enhancing productivity apart from increasing
production. The result of the study revealed that important market places for buyers are either
those located at the district urban centre or in the peasant associations within the district. This
implied that markets outside the districts were not important for producers and the important
selling channels were wholesalers and urban collectors for the crops. The study is relevant to the
current one in developing appropriate method of characterizing marketing channels and
identifying important buyers for producers output in the markets.
Mussema and Dawit (2012) evaluated the market chain of red pepper at HSD and Silti zone of
Ethiopia. The objective of the study was to identify factors affecting volume of pepper supply.
The study used a Heckman two-stage model to assess the factors that affect red pepper
producers’ output market participation. The study found that the quantity of red pepper produced
and extension service had positive and significant influence on market participation, while yield
of cereals had negative and significant effect on market participation. The study also found that
livestock numbers and non-farm income negatively and significantly influence the amount of red
pepper supplied to the market. It was concluded that policies that would improve pepper
production capacity by identifying new technologies and create stable demand for surplus
production would enhance farmers’ decisions on marketable surplus. As a result, policy should
be designed on integrated farming system to minimize income risk and to improve the livelihood
of the farmers. Attempt was made in analyzing red pepper market participation and extent of
participation. However, the results obtained for red peppers cannot be generalized to red bean
because pepper is produced for commercial purpose only whereas red bean production is for both
commercial and household subsistence. That is, the production drivers are not the same. The red
bean production in Ethiopia is already on record to be increasing. The previous study was used in
specifying the model.
2.9 Summary
Reviews of literature outlining market participation of smallholder farmers have been presented.
Ethiopia’s production and export position at global level was highlighted. The prominence of
bean in the livelihoods of the smallholders in the study area and on the country’s export earnings

16
has been reviewed. The different types of common bean like red, mottled, white, and black bean
have been explored. In the country, most of the past studies on smallholders’ market
participation were focused on livestock and cereal crops. Those conducted on bean were focused
on adoption, agronomic improvements, and how markets accessibility affects smallholders input
market participation. Studies that have been conducted on common bean market opportunity in
Ethiopia identified different opportunities of local as well as international markets. No past study
has been undertaken on the factors influencing red bean farmers’ market participation in
Ethiopia. In most of the past market participation studies, a Heckman two-step model was
applied mainly to correct for self-selection bias. Generally, there is scanty information on the
factors influencing farmers’ participation in the marketing of red bean in HSD of Ethiopia and
hence this study.

17
CHAPTER 3
METHODOLOGY 3.1 Theoretical Framework
In order to analyze market participation of smallholders in red bean market in HSD of Ethiopia,
an agricultural household model framework was applied. According to Singh et al. (1986) and
Key et al. (2000), the household model assumes that a household maximizes utility subject to a
set of constraints. Following Singh et al. (1986) and assuming absence of transactions costs, the
household's problem is to maximize the utility function:
1. Maximize U�C, Z�� the utility function …………………………………….(3.1)
Subject to:
2. ∑ P�� m�+ T = 0�
��� the cash constraint ……………………………………(3.2)
3. q�− x�+ A�− m�− c�= 0 the resource balance (where �= 1,….N)……………...(3.3)
4. G�q, x; z��= 0 the production technology ………………………………………(3.4)
5. c�q�x� ≥ 0 the non-negativity condition ……………………………………(3.5)
where, C is consumption, Zu is exogenous shifter of the utility function, pim is the market price of
good i, mi is quantity that the household decides to sell in the market (positive for sell and
negative for purchase), and T represents exogenous transfers and other incomes. On the other
hand, qi represents how much to produce, xi how much input to use, Ai the endowment in good i,
ci how much of good i to consume, � the production technology, and z� exogenous shifters of
the production function.
The cash constraint equation (3.2) states that expenditures on all purchases must not exceed
revenues from all sales and transfers. The resource balance equation (3.3) states that, for each of
the goods, the sum of the amount consumed, used as input, and sold, is equal to what is
produced and bought plus the endowment of the good. The production technology equation (3.4)
relates inputs (e.g., land, labor, etc) to outputs.
According to Jagwe (2011) and Key et al. (2000), incorporating proportional transaction costs
and fixed transaction costs into the household cash constraint yields:

18
∑ [(P���
��� − t���(z�
�))δ�� − �p�
� + t��� �z�
��)δ���]m�− t��
��z���δ�
� − t����z�
��δ�� + T = 0 … (3.6)
where the household pays the fixed cost t�is
if it sells good and payst�ib if it buys goodi. To solve
the household problem, a Lagrange expression is derived and first order conditions for the
consumption goods obtained from equations (3.1) to (3.6).
The decision price, pi, is thus defined as:
p�= �
p�� − t��
� ifm�> 0forasellinghouseholdp�
� + t��� ifm�< 0forabuyinghousehold
p�̴ = μ�
λifm = 0foraself − suf�icienthousehold
………………………… (3.7)
The supply curves for the selling, buying, and non-participant households in the presence of
transaction costs are given by:
�q� = q�p� − t�
� − t��, z��sellers
q� = q�p� + t�� + t�
�, z��buyersq� = q�p, z��non − participants
…………………………………………………… (3.8)
For empirical analysis, the current study focused on the selling households. Accordingly the
linear expression of equation (3.8) was assumed for the supply functions and the proportional
transaction costs as follows (Jagwe, 2011):
q�p, z��= pβ + z�β�andt�� = − z�
��wheret�
� = − z��β�
� …………………………… (3.9)
This leads to linear expressions for the supply curve of sellers as follows:
q�∗ = p� β� + z��β�
� + z�β�……………………………………………………………. (3.10)
where, zt are exogenous characteristics that affect transaction costs when selling; zq are
production shifters; zc, are consumption shifters, and ���, αq
s ,andαcs are their coefficients,
respectively. The econometric specification of market participation as a seller can thus be
obtained by adding an error term to equation (3.11) as follows:
q�∗ = p� β� + z��β�
� + z�β� + μ ……………………………………………………… (3.11)
19
with a linear production threshold, q ̱�, expressed as:
q ̱� = z�
�α�� + z�α�
� + z�α�� ……………………………………………………………… (3.12)
where qs∗is the latent supply if a household is a seller and it is observed when it is higher than the
threshold for market participation, q ̱�. Thus, if qs∗ > q̱s then the household is participating in the
market as a seller. The expression in equation (3.13), therefore, allows for the identification of
parameters βi using probit analysis. The factors affecting the decision of smallholder farmers to
participate in the red bean market can be determined on the basis that (Jagwe, 2011):
q�∗ > q ̱� ≡ Prob�Y = 1�= X�β�+ μ ……………………………………………….. (3.13)
The estimation of coefficients in equation (3.12), β� , β��, β�, captures the intensity of
participation among the smallholder farmers.
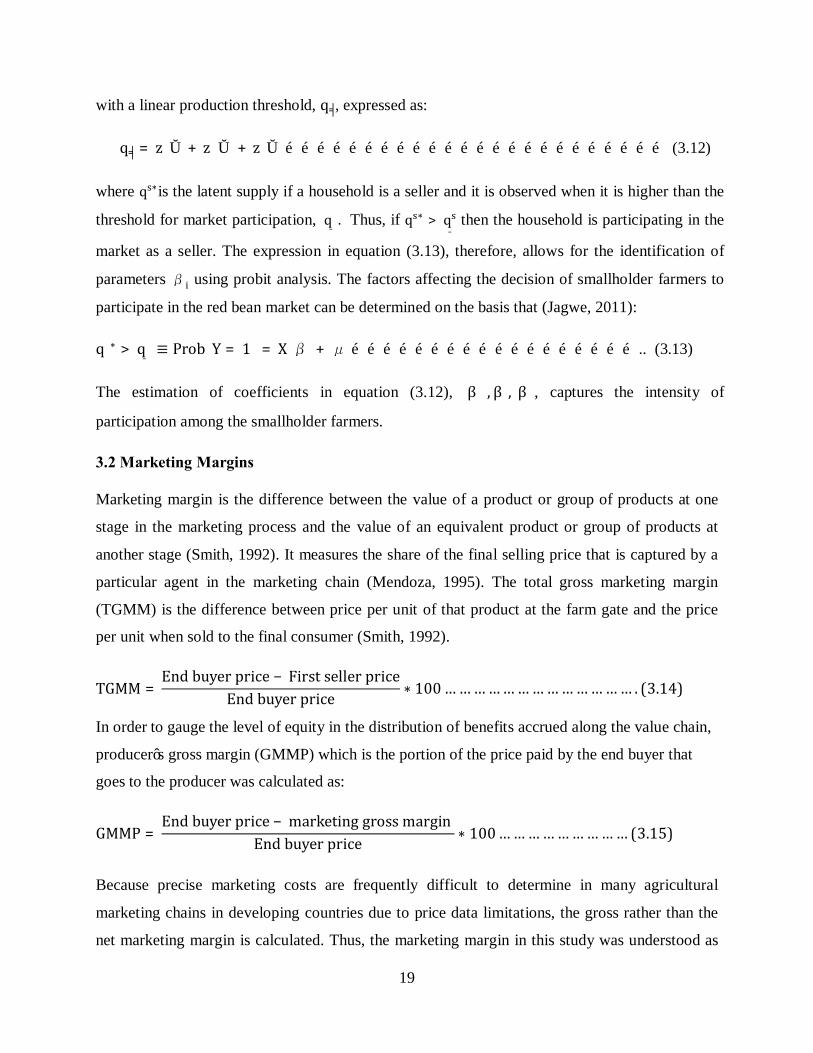
3.2 Marketing Margins
Marketing margin is the difference between the value of a product or group of products at one
stage in the marketing process and the value of an equivalent product or group of products at
another stage (Smith, 1992). It measures the share of the final selling price that is captured by a
particular agent in the marketing chain (Mendoza, 1995). The total gross marketing margin
(TGMM) is the difference between price per unit of that product at the farm gate and the price
per unit when sold to the final consumer (Smith, 1992).
TGMM =Endbuyerprice − Firstsellerprice
Endbuyerprice ∗ 100 … … … … … … … … … … … … … . (3.14)
In order to gauge the level of equity in the distribution of benefits accrued along the value chain,
producer’s gross margin (GMMP) which is the portion of the price paid by the end buyer that
goes to the producer was calculated as:
GMMP =Endbuyerprice − marketinggrossmargin
Endbuyerprice ∗ 100 … … … … … … … … … (3.15)
Because precise marketing costs are frequently difficult to determine in many agricultural
marketing chains in developing countries due to price data limitations, the gross rather than the
net marketing margin is calculated. Thus, the marketing margin in this study was understood as

20
gross marketing margin (Scott, 1995). The gross marketing margins were used to compare the
benefits farmers got from each red bean marketing channel and the higher value indicated the
higher gross returns to the farmers.
3.3 Empirical Model
In most empirical studies on market participation and extent of participation, the Heckman two-
step model has been used. It is also possible to use a Tobit model that accounts for the clustering
of zeros due to non-participation. However, a major limitation with the Tobit model is that it
assumes that the same set of parameters and variables determine both the probability of market
participation and the extent of participation (Blaylock and Blisard, 1993). The Heckman two-step
model relaxes these assumptions by allowing different mechanisms to verify the discrete
probability of participation and the level of participation (Wooldridge, 2002). The model allows
for separation between the initial decision to participate (y>0 vs y=0) and the decision of how
much to participate (y is quantity of red bean sold in this case) given (y>0) (ibid). In this case, it
is assumed that a different set of explanatory variables influences participation and the extent of
participation differently (Mathenge et al., 2010). For these reasons, this study used the Heckman
two-step model to examine the factors that influence red bean farmers’ market participation and
extent of that participation in Halaba Special District.
In the Heckman two-step model, the decision to participate in the market can be seen as a
sequential two-step decision-making process due to the influence of various types of transaction
costs and other constraints associated with production on household market participation
decisions (Heckman, 1979). The empirical model used to assess the factors influencing
households’ decision to enter into the market and their level of participation in the market given
their entry into the market was specified as follows:
RBMKPD = α0 + α1(GND)i + α2(AGH)i + α3(FSZE)i + α4(EDLV)i + α5(OFFI)i + α6(OWNT)i +
α7(FRSZE)i + α8(AMRB)i + α9(DSMK)i + α10(PRRB)i + α11(NOEX)i + α12(MINFO)i+
α13(ACICR)i + α14(MCOO)i + α15(AQST)i …………………………………………….. (3.16)
EXRBMP = β0 + β1(GND)i + β2(AGH)i + β3(FSZE)i + β4(EDLV)i + β5(OFFI)i + β6(OWNT)i β7(FRSZE)i + β8(AMRB)i + β9(DSMK)i + β10(PRRB)i + β11(NOEX)i + β12(MINFO)i + β13(ACICR)i + β14(MCOO)i + β15(AQST)i ……………………………………………...(3.17)

21
Table 3.1:Description of variables in the empirical model
Source: Author (2013)
Variable Description Unit of measurement Exp. Sign
RBMKPD Red bean market participation decision Dummy (1=participate, 0=otherwise) -
EXRBMP Red bean supplied to the market in 2012 Kilogram -
Independent Variables
GND Gender Dummy (1= male, 0= otherwise) (+)
AGH Age of household head Year (+/-)
FSZE Family size Number of people in the house in 2012 (+/-)
EDLV Education status Number of years in School (+/-)
OFFI Off farm income Birr (ETB) (-/+)
OWNT Ownership of means of transportation Dummy (1= yes, 0= otherwise ) (+)
FRSZE Size of farm allocated to red bean Hectares (Ha) (+)
AMRB Quantity of red bean produced in the 2012 Kilogram (+)
DSMK Distance to the nearest market Kilometers (-)
PRB Average price of red bean in the year 2012 Birr per Kg (ETB) (+)
NOEX Number of extension visit in year 2012 Number of days (+)
MINFO Access to market information Dummy (1=access, 0= otherwise) (+)
ACICR Access to informal credit Dummy(1 =access, 0 = otherwise) (+)
MCOO Membership in a cooperative Dummy (1= yes, 0= otherwise) (+)
AQST Awareness about quality standards Dummy (1=aware, 0=otherwise) (+)
22
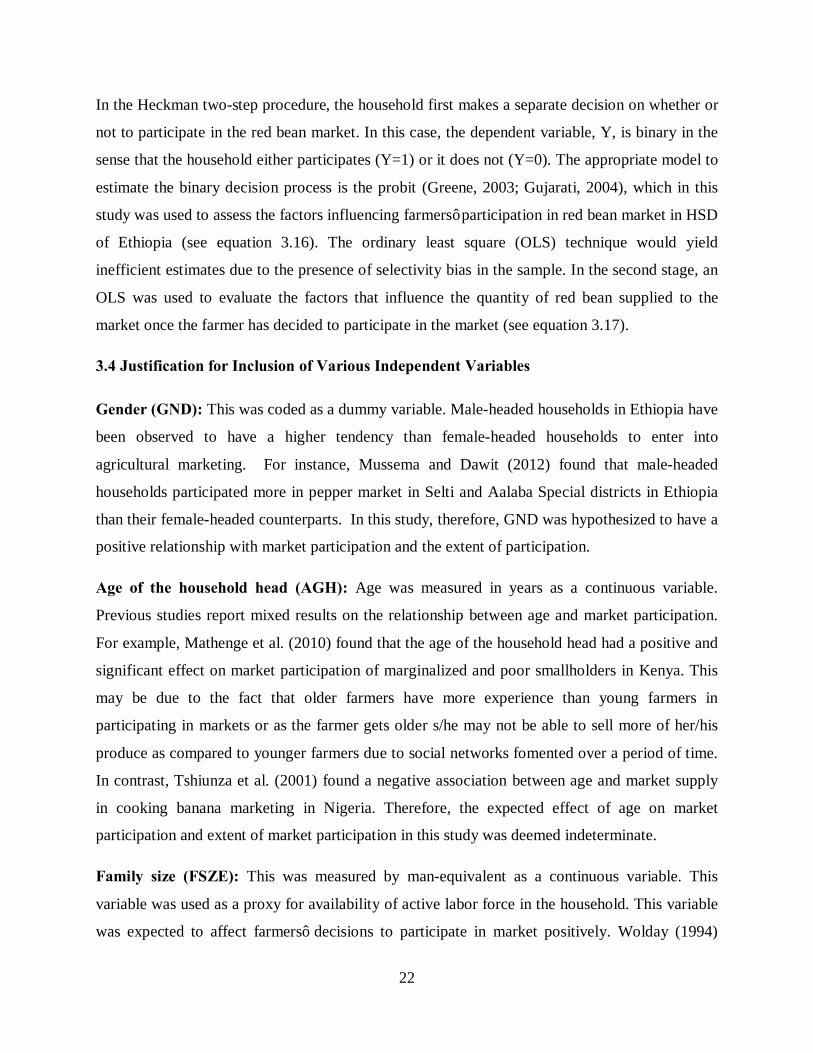
In the Heckman two-step procedure, the household first makes a separate decision on whether or
not to participate in the red bean market. In this case, the dependent variable, Y, is binary in the
sense that the household either participates (Y=1) or it does not (Y=0). The appropriate model to
estimate the binary decision process is the probit (Greene, 2003; Gujarati, 2004), which in this
study was used to assess the factors influencing farmers’ participation in red bean market in HSD
of Ethiopia (see equation 3.16). The ordinary least square (OLS) technique would yield
inefficient estimates due to the presence of selectivity bias in the sample. In the second stage, an
OLS was used to evaluate the factors that influence the quantity of red bean supplied to the
market once the farmer has decided to participate in the market (see equation 3.17).
3.4 Justification for Inclusion of Various Independent Variables
Gender (GND): This was coded as a dummy variable. Male-headed households in Ethiopia have
been observed to have a higher tendency than female-headed households to enter into
agricultural marketing. For instance, Mussema and Dawit (2012) found that male-headed
households participated more in pepper market in Selti and Aalaba Special districts in Ethiopia
than their female-headed counterparts. In this study, therefore, GND was hypothesized to have a
positive relationship with market participation and the extent of participation.
Age of the household head (AGH): Age was measured in years as a continuous variable.
Previous studies report mixed results on the relationship between age and market participation.
For example, Mathenge et al. (2010) found that the age of the household head had a positive and
significant effect on market participation of marginalized and poor smallholders in Kenya. This
may be due to the fact that older farmers have more experience than young farmers in
participating in markets or as the farmer gets older s/he may not be able to sell more of her/his
produce as compared to younger farmers due to social networks fomented over a period of time.
In contrast, Tshiunza et al. (2001) found a negative association between age and market supply
in cooking banana marketing in Nigeria. Therefore, the expected effect of age on market
participation and extent of market participation in this study was deemed indeterminate.
Family size (FSZE): This was measured by man-equivalent as a continuous variable. This
variable was used as a proxy for availability of active labor force in the household. This variable
was expected to affect farmers’ decisions to participate in market positively. Wolday (1994)

23
found that household size had a positive and significant effect on quantity of teff marketed.
However, Singh and Rai (1998) found the marketed surplus of buffalo milk in Haryana to be
negatively affected by family size. In this study therefore, family size was expected to have an
indeterminate relationship with market participation and the extent of participation in the red
bean market in HSD.
Education level (EDLV): This was measured as a continuous variable denoting the number of
years of formal schooling of the household head at the time of the survey. Household heads with
more years of formal education were expected to have a higher ability to accept new ideas and
innovations, and therefore would be more willing to produce and supply red bean for sale. Thus,
education was hypothesized positively to influence market participation and the extent of
participation. Holloway et al. (2000) found that education had a significant and positive effect
on the quantity of milk marketed in Ethiopian highlands. Gani and Adeoti (2011) found that in
Nigeria, farmers’ market participation decision was positively influenced by the level of
education. However, Lapar et al. (2002) found that formal education of the household head was
negatively associated with market participation. They explained that the phenomena might have
been caused by the risk aversion nature of educated household heads that diverted their attention
to other business. In this study, therefore, the household heads’ years of formal education was
hypothesized to have an indeterminate effect on their market participation decision as well as
extent of participation.
Off-farm income (OFFI): Off-farm income was measured in ETB as a continuous variable that
shows the amount of income obtained by the household head from non-farm activities. This
income may strengthen the farming activity or make the household head reluctant to produce red
bean to generate money from beans. Getting income from non-farm activities was expected to
have either a positive or a negative relation with market participation and marketable surplus.
This expectation was supported by Martey et al. (2012) who found that an increase in off-farm
income reduced maize market participation whereas an increase in off-farm income increased the
extent of cassava market participation in Ghana.
Ownership of means of transport (OWNT): This was coded as a dummy variable that referred
to the ownership of transportation means with one, and zero otherwise. Households with own
transportation means may be engaged in more of red bean production that increases the farmers’

24
volume of red bean supply. So, in this study, ownership of own transportation means was
expected to influence red bean market participation and volume positively. Masuku et al. (2001)
found that ownership of transportation means significantly enhanced probability of market
participation of households in Swaziland.
Farm allocated to red bean (FRSZE): This was measured in hectares as a continuous variable
indicating the total size of land allocated to red bean in 2012. Total farm size allocated to red
bean was expected positively to influence the quantity of red bean marketed and therefore the
probability of market participation. Mussema and Dawit (2012) found that as land allocated to
red pepper increased in Aalaba Special District the amount of pepper marketed also increased.
Martey et al. (2012) also found that maize and cassava market participation increased as farm
size increased. This was because increase in farm size provides opportunity to increase surplus
production, which is critical in improving market participation.
Quantity of red bean produced (AMRB): It was measured in kilograms as a continuous
variable. High red bean production was hypothesized to have a positive effect on market
participation and extent of participation as measured by the quantity of red bean supplied in the
market. Wolday (1994) observed that output of food grains (wheat, teff, and maize) had a
positive effect on the quantity supplied to the market in Ethiopia. In Ghana, Martey et al. (2012)
found that an increase in production of cassava increased farmers’ market participation.
Distance to the nearest markets (DSMK): This variable was measured in kilometers as a
continuous variable. The closer the household is to the red bean market the lower the
transportation cost and the better would be farmers’ market access. Hence, DSMK was
hypothesized to be negatively related to market participation and the extent of participation.
Mussema and Dawit (2012) found that market participation among smallholder pepper producers
in Silte and Aalaba in Ethiopia was negatively associated with distance to the market. Martey et
al. (2012) in Ghana found distance to nearest market to be significantly associated with a lower
level of cassava sales and every additional kilometer reduced the extent of market participation
by 0.4 percent. In Ethiopia, it was reported that smallholder households who were away from
market centers had lower market participation (Gebremedhin and Jaleta, 2012).

25
Price of red bean (PRB): This was a continuous variable measured as the annual average price
of red bean in the Halaba Kulito and Guba markets in 2012. The price was expected to positively
affect market participation and the quantity supplied in the market because when producers are
well paid, this will motivate them increase their market participation and quantity of red bean
sold. Goetz (1992) observed a significant and positive relationship between grain price and the
quantities sold in markets in Sub-Saharan Africa (SSA).
Number of extension visit (NOEX): This variable was coded as a continuous variable to proxy
for number of contacts between farmers with public extension workers. Farmers who have
contact with extension agents are more likely to have knowledge about production, quality, and
price of inputs and information on markets and output prices of poultry (Zeberga, 2010). It was
observed that number of extension visits by an extension agent had significant and positive effect
on quantity of milk marketed in Ethiopia (Holloway et al. 2000). In this study, therefore, number
of contact with extension workers was expected to have a positive relationship with market
participation decision and the extent of participation.
Access to market information (MINFO): This was coded as a dummy variable and was
expected to influence positively market participation decision. The market information
considered was information on prices, demand, buyers, and other relevant information that could
contribute sellers’ marketing decision. MINFO was expected to influence positively the
participation as well as the extent of participation. Goetz (1992) found that better information
significantly raises the probability of market participation among potential selling households. In
Nigeria, Gani and Adeoti (2011) found that access to market information positively and
significantly influenced farmers’ market participation decision.
Membership to cooperatives (MCOO): This was coded as a dummy variable, which took the
value of one if the farmer was a member of cooperative and zero otherwise. This variable was
expected to affect the household supply of red bean positively. This is because, producers who
are members of cooperatives are likely to get inputs and market information and thus could
participate and supply red bean to the market than non-members. Alene et al. (2008) found that
membership in farmer organizations significantly raised the probability of market participation
for selling households in Kenya. Furthermore, Gani and Adeoti (2011) also found membership to

26
cooperative society positively and significantly affect market participation decision by farmers in
Nigeria. This means, market participation would be motivated if they belonged to a cooperative
society. Cooperative members would likely here access to information and other inputs that
encourage them to participate in the market.
Access to credit (ACIR): This was coded as a dummy variable taking a value of one if the
household had access to credit and zero otherwise. This variable was expected to influence the
marketable supply of red bean producers positively on the assumption that access to credit
improves the financial capacity of red bean producers to buy more improved production inputs,
thereby increasing red bean production, which would also increase market participation. Alene et
al. (2008) found that limited access to credit constrains farmers’ ability to buy agricultural inputs,
which in turn reduces farmers’ market participation in Kenya. Martey et al. (2012) found that
access to credit from both formal and informal sources had a positive effect on smallholder
maize and cassava farmers in Ghana. Negassa (2009) found credit to have a positive relation
with likelihood of selling raw milk in Ethiopia, indicating access to credit increased milk market
participation.
Awareness about quality standards (AQST): This variable was coded as a dummy variable.
For those households who produce and participate in the red bean market, awareness about
quality standards of the crop was expected to increase producers’ market participation and extent
of market participation decision. Govindasamy et al. (1998) found that majority of consumers’
decision to purchase food items was determined by quality of the produce. This indicates that
consumers were willing to pay for quality products. In Ethiopia, one of the bottlenecks of
performance of agricultural marketing was poor quality of agricultural produce (Wolday, 1994).
Somano (2008) found that milk quality was one of the factors that determined traders’ price
setting for milk and butter in Ethiopia. Emergence of quality standards and food safety
requirements constrained farmers in developing countries, those countries exporting fresh food
item face increasing constraint to access markets all over the world (Ruben et al., 2007). In this
study, awareness about red bean quality standards was expected to have positive relation with
market participation decision as well as the extent of participation.

27
3.5 Inverse Mill’s Ratio
The first stage of the Heckman model yields an inverse Mill’s ratio (IMR) which is then used in
the second-stage as an explanatory variable to account for self-selection bias.
The Inverse Mill’s Ratio was estimated as:
�� =�(��)
� − �(��) … … … … … … … … … … … … … … … … … … … … … … … … … … … … … … … (�. ��)
where f(Xβ) is density function and 1-F(Xβ) is the cumulative distribution function.
The Inverse Mill’s Ratio was statistically significant (p = 0.021). This implies that the correction
for selectivity bias was significant. This shows that sample selection bias would have resulted if
the red bean supply equations were estimated without considering the discrete decision to
participate in red bean market.
3.6 Diagnostic Tests
3.6.1 MulticollinearityTest
Multicollinearity is a situation whereby there exist strong linear relationships among independent
variables is more than 75 percent (Gujarati, 2004). If two variables are highly collinear, then this
will result in inefficient estimates. In this study, before running the Heckman two-stage model,
multicollinearity was tested using a Pearson correlation matrix. The results are presented in
Appendix 1. Based on the results presented, there was no evidence of multicollinearity on the
data.
In addition to the Pearson correlation matrix test, multicollinearity was tested using the Variance
Inflation Factor (VIF) method to assess the degree of association among continuous and dummy
explanatory variables. The results are presented in Appendix 2. According to Gujarati (2004),
the Variance Inflation Factor (VIF) is calculated as follows:
������� = �� − ������ …………………………………………………………………… (3.20)
Where, VIF is variance inflation factor

28
Rj2is the multiple correlation coefficients between explanatory variables, the larger the value of
R�� the higher the value of VIF (Xj) causing higher collinearity in variable (Xj).
As a rule of thumb, if the VIF is greater than 10 the variable is said to be highly collinear
(Gujarati, 2004). In this study, there was no evidence of multicollinearity since there was no VIF
value greater than 10 (see Appendix 2).
3.6.2 Heteroskedasticity Test
Heteroscedasticity is a situation in which the variance of the dependent variable varies across the
data or unequal spread or variance, which shows that the conditional variance of Yi increases as
X increases (Gujarati, 2004). The problem associated with heteroscedasticity is that an estimator
is inefficient; (ibid).The Breusch-Pagan statistics are standard tests of the presence of
heteroskedasticity in an OLS regression. The principle is to test for a relationship between the
residuals of the regression and p indicator variables that are hypothesized to be related to the
heteroskedasticity (Baum et al., 2003).These tests are available in Stata, following estimation
with regress, using hettest (Baum et al., 2003). Hence, in this study heteroskedasticity was tested
using Breusch-Pagan statistics. On the courses of testing, first the regression model was run and
then hettest was ordered on stata 12 statistical packages. In this study, there was no evidence of
heteroskedasticity since there was no p-value significant, indicating homoskedasticity (see
Appendix 3).
3.6.3 Goodness-of-Fit Test
The goodness-of-fit of the models were assessed using pseudo R-squared and probability of
model joint significance value for probit model and probability of joint significance and adjusted
R-squared values for OLS model (Madala, 1983). Pseudo R-squared is calculated and the
obtained values indicated that the independent variables included in the regression explain
significant proportion of the variations in the red bean farmers’ likelihood to participate in the
market. The pseudo R-square, value ranges from zero to one with higher values indicating a
good fit of the model (Maddala (1983). In this study, the R-square value is 66 percent indicating
the fitness of the model. When probability of joint significance of the model is significant, then

29
this indicates that the independent variables are explained the dependent variable, indicating
fitness of the model (Appendix, 9).
3.7 Study Area
Halaba Special District is found in Southern Nations, Nationalities and People’s Region
(SNNPR), located 315 km from Addis Ababa and 90 km from regional capital, Hawasa, on the
main road to Arbaminch (Figure 3.1). The district has 79 rural Kebele Administrative (KA) and
five urban KA, and Kulito is the capital. The district is called “special” because it has a special
status where the administration directly reports to the regional state. The latitude and longitude
of study area is 7o19’12”N and 38o4’47’’E respectively (JICA, 2012; IPMS, 2005). The District
is located east of Kembata Tembaro zone, west of Oromia region, North, and Southeast of
Hadiya zone and South East of Silte zone (IPMS, 2005).
The altitude ranges from 1,554 to 2,149 Meters Above Sea Level (M.A.S.L), but most of it is
about 1,800 M.A.S.L (IPMS, 2005). Except for a few hills; the district has agriculturally suitable
land in terms of topography. Despite recurrent drought, flooding has also been a major problem
in the area. Rainfall has been a major limiting factor in agricultural production in the area. As a
result, it is among the districts in SNNPR where drought is observed recurrently affecting many
households. The annual rainfall varies from 857 to 1,085 millimeters; the annual mean
temperature also varies from 17oC to 20oC. The district receives a bimodal rainfall where short
rains occur between March and April while long rains occur from July to September. Both
seasons experience erratic rainfall such that most of the time crops fail due to uneven distribution
of rainfall over the growing period. The total area of the district is 64,116.25 hectares (ha) of
which 48,337 ha (75 percent) are considered suitable for agriculture (JICA, 2012).
Halaba Special District has two major farming systems: (i) teff/bean/livestock farming system
and (ii) pepper/livestock farming system. Of all the 79 KA, 45 belong to the teff/bean/livestock
farming while the other 34 KA have the pepper/livestock farming system. In the
teff/bean/livestock farming system, bean is the most important crop for household income
generation and food security and has been identified as a priority marketable commodity in the
district (IPMS, 2005).

30
Figure 3.1: Map of Halaba Special District
Data Source: ILRI GIS Data Base (2011)
3.8 Sampling Techniques
A multi-stage sampling procedure was employed in order to draw a sample from red bean
producers. First, the district was selected purposively because of red bean production potential
and the existing low market participation. Secondly, red bean producing KA were identified. Out
of 79 KA in district, 45 KA were dominant red bean producers. Thirdly, five KA and four
villages were randomly selected from each of the five KA. Based on the information from the
District Agriculture and Rural Development office, producers in each village were grouped into
those who were participating in the market and those who did not participate in the red bean
market; proportions to size were calculated. Based on the proportions done, random number
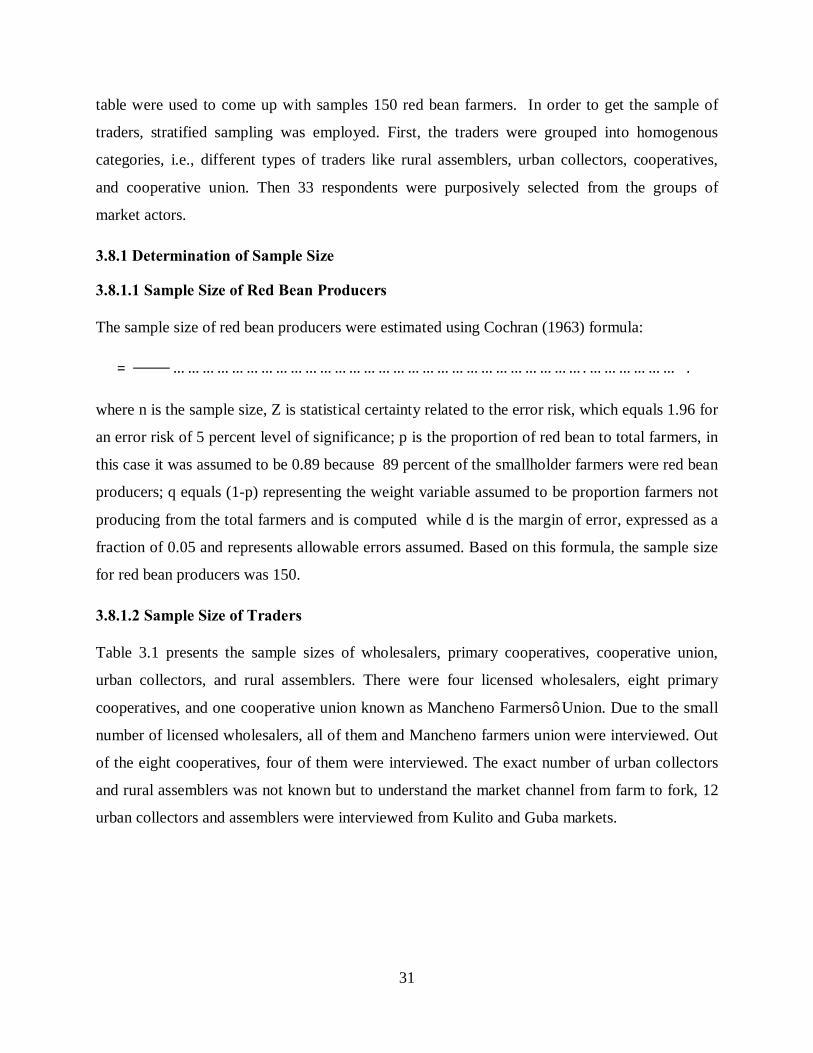
31
table were used to come up with samples 150 red bean farmers. In order to get the sample of
traders, stratified sampling was employed. First, the traders were grouped into homogenous
categories, i.e., different types of traders like rural assemblers, urban collectors, cooperatives,
and cooperative union. Then 33 respondents were purposively selected from the groups of
market actors.
3.8.1 Determination of Sample Size
3.8.1.1 Sample Size of Red Bean Producers
The sample size of red bean producers were estimated using Cochran (1963) formula:
� =����
�� … … … … … … … … … … … … … … … … … … … … … … … … … … … … . … … … … … … �. ��
where n is the sample size, Z is statistical certainty related to the error risk, which equals 1.96 for
an error risk of 5 percent level of significance; p is the proportion of red bean to total farmers, in
this case it was assumed to be 0.89 because 89 percent of the smallholder farmers were red bean
producers; q equals (1-p) representing the weight variable assumed to be proportion farmers not
producing from the total farmers and is computed while d is the margin of error, expressed as a
fraction of 0.05 and represents allowable errors assumed. Based on this formula, the sample size
for red bean producers was 150.
3.8.1.2 Sample Size of Traders
Table 3.1 presents the sample sizes of wholesalers, primary cooperatives, cooperative union,
urban collectors, and rural assemblers. There were four licensed wholesalers, eight primary
cooperatives, and one cooperative union known as Mancheno Farmers’ Union. Due to the small
number of licensed wholesalers, all of them and Mancheno farmers union were interviewed. Out
of the eight cooperatives, four of them were interviewed. The exact number of urban collectors
and rural assemblers was not known but to understand the market channel from farm to fork, 12
urban collectors and assemblers were interviewed from Kulito and Guba markets.

32
Table 3.2: Sample size of market traders surveyed in HSD
Traders Total number Sample size
Licensed wholesalers 4 4
Primary cooperatives 8 4
Cooperative union 1 1
Rural assemblers - 12
Urban collectors - 12
Sources: Author (2013)
3.9 Data Sources
Primary data was used for this study. The data were collected from a sample of red bean farmers,
traders, primary cooperatives, and cooperative union using a semi-structured pre-tested
questionnaire and informal interviews. The latter comprised two focus group discussions
(FGDs) and key informant interviews with producers, urban collectors, rural assemblers,
wholesalers, elders of the community, female representatives of KA, chairperson of KA and
development agents, to generate more information on the market chain. During the FGDs, the
major challenges for producers, cooperatives and traders were elicited. In addition, farmers’ view
in selling their red bean to cooperatives, farmers’ main information channels, challenges
associated with consuming red bean, challenges related to brokers in market places, and
motivation of farmers in producing red bean were identified.
Two types of questionnaires were developed, one for farmers and the other for traders. A
checklist was used to guide the FGDs and key informant interviews (see Appendix 4). The
questionnaire for farmers captured information on farmer and farm characteristics and the factors
affecting farmers’ red bean market participation and the extent of their participation (see
Appendix 5). The questionnaire for traders covered trader characteristics; trading activities,
constraints of marketing, source of market information and other relevant information (see
Appendix 6).

33
3.10 Data Analysis
The questionnaire data were captured in SPSS. Both descriptive and econometric analyses were
undertaken on the data using STATA version 12 and SPSS Version 16 computer packages (for
both t-test for quantitative data and chi-square for qualitative data). The data from FGD and key
informant interviews were analyzed qualitatively and used in the text to boost the information
from STATA and SPSS analysis.
3.10.1 Analysis of Marketing Channels and Constraints of Farmers, Traders and Cooperatives
Descriptive statistics were used to characterizing marketing channels, and the constraints faced by
each actor. This involved the computation of means, frequencies, percentages, and standard
deviation of red bean farmers, and other market actor characteristics. This part of the analysis
answered research question one and two on their respective order. The first research question was
answered by describing the main marketing channels of red bean in HSD. The second research
question was answered by identifying the constraints of farmers, traders and cooperatives along
the red bean marketing chain in HSD.
3.10.2 Analysis of Factors Affecting Red Bean Farmers’ Market Participation Decision and
their Extents
Red bean farmers’ market participation decisions and extent of participation were estimated
using the empirical model, (which one? the multinomial logit, probit? Name it here). The
empirical models in equations 3.16 and 3.17 were fitted into the data. The third research question
was answered based on the output of the model. In this part, all significant variables (α and β less
than10 percent) indicated that they influenced red bean farmers’ market participation decision
and extent of participation. The non-significant variables indicated that they did not influence red
bean farmers’ market participation decision and extent of participation. Table 3.3 summarizes the
meaning of each variable and its hypothesized signs.

34
CHAPTER 4
RESULTS AND DISCUSSION
4. 1 Comparison of Demographic and Socio-Economic Characteristics of Red Bean
Farmers in Halaba Special District
4.1.1 Demographic Characteristics of Farmers
Table 4.1 shows the difference between red bean market participants and non-participants with
regard to their demographic characteristics. The mean age of red bean market participants and
non-participants was 41 and 42 years respectively and were not statistically different (p = 0.588).
On the other hand, the number of years of formal education of the household head was
statistically different between the two groups (p = 0.079). The mean years of formal education
for participants were 1.6 years while for non-participants it was 2.2 years. This indicates that
participants were relatively less educated than their counterparts.
Table 4. 1: Demographic characteristics of red bean farmers in HSD
Variables Participants
(n=85)
Non participants
(n=65)
Mean Std Mean Std P-value
Age (Years) 41 7.8 42 11.6 0.588
Education (years of schooling) 1.6 2.8 2.2 0.9 0.079*
Family size in the year 2012 6.6 2.6 7.9 2.6 0.648
Farming experience (years) 22.1 8.4 23.9 10.3 0.161
Source: Survey data (2013) ***, **, * = significant at 1, 5 and 10 percent respectively
On average, red bean market participating families had seven members while a non-participating
one had eight family members. The two means were statistically not significant different (p = 0.
0.648). The mean farming experience was 22 for participants while 23 for non-participants, but
there was no statistical significant difference between the two groups (p = 0.161).
Table 4.2 shows the distribution of red bean farmers in HSD according to gender and marital
status. Participating female-headed households were 46.4 percent compared to 53.6 percent non-

35
participants. There was no significant difference between red bean market participating and non-
participating households in terms of gender and their marital status (χ2 = 1.5 and 4.1)
respectively.
Table 4.2: Distribution of red bean farmers in HSD according to gender and marital status
Variables Participants Non- participants
n % n % χ2-value
Gender of the
household head
Female 13 46.4 15 53.6 1.5
Male 72 59.0 50 41.0
Marital status of the
household head
Single 2 2.4 4 6.2 4.1
Married 57 67.1 46 70.8
Widowed 8 9.4 8 12.3
Polygamous 18 21.2 7 10.8
Source: Survey data (2013) ***, **, * = significant at 1, 5 and 10 percent respectively
4.1.2 Socio-Economic Characteristics of Red Bean Farmers in HSD
(a) Resource ownership of the household
Resource ownership was characterized in terms of different species of livestock, number of
mobile phones owned, number of working radios, number of bicycles and cart owned, and land
area owned by the household. The livestock species found in the study area were cattle, goats,
sheep, donkeys, horses, and poultry. In the district, they kept oxen for traction power and
donkeys for agricultural produce transportation from farm to store and from store to the market.
Table 4.3 presents the mean of various items owned by the households in HSD. TLU (tropical
livestock unit)1 was used to compare livestock ownership. The mean number of livestock owned
1TLU is a standardized method in which number of various livestock species can be expressed as a single figure that
express the total amount of livestock present irrespective of the specific composition. Calf=0.25, calf weaned=0.34,
heifer=0.75, cow or ox=1.0, horse=1.1, donkey adult=0.7, donkey young=0.35, sheep and goat adult=0.13, sheep
and goat young=0.06, chicken=0.013, bull=0.75 (Storck et al., 1991).

36
by red bean market participants was 6.5 TLU while non-participants owned only 2.9 TLU. There
was a significant statistical difference between red bean market participants and non-participants
with regard to TLU (p = 0.001). Additionally, red bean market participants had significantly
more communication equipment (mobile phones and working radio owned) compared to their
counterparts (p = 0.004) and (p = 0.001) respectively.
The mean size of land owned by red bean market participants and non-participants was 2.1ha and
1.4 ha per household respectively. The land owned by market participants and non-participants
households had significant difference (p = 0. 001), more land size was owned by market
participants than non-participants who had 2.1 ha, and 1.4 ha respectively. Land in the study area
is one of the major constraints that limit farmers’ production potential. During FGD sessions, it
was stressed that there was no option for newly formed households to have their own farmland.
The only chance for such households was to share what the household had in the past. The mean
annual off-farm income for market participants and non-participants was 897.9 and 640 ETB per
household per year respectively but not statistically significant different (Table 4.3).
Table 4.3: Summary of resource ownership and off-farm income by households in HSD
Item Participants
n=85
Non-participants
n=65
Mean Std Mean Std P-value
Tropical livestock units (TLU) 6.5 5.9 2.9 2.4 0.001***
Number of mobile phones owned 1.6 0.9 1.1 0.6 0.004***
Number of working radios 1.3 0.6 0.9 0.2 0.001***
Total land holding in ha 2.1 1.1 1.4 0.5 0.001**
Off-farm income 897.9 1158.0 640.0 2542.3 0.82
Source: Survey data (2013) ***, **, * = significant at 1, 5 and 10 percent respectively
(b) Ownership of means of transport
On average, market participants had 1.6 bicycles, which was statistically higher than the 0.9
bicycles owned by non-market participants (p = 0.006). The mean number of bicycles and animal
drawn carts were statistically different between market participants and non-participants (p = 0.

37
0.011). It was reported that market participants owned 1.3 animal drawn carts while non-
participants owned 0.9 animal drawn carts (Table 4.4). Red bean farmers mainly used donkeys
and horses as a means of transport. During the FGDs farmers pointed that their main
transportation means was animal drawn cart (a cart drown by oxen, donkey, and horse), and pack
animals (animals used for loading directly on their back without using cart). No farmer reported
use of vehicle to transport red bean to the market or to their store. This could be due to
accessibility of cheaper local animal transportation trend.
Table 4.4: Number of transportation means owned by red bean farmers in HSD
Item Participants
n=85
Non-participants
n=65
Mean Std Mean Std T-value
Number of bicycles owned 1.6 0.9 0.9 0.3 0.006***
Number of animal drawn
carts owned
1.3 0.5 0.9 0.3 0.011**
Source: Survey data (2013) ***, **, * = significant at 1, 5 and 10 percent respectively
(c) Main sources of income in HSD
Table 4.5 presents the main sources of income for red bean farmers in HSD. The primary source
of income was both livestock and crop production for 64.7 percent of market participants and
44.6 percent of non-participating households. The number of red bean market participants who
engaged in both livestock and crop production was significantly higher than that for non-
participants (p = 0.026). About 34 percent of red bean market participants reported that their
main source of income was crop production whereas only 1.2 percent of market participant
households obtained their income from petty trade and daily labor. As a result, most of red bean
farmers get their income from mixed livestock and crop enterprises, followed by crop production
whereas the non-participants obtain their income mainly from crop production followed by
livestock and crop production. Households participating in the market had their income from
both livestock and crop production while those non-participant households obtained their income
mainly from crop production.

38
Table 4. 5: Main sources of income for red bean farmers in HSD
Item Participants Non-participants
n % n % χ2-value
Crop production 29 34.1 36 55.4 7.3**
Livestock and crop production 55 64.7 29 44.6
Petty trade and daily labor 1 1.2 0 0
Source: Survey data (2013) ***, **, * = significant at 1, 5 and 10 percent respectively
(d) Participation in off-farm activities
Table 4.6 presents off-farm income activities practiced by red bean farmers in HSD. The main
types of off-farm activities involving red bean market participant were petty trade followed by
donkey cart (donkey pulling cart for transportation of farm produce) while for non-participants
both petty trade and donkey carts were equally important. Among non-market participant, none
of them had horse carts. The reported annual average off-farm income of red bean market
participants and non-participants was ETB 897.9 and ETB 640 respectively and were not
statistically different (p = 0.278) (Table 4.3).
Table 4.6: Off-farm activities of red bean farmers in HSD
Item Participants Non-participants
n % n % χ2-value
Petty trade 11 12.9 3 4.6 3.9
Donkey cart 6 7.1 3 4.6
Horse cart 3 3.5 0 0
Paid daily labor 1 1.9 2 3.1
Source: Survey data (2013) ***, **, * = significant at 1, 5 and 10 percent respectively
4.2 Discussion
Table 4.1 indicates that households with relatively lower number of years of schooling were
market participants while those with relatively better educational status were not market
participants. Even though, education level was statistically different between red bean farmers

39
market participation and non-participants, in real sense the difference between the group could
not make difference since the difference is very small.
The analysis of resource ownership indicates that red bean market participants owned more
resources than non-market participants (Table 4.3). This implies that in HSD, market participants
were better-off compared to non-participants. Additionally, market participants had more access
to information than their counterparts because they had more information communication
equipment like mobile phones and working radios. This implies that their market participation
helped them to earn money and buy equipments needed by the household.
There was a significant difference between red bean market participants and non-participants
with regard to ownership of means of transportation like bicycle and draught animals. This might
be because those farmers who had own transportation means sold more as compared to those
who did not have own transport means. Gebremedhin and Jaleta (2010) found that ownership of
some means of transportation like equines increased farmers’ market participation in Ethiopia.
This is because of relatively low cost using their animals for transportation. Mathenge et al.
(2010) also found that ownership of some means of transportation had a positive impact on
farmers’ market participation decision in Kenya. Improvemnt on farmers resource ownership
could enhance farmers access to market information because when farmers had resource then
they could buy communication equipemnts and hence get information from their networks. The
results of the study indicated that, farmers who had own transportation means participated in the
red bean market, indicating that the ownership to transportation mean motivated them to
participate in the red bean market.
4.3 Access to Different Services
4.3.1 Access to Credit
Table 4.7 shows that among the red bean market participants, 11.8 percent accessed credit while
among the non-participants, only 4.6 percent had credit access at the time of the survey. Access
to credit was low for both participants and non-participants at the end of the surveys.

40
Table 4.7: Red bean farmers’ access to different services in HSD
Item Participants Non participants
n % n % χ2-value
Access to credit Yes 10 11.8 3 4.6 26.9
No 75 88.2 62 95.4
Access to field
demonstrations
Yes 48 56.5 18 27.7 0.532***
No 37 43.5 47 72.3
Access to market
information
Yes 81 95.3 40 61.5 26.9***
No 4 4.7 25 38.5
Source: Survey data (2013) ***, **, * = significant at 1, 5 and 10 percent respectively
The chi-square test in Table 4.8 indicates that there was a significant statistical difference
between market participants and non-participants with regard to their reasons for not accessing
credit from the government (χ2 = 0.532). Out of the total 150 respondents, 20 percent of market
participants and 12 percent of non-participants reported that they did not access credit from
government because of inadequate supply. About 27 percent of red bean market participants and
49 percent of non-participants indicated they were not willing to take credit from formal sources
because of high interest rate. Furthermore, among the market participants, three percent and four
percent from non-red bean market participant did not take credit from formal sources due to
restrictive procedures. Inadequate information was one of the reasons that hindered red market
participants and non-participants’ credit application from formal sources as reported by 4 percent
of both groups of farmers. In the district, majority of red bean market participants (44 percent)
and non-participants (29 percent) did not take credit because of their religion that disallowed
them to pay interest for any borrowed money. About 12 percent and 4.6 percent of market
participants and non-participants, respectively, had access to informal credit (mainly from
friends and relatives) during the year preceding the survey.

41
Table 4.8: Reasons of red bean farmers not to access formal credit in HSD
Reasons for not accessing
credit
Participants Non-participants
n (%) n (%) χ2-value
Inadequacy of supply 17 20.0 8 12.3 8.7*
High interest rate 23 27.1 32 49.2
Restrictive procedures 3 3.5 3 4.6
Inadequacy of information 4 4.7 3 4.6
Religion 38 44.7 19 29.2
Source: Survey data (2013) ***, **, * = significant at 1, 5 and 10 percent respectively
4.3.2 Access to Field Demonstrations
Table 4.7 shows that out of 150 red bean farmers interviewed in HSD, 44 percent attended field
demonstration during the year preceding the survey. Among sampled red bean farmers who
participated in the market, 56.5 percent attended field demonstration while among non-
participants, only 27.7 percent attended the field demonstration. The chi-square test (χ2 =8.7)
indicate that there was a significant statistical difference between red bean market participants
and non-participants with respect to access to field demonstrations. The result indicated that
participation in field demonstrations seemed to enhance market participation
4.3.3 Access to Market Information
Table 4.7 shows that about 95 percent of red bean market participants and 61.5 percent of non-
participants had access to market information. This observation indicates that access to market
information was not a problem in the study area especially for red bean market participants
because about 95 percent of them accessed market information. There was a significant
difference (χ2 = 26.9) between market participants and non-participants in terms of access to
market information. During the FGDs, farmers reported that there was information accessibility
although it was not reliable because some of the information they had earlier about the market on
red bean prices was outdated.
Table 4.9 shows main sources of market information in HSD. There was a statistically significant
difference between market participants and non-participants on access to price information

42
sources at (χ2 = 21.3), whereas there were no differences on sources of information on
husbandry, quality and demand of red bean (χ2 = 4.7, 8.1 and 12.7) respectively. Among the
households that accessed market information, more than 24 percent of market participants and
non-participants got price information from MARD. In HSD, most of red bean market
participants (42 percent) farmers received price information from other farmers. In the study
area, MARD is most important information source on price, demand, husbandry, and quality of
red bean for both market participants and non-participants. Farmer-to farmer information
transmission was the second most used source of information for red bean market participants
and non-participants farmers. In the study area, NGOs and DAs were not important sources of
information for both red bean market participants and non-participants as few farmers used them.
Table 4.9: Main sources of market information in HSD
Participants
(n=85)
Non-participants
(n=65)
Source Pri. Hus. Qua. Dem. Pri. Husb. Qua. Dem.
MARD 24.3 53.8 52.8 39.8 24.8 34.3 33.5 21.3
NGO 0.5 5 6 4.5 0.5 3 1 1
Other farmers 42.3 10.4 9.9 18.3 15.4 4.9 6 5.3
traders 9.4 1.8 4.3 13.4 2.3 0.8 2.5 15.4
DA 1.5 4 4 3 0.5 0.3 0.1 0.2
χ2-value 21.3*** 4.7 8.1 12.7
Source: Survey data (2013); pri=price, Hus=crop husbandry, qua=quality, and dem=demand; ***, **, * = significant at 1, 5 and 10 percent respectively
Table 4.10 presents the main information delivery channels in the study area on price,
husbandry, quality, and demand of red bean. As shown, extension agents were the most
important information delivery channels in the district for both red bean market participants and
non-participants. Farmer-to-farmer information delivery system was the second most important
channel in circulating price, husbandry, and quality and demand information on red bean in the
district. About 3 percent of red bean farmers participating in the market obtained information on
red bean quality from the radio whereas only 2.3 percent of non-participants obtained it from the

43
same source. Brokers were important information transmission channels of price 9.2 percent and
4.7 percent of market participants and non-market participants respectively relied on them.
Table 4.10: Information delivery channels on different red bean market attributes in HSD
Item Participants
(n=85)
Non-participants
(n=65)
Info
rm.
deliv
ery
Cha
nnel
s
Rad
io
Exte
nsio
n
wor
kers
O
ther
farm
ers
Pers
onal
Trad
ers
Bro
kers
Rad
io
Exte
nsio
n
wor
kers
O
ther
farm
ers
Pers
onal
Trad
ers
Bro
kers
Price (%) 8.3 22.6 27. 8.3 7.4 9.2 4.8 11.3 14.1 2.8 2.4 4.7
Crop Husba-
ndry (%)
1.5 27.9 11.9 0.3 0.3 1.2 2.0 53.2 15.2 0.5 0.0 0.7
Quality (%) 2.9 56.3 9.6 0.0 2.9 2.0 2.3 28.9 7.2 2.1 1.7 0.6
Demand (%) 3.9 40.1 20.4 4.5 5.6 2.5 6.2 16.2 11.7 1.7 7.0 0.2
Source: Survey data (2013)
4.3.4 Membership in a Farmer Cooperative
Table 4.11 presents that out of 85 farmers who participated in red bean market, 22.4 percent
were members of Metoma farmer Cooperative Society. Only 1.5 percent of the non-market
participants were members of the cooperative. Membership in a red bean cooperative society was
statistically significant between market participants and non-participants (χ2 = 13.8). This result
implies that only few farmers were members of cooperative, and among the members, majority
were red bean sellers. Among members of the primary cooperative, the majority were red bean
market participants (see Appendix 7).
4.3.5 Awareness about Quality Standards and Production According to Quality Standards
About 78 and 38 percent of red bean market participants and non-participants respectively were
aware of red bean quality standards demanded by traders in the market (Table 4.11). The level of
awareness was statistically different between the two groups (χ2 = 25.3). The result implies that
farmers who were red bean market participants were more aware of quality standards as
compared to non-participants.

44
Red bean farmers were asked whether they knew and produced according to quality standards
demanded by the market. Quality standards were defined as the ability of producers to meet
customer’s needs and expectations (UNIDO, 2006). Out of 85 red bean market participants, 47
percent produced red bean according to quality standards while 15 percent out of 65 non-
participants produced red bean according to quality standards. There was a statistically
significant difference (χ2 = 18.6) between red bean market participants and non-participants in
terms of producing according to quality standards (Table 4.11).
From the FGDs, the color of the red bean, texture (shriveled or not) and cleanness were among
the major criteria of quality standards perceived in the study area. During the FGDs, farmers
reported that they were working to keep the quality as it was needed by the customers through
keeping the grain soil-free and avoiding over and under drying. However, although the farmers
were working to keep the quality standards red bean traders pointed out that most of the red bean
produce from HSD was of inferior quality and they preferred to buy from other nearby districts.
Table 4.11: Membership, awareness and standard among red bean farmers in HSD
Item Participants Non-participants
n % n % χ2-value
Membership to
cooperative
Yes 19.0 22.4 1.0 1.6 13.8***
No 66.0 77.7 64.0 98.5
Awareness about
quality standard
Yes 67.0 78.8 25.0 38.5 25.3***
No 18.0 21.2 40.0 61.5
Produce according
to quality standard
Yes 40.0 47.1 10.0 15.4 18.6***
No 45.0 52.9 55.0 84.6
Source: Survey data (2013) ***, **, * = significant at 1, 5 and 10 percent respectively
4.3.6 Discussion
In HSD, both red bean market participants and non-participants did not have much access to
credit due to various reasons, such as inadequate supply, high interest rate, restrictive procedures,
and religion (Table 4.8). Among the red bean market participants, the major barrier in credit
access was religion whereas for non-participants group the dominant factor was high interest

45
rate. Studies show that credit has a positive and significant effect on smallholders’ market
participation decision. For instance, Alene et al. (2008) found that of maize supply and fertilizer
demand and credit enhanced credit worthy smallholders’ market participation in Kenya.
Mussema and Dawit (2012) also found that among red pepper farmers in Alaba Special District,
Ethiopia, about 61 percent needed credit whereas only 11 percent of them had received the
credit, indicating disparity between demand and supply of credit.
The results on field demonstration participation (Table 4.7) indicate that most of the farmers who
attended field demonstration were better in participating in red bean market. This might be
related to the knowledge that they acquired during field visit which would have motivated them
to produce surplus and participate in the red bean market. Additionally, attending the field
demonstration might have helped them to communicate with other farmers and gain knowledge
or exchange ideas on production techniques and quality issues, and this could enable them to
produce according to the market demand and thereby participate in the market. The result tallies
with that of Negash (2007) who found that field visits and training contributed positively to
farmers’ adoption decision of haricot bean in Alaba Special District of Ethiopia. On the other
hand, Lapar et al. (2002) found that improving farm-specific skills through field demonstrations
(visits) by extension agents was important in enhancing the market participation decision.
Access to market information is extremely limited in the Ethiopian grain market (Wolday, 1994).
Furthermore, farmers have limited access to quality and timely information on market prices
(ibid). In contrast, farmers in HSD had access to market information although there was
inadequate organized market information system for use by farmers. Aysheshm (2007) found
that in sesame marketing, access to market information was not a problem; rather, it was the
quality of information accessed by the farmers that was woefully low. During FGD sessions,
farmers indicated that they had access to market information although it was neither timely nor
reliable. Access to timely and accurate market information is the fundamental element in
commodity marketing (ibid). Djalalou et al. (2012) also noted that up-to-date market information
could enhance the quality and increase incomes for actors along the market chain participating in
the marketing of pineapple in Benin.
Awareness about quality standards and production according to quality standards were analyzed
in this study. The results show that farmers who were aware about red bean quality standards

46
participated better in red bean market as compared with those unaware about quality standards.
This might be due to the fact that the awareness created enabled them know how to produce red
beans according to consumer demand, which enhanced their market participation. Djalalou et al.
(2012) found that smallholder farmers’ low level of awareness of the required quality in the
market led to the rejection of their produce in the market. Aysheshm (2007) found that sesame
traders in Ethiopia were very serious in identifying sesame quality standards in the market and
only those who produced high quality sesame were able to sell at high prices. Wolday (1994)
also noted that in Ethiopia poor product quality was one of the bottlenecks that hindered farmers’
market participation in Alaba and Siraro markets. In HSD, the farmers who produced according
to the quality standards participated better compared to those who did not. This might be
associated with consumers’ willingness to pay higher price for quality produce and when farmers
get higher price this could motivate them to participate in the market.
4.4 Farmer Perception of Keeping of Farm Records in HSD
4.4.1 Record Keeping among Respondents
In HSD, not all the sampled households kept farm records. Farmers in the district reported
various reasons why they did not keep farm records. Farm records were reported to be important
in farm management, obtaining credit, for cost-benefit analysis of the production, farm decision
making, in enhancing farmers’ compliance to income tax requirements. Montshwe (2006) found
that despite the importance of farm records in improving farm management, only 13 percent of
the farmers surveyed kept farm records in South Africa.
4.4.2 Reasons for not Keeping Records in HSD
Out of 150 households interviewed, neither market participant nor non-participant farmers kept
farm records in the district. Table 4.12 shows that there is significant difference between red
bean market participants and non-participants (χ2 = 33.0). Among red bean market participants
and non-participants, 36 percent and 18 percent respectively were not used to keeping farm
records due to lack of knowledge on its importance. Additionally, 14 percent and 15 percent red
bean market participant and non-participants respectively did not keep farm records because of
inadequate information. Lack of education (illiteracy) hindered 4 percent of red bean market
participants and 8 percent of non-participants from keeping their farm records. Unwillingness

47
was not a problem for red bean market participants while about 2 percent of the non-market
participant farmers reckoned that they were unwilling to keep farm records because they had
other businesses that they were running (Table 4.12).
Table 4.12: Major reasons for not keeping farm records in HSD
Item Participants Non-participants
n % n % χ2-value
Lack of knowledge 54 36 28 18.7 33.0*
Lack of information 21 14 23 15.3
Lack of education 7 4.7 13 8.7
Unwillingness 0 0 4 2.7 Source: Survey data (2013) ***, **, * = significant at 1, 5 and 10 percent respectively
4.5 Production and Supply of Red Bean in HSD
4.5.1 Main Sources of Labor
Figure 4.1 presents main sources of labor available in HSD. About 60 percent of red bean market
participants used family labor while 84 percent used family labor. In the district, 23 percent of
market participants used hired labor while only 6 percent of non-participants use hired labor.
Additionally, 17 percent of red bean market participants used debo labor while 10 percent of
non-participants used debo as a source of labor. Debo is a source of labor in which two or more
people come together and work for each other in turns. From the study, the use of family labor in
red bean production was common for both market participants and non-participants.

48
Figure 4. 1: Percentage of main sources of labor in HSD
Source: Survey data (2013)
4.5.2 Sources of Planting Materials
Planting material is a major input that affects productivity and production of crops. In HSD,
farmers used both local (Red Wolayita) and improved red bean varieties (Nasir) as planting
material. The results of analysis indicated that there was no significant difference between red
bean market participants and their non-participant counterparts with regard to type of seed used
(χ2=3.6). About 95 and 88 percent of red bean market participants and non-participants
respectively used improved seed (Nasir) (Table 4.13). The rest used the local variety (Red
Wolayita). During the FGDs, farmers complained that timely access to improved seed was a
major bottleneck. The red bean farmers preferred Nasir variety because of its disease resistance,
high productivity, and better demand in the market.
Table 4.13: Type of red bean planting material used in HSD
Item Participant Non-participant
N % n % χ2-value
Improved seed (nasir) 81 95.3 57 87.7 3.6
Local (Red Wolayita) 4 4.7 8 12.3
Source: Survey data (2013) ***, **, * = significant at 1, 5 and 10 percent respectively
60%23%
17%
Red bean market participant
family labor hired labor debo
84%
6% 10%
Red bean market non participant
family labor hired labor debo

49
4.5.3 Discussion
The results of the study show that a major source of labor was family labor for both red bean
market participants and non-participants. This might be associated with the culture of using
family labor for farming activities among rural Ethiopians. Additionally, this could have been
because of lack of funds to hire labor to substitute family labor. Furthermore, red bean market
participants were better in using hired labor and debo. This could be because red bean market
participants may have higher income to hire labor as compared to non-market participants. The
result showed that market participants were better in using debo. This might be associated with
the social network they had in the past within the community. Moreover, these farmers were
market participants and had cash income. As a result, other farmers might have been willing to
work for them.
In HSD, most of the market participants and non-participants used improved red bean seed. The
Nasir seed variety was most preferred among both groups. This might be due to its better taste
and market demand. Susceptibility to disease could be another cause forcing farmers to plant
Nasir instead of the local variety, Red Wolayita (IPMS, 2005).
4.6 Red Bean Marketing in HSD
4.6.1 The Red Bean Market Channels in HSD
The flow of red bean from farmers to different channels is presented in the Figure 4.2. The figure
representing the channels was considered only the red bean sold to the market. This part of the
research result answered research question one by describing the major available red bean
marketing channels. There were seven red bean-marketing channels in the study area. In terms of
quantity of red bean sold by farmers, only three market channels seemed important, i.e., urban
collectors, wholesalers, and rural assemblers. About 19.5 percent of the farmers sold directly to
wholesalers and the major portion was sold to urban collectors (79 percent), 0.7 percent sold to
primary cooperative while 0.8 percent sold to rural assemblers.
On figure 4.2, the arrow from NGOs back to farmers shows the flow of red beans from NGOs to
farmers in the form of aids. In the year preceding the survey, NGOs bought red beans from
cooperative union and distributed them to farmers as planting materials to enhance household
food security. In the district, cooperative union, urban collectors and rural assemblers channeled

50
all what they bought to wholesalers. There was no broker who bought red beans with his/her own
money and sold to any traders; instead, brokers bought the red beans on credit. Additionally,
wholesalers and rural assemblers gave money to their brokers in the morning of every market
day and transported the produce to the store in the same day in the afternoon or the morning of
the next day.
Figure 4. 2: Marketing channels of red bean in HSD
Source: Survey data (2013)
Channel I: Farmers Urban Collectors Wholesalers Exporters Consumers
Channel II: Farmers Wholesalers Exporters Consumers
Channel III: Farmers Rural Assemblers Urban Collectors Wholesalers Exporters
Consumer
Channel IV: Farmer Rural Assemblers Wholesalers Exporters Consumers
Channel V: Farmers Rural Assemblers Exporters Consumers
Exporters
Urban Collectors (79.10%)
Wholesalers (19.50%)
Rural Assemblers (0.7843%)
NGOs
Primary Cooperatives (0.675%)
Cooperative union
Red Bean Farmers
100%

51
Channel VI: Farmers Primary Cooperatives Cooperative Union Wholesalers
Exporters Consumers
Channel VII: Farmers Primary Cooperatives Cooperative Union Exporters
Consumers
4.6.2 Major Market Actors and their Role in Red Bean Marketing Chain in HSD
(a) Producers
Producers are the first step in the marketing chain. Red bean producers in HSD harvest and
consume some at home, give some as gift, some preserved as planting material for next season,
some lost due to post harvest problem and supply the rest to the traders in the market. Table 4.14
shows red bean Production, consumption, post-harvest loss, gift and land allocation in HSD.
On average, red bean market participants produced 430.6 kg while non-participants produced
161.2 kg of red bean in the year preceding the survey. From this production, 302.94 kg (or 70
percent) was sold to wholesaler, urban collectors, rural collectors and primary cooperative. The
quantity of red bean consumed by red bean market participants and non-participants was 103.06
kg and 137.5 kg respectively. These amounts were not statistically different between the two
groups (p = 0.891).
The average land size under red bean production was 0.6 and 0.4 ha per household among
market participants and non-participants respectively (Table 4.14). The average land size was
significantly different between the groups (p = 0.019) indicating that participants of red bean
market had significantly larger farm size than non-participants. According to FGDs, farmers had
the desire to increase land allocation if they were certain about market and on time access for
improved seed. The participants of FGDs indicated that farmers threshed bean on un-cemented
floor, which contaminated them with soil thereby reducing quality. No red bean processing was
reported at the farm level in the study area, other than thrashing and storage.
The quantity of red bean preserved for seed, the post harvest loss and the quantity given as gift
by market participants was not significantly higher than those of their counterparts (P= 0.169).
During the FGDs, it was pointed out that there were no market arrangement between farmers and
buyers; this indicates that there is need to work on improving this market environment.

52
Rural assemblers paid farmers 4.10 ETB/kg (1USD=18.5 ETB) of red beans while wholesalers
paid 5.60 ETB/kg (Table 4.15). Few farmers sold their produce to wholesalers while most of the
farmers sold their red bean to urban collectors at an average price of 4.88 ETB/kg.
Table 4.14: Production, consumption, post harvest loss, gift and land allocation in HSD
Source: Survey data (2013); the numbers in parenthesis indicate standard deviation. ***, **, * = significant at 1, 5 and 10 percent respectively
(b) Brokers
Brokers are agents who work for a commission on behalf of other participants (Mussema, 2006).
Red bean farmers were unable to determine the price of their produce because there were too
many brokers working for illegal traders (traders who did not have trading licenses and who
competed with licensed traders in market places) and wholesalers. They specialized in bringing
the buyers and sellers together but most of the time they allegedly cheated farmers; almost all
farmers complained about brokers. The brokers had very strong linkages with wholesalers and
illegal red bean traders. Ketema (2007) also reported that brokers are the ones who decide on the
Item Participants Non-participants
n Per 100Kg n Per 100Kg P-value Quantity of red bean
produced in 2012 (Kg)
85 430.6
(346.7)
65 161.2
(92.5)
0.005***
Quantity of red bean
consumed in 2012
73 103.1
(85.7)
62 137.5
(80.1)
0.891
Quantity of red bean sold
in 2012
85 302.9
(286.1)
0 0 0.006***
Quantity of red bean
preserved for seed
49 47.1
(36.5)
30 21.0
(14.2)
0.009***
Quantity of red bean lost
due to post harvest losses
43 26.9
(18.1)
18 22.1
(17.2)
0.768
Quantity of red bean used
as gift
37 29.6
(23.6)
18 22.1
(15.9)
0.169
Land allocated for red
bean in 2012 (ha)
85 0.6
(0.4)
65 0.4(0.3) 0.019**
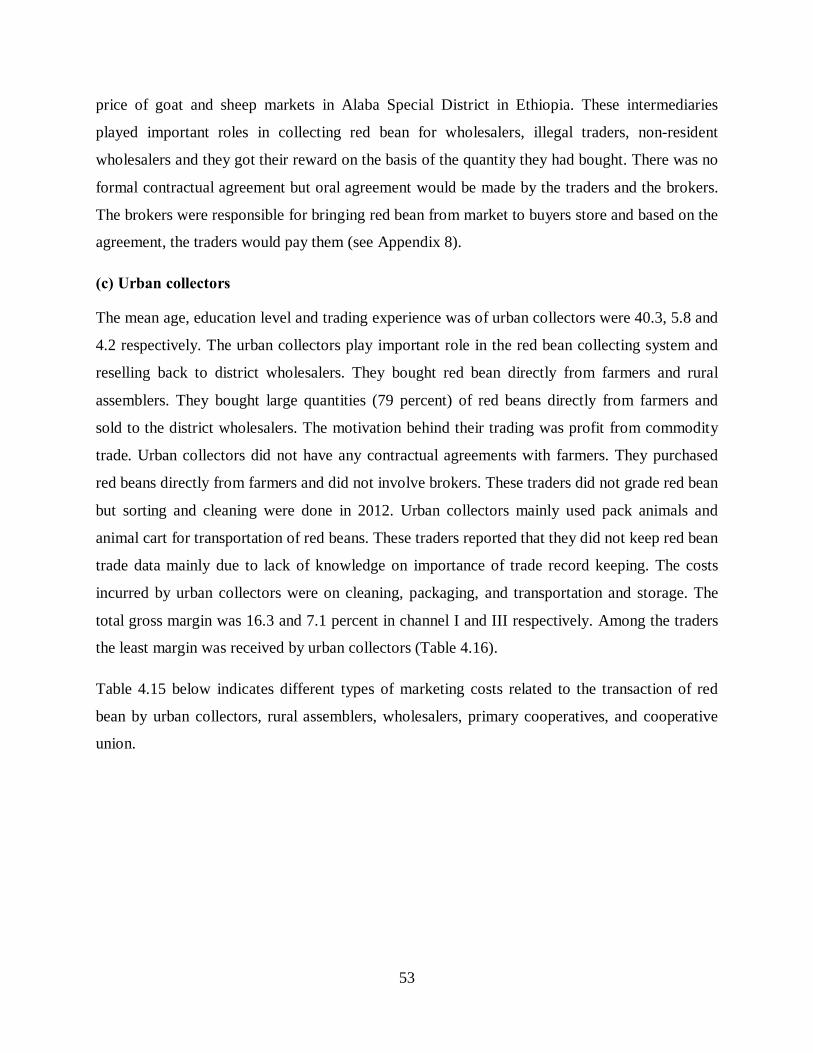
53
price of goat and sheep markets in Alaba Special District in Ethiopia. These intermediaries
played important roles in collecting red bean for wholesalers, illegal traders, non-resident
wholesalers and they got their reward on the basis of the quantity they had bought. There was no
formal contractual agreement but oral agreement would be made by the traders and the brokers.
The brokers were responsible for bringing red bean from market to buyers store and based on the
agreement, the traders would pay them (see Appendix 8).
(c) Urban collectors
The mean age, education level and trading experience was of urban collectors were 40.3, 5.8 and
4.2 respectively. The urban collectors play important role in the red bean collecting system and
reselling back to district wholesalers. They bought red bean directly from farmers and rural
assemblers. They bought large quantities (79 percent) of red beans directly from farmers and
sold to the district wholesalers. The motivation behind their trading was profit from commodity
trade. Urban collectors did not have any contractual agreements with farmers. They purchased
red beans directly from farmers and did not involve brokers. These traders did not grade red bean
but sorting and cleaning were done in 2012. Urban collectors mainly used pack animals and
animal cart for transportation of red beans. These traders reported that they did not keep red bean
trade data mainly due to lack of knowledge on importance of trade record keeping. The costs
incurred by urban collectors were on cleaning, packaging, and transportation and storage. The
total gross margin was 16.3 and 7.1 percent in channel I and III respectively. Among the traders
the least margin was received by urban collectors (Table 4.16).
Table 4.15 below indicates different types of marketing costs related to the transaction of red
bean by urban collectors, rural assemblers, wholesalers, primary cooperatives, and cooperative
union.
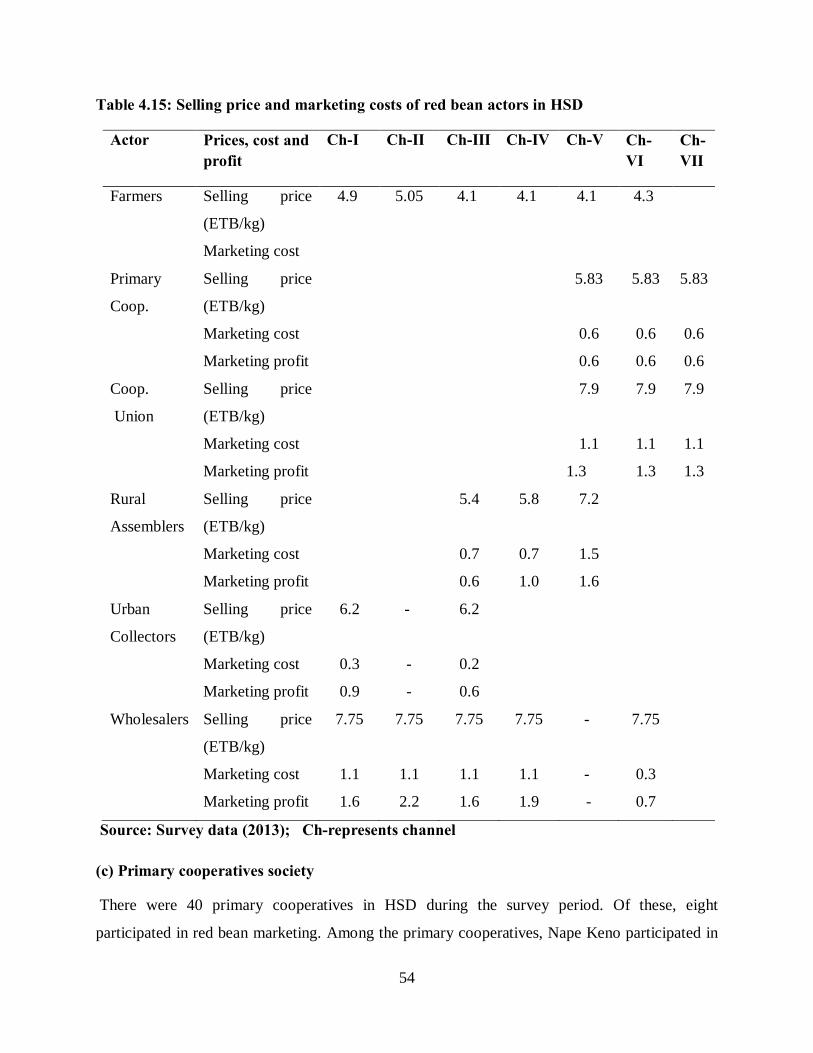
54
Table 4.15: Selling price and marketing costs of red bean actors in HSD
Source: Survey data (2013); Ch-represents channel
(c) Primary cooperatives society
There were 40 primary cooperatives in HSD during the survey period. Of these, eight
participated in red bean marketing. Among the primary cooperatives, Nape Keno participated in
Actor Prices, cost and profit
Ch-I Ch-II Ch-III Ch-IV Ch-V Ch-VI
Ch-VII
Farmers Selling price
(ETB/kg)
4.9 5.05 4.1 4.1 4.1 4.3
Marketing cost
Primary
Coop.
Selling price
(ETB/kg)
5.83 5.83 5.83
Marketing cost 0.6 0.6 0.6
Marketing profit 0.6 0.6 0.6
Coop.
Union
Selling price
(ETB/kg)
7.9 7.9 7.9
Marketing cost 1.1 1.1 1.1
Marketing profit 1.3 1.3 1.3
Rural
Assemblers
Selling price
(ETB/kg)
5.4 5.8 7.2
Marketing cost 0.7 0.7 1.5
Marketing profit 0.6 1.0 1.6
Urban
Collectors
Selling price
(ETB/kg)
6.2 - 6.2
Marketing cost 0.3 - 0.2
Marketing profit 0.9 - 0.6
Wholesalers Selling price
(ETB/kg)
7.75 7.75 7.75 7.75 - 7.75
Marketing cost 1.1 1.1 1.1 1.1 - 0.3
Marketing profit 1.6 2.2 1.6 1.9 - 0.7

55
improved red bean seed production, and sold the seed to the cooperative union that solicited for
markets. The four cooperatives visited included Nape Keno, Amelamo Grain Trading Service,
Metoma Grain Trading, and Upper Bedenea Cooperative Society. These cooperatives were
mainly trading with teff, maize, and red bean in the district. None of them bought grains
contaminated with soil or stones and with shriveled grains as these would compromise the
quality demanded by the cooperative union.
There was contractual agreement between the cooperative societies and the cooperative union
such that the former were expected to supply the latter quality red beans. The cooperative union
was expected to buy the beans based on the agreement made. There was no contractual
agreement between the cooperatives and farmers; farmers were free to sell their produce
anywhere they wished and at any price.
The cooperatives used both animal carts and trucks for transporting red beans, the former for
short distances while the latter for relatively longer stretches. All the cooperatives stored what
they bought (15,900 kg) and sold it latter to the cooperative union at an average price of ETB
5.83/kg for the commodity that they bought for 4.3 ETB/kg (Table 4.15). The total gross margin
for primary cooperatives was 21.3 percent in channel VI and VII (Table 4.16).
(d) Cooperative union
There was one cooperative union in the district called Mancheno that cooperatives societies were
affiliated to. The cooperative union was established in Kulito town in 2004 with eight
cooperative society members, although it started buying red bean from the cooperative societies
in 2008. The union bought the produce from cooperative societies working in rural areas where
there was production. The union traded trades in maize, wheat, teff, red bean, red pepper, white
bean, and millet seed. The union participated in the market by buying red bean through
cooperative societies, and reduced price volatility of different commodities in the district. The
cooperative union considered red bean variety, color and size of the grain as major quality
attributes and the inspection was done by only visual observation. The variety traded by the
union was called Nasir. The major means of transportation was trucks. It supplied NGO and
wholesalers. The term of payment with both suppliers of the union and buyers of the union was

56
cash. The nearest cooperative society was 5 km away and the farthest 100 km away from the
union.
The constraints that hindered the cooperative union from supplying red bean to markets
consistently were (i) low quality of red bean, (ii) price fluctuations, (iii) inadequate storage
facilities, (iv) inconsistent supply from cooperative societies, (v) illegal market/traders, (vi)
distance from union to the market, (vii) inconsistent demand from traders at different levels and
(viii) financial capacity to support cooperative societies working in rural areas, to buy as much as
possible and to build storage facilities (Table 4:18). Producers and traders also seemed inept in
handling the produce, resulting in poor quality.
It was reported that the union paid an additional 10 to 15 percent on the normal market price, yet
not all producers were willing to sell through this channel. The reason could be that the
cooperative bought only high quality red bean, and some farmers did not have knowledge about
those standards and failed to sell to the union. During the FGDs, some of the producers indicated
that they did not want to waste their resources transporting beans to the cooperative because of
the probability of rejection due to poor quality. To fill up this quality gap, farmers requested
training on red bean quality and standard issues. In the district, the cooperative union was
controlled by the government. There was contractual agreement between the cooperative union
and the cooperative societies in which the union expected to buy all the produce from
cooperative societies and the cooperative society were expected to realize the expected minimum
quality requirements. The cooperative union also had contractual agreements to supply required
quantity and quality of red beans to its clients. The total quantity of red bean that was bought by
the union in 2012 was 32,473 kg. The costs incurred by the cooperative union were
transportation, loading and unloading, cleaning, sorting, packaging, rent for store and grading.
They bought for 5.5 ETB/kg and sold 7.9 ETB (Table 4.15). Total gross margin for cooperative
union was 20.5 percent of end buyer’s price in channel VI and channel VII (Table 4.16).
(e) Rural assemblers
The mean age, education level and trading experience of rural assemblers were 38.2, 4.9 and 5.2
respectively. Assemblers mainly bought small lots of red beans directly from farmers in rural
markets and roadsides and finally sold to wholesalers, urban collectors, and exporters, depending

57
on best price offered. Every rural assembler added value, such as cleaning, and sorting. The
entire rural assemblers did not get any credit from banks but obtained credit from friends and
relatives. Rural assemblers fumigated, sorted, cleaned, and stored red beans for some time until
they got reasonable price in the market. The main sources of information on price of red bean
were customers, such as urban collectors, wholesalers, and exporters. They used their own
financial resources and their local knowledge to bulk red bean from farmers. The assemblers
used animal carts to collect red bean from the market. They used animal carts and trucks
(especially when selling to exporters). There was no contractual agreement between assemblers
and farmers and there was no contractual agreement between assemblers and their buyers. The
costs for rural assemblers were transportation, loading, and unloading, rent of store, fumigation,
cleaning and grading. Rural assemblers bought red bean directly from farmers at farm level and
sold to urban collectors, wholesalers and even exporters. Assemblers handled about 34,100 kg
of the total production. They paid ETB 4.1/kg and received ETB 5.4, 5.8 and 7.2/kg when they
sold to urban collectors, wholesalers and exporters respectively (Table 4.15). The total gross
margin for rural assemblers was 24.3, 29.7, and 43.3 percent of end buyer’s price in channel III,
IV and V respectively. Rural assemblers received higher net marketing margin when they sold to
exporters directly. The second channel with higher gross margin was when they directly sold to
wholesalers (Table 4.16).
(f) Wholesalers
The mean age, education level and trading experience of wholesalers were 49, 6.3 and 13.5
respectively. Wholesalers are traders who buy large quantities of red beans and resell to other
traders both in local and export markets. With regard to quantity handled, wholesalers were the
major actors, and channeled the produce to exporters and other wholesalers. These traders graded
the produce based on color and size. In HSD, 75 percent of the wholesalers sold red beans to
exporters and other markets outside the district, and 25 percent sold to other wholesalers within
the district. Wholesalers mainly used trucks for transportation. They had brokers in different
markets in and outside the district to assemble red beans for them. Wholesalers bought red bean
from farmers, urban collectors and rural assemblers and the remaining portion was satisfied
through their brokers. They played a significant role in price formation at the local level, based

58
on price information accessed from exporters. They also provided price information, credit to
selected reliable clients, and were in good position in accessing price information from exporters.
There was no contractual agreement between wholesalers and their suppliers with regard to red
bean trade. They had some informal contractual agreements with their buyers when wholesalers
sold their output to other traders on credit. The quantity handled by wholesalers was 805,000 kg
in 2012 and the price received was ETB 7.750/kg (Table 4.15). The cost incurred by the
wholesalers was on transportation, loading and offloading, rent of store, sorting, grading,
cleaning, and packaging. All wholesalers received credit from commercial banks and informal
sources (friends and relatives). Wholesalers total gross margin was 24.8, 34.8, 24.8, 24.8, and
24.8 percent of end buyer’s price in channel I, II, III, IV and VI respectively (Table 4.16).
(g) Exporters
Red bean exporters are the last marketing chain link in the domestic trade. The exporters had the
necessary capital, facilities, and knowledge. The terminal market was in Adama, the capital city
of Oromia Regional State, and Moyale, which is in the boarder of Ethiopia and Kenya. They
contributed to price formation for the wholesalers based on the price of international market.
(h) Consumers
For many people, particularly the medium to higher income urban consumers, beans are
considered a poor man’s or a farmer’s food crop. Majority of traders who did business in pulses
preferred selling chickpea, lentils, faba beans. In some towns white and red beans were sold in
the poorer section of the market where there were no fixed stalls (Ferris and Kaganzi, 2008).
Every farmer in the district produced red beans at least to feed his or her family, and sold the
surplus. Red beans were mainly consumed by the local people during harvesting of the crop, and
this is the time when most farmers faced shortage of food. Except boiling, farmers indicated that
they did not know of other ways to prepare different dishes of red beans. In the southern part of
the country the level of red bean consumption was about 9 to 15kg per year (ibid).
(i) Retailers
There were no data on red bean retailers because during the period of the survey all the retailers
had shifted from red bean retailing to trading in other commodities like teff, maize and red

59
pepper due to the seasonal nature of red bean market in HSD. The main red bean traders were
women, who sold beans in small lots such as cups (Ferris and Kaganzi, 2008).
4.6.3 Discussion
Red bean market participants used more land for the crop in comparison to their counterparts but
consumed less. Higher land allocation that resulted in higher production coupled with low
consumption might help market participants to participate in the market (Table 4.14). In the
district, there was contractual agreement between the primary cooperatives and the cooperative
union. Primary cooperatives were responsible of supplying quality red bean to the cooperative
union (HSDMD, 2012). In HSD, cooperative union in turn had a responsibility of buying what
the primary cooperative bought and sought for market and finally channeled it to better
rewarding markets. In the district, the cooperative union was given the assignment of working
with primary cooperatives, searching for markets, and bargaining with other traders, and
supplied to deficit markets outside the district. The government gave this assignment to the
cooperative union because they had better market information and bargaining power that
supported these primary cooperatives working in rural areas, with limited reliable market
information and bargaining power (HSDMD, 2012).
Along the red bean marketing chain, producers, brokers, urban collectors, rural assemblers,
wholesalers, primary cooperative and cooperative union were found to be the major market
actors. The producers mainly sold their red bean to urban collectors, rural assemblers, primary
cooperative, and wholesalers. Urban collectors bought higher quantity of red beans directly from
farmers and resold to wholesalers. Wholesalers handled huge quantity of red bean and sold it to
other markets outside HSD. They were the major actors in channeling red beans to markets
outside the district. This finding corroborates that of Mussema (2006) who found that in Alaba
Special District wholesalers were the major outlet of red pepper to other markets.
4.6.4 Marketing Arrangements of Red Beans in HSD
4.6.4.1 Marketing Costs and Margins
All the urban collectors interviewed had no intermediaries to buy red bean on their behalf.
However, all the wholesalers used intermediaries (brokers) who bought red beans on their behalf.
Among the rural assemblers, 92.3 percent bought red beans directly from producers and only 7.7

60
percent of them used intermediaries (brokers). The terms of payment for urban collectors to
supply red bean to the next marketing agent was cash whereas usually rural assemblers and
wholesalers sold red bean to exporters on credit. Traders bought red bean from producers on cash
basis. No contractual agreement was reported among the different actors except primary
cooperatives and the cooperative union.
The marketing costs of the traders included transportation cost, rent for store, packaging,
cleaning, sorting, grading, and brokerage (only for rural assemblers and wholesalers). From the
results it is observed that wholesalers incurred relatively higher marketing costs, which was
associated with intensive work on cleaning, sorting, grading, and long distance transportation to
sell the red bean to the next actors while urban collectors incurred the least marketing cost. The
urban collectors incurred the least marketing cost; the low market cost was because they did not
work intensively on cleaning, sorting, and grading. The selling price for farmers was different
within different marketing channels; the highest selling price was recorded when wholesalers
directly bought from farmers. When farmers sold their produce to wholesalers directly, they
incurred relatively higher costs because farmers did intensive cleaning and sorting activities
whenever they targeted selling their produce to wholesalers. When wholesalers bought red bean
directly from farmers they did not pay for brokerage, this reduce their marketing costs, hence
offered relatively higher price for farmers.
The total gross marketing margin (TGMM) was highest in Channel VI followed by channel III,
that accounted for 66.6 percent and 56.2 percent of the end buyer’s price, respectively. The result
reveals that producer’s share in end buyer’s price was less than 60 percent in all channels except
channels II. The analysis of total gross margins indicated that highest gross margin was accrued
by producers in all channels (Table 4.16).

61
Table 4.16: Marketing margins of traders for seven different channels
Margins (%) Marketing channels
I II III IV V VI VII
TGMM 41.07 34.84 56.17 54.45 43.29 66.59 41.82
GMMpco 21.32 21.32
GMMcou 20.50 20.50
GMMra 24.33 29.67 43.29
GMMuc 16.30 7.07
GMMwh 24.77 34.84 24.77 24.77 24.77
GMMp 58.93 65.16 43.83 45.55 56.71 33.41 58.18
Source: Survey data (2013)
Where, TGMM is total gross marketing margin, GMMpco is gross marketing margin of
primary cooperative, GMMcou is gross marketing margin cooperative union, GMMra gross
marketing margin of rural assemblers, GMMuc is gross marketing margin of urban collectors,
GMMwh is gross marketing margin of wholesalers, GMMp is gross marketing margin of
producers (farmers share).
4.6.4.2 Discussion
All the wholesalers who were interviewed responded that they had their own brokers who could
buy red beans on their behalf while all urban collectors did not have brokers. This could be
because wholesalers dealt with huge amount of red beans that could not be collected by only the
wholesalers themselves while urban collectors dealt with small amount of red beans and bought
directly from the farmers at the market place. Aysheshm (2007) found that in Ethiopia along
sesame market chain wholesalers used brokers and commission agents to collect sesame grain.
Jagwe (2011) reported that wholesalers of banana in Rwanda, Burundi and Democratic Republic
of Congo handle the largest volume of banana and have intermediaries who can collect banana
from different sources. Majority of rural assemblers bought red beans directly from farmers and
this is because rural assemblers are traders who live next to the farmer and buy directly from the
farmer. Aysheshm (2007) reported that in Ethiopia, along sesame value chain rural assemblers
buy small lots of sesame directly from farmers and sold to wholesalers and exporters. Farmers
received higher price when they sold directly to wholesalers. This could be because when

62
wholesalers buy red beans directly from farmers, then there is no cost of brokerage hence they
pay more. It is not simple for a given farmer to sell his/her produce directly to wholesalers
because brokers are always there blocking the way for farmers. This indicated that it is good for
farmers to sell their produce directly to wholesalers to get higher gross margin from their red
bean.
4.7 Major Constraints in Red Bean Production and Marketing in HSD
4.7.1 Major Production Constraints
Table 4.18 presents five major constraints experienced by red bean farmers were (i) incessant
price fluctuations (65.3 percent), (ii) access to improved seed (60 percent), (iii) access to credit
(62.7 percent), (iv) access to fertilizer (50 percent), and (v) inconsistent demand in the market
(66.7 percent). These results answered the research question constraints of farmers in red bean
production and constraints.

63
Table 4.17: Major production constraints experienced by red bean farmers in HSD
Constraints n Percent Constraints n Percent
Brokers Yes 100 66.7 Absence of demand Yes 58 38.7
No 50 33.3 No 92 61.3
Inconsistent
demand
Yes 99 66 Poor road Yes 56 37.3
No 51 34 No 94 62.7
Price
fluctuation
Yes 98 65.3 Shortage of labor Yes 37 24.7
No 52 34.7 No 113 75.3
Access to credit Yes 94 62.7 Shortage of land Yes 63 42
No 56 37.3 No 87 58
Access to
improved seed
Yes 91 60.7 Weak coordination
among actors
Yes 43 28.7
No 59 39.3 No 107 71.3
Ownership of
oxen
Yes 76 50.7 Transportation service Yes 33 22
No 74 49.3 No 117 78
Less return
Yes 75 50 Storage facility Yes 32 21.3
No 75 50 No 118 78.8
Access to
fertilizer
Yes 75 50 Sale tax Yes 31 20.7
No 75 50 No 119 79.3
Distance to
market
Yes 59 39.3 Access to price
information
Yes 30 20
No 91 60.7 no 120 80
Source: Survey data (2013)
According to the focus group discussion, brokers were major problem in the district as 66.7
percent of respondent farmers complained about them especially in Kulito and Guba markets. A
common problem facing farmers was the unfair trade practices imposed by brokers at the market
place. Farmers were cheated through incorrect weighing scales, and any protest from them would
trigger a rejection of their produce by these brokers. The brokers lured the farmers with ‘good
price’ and later allegedly adjusted the scales during measurement to give a low reading, hence
higher weight for the supposedly “good price.” The farmers were dissatisfied by the transaction
process leaving them feeling robbed by brokers who also altered the reading of the weighing

64
scales. The illicit transaction process was made hasty as the traders quickly mixed the red bean
with their bulk leaving the farmers with no power to file their complaints.
Price setting is a major problem of marketing in HSD. Farmers depend on traders’ price and
there is no room to negotiate with traders. During the focus group discussion farmers revealed
that traders and brokers set the price and it is usually unstable. In addition, there is no channel to
convey information directly from export markets to farmers since red bean is not among
commodities traded by ECX (Ethiopian Commodity Exchange). Out of the sample farmers, 50
percent reported that returns from red bean was very little and sometimes losses were higher than
benefits. According to the focus group discussion, farmers did not benefit much from red
production but still kept on producing because the crop is important in saving life during the
months of hunger (the period before maize maturity) commonly known to farmers as ‘bridge’.
The other reason that kept farmers in red bean production is that the crop matures faster and
farmers use the land that has been used for red bean again for teff meaning farmers use the land
twice in a year. Teff is a cash crop that is produced by all red bean farmers in the form of crop
rotation. The total gross margin analysis showed that farmers’ share was higher than those of all
the actors along the market chain of red bean (Table 4:16). Though farmers got highest market
share, because of high production costs farmers were not making much profit from the business.
Access to credit and improved seed was among the major constraints scoring 62.7 percent and 60
percent respectively. Solving such critical problems associated with farmers could improve the
livelihood of the producers in the district. Weak coordination among marketing actors,
transportation, sale tax and price information were among the constraints which were not critical
as they were reported as constraints by a few red bean producers (Table 4.17)
4.7.2 Major Marketing Constraints
The five major marketing constraints were (i) low quality of red bean supplied by producers, (ii)
price fluctuation, (iii) high number of informal traders, (iv) inconsistent supply, and (v) shortage
of finance (Table 4.18).

65
Table 4.18: Frequency of major red bean marketing constraints in HSD
Item n Urban
collector
n Rural
assemblers
n Wholes
alers
n Cooper-
atives
Price
fluctuation
Yes 11 91.7 11 91.7 3 75 4 100
No 1 8.3 1 8.3 1 25 0 -
Low quality Yes 11 91.7 10 83.3 3 75 4 100
No 1 8.3 2 16.7 1 25 0 -
Informal
traders
Yes 11 91.7 7 58.3 3 75 2 50
No 1 8.3 5 41.7 1 25 2 50
Access to
credit
Yes 9 75 8 66.7 3 75 4 100
No 3 25 4 33.3 1 25 0 -
Financial
capacity
Yes 9 75 11 91.7 4 100 3 75
No 3 25 1 8.3 0 - 1 25
Inconsistent
supply
Yes 10 83.3 10 83.3 3 75 2 50
No 2 16.7 2 16.7 1 25 2 50
Brokers Yes 8 66.7 10 83.3 1 25 0 -
No 4 33.3 2 16.7 3 75 4 100
Inconsistent
demand
Yes 8 66.7 11 91.7 3 75 3 75
No 4 33.3 1 8.3 1 25 1 25
Storage
facility
Yes 4 33.3 8 66.7 1 25 1 25
No 8 66.7 4 33.3 3 75 3 75
Weak
coordination
among actors
Yes 7 58.3 9 75 2 50 4 100
No 5 41.7 3 25 2 50 0 -
Distance to
market
Yes 3 41.7 3 41.7 1 25 1 25
No 9 58.3 9 58.3 3 75 3 75
price
information
Yes 4 33.3 5 41.7 0 - 2 50
No 8 66.7 7 58.3 4 100 2 50

66
Table 4.18 continued
Item n Urban
collector
n Rural
assemblers
n Wholes-
alers
n Cooper
-atives
Poor road
Facility
Yes 2 16.7 3 25 0 - 1 25
No 10 83.3 9 75 4 100 3 75
Transport
facilities
Yes 2 16.7 3 25 0 - 2 50
No 10 83.3 9 75 4 100 2 50
Sale tax Yes 2 16.7 8 66.7 1 25 0 -
No 10 83.3 4 33.30 3 75 4 100
Source: Survey data (2013)
Both assemblers and wholesalers reported that their financial capacity was among the major
constraints of marketing. All wholesalers stated that low quality red bean, price fluctuation,
access to credit, informal traders, and inconsistent demand and supply were the major constraints
in red bean marketing. During the FGDs, it was reported that the quality of red beans produced
in the district was very poor and it was recommended that the government or other concerned
organizations should give training to farmers on methods of threshing and storing red bean.
Traders reported that if the quality of red beans was improved, then farmers could eventually join
good market and make money from the business.
4.7.3 Discussion
The brokers exploited producers because the former were better informed about quality and price
information and farmers were obliged to sell for the price offered by brokers otherwise no power
to negotiate. Brokers were reported as challenges of not only red beans marketing but also red
pepper marketing in Alaba Special District (Mussema, 2006). Urban collectors reported that they
did not use intermediaries in buying or selling of red beans. This is related to high brokerage
cost, wrong price information and cheating about the quality of red beans. Few rural assemblers
used brokers in rural areas because the latter had better information about red bean sellers and
non-sellers. Ketema (2007) found that brokers abused sheep and goat farmers and brokers were
the major challenges of sheep and goat marketing in Halaba Special district in Ethiopia. It was
also reported that sheep and goat brokers requested high rate of commission or misinformed and
repelled purchasers.

67
All the wholesalers in HSD used intermediaries because of their huge demand on quantity of red
beans. For wholesalers to satisfy the huge demand, it was necessary to have brokers who bought
red beans on their behalf to satisfy the market demand. In the case of wholesalers, there were few
problems associated with brokers because wholesalers were better informed about price and
quality, had long trading experience and had strong social networks in the market that helped
them not to be victims of brokers (Mussema, 2006).
Traders reported inconsistent supply of red beans as a major challenge that influenced their trade
negatively. This implies that most red bean farmers did not have grain stores and hence sold their
produce soon after harvest thereby depressing prices. The other reason could be that most
farmers did not have credit sources and after harvesting, the produce was sold to fulfill other
family demands like school fees and settling credit that may have been taken during the red bean
production (Aysheshm, 2007).
There were a number of constrains that hindered traders not to be involved in the red bean
market. Among the traders, the main constraints were price fluctuation, low quality, informal
traders, limited financial capacity, and low access to credit. Due to low level of awareness about
red bean quality, farmers produced red beans with low quality. Mussema (2006) found that red
pepper traders faced constraints like credit in Alaba Special District and Silt District. Informal
traders were the other major challenge to formal and licensed traders of HSD. The problem was
serious because these informal traders had very strong linkage with brokers. As a result, licensed
traders had little access to red bean supply (JICA, 2012).
4.8 Factors Influencing Red Bean Farmers’ Market Participation and Extent of
Participation in HSD
4.8.1 Factors Influencing the Decision to Participate in Red Bean Market in HSD
The results of the study indicated that the model explained 66 percent of the variations in the
likelihood of red bean farmers’ market participation decision. In addition, the estimated
probability greater than chi-square value (Prob > chi-square = 0.0000), suggests that all the
model parameters were jointly significant in explaining the dependent variable at less than 1
percent significance level, indicating the goodness-of-fit of the model (see Appendix 9). Table
4.19 presents the maximum likelihood estimates for fitting equation 3.16 into the data.

68
As shown on Table 4.19 below, farmers’ decision to participate in the red bean market in HSD
was significantly and positively influenced by the price of red beans, quantity of red beans
produced, access to market information, ownership to transportation means, number of extension
visits, awareness of red bean quality standards and access to credit. On the other hand, the gender
of the household head had a significant but negative effect on farmers’ decision to participate in
the red bean market in HSD. Furthermore, family size positively influenced farmers’ market
participation decision. Age of household head, education, off-farm income, farm size, distance to
market, and cooperative membership had no effect on farmers’ decision to participate in the red
bean market. All the nine significant variables answered part of research question three,
indicating an improvement on them could result in an increase on red bean farmers’ market
participation decision in HSD.
As it was expected, gender of household head was significantly and negatively contributed (it
was coded as “1” for male and “0” for female) to red bean market participation decision (p =
0.019) (Table 4.19). The result implies that there is higher probability of red bean market
participation if the head of household is female. Currently the government of Ethiopia and
different NGOs within the country are providing gender specific training for farmers that might
help female farmers to have higher probability of red bean market participation. The result of the
study revealed that a shift from male-headed to female-headed household would increase the
probability of market participation by 1.4 percent. Gizachew (2005) found that in Ethiopia
female-headed households had a higher tendency to participate in the dairy market than male-
headed households. This is because in Ethiopia females are the ones who participate in the
processing of dairy products. Onoja et al. (2012) reported that in Nigeria female-headed
households had higher probability of fish market participation than male-headed households. The
gendered nature of the fish business comes from the fact that skills and tasks training for the
acquisition of knowledge is gender specific in the study area.

69
Table 4.19: Factors that influence farmers’ market participation - probit model result
Market participation decision Coefficients P-value Marginal
effects
Remarks
Demographic and socio-economic factors
Gender -1.089 (0.464) 0.019 -0.014 Significant
Age of household head -0.028 (0.025) 0.266 -0.0036 Insignificant
Family size 0.178 (0.084) 0.033 0.023 Significant
Years of education of household
head -0.031 (0.069) 0.655
-0.0039 Insignificant
Off-farm income -0.001 (0.001) 0.326 -0.000033 Insignificant
Ownership to transportation means 0.651 (0.388) 0.094 0.083 Significant
Farm level factors
Farm size -0.402 (1.450) 0.782 -0.051 Insignificant
Quantity of red bean produced 0.006 (0.002) 0.018 0.0007 Significant
Distance to market 0.061 (0.044) 0.164 0.0078 Insignificant
Institutional factors
Price 0.907 (0.365) 0.013 0.12 Significant
Number of extension visits per year 0.067 (0.033) 0.045 0.0085 Significant
Access to market information 4.197 (1.840) 0.023 0.54 Significant
Membership in a cooperative -0.094 (0.883) 0.916 -0.012 Insignificant
Access to credit 3.265 (1.892) 0.084 0.42 Significant
Awareness about bean quality
standard 0.686 (0.413) 0.097
0.087 Significant
Constant -9.186 (2.821) 0.001 0.12 Significant
Log likelihood = -34.58; Pseudo R2= 0.6631; LR Chi-square = 136.11;
Probability > Chi-square = 0.0000, Number of observations = 150
Source: Survey data (2013) ***, **, * = significant at 1, 5 and 10 percent respectively
As expected, the price of red beans turned out to be positively and significantly related to market
participation decision (p=0.013). A unit increase in the red bean price increased the probability

70
of farmers participating in the market by 12 percent. This suggests that price is among drivers
that encourage red bean farmers’ market participation decision in HSD. This is related to
farmers’ decision to sell when there is high price because they need to increase their income to
purchase other consumption items and production inputs. Price signals generated and transmitted
to active actors along the value chain can influence production and consumption decision of the
actors (Timmer, 1974). Onoja et al. (2012) found higher probability of fish market participation
with an increase on price of fish in Nigeria. The author justified that households with higher
expectation of making profits from price signals are more likely to participate in fish marketing
in the study area.
The quantity of red bean produced had a positive and significant influence as expected a priori
(p=0.018). The marginal effects revealed that a unit increase in the quantity of red beans
produced increased the probability of market participation by only 0.07 percent. This can be
explained by the fact that red bean is among the cash crops grown in HSD; the higher the
produce the higher the farmers’ motivation to sell more to generate more income. Additionally,
red beans were rarely consumed in the study area by urban dwellers. This finding tallies with that
of Mussema and Daniel (2012) who observed that in Ethiopia when farmers produce more
pepper, it motivates them to sell more. This is because, pepper is a cash crop for most of the
farmers, the higher the output, the higher is the farmer willing to participate in the market.
Holloways et al. (2000) also found that in Ethiopia an increase in the number of livestock
increased livestock farmers’ market participation decision.
As expected, access to market information positively and significantly influenced farmers’
market participation decision at (p = 0.023). A shift from lack of access to market information to
access of market information increased the probability of producers’ market participation
decision by 54 percent. Availability of market information that could be used by farmers
enhances market participation decision because market information will motivate farmers to plan
effectively on time and produce according to the market demand and hence increase market
participation decision. Aysheshm (2007) noted that in Ethiopia access to market information on
sesame significantly influenced farmers’ market participation decision. Additionally, Coetzee et
al. (2004) found that in SSA the availability of usable market information strengthens producers’
negotiating ability during transactions with buyers, and as a result, prevents possible exploitation

71
by better-informed buyers of the commodity. This eventually motivates producers to participate
in the market. Key et al. (2000) also found that access to price information increased maize
farmers’ market participation decision in Mexico. This is due to the fact that availability of
information reduces the cost of searching market information and encourages farmers to
participate in the market.
As shown in Table 4.19, ownership to a means of transport positively and significantly
influenced red bean farmers’ market participation decision (p = 0.094). A shift from lack of
means of transportation ownership to owning one increased the red bean farmers’ market
participation by 8.3 percent. This suggests that when farmers own transportation means, it
motivates them to produce surplus and participate in the market because they own the means of
transport to bring production inputs from the source and convey outputs to the market. The
findings corroborates that of Mathenge et al. (2010) who found that in Kenya, ownership of
means of transport had a positive and significant effect on the probability of farmers participating
in maize, roots and tuber crop markets. Alene et al. (2008) also found that in Kenya ownership of
means of transport positively and significantly influenced farmers’ market participation decision
because transportation equipment help producers to access production inputs from the source.
Family size had a positive and significant relationship with market participation decision (p =
0.033). The marginal effects of the variables indicate that a unit increase in family number
increased farmers’ market participation decision by 2.3 percent. Red bean production is labor
intensive; those households with large family sizes need less investment to hire labor for red
bean production because their family members can be used as a major source of labor. This
encourages farmers to produce surplus red bean and participate in the market. This finding tallies
with that of Somano (2008) in Ethiopia who found that labor force encouraged farmers’ milk
market participation. In Ghana, Martey et al. (2012) found that local farming communities had
large family sizes for agricultural purposes and that this labor force motivated them to participate
in cassava market. Lapar et al. (2002) found a decline in market participation among Philippines
smallholder milk producers with an increase in the number of household members. As the
number of family members increased, farmers might not have excess milk to participate in the
market.

72
As expected a priori, an increase in the number of extension visits significantly and positively
affected farmers’ market participation decision (p = 0.045). The marginal effect result indicated
that an extra extension visit would increase the likelihood of farmers participating in the red bean
market by 0.9 percent. This could be attributed to the fact that an increase in the number of
extension visits would avail up to date information regarding agricultural technologies that might
improve productivity and therefore increase the marketable surplus. The finding corroborates
that of Negash (2007) who found that frequent extension visits increased the likelihood of
adoption of improved haricot beans in Alaba Special District of Ethiopia. The authors reasoned
that frequent extension visits provided current information and this made the farmers conscious
of production and production techniques of the commodity.
As expected, awareness about red bean quality standards positively and significantly influenced
the probability of red bean farmers participating in the market (p = 0.097). A shift from lack of
awareness of red bean quality standards to awareness about the quality standards increased the
likelihood of farmers participating in the red bean market by 8.3 percent. This implies that when
farmers’ expertise on quality standards of red beans increased, it enhanced their market
participation decision. This is because when farmers obtain knowledge on quality standards
demanded by the customers they can produce according to quality requirements and participate
in the market. Reardon and Barrett (2000) argue that product grades and standards were among
the bottlenecks for smallholder farmers leading them to exclusion from participating in the
market. Djalalou et al. (2012) also argued that strict quality standards requirements suppressed
the amount of pineapples exported from Benin to two percent of the total production, indicating
that quality standards limited pineapple farmers’ market participation decision. Furthermore, it
was reported that in New Jersey State University, the buying decision of 63 percent of consumers
was based on product quality, indicating how quality hinders farmers’ market participation
decision (Govindasamy et al., 1998).
As expected, access to credit positively and significantly influenced the likelihood of farmers in
HSD participating in red bean market (p = 0.084). A shift from lack of credit to access of the
same increased the probability of market participation by 42 percent (Table 4.19). This could be
attributed to credit accessibility that allows farmers to purchase agricultural inputs like fertilizers,
improved seeds and other production-enhancing technologies, which increase production and

73
therefore the marketable surplus. Credit is among the major constraints that hinder red bean
production and hence farmers’ market participation decision. Red bean farmers might have
liquidity constraints to buy inputs like improved seeds and other production inputs that determine
red bean productivity. Wolday (1994) reported that in Ethiopia marketing systems were
constrained by limited access to credit. Randela et al. (2008) also found that access to credit had
a positive and significant impact on producers’ likelihood to participate in cotton market in South
Africa, because availability of credit reduces transaction costs of both in input and output
markets.
4.8.2 Factors Influencing the Extent of Red Bean Market Participation in HSD
The results of second-stage Heckman selection estimation for the level of participation are given
in Table 4.20. The coefficient of Mills ratio (Lambda) in the Heckman two-stage estimation is
significant at the probability of less than 5 percent. This indicates sample selection bias,
existence of some unobservable farmer characteristics determining farmer’s likelihood to
participate in red bean market and thus affecting the level of participation. The goodness of fit
for the second stage (OLS) was assessed using adjusted R-squared (Martin, 2012). The adjusted
R-squared is 0.47, indicating that 47 percent of the variations on dependent variable (extent of
red bean market participation) was explained by the independent variables (see Appendix 9).
As shown in Table 4.20, ownership of means of transport, quantity of red beans produced and
price of red beans positively and significantly influenced the extent of market participation
among the respondents. On the other hand, family size had a negative but significant effect on
the extent of market participation. Out of the fifteen variables analyzed in this study, only four
significantly influenced red bean farmers’ extent of market participation, and this enabled
answering part of the third research question of the study.
Family size had a negative but significant effect on the quantity of red bean supplied to the
market at probability level of p = 0.004. The negative sign indicates that as the family size
increases the quantity marketed would be decreased. This could be because a big family size
increases the quantity of red bean needed for home consumption thereby reducing the marketable
surplus. A unit increase in family size would reduce the amount of red beans to be sold by 12.30
kg (Table 4.20). This finding corroborates that of Gani and Adeoti (2011) who found that an

74
increase in family size reduced the amount of cassava sold in Nigeria. It was justified that an
increase in family size is an increase on the number of mouse, which reduces marketable surplus.
Table 4.20: Factors influencing the extent of farmers’ participation in red bean market in HSD
Variable Coefficients t-ratio Remarks
Gender 4.397 (27.419) 0.873 Insignificant
Age of household head 1.354 (1.304) 0.299 Insignificant
Family size -12.302 (4.274) 0.004*** Significant
Education level of household head -1.123 (3.450) 0.745 Insignificant
Off-farm income (ETB) 0.014 (0.009) 0.131 Insignificant
Ownership to transportation means 64.454 (22.569) 0.004*** Significant
Farm level factors
Farm size (ha) 19.743 (41.370) 0.633 Insignificant
Quantity of red bean produced (Kg) 0.762 (0.053) 0.000*** Significant
Distance to market (Km) -0.848 (2.649) 0.749 Insignificant
Institutional factors
Price 33.578 (18.678) 0.072* Significant
Access to Market information 82.987 (53.444) 0.120 Insignificant
Access to credit 7.283 (37.934) 0.848 Insignificant
Membership in a cooperative 11.007 (24.882) 0.658 Insignificant
Awareness on red bean quality
standards 38.631 (29.283) 0.187
Insignificant
Constant -324.960 (105.76) 0.002*** Significant
Inverse Mills Ratio 59.558 (25.817) 0.021** Significant
Rh0 = 0.718; Sigma = 82.977; Wald chi2 (14) = 806.89;
probability >Chi-square = 0.0000; Number of observation = 150;
censored = 65; uncensored = 85
Source: Survey data (2013) ***, **, * = significant at 1, 5 and 10 percent respectively

75
As hypothesized a priori, ownership of means of transport positively and significantly
influenced the extent of red bean farmers’ market participation at (p = 0.004). Thus, a shift from
lack of ownership to ownership of a means of transport would increase the extent of farmers
participating in the red bean market by 64.5 kg (Table 4.20). This is because after production
farmers are constrained by transport cost and households with own transport would sell more
because ownership of means of transport would reduce transportation cost that constrains them.
This finding corroborates that of Gebremedhin and Jaleta (2012) who found that ownership of
equines as a means of transport increased market participation because of equines reduce
marketing costs. Mathenge et al. (2010) also found that the quantity of maize sold was positively
related with ownership of transport equipment in Kenya. This is because ownership of
transportation means reduce costs of transporting output from farm to market. Key et al. (2000)
also found that ownership of a means of transport reduced variable transaction costs thus
increasing the extent of market participation among Mexican maize farmers.
As was hypothesized, the amount of red bean produced was positively and significantly related
to extent of red bean market participation (p = 0.000). A unit increase in the quantity of red beans
produced would lead to a 0.79 kg increase in the quantity of red beans supplied to the market
(Table 4.20). Those farmers who produced more also sold more, which is consistent with
expectation. The findings of this study are consistent with that of Negassa (2009) also found that
an increase in the quantity of milk produced in Ethiopia increased extent of market participation.
Moreover, higher productivity could drive market participation because farmers with high
productivity have surplus to participate in the market, ceteris paribus (Rios et al., 2008).
As was expected a priori, the price of red beans was positively associated with the quantity of
red bean supplied to the market (p = 0.072). This reflects the law of supply, namely, ceteris
paribus as the price of a good rises, the quantity supplied rises (Mas-Colell et al., 1995). A unit
increase in the price increased the quantity of red bean sold by 33.6 kg (Table 4.20). This could
be due to higher prices received by the red bean producers that generated more profits for the
business. The results are consistent with Mathenge et al. (2010) who found that in Kenya, when
tea, coffee, and sugarcane prices increased, the quantity sold also increased. This is justified as
higher output price acts as an incentive to sell. Key et al. (2000) found that in Mexico, a one

76
percent increase in the selling price of maize increased the probability that households sell by
0.77 percent. In Mexico an increase in price of maize motivates farmers to sell more.

77
CHAPTER 5
SUMMARY, CONCLUSIONS AND POLICY RECOMMENDATIONS 5.1 Summary
In Ethiopia, pulses are important food and cash crops that play a crucial role in the country’s
economy. They improve farmers’ food security, and are an affordable source of protein diet in
the country. There is a wide range of common beans in Ethiopia. Red and white beans are the
main commercial varieties with increasing market demand both locally and internationally.
Although there is huge local and international demand for quality red bean, the country is unable
to meet the demand in international market whereas there is huge un-marketed production in the
country. This is aggravated by low market participation of smallholder red bean producers.
The study was conducted in HSD of SNNPR administrative region. The District was chosen
because of low smallholder market participation among red bean producers despite its huge
production. The main purpose of this study was to examine the factors determining the market
participation of smallholder farmers, and the constraints of traders and cooperatives in the red
bean market chain in the District. A multi-stage sampling procedure was employed in order to
draw a sample from red bean producers. In order to get the sample of traders, stratified sampling
was employed. Descriptive and econometric models were used to identify factors and to what
extent those factors influenced farmers’ likelihood to participate in red bean market in HSD.
The descriptive statistics revealed that among the sampled farmers, 56.6 percent were red bean
market participants. Significant differences were recorded among red bean market participants
and non-participants in terms of education level, family size, farming experience, membership to
cooperative, awareness of quality standards, access to field demonstrations, access to market
information, and ownership of means of transport.
The major red bean market actors were producers, primary cooperatives, cooperative unions,
rural assemblers, wholesalers, exporters, urban collectors, and brokers. There were eight major
red bean market channels in HSD. The major marketing limitation of red bean producers, traders,
and cooperatives were found. It was noted that wholesalers had higher education level and
trading experience compared to urban collectors and rural assemblers. Wholesalers used
intermediaries in buying red beans and all traders made payments in cash to farmers. In red bean

78
marketing, color, size, variety, shrinkage, and breakage were main criteria used in grading the
commodity.
The first stage results of the Heckman two-stage model (participation decision stage) showed
that out of the fifteen variables hypothesized to influence red bean farmers’ market participation
decision, nine were statistically significant. The factors that significantly and positively
influenced the likelihood of farmers participating in the red bean market were price, ownership
of means of transport, number of extension visits per year, quantity of red bean produced,
awareness about quality standards, market information, access to credit and family size. The
result indicated that increase in the values of the variables also increased market participation
decision of red bean farmers. Gender negatively but significantly influenced red bean market
participation, indicating that female-headed households were more likely to participate in red
bean marketing than their male-headed counterparts. In the second stage (extent of participation
decision), only four out of fourteen factors were statistically significant. The positive ones were
red bean price, ownership of means of transport and quantity of red beans produced. Thus an
increase in any of these variables increased the extent of market participation. Only family size
negatively influenced extent of red bean market participation among the survey respondents.
This implies that an increase on family size would reduce the extent of market participation. This
is due to an increased number of family members who fed on the crop.
5.2 Conclusion
In Ethiopia, there is huge potential for red bean production and marketing. In Halaba Special
District, there were seven major red bean marketing channels and among the channels farmers
received highest gross marketing margins in channel two, where farmers sell directly to
wholesalers. In the district, six major market actors were identified such as farmers, urban
collectors, wholesalers, rural assemblers, primary cooperatives and cooperative union.
In Halaba Special District, farmers red bean production and marketing constraints were
identified to be brokers, price fluctuation, access to improved seeds, and access to credit. Traders
and cooperatives reported that their constraints in the red bean marketing were low quality red
bean, informal traders, price fluctuation and shortage of credit. Therefore, improving both red
bean production and marketing could improve livelihood of the farmers.
79
The important role of red bean quantity produced was explained through its significant influence
on market participation decision and the extent of market participation, indicating the need for
enabling environment for increasing smallholders’ ability to produce quality red beans. Credit
was a crucial factor that influenced red bean farmers’ market participation decision. This implies
that availability of credit especially during planting could encourage farmers to produce surplus
and participate in the market. This is suggestion derives from the fact liquidity was among the
major challenges cited by farmers that constrain production.
Improving access to red bean market information appears important in market participation
decision as well as the extent of market participation. Reliable information and information
presented in an understandable manner is most valuable. Ownership of a means of transport
among producers eased the transportation costs and therefore positively influenced both market
participation decision and extent of market participation.
5.3 Recommendations
1. There should be a strong emphasis on creating good market networks and linking farmers to
reliable markets information. Both government and non-government actors should invest on
linking farmers to different information sources to enhance farmers’ access to information on
price, good husbandry practices, quality standards, and market demand. Because red beans are
among the commodities with an increasing acreage in the study area, links should be created
between producers and market information channels. This can be done either by assigning
marketing specialists to work at a fee for farmers at the district level or through registering the
crop under the Ethiopian Commodity Exchange (ECX) in which market information can be
delivered directly from ECX to farmers as it applies coffee, white beans, and sesame.
2. This study showed that awareness on quality standards and number extension contacts per
year significantly influenced the probability of farmers’ participating in the red bean market.
Thus, the government and/or private sector players (e.g., traders, exporters, etc) should train
farmers on quality standards of red beans demanded by consumers. Training on production and
post-harvest handling techniques could address this challenge. Strong extension intervention is
vital to assist farmers in producing high quality red beans and increase production through
consistent follow up, and keeping of farm records.

80
3. During the survey farmers, urban collectors and rural assemblers complained that brokers
were the major challenge in red bean marketing. There is an urgent need for government
intervention with regard to Halaba Kulito and Guba market brokers’ activities. It is critical to
formulate rules and regulations for brokers working along the value chain of red beans in the
district. Specifically, red bean farmers are victims of brokers’ habits and the District Agricultural
and Rural Development and Marketing Departments should work together with red bean farmers
to harmonize the operations of brokers along the chain.
4. The amount of red bean produced positively influenced market participation decision and
extent of market participation. Hence, policies that would improve farmers’ red bean production
capacity such as supply of improved seeds and credit to farmers should be explored.

81
REFERENCES
Alene, A.D., Manyong, V.M., Omanya, G., Mignouna, H.D., Bokanga, M., and Odhiambo, G,
(2008). Smallholder market participation under transactions costs: Maize supply and
fertilizer demand in Kenya. Food Policy, 33:318–328.
Ayelew, M.A, (2011). Factors affecting adoption of improved haricot bean varieties and
associated agronomic practices in Dale Woreda, SNNPR. Unpublished M.Sc. thesis,
Hawassa University, Ethiopia.
Aysheshm, K, (2007). Sesame market chain analysis: the case of Metema Woreda, North Gondar
Zone, Amhara National Regional State. Unpublished M.Sc. thesis, Haramaya University,
Ethiopia.
Barret, B.C, (2008). Smallholder market participation: Concepts and evidence from Eastern and
Southern Africa. Food Policy, 33:299–317.
Baum, F.C., Heriot, S.M., Stillman, S, (2003). Instrumental variables and GMM: Estimation and
testing. Working paper No 545. Botson College Department of Economics.
Bindera, J, (2009). Analysis of Haricot bean production, supply, demand, and marketing issues
in Ethiopia, Ethiopian Commodity Exchange Authority (ECX), Economic Analysis
Team, Addis Ababa, Ethiopia.
Birachi, E.A., Ochieng, J., Wozemba, J., Ruraduma, C., Niyuhire, M.C., and Ochieng, D,
(2011). Factors Influencing Smallholder Farmers’ Beans Production and Supply to
Market in Burundi. African Crop Science Journal, 19:335-342.
Bisschop, A., and Dijk, G. J, 2007. Market Study on Maize and Haricot Beans in Ethiopia.
Research Report on Ethiopian Beans.
Blaylock, J. R., and Blisard, W. N, (1993). Women and the demand for alcohol: estimating
participation and consumption. Journal of Consumer Affairs, 27(2):319-324.
Central Statistics Authority, (2008). Area and Production of Major Crops. Statistical Bulletin,
Addis Ababa, Ethiopia.

82
Central Statistics Authority, (2011). Area and Production of Major Crops. Statistical Bulletin,
Addis Ababa, Ethiopia.
CII (Chemonics International Inc), (2010). Staple foods value chain analysis in Ethiopia.
USAID, the competitiveness and trade expansion program, country report, Addis Ababa,
Ethiopia.
Cochran, W.G, (1963). Sampling techniques, 2nd ed., New York: John Wiley and Sons, Inc.
Coetzee, L., Montshwe, B.D., and Jooste, A, (2004). Livestock Marketing: Constraints,
challenges and implications for Extension Services. Paper presented at the 38th
Conference of the South African Society for Agricultural Extension.
Co-SAERSAR, (1997). Commission for Sustainable Agriculture and Environmental
Rehabilitation project in Southern Administrative Region, Project Report.
Djalalou, D.A.A., Stefano, P., Anita, R. L., Ousmane, C., Geoffrey, H., and Onno, S.F.W. O,
(2012). Market Channel participation of Smallholder Pineapple Farmers in Benin. Las
Vegas International Academic Conference, Nevada USA.
ERCA (Ethiopian Revenue and Customs Authority), (2008). Customs Tariff Book, Volume I,
Addis Ababa, Ethiopia.
Faostat, (2013). Fao.org/site/291/default.aspx, (http://www. faostat).
Ferris, S., and Kaganzi, E, (2008). Evaluating Marketing Opportunities for Haricot beans in
Ethiopia. IPMS (Improving Productivity and Market Success) of Ethiopian Farmers
Project Working Paper 7. ILRI (International Livestock Research Institute), Nairobi,
Kenya.
Gani, B.S., and Adeoti, A.I, (2011). Analysis of Market Participation and Rural Poverty among
Farmers in Northern Part of Taraba State, Nigeria. Department of Agricultural
Economics, University of Ibadan, Ibadan. Oyo State. Nigerian Journal of Economics,
2(1):23-36.
Gebremedhin, B., and Hoekstra, D, (2007). Cereal Marketing and Household Market
Participation in Ethiopia: The Case of Teff, Wheat and Rice. International Livestock

83
Research Institute (ILRI) Addis Ababa, Ethiopia. AAAE Conference Proceedings, 243-
252.
Gebremedhin, B., and Jeleta, M, (2010). Commercialization of Smallholders: Is Market
Participation Enough? Contributed Paper presented at the Joint 3rdAfrican Association of
Agricultural Economists (AAAE) and 48th Agricultural Economists Association of South
Africa (AEASA) Conference, Cape Town, South Africa, September 19-23, 201.
Gebremedhin, B., and Jalata, M, (2012). Market Orientation and Market Participation of
Smallholders in Ethiopia: Implications for Commercial Transformation. Paper presented
at International Association of Agricultural Economists (IAAE) Triennial Conference,
Foz do Lguacu, Brazil.
Gidago, G., Beyene, S., and Worku, W, (2011). The response of haricot beans (Phaseolus
vulgaris L) to phosphorus application on ultosoil at Areka, Southern Ethiopia. Journal of
Biology, Agriculture and Healthcare, 1(3):2224-3208.
Gizachew G, (2005). Dairy Marketing Patterns and Efficiency: The Case of Ada’ Liben District,
Eastern Oromia., Unpublished M.Sc. Thesis, Haramaya University, Ethiopia.
Goetz, S. J, (1992). A Selectivity model of household food marketing behavior in Sub- Saharan
Africa. American Journal of Agricultural Economics, 74(2):444-452.
Govindasamy, R., Zurbriggen, M., Italia, J., Adelaja, A., Nitzsche, P., and VanVranken, R,
(1998). Farmers’ Markets: Consumer Trends, Preferences, and Characteristics. The State
University of New Jersey. Agricultural Marketing Service, United States Department of
Agriculture Markets Division, New Jersey.
Greene, W. H, 2003. Econometric Analysis. 5th ed. Upper Saddle River, NJ: Prentice
Hall.
Gujarati, D. N, (2004). Basic Econometrics, 4th ed. The McGraw-Hill Companies. 1003pp.
Haddad, L. J. and Bouis, H.E, (1990). Agricultural commercialization, nutrition and the rural
poor: A study of Philippine farm households. International Food Policy Research
Institute (IFPRI), Washington, DC.

84
Heckman, J.J, (1979). Sample selection bias as a specification error, Econometrica, 47, 153-161.
Holloway, G.C., Nicholson, C., Delgado, C., Staal, S., and Ehui, E, (2000). How to make milk
market: A case study from Ethiopian high lands. Socio-economic and Policy Research
Working Paper 28. ILRI, Nairobi, Kenya. 85pp.
HSDMD, (2012). Agricultural production and marketing survey in Halaba special district, in
Southern Nation and Nationality People Region, Annual Report.
IPMS (Improving Productivity and Market Success) of Ethiopian Farmers. (2005). “Alaba Pilot
Learning Woreda Diagnosis and Program Design.” www.ipms-ethiopia.org.
Jagwe, J., N, (2011). The impact of transaction costs on the participation of smallholder farmers
and intermediaries in the banana markets of Burundi, Democratic Republic of Congo and
Rwanda. PHD dissertation, University of Pretoria, South Africa. 120pp.
Jayne, T.S., Mather, D., and Mghenyi, E, (2005). Smallholder farming in difficult circumstances:
Policy issues for Africa. MSU International Development Working Paper No. 86, 2006.
Department of Agricultural Economics and the Department of Economics, Michigan
State University, East Lansing, Michigan 48824-1039, U.S.A.
JICA, (2012). Strengthening Agricultural Marketing System in Southern Nation’s Nationality
and Peoples’ Region, Ethiopia, Volume 1, Draft Final Project Report-Unpublished.
Katungi, E., Horna, D., Gebeyehu, S., and Sperling, L, (2011). Market access, intensification and
productivity of common beans in Ethiopia: A microeconomic analysis. African Journal of
Agricultural Research, 6(2):476-487.
Ketema K.T, 2007. Production and marketing systems of sheep and goats in Alaba, Southern
Ethiopia. Unpublished M.Sc. Thesis Hawassa University, Ethiopia.
Key, N. E., Sadoulet, E., and Janvry, A, (2000). Transaction costs and agricultural household
supply response. American Journal of Agricultural Economics, 82(2):245–259.
Lapar M.L., Holloway, G., and Ehui, S, (2002). Policy options promoting market participation
of smallholder livestock producers: A case study from the Philippines. Socio-economic

85
and Policy Research Working Paper 47. International Livestock Research Institute),
Nairobi, Kenya.
Legesse, D., Kumssa, G, Assefa, T., Taha, M., Gobena, J., Alemaw, J., Abebe, A., Mohhamed,
A., and Terefe, H, (2006). Production and Marketing of White Pea Beans in the Rift
Valley, Ethiopia. A Sub-Sector Analysis. National Bean. Research Program of the
Ethiopian Institute of Agricultural Research.
Maddala, G.S, (1983). Limited Dependent and Qualitative Variables in Econometrics.
Cambridge University Press.
Martey, E., Ramatu, M.A., and John, K.M.K, (2012). Commercialization of smallholder
agriculture in Ghana: A Tobit regression analysis. African Journal of Agricultural
Research, 7(14):2131-2141.
Martin, G.K, (2012). Assessing the fit of regression models. Cornell statistical consulting unit,
Newsletter.
Mas-Colell, A., Whinston, D.M., and Green, R.J, (1995). Microeconomic Theory. Oxford
University Press.
Masuku, M. B., Makhura, M.T., and Rwelarmira, J. K, (2001). Factors affecting marketing
decisions in the maize supply chain among smallholder farmers in Swaziland, Agrekon:
Agricultural Economics Research, Policy and Practice in Southern Africa, 40(4): 698-
707.
Mathenge, M., Frank, P., Olwande, J., and Dagmar, M, (2010). Market Participation among Poor
Rural Households in Kenya. World Agroforestry Center, Tegemeo Institute of
Agricultural Policy and Development, Egerton University and World Agroforestry
Center, Study report.
Mendoza, G, (1995). A Primer on marketing channels and margins. Lyme Rimer Publishers
Inc., USA. 425pp.
MARD, (2011). Annual Statistical Bulletin, 2011 Budget year and main agricultural products
and export performance annual statistical bulletin, Ethiopia.

86
Montshwe, B.D, (2006). Factors affecting participation in mainstream cattle markets by Small-
scale cattle farmers in South Africa. M.Sc Thesis, University of Free State Bloemfontein
Mussema, R, (2006). Analysis of red pepper marketing: the case of Alaba and Silte in SNNPRS
of Ethiopia. Unpublished M.Sc. thesis, Haramaya University, Ethiopia.
Mussema, M., and Dawit, A, (2012). Red pepper marketing in Siltie and Alaba in SNNPRS of
Ethiopia: factors affecting households' marketed pepper. International Research Journal
of Agricultural Science and Soil Science, 2(6):261-266.
Negash, R, (2007). Determinants of adoption of improved haricot beans production package in
Alaba Special Woreda, Southern Ethiopia, Unpublished M.Sc. thesis, Haramaya
University, Ethiopia.
Negassa, A, (2009). Improving smallholder farmers’ marketed supply and market access for
dairy products in Arsi Zone, Ethiopia. Research Report 21. ILRI (International Livestock
Research Institute), Nairobi, Kenya. 107 pp.
Onoja, O.A; Usuroh, B.B; Adieme, T.D; and Deedam, J.N, (2012). Determinants of Market
Participation in Nigerian Small-Scale Fishery Sector: Evidence from Niger Delta
Region. The Journal of Sustainable Development 9(1): 69 – 84.
Randela1, R; Alemu, G.Z; and Groenewald, A.J, (2008). Factors enhancing market participation
by small-scale cotton farmers. Agrekon, 47(4): 451-469.
Reardon, T., and Barrett, C, (2000). Agro-industrialization, globalization, and international
development: an overview of issues, patterns, and determinants. Journal of Agricultural
Economics, 23:195-205.
Reardon, T, and Timmer, C.P, (2005). Transformation of Markets for Agricultural Output in
Developing Countries Since 1950: How Has Thinking Changed? Handbook of
Agricultural Economics. Amsterdam, the Netherlands.
Rios, A. R., William, A. M and Gerald, E, (2008). Linkages between Market Participation and
Productivity: Results from a Multi-Country Farm Household Sample Prepared for

87
presentation at the American Agricultural Economics Association, Annual Meeting,
Orlando, Florida, July 27-29, 2008.
Rubatzky, V.E., and Yamaguch, M, (1997). World Vegetables: Principles, Production, and
Nutritive Values. 2nd ed. Chapman & Hall. New York, USA. 843pp.
Ruben, R., Boekel, V. A., Tilburg, V., and Trienekens, J (eds), (2007). Tropical food chains:
Governance regimes for quality management. Wageningen Academic Publishers.
Wageningen, the Netherlands.
Scott, J., (1995). Price Products, and People Analyzing Agricultural Markets in Developing
Countries, Lynne Rinner Publisher, London. 498pp.
Singh, I., Squire, L., & Strauss, J, (1986). Agricultural Household Models Extensions,
Application and Policy. Boltimore: The Johns Hopkins University press.
Singh, V., and Rai, K.N, (1998). Economics of production and marketing of Buffalo milk in
Haryana. Indian Journal of Agricultural Economics, 53(1):43-52.
Shahidur, R., Chilot, Y., Befekadu, B., and Solomon, L, (2010). Pulse value chain in Ethiopia;
constraints and opportunities for enhancing exports. International Food Policy Research
Institutes (IFPRI), working Paper 1.
Smith, D.L, (1992). Costs, Margins and Returns in Agricultural marketing. Marketing and
agribusiness development paper No 1. Marketing and rural finance service (AGSM)
agricultural services division food and agriculture organization, Rome.
Somano, W, (2008). Dairy marketing chains analysis: The case of Shashemane, Hawassa and
Dale District’s milk shed, Southern Ethiopia. Unpublished M.Sc. thesis, Haramaya
University, Ethiopia.
Storck, H., Emana, B., Adnew, B., Borowiccki, A., and W/Hawariat, S, (1991). Farming
Systems and resource economics in the tropics: Farming system and farm management
practices of smallholders in the Hararghe Highland. Volume-II, Wissenschaftsverlag
Vauk, Kiel, Germany.

88
Timmer, C.P, (1974). A model of price marketing margin in Indonesia. Food Resenen Institute
Study, 13(2):145-167.
Tshiunza, M., Lemchi, J., and Tenkouano, A, (2001). Determinants of Market Production of
Cooking Banana in Nigeria. Journal of African Crop Science, 9(3):537-547.
UNIDO (United Nations Industrial Development Organization), (2006). Product quality: A guide
for small and medium-sized enterprises. Working paper.
Wolday, A, (1994). Food Grain Marketing Development in Ethiopia after Reform 1990. A Case
Study of Alaba Siraro. The PhD Dissertation Presented to Verlag Koster University.
Wooldridge, J, (2002). Econometric Analysis of Cross-Section and Panel Data. Massachusetts:
The MIT Press. World Bank, 2008. World Bank Development Report.
World Bank, (2008). “Agriculture for Development”. World Development Report 2008.
Washington: World Bank.
Wortmann, C.S, (2006). Building competitiveness in Africa’s agriculture: a guide to value chain
concepts and applications. World Bank Publications.
Yaynabeba, A., and Tefera, T, 2013. Factors influencing market participation decision and extent
of participation of haricot bean farmers in Meskan District. International Journal of
Management and Development Studies, 2(6): 17-26.
Zeberga, A, (2010). Analysis of poultry market chain: the case of Dale and Alaba “Special”
Woredas of SNNPRS, Ethiopia. Unpublished M.Sc. Thesis, Haramaya University,
Ethiopia.
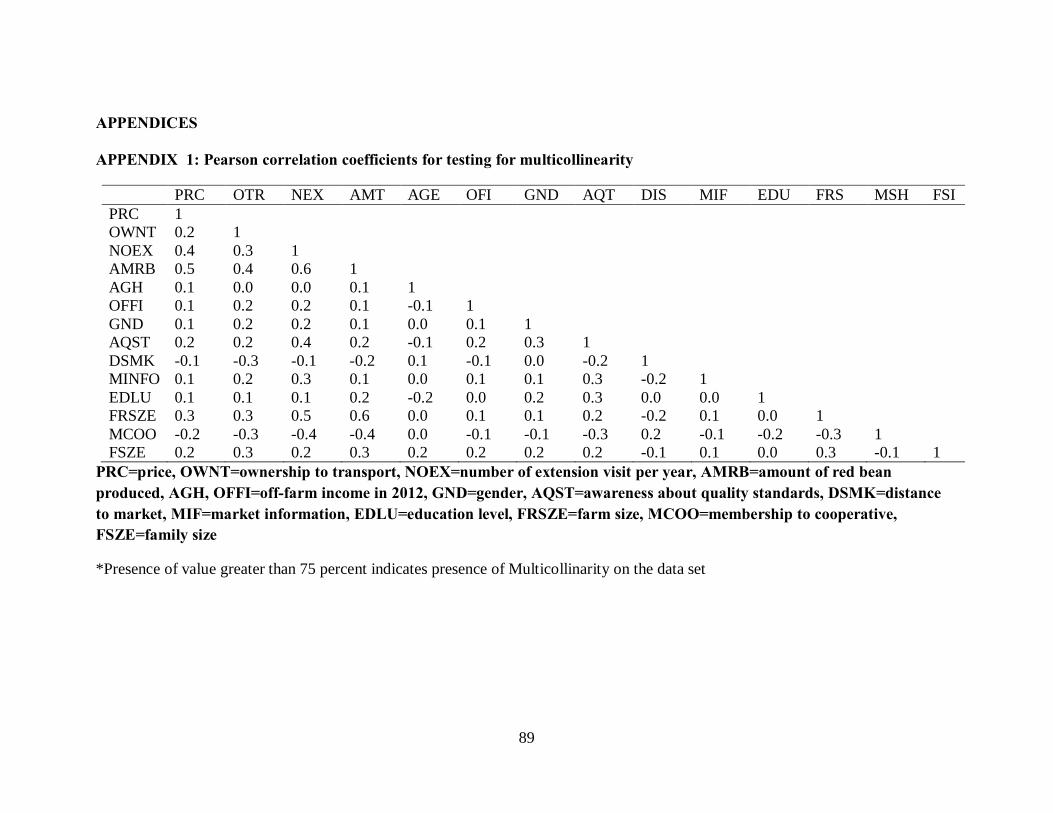
89
APPENDICES
APPENDIX 1: Pearson correlation coefficients for testing for multicollinearity
PRC OTR NEX AMT AGE OFI GND AQT DIS MIF EDU FRS MSH FSI PRC 1 OWNT 0.2 1 NOEX 0.4 0.3 1 AMRB 0.5 0.4 0.6 1 AGH 0.1 0.0 0.0 0.1 1 OFFI 0.1 0.2 0.2 0.1 -0.1 1 GND 0.1 0.2 0.2 0.1 0.0 0.1 1 AQST 0.2 0.2 0.4 0.2 -0.1 0.2 0.3 1 DSMK -0.1 -0.3 -0.1 -0.2 0.1 -0.1 0.0 -0.2 1 MINFO 0.1 0.2 0.3 0.1 0.0 0.1 0.1 0.3 -0.2 1 EDLU 0.1 0.1 0.1 0.2 -0.2 0.0 0.2 0.3 0.0 0.0 1 FRSZE 0.3 0.3 0.5 0.6 0.0 0.1 0.1 0.2 -0.2 0.1 0.0 1 MCOO -0.2 -0.3 -0.4 -0.4 0.0 -0.1 -0.1 -0.3 0.2 -0.1 -0.2 -0.3 1 FSZE 0.2 0.3 0.2 0.3 0.2 0.2 0.2 0.2 -0.1 0.1 0.0 0.3 -0.1 1
PRC=price, OWNT=ownership to transport, NOEX=number of extension visit per year, AMRB=amount of red bean produced, AGH, OFFI=off-farm income in 2012, GND=gender, AQST=awareness about quality standards, DSMK=distance to market, MIF=market information, EDLU=education level, FRSZE=farm size, MCOO=membership to cooperative, FSZE=family size
*Presence of value greater than 75 percent indicates presence of Multicollinarity on the data set

90
APPENDIX 2: The results of variance Inflation factor (VIF) analysis
Variable VIF 1/VIF
AMRB 2.75 0.362988
FRSZE 1.97 0.506383
NOEX 1.90 0.527318
AQST 1.51 0.661777
OWNT 1.40 0.715510
PRC 1.40 0.716374
MCOO 1.38 0.725164
FSZE 1.35 0.742039
MINFO 1.31 0.763502
DSMK 1.24 0.806057
EDLV 1.20 0.831461
AGH 1.18 0.848580
GND 1.16 0.864771
OFFI 1.15 0.871957
ACICR 1.14 0.879703
Mean VIF 1.47
*VIF value greater than 10 indicates presence of Multicollinarity on the data set

91
APPENDIX 3: Results of heterokedasticity test
Item Probability
Breusch-Pagan method
Gender 0.125
Age of household head 0.679
Family size 0.394
Education status 0.381
Off farm income 0.241
Ownership of means of transportation 0.305
Size of farm allocated to red bean 0.469
Quantity of red bean produced in the 2012 0.765
Distance to the nearest market 0.121
Price of red bean in the year 2012 0.310
Number of extension visit in year 2012 0.2934
Access to market information 0.588
Access to informal credit 0.126
Membership in a cooperative 0.305
Awareness about quality standards 0.224
*Presence of probability value less or equal to 10 percent indicates the presence of heterokedasticity in the data set

92
APPENDIX 4: Checklist for Focus Group Discussion
Focus group discussion questions with actors along the market chain of Red bean on “Analysis
of factors influencing participation of smallholder farmers in Red Bean market in Halaba Special
District, Ethiopia” for M.Sc. Research project
1. Who are the major marketing actors that are involved in the movement of the product
from producer to the market? What are the problems associated with them?
2. What are the main activities carried out in the market chain by each actor?
3. Is there land shortage for red bean production? How do you transport the produce?
4. Which types of red bean variety is common in the district? Why? Is it availability?
5. What is the average amount of red bean that can be produced from one ha of land?
6. What types of business services are feeding into the chain?
7. What are the main strengths and weaknesses of the chain?
8. What are the major factors that affect producers’ decision to participate in red bean
market and the amount they are supplying to the market?
9. What are the major constraints that affect producers, urban collectors, rural assemblers,
and wholesalers to operate in the red bean marketing?
10. What type of relationship exist between

93
Actors No relationship Weak Strong
Farmers and farmers
Farmers and brokers
Farmers and urban collectors
Farmers and wholesalers
Farmers and cooperative
Farmers and rural assemblers
Brokers and urban collectors
Brokers and wholesalers
Urban collectors and wholesalers
Urban collectors and cooperative
Brokers and illegal traders

94
APPENDIX 5: Producers’ Survey Questionnaire
Questionnaire for producers on “Analysis of factors influencing participation of smallholder
farmers in Red Bean market in Halaba Special District, Ethiopia” for M.Sc. Research project
1. General Information
1. Questionnaire number: _____________
2. Name of the enumerator: _____________________Signature: _____________
3. Date: _______/ _______/________
4. Name of Kebele administration ____________________________
5. Name of the village _____________________________________
2. Household Characteristics
1. Name of the respondent __________________________
2. Who is the head of the household, i.e. decision maker? ____________________
3. Age of the household head ____________________________
4. Sex of the household head 1. Male [ ] 2. Female [ ]
5. Marital status of the household head
1. Single [ ] 2. Married [ ] 3. Divorced [ ] 4. Widowed [ ] 5. Polygamous [ ]
6. Education level of the household head 1. Number of years in school____________
7. Farming experience of household head: _______ years
8. Number of family including the respondent ___________
Name, age, sex, and education level of family (Use the code) 3. Land Use
1. Total land holding owned _____________ (ha)
2. Total land hired in ___________________ (ha)
3. Cultivated area ______________________ (ha)
4. Red bean growing area _______________ (ha)
5. Land allocated for other crops __________ (ha)
4. Production

95
1. Production of Red bean and major crops in 2012.
2. The best cash crops relative to level of income 1st _________________
2nd _______________________ 3rd ____________________
3. Which type of red bean Variety are you using? 1. Local [ ] 2. Improved [ ] 3. Both [ ]
4. Is labor force available for production of red bean?
1. Yes [ ] 2. No [ ]
5. What is your source of labor for producing red bean?
1. Family labor [ ]. 2. Hired labor [ ] 3. Debo [ ] 4. All [ ]
5. Marketing aspects
1. Are you selling red bean to any market? 1. Yes [ ] 2. No [ ]
(The following questions (2 up to 5) under this sub topic is only for those who participate in
the market)
2. Experience in the marketing of red bean (Years) __________
3. Total quantity sold and average selling price:
Red bean type Total quantity sold Average selling price
2010 2011 2012 2010 2011 2012
4. How do you transport red bean from farm to market?
1. Head loading [ ] 2. Pack animals [ ] 3. Animal cart [ ] 4. Trucks [ ]
Type of
crop
Quantity
produced
Quantity
consumed
Stored for
seed ( kg)
Gift
(kg)
Quantity
sold 2012
Price in 2012
per 100 kg
1 Red bean 1 Red 2 Maize 3 Teff 4 Other

96
5. Others ________________
1. To whom are you supplying your red bean?
1. Local assemblers [ ] 2. Wholesalers [ ] 3. Retailers [ ] 4. Urban collectors [ ] 5.
Consumers [ ] 6. Informal traders [ ] 7. Other/specify ________
5. Where could (did) you get them/buyers?
1. At the farm level [ ] 2. At the local market [ ] 3. on the main road [ ]
4. At the district market [ ] 5. Others/specify________
6. What are marketing costs you incur when you take your produce to the market?
7. How many kilometers you need to travel to get the following?
1. The nearest Cooperatives ______ Km 2. The nearest market for selling red bean ______ Km
3. Local assemblers (if there is) _______Km. 4. The district market _____ Km
8. Do you have your own transportation means like donkey, horse, mule, cart, and track?
1. Yes [ ] 2. No [ ]
9. Did you know the nearby market price before you sold your red bean? 1. Yes [ ] 2. No [ ]
10. Do you have access to market information? 1. Yes [ ] 2. No [ ]
10.1 From which source did you get information on supply of red bean markets?
1. Other red bean farmers [ ] 2. Personal observation [ ] 3. Radio [ ] 4. Broker [ ]
5. TV [ ] 6. Telephone [ ] 7. Extension agents [ ] 8. Newspaper [ ] 9. Other
10.2 Which one is/are your source of information on demand of red bean markets?
1. Other red bean farmers [ ] 2. Personal observation [ ] 3. Radio [ ] 4. Broker [ ]
Items
Cost (birr) Remark
Sales tax
Transport cost
Loading and unloading
Packing
Others

97
5. TV [ ] 6. Telephone [ ] 7. Extension agents [ ] 8. Newspaper [ ] 9. Other
10.3 Which one is/are your source of information on price of red bean markets?
1. Other red bean farmers [ ] 2. Personal observation [ ] 3. Radio [ ] 4. Broker [ ]
5. TV [ ] 6. Telephone [ ] 7. Extension agents [ ] 8. Newspaper [ ] 9. Other
10.4 Do you have awareness about the quality or variety of red bean that is important for market?
6. Credit
1) Do you have access to credit?
1. Yes [ ] 2. No [ ]
2) Have you received formal credit last year (2012)?
1. Yes [ ] 2. No [ ]
3) If yes, how much did you take? ______________
4) What is your source of the credit?
1. Bank [ ] 2. NGO [ ] 3. Microfinance [ ] 4. Relatives or friends [ ] 5. Other
_______________
5) What problem do you perceive in taking formal credit?
1. Inadequacy of supply [ ] 2. High interest rates [ ] 3. Restrictive procedures [ ]
4. Others (specify) ___________________________________
7. Extension Service
1. Do you have access to extension service? 1. Yes [ ] 2. No [ ]
2. Did you get extension service in relation to red bean production in 2012? 1. Yes [ ]
2. No [ ]
3. If yes, what type of extension service did you get?
1. Technical advice 1. Yes [ ] 2. No [ ]
2. Price information 1 Yes [ ] 2. No [ ]
3. Input use 1. Yes [ ] 2. No [ ]
4. Credit use-making 1. Yes [ ] 2. No [ ]
5. Other _________________________________________________________
4. How often the extension agent contacted you?
1. Weekly [ ] 2. Once in two week [ ] 3. Monthly [ ]

98
4. Twice in the year [ ] 5. Once in a year [ ] 6. Any time when I ask them [ ]
5. Have you ever attended any demonstration field days arranged by development agents
regarding red bean production?
1. Yes [ ] 2. No [ ]
6. Have you ever heard about quality standards of red bean that is excellent for exporting?
1. Yes [ ] 2. No [ ]
7. If yes from where?
1. Cooperatives [ ] 2 other farmers [ ] 3. From radio [ ]
4. Extension agents [ ] 5. Never heard [ ] 6. Other __________________________
8. Are you a member of primary cooperatives? 1. Yes [ ] 2. No [ ]
9. If yes, please could you mention the primary cooperative that you are participating?
_________________________________________________________________
8. Other income
1. What is the type of off-farm activity in which the household is involved in?
1. Paid daily labor [ ] 2. Petty trade [ ] 3. Handcraft [ ]
4. Other, specify ___________________________________________
2. What was the estimated amount of off farm income for last year (2012)? _______ Birr.
3. How many livestock do you have?
1. Ox _________________ 2. Cow __________ ___ 3. Sheep _________________
3. Goat ___________ 4. Donkey __________ 5. Mule ___________ 6. Horse ___________
3. Please could you tick the major constraints that you are facing while or to supply red bean to
the market?
1. Access to improved seed 1. Yes [ ] 2. No [ ] 2. Access to fertilizer 1. Yes [ ] 2. No [ ]
3. Inconsistent demand 1. Yes [ ] 2. No [ ] 4. Ownership of oxen for plough 1. Yes [ ] 2. No [
]
3. Price fluctuation 1. Yes [ ] 2. No [ ] 4. Distance to market 1. Yes [ ] 2. No [ ]
5. Access to credit? 1. Yes [ ] 2. No [ ] 6. Access to price information 1. Yes [ ] 2. No [ ]
7. Transport service 1. Yes [ ] 2. No [ ] 8. Absence of demand 1. Yes [ ] 2. No [ ]
9. Storage facilities 1. Yes [ ] 2. No [ ] 10. Week coordination among marketing actors

99
1. Yes [ ] 2. No [ ] 11. Sale tax 1. Yes [ ] 2. No [ ]
12. Poor road facility 1. Yes [ ] 2. No [ ] 13 .Brokers 1. Yes [ ] 2. No [ ]
15. Lack of awareness on the type of variety that is standard for marketing
16. Shortage of labor force
17. Shortage of farmland
18. Less return from selling
17. If yes, can you mention the marketing agents who are causing problem in the red bean
market?
18. Other ______________________________________________________________.
100
APPENDIX 6: Traders (urban collectors, rural collectors, wholesalers, primary cooperative and union) survey questionnaire
Questionnaire for traders, cooperatives, and unions on “Analysis of factors influencing
participation of smallholder farmers in Red Bean market in Halaba Special District, Ethiopia” for
M.Sc. Research project
1. General information
Name of enumerator: …………………………….Signature: …………………………
Date: … /…/… Checked by ………………………………………..
2. Demographic Characteristics
1. Name of the trader/Primary Cooperative/Cooperative Union _______________________
2. Age of the trader/Primary Cooperative/Cooperative Union _________________________
3. Sex of the trader 1. Male [ ] 2. Female [ ]
4. Marital status of the trader 1. Single [ ] 2. Married [ ] 3. Divorced [ ] 4. Widowed [ ]
5. Polygamous [ ]
5. Education status of the trader 1. Illiterate [ ] 2. Literate [ ]
3. Subject Questions
1. What type of business were you involved in?
1. Supplier/Wholesaler [ ] 2. Broker & commission agent [ ] 3. Retailer [ ]
4. Retailer & Broker [ ] 5. Local collector [ ] 6. Assembler [ ]
7. Broker/commission agent [ ] 8. Cooperative union [ ] 9. Cooperative [ ]
2. How long have you been engaged in red beans trading? _________Years
3. What is the motivation behind your participation in red bean marketing?
1. Profitability of the commodity [ ] 2. Low transaction cost [ ] 3. Less competition [ ]
4. There is no any option [ ] 5. Other/specify______________________________
4. Would you please list the major actors in the market chain of red bean in your area? _____
4. Purchasing & Processing
1. Do you have any arrangement with suppliers of red bean? 1. Yes [ ] 2. No [ ]
2. If yes, what kind of arrangement you practiced? 1. Contract with producers [ ]
2. Contact with [ ] local traders [ ] 3) other/specify _______________________________
3. Do you have your own intermediaries who collect red bean from farmers?
1. Yes [ ] 2. No [ ]

101
4. If no, how do you access the produce from farmers? _________________________________
5. From which market you bought red bean in 2012?
1. Village market [ ] 2. District market [ ] 3. other district market [ ]
4. Zonal market [ ] 5. Other (specify) _________________________________
6. To who did, you supplied your red bean in 2012?
1. Farmers/producers [ ] 2. Retailers [ ] 3. Wholesalers [ ] 4. Village assemblers [ ]
5. Cooperative union [ ] 6. Cooperatives [ ] 7. Traders [ ] 8. Other (specify) [ ]
7. Average quantity purchased in a year ____________________
8. Average monthly price per 100 Kg of red bean ____________
9. How many days did you operate in marketing of red bean in a month ____________
10. Terms of payment with suppliers 1. Cash [ ] 2. Credit [ ] 3. Both [ ] 4. Advance payment[ ]
11. Did you use brokers to purchase red bean? 1. Yes [ ] 2. No [ ]
12. If brokers were used, what was the advantage of using brokers?
1. You could get buyers and sellers easily [ ] 2. Reduce transaction costs [ ]
3. Purchased at lower price [ ] 4. Sell at higher price [ ]
5. Other (specify) _______________________________________________
13. Is there any problem related with using brokers? 1. Yes [ ] 2. No [ ]
14. If there is problem, what problems did they create?
1. Cheating quality [ ] 2. Wrong price information [ ]
3. Cheating scaling (weighing) [ ] 4. Charged high brokerage [ ]
5. Other (specify) ________________________________________________
15. How do you measure your purchase? 1. By standard weighing (kg) [ ]
2. By traditional weighing materials [ ] 3. Other (specify) ________________________
16. Do you pack your purchase? 1. Yes [ ] 2. No [ ]
17. If yes, what were your packing materials? ________________________________________
18. What is the cost of packing? _________Birr/100 kg
19. Did you process /clean/ your red bean? 1. Yes [ ] 2. No [ ]
20. If yes how? _________________________________________________________________
21. What is the cost of processing/ clearing________Birr/100 kg
22. Did you grade your red bean? 1. Yes [ ] 2. No [ ]
23. If yes what was the basis of your grading?

102
1. Color [ ] 2. Size [ ] 3. Taste [ ] 4. Other (specify ______________________
24. What is the cost of grading per 100 kg ________________ Birr
5. Transport & value addition
1. How far is the purchasing market place from your residence?
1. Longest _______ kms 2. Nearest ______Kms
2. What is the most frequently used mode of transport red bean from purchasing sites to market?
1. Head [ ] 2. Pack animals [ ] 3. Animal cart [ ] 4. Trucks [ ]
5. Others………………………………………………………………………….
3. Average cost of transportation you incur to transport 100 kg of red bean:
• From purchase, center /collection point to the store? _______Birr/100 kg
• From store to cooperatives? __________ Birr/100 kg
• From store to market? ______________ Birr/100 kg
• From cooperative to Cooperative union? ________ Birr/100 kg
• From cooperative union to traders? __________ Birr/100 kg
5. How much was the loading and unloading expenses per 100 kg? _________________
6. Are there any activities you are doing on the red bean you purchase before you supply to the
buyers? 1. Yes [ ] 2. No [ ]
7. If yes, could you mention the activities you do as a value addition before you sell it
Activities Estimated cost per 100 kg
6. Selling practice
1. Where did you sale red bean in 2012?
2. To whom did you sell in 2012? ________________________________________________
3. How many quintal/100 kg/ you sold in the year 2012? ________________________
4. Average quantities of red bean sold per month in this market?
5. How many weeks did you operate in this market?
6. Terms of payment with buyers
1. Cash [ ] 2. Credit [ ] 3. Advance payment

103
7. What are prices of red bean during scarce and abundant seasons
Scarce Abundant Commonly
Red bean Selling price
Purchasing price
3. Please, could you tick the major constraints that hinder you from supplying red bean to the
market?
1. Low quality 1. Yes [ ] 2. No [ ] 2. Inconsistent supply 1. Yes [ ] 2. No [ ]
3. Price fluctuation 1. Yes [ ] 2. No [ ] 4. Distance to market 1. Yes [ ] 2. No [ ]
5. Access to credit? 1. Yes [ ] 2. No [ ] 6. Access to price information 1. Yes [ ] 2. No [ ]
7. Transport service 1. Yes [ ] 2. No [ ] 8. Demand 1. Yes [ ] 2. No [ ]
9. Storage facilities 1. Yes [ ] 2. No [ ] 10. Week coordination among marketing actors
1. Yes [ ] 2. No [ ] 11. Sale tax 1. Yes [ ] 2. No [ ]
12. Poor road facility 1. Yes [ ] 2. No [ ] 13 .Brokers 1. Yes [ ] 2. No [ ]
15. Linkage among cooperatives 1. Yes [ ] 2. No [ ]
16. Financial capacity of the cooperative 1. Yes [ ] 2. No [ ]
17. Illegal/informal market 1. Yes [ ] 2. No [ ]
18. Linkage between cooperatives and union 1. Yes [ ] 2. No [ ]
17. If yes, can you mention the marketing agents who are causing problem in the red bean
market ___________________________________________________________________?
18. Other ______________________________________________________________.
6. If you have any recommendation or advice in order to improve marketing of red bean in the
area __________________________________________________________________________

104
APPENDIX 7: Percentage of members and non-members of primary cooperative in HSD
Number of the members Percentage
Members 20 13.3
Non-members 130 86.7
Market participants 19 22.35
Non-market participants 1 1.54
Source: Survey data (2013)

105
APPENDIX 8: Relationships between different actors along red bean market chain in HSD
First Ansha kebele
No Actors No relationship Weak Strong
1 Producers and producers ü
2 Producers and brokers ü
3 Producers and urban collectors ü
4 Producers and wholesalers ü
5 Producers and cooperative ü
6 Producers and rural assemblers ü
7 Brokers and urban collectors ü
8 Brokers and wholesalers ü
9 Urban collectors and wholesalers ü
10 Urban collectors and cooperative ü
11 Brokers and illegal traders ü

106
Continued Kufe kebele
Actors No relationship Weak Strong
1 Farmers and farmers ü
2 Farmers and brokers ü
3 Farmers and urban collectors ü
4 Farmers and wholesalers ü
5 Farmers and cooperative ü
6 Farmers and rural assemblers ü
7 Brokers and urban collectors ü
8 Brokers and wholesalers ü
9 Urban collectors and
wholesalers
ü
10 Urban collectors and
cooperative
ü
11 Brokers and illegal traders ü

107
APPENDIX 9: Probit and OLS models test of fitness
Probit model OLS
Number of observation 150 Number of observation 150
LR Chi-square (15) 136 Probability > F 0.0000
Probability > chi-square 0.0000 Adjusted R2 0.47
Pseudo R2 0.663
Log likelihood -34.58

108
APPENDIX 10: Lists of red bean farmers attended the FGD in HSD
First Ansha Kebele
No Name Village Gendre Education
statuas
Occupation in the value
Chain
1. Shek -Jemal
Bekara
Sidea
Abagona
Male 6 Assembler and Chairman
of the KA 2. Zayiton Ebiro Aje Darm Male 5 Urban red bean collector 3. Dube Halaga Malorto Male 4 Assembler 4. Zayitun Worabicho Female 6 Assembler 5. Bekelech Aje Darm Female 3 Red Bean Producer 6. Wabala Babiso Widanto Male 0 Urban red bean collector
7. Kedir Hussen Abisalasto Male 10 Red Bean Producer
8. Kedir Tekiye Sede Male 4 Red Bean Producer
9. Dubala Yesuf Darm Male 1 Red Bean Producer
10. Befata Hussen Darm Male 5 Red Bean Producer
Name of the KA 1st Ansha, Place where the FGD held Ansha Farmers Training
Center (FTC), Date of FGD 13-06-2013-, Starting time 3:00 Ending time 5:05,
Number of people who attend the FGD 10.

109
Kufe kebele
No
Name Village Gende
r
Occupation Edu.
level
Occupation along
value chain
1 Yadisa Onike Farzana Male Chairman of the KA 12 Farmer
2 Handino Hamiza Azara Male Farmer and trader 3 Farmer
Ramato Dawoid Azara Male Farmer and trader 6 Assembeler
4 Zarifame Hebiso Azara Femal
e
Female reperes. - Farmer
5 Bergena Abino Safato Male Trader 2 Farmer
6 Baharu Ribo Safato Male Farmer 10 Assembeler
7 Suragi Alkawir Farzana Male Youth representa. 10 Urban collector
8 Salome Tasfaye Urago Femal
e
Farmer - Farmer
9 Muhidin Jemal Farzana Male Trader 9 Urban collector
10 Muhidin Asamo Toko Male Trader 8 Farmer
Name of the KA Kufe, Place where the FGD held Kufe kebele administration office,
Date of FGD 23-06-2013 E.C, Starting time 3:00 Ending time 5:05, Number of people
who attend the FGD 10.