an analysis of extreme el niño insurance in Protecting a...
16
TECHNICAL NOTE 5 An Analysis of Extreme El Niño Insurance in Protecting a Financial Institution’s Portfolio 5 Insurance for Climate Change Adaptation Project
Transcript of an analysis of extreme el niño insurance in Protecting a...

Technical noTe 5
an analysis of extreme el niño insurance in Protecting a Financial institution’s Portfolio
5
Insurance for C l imate Change Adaptat ion Pro ject
2
Technical noTe 5an analysis of extreme el niño insurance for Protecting a Financial institution’s PortfolioDeutsche Gesellschaft für internationale Zusammenarbeit (GiZ) Gmbh
insurance for climate change adaptation Project Main advisor Alberto Aquino [email protected] Jr. Los Manzanos 119, San Isidro http://seguros.riesgoycambioclimatico.org/
author GlobalAgRisk
Translation Damian HagerDesign and layout Renzo Rabanal Photographs GIZ photo archives, Diario El Tiempo, PiuraPrinting Giacomotti Comunicación Gráfica S.A.C. Calle Huiracocha 1291. Of 302, Jesús María First edition, Lima (Peru), August 2012 Legal deposit in the Biblioteca Nacional del Perú (National Library of Peru) No. 2012-09426
Cooperación Alemana al Desarrollo – Agencia de la GIZ en el PerúAv. Prolongación Arenales 801, MirafloresTotal or partial reproduction of this work is allowed, provided the source is cited.
Dia
rio
El
tiEm
po, P
iUra
3
an analysis of extreme el niño insurance in Protecting a Financial institution’s Portfolio
Executive summary
The purpose of this paper is to present the portfolio benefits of Extreme El Niño In-
surance for a financial institution and describe risk assessment results, a quantitative
model of a financial institution’s exposure to the El Niño Phenomenon, and the prod-
uct’s expected benefits. Specifically, insurance payments can contribute to maintaining
a satisfactory capital ratio by compensating capital losses due to increased provisions
and bad loans. The high cost of undercapitalization will, inevitably, translate into lost
opportunities of cost effective loans (Van den Heuval, 2006); thus an insured financial
institution should expect greater income than those that do not opt for this type of
insurance coverage.
The results of the model suggest it would be possible to obtain substantial portfolio protec-
tion by purchasing a relatively small amount of insurance, for example, a sum insured
equivalent to 1% - 4% of the credit portfolio value. Since the insurance protects a financial
institution’s ability to extend loans after an extreme El Niño event the model also indicated
that the product increases, on average, the final capital position at the end of a 15 year
period. More importantly, the insurance greatly reduces the volatility of the bank’s equity.
In addition to the quantitative effects of the model, insurance coverage can produce
other qualitative benefits, namely
1. Heightened reputation of the financial institution of the financial institution as an
innovative, socially committed company and market leader.
2. Increased international visibility among socially conscious investors and donors.
3. Improved risk profile for credit rating agencies and debt and capital investors.
4. Reduced net regulatory burden since insurance is formally recognized as a risk
management device.
5. Strategic market positioning after an extrem El Niño event which facilitates growth
in market share.
Based on the results of the model and these other potential benefits, let’s assume
that a financial institution chooses to insure partially its risk at an amount equivalent
4
to roughly 0.8% of its credit portfolio. The premium paid for this risk transfer is about
0.5 basis points of the credit portfolio, and thus it will reduce capital volatility related to
an extreme El Niño by nearly 22%.
Background
The El Niño Phenomenon causes catastrophic flooding in northern Peru. This climatic
event is associated with an increase in Pacific sea surface temperatures off the coast
of Peru (Lagos et al., 2008). Warm air from the west collides with cold air cascading
down from the Andes in the east, thereby setting off severe rainfall (McPhaden, 2003).
During the 1982–83 and 1997–98 extreme events, January to May precipitation levels
were nearly 40 times above. The volume of water in the Piura River was also 40 times
the norm during those events(Skees and Murphy, 2009). As a result of the extreme
weather, bridges washed away, roads were destroyed, fields flooded, assets were lost,
communities were isolated, and food prices, and diseases increased. An extreme El
Niño creates problems for financial intermediaries and limits access to credit. For
instance, the 1997–98 El Niño event caused credit payment problems that lasted for
years (Trivelli, 2006). Afterwards, some financial intermediaries reacted by drastically
reducing access to credit for sectors they considered highly vulnerable to the phenom-
enon, such as agriculture. Moreover, interest rates rose close to 3% in northern Peru
on account of the hightened risk of nonpayment associated with the El Niño (Skees and
Barnett, 2006).
Extreme El Niño Insurance is a type of index insurance which provides pays out on the
basis of objective measurements of the severity of a disaster and it is widely used in
places where traditional insurance does not meet all the needs of the target market.
Its payments are based upon the increase in Pacific sea surface temperatures (SST),
which is the standard means climatologists gauge the severity of an El Niño event. The
temperature readings accurately predict catastrophic flooding in northern Peru (Khalil
et al., 2007), and because of that predictive ability, insurance can be paid even before
disaster onset of the disaster. The contract the financial institution is evaluating em-
ploys November-December SST readings and pays out in January, the reason being
that previous event reports indicate that catastrophic floods occur in February.
Thus, the index insurance plan benefits are: 1) advanced payout for more robust disas-
ter management, 2) coverage against business interruptions and higher costs that
would not typically be included in traditional insurance plans, and 3) lower insurance
costs since adverse selection and moral hazard related to traditional insurance are
substantially reduced in index insurance.
5
El Niño Risk Assessment
To understand the effects the El Niño has on a credit portfolio and its performance,
the financial institution surveyed and interviewed its field officers and managers work-
ing in northern Peru. There are two important estimates regarding the portfolio: 1) the
percentage of the credit portfolio that is affected that requires an adjustment to cred-
it terms through refinancing and restructuring and 2) the percentage of the credit
portfolio that is lost. This analysis indicates that the departments of Tumbes, Piura, and
Lambayeque are the most vulnerable to an extreme El Niño event. La Libertad is also
vulnerable, but to a lesser degree, as only 60% of the department is exposed to an
extreme event. The economic sectors of agriculture, fishery, and transportation in these
regions are the most at risk, and loans for their investors will present the greatest
problems. Management is anticipating some type of response from the federal gov-
ernment to the problems facing the agricultural sector, and prior interventions, such
as RFA, motivated an estimated 50% recovery of agricultural credit since the govern-
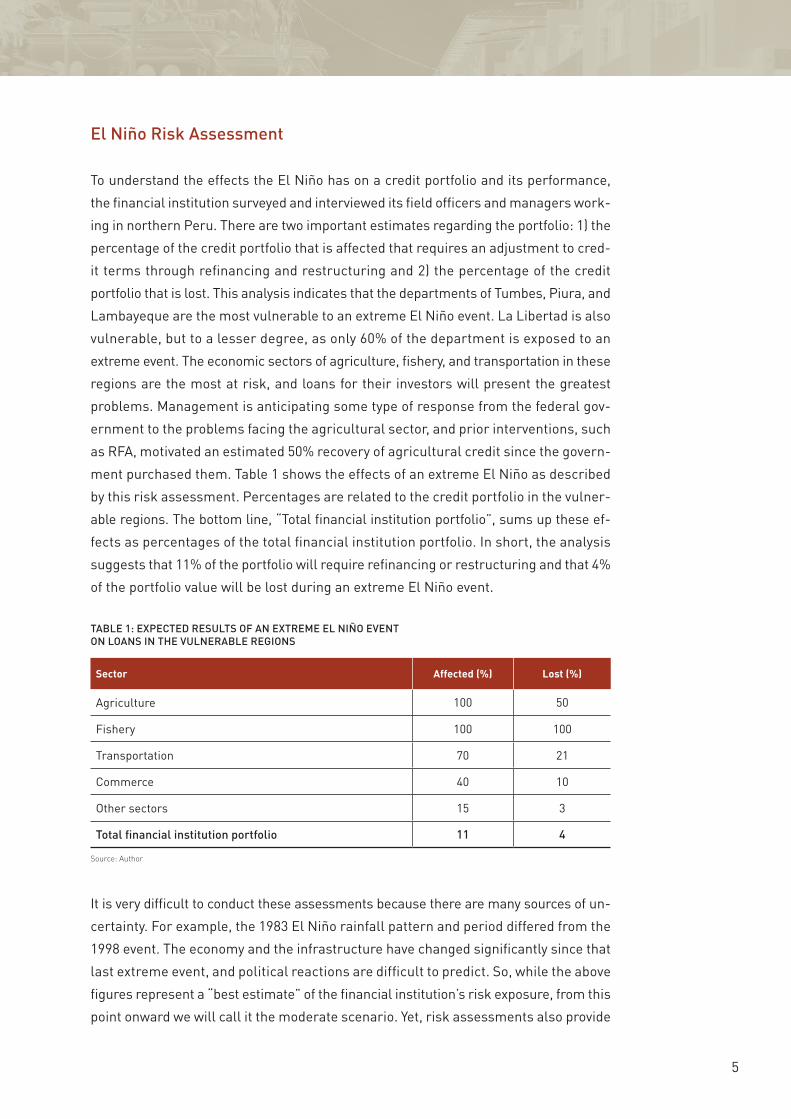
ment purchased them. Table 1 shows the effects of an extreme El Niño as described
by this risk assessment. Percentages are related to the credit portfolio in the vulner-
able regions. The bottom line, “Total financial institution portfolio”, sums up these ef-
fects as percentages of the total financial institution portfolio. In short, the analysis
suggests that 11% of the portfolio will require refinancing or restructuring and that 4%
of the portfolio value will be lost during an extreme El Niño event.
It is very difficult to conduct these assessments because there are many sources of un-
certainty. For example, the 1983 El Niño rainfall pattern and period differed from the
1998 event. The economy and the infrastructure have changed significantly since that
last extreme event, and political reactions are difficult to predict. So, while the above
figures represent a “best estimate” of the financial institution’s risk exposure, from this
point onward we will call it the moderate scenario. Yet, risk assessments also provide
TABlE 1: ExPECTEd REsulTs of AN ExTREmE El NIño EvENT oN loANs IN ThE vulNERABlE REgIoNs
Sector affected (%) lost (%)
Agriculture 100 50
Fishery 100 100
Transportation 70 21
Commerce 40 10
Other sectors 15 3
Total financial institution portfolio 11 4
Source: Author

6
optimistic and pessimistic scenarios. In terms of the former, an extreme El Niño affects
La Libertad to a lesser extent and creates fewer portfolio losses in the transportation,
commerce, and “other” sectors, thereby resulting in an affected portfolio of 9.5% and
losses of 2.7%. Under a pessimistic scenario, an extreme El Niño has a greater affect
in La Libertad and heightens the problems and/or losses in the agriculture, transpor-
tation, and commerce sectors, resulting in an affected portfolio of 14.5% and losses of
6%. If the government was not to intervene through the purchase of agricultural credits
after an extreme event, then portfolio losses under the moderate scenario would also
be as high as 6%. Table 2 summarizes the three scenarios in terms of the financial in-
stitution’s total portfolio.
Benefits of the insurance for an El Niño event
The greatest risk the El Niño poses for a financial institution is asset loss through late
loan payments, a situation that could destroy the bank’s capital. Undercapitalization dis-
rupts normal income generating opportunities since bank originates fewer new loans
when it reduces leverage. Bad loans also reduce gross income from interest, thereby
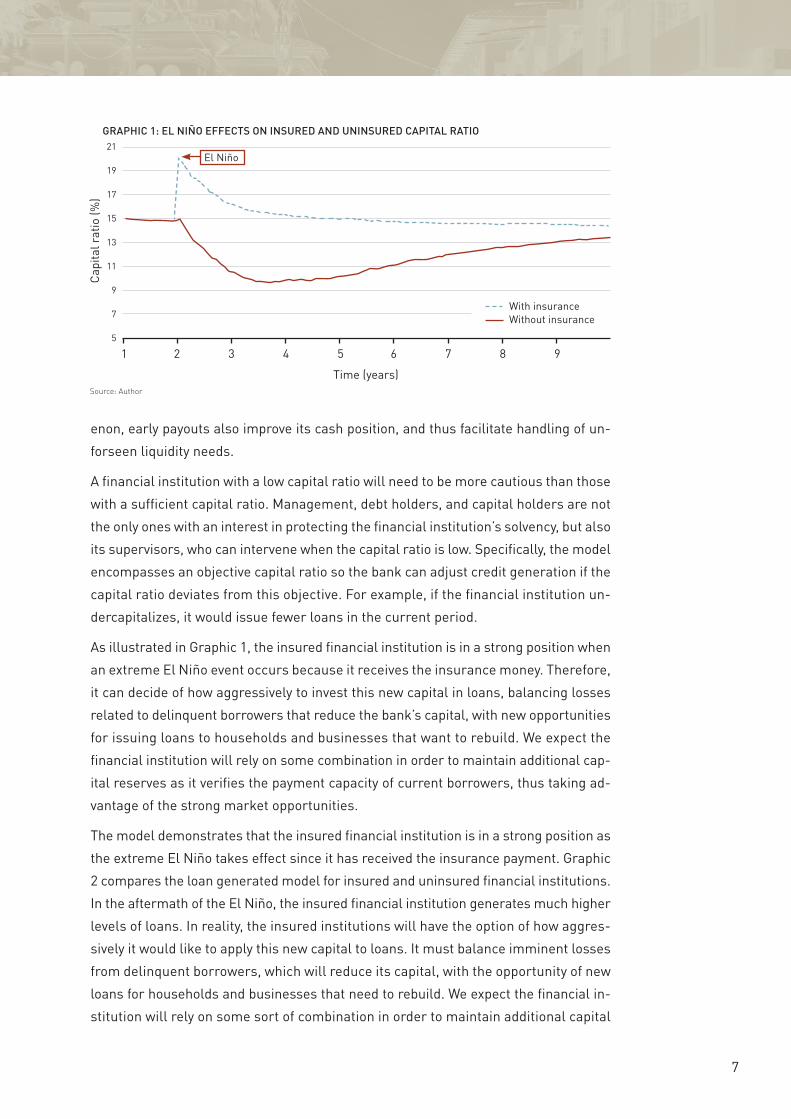
decelerating recovery due to a reduction in earnings flows. Graphic 1 was generated
from a banking model using a moderate scenario. The solid line shows the effect of
an extreme El Niño event has on the capital ratio during the second year of the model.
El Niño Insurance protects the bank’s capital, and it will be paid just before a strong
event. The insurance money will be entered into the balance sheet as new capital since
it increases the financial institution’s assets without associated liabilities. Hence, it in-
creases the capital ratio,by the dotted line in Graphic 1, where the insured amount is
4% of the portfolio value. Bear in mind that the financial institution’s insured capital ratio
will fall after the El Niño event for two reasons: 1) the portfolio insurance does not di-
rectly deal with problems related to borrowers’ failure to make loan payments, thus the
portfolio value will continue to fall, and 2) we anticipate that the financial institution
will want to offer loans aggressively after the catastrophic event in order to cover a grow-
ing demand from its good customers in the region who need to rebuild. While a financial
institution is not very vulnerable to liquidity risks due to an extreme El Niño phenom-
TABlE 2: summARy of ExTREmE El NIño EffECTs oN ThE PoRTfolIo IN ThE ThREE sCENARIos
Sector affected (%) lost (%)
Optimistic 9,5 2,7
Moderate 11,0 4,0
Pessimistic 14,5 6,0
Source: Author
7
enon, early payouts also improve its cash position, and thus facilitate handling of un-
forseen liquidity needs.
A financial institution with a low capital ratio will need to be more cautious than those
with a sufficient capital ratio. Management, debt holders, and capital holders are not
the only ones with an interest in protecting the financial institution’s solvency, but also
its supervisors, who can intervene when the capital ratio is low. Specifically, the model
encompasses an objective capital ratio so the bank can adjust credit generation if the
capital ratio deviates from this objective. For example, if the financial institution un-
dercapitalizes, it would issue fewer loans in the current period.
As illustrated in Graphic 1, the insured financial institution is in a strong position when
an extreme El Niño event occurs because it receives the insurance money. Therefore,
it can decide of how aggressively to invest this new capital in loans, balancing losses
related to delinquent borrowers that reduce the bank’s capital, with new opportunities
for issuing loans to households and businesses that want to rebuild. We expect the
financial institution will rely on some combination in order to maintain additional cap-
ital reserves as it verifies the payment capacity of current borrowers, thus taking ad-
vantage of the strong market opportunities.
The model demonstrates that the insured financial institution is in a strong position as
the extreme El Niño takes effect since it has received the insurance payment. Graphic
2 compares the loan generated model for insured and uninsured financial institutions.
In the aftermath of the El Niño, the insured financial institution generates much higher
levels of loans. In reality, the insured institutions will have the option of how aggres-
sively it would like to apply this new capital to loans. It must balance imminent losses
from delinquent borrowers, which will reduce its capital, with the opportunity of new
loans for households and businesses that need to rebuild. We expect the financial in-
stitution will rely on some sort of combination in order to maintain additional capital
1 2 3 4 5 6 7 8 9
Time (years)
Capi
tal r
atio
(%)
21
19
17
15
13
11
9
7
5
With insuranceWithout insurance
Source: Author
gRAPhIC 1: El NIño EffECTs oN INsuREd ANd uNINsuREd CAPITAl RATIo
El Niño

8
reserves as it determines the repayment capacity of its current borrowers, whereby it
takes advantage of the strong market opportunities. One financial benefit of the insur-
ance not shown in this model is that after an extreme event, the stronger financial in-
termediaries have the potential to gain more of the market share from the weaker.
Results comparison over a 15 year time period
The above example describes how an extreme El Niño event can affect a financial in-
stitution. The following analysis compares a range of possible results in order to deter-
mine whether the bank will be in a better or worse position due to the purchase of the
insurance. We use a 15 year time period because it offers a clearer image of how the
insurance helps protect the bank’s long term stability
We use the Monte Carlo simulation for this analysis, in which the same test is repeated
when a result is uncertain (for example, if and when the El Niño event will occur) and
the possible results are summarized. Thus, a Monte Carlo simulation is like throwing
dice over and over again, while documenting the results. The result of interest in this
method is the financial institution’s capital at the end of a 15 year period.
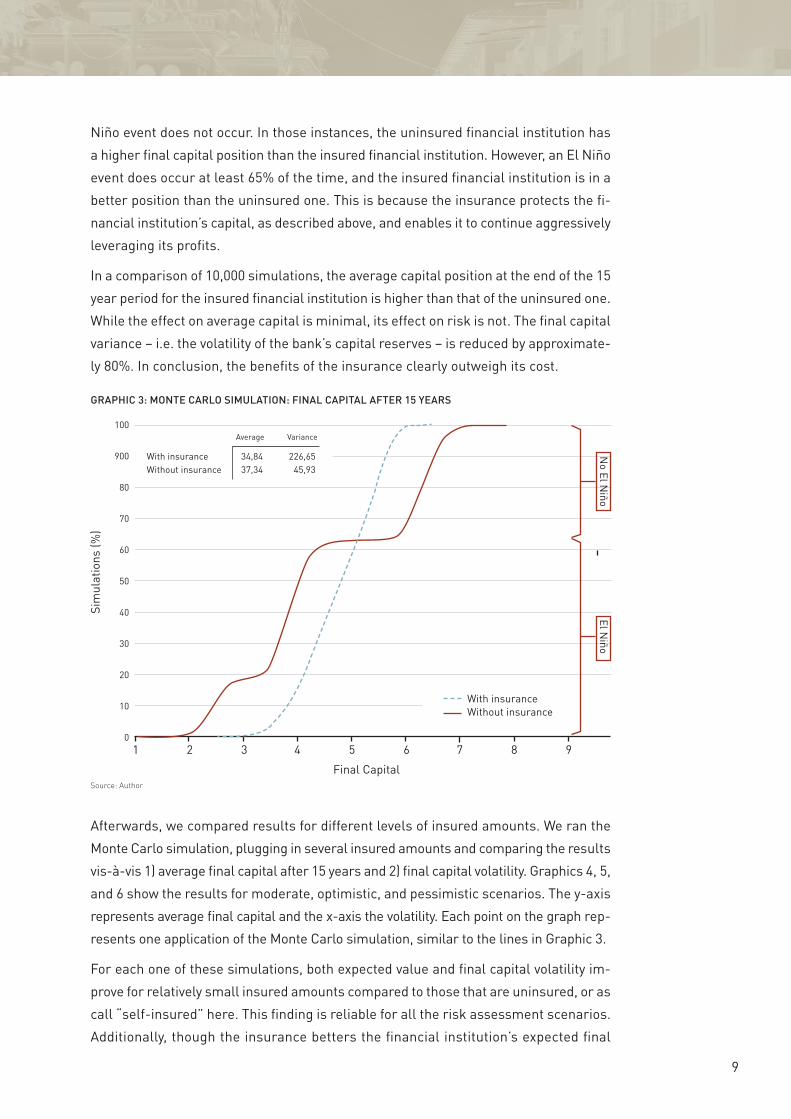
Graphic 3 features the results for a moderate scenario. The insured amount is equal
to 4% of the credit portfolio value, the price of the insurance in this model is 7% of the
insured amount each year, and the number of simulations is 10,000. The graph is laid
out so that the simulations with lower final capital are on the left and those with high-
er are on the right. Approximately 35% of the time during the 15 year period, an El
1 2 3 4 5 6 7 8 9Time (years)
CPor
tfolio
gro
wth
(%)
1,20
1,00
0,80
0,60
0,40
0,20
0,00
-0,20
-0,40
-0,60
With insuranceWithout insurance
Source: Author
gRAPhIC 2: PoRTfolIo gRowTh
9
Niño event does not occur. In those instances, the uninsured financial institution has
a higher final capital position than the insured financial institution. However, an El Niño
event does occur at least 65% of the time, and the insured financial institution is in a
better position than the uninsured one. This is because the insurance protects the fi-
nancial institution’s capital, as described above, and enables it to continue aggressively
leveraging its profits.
In a comparison of 10,000 simulations, the average capital position at the end of the 15
year period for the insured financial institution is higher than that of the uninsured one.
While the effect on average capital is minimal, its effect on risk is not. The final capital
variance – i.e. the volatility of the bank’s capital reserves – is reduced by approximate-
ly 80%. In conclusion, the benefits of the insurance clearly outweigh its cost.
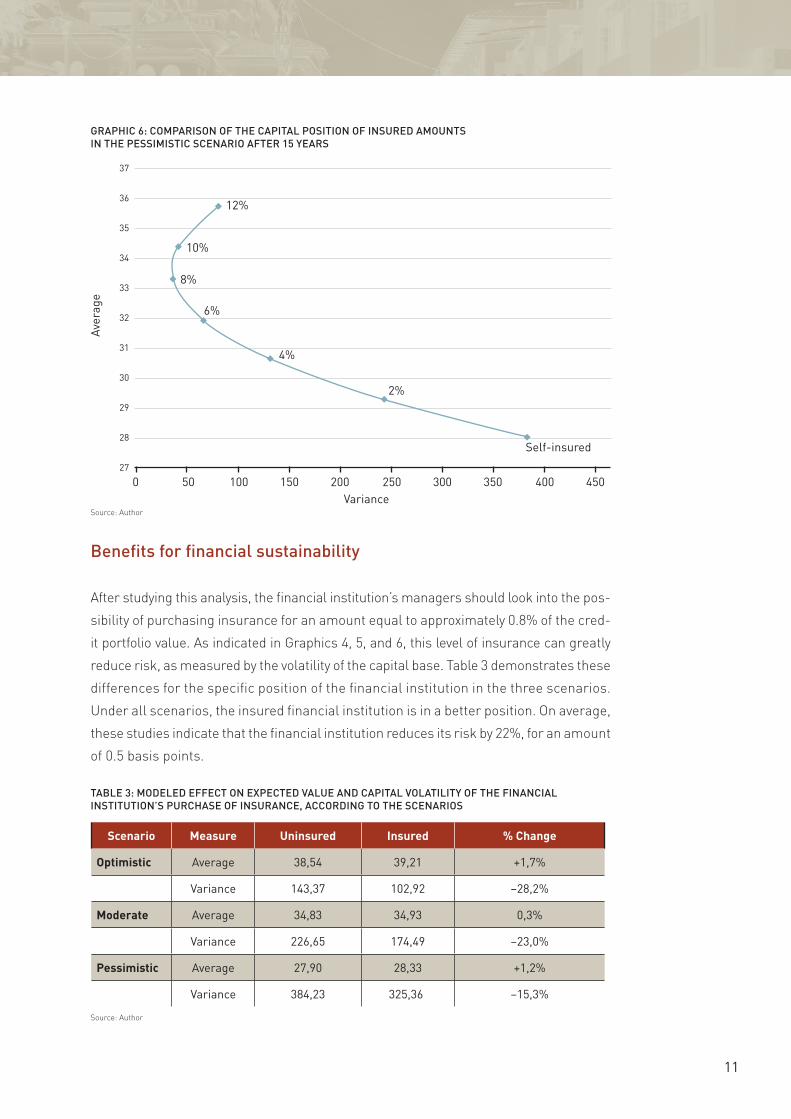
Afterwards, we compared results for different levels of insured amounts. We ran the
Monte Carlo simulation, plugging in several insured amounts and comparing the results
vis-à-vis 1) average final capital after 15 years and 2) final capital volatility. Graphics 4, 5,
and 6 show the results for moderate, optimistic, and pessimistic scenarios. The y-axis
represents average final capital and the x-axis the volatility. Each point on the graph rep-
resents one application of the Monte Carlo simulation, similar to the lines in Graphic 3.
For each one of these simulations, both expected value and final capital volatility im-
prove for relatively small insured amounts compared to those that are uninsured, or as
call “self-insured” here. This finding is reliable for all the risk assessment scenarios.
Additionally, though the insurance betters the financial institution’s expected final
1 2 3 4 5 6 7 8 9
Final Capital
Sim
ulat
ions
(%)
100
900
80
70
60
50
40
30
20
10
0
With insuranceWithout insurance
Source: Author
gRAPhIC 3: moNTE CARlo sImulATIoN: fINAl CAPITAl AfTER 15 yEARs
With insuranceWithout insurance
34,84 226,6537,34 45,93
Average Variance
El Niño
No El N
iño

10
capital position, the sound risk reduction benefits of acquiring even a small amount of
insurance are extremely evident.
0 50 100 150 200 250
8%
6%
4%
2%
Self-insured
Variance
Aver
age
41
40
39
38
7
36
35
34
Source: Author
gRAPhIC 4: ComPARIsoN of ThE fINAl CAPITAl PosITIoN of INsuREd AmouNTs IN ThE modERATE sCENARIo AfTER 15 yEARs
0 20 40 60 80 100 120 140 160
6%
4%
2%
Self-insured
Variance
Aver
age
43,0
42,5
42,0
41,5
41,0
40,5
40,0
39,5
39,0
38,5
38,0
Source: Author
gRAPhIC 5: ComPARIsoN of ThE CAPITAl PosITIoN of INsuREd AmouNTs IN ThE oPTImIsTIC sCENARIo AfTER 15 yEARs
11
Benefits for financial sustainability
After studying this analysis, the financial institution’s managers should look into the pos-
sibility of purchasing insurance for an amount equal to approximately 0.8% of the cred-
it portfolio value. As indicated in Graphics 4, 5, and 6, this level of insurance can greatly
reduce risk, as measured by the volatility of the capital base. Table 3 demonstrates these
differences for the specific position of the financial institution in the three scenarios.
Under all scenarios, the insured financial institution is in a better position. On average,
these studies indicate that the financial institution reduces its risk by 22%, for an amount
of 0.5 basis points.
0 50 100 150 200 250 300 350 400 450
12%
10%
8%
6%
4%
2%
Self-insured
Variance
Aver
age
37
36
35
34
33
32
31
30
29
28
27
Source: Author
gRAPhIC 6: ComPARIsoN of ThE CAPITAl PosITIoN of INsuREd AmouNTs IN ThE PEssImIsTIC sCENARIo AfTER 15 yEARs
TABlE 3: modElEd EffECT oN ExPECTEd vAluE ANd CAPITAl volATIlITy of ThE fINANCIAl INsTITuTIoN’s PuRChAsE of INsuRANCE, ACCoRdINg To ThE sCENARIos
Scenario Measure Uninsured insured % change
optimistic Average 38,54 39,21 +1,7%
Variance 143,37 102,92 –28,2%
Moderate Average 34,83 34,93 0,3%
Variance 226,65 174,49 –23,0%
Pessimistic Average 27,90 28,33 +1,2%
Variance 384,23 325,36 –15,3%
Source: Author
12
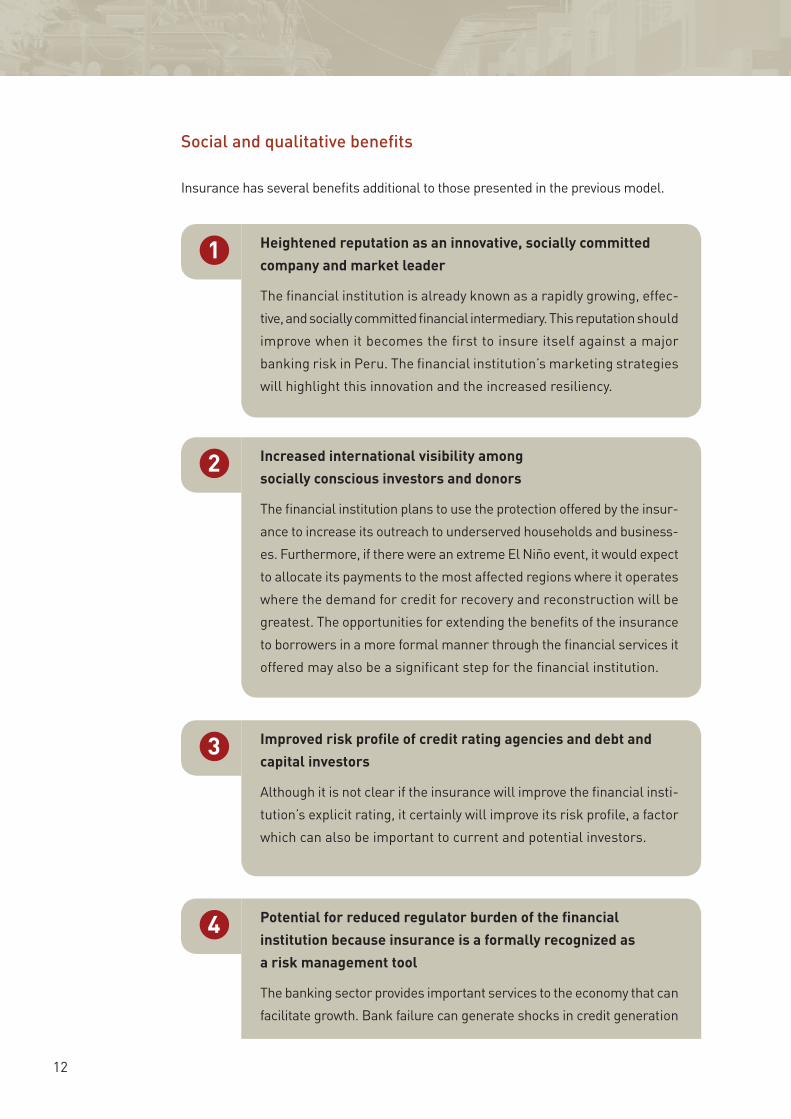
social and qualitative benefits
Insurance has several benefits additional to those presented in the previous model.
1
2
3
4
heightened reputation as an innovative, socially committed company and market leader
The financial institution is already known as a rapidly growing, effec-
tive, and socially committed financial intermediary. This reputation should
improve when it becomes the first to insure itself against a major
banking risk in Peru. The financial institution’s marketing strategies
will highlight this innovation and the increased resiliency.
increased international visibility among socially conscious investors and donors
The financial institution plans to use the protection offered by the insur-
ance to increase its outreach to underserved households and business-
es. Furthermore, if there were an extreme El Niño event, it would expect
to allocate its payments to the most affected regions where it operates
where the demand for credit for recovery and reconstruction will be
greatest. The opportunities for extending the benefits of the insurance
to borrowers in a more formal manner through the financial services it
offered may also be a significant step for the financial institution.
improved risk profile of credit rating agencies and debt and capital investors
Although it is not clear if the insurance will improve the financial insti-
tution’s explicit rating, it certainly will improve its risk profile, a factor
which can also be important to current and potential investors.
Potential for reduced regulator burden of the financial institution because insurance is a formally recognized as a risk management tool
The banking sector provides important services to the economy that can
facilitate growth. Bank failure can generate shocks in credit generation
13
5 Strategically market positioning after an extreme el niño event can open doors to the financial institution for an in-creased market share
After a severe El Niño event, borrowers will have a growing need for
credit to recover and to rebuild, but many banks will not be in a good
position to extend them loans because they will have experienced huge
losses. Bankers that were in business during the 1998 El Niño reported
that strong banks were able to take over entire groups of weakened
banks in the aftermath. Since the insurance will improve the financial
institution’s position after a severe El Niño event vis-à-vis uninsured
banks, it will be able to capture a greater market share in that period.
that lead to economic losses. Therefore, one policy objective is to avoid
shocks in the credit market, thereby reducing bank failure. Policymak-
ers expect to satisfy this objective with minimal social cost related to
a reduction in credit access.
Capital requirements are an important risk management mechanism
that can act as a buffer against losses from a variety of risks. Banking law
dealing with portfolio risk management that solely uses capital reserves
is limited in the following ways: 1) Basel requirements are not sensitive
to the systemic risks that Peruvian banks face, 2) they implicitly limit ac-
cess to credit and raise interest rates, 3) they fail to promote portfolio risk
reduction, through diversification, 4) they fail to encourage loans in re-
gions where systemic risks can be transferred, and 5) they perpetuate
credit shocks since banks have to reduce investment after losing capital.
Insuring against significant systemic risks can be a viable complement
to capital reserves that improve prudent regulatory efficiency and ef-
fectiveness by addressing these limitations of capital requirements.
The best use of insurance will probably be for unsettling systemic risks
that can generate substantial portfolio losses, such as disasters. Insur-
ing against natural disasters is usually more important for development
banks in the country since their portfolios tend to be more concentrated
in geographic area and economic sectors. El Niño Insurance is an ex-
cellent example and creates an opportunity for the Peruvian banking
regulatory agency to set a precedent that will reward strategies which
tend to reduce risks among banks in developing countries and that
tackle limitations in the current international banking standards.
14
References
Boucher, S; Carter, M, and C. Guirkinger. “Risk Rationing and Wealth Effects in Credit
Markets: Theory and Implications for Agricultural Development” in American Journal of Agricultural Economics 90 (2008): 409-23.
Khalil, A.F., H.H. Kwon, U. Lall, M.J. Miranda, J.R. Skees. “El Niño-Southern Oscilla-
tion-based Index Insurance for Floods: Statistical Risk Analyses and Application to
Peru.” Water Resources Research 43 (2007): W10416.
McPhaden, M. J. “El Niño and La Niña: Causes and Global Consequences”. Encyclo-pedia of Global Environmental Change, Volume 1: The Earth System: Physical and Chemical Dimensions of Global Environmental Change. MacCracken, M. M., Perry, J. S.
(Eds.) & Munn, T. (Editor-in-Chief), Wily: Hoboken, NJ, 2003.
Skees, J.R. and B. J. Barnett. “Enhancing Microfinance Using Index-Based Risk-Trans-
fer Products.” Agricultural Finance Review 66 (2006): 235-250.
Skees, J.R. and A. G. Murhpy. “ENSO Business Interruption Index Insurance for Cata-
strophic Flooding in Piura, Peru.” GlobalAgRisk, Inc.
Trivelli, C. “Rural Finance and Insurance on the North Coast of Peru.” Summary Report
2005/06. Instituto de Estudios Peruanos, Lima, September 2006.
Van den Heuvel, S. “The Bank Capital Channel of Monetary Policy.” 2006 Meeting Papers
512, Society for Economic Dynamics (2006).

15
Dia
rio
El
tiEm
po, P
iUra
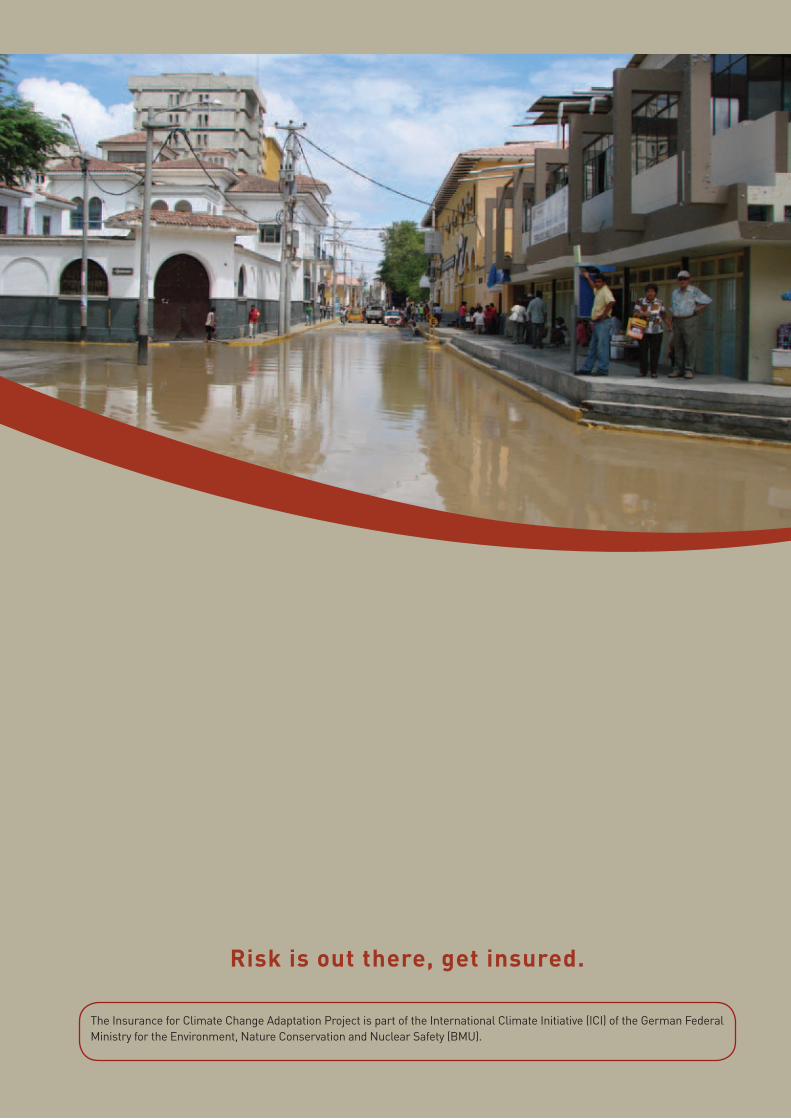
Risk is out there, get insured.
The Insurance for Climate Change Adaptation Project is part of the International Climate Initiative (ICI) of the German Federal Ministry for the Environment, Nature Conservation and Nuclear Safety (BMU).